Article

Copper(II) Perfluorinated Carboxylate Complexes with Small Aliphatic Amines as Universal Precursors for Nanomaterial Fabrication

by
Iwona B. Szymańska
*,
Katarzyna Madajska
,
Aleksandra Butrymowicz
and
Magdalena Barwiołek
Faculty of Chemistry, Nicolaus Copernicus University in Toruń, Gagarina 7, 87-100 Toruń, Poland
*
Author to whom correspondence should be addressed.
Materials 2021, 14(23), 7451; https://doi.org/10.3390/ma14237451
Submission received: 2 November 2021 / Revised: 25 November 2021 / Accepted: 30 November 2021 / Published: 4 December 2021
(This article belongs to the Special Issue Transition Metal Complexes and Their Applications)

Abstract

:
Copper(II) carboxylate compounds with ethylamine and isopropylamine of the general formula [Cu2(RNH2)2(µ-O2CRf)4], where R = Et, iPr, and Rf = CnF2n+1, n = 1–6, were characterised in the condensed and gas phases by electron impact mass spectrometry (EI MS), IR spectroscopy, and thermal analysis. A mass spectra analysis confirmed the presence of metallated species in the gas phase. Among the observed fragments, the pseudomolecular ions [Cu2(RNH2)2(µ-O2CRf)3]+ were found, which suggests the dimeric structure of the studied complexes with axially N-coordinated ethyl- or isopropylamine molecules and bridging perfluorinated carboxylates. TGA studies demonstrated that copper transfer to the gas phase occurs even under atmospheric pressure. The temperature range of the [Cu2(RNH2)2(µ-O2CRf)4] and other copper carriers detection, observed in variable temperature infrared spectra, depends on the type of amine. The possible mechanisms of the decomposition of the tested compounds are proposed. The copper films were produced without additional reducing agents despite using Cu(II) CVD precursors in the chemical vapor deposition experiments. The layers of the gel-like complexes were fabricated in both spin- and dip-coating experiments, resulting in copper or copper oxide materials when heated. Dinuclear copper(II) carboxylate complexes with ethyl- and isopropylamine [Cu2(RNH2)2(µ-O2CRf)4] can be applied for the formation of metal or metal oxide materials, also in the nanoscale, by vapour and ‘wet’ deposition methods.

Graphical Abstract

1. Introduction

Nowadays, copper compounds are applied as antifungal and antibacterial coatings, catalysts, or in the assembly of chemical and electrochemical sensors. [1]. Additionally, organic-inorganic hybrid compounds containing copper-bis(triazole) complexes and Keggin-type polyoxometalates (POMs) showed electrocatalytic activities towards the reduction of nitrites [2]. Copper-halide compounds may be employed as new light-emitting materials [3] and in photovoltaic application [4].
To the best of our knowledge, the literature data concerning Cu(II) carboxylate compounds with EtNH2 are limited to the dicarboxylate [Cu(EtNH2)2(C2O4)] derivative [5]. It was synthesised by adding ethylamine to a chloroform hemihydrate [Cu(C2O4)] 0.5 H2O solution, and its spectral, magnetic, and thermal properties were characterised. Information on copper compounds containing carboxylates and triethylamine of the following formula [Cu2(NEt3)2(μ-O2CtBu)4] [6] and on copper polymers [Cu2(Et3NH)(syn,syn-η11:μ-O2CR)4(anti,anti-η11:μ-O2CR)]n, where R = Me or H and dimers such as [Cu2(Et2NH2)2(syn,syn-η11:μ-O2CMe)4(anti-η1-O2CMe)2] and [Cu2(Et3NH)2(syn,syn-η11:μ-O2CPh)4(anti-η1-O2CPh)2] can also be found in the literature [7]. Furthermore, copper(II) complexes with aromatic carboxylates with a substituent on the benzene ring (−CH3, −Cl, or −NO2) and diethylamine or dipropylamine have been previously described [8]. The possibility of tert-butylamine copper(II) carboxylate complexes formation by applying tert-butyl isocyanate was described in our previous paper [9]. Therefore, the applicability of this reaction type for the preparation of ethyl- and isopropylamine Cu(II) carboxylate compounds was a noteworthy issue. Working with isocyanates is easier due to their higher boiling points (e.g., for ethylamine. b.p = 16.6 °C so it is gaseous at room temperature, while for ethyl isocyanate, b.p = 60 °C).
The copper(II) carboxylate complexes with tert-butylamine were applied as Cu CVD precursors for the fabrication of copper nanomaterials fabrication. It is worth emphasizing that even with the first CVD experiments, all the [Cu2(tBuNH2)2(µ-O2CRf)4] (Rf = CnF2n+1, n = 1–6) complexes led to copper covers with no reducing agent despite those containing copper in the second oxidation state [9,10]. Over the past few years, the synthesis and research of analogous compounds have been continued and expanded. As a result, compounds with the formulas: [Cu2(tBuNH2)2(μ-O2CC2F5)4], [Cu2(sBuNH2)2(μ-O2CC2F5)4], [Cu2(EtNH2)2(μ-O2CC2F5)4], and [Cu2(EtNH2)2(μ-O2CC3F7)4] were synthesized and tested for interactions with low-energy electrons and a possible use in the focused electron beam induced deposition (FEBID) method. Due to their gel form, compounds could be directly deposited on a surface which allowed the studying them with surface science tools in a vacuum environment [11,12].
The obtained new compounds [Cu2(RNH2)2(µ-O2CRf)4], where R = Et, Rf = CF3, C4F9, C5F11, C6F13; and R = iPr, Rf = CF3, C2F5, C3F7, C4F9, form blue gels under normal conditions. Therefore, we want to examine how the N-donor ligand modification (EtNH2 vs. iPrNH2) can affect the physicochemical properties of complexes, mainly their thermal stability and suitability for the generation of metallated volatile species. Due to a good solubility of the compounds, we have tested the applicability of these metal-organic compounds application in ‘wet’ coating methods. The literature data indicate that using spin- or dip- coating techniques and then heating the deposited precursors, metal or metal oxide layers at a thickness from a few tens up to several hundred nanometers can be obtained [13,14] in a low-cost process because they do not require complicated technical and hence, expensive equipment.
In the case of copper compounds, ‘wet’ deposition methods are the most often used for the copper(II) oxide materials formation. They are applied as heterogenic catalysts, in electrochemical cells for the Li2CuO2 preparation, as electrodes in photoelectrochemical PEC cells, and for the construction of gas sensors and high-temperature superconductors. Moreover, the obtained copper materials can be used for example, in electronic [15,16], plasmonics [17,18], catalysis [19,20,21], and as antibacterial agents [22,23]. In dip and spin-coating methods, systems based on copper carboxylates were applied. For example, the ethanolic solution of the [Cu2(H2O)2(µ-O2CCH3)4] complex in the presence of monoethanolamine (MEA) was used for the copper(II) oxide layer formation by the dip-coating method. The covers were obtained by heating the dip-coated films in the air at 723 K [24].
Furthermore, the anhydrous copper(II) acetate dissolved in ethanol was applied in a spin-coating process on glass substrates. The final cover (Cu2O) was fabricated by heating at 423 K under nitrogen. Moreover, copper carboxylate compounds were used for the metallic copper layer formation by a dip-coating method. The solution contained copper acetate dihydrate and diethanolamine (DEA) in 2-propanol. The molar ratio of DEA to Cu2+ was 2:1, but the concentration of the obtained sol ranged from 0.25 to 1.5 mol/dm3. The copper coatings were prepared by heating under nitrogen deposited on glass substrates materials [25]. The results of the complexing agents and surfactants addition aimed at improving the deposition process were described in literature while, for the compounds studied herein, the perfluorinated carboxylates as the complexing surfactants form the integral part of the molecules (vide infra).
In this paper, the synthesis, characteristics by electron impact mass spectrometry, infrared (IR) spectroscopy, variable temperature infrared spectroscopy (VT IR), thermal analysis, and applications of [Cu2(RNH2)2(µ-O2CRf)4] complexes, where R = Et, iPr; Rf = CnF2n+1, n = 1–6, in the Chemical Vapour Deposition process as well as in spin- and dip- coating methods will be described.

2. Experimental

2.1. Materials

CuCO3·Cu(OH)2, ethyl isocyanate EtNCO (97%), isopropyl isocyanate iPrNCO (98%), CF3COOH and C6F13COOH (99%); C3F7COOH (98%); and RfCOOH (97%) Rf = CnF2n+1; n = 2, 4, 5; were purchased from Sigma-Aldrich, acetonitrile (99.9%) from Honeywell, tetrahydrofuran (p.a.) from Avantor Performance Materials Poland S.A., ethanol (99.6%) from Bioetanol AEG, HF (40%) and HNO3 (65%) from Chempur and Si(111) from Institute of Economic Materials Technology in Warsaw. All reagents were used as received. Copper(II) carboxylates [Cu(µ-O2CRf)2], where Rf = CnF2n+1, n = 1–6, were prepared as reported [26].

2.2. Instrumentation

Mass spectra using a Finnigan MAT 95 mass spectrometer, Waltham, MA, USA and electron impact (EI) ionisation method were registered over the temperature range of 303–623 K. The isotopic patterns were simulated by using the shareware software Wsearch32. IR spectra were measured on a Vertex 70V spectrometer (Bruker Optik, Leipzig, Germany) using a reflective-single reflection diamond ATR unit (200–4000 cm−1) or using a PerkinElmer Spectrum 2000 spectrometer (Waltham, MA, USA) over 400–4000 cm−1 in KBr and over 200–400 cm−1 in PE, with a medium slit width and a peak resolution of 2.0 cm−1. The Cu content was determined with an iCE3300 FL atomic absorption spectrometer Thermo Fisher Scientific, Waltham, MA, USA. The content of C and H was found out with a Vario MACRO CHN ELEMENTAR Analysensysteme GmbH, Langenselbold, Germany. Thermal studies (TGA/DTA) were performed on an SDT 2960 TA analyser (New Castle, DE, USA) (dry N2; heating rate 2.5 K/min, heating range up to 598–692 K; sample mass 7–13 mg). Variable temperature infrared spectra (VT IR) were registered using a PerkinElmer Spectrum 2000 spectrometer (Waltham, MA, USA) over 400–4000 cm−1 with a medium slit width and a peak resolution of 2.0 cm−1. The glass vessel with the precursor sample (~100 mg) was placed in the homemade reactor tube and heated (from 303 to 753 K) under a dynamic vacuum (p = 10−1 mbar). IR spectra of vapours collected at selected temperatures were registered. Optical images of the deposited layers were made using an optical microscope RamanMicro 200 PerkinElmer (Waltham, MA, USA). The morphology and composition studies of obtained materials were performed using scanning electron microscopy: SEM-LEO 1430VP, Ltd., Cambridge, UK (operating voltage 28 kV) equipped with an energy dispersive X-ray spectrometer (EDS) Quantax 200 with detector XFlash 4010 (Bruker AXS microanalysis GmbH, Berlin, Germany). SEM images were registered using Quanta 3D FEG (FEI, Hillsboro, OR, USA). Transmission electron microscopy (TEM G2 F20X-Twin 200 kV FEI, Hillsboro, OR, USA) was used to confirm the composition of the deposited materials. To identify the chemical elements, energy-dispersive X-ray (EDX, RTEM model SN9577, 134eV, EDAX, FEI, Hillsboro, OR, USA) spectra and selected area (electron) diffraction pattern were recorded.

2.3. Chemical Vapour Deposition Parameters

CVD deposition experiments were conducted using the homemade horizontal hot-wall CVD reactor. Copper films were grown on Si(111) substrates in argon atmosphere within 60 min, at p = 10−1 mbar. Silicon substrate surfaces were previously cleaned according to the literature procedure [10,27]. The process parameters were selected based on the data obtained from the thermal analysis and the results of the VT IR.

2.4. Spin- and Dip-Coating Parameters

Precursors were dissolved either in tetrahydrofuran (THF) or acetonitrile, forming an almost saturated solution, and deposited on Si(111) substrates by the spin-coating technique using a spin-coater (Laurell 650SZ) and by the dip-coating method using a dip-coater (QPI-168 Qualtech Products Industry).
The spin coating was a multistage process, the spin speed was varied from 600 to 3000 rpm, and the process time was changed over the range 4–60 s. The SC (spin-coated) materials were obtained in four stages program. Each program consisted of three steps with variable spin speed and one drying stage (3000 rpm, 1 min). The solution introduction on the substrate and all deposition procedures for each layer were repeated twice.
The dip-coating parameters were the following: the withdraw rate 20–80 mm/min, the immersion rate 60–80 mm/min, the immersion time 5, 10, or 120 s, and the coating count 5–80.
The films obtained by both techniques were characterised and next heated in a tube furnace PRW 55 Czylok equipped with a quartz reactor with steel gas heads. The process was carried out under a nitrogen atmosphere (1 cm3/min) at 673 K for 3 h. Then deposits were cooled down under nitrogen for 3 h. The heating temperature of the films was selected based on the thermal analysis results.

2.5. Synthesis of [Cu2(RNH2)2(µ-O2CRf)4]) (110)

In the general procedure, copper(II) carboxylate [Cu2(µ-O2CRf)4] (1·10−3 mol for Rf = CF3 (1) or 0.5·10−3 mol for Rf = C4F9, C5F11, C6F13 (46) and R = Et; 1·10−3 mol for Rf = CF3, C2F5, C3F7, C4F9 and R = iPr (710)) was dissolved in 20 cm3 acetonitrile, and ethyl or isopropyl isocyanate 1·10−3 mol or 0,5·10−3 mol was dropped in, respectively. The obtained reaction mixture was stirred for 4 h, on air, at room temperature for Rf = CnF2n+1, where n = 1–5 but at 303 K for Rf = C6F13 (6). Next, the solution was filtered, and the final product was isolated by solvent evaporation at the reduced pressure in argon. The obtained complexes were blue, gel-like solids, stable on air, which should only be moisture-protected during the storage. Yields ranged between 40–85% for R = Et and 62–72% for R = iPr. No crystals suitable for an X-ray structure determination were obtained.
The synthesis of compounds [Cu2(EtNH2)2(µ-O2CC2F5)4] (2) and [Cu2(EtNH2)2(µ-O2CC3F7)4] (3) has been described by us earlier [11,12]. The complexes (2) and (3) were prepared and tested for interactions with low-energy electrons.
The results of elementary analyses and spectroscopic data are given below:
[Cu2(EtNH2)2(µ-O2CCF3)4] (1) C12H14Cu2F12N2O8 (calc./found) % Cu 19.0/18.3, C 21.53/21.72, H 2.11/2.28; EI-MS T = 305 K (m/z, RI %) [C2H7N]+. (45, 45); [Cu(EtNH2)(O2CCF3)]+ (221, 11); [Cu2(O2CCF3)]+ (239, 100); [Cu2(EtNH2)(O2CCF3)]+ (284, 5); [Cu2(O2CCF3)2]+. (352, 66); [Cu2(EtNH2)2(O2CCF3)3]+ (555, 3); IR (KBr, 3253, 3084, 2992, 2835, 2743, 2628, 2520, 2046, 1672, 1518, 1478, 1436, 1402, 1337, 1202, 1143, 1045, 996, 842, 797, 726, 612, 600, 520, 422; PE 426, 382, 347 cm−1).
Data for copper complexes (2) and (3) have been published previously [11,12].
[Cu2(EtNH2)2(µ-O2CC2F5)4] (2) C16H14Cu2F20N2O8 [12].
[Cu2(EtNH2)2(µ-O2CC3F7)4] (3) C20H14Cu2F28N2O8 [11].
[Cu2(EtNH2)2(µ-O2CC4F9)4] (4) C24H14Cu2F36N2O8 (calc./found) % Cu 10.0/10.2, C 22.71/23.03, H 1.11/1.53, EI-MS T = 345 K (m/z, RI %) [C2H7N]+. (45,10); [Cu2(O2CC4F9)]+ (389, 100); [Cu2(EtNH2)(O2CC4F9)]+ (434, 1); [Cu2(O2CC4F9)2]+. (652, 25); [Cu2(EtNH2)2(O2CC4F9)3]+ (1005, 1); IR (KBr, 3252, 3156, 3068, 2998, 2595, 2505, 1993, 1681, 1531, 1403, 1348, 1210, 1162, 1135, 1056, 1043, 1024, 914, 885, 815, 743, 714, 656, 556, 533, 452, 416; PE 421, 395, 350 cm−1).
[Cu2(EtNH2)2(µ-O2CC5F11)4] (5) C28H14Cu2F44N2O8 (calc./found) % Cu 8.7/8.2, C 22.88/22.2, H 0.96/1.10, EI-MS T = 319 K (m/z, RI %) [C2H7N]+∙ (45,28); [Cu2(O2CC5F11)]+ (439, 94); [Cu2(EtNH2)(O2CC5F11)]+ (484, 2); [Cu2(O2CC5F11)2]+∙ (752, 22); [Cu2(EtNH2)2(O2CC5F11)3]+ (1155, 2); IR (KBr, 3245, 3093, 2838, 2743, 2628, 2520, 2046, 1679, 1638, 1545, 1479, 1435, 1409, 1200, 1142, 1046, 996, 843, 796, 726, 612, 520; PE 427, 382, 342 cm−1).
[Cu2(EtNH2)2(µ-O2CC6F13)4] (6) C32H14Cu2F52N2O8 (calc./found) % Cu 7.6/7.7, C 23.02/22.50, H 0.85/1.13, EI-MS T = 365 K (m/z, RI %) ([C2H7N]+∙ (45, 8); [Cu2(O2CC6F13)]+ (489, 100); [Cu2(EtNH2)(O2CC6F13)]+ (534, 2); [Cu2(O2CC6F13)2]+∙ (852, 18); [Cu2(EtNH2)2(O2CC6F13)3]+ (1305, 1); IR (KBr, 3244, 3165, 3068, 2998, 2958, 2738, 2602, 2501, 1982, 1673, 1623, 1527, 1478, 1461, 1404, 1358, 1310, 1290, 1233, 1207, 1150, 1121, 1064, 1049, 976, 961, 930, 904, 849, 805, 788, 775, 744, 735, 718, 705, 663, 626, 591, 571, 551, 529, 459, 415; PE 429, 375, 343 cm−1).
[Cu2(iPrNH2)2(µ-O2CCF3)4] (7) C14H18Cu2F12N2O8 (calc./found) % Cu 18.21/18.42, C 24.11/24.91, H 2.60/3.51, EI-MS T = 389 K (m/z, RI %) [C3H9N]+∙ (59, 41); [Cu(iPrNH2)(O2CCF3)]+ (235, 28); [Cu2(iPrNH2)(O2CCF3)]+ (298, 14); [Cu2(O2CCF3)2]+∙ (352, 63); [Cu2(iPrNH2)2(O2CCF3)3]+ (583, 77); IR (ATR, 3082, 2983, 2947, 1666, 1520, 1471, 1431, 1400, 1385, 1190, 1136, 1024, 937, 922, 841, 795, 725, 613, 521, 469, 420, 375, 347 cm−1).
[Cu2(iPrNH2)2(µ-O2CC2F5)4] (8) C18H18Cu2F20N2O8 (calc./found) % Cu 14.15/14.84, C 24.09/23.90, H 2.02/2.39, EI-MS T = 404 K (m/z, RI %) [C3H9N]+∙ (59, 46); [Cu(iPrNH2)(O2CC2F5)]+ (285, 24); [Cu2(O2CC2F5)]+ (289, 3); [Cu2(iPrNH2)(O2CC2F5)]+ (348, 16); [Cu2(iPrNH2)2(O2CC2F5)3]+ (733, 72); IR (ATR, 3065, 2986, 1675, 1523, 1471, 1403, 1323, 1207, 1158, 1028, 818, 732, 586, 542, 471, 420, 377, 360 cm−1).
[Cu2(iPrNH2)2(µ-O2CC3F7)4] (9) C22H18Cu2F28N2O8 (calc./found) % Cu 11.57/14.09, C 24.08/24.09, H 1.65/2.02, EI-MS T = 372 K (m/z, RI %) [C3H9N]+∙ (59, 16); [Cu(iPrNH2)(O2CC3F7)]+ (334, 4); [Cu2(O2CC3F7)]+ (339, 24); [Cu2(iPrNH2)(O2CC3F7)]+ (398, 5); [Cu2(O2CC3F7)2]+∙ (552, 4); [Cu2(iPrNH2)2(O2CC3F7)3]+ (883, 24); IR (ATR, 3088, 2990, 2955, 1683, 1630, 1592, 1522, 1473, 1406, 1340, 1275, 1207, 1165, 1119, 1086, 967, 934, 818, 762, 745, 722, 645, 603, 589, 528, 475, 428, 376, 351 cm−1).
[Cu2(iPrNH2)2(µ-O2CC4F9)4] (10) C26H18Cu2F36N2O8 (calc./found) % Cu 9.79/10.32, C 24.07/23.39, H 1.40/2.23, EI-MS T = 401 K (m/z, RI %) [C3H9N]+∙ (59, 23); [Cu(iPrNH2)(O2CC4F9)]+ (385, 3); [Cu2(O2CC4F9)]+ (389, 64); [Cu2(iPrNH2)(O2CC4F9)]+ (448, 5); [Cu2(O2CC4F9)2]+∙ (652, 9); [Cu2(iPrNH2)2(O2CC4F9)3]+ (1033, 21), IR (ATR, 3095, 2987, 1681, 1627, 1588, 1522, 1475, 1403, 1347, 1198, 1163, 1130, 1060, 1023, 939, 916, 888, 813, 743, 717, 657, 603, 554, 535, 470, 419, 376, 352 cm−1).

3. Results and Discussion

In the case of other simple aliphatic amines, the following reaction:
2 [Cu(µ-O2CRf)2] + 2 RNCO + 2H2O → [Cu2(RNH2)2(µ-O2CRf)4] + 2CO2 is analogous to those we reported copper compounds containing tert-butylamine [9], as well as ethylamine [Cu2(EtNH2)2(µ-O2CC2F5)4] (2) and [Cu2(EtNH2)2(µ-O2CC3F7)4] (3) complexes [11,12].
The obtained compounds (110) were blue, gel-like solids, stable without moisture access for months.

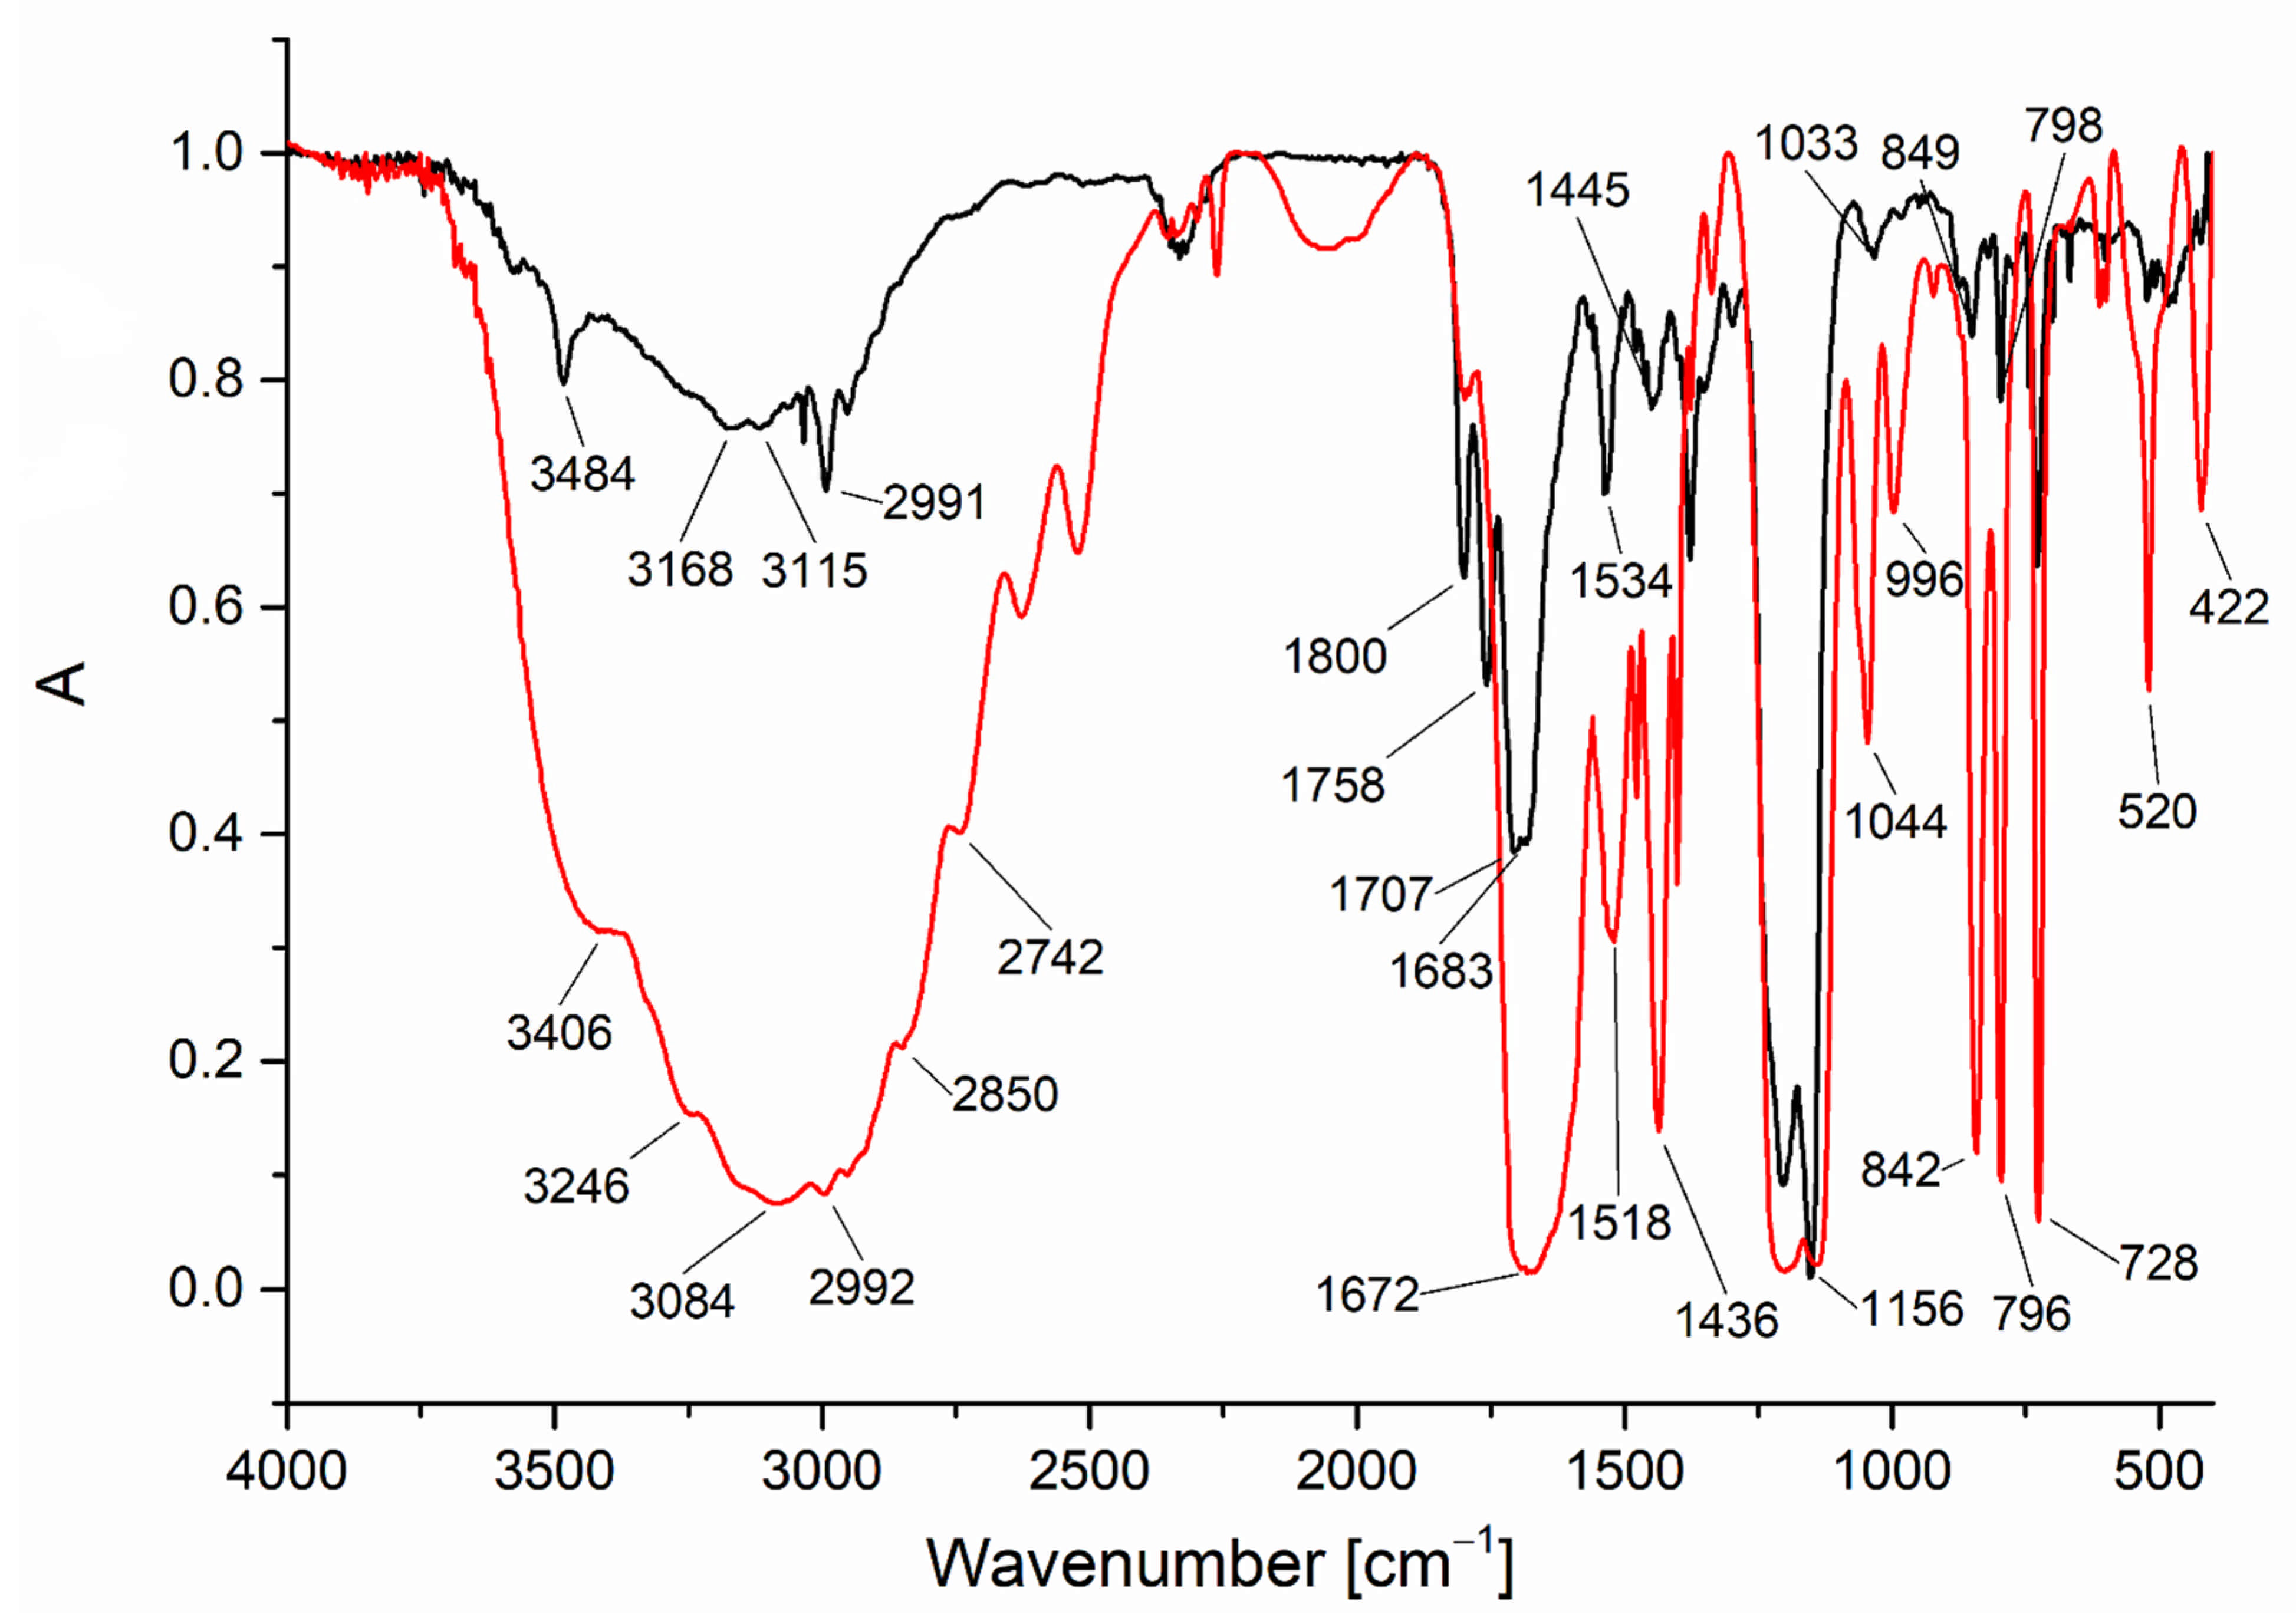
3.1. Infrared Spectra Analysis

The results of infrared spectroscopy are given in (Table 1, Figures S1–S10) The strong absorption bands typical of stretching vibrations of the isocyanate group νasN=C=O = 2279 cm−1 for ethyl isocyanate and νasN=C=O = 2267 cm−1 for isopropyl isocyanate disappeared. Simultaneously, the broad and intense band of the amine N-H stretching and hydrogen bonding vibrations were detected over the range 3060–3100 cm−1 (Table 1). The coordination shifts of this band were calculated in relation to the free amine (for ethylamine—3360 cm−1, isopropylamine—3380 cm−1), and they achieved the values approximately 300–270 cm−1 (16) and 320–280 cm−1 (710), respectively. The Cu–N bond formation and the occurrence of hydrogen bonds NH–F influenced the high value of this shift [28]. The shift of the N-H stretching band towards the lower wavenumber was also observed for other amine complexes of copper as well as palladium and silver [29,30,31]. Additionally, the signals over the range 1520–1545 cm−1 were detected. They can be assigned to the scissors deformation vibration of the amine group. These bands were shifted down for about 102–80 cm−1 (16) and 98–95 cm−1 (710), which confirms the ethyl- and isopropylamine coordination. The shift of the stretching and deformation bands changed irregularly with the length of the carboxylate carbon chain.
Asymmetric and symmetric stretching vibrations of the carboxylic group were detected over the ranges: νasCOO = 1673–1681 cm−1 and νsCOO = 1403–1436 cm−1 (Table 1, Figures S1–S10). The calculated ∆ν = νasCOO − νsCOO parameter for the [Cu2(EtNH2)2(µ-O2CCF3)4] (1) amounted ∆ν = 236 cm−1 and in the case of [Cu2(EtNH2)2(µ-O2CCnF2n+1)4], n = 2–6 (26) achieved ∆ν = 262–278 cm−1. While for compounds containing an isopropyl group, the calculated amounted ∆ν = 235 cm−1 for the [Cu2(iPrNH2)2(µ-O2CCF3)4] (7) and reached the value of ∆ν = 272–278 cm−1 for the [Cu2(iPrNH2)2(µ-O2CCnF2n+1)4], n = 2–4 (810). These values are close to the same parameter found for the appropriate sodium salts (Δν(CF3COONa) = 223 cm−1 and Δν(CnF2n+1COONa; n = 2–6) = 268–272 cm−1) which suggests the bridging coordination mode of carboxylates. The analogous relationship was observed in the case previously described [Cu2(tBuNH2)2(µ-O2CCnF2n+1)4] complexes with tert-butylamine [9]. The bridging mode of copper(II) carboxylates is in favor of complexes’ dimeric units in the solid state [32,33].
Assuming the C4v microsymmetry of the Cu(II) coordination sphere [9] spectra in the metal-ligand vibrations region (600–100 cm−1) can be described in the following manner: the bands detected over the range 419–429 cm−1 can be assigned to Cu–N stretching vibrations and these observed over 375–395 cm−1 and 331–360 cm−1—to asymmetric and symmetric CuO4 stretching vibrations, respectively [28].

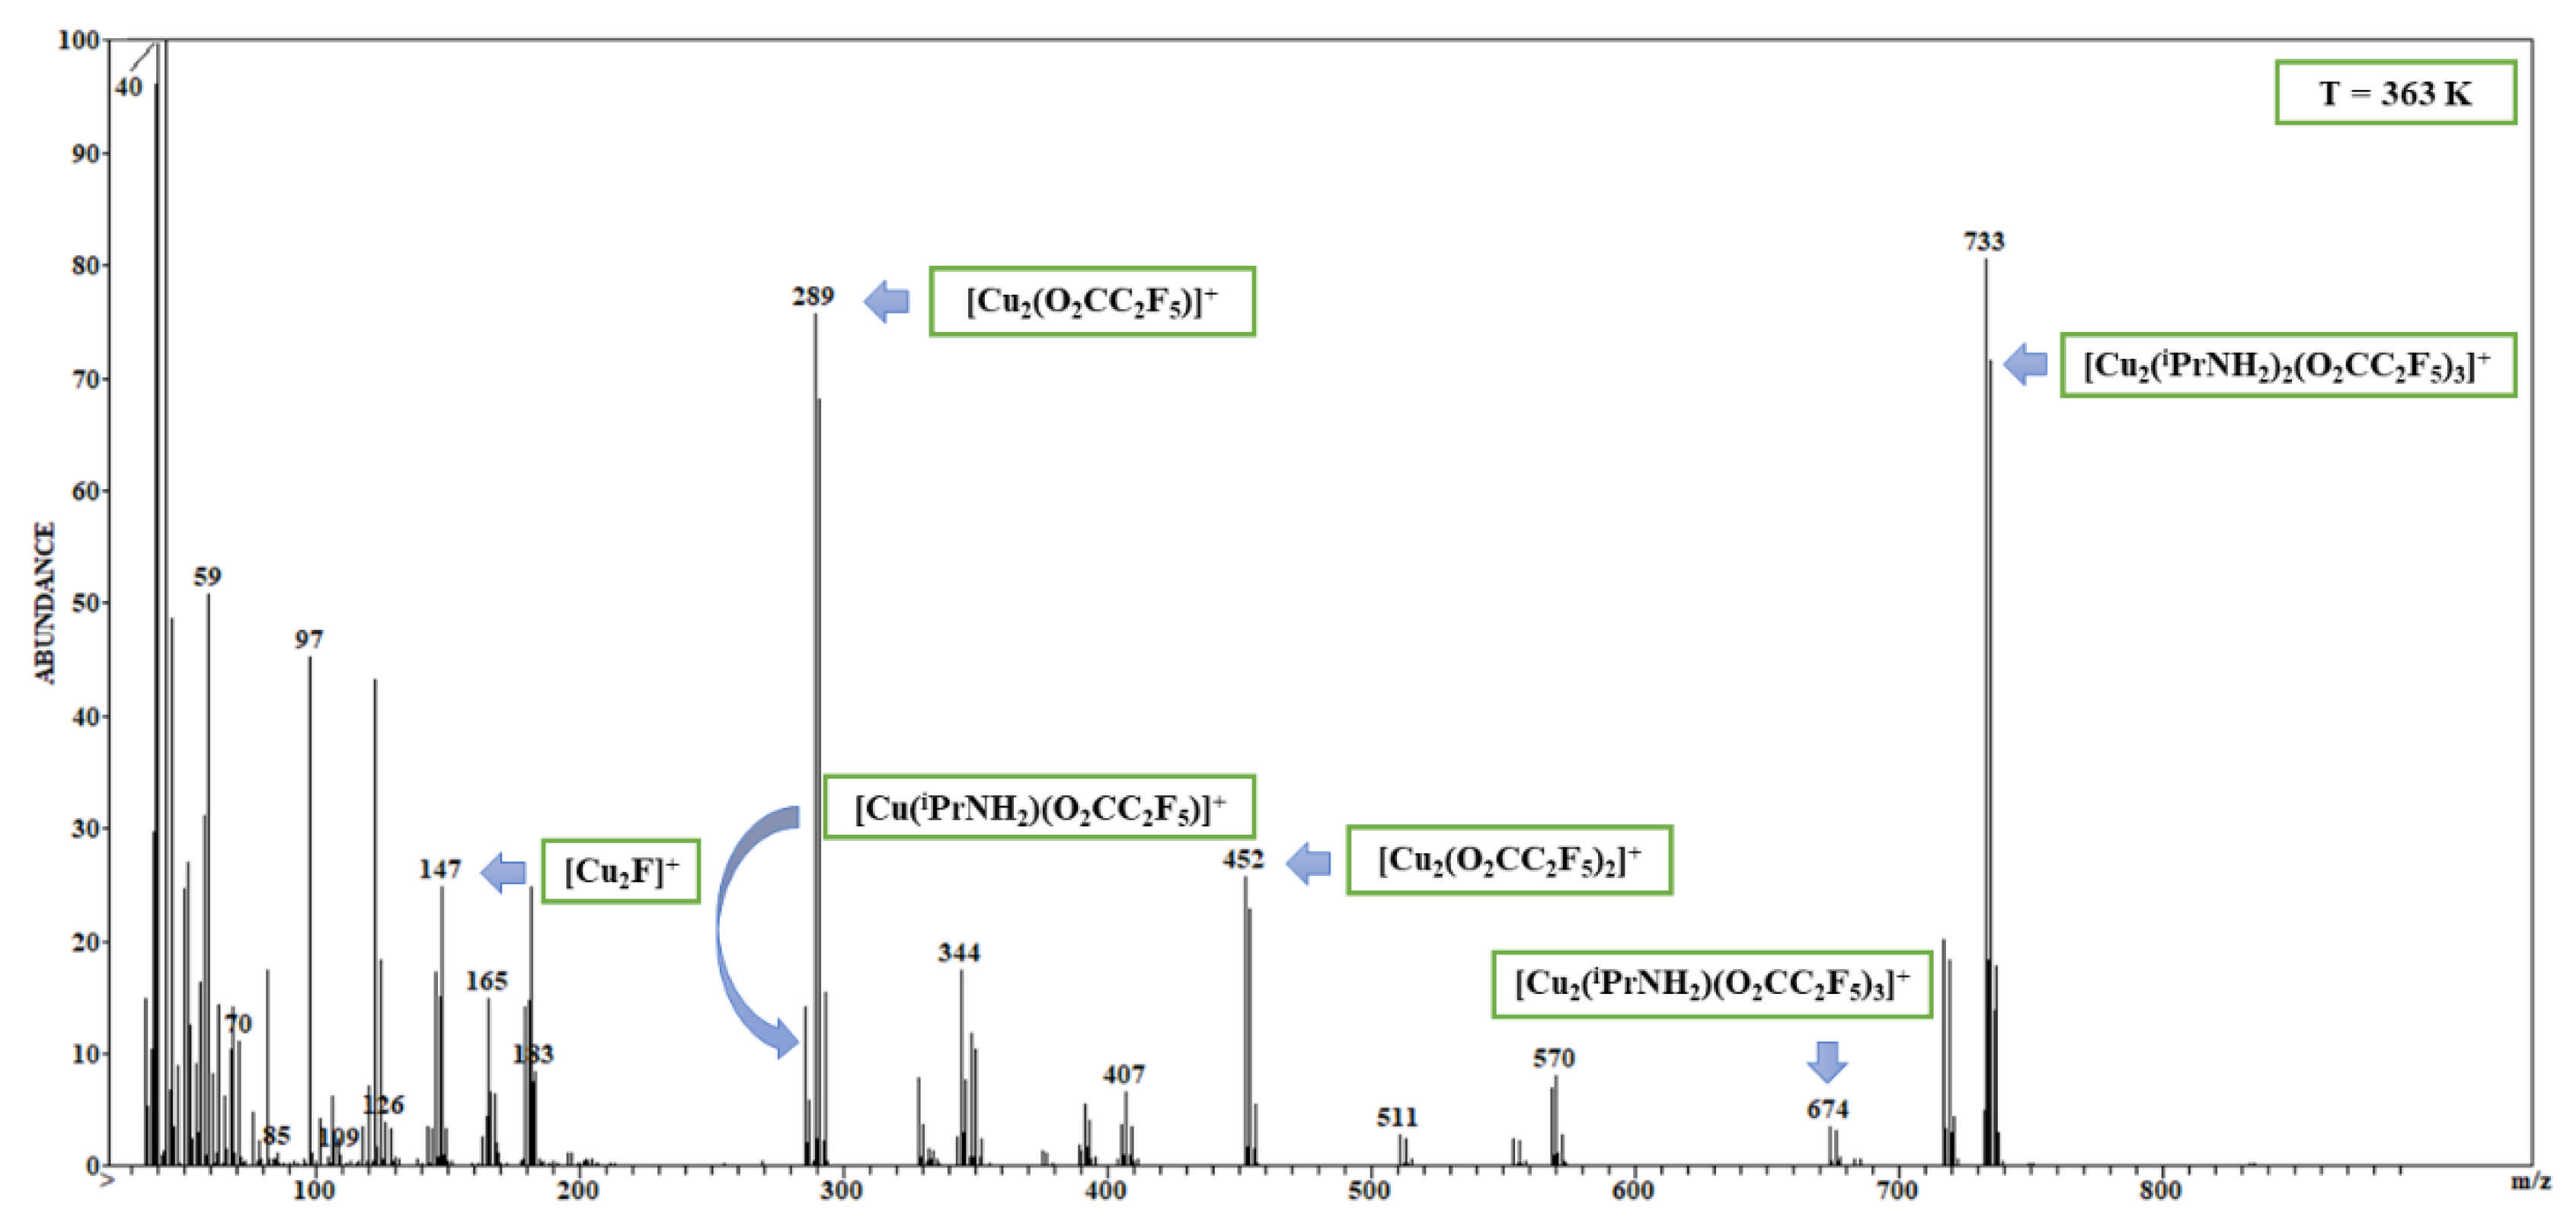
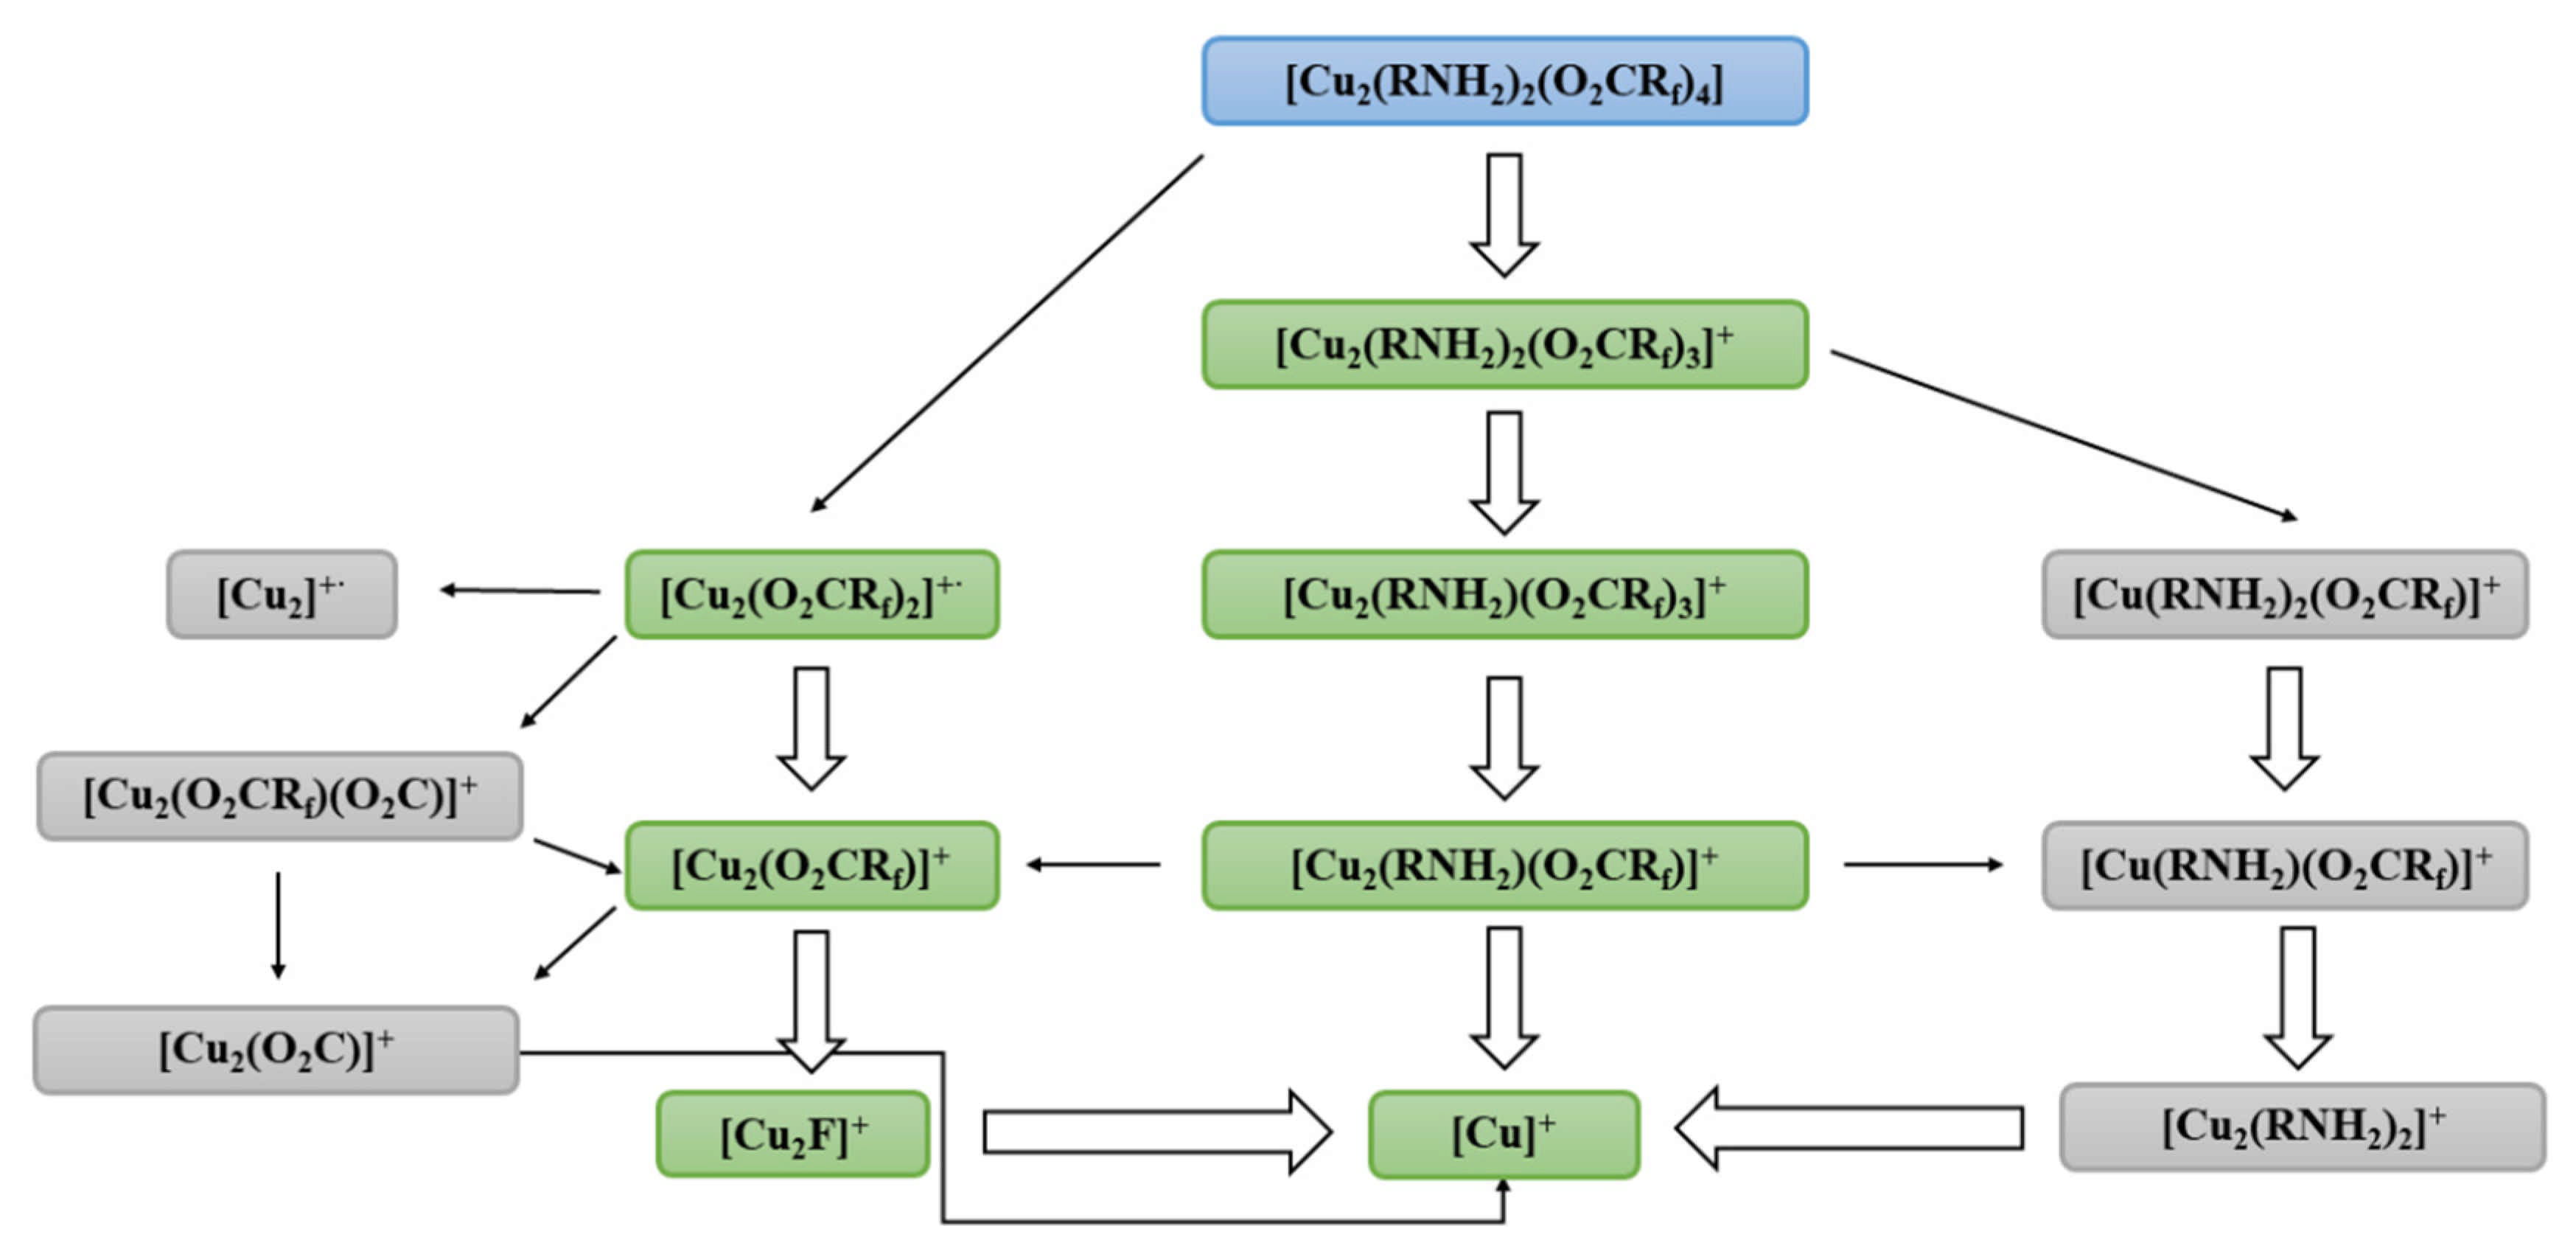
3.2. Mass Spectra Analysis

Mass spectra (EI MS) of the studied compounds were measured between 303 and 623 K (Figures S11–S20) and applied for the molecular mass determination and structural characteristics. Additionally, metallated fragments in the gas phase can be identified, and a preliminary usefulness evaluation of usefulness by vapour deposition techniques can also be considered.
For the [Cu2(EtNH2)2(µ-O2CRf)4] complexes (16) (Table 2 and Tables S1–S5), the following fragments, characteristic of ethylamine, were detected: [C2H7N]+ (45 m/z), [C2H4N]+ (42 m/z), [C2H3N]+ (41 m/z), [C2H2N]+ (40 m/z). Among these ions, the [C2H7N]+ fragment exhibits RI = 69% for (1) (Table 2) at 355 K. Other complexes (26) revealed a different behaviour, and their RI achieved only 10–38% over the temperature range 305–357 K. Additionally, the copper-amine ion [Cu(EtNH2)]+ (108 m/z) was observed for the following complexes: (2) (3–4% RI, up to 357 K), (3) (2–3% RI, up to 463 K), and (6) (1–2% RI, up to 431 K).
Similar ions were observed for the [Cu2(iPrNH2)2(µ-O2CRf)4] complexes (710) (Table 3 and Tables S6–S8), a molecular ion characteristic for isopropylamine was recorded [C3H9N]+ (59 m/z) and achieved the highest intensity RI = 46% for (8) at 404 K, for other compounds intensity of this ion were in the range of 16–41% for (7, 9, 10) at 372–389 K. The highest intensity of a metallated fragment with isopropylamine molecule [Cu(iPrNH2)]+ (122 m/z) were observed for (8) RI = 53% at 404 K, while for other compounds (7) RI = 40% at 389 K and (9) RI = 25% at 372 K.
The [Cu2(O2CRf)]+ and [Cu2(O2CRf)2] dicopper carboxylate ions were noticed in the gas phase of all the studied complexes (Figure 1 and Figure 2), which confirms the dimeric structure of the compounds (110). For the complexes with ethylamine, the [Cu2(O2CRf)]+ ion achieved the highest intensity (up to 100%) over the range 305–425 K (Table 2 and Tables S1–S5). Interestingly, for the complexes (2) and (3), the high intensity (100% RI) of the [Cu2(O2CRf)]+ ion was maintained up to 542 K (Tables S1 and S2). For compounds with isopropylamine, the [Cu2(O2CRf)]+ ion reaches a maximum intensity of 64% RI at 401 K for compound (10). The [Cu2(O2CRf)2] fragment generally accompanies the [Cu2(O2CRf)]+ ion, but its intensity is usually lower. The fragmentation of the long-chain carboxylates influences the amount and intensity of the fluorocarbon species, e.g., [C2F5]+, [C4F7]+. The formation of the [C3F5]+ ion (RI to 100%), which is the analogue of the allyl cation, was observed for the compounds (36 and 910). Moreover, the less complicated metallated fragments: [Cu2F]+ (145 m/z), [Cu2] (126 m/z), and [Cu]+ (63 m/z) were detected as the fragmentation terminal products. This fact may indicate the sensitivity of the compounds to the electron beam and the formation of a mixture of copper and copper(I) fluoride. The intensity of the [Cu2F]+ ion was relatively high comparison to the analogous complexes with tert-butylamine [9]. The [Cu3(O2CRf)5]+ ion was also detected for some studied carboxylate compounds with ethylamine (1, 4, 5) and isopropylamine (9, 10).
The detection of the metallated fragments containing both ligands, i.e., [Cu(RNH2)(O2CRf)]+, [Cu(RNH2)2(O2CRf)]+, [Cu2(RNH2)(O2CRf)]+, [Cu2(RNH2)(O2CRf)3]+ and the pseudomolecular [Cu2(RNH2)2(O2CRf)3]+ ion (simulations of isotopic patterns are shown in the Figures S11–S20) was the most important (Figure 1 and Figure 2). The latter was formed by one carboxylate ligand detaching. It was also observed for the complex (6) whose molecular mass is the highest. The majority of metallated fragments were dinuclear, but in the case of the complexes (1), (7)–(10), monocopper fragments containing both ligands were detected as well (Table 2 and Tables S6–S8). In the mass spectra of the tested compounds, the following fragments which contain Cu(I) ions appear: [Cu(RNH2)]+, [Cu2(O2CRf)]+, [Cu2(O2CRf)2], and [Cu2(RNH2)(O2CRf)]+. It suggests that the copper(II) reduction can occur during the thermolysis. When the [Cu2(tBuNH2)2(µ-O2CRf)4] complexes were used as Cu CVD precursors, this process resulted in metallic copper formation [10]. Generally, the metallated fragments group achieved the highest intensity (at least the level of a few percent) over the temperature range 305–600 K and 340−548 K for complexes with ethyl- and isopropylamine, respectively. The complexes (1), (2), and (5) showed the lowest temperature of the metallated fragments generation, and they seemed to be promising for CVD purposes.
Summarising, the types of the observed fragments in the case of ethyl- and isopropylamine complexes were almost the same as those of the tert-butylamine derivatives. Additionally, the [Cu(O2C)]+ ion (2, 3, 6, 8) and the [Cu(RNH2)2(O2CCF3)]+ fragment (1, 710) were detected. The temperatures at which the [Cu2(EtNH2)2(O2CRf)3]+ pseudomolecular ions achieved the highest intensity, were generally lower (305–357 K) for the [Cu2(EtNH2)2(µ-O2CRf)4] complexes than in the case of the [Cu2(iPrNH2)2(µ-O2CRf)4] (389−404 K) and [Cu2(tBuNH2)2(µ-O2CRf)4] analogues (369–465 K). It means that the complexes with ethylamine show the highest volatility among the tested compounds. A similar dependence was observed for the [Cu2(O2CRf)]+ ions. The highest intensities (up to 100%) were achieved over the temperature range 305–425 K (EtNH2) in relation to 401–548 K (iPrNH2) and 505–573 K (tBuNH2). Seemingly, these data concerning temperatures may appear as promising for the chemical vapour deposition purposes. Additionally, the [Cu]+ high intensity (40% RI), especially observed simultaneously with the pseudomolecular ion detection, suggests that, from among the studied complexes with EtNH2, iPrNH2, and tBuNH2, to the electron, is [Cu2(EtNH2)2(µ-O2CCF3)4] is the compound most sensitive to the electrons (1).

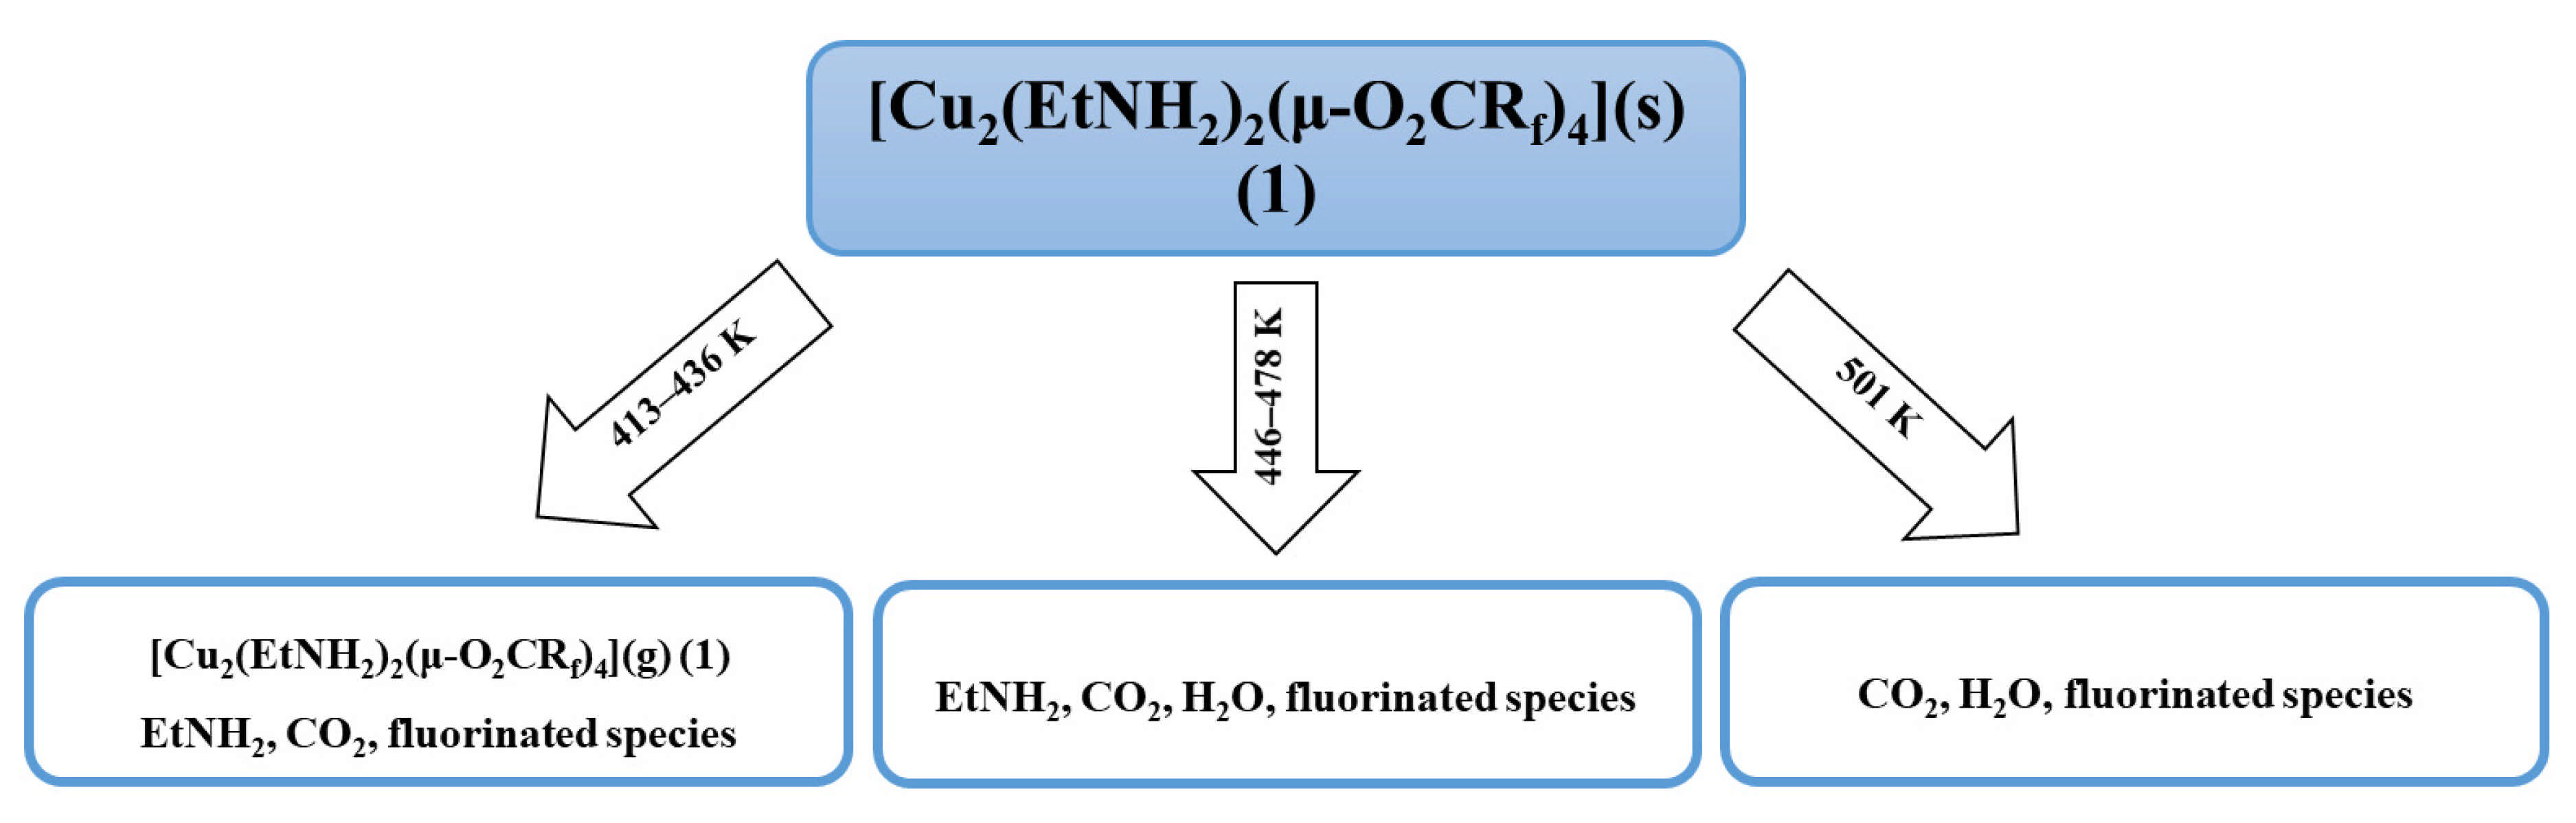
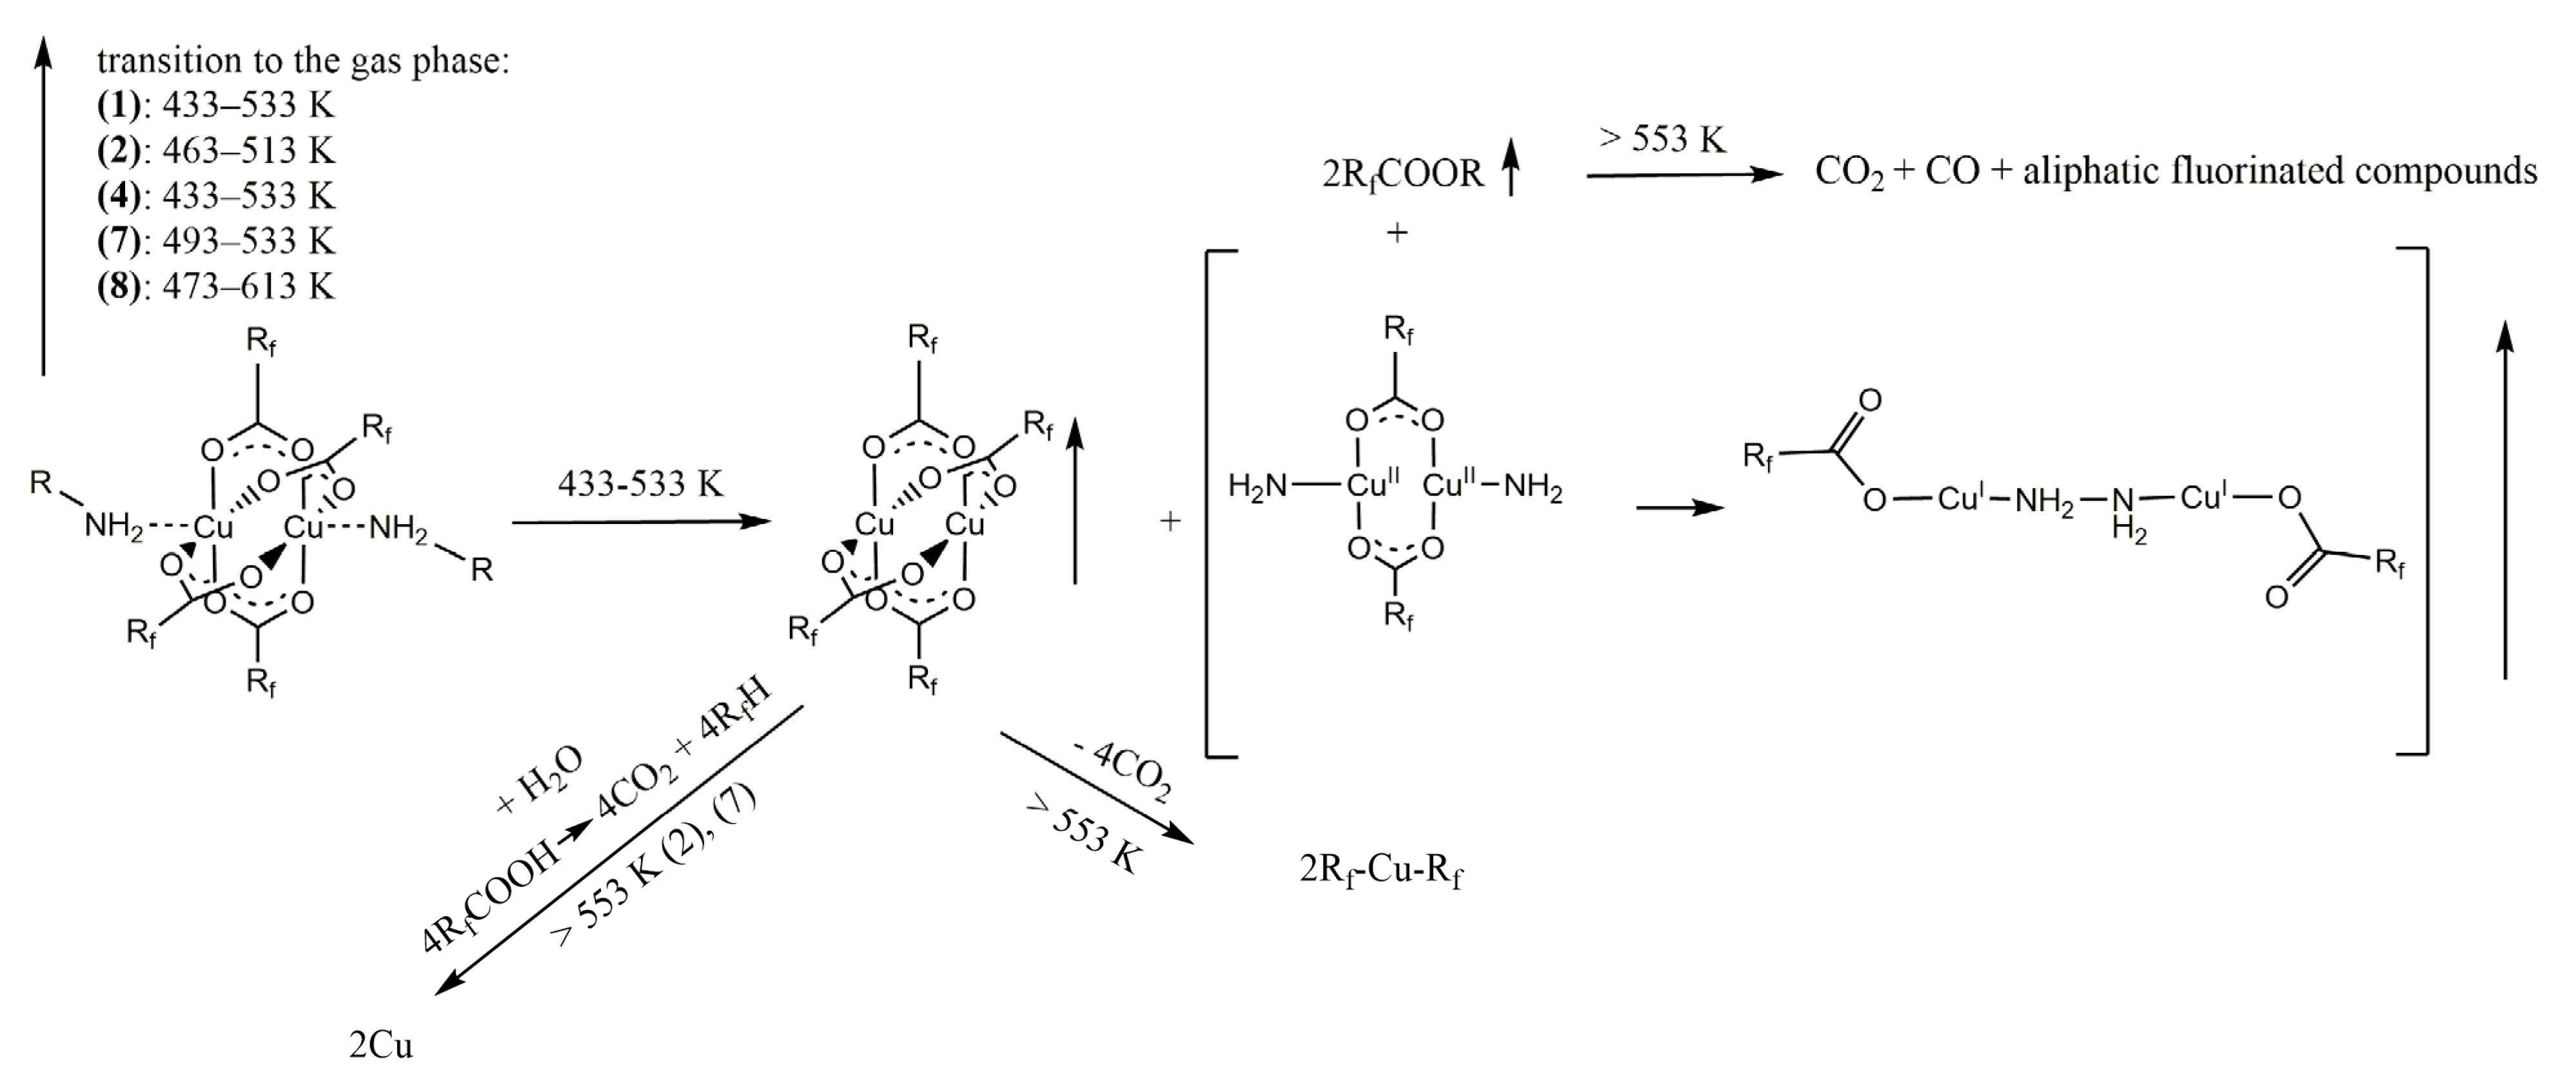
3.3. Results of Thermal Analysis

The thermal analysis of the complexes (14) and (710) indicates that the slow weight loss occurs from the beginning of heating of the complex (Figures S21 and S23–S28). A complicated process is observed at higher temperatures. Analysis of the DTA curve for these compounds indicates the endothermic effects connected with thermal decomposition.
The temperature of the decomposition process onset changed over the range 388–410 K and 308–355 K for complexes containing ethyl or isopropyl group, respectively. The temperature of the final product formation varied from 505 K to 532 K (1), (3), (4), and 478 K to 548 K (710). The lowest Tm (466 K and 463–464 K) was observed for the compound (3), (9), and (10) containing chain Rf = C3F7, C4F9 and the highest value (486 K and 474 K) for (1) and (7) including group CF3. The mass of the residues after the thermal analysis for compounds (1) and (7) reveals that the decomposition product of the compounds with EtNH2 is metallic copper, while for compounds with iPrNH2, it is copper(II) oxide (Table 4). The formation of these substances is also confirmed by the color of the residue, red-orange and black, respectively. In the case of the complexes (3), (4), (8), and (9), the mass of the final decomposition products was lower than the value calculated for pure copper or copper(II) oxide (Table 4), which suggests that the copper transfer to the gas phase occurred under the atmospheric pressure, which seemed promising for the CVD and FEBID application. The higher residue mass with regard to its theoretical value for the compound (10) (Rf = C6F13) may indicate carbon contamination during thermal decomposition.
In the case of [Cu2(EtNH2)2(µ-O2CRf)4] complexes, the onset temperatures achieved higher values than those for the tert-butylamine analogues. However, for the [Cu2(iPrNH2)2(µ-O2CRf)4] complexes, the initial temperatures of the decomposition process were similar to the temperatures observed for the compounds containing the tert-butylamine group. On the contrary, the observed final decomposition temperatures were lower for the compounds containing ethylamine and also the isopropylamine group. It means that the thermal decomposition ranges for the [Cu2(RNH2)2(µ-O2CRf)4] complexes discussed here are narrower than those for previously described [Cu2(tBuNH2)2(µ-O2CRf)4] compounds. Interestingly, in the case of complexes with tBuNH2, [Cu2(tBuNH2)2(µ-O2CCF3)4] was the most volatile, while for iPrNH2 and EtNH2, it was observed that compounds with trifluoroacetate have the lowest volatility [9].
Due to the complexity of the process of thermal decomposition of the compounds, we decided to investigate it in more detail for the complex (1) by examining gas phase composition during thermal analysis by infrared spectroscopy (TGA/IR). The spectra analysis showed the characteristic absorption bands for coordinated ethylamine (νCH = 2990 cm−1, δNH2 = 1524 cm−1) and carboxylate ligands (νasCOO = 1701 cm−1, νsCOO = 1440 cm−1). These results suggested that from 413 to 436 K, the complex (1) undergoes evaporation. The 2361 cm−1 band, characteristics of CO2 [34], was detected over the whole studied temperature range (413–501 K), but between 446 and 478 K, its intensity decreased rapidly (Figure S22). The bands typical for fluorinated species (νCF = 1199 cm−1, 1156 cm−1) were observed throughout the temperature range. The typical bands for H2O (νOH = 4000–3500 cm−1, δOH = 1800–1300 cm−1) [35] were registered over the 446–501 K. The free amine [36] was detected over 413–478 K. The observed organic molecule bands indicate the partial compound decomposition in the gas phase (Figure 3).
The TGA/IR results confirm that the thermal decomposition of the compound (1) is a complicated process. Additionally, it has been shown that the complex (1) enters the gas phase in the initial heating phase in a narrow temperature range and is accompanied by its decomposition.

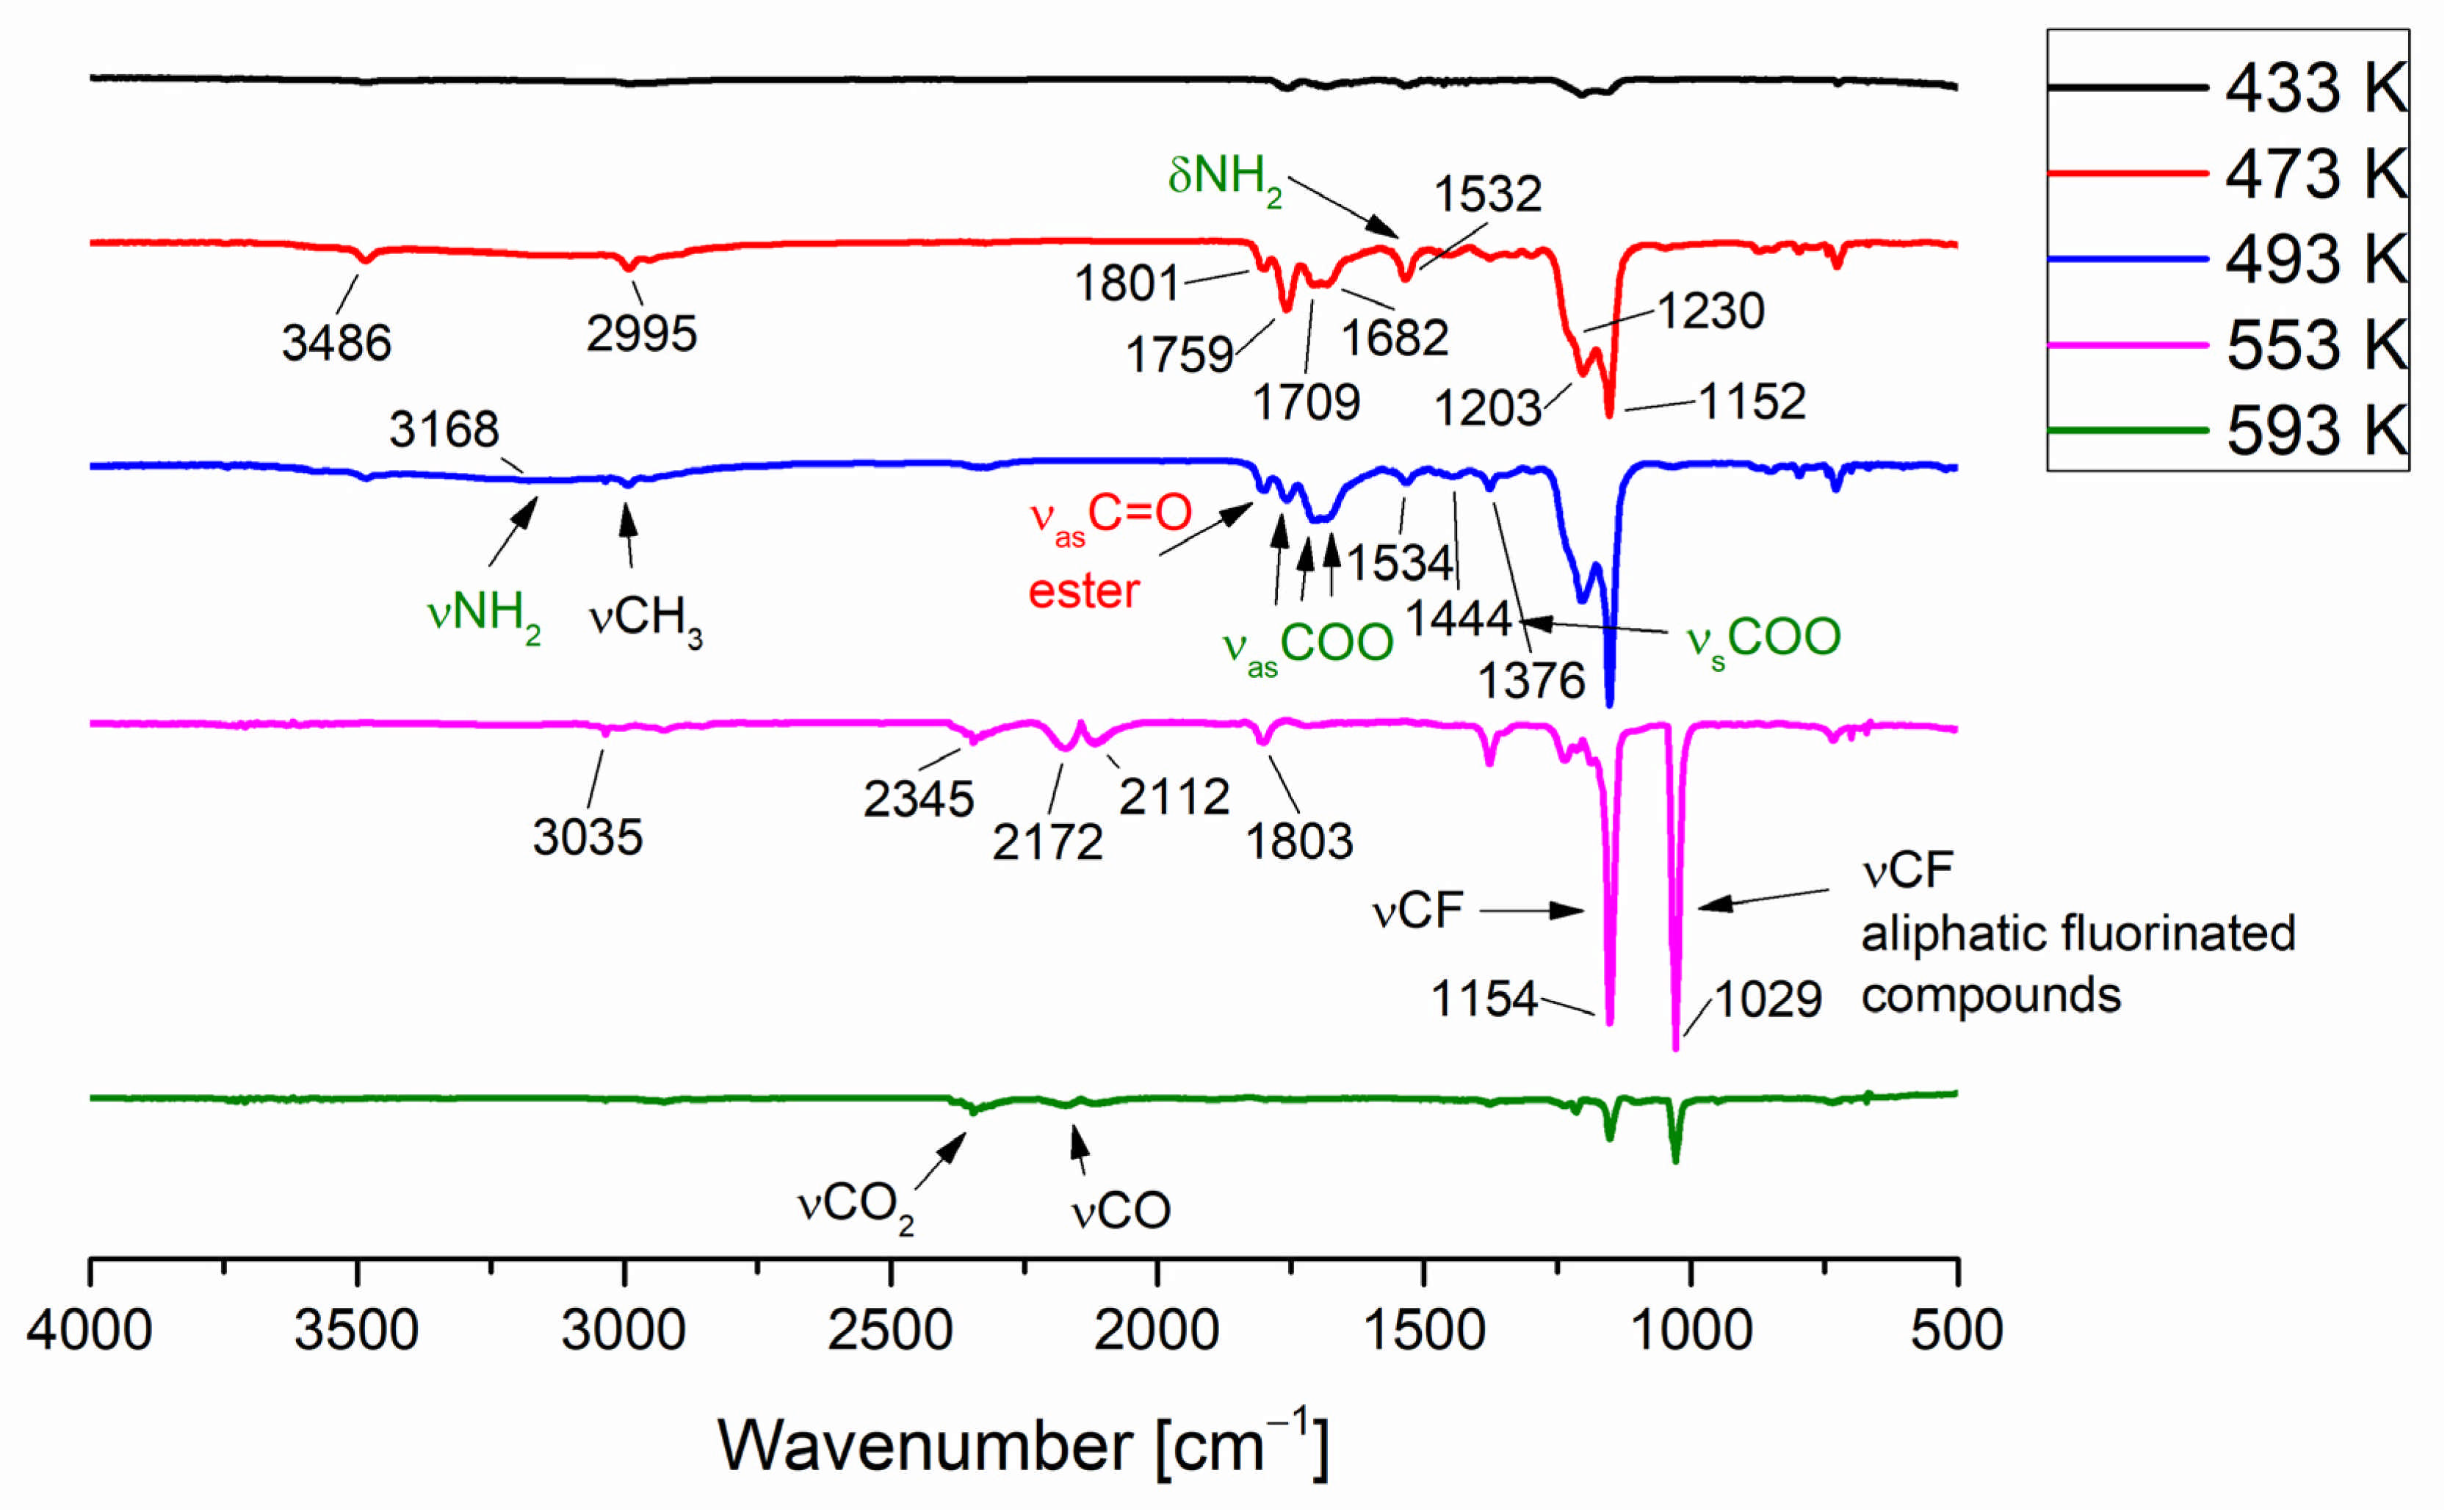
3.4. Temperature Variable Infrared Spectroscopy

The following selected compounds [Cu2(EtNH2)2(µ-O2CCF3)4] (1), [Cu2(EtNH2)2(µ-O2CC2F5)4] (2), [Cu2(EtNH2)2(µ-O2CC4F9)4] (4), [Cu2(iPrNH2)2(µ-O2CCF3)4] (7), and [Cu2(iPrNH2)2(µ-O2CC2F5)4] (8) were studied by temperature variable infrared spectroscopy (VT IR) over the temperature range 303–753 K.
In the case of the [Cu2(EtNH2)2(µ-O2CCF3)4] (1) four bands (1801 cm−1, 1759 cm−1, 1709 cm−1, and 1682 cm−1) within the range characteristic of C=O stretching vibrations were observed in the temperature between 433 and 533 K. The first is typical of gas-phase ethyl trifluoroacetate, which seems to be the decomposition product [37] The carboxylic acid formation was also considered, but in the spectrum of CF3COOH acid in the gas phase, the band νC=O band appears at 1826 cm−1 and 1788 cm−1 for the monomeric and the dimeric form, respectively [38,39,40]. Due to the existence of a band coordination shift relative to νasCOO for the free carboxylic acid, other bands in this area can be attributed to asymmetric vibrations of the coordinated COO group (Figure 4). Therefore, the lowest band (1682 cm−1) can be assigned to the νasCOO vibrations in the copper carboxylate [Cu2(µ-O2CCF3)4], as evidenced by the gas-phase spectrum measured for copper(II) pentafluoropropionate (Figure S29). In the solid-phase spectra, the vasCOO band are shifted towards higher values for the amine-containing compounds when compared to the copper carboxylate (1647 cm−1 → 1672 cm−1; Figure S30 and Figure 5). Taking this fact into account, the band at 1709 cm−1 can be assigned to the vibration of νasCOO in the molecule of the complex (1) in the gas phase, which means shifting up 37 cm−1 with regard to the compound (1) in the solid phase (Figure 5). The coordinated ethylamine vibrations bands were also identified at 2995 cm−1 (νCH3), 3168 cm−1 (νNH2), and 1532 cm−1 (δNH2), which additionally confirmed the evaporation of the complex during heating. Interestingly, no bands characteristic of free ethylamine in the gas phase were observed in the spectra (3345 cm−1,1620 cm−1 [41]). The occurrence of the vasCOO at 1759 cm−1 (shift towards higher values) indicates a change in the coordination mode from bidentate to unidentate [42] Combining this fact with the presence of the vNH2 at 3486 cm−1, the formation of the transitional copper(II) carboxylate complex with coordinated amido group (NH2) in the gas phase, in which the coordination center is reduced to Cu(I) and a hydrazine-bridged complex is generated, has been proposed (Figure 6). A similar chemical reaction was observed for the nickel complexes. [43] The strongest registered signals came from the νCF stretching vibrations over the 1152–1203 cm−1 range.
In the next step, at the temperature of 553 K, the band at 3035 cm−1 from the νCH3 stretching vibrations and at 1154 cm−1 from the νCF stretching vibrations were registered. Ethyl trifluoroacetate was still observed in the gas phase. Moreover, the identified bands at 2345 cm−1 and 2172 cm−1 can be assigned to the CO2 and CO molecules, respectively. A band characteristic of aliphatic fluorinated compounds (1029 cm−1) was also detected. The above data analysis leads to a conclusion that the [Cu2(EtNH2)2(µ-O2CCF3)4] complex (1) exists from 473 K to 533 K in the gas phase. Over this temperature, the compound (1) disappeared, and the decomposition products mixture was formed.
Similar products in the gas phase were observed in the VT IR spectra for compounds (2), (4), (7), and (8). Bands characteristic of the studied complexes were noted for each of them, and they are also shifted towards higher values in relation to the signals in the solid phase (Figures S31–S36). In conclusion, the compounds with ethylamine evaporate in the temperature range 433–533 K but those with isopropylamine in the range 473–613 K (Table 5).
The presence of carboxylic acid was identified for compounds (2) and (7) in the gas phase. In the case of the complex (2), relatively intense signals characteristic of water contamination in the gas phase were also observed in the spectra. Its presence may explain the formation of acid during decomposition. For the compound (7), the bands for water are not visible. The low intensity of the νasCOO band for the acid testifies to its little concentration in the gas phase. Therefore, the water content in the gas phase may be so low that it is invisible in the spectra but sufficient to form an acid. In addition, for the complex (2), the formation of CO2 was detected at the temperature of 413 K before the appearance of metal carriers in the gas phase. In the case of the compound (4), the bands characteristic of copper carboxylates with a coordinated amide (NH2) group were not registered. The possible mechanisms of the decomposition of the tested compounds are shown in Figure 6.
The intensity of bands registered above 3000 cm−1 in the VT IR spectra of the compounds (1), (2), (4), (7), and (8) was lower than that in the solid phase, which confirms that in the gas phase, the number of hydrogen bonds decreased, as expected. Comparing all the [Cu2(RNH2)2(μ-O2CRf)4] complexes (R = Et, iPr, tBu), the earlier described compound [Cu2(tBuNH2)2(µ-O2CC2F5)4] with tert-butylamine [9,10] has the lowest evaporation temperature (413 K). On the other hand, the gas-phase complex occurs in the widest temperature range, in the case of [Cu2(iPrNH2)2(µ–O2CC2F5)4] (8).

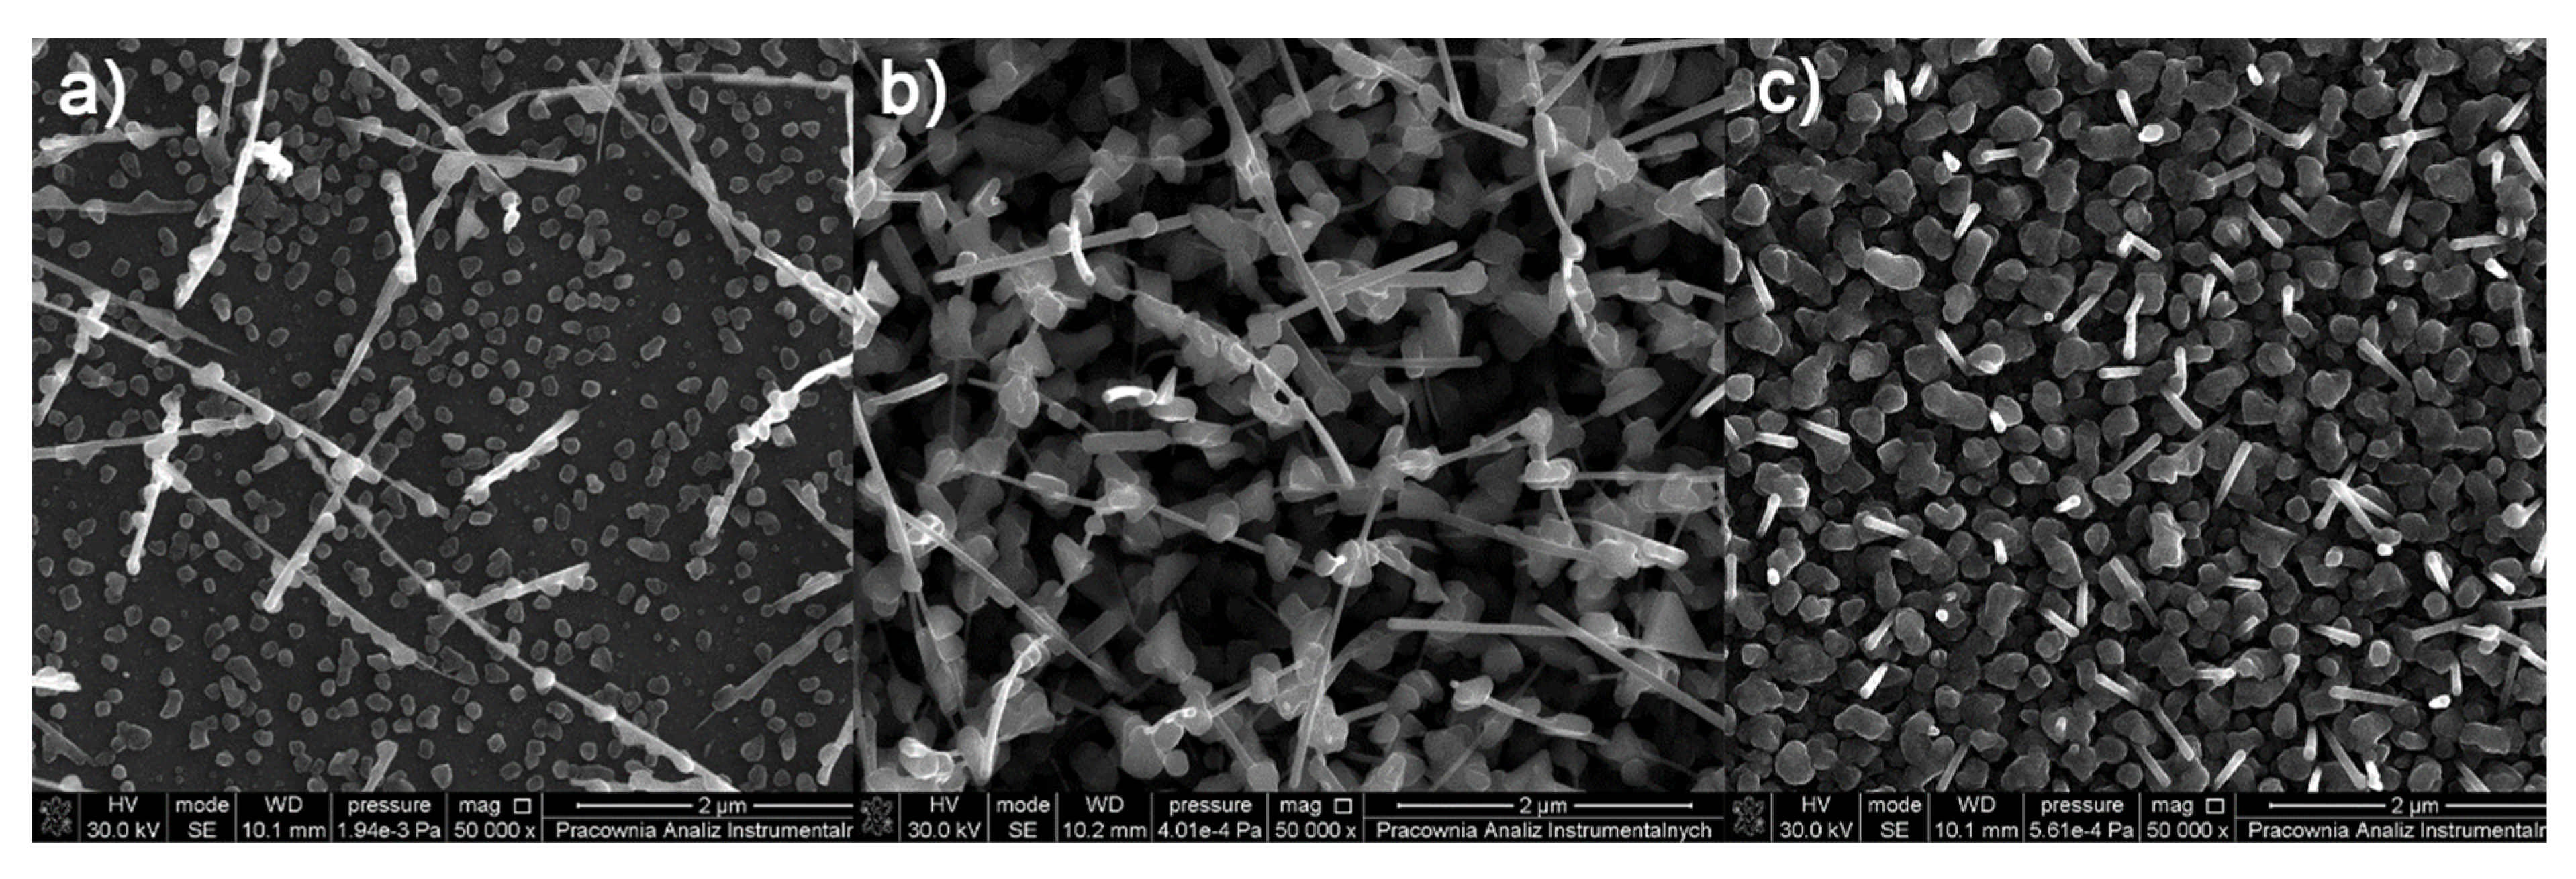
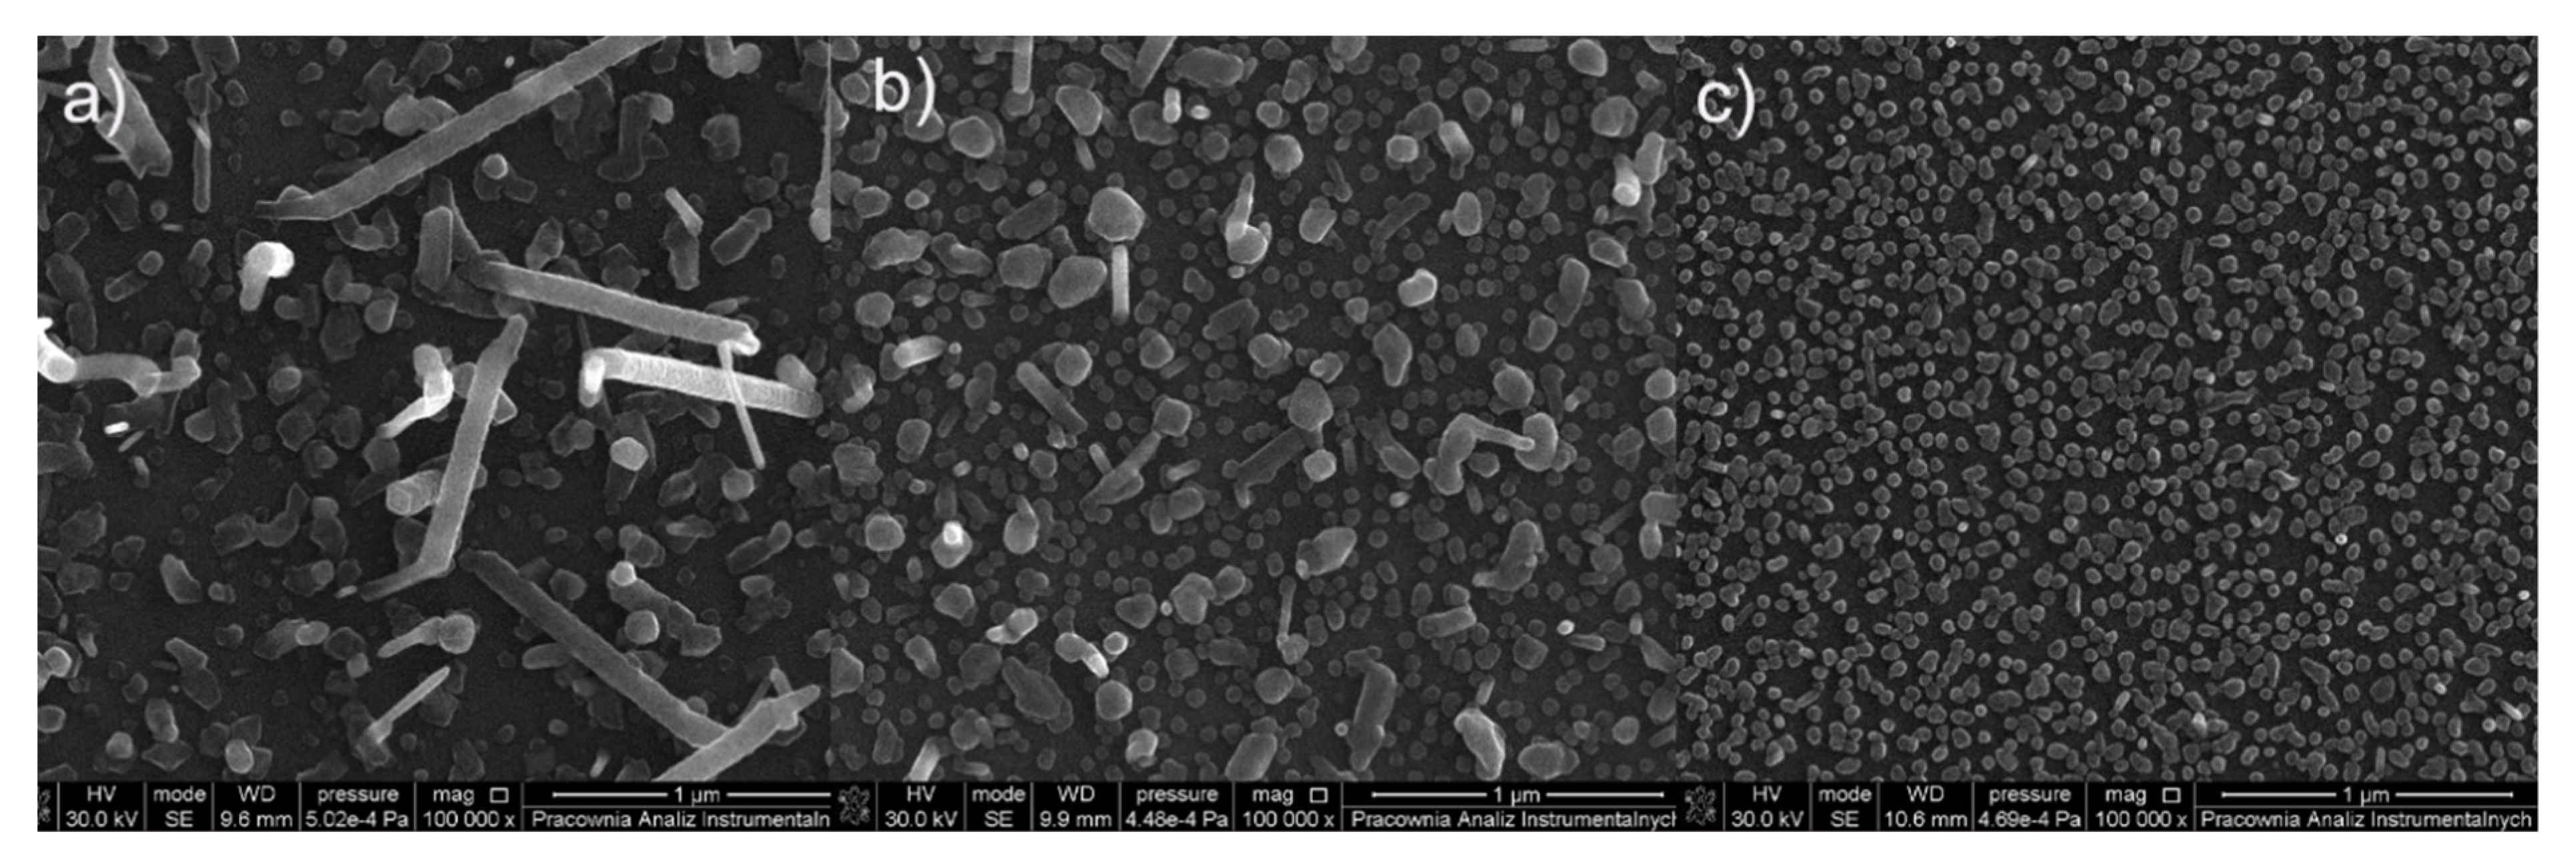
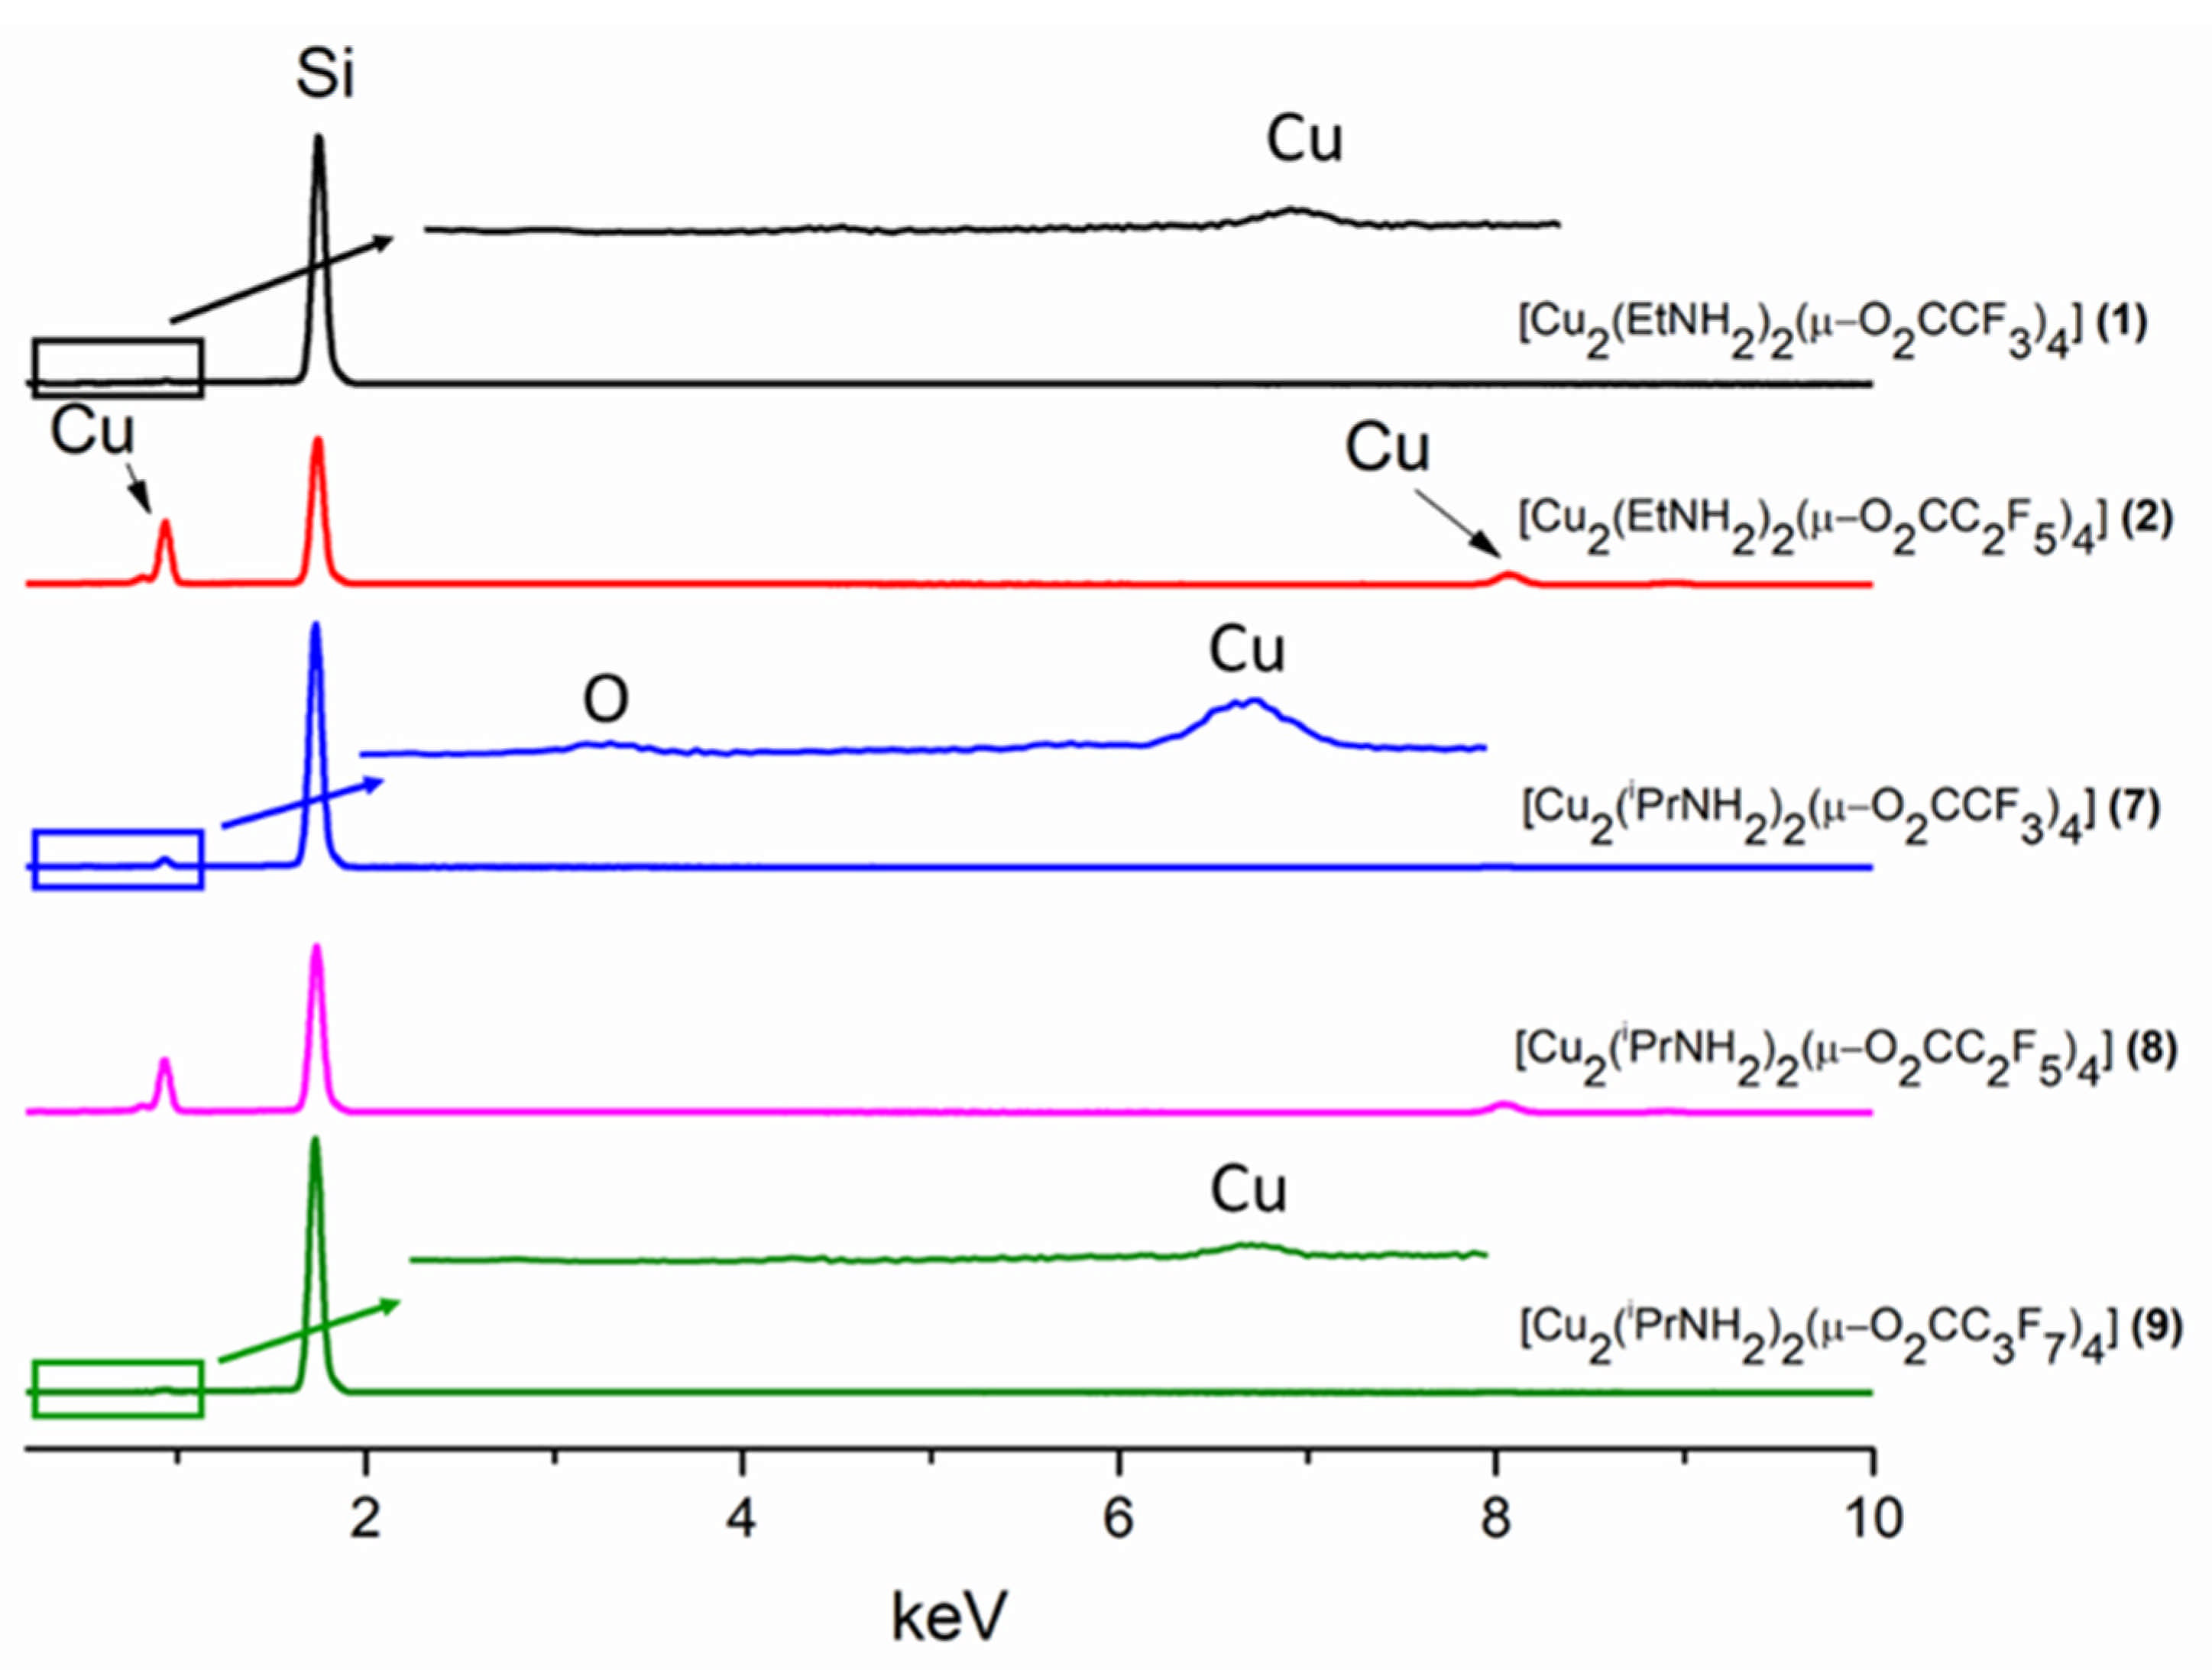
3.5. CVD Experiments

The above-mentioned studies in the gas phase indicated that from among the obtained complexes, [Cu2(EtNH2)2(µ-O2CCF3)4] (1), [Cu2(EtNH2)2(µ-O2CC2F5)4] (2), [Cu2(iPrNH2)2(µ-O2CCF3)4] (7), [Cu2(iPrNH2)2(µ-O2CC2F5)4] (8), and [Cu2(iPrNH2)2(µ-O2CC3F7)4] (9) revealed the best properties for the purposes of Chemical Vapor Deposition precursors formation. These are derivatives of the carboxylate ligands with shorter carbon chains (number of carbon atoms in the chain n = 1–3). For all the selected compounds ((1), (2), (7), (8), and (9)), deposits were obtained by the CVD method. The vaporisation temperatures TV were 453 K (7) and 473 K (1, 2, 8, and 9), whereas the deposition temperatures TD values were from 573 K to 713 K (Table 6).
The surface morphology of the formed deposits from the complex [Cu2(EtNH2)2(µ-O2CCF3)4] (1) is differentiated due to the size, shape, and density of the objects (Figure 7) and depends on the length of the transport pathway in the CVD reactor. On the first covered silicone substrate (Figure 7a), sparsely distributed nanowires with the length of 300 nm to 800 nm in length and around 50 nm to 90 nm in diameter were observed. Instead, the surface of the sample (Figure 7b) is covered by a heterogeneous and rough deposit layer on which a few nanoparticles of 80 nm in diameter were visible. The surface of the next deposit (Figure 7c) is most different from the other two because it is covered by grains with of 40 nm to 70 nm in diameter that overlap in some areas.
SEM images (Figure 8) for the compound [Cu2(EtNH2)2(µ-O2CC2F5)4] (2) show that the surface morphology of the obtained materials is diversified. The dependence of the deposit morphology on the length of the transport pathway of the precursor is evident. The coverage silicone substrate (a) (Figure 8a) morphology is extremely interesting. It consists of densely packed vertical copper nanorods with a diameter of 60 to 150 nm in diameter and approximately 500 nm in length. The material (b) (Figure 8b) is composed of densely packed grains with a size of 60–150 nm in size, which begin to interconnect with each other. The deposit (Figure 8c) shows that the grains virtually completely coalesce with the formation of a continuous layer. Considering data for the morphology of the obtained materials, it was found that the grains merged more and more intensively with the extension of the transport way.
In order to check the effect of an amine on the type of deposits formed in the CVD process, complexes containing iPrNH2 in the axial position were also used. The surface morphology of the obtained materials (a, b, c) (Figure 9) for the complex [Cu2(iPrNH2)2(µ-O2CCF3)4] (7) is heterogeneous. The Si(111) substrate (a) is covered by a rugged film on which oblong elements are visible. The deposit (b) consists of clusters of elements forming a rough surface. A similar situation is observed for the cover (c) but, this surface is even less homogeneous, and the areas with holes are visible.
As for the complex (2), in the case of the deposits obtained for the complex [Cu2(iPrNH2)2(µ-O2CC2F5)4] (8) (Figure 10), the influence of the precursor transport way on the surface morphology and the formation of nanowires was observed. However, when the compound (8) was used, the obtained nanorods were overgrown with droplet-shaped grains with a size of 80–200 nm in size (Figure 10a,b). The size of the nanorods (a) was 50–150 nm in diameter and about 900 nm in length, but the structures (b) were 20–50 nm in diameter and 500–900 nm in length. In the formed deposit (c), the packed grains with in size of 140–300 nm and nanorods in diameter of 30–70 nm and about 300–600 nm in length were grown.
Morphology of the compound [Cu2(iPrNH2)2(µ-O2CC3F7)4] (9) deposits (Figure 11) is also heterogeneous. On the surface (a), rods of about 1 µm and single grains are visible. The substrate (b) is covered by grains differing in shape (100–180 nm) and round, smaller elements (approx. 50nm in diameter) between which single rods are visible. In comparison, surface (c) is uniformly coated by small and round grains (30–80 nm).
The EDX spectra (Figure 12) confirm the presence of copper in the obtained deposits. For the majority of materials, signals from oxygen, nitrogen, carbon, and fluorine, of which the precursor was composed of which, were not observed in the spectra. A slight peak corresponding to oxygen was recorded for the cover obtained from the complex (7). It may be due to the formation of small amounts of copper oxide. In all the cases, the evaporation temperatures were similar as opposed to the deposition temperatures. In the case of the precursors (2) and (8), the copper signal in the spectrum is the most intense because the resulting covers contain a densely packed material. This result may due to the better transport of the metal carriers in the gas phase and the higher decomposition temperature used.

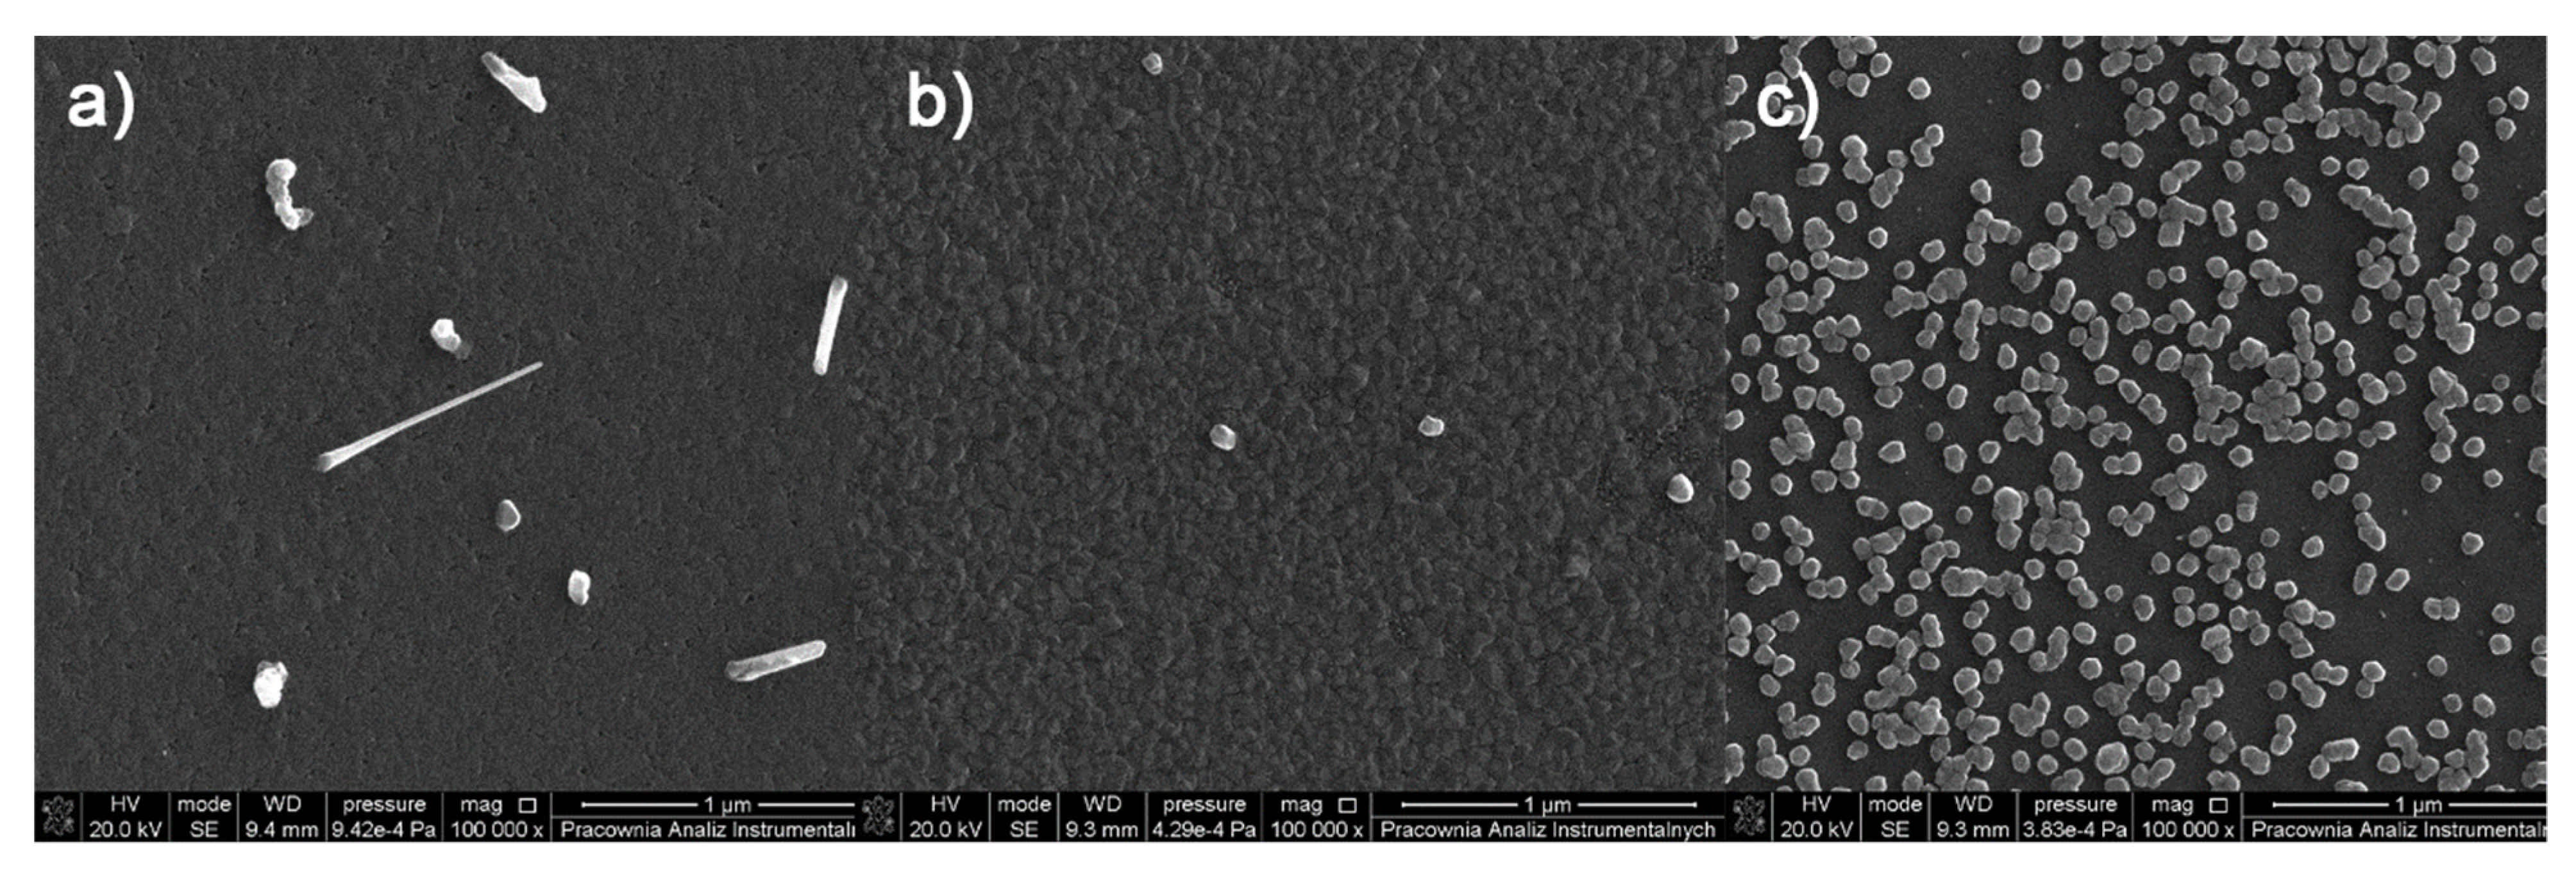
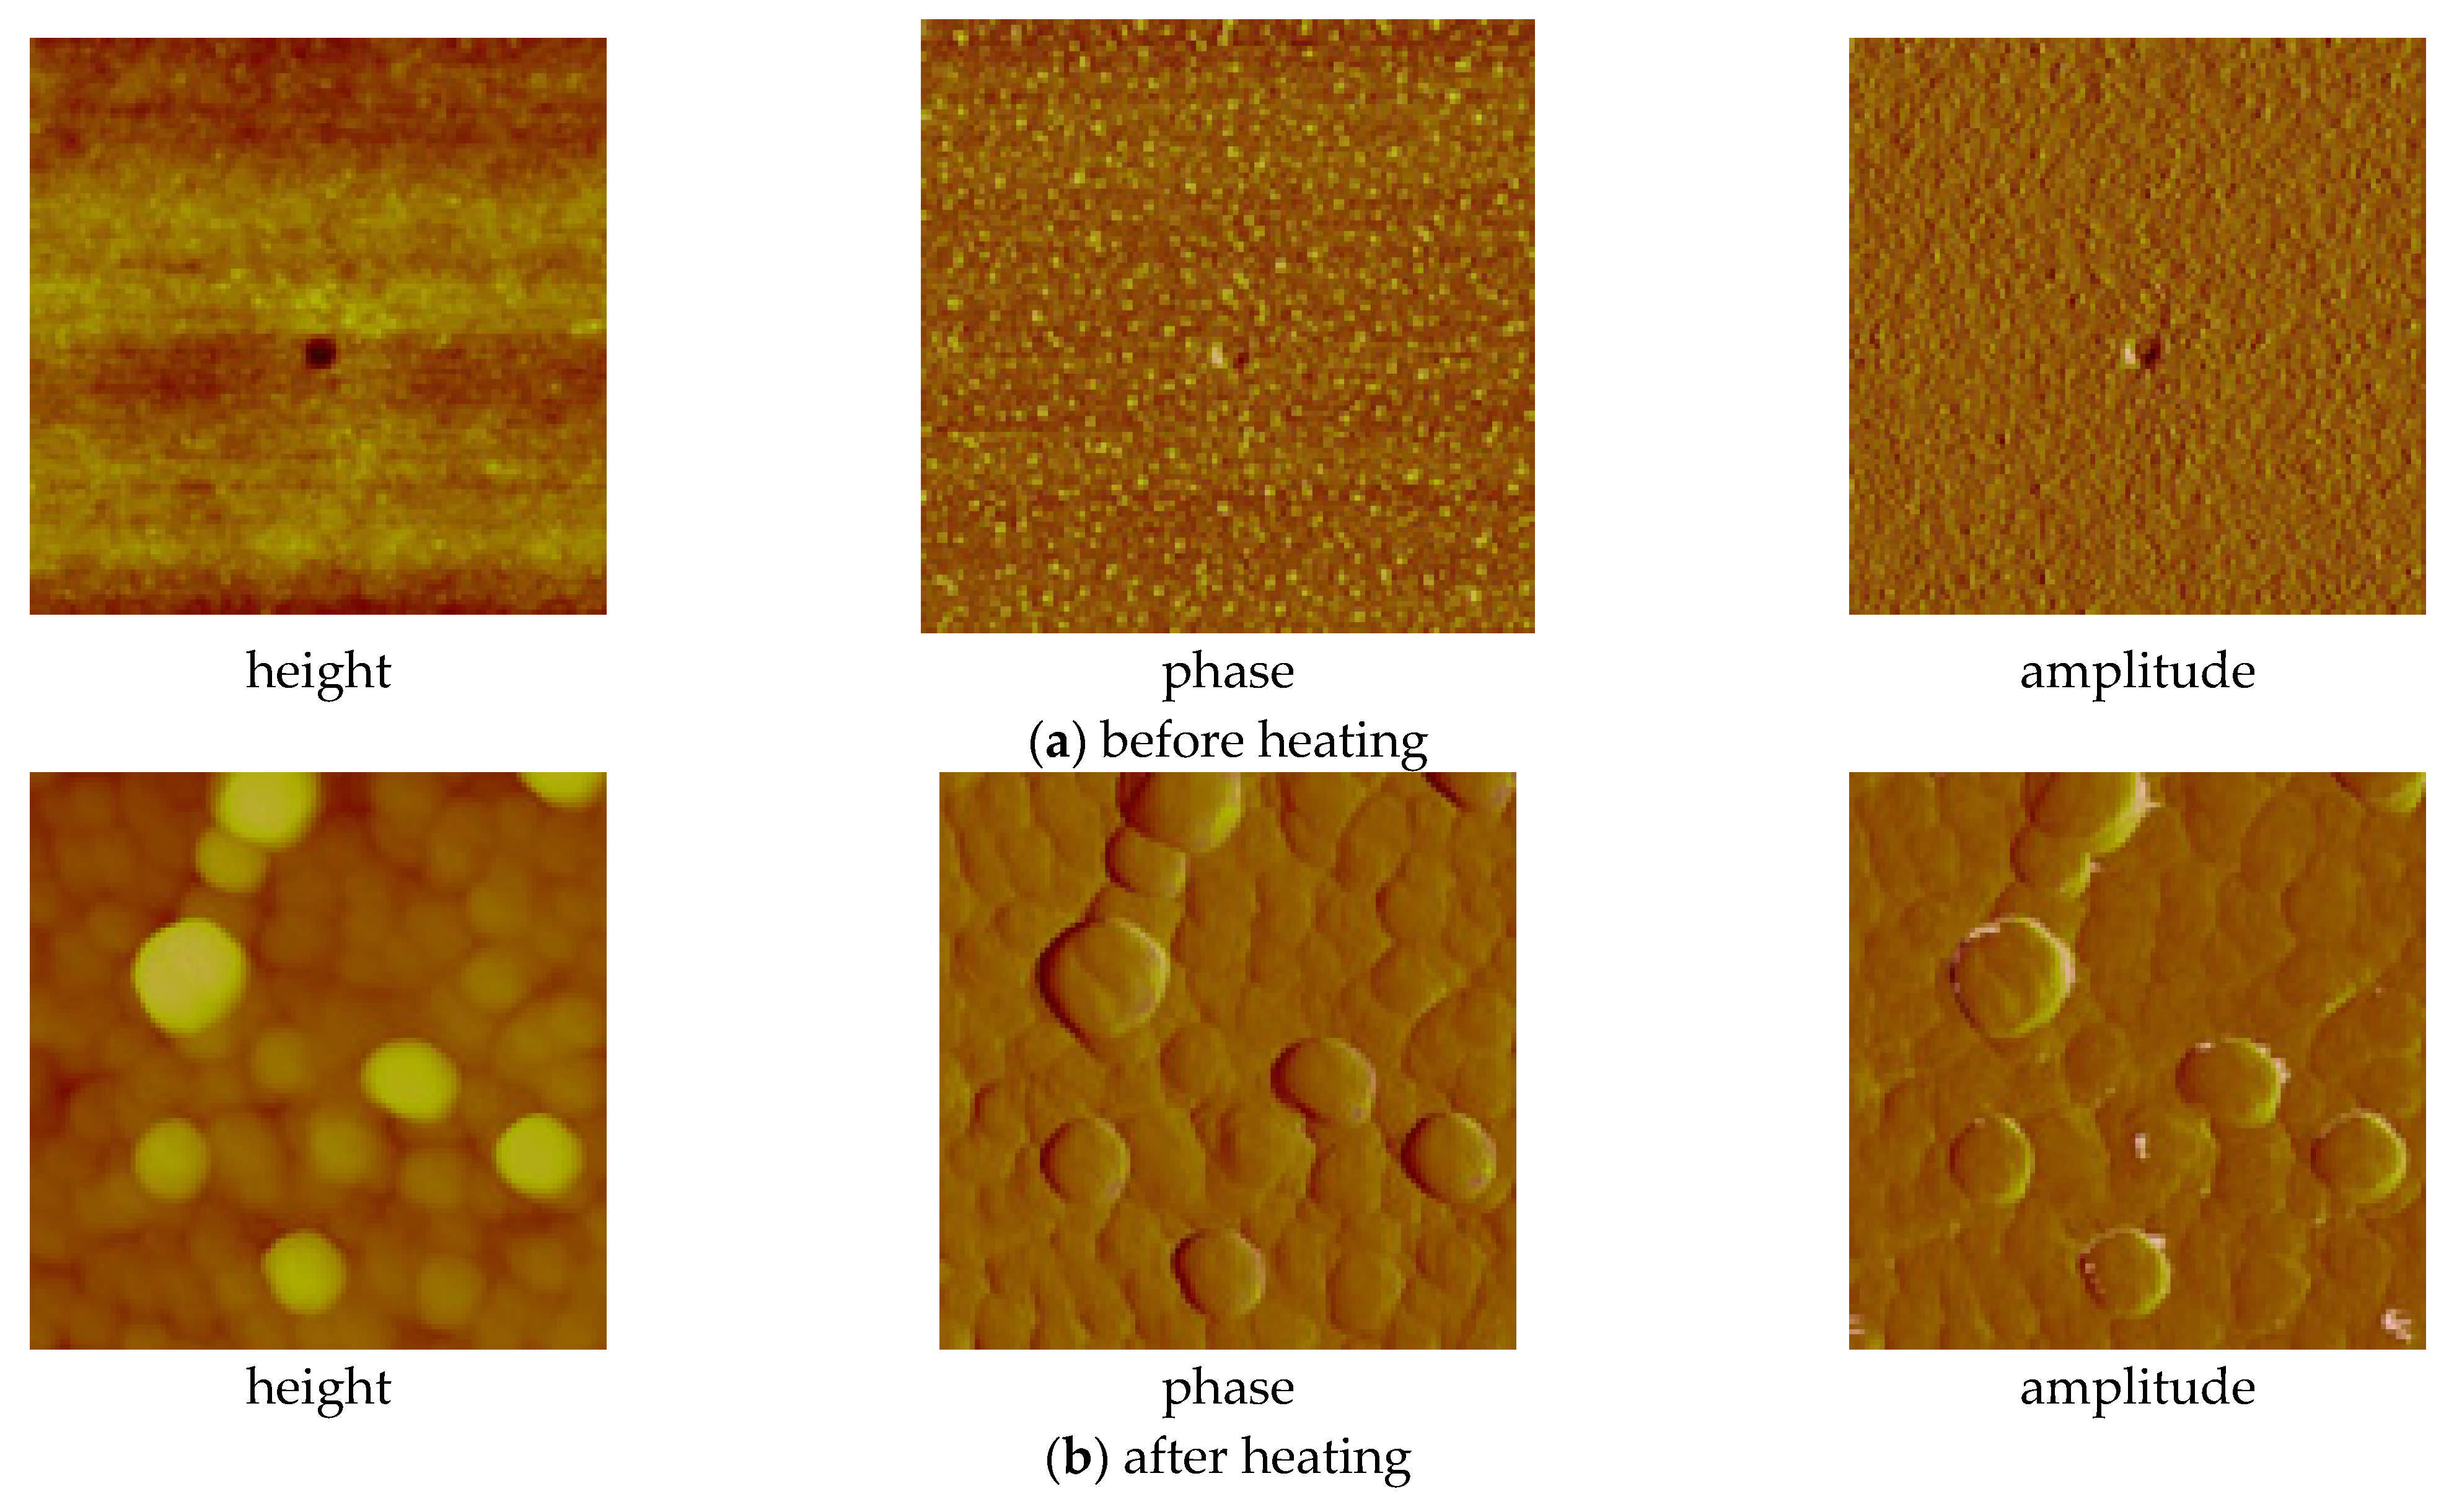
3.6. Spin- and Dip-Coating Deposition

Since the first preliminary attempts to deposit nanomaterials using the ethylamine derivative in the CVD method failed, dip- and spin-coating methods were used to prepare thin layers of the gel-like copper complexes on a silicon substrate. The thus fabricated materials were then heated to decompose the compounds to produce thin copper oxide or copper layers.

3.6.1. Spin-Coated Materials

In the case of the [Cu2(EtNH2)2(µ-O2CC3F7)4] complex (3) deposited on the Si substrate (at 1100 rpm, 30 s), the copper compound covered the surface evenly—in the dots shape (Figure 13). The phase AFM images show homogeneity of the covers (Figure 14a). One area of the complex layer was observed. The height (thickness) of the layers ranged from 2.5 to 25 nm.
After annealing, the dots become flatter and more extensive. The roughness parameters achieved Ra = 2.46 nm, Rq = 2.14 nm before heating, and Ra = 8.76 nm, Rq = 27.50 nm after heating, which points to the roughness increasing after the complex thermal decomposition Figure 14b.
The application of the [Cu2(EtNH2)2(µ-O2CC2F5)4] complex (2) on Si(111) in the multistage spin coating process gave the formation of a new type of layers type, in which small islands of the compound occasionally appeared. The size of these islands did not exceed 1 µm. Depending on the spin coating conditions, the films with different arrangements were obtained. The complex formed grains of regular size and covered the surface evenly without empty spaces. The layer was smooth with Ra = 1.78 nm, Rq = 2.37 nm, and 15 nm thick. Similar to how it was observed for the [Cu2(EtNH2)2(µ-O2CC3F7)4] (3) materials, SEM analysis indicated the presence of the small crystallites in the complex surface.
After heating, the size of the grains increased, and sometimes the empty spaces appeared; the cracks were also noted resulting in inhomogeneous cover (Figure 15). This fact influenced the surface roughness, and the parameters Ra and Rq increased significantly, achieving 15.1 nm and 18.7 nm, respectively. Generally, the roughness of the obtained layers increased after annealing (Figure 16). Additionally, after heating the layers, the defects (spaces between compounds structures) increased twice from about 60 nm to 120 nm. As a consequence, the discontinuity of the films was observed. Different film thicknesses can be explained by the above-mentioned spin coating process as a result of which defects upon heating can be produced. Unequal evaporation of the in situ formed reaction products leads to partially cracked films of copper compounds films. A similar phenomenon was observed in the case of other copper and silver complexes [44].
EDX results for the [Cu2(EtNH2)2(µ-O2CC3F7)4] (3)/Si material formed at the spin speed 1000 rpm and time of coating 30 s were: Cu 1.69; N 9.80; F 10.44; O 5.0/Cu 2.10; O 6.11 wt.% (before/after heating). The same phenomenon was observed for [Cu2(EtNH2)2(µ-O2CC2F5)4]/Si (2) material (1100 rpm 30 s), and the following amount of copper: 0.78 wt.% before and 1.05 wt.% after heating were found. Moreover, the punctual copper quantity was much higher and achieved 20.4 wt.%. This situation results from the heating and an irregularly arrangement of a compound on the substrate surface (the presence of local islands of compounds). After heating, only Cu and O elements were detected as the result of the copper complex thermal decomposition. The lack of fluorine and nitrogen signals indicated the most probable formation of CuO as the final product. According to our expectations, the relative concentration of copper in the layers increased after heating. The above discussion suggests that the quality of the layer (uniformity, roughness) can be optimised by the spin speed and deposition time variation.

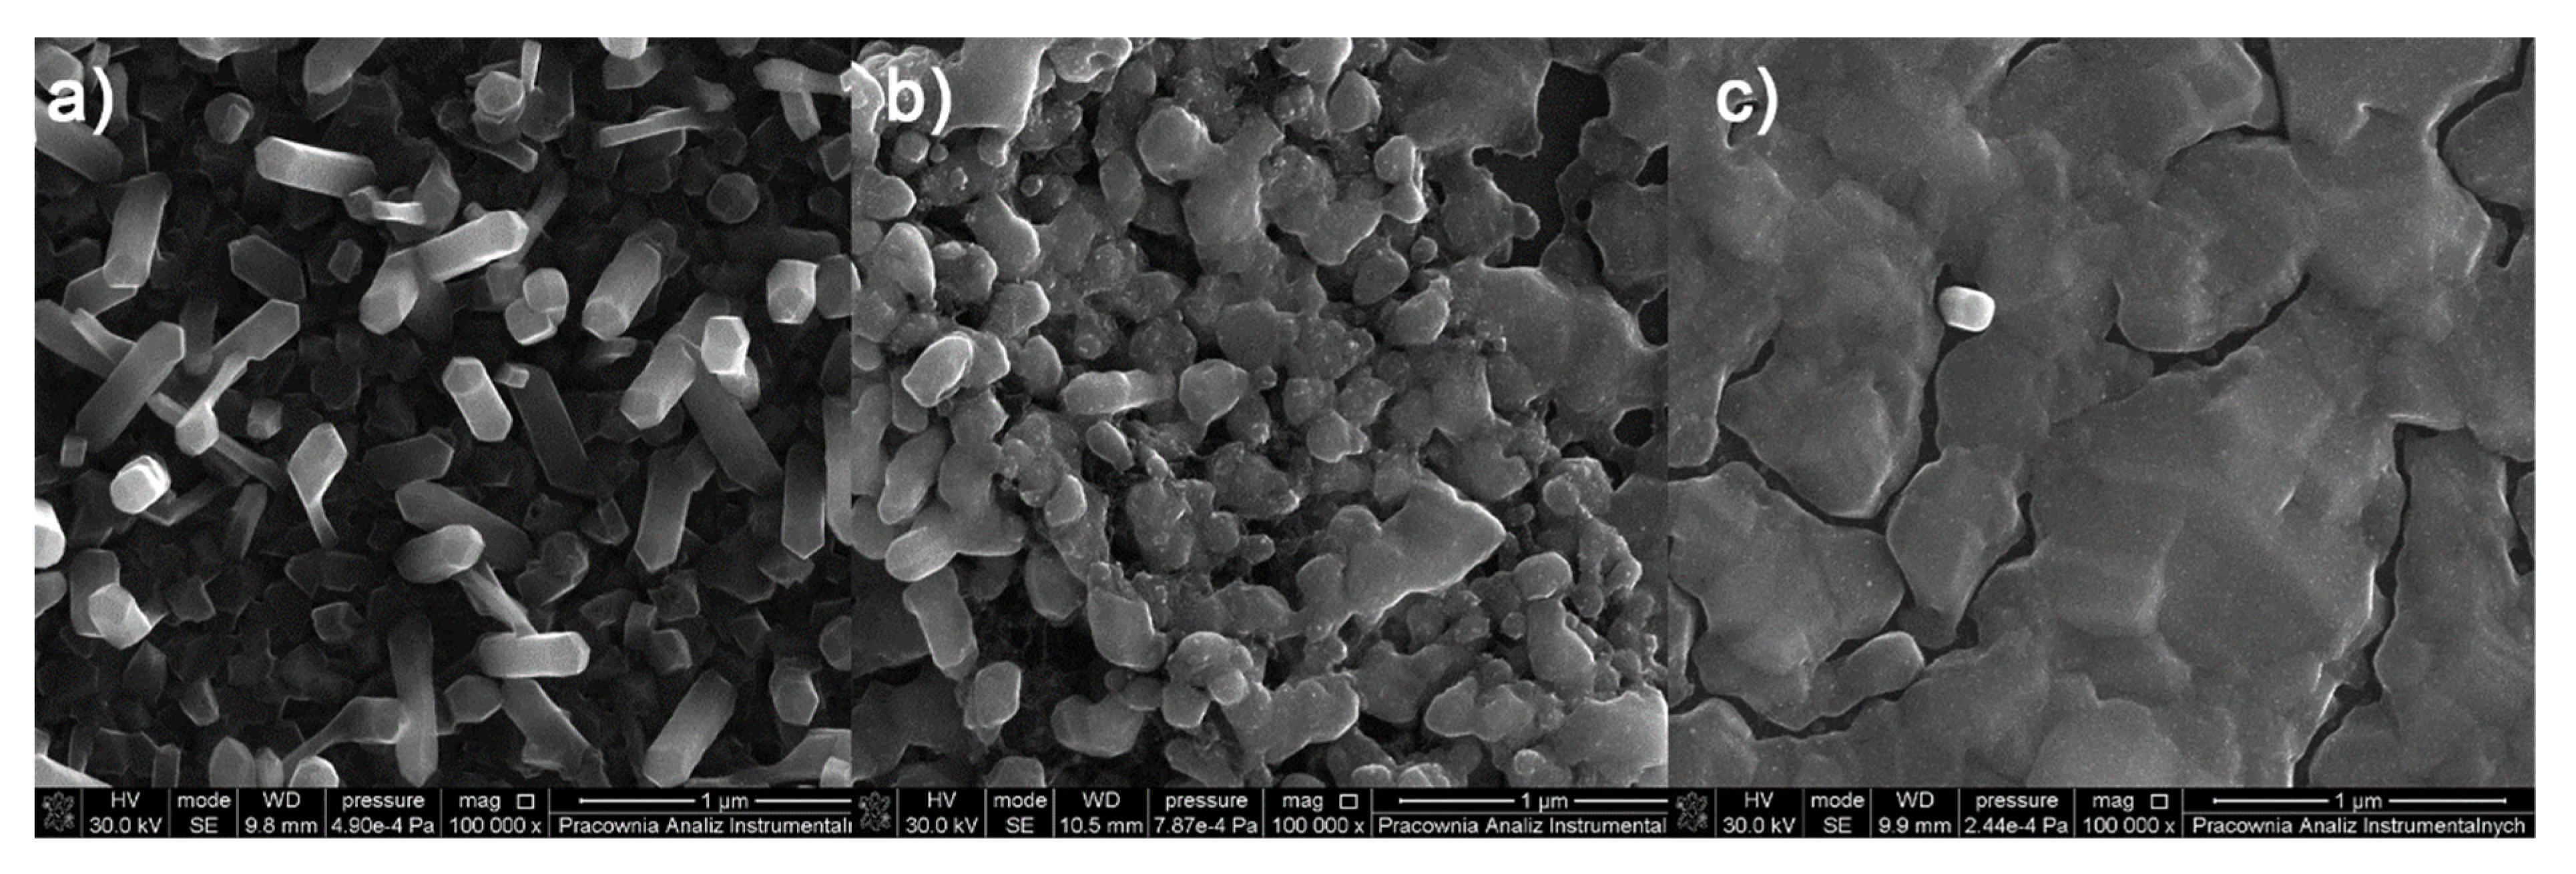
3.6.2. Dip-Coated Materials

Dip coating was the second method used to obtain thin layers of both complexes (2) and (3). Considering the essential factors affecting the formation and quality of the fabricated covers, the effect of the following parameters was taken into account: the number of coating counts (varied from 5 to 30), immersion rate (from 20 to 80 mm/min), and the immersion time (over 5−120 s). Selected from among twenty-one, the four different sets of process parameters, for which the deposition effects were most promising, were chosen (Table 7). The influence of coating counts on the properties of the [Cu2(EtNH2)2(µ-O2CC2F5)4] (2) layers were studied as well.
Again, the complex layers were heated to obtain copper oxide or thin copper materials.
AFM results showed evenly distributed copper complexes on the silicon surface and layers without discontinuities. The phase AFM images exhibited only one area of the complex layers (Figure 17 and Figure 18).
The covers of [Cu2(EtNH2)2(µ-O2CC3F7)4] (3) obtained at the immersion time 30 s exhibited tight surface; in some places, depressions and ridges appeared (Ra = 2.90 nm, Rq = 3.98 nm) (Figures S37, S38 and Figure 17). These layers are slightly rougher than the deposits obtained in the spin coating process (Ra = 2.46 nm, Rq = 2.14 nm). Reducing the immersion time to 20 s led to a more covered surface—the weight percent of silicon equals 10, which suggests a relatively good deposition of the copper complex on the surface. The best dip-coating parameters were immersion rate 10, immersion speed 80 mm/min, immersion time 20 s (Figures S15 and S39). The EDX analysis confirmed the presence of the complex by the percentage of copper 9.93 wt.%, oxygen 3.25 wt.%, fluoride 55.34 wt.%, carbon 6.29 wt.%, and nitrogen 4.22 wt.%.
The [Cu2(EtNH2)2(µ-O2CC2F5)4] (2) complex forming materials obtained by deposition on Si(111) exhibited a thin, regular structure at the following roughness parameters as follows: Ra = 0.34–0.40 nm, Rq = 0.45–0.50 nm. In some cases, small, single crystallites appeared. These layers are smoother than those fabricated by the spin-coating method (Ra = 1.78 nm, Rq = 2.37 nm for SC). The phase AFM images show homogeneity of the covers (Figure 18). One area of the complex layer was observed. The height of the layer was equal to 68 nm. Additionally, the AFM analysis pointed out a difference in the materials depending on the coating counts (5 or 10). In both cases, the layers are smooth, but increasing the coating count leads to the layers in which the singular, randomly distributed crystallites appear.
For all the dip-coated materials, the roughness of the layers increased after heating. The enhancement of the roughness is a consequence of the solvent lose and decomposition of the copper complex. Other authors observed the same effect in the case of silver and copper complexes [13,14,45]. After heating, the layers’ shape, structure, and composition were changed significantly. In the [Cu2(EtNH2)2(µ-O2CC3F7)4] (3)/Si materials, the grains of sizes from 5 to 500 nm, formed irregular aggregates. The regular grains were evenly dispersed on the silicon surface (Figure S40A and Figure 19, Figure 20, Figure 21).
Surprisingly, the relative copper content decreased several times in some cases (e.g., from 9.93 to 5.64 wt.%). The layers were smooth with Ra = 3.53 nm, Rq = 4.31 nm before heating and rough Ra = 33.4 nm, Rq = 42.3 nm after heating (Figure 21).
Similar results were observed in the case of nickel and cobalt films, which were achieved by a dip-coating process using acetolhydrazone (ALH) as a dissolving and reducing agent [46]. When the copper acetate and diethanoldiamine as solvent were used and the produced films were then heated, thin, homogenous, and smooth layers without cracks were obtained [25]. The films consisted of grains of sizes dependent on heating temperature. The roughness of these films was relatively low and ranged from 50 to 100 nm.
Additionally, for [Cu2(EtNH2)2(µ-O2CC3F7)4] (3)/Si covers after heating, TEM analysis was performed (Figure 22). TEM results confirmed the presence of copper (96.51 atomic %) and a small amount of oxygen in the layer, suggesting the metallic copper materials as the final product of thermal treatment. The diffraction analysis pointed to the d h k l = 2/5 nm = 0.4 nm and confirmed the copper grains formation as the final heating product [47]. The materials were formed by spherical structures of around 50 nm in size and were also grouped, creating agglomerates.
Moreover, for [Cu2(EtNH2)2(µ-O2CC2F5)4] (2)/Si, the regular spherical shapes of 7–420 nm in dimension were observed (Figure S40B and Figure 23). These grains were regularly disposed on the silicon surface. These structures are unusual regarding materials obtained by the dip-coating method.
The EDX results indicated the presence of copper and oxygen suggesting copper oxide to be the thermal decomposition product. Carbon as an impurity was detected as well (a few weight percent). Grains were evenly spread on the silicon surface. Therefore, a tight, rough surface of materials without cracks was observed (Figure 24 and Figure 25). The surface roughness increased from several to tens of nanometres (Ra over the range 14.0–33.0 nm, Rq = 21.5–42.0 nm). The height of the layer is about 0.5 µm. The increase in the surface’s roughness was observed for materials resulting from applying both, the spin- and dip-coating methods.
The comparison of the layers obtained by two different wet methods, i.e., dip- and spin- coating indicates that the better results–thin, smooth materials without cracks with high copper content- were obtained by the dip-coating technique (immersion rate: 10 or 5, immersion speed 80 mm/min, immersion time 20 s). Moreover, the best conditions for the spin-coating process were 1000 rpm and of 30s coating time. Better results were obtained for the [Cu2(EtNH2)2(µ-O2CC3F7)4] (3) complex.
After heating, all the surfaces prepared by the spin-coating method change colour and roughness (from several to tens of nanometres). Additionally, the presence of cracks was noted. However, the films obtained by the dip-coating technique keep the tight structure, changing their colour and roughness (from several to tens of nanometres). This latter method can be an alternative to the CVD technique.

4. Conclusions

Copper(II) carboxylate complexes group with ethylamine and isopropylamine of the general formula [Cu2(RNH2)2(µ-O2CRf)4] (110), where R = Et, iPr, Rf = CnF2n+1, n = 1–6, were synthesized in the reaction of copper(II) perfluorinated carboxylates with amines in situ generated from ethyl or isopropyl isocyanate. These compounds form blue gel-like solids. Based on the IR spectra analysis, the carboxylates bridging coordination mode and the axially N-bonded amine molecules were proposed, which results in the CuNO4 coordination sphere and the dimeric structure of the compounds in the solid state. The electron impact mass spectra analysis exhibited the occurrence of metallated species in the gas phase. The registered pseudomolecular ions [Cu2(EtNH2)2(µ-O2CRf)3]+ and [Cu2(iPrNH2)2(µ-O2CRf)3]+ confirmed the above proposed dimeric structure for the studied complexes both in the solid-state and in the gas phase. The thermal analysis showed that copper transfer to the gas phase took place at atmospheric pressure for complexes [Cu2(EtNH2)2(µ-O2CC3F7)4] (3), [Cu2(EtNH2)2(µ-O2CC4F9)4] (4), [Cu2(iPrNH2)2(μ-O2CC2F5)4] (8), and [Cu2(iPrNH2)2(μ-O2CC3F7)4] (9). In VT IR spectra, vapours of the (1) and (4) complexes vapours were observed over the temperature range 433–533 K, but in the case of the (2) compound—from 463 to 513 K. For the compounds containing isopropyl group bands, vapours of the corresponding complexes were noticed over 493–533 K (7) and 473–613 K (8). Therefore, the complexes with ethylamine require a lower evaporation temperature than precursors with isopropylamine.
The CVD experiments confirmed that the [Cu2(RNH2)2(µ-O2CRf)4] compounds are the source of metal carriers in the gas phase. The best-quality deposits consisting of pure copper were obtained using precursors [Cu2(EtNH2)2(µ-O2CC2F5)4] (2) and [Cu2(iPrNH2)2(μ-O2CC2F5)4] (8), the evaporation temperature of 473 K, and the deposition temperature of 713 K. Nanorods, nanoparticles, and densely packed grains are produced from the synthesised precursors in the CVD process. The great advantage of the [Cu2(RNH2)2(µ-O2CRf)4] compounds is that a metallic film can be obtained from the air-stable copper(II) compound with no need to use any additional reducing agent such as H2.
The procedure of the [Cu2(EtNH2)2(µ-O2CRf)4] complex layer formation was not as complicated as that for copper acetate described in the literature. The use of dip- and spin-coating indicates that better results, i.e., the thin, smooth materials without cracks, with a high copper content, can be obtained by dip-coating technique. The best conditions for the spin coating process were 1000 rpm and 30s coating time. The dip-coating parameters (for the [Cu2(EtNH2)2(µ-O2CC3F7)4] complex (3)) were as follows: immersion rate 10, immersion speed 80 mm/min, and immersion time 20 s. Heating the materials resulting from the dip- and spin-coating processes lead to thin copper metallic or copper oxide materials. In the case of the dip-coating method, spherical structures on the substrate surface were formed.
The presented results of EI MS, TG-IR, and VT IR studies confirmed the applicability of the proposed methodology for the CVD precursors selection. The thermal analysis for the temperature determination for the spin- and dip-coating materials heating was also proven.

Supplementary Materials

The following are available online at www.mdpi.com/article/10.3390/ma14237451/s1, Table S1 Mass spectrometry EI MS data of [Cu2(EtNH2)2(µ-O2CC2F5)4] (2); Table S2 Mass spectrometry EI MS data of [Cu2(EtNH2)2(µ-O2CC3F7)4] (3); Table S3 Mass spectrometry EI MS data of [Cu2(EtNH2)2(µ-O2CC4F9)4] (4); Table S4 Mass spectrometry EI MS data of [Cu2(EtNH2)2(µ-O2CC5F11)4] (5); Table S5 Mass spectrometry EI MS data of [Cu2(EtNH2)2(µ-O2CC6F13)4] (6); Table S6 Mass spectrometry EI MS data of [Cu2(iPrNH2)2(µ-O2CC2F5)4] (8); Table S7 Mass spectrometry EI MS data of [Cu2(iPrNH2)2(µ-O2CC3F7)4] (9); Table S8 Mass spectrometry EI MS data of [Cu2(iPrNH2)2(µ-O2CC4F9)4] (10); Figure S1 Infrared spectrum (thin film on KBr plates) of [Cu2(EtNH2)2(µ-O2CCF3)4] (1); Figure S2 Infrared spectrum (thin film on KBr plates) of [Cu2(EtNH2)2(µ-O2CC2F5)4] (2); Figure S3 Infrared spectrum (thin film on KBr plates) of [Cu2(EtNH2)2(µ-O2CC3F7)4] (3); Figure S4 Infrared spectrum (thin film on KBr plates) of [Cu2(EtNH2)2(µ-O2CC4F9)4] (4); Figure S5 Infrared spectrum (thin film on KBr plates) of [Cu2(EtNH2)2(µ-O2CC5F11)4] (5); Figure S6 Infrared spectrum (thin film on KBr plates) of [Cu2(EtNH2)2(µ-O2CC6F13)4] (6); Figure S7 ATR-IR spectrum of [Cu2(iPrNH2)2(µ-O2CCF3)4] (7); Figure S8 ATR-IR spectrum of [Cu2(iPrNH2)2(µ-O2CC2F5)4] (8); Figure S9 ATR-IR spectra of [Cu2(iPrNH2)2(µ-O2CC3F7)4] (9); Figure S10 ATR-IR spectrum of [Cu2(iPrNH2)2(µ-O2CC3F7)4] (10); Figure S11 Mass spectrometry EI MS spectra of [Cu2(EtNH2)2(µ-O2CCF3)4] (1) at temperature: (a) 305 K, (b) 355 K, (c) 600 K and (d) simulation of isotopic pattern for a pseudomolecular ion [Cu2(EtNH2)2(O2CCF3)3]+; Figure S12 Mass spectrometry EI MS spectra of [Cu2(EtNH2)2(µ-O2CC2F5)4] (2) at temperature: (a) 310 K, (b) 331 K, (c) 357 K (d) 542 K and (e) simulation of isotopic pattern for a pseudomolecular ion [Cu2(EtNH2)2(O2CC2F5)3]+; Figure S13 Mass spectrometry EI MS spectra of [Cu2(EtNH2)2(µ-O2CC3F7)4] (3) at temperature: (a) 357 K, (b) 417 K, (c) 463 K (d) 542 K and (e) simulation of isotopic pattern for a pseudomolecular ion [Cu2(EtNH2)2(O2CC3F7)3]+; Figure S14 Mass spectrometry EI MS spectra of [Cu2(EtNH2)2(µ-O2CC4F9)4] (4) at temperature: (a) 305 K, (b) 345 K, (c) 424 K (d) 590 K and (e) simulation of isotopic pattern for a pseudomolecular ion [Cu2(EtNH2)2(O2CC4F9)3]+; Figure S15 Mass spectrometry EI MS spectra of [Cu2(EtNH2)2(µ-O2CC5F11)4] (5) at temperature: (a) 319 K, (b) 425 K, (c) 590 K and (d) simulation of isotopic pattern for a pseudomolecular ion [Cu2(EtNH2)2(O2CC5F11)3]+; Figure S16 Mass spectrometry EI MS spectra of [Cu2(EtNH2)2(µ-O2CC6F13)4] (6) at temperature: (a) 305 K, (b) 398 K, (c) 431 K (d) 616 K and (e) simulation of isotopic pattern for a pseudomolecular ion [Cu2(EtNH2)2(O2CC6F13)3]+; Figure S17 Mass spectrometry EI MS spectra of [Cu2(iPrNH2)2(µ-O2CCF3)4] (7) at temperature: (a) 368 K, (b) 389 K, (c) 548 and (d) simulation of isotopic pattern for a pseudomolecular ion [Cu2(iPrNH2)2(O2CCF3)3]+; Figure S18 Mass spectrometry EI MS spectra of [Cu2(iPrNH2)2(µ-O2CC2F5)4] (8) at temperature: (a) 357 K, (b) 404 K, (c) 458 K, (d) 505 K and (e) simulation of isotopic pattern for a pseudomolecular ion [Cu2(iPrNH2)2(O2CC2F5)3]+; Figure S19 Mass spectrometry EI MS spectra of [Cu2(iPrNH2)2(µ-O2CC3F7)4] (9) at temperature: (a) 340 K, (b) 372 K, (c) 499 K, (d) 544 K and (e) simulation of isotopic pattern for a pseudomolecular ion [Cu2(iPrNH2)2(O2CC3F7)3]+; Figure S20 Mass spectrometry EI MS spectra of [Cu2(iPrNH2)2(µ-O2CC4F9)4] (10) (a) 369 K, (b) 388 K, (c) 401 K, (d) 490 K and (e) simulation of isotopic pattern for a pseudomolecular ion [Cu2(iPrNH2)2(O2CC4F9)3]+; Figure S21 Thermal decomposition of [Cu2(EtNH2)2(µ-O2CCF3)4] (1) (TG, DTG, DTA curves); Figure S22 TGA/IR spectrum of [Cu2(EtNH2)2(µ-O2CCF3)4] (1) registered at temperature 423 K; Figure S23 Thermal decomposition of [Cu2(EtNH2)2(µ-O2CC3F7)4] (3) (TG, DTG, DTA curves); Figure S24 Thermal decomposition of [Cu2(EtNH2)2(µ-O2CC4F9)4] (4) (TG, DTG, DTA curves); Figure S25 Thermal decomposition of [Cu2(iPrNH2)2(µ-O2CCF3)4] (7); Figure S26 Thermal decomposition of [Cu2(iPrNH2)2(µ-O2CC2F5)4] (8); Figure S27 Thermal decomposition of [Cu2(iPrNH2)2(µ-O2CC3F7)4] (9); Figure S28 Thermal decomposition of [Cu2(iPrNH2)2(µ-O2CC3F7)4] (10); Figure S29 Temperature variable infrared spectra VT IR of vapors formed during the [Cu2(µ-O2CC2F5)4] heating; Figure S30 Infrared spectra for the [Cu2(µ-O2CCF3)4] in the solid state; Figure S31 Temperature variable infrared spectra VT IR of vapors formed during the [Cu2(EtNH2)2(µ-O2CC2F5)4] complex (2) heating; Figure S32 The spectra comparison for the [Cu2(EtNH2)2(µO2CC2F5)4] complex (2) in the solid state (orange line) and in the gas phase at 473 K (blue line); Figure S33 Temperature variable infrared spectra VT IR of vapors formed during the [Cu2(EtNH2)2(µ-O2CC4F9)4] complex (4) heating; Figure S34 The spectra comparison for the [Cu2(EtNH2)2(µO2CC4F9)4] complex (4) a) in the solid state (red line) and in the gas phase at 493 K (black line) b) at temperature 493 K and 533 K; Figure S35 Temperature variable infrared spectra VT IR for the vapor formed during the [Cu2(iPrNH2)2(µ-O2CCF3)4] complex (7) heating; Figure S36 Temperature variable infrared spectra VT IR of vapors formed during the [Cu2(iPrNH2)2(µ-O2CC2F5)4] complex (8) heating 433-733K and at temperature 493 K (red line); Figure S37 Optical microscope images of [Cu2(EtNH2)2(µ-O2CC3F7)4](3)/Si before heating, immersion time 30, before heating (A) the immersion line, (B) middle of the layer; Figure S38 SEM image of [Cu2(EtNH2)2(µ-O2CC3F7)4](3)/Si immersion time 30, Mag = 200x, before heating; Figure S39 Optical microscope images of [Cu2(EtNH2)2(µ-O2CC3F7)4](3)/Si, before heating, immersion time 20, coating count 10, Mag 5x, lower part of the substrate (A), middle of the layer (B), immersion line (C); Figure S40 Images from optical microscope after heating (A) [Cu2(EtNH2)2(µ-O2CC3F7)4](3)/Si immersion time 20; (B) [Cu2(EtNH2)2(µ-O2CC2F5)4](2)/Si immersion time 20.

Author Contributions

Conceptualization, M.B. and I.B.S.; investigation, A.B., K.M., M.B. and I.B.S.; writing—original draft preparation, A.B., K.M., M.B. and I.B.S.; writing—review and editing, A.B., K.M., M.B. and I.B.S.; visualization, A.B. and K.M.; supervision, M.B. and I.B.S.; funding acquisition, I.B.S. All authors have read and agreed to the published version of the manuscript.

Funding

The financing of this work was by National Science Centre (grant: N N204 546539) and Nicolaus Copernicus University in Torun (PDB no. 103).

Institutional Review Board Statement

Not applicable.

Informed Consent Statement

Not applicable.

Data Availability Statement

The data presented in this study are available on request from the corresponding author.

Conflicts of Interest

The authors declare no conflict of interest.

References

  1. Padnya, P.; Shibaeva, K.; Arsenyev, M.; Baryshnikova, S.; Terenteva, O.; Shiabiev, I.; Khannanov, A.; Boldyrev, A.; Gerasimov, A.; Grishaev, D.; et al. Catechol-Containing Schiff Bases on Thiacalixarene: Synthesis, Copper (II) Recognition, and Formation of Organic-Inorganic Copper-Based Materials. Molecules 2021, 26, 2334. [Google Scholar] [CrossRef]
  2. Hao, X.-L.; Ma, Y.-Y.; Zhang, C.; Wang, Q.; Cheng, X.; Wang, Y.-H.; Li, Y.-G.; Wang, E.-B. Assembly of new organic-inorganic hybrids based on copper-bis(triazole) complexes and Keggin-type polyoxometalates with different negative charges. CrystEngComm 2012, 14, 6573–6580. [Google Scholar] [CrossRef]
  3. Wang, L.; Sun, H.; Sun, C.; Xu, D.; Tao, J.; Wei, T.; Zhang, Z.; Zhang, Y.; Wang, Z.; Bi, W. Lead-free, stable orange-red-emitting hybrid copper based organic-inorganic compounds. Dalton Trans. 2021, 50, 2766–2773. [Google Scholar] [CrossRef] [PubMed]
  4. Li, X.; Zhong, X.; Hu, Y.; Li, B.; Sheng, Y.; Zhang, Y.; Weng, C.; Feng, M.; Han, H.; Wang, J. Organic-Inorganic Copper(II)-Based Material: A Low-Toxic, Highly Stable Light Absorber for Photovoltaic Application. J. Phys. Chem. Lett. 2017, 8, 1804–1809. [Google Scholar] [CrossRef] [PubMed]
  5. Srivastava, P.C.; Singh, B.N.; Adhya, S.D.; Banerji, K.C. Thermal behaviour of copper oxalate and its mixed ligand complexes with amines. J. Therm. Anal. 1983, 27, 263–273. [Google Scholar] [CrossRef]
  6. Perova, E.V.; Yakovleva, M.A.; Baranova, E.O.; Anan’ev, I.V.; Nefedov, S.E. Reactions of aqueous copper acetate with triethylamine and 3,5-dimethylpyrazole. Russ. J. Inorg. Chem. 2010, 55, 714–726. [Google Scholar] [CrossRef]
  7. Rigamonti, L.; Carlino, S.; Halibi, Y.; Demartin, F.; Castellano, C.; Ponti, A.; Pievo, R.; Pasini, A. Copper 1D coordination polymers and dimers: Role of the carboxylate and the ammonium cation, crystal structures and magnetic studies. Polyhedron 2013, 53, 157–165. [Google Scholar] [CrossRef] [Green Version]
  8. Kumar, N.; Kalsotra, B.L. Preparation of Complexes of Copper(II) Aryl Carboxylates with Diethyl Amine and Dipropyl Amine. J. Chin. Chem. Soc. 1974, 21, 267–269. [Google Scholar] [CrossRef]
  9. Szymańska, I.B. Gaseous phase studies of new copper(II) carboxylate complexes with tert-butylamine as potential precursors for chemical vapor deposition (CVD). Polyhedron 2013, 50, 200–207. [Google Scholar] [CrossRef]
  10. Piszczek, P.; Szymańska, I.B.; Talik, E.; Heimann, J. Deposition of thin copper layers using copper(II) carboxylate complexes with tert-butylamine as new CVD precursors. Chem. Vap. Depos. 2013, 19, 251–259. [Google Scholar] [CrossRef]
  11. Lacko, M.; Papp, P.; Szymańska, I.B.; Szłyk, E.; Matejčík, Š. Electron interaction with copper(II) carboxylate compounds. Beilstein J. Nanotechnol. 2018, 9, 384–398. [Google Scholar] [CrossRef] [PubMed] [Green Version]
  12. Sala, L.; Szymańska, I.B.; Dablemont, C.; Lafosse, A.; Amiaud, L. Response under low-energy electron irradiation of a thin film of a potential copper precursor for focused electron beam induced deposition (FEBID). Beilstein J. Nanotechnol. 2018, 9, 57–65. [Google Scholar] [CrossRef] [PubMed] [Green Version]
  13. Jakob, A.; Rüffer, T.; Schmidt, H.; Djiele, P.; Körbitz, K.; Ecorchard, P.; Haase, T.; Kohse-Höinghaus, K.; Frühauf, S.; Wächtler, T.; et al. Disilver(I) coordination complexes: Synthesis, reaction chemistry, and their potential use in CVD and spin-coating processes for silver deposition. Eur. J. Inorg. Chem. 2010, 2010, 2975–2986. [Google Scholar] [CrossRef]
  14. Tuchscherer, A.; Shen, Y.; Jakob, A.; Mothes, R.; Al-Anber, M.; Walfort, B.; Rüffer, T.; Frühauf, S.; Ecke, R.; Schulz, S.E.; et al. Lewis-base copper(I) formates: Synthesis, reaction chemistry, structural characterization and their use as spin-coating precursors for copper deposition. Inorg. Chim. Acta 2011, 365, 10–19. [Google Scholar] [CrossRef]
  15. Yang, Y.; Huang, Q.; Payne, G.F.; Sun, R.; Wang, X. A highly conductive, pliable and foldable Cu/cellulose paper electrode enabled by controlled deposition of copper nanoparticles. Nanoscale 2019, 11, 725–732. [Google Scholar] [CrossRef]
  16. Kwon, Y.T.; Kim, Y.S.; Lee, Y.; Kwon, S.; Lim, M.; Song, Y.; Choa, Y.H.; Yeo, W.H. Ultrahigh Conductivity and Superior Interfacial Adhesion of a Nanostructured, Photonic-Sintered Copper Membrane for Printed Flexible Hybrid Electronics. ACS Appl. Mater. Interfaces 2018, 10, 44071–44079. [Google Scholar] [CrossRef] [Green Version]
  17. Chan, G.H.; Zhao, J.; Hicks, E.M.; Schatz, G.C.; van Duyne, R.P. Plasmonic properties of copper nanoparticles fabricated by nanosphere lithography. Nano Lett. 2007, 7, 1947–1952. [Google Scholar] [CrossRef]
  18. Huang, C.-L.; Kumar, G.; Sharma, G.D.; Chen, F.-C. Plasmonic effects of copper nanoparticles in polymer photovoltaic devices for outdoor and indoor applications. Appl. Phys. Lett. 2020, 116, 253302. [Google Scholar] [CrossRef]
  19. Gu, Z.; Shen, H.; Shang, L.; Lv, X.; Qian, L.; Zheng, G. Nanostructured Copper-Based Electrocatalysts for CO2 Reduction. Small Methods 2018, 2, 1800121. [Google Scholar] [CrossRef]
  20. Luc, W.; Fu, X.; Shi, J.; Lv, J.J.; Jouny, M.; Ko, B.H.; Xu, Y.; Tu, Q.; Hu, X.; Wu, J.; et al. Two-dimensional copper nanosheets for electrochemical reduction of carbon monoxide to acetate. Nat. Catal. 2019, 2, 423–430. [Google Scholar] [CrossRef]
  21. Kuroda, K.; Keller, P.; Kawasaki, H. Mild synthesis of single-nanosized plasmonic copper nanoparticles and their catalytic reduction of methylene blue. Colloids Interface Sci. Commun. 2019, 31, 100187. [Google Scholar] [CrossRef]
  22. Gao, F.; Pang, H.; Xu, S.; Lu, Q. Copper-based nanostructures: Promising antibacterial agents and photocatalysts. Chem. Commun. 2009, 24, 3571–3573. [Google Scholar] [CrossRef] [PubMed]
  23. Mahmoodi, S.; Elmi, A.; Hallaj-Nezhadi, S. Copper Nanoparticles as Antibacterial Agents. J. Mol. Pharm. Org. Process Res. 2018, 6, 1000140. [Google Scholar] [CrossRef]
  24. Niavol, S.S.; Ghodsi, F.E. Effect of pH on the Properties of Nanocrystalline CuO Thin Films Deposited by Sol-Gel Process. Russ. J. Phys. Chem. A 2013, 87, 84–87. [Google Scholar] [CrossRef]
  25. Syukri, T.; Ban, Y.; Ohya, Y.; Takahashi. Novel approach to deposition of copper thin films by dip-coating method. J. Mater. Sci. Lett. 2002, 21, 1449–1451. [Google Scholar] [CrossRef]
  26. Szłyk, E.; Szymańska, I. Studies of new volatile copper(I) complexes with triphenylphosphite and perfluorinated carboxylates. Polyhedron 1999, 18, 2941–2948. [Google Scholar] [CrossRef]
  27. Furukawa, Y.; Kaneko, A. Investigation of surface formation process of silicon molecular beam epitaxy by atomic force microscopy. CIRP Ann. 1999, 48, 453–457. [Google Scholar] [CrossRef]
  28. Nakamoto, K. Infrared and Raman Spectra of Inorganic and Coordination Compounds, 6th ed.; John Wiley & Sons, Inc.: Hoboken, NJ, USA, 2009; Part A 56–58, 217–220, part B, 276–282. [Google Scholar]
  29. Sengar, B.R.S.; Narain, G. Magneto-chemistry and Infrared Spectra of Ammonia and Primary Aliphatic Amine Complexes of Copper(II) Chromate. Bull. Chem. Soc. Jpn. 1975, 48, 1087–1088. [Google Scholar] [CrossRef]
  30. Uznanski, P.; Zakrzewska, J.; Favier, F.; Kazmierski, S.; Bryszewska, E. Synthesis and characterization of silver nanoparticles from (bis)alkylamine silver carboxylate precursors. J. Nanoparticle Res. 2017, 19, 121. [Google Scholar] [CrossRef] [Green Version]
  31. Zakrzewska, J.; Uznanski, P. Synthesis and characterization of bis(amine)palladium(ii) carboxylate complexes as precursors of palladium nanoparticles. Dalton Trans. 2021, 50, 6933–6948. [Google Scholar] [CrossRef] [PubMed]
  32. Melník, M. Mono-, bi-, tetra- and polynuclear copper(II) halogenocarboxylates. Coord. Chem. Rev. 1981, 36, 1–44. [Google Scholar] [CrossRef]
  33. Mikuriya, M.; Yamakawa, C.; Tanabe, K.; Nukita, R.; Amabe, Y.; Yoshioka, D.; Mitsuhashi, R.; Tatehata, R.; Tanaka, H.; Handa, M.; et al. Copper(II) Carboxylates with 2,3,4-Trimethoxybenzoate and 2,4,6-Trimethoxybenzoate: Dinuclear Cu(II) Cluster and µ-Aqua-Bridged Cu(II) Chain Molecule. Magnetochemistry 2021, 7, 35. [Google Scholar] [CrossRef]
  34. John Wiley & Sons. SpectraBase Compound ID=8A1dEqurmmH SpectraBase Spectrum ID=G4CBuKNSKtQ, (n.d.). Available online: https://spectrabase.com/spectrum/G4CBuKNSKtQ (accessed on 30 October 2021).
  35. John Wiley & Sons. SpectraBase Compound ID=Cz3wO46i3MG, (n.d.). Available online: https://spectrabase.com/compound/Cz3wO46i3MG (accessed on 30 October 2021).
  36. John Wiley & Sons. SpectraBase, SpectraBase Compound ID=3IaXq9hN0c6 SpectraBase Spectrum ID=4PAsbe0uoOp, (n.d.). Available online: https://spectrabase.com/spectrum/4PAsbe0uoOp (accessed on 30 October 2021).
  37. John Wiley & Sons. SpectraBase Compound ID=6i6hO8Z6rbg SpectraBase Spectrum ID=1HL91c6HmtV, SpectraBase, (n.d.). Available online: https://spectrabase.com/spectrum/1HL91c6HmtV (accessed on 30 October 2021).
  38. John Wiley & Sons. SpectraBase Compound ID=4G3cv2HmDfG SpectraBase Spectrum ID=89U74D3zedG, (n.d.). Available online: https://spectrabase.com/spectrum/89U74D3zedG (accessed on 30 October 2021).
  39. Fuson, N.; Josien, M.-L.; Jones, E.A.; Lawson, J.R. Infrared and Raman spectroscopy studies of light and heavy trifluoroacetic acids. J. Chem. Phys. 1952, 20, 1627–1634. [Google Scholar] [CrossRef]
  40. Shipman, S.T.; Douglass, P.C.; Yoo, H.S.; Hinkle, C.E.; Mierzejewski, E.L.; Pate, B.H. Vibrational dynamics of carboxylic acid dimers in gas and dilute solution. Phys. Chem. Chem. Phys. 2007, 9, 4572–4586. [Google Scholar] [CrossRef] [PubMed]
  41. Höflich, K.; Jurczyk, J.M.; Madajska, K.; Götz, M.; Berger, L.; Guerra-Nuñez, C.; Haverkamp, C.; Szymanska, I.; Utke, I. Towards the third dimension in direct electron beam writing of silver. Beilstein J. Nanotechnol. 2018, 9, 842–849. [Google Scholar] [CrossRef] [PubMed] [Green Version]
  42. Nakamoto, K. Infrared and Raman Spectra of Inorganic and Coordination Compounds: Part B: Applications in Coordination, Organometallic, and Bioinorganic Chemistry, 6th ed.; John Wiley & Sons, Inc.: Hoboken, NJ, USA, 2009; p. 118. [Google Scholar]
  43. Gu, N.X.; Oyala, P.H.; Peters, J.C. Hydrazine Formation via Coupling of a Nickel(III)–NH2 Radical. Angew. Chem. Int. Ed. 2021, 60, 4009–4013. [Google Scholar] [CrossRef] [PubMed]
  44. Jakob, A.; Rüffer, T.; Ecorchard, P.; Walfort, B.; Körbitz, K.; Frühauf, S.; Schulz, S.E.; Gessner, T.; Lang, H. Phosphane Copper(I) Dicarboxylates: Synthesis and Their Potential Use as Precursors for the Spin-coating Process in the Deposition of Copper. Z. Anorg. Allg. Chem. 2010, 636, 1931–1940. [Google Scholar] [CrossRef] [Green Version]
  45. Bräuer, B.; Zahn, D.R.T.; Rüffer, T.; Salvan, G. Deposition of thin films of a transition metal complex by spin coating. Chem. Phys. Lett. 2006, 432, 226–229. [Google Scholar] [CrossRef]
  46. Syukri; Terazawa, T.; Ban, T.; Ohya, Y.; Takahashi, Y. Dip Coating of Metal Films from Metal Acetate-Acetol Hydrazone System, Ceram. Trans. In Proceedings of the International Conference on Ceramic Processing Science Meeting, Nagoya, Japan, 15–17 May 2000; 2001; Volume 112, pp. 329–334. [Google Scholar] [CrossRef]
  47. Theivasanthi, T.; Alagar, M. X-Ray Diffraction Studies of Copper Nanopowder. Arch. Phys. Res. 2010, 1, 112–117. [Google Scholar] [CrossRef]
Figure 1. EI MS spectrum of [Cu2(iPrNH2)2(µ-O2CC2F5)4] (8), T = 363 K.
Materials 14 07451 g001
Figure 2. Fragmentation scheme for metallated fragments of [Cu2(RNH2)2(μ-O2CRf)4] (marked green—observed for all compounds (110); marked grey—observed for some complexes).
Materials 14 07451 g002
Figure 3. The thermal decomposition scheme for [Cu2(EtNH2)2(μ-O2CCF3)4] (1) proposed based on TG-IR results.
Materials 14 07451 g003
Figure 4. Temperature variable infrared spectra VT IR for the vapour formed during the [Cu2(EtNH2)2(µ-O2CCF3)4] complex (1) heating.
Materials 14 07451 g004
Figure 5. The spectra comparison for the [Cu2(EtNH2)2(µ-O2CCF3)4] complex (1) in the solid-state (red line) and the gas phase at 493 K (black line).
Materials 14 07451 g005
Figure 6. The thermal decomposition scheme for [Cu2(RNH2)2(μ-O2CRf)4] compounds (1, 2, 4, 7, and 8) based on VT IR results.
Materials 14 07451 g006
Figure 7. SEM images of deposits for the precursor [Cu2(EtNH2)2(µ-O2CCF3)4] (1), Mag = 100,000× ((ac)—orderly with the increasing transport way), TV = 473 K, TD = 573 K, Si(111), Ar.
Materials 14 07451 g007
Figure 8. SEM pictures of deposits for the precursor [Cu2(EtNH2)2(µ-O2CC2F5)4] (2), Mag = 150,000×, ((ac)—orderly with the increasing transport way), TV = 473 K, TD = 713 K, Si(111), Ar.
Materials 14 07451 g008
Figure 9. SEM pictures of deposits for the precursor [Cu2(iPrNH2)2(µ-O2CCF3)4] (7), Mag = 50,000×, ((ac)-orderly with the increasing transport way), TV = 453 K, TD = 573 K, Si(111), Ar.
Materials 14 07451 g009
Figure 10. SEM pictures of deposits for the precursor [Cu2(iPrNH2)2(µ-O2CC2F5)4] (8), Mag = 50,000×, ((ac)—orderly with the increasing transport pathway), TV = 473 K, TD = 713 K, Si(111), Ar.
Materials 14 07451 g010
Figure 11. SEM pictures of deposits for the precursor [Cu2(iPrNH2)2(µ-O2CC3F7)4] (9), Mag = 100,000×, ((ac)—orderly with the increasing transport way), TV = 473 K, TD = 673 K, Si(111), Ar.
Materials 14 07451 g011
Figure 12. Composition analysis of the obtained materials using precursors: [Cu2(EtNH2)2(µ-O2CCF3)4] (1) (black line), [Cu2(EtNH2)2(µ-O2CC2F5)4] (2) (red line), [Cu2(iPrNH2)2(µ-O2CCF3)4] (7) (blue line), [Cu2(iPrNH2)2(µ-O2CC2F5)4] (8) (pink line), [Cu2(iPrNH2)2(µ-O2CC3F7)4] (9) (green line).
Materials 14 07451 g012
Figure 13. SEM images of [Cu2(EtNH2)2(µ-O2CC3F7)4] (3)/Si (a) before, (b) after heating Mag = 10,000× (1100 rpm, 30 s).
Materials 14 07451 g013
Figure 14. AFM images of [Cu2(EtNH2)2(µ-O2CC3F7)4] (3)/Si (a) before, (b) after heating (1100 rpm, 30 s).
Materials 14 07451 g014
Figure 15. SEM images of [Cu2(EtNH2)2(µ-O2CC2F5)4] (2)/Si after heating, Cu 5.53 wt.%, O 10.48 wt.%, (800 rpm, 10 s, 600 rpm, 10 s ×2, drying 3000 rpm, 60 s) (a) Mag = 5000× (b) Mag = 10,000×.
Materials 14 07451 g015
Figure 16. AFM images of [Cu2(EtNH2)2(µ-O2CC2F5)4] (2)/Si (a) before, (b) after heating (multistage process: 800 rpm, 10 s, 600 rpm, 10 s, 600 rpm, 10 s, drying 3000 rpm, 60 s).
Materials 14 07451 g016
Figure 17. AFM images of [Cu2(EtNH2)2(µ-O2CC3F7)4] (3)/Si immersion time 30 s, amplitude Mag = 5 µm (A); Mag = 1 µm (B), height (C) before heating, dip coating, Ra = 2.90 nm, Rq = 3.98 nm.
Materials 14 07451 g017
Figure 18. AFM images of [Cu2(EtNH2)2(µ-O2CC2F5)4] (2)/Si, Mag = 5 µm, dip coating before heating.
Materials 14 07451 g018
Figure 19. SEM images of [Cu2(EtNH2)2(µ-O2CC3F7)4]/Si (3), Mag = 200× (a), Mag = 10,000× (b), Mag = 50,000× (c), and Mag = 25,000× (d), immersion time 20 s, after heating.
Materials 14 07451 g019
Figure 20. SEM images of [Cu2(EtNH2)2(µ-O2CC3F7)4] (3)/Si after heating, (a) Mag = 10,000×, (b) Mag = 50,000×.
Materials 14 07451 g020
Figure 21. AFM images of [Cu2(EtNH2)2(µ-O2CC3F7)4] (3)/Si immersion time 20 s, Mag 5 µm (A); Mag 1 µm (B) height (C), after heating.
Materials 14 07451 g021
Figure 22. TEM data of the [Cu2(EtNH2)2(µ-O2CC3F7)4] (3)/Si after heating, (a) TEM image (top left), chemical mapping (top right) and EDX spectrum (bottom), (b) diffraction pattern d h k l = 2/5 nm = 0.4 nm.
Materials 14 07451 g022
Figure 23. SEM images of [Cu2(EtNH2)2(µ-O2CC2F5)4] (2)/Si, after heating, (a) Mag = 10,000×, (b) Mag 50,000×.
Materials 14 07451 g023
Figure 24. SEM image of [Cu2(EtNH2)2(µ-O2CC3F7)4] (3)/Si, immersion time 20 s, after heating, (a) the main, homogeneous cover, (b) the area at the bottom with the high deposit concentration
Materials 14 07451 g024
Figure 25. AFM images of [Cu2(EtNH2)2(µ-O2CC3F7)4] (3)/Si, immersion time 20 s. Mag 5 µm, after heating.
Materials 14 07451 g025
Table 1. Selected IR absorption bands (cm−1) of studied compounds (110).
CompoundνNH2 brνasCOOνNH2 scciνsCOO∆νCOO
(1) 
[Cu2(EtNH2)2(µ-O2CCF3)4]
3080167215181436236
(2) 
[Cu2(EtNH2)2(µ-O2CC2F5)4]
3080167515311413262
(3) 
[Cu2(EtNH2)2(µ-O2CC3F7)4]
3060167915281405274
(4) 
[Cu2(EtNH2)2(µ-O2CC4F9)4]
3070168115311403278
(5) 
[Cu2(EtNH2)2(µ-O2CC5F11)4]
3090167915451409270
(6) 
[Cu2(EtNH2)2(µ-O2CC6F13)4]
3070167315271404269
(7) 
[Cu2(iPrNH2)2(µ-O2CCF3)4]
3080166615201431235
(8) 
[Cu2(iPrNH2)2(µ-O2CC2F5)4]
3060167515231403272
(9) 
[Cu2(iPrNH2)2(µ-O2CC3F7)4]
3090168315221406277
(10) 
[Cu2(iPrNH2)2(µ-O2CC4F9)4]
3100168115221403278
EtNH23360-1625--
iPrNH23380-1618--
Δν(CF3COONa) = 223 cm−1, Δν(C2F5COONa) = 268 cm−1, Δν(CnF2n+1COONa; n = 3–6) = 272 cm−1; br, broad (approximate values).
Table 2. Mass spectrometry EI MS data of [Cu2(EtNH2)2(µ-O2CCF3)4] (1).
Fragmentsm/zRI[%]
305 K355 K600 K
[C2H2N]+4076-
[C2H3N]+41118-
[C2H4N]+421513-
[CO2]+443533100
[C2H7N]+./[COOH]+.4545693
[CF2]+50202011
[CF3]+699310061
[CF3CO]+97996
[Cu]+6340261
[Cu2]+∙12667-
[Cu2F]+14525242
[Cu(EtNH2)(O2CCF3)]+221113-
[Cu2(O2CCF3)]+239100986
[Cu2(EtNH2)(O2CCF3)]+28452-
[Cu2(O2CCF3)2]+∙35266614
[Cu2(O2CCF3)3]+46571-
[Cu2(EtNH2)(O2CCF3)3]+510113-
[Cu2(EtNH2)2(O2CCF3)3]+5553--
[Cu3(O2CCF3)5]+7562--
Table 3. Mass spectrometry EI MS data of [Cu2(iPrNH2)2(µ-O2CCF3)4] (7).
Fragmentsm/zRI[%]
368 K389 K548 K
[C2H2N]+401503
[C2H3N]+41-18
[C2H4N]+42116
[C3H7]+4342802
[CO2]+4410064
[C2H7N]+/[COOH]+∙45403740
[CF2]+5086752
[C3H7N]+571819-
[C3H8N]+58691-
[C3H9N]+∙5919412
[CF3]+694421
[CF3CO]+9745532
[Cu]+63-2044
[Cu(iPrNH2)]+122240-
[Cu2]+∙126-811
[Cu2F]+145-2939
[Cu(iPrNH2)(O2CCF3)]+2351282
[Cu2(O2CCF3)]+239--99
[Cu(iPrNH2)2(O2CCF3)]+294122-
[Cu2(iPrNH2)(O2CCF3)]+298114-
[Cu2(O2CCF3)2]+∙352-6345
[Cu2(O2CCF3)3]+ a)465---
[Cu2(iPrNH2)(O2CCF3)3]+524-12-
[Cu2(iPrNH2)2(O2CCF3)3]+583577-
a) The [Cu2(O2CCF3)3]+2 ion (465 m/z) was detected but not at the temperatures selected for Table 3.
Table 4. Thermal analysis data.
ComplexTemperature (K)Residue (%)
TiTmTfFoundCalc.
[Cu2(EtNH2)2(μ-O2CCF3)4] (1)41048653218.1718.99 (Cu)
[Cu2(EtNH2)2(μ-O2CC3F7)4] (3)3954665056.0311.88 (Cu)
[Cu2(EtNH2)2(μ-O2CC4F9)4] (4)3884765206.9710.01 (Cu)
[Cu2(iPrNH2)2(μ-O2CCF3)4] (7)31247452822.922.8 (CuO)
[Cu2(iPrNH2)2(μ-O2CC2F5)4] (8)3234494784.7217.7 (CuO)
[Cu2(iPrNH2)2(μ-O2CC3F7)4] (9)3084645487.214.5 (CuO)
[Cu2(iPrNH2)2(μ-O2CC4F9)4] (10)35546351014.412.2 (CuO)
Ti, initial temperature; Tm, maximum temperature; Tf, final temperature.
Table 5. Temperature ranges of occurrence of decomposition products in the gas phase for compounds (1), (2), (4), (7), and (8).
The Product
in the Gas Phase
Temperature Range [K]
(1)(2)(4)(7)(8)
[Cu2(RNH2)2(O2CRf)4]433–533463–513433–533493–533473–613
[Cu2(O2CRf)4]433–533463–513433–513433–533473–613
[Cu2(NH2)2(O2CRf)2]433–533≥463473–533 *433–533≥473
RfCOOR433–573≥463≥433≥453533–613
RfCOOH473–513≥513
CO2≥553≥413≥533≥493≥473
CO≥553533–553≥553553–613
aliphatic fluorinated compounds≥553≥533
* Very low concentration.
Table 6. Summary CVD conditions for experiments.
Vaporization Temperature TV [K]Deposition Temperature TD [K]Precursor Mass (m) [mg]Carrier GasSubstrateDeposition Time (t) [min]
[Cu2(EtNH2)2(µ-O2CCF3)4] (1)47357380ArSi(111)60
[Cu2(EtNH2)2(µ-O2CC2F5)4] (2)473713100
[Cu2(iPrNH2)2(µ-O2CCF3)4] (7)45357380
[Cu2(iPrNH2)2(µ-O2CC2F5)4] (8)473713100
[Cu2(iPrNH2)2(µ-O2CC3F7)4] (9)473673100
Table 7. The list of selected parameters of the dip-coating process for the best quality layers of [Cu2(EtNH2)2(µ-O2CC3F7)4] (3).
Set NumberCoating
Counts
Immersion Rate [mm/min]Immersion Time[s]
110805
2108020
3108030
4308010
Publisher’s Note: MDPI stays neutral with regard to jurisdictional claims in published maps and institutional affiliations.

