
Numerical and Experimental Study of Five-Layer Non-Symmetrical Paperboard Panel Stiffness

 , ,
, ,
Abstract
:1. Introduction
2. Problem Formulation
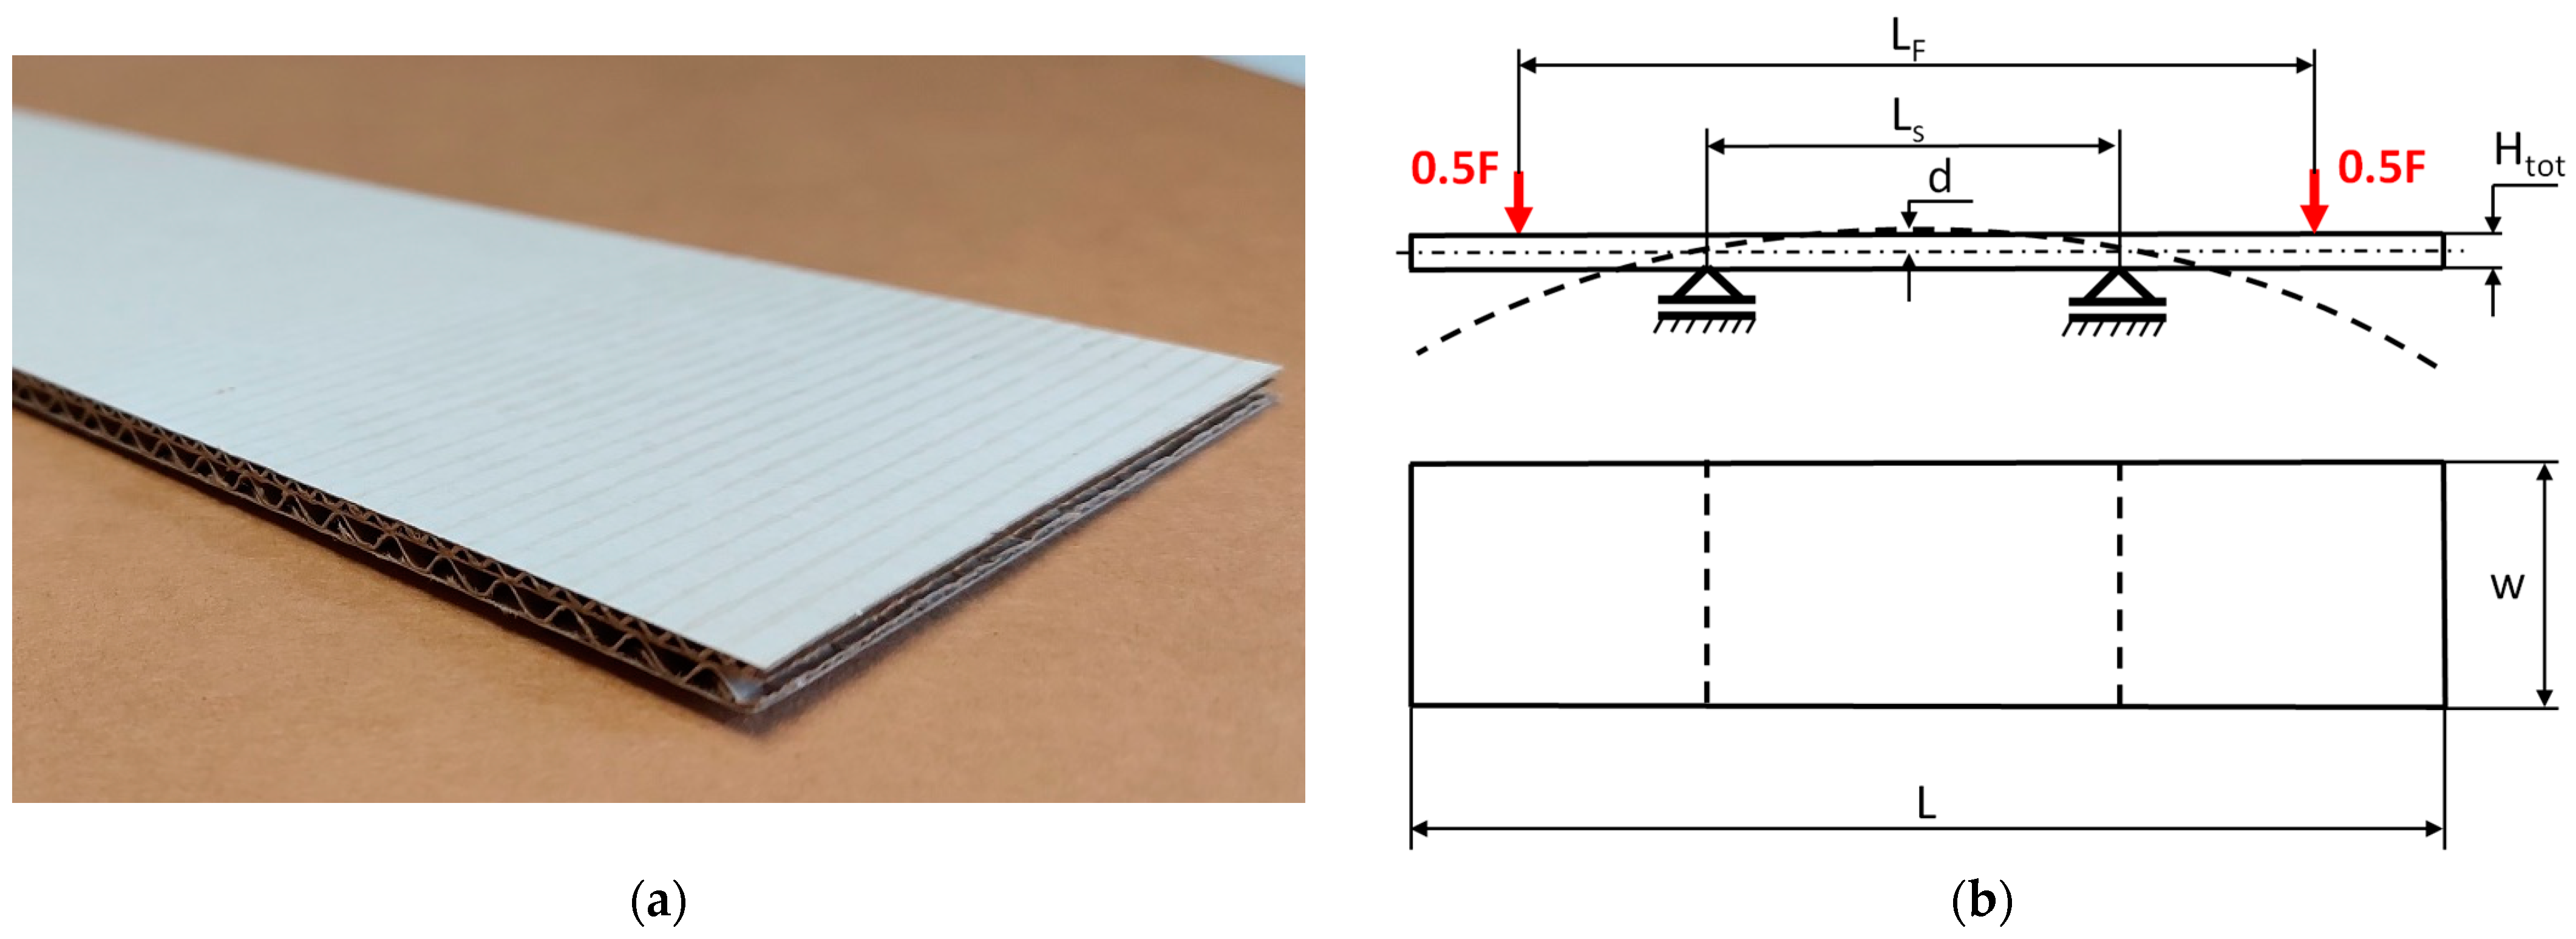
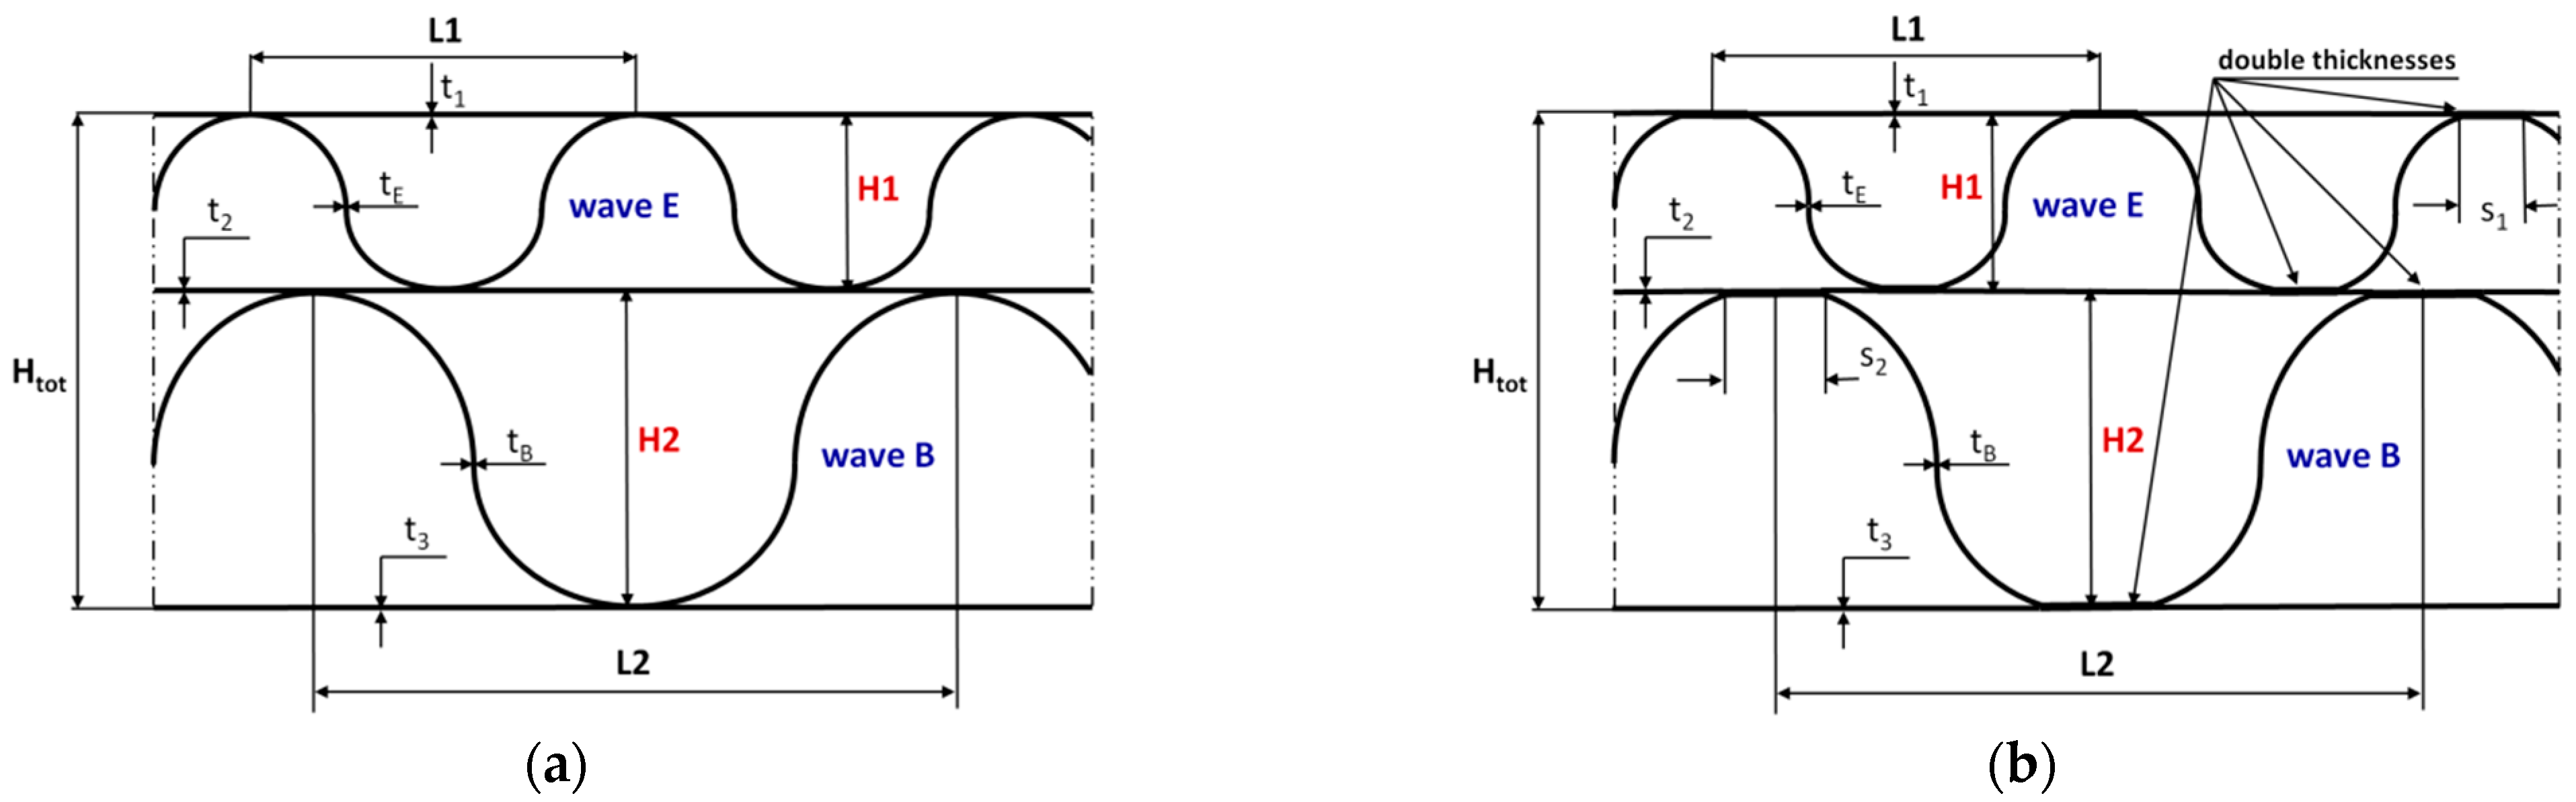
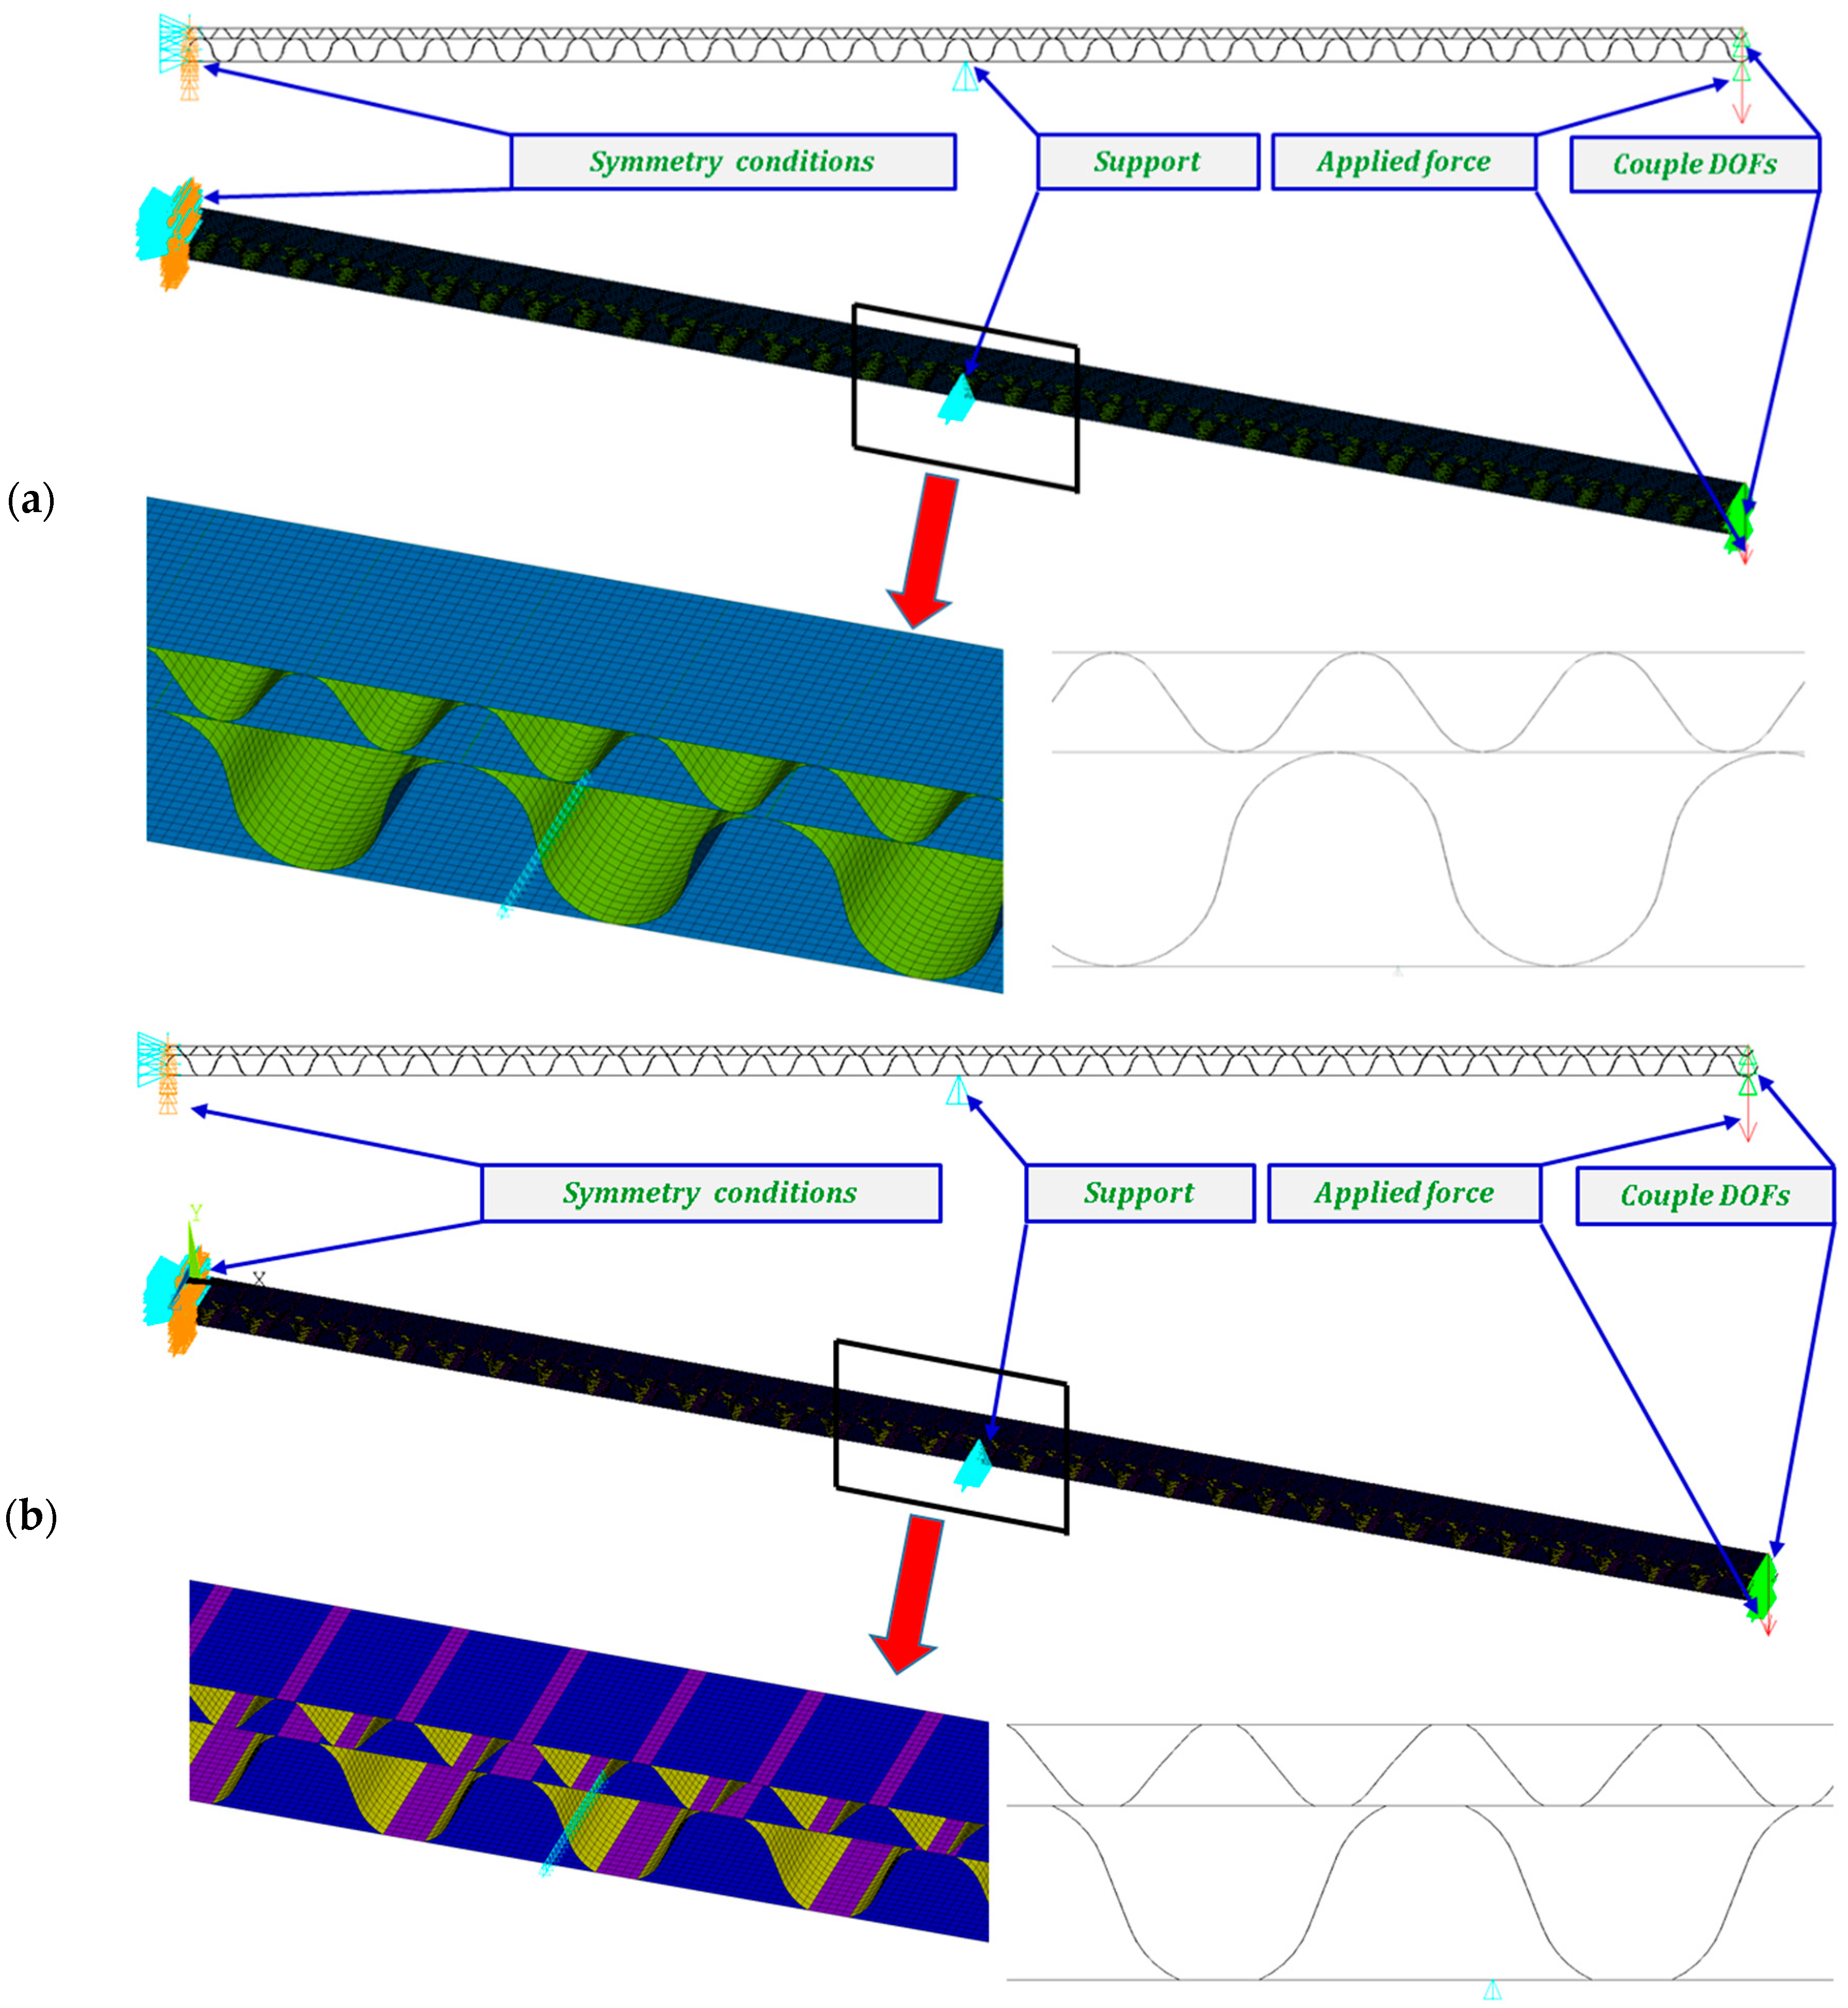
2.1. Object of Analysis
2.2. Material Properties
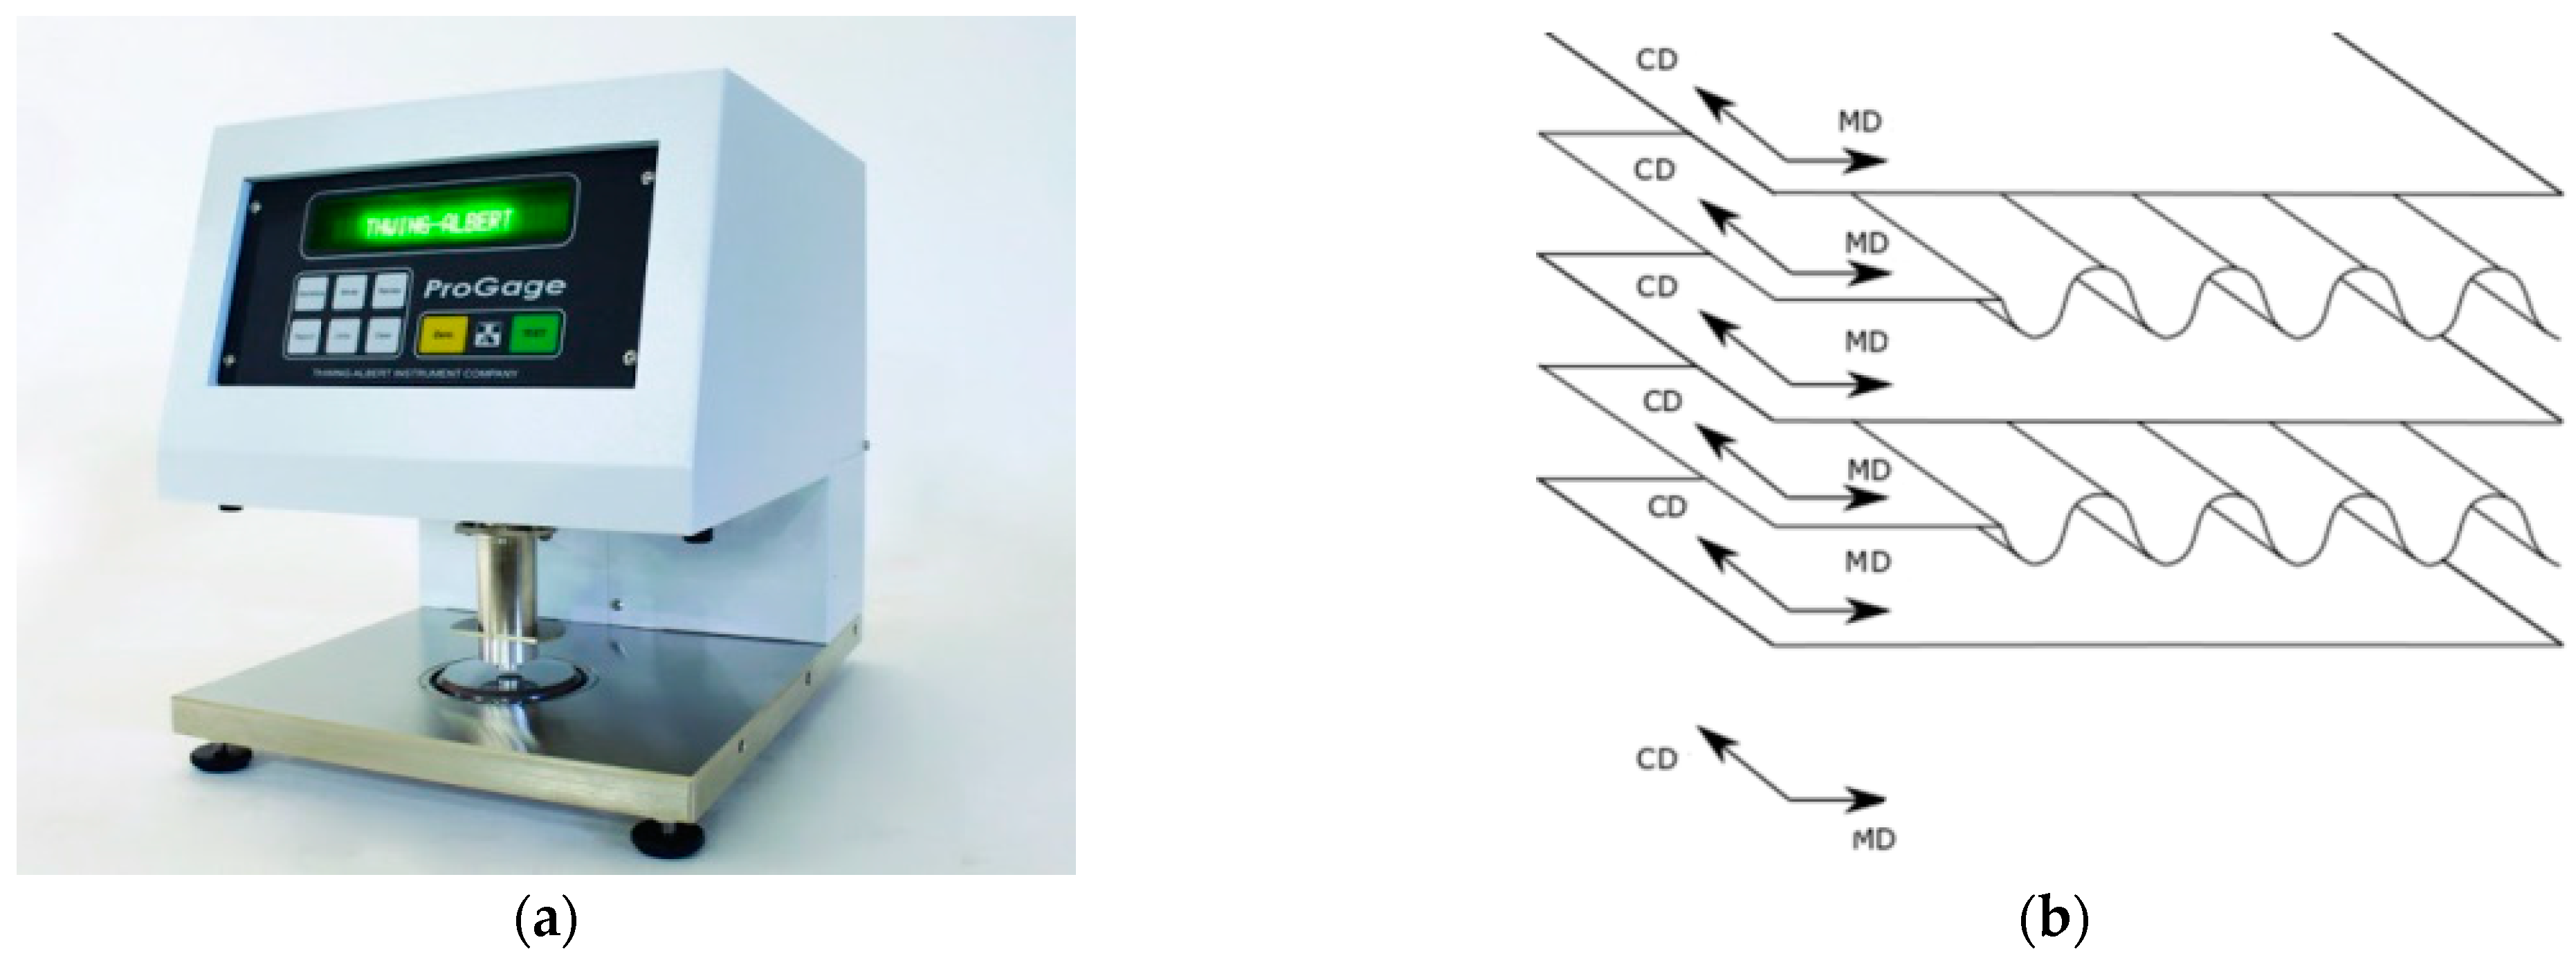
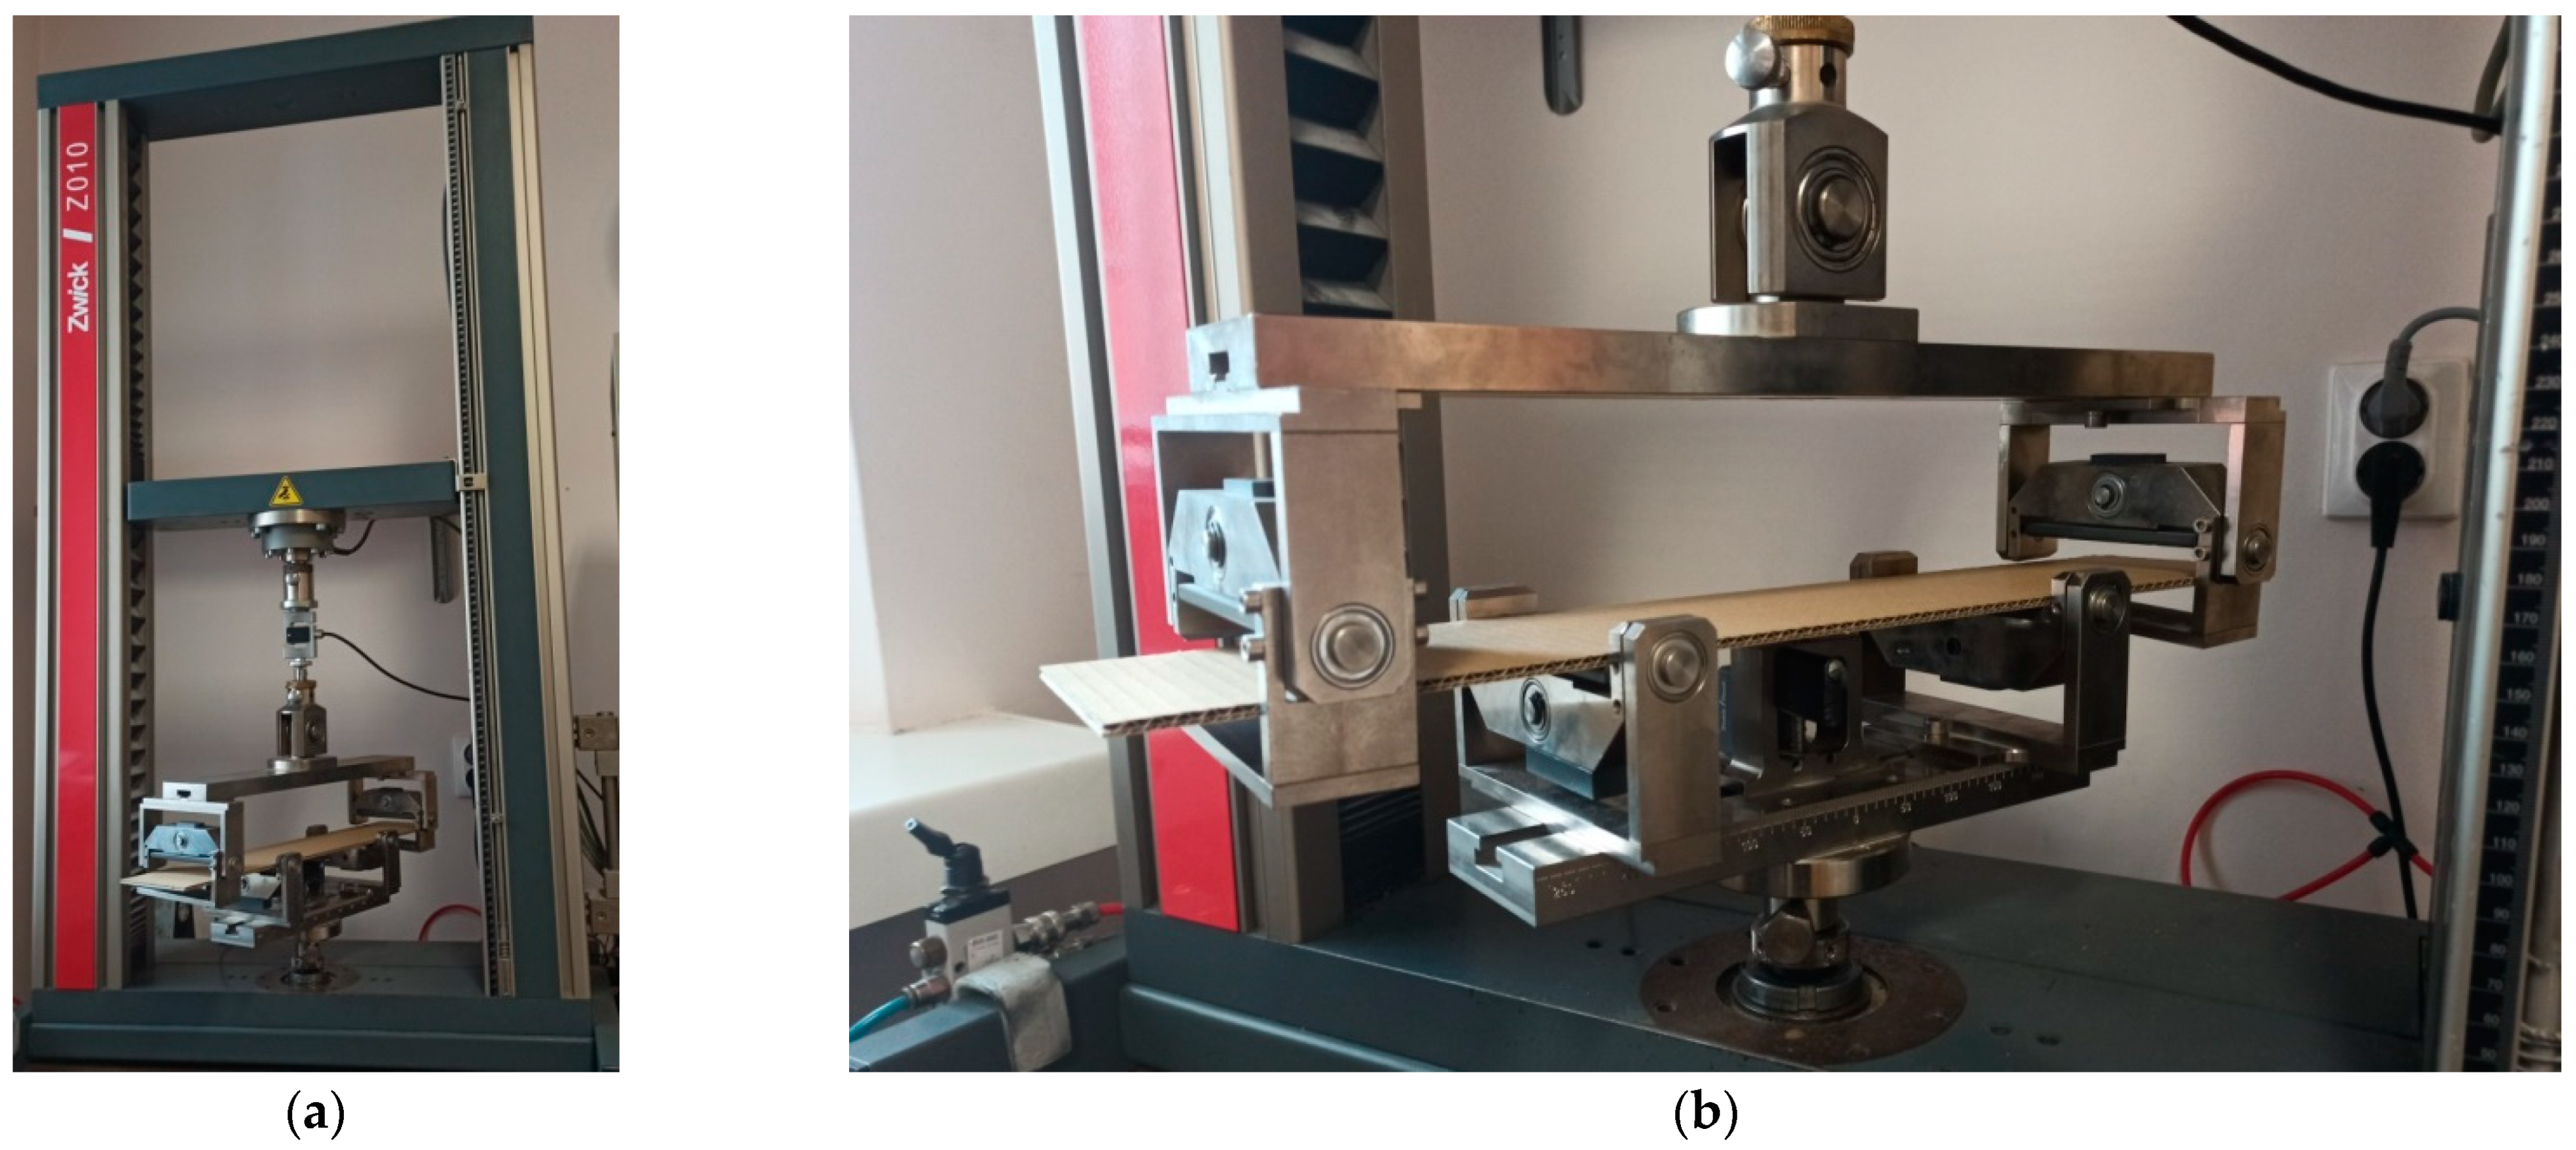
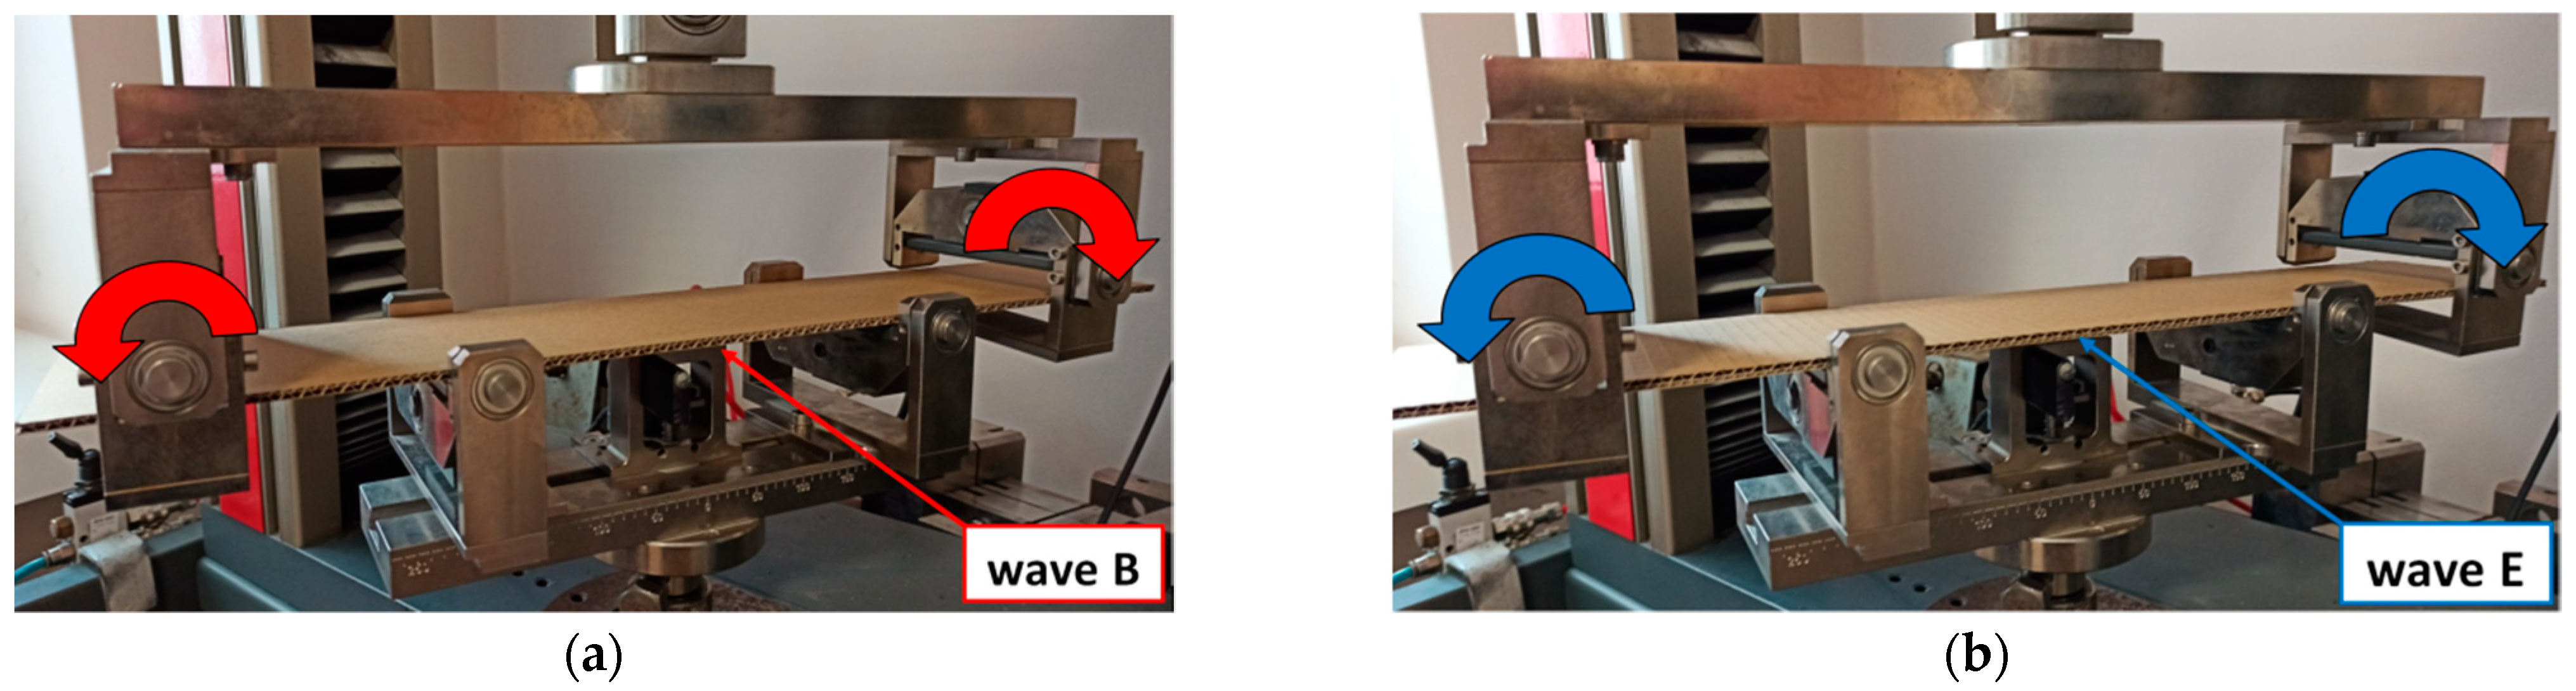
2.3. Test Stand
2.4. Bending Stiffness
2.5. FE Models
3. Results
3.1. Stiffness Analysis
3.2. Deformations Maps
3.3. Full Experimental Curves
4. Conclusions
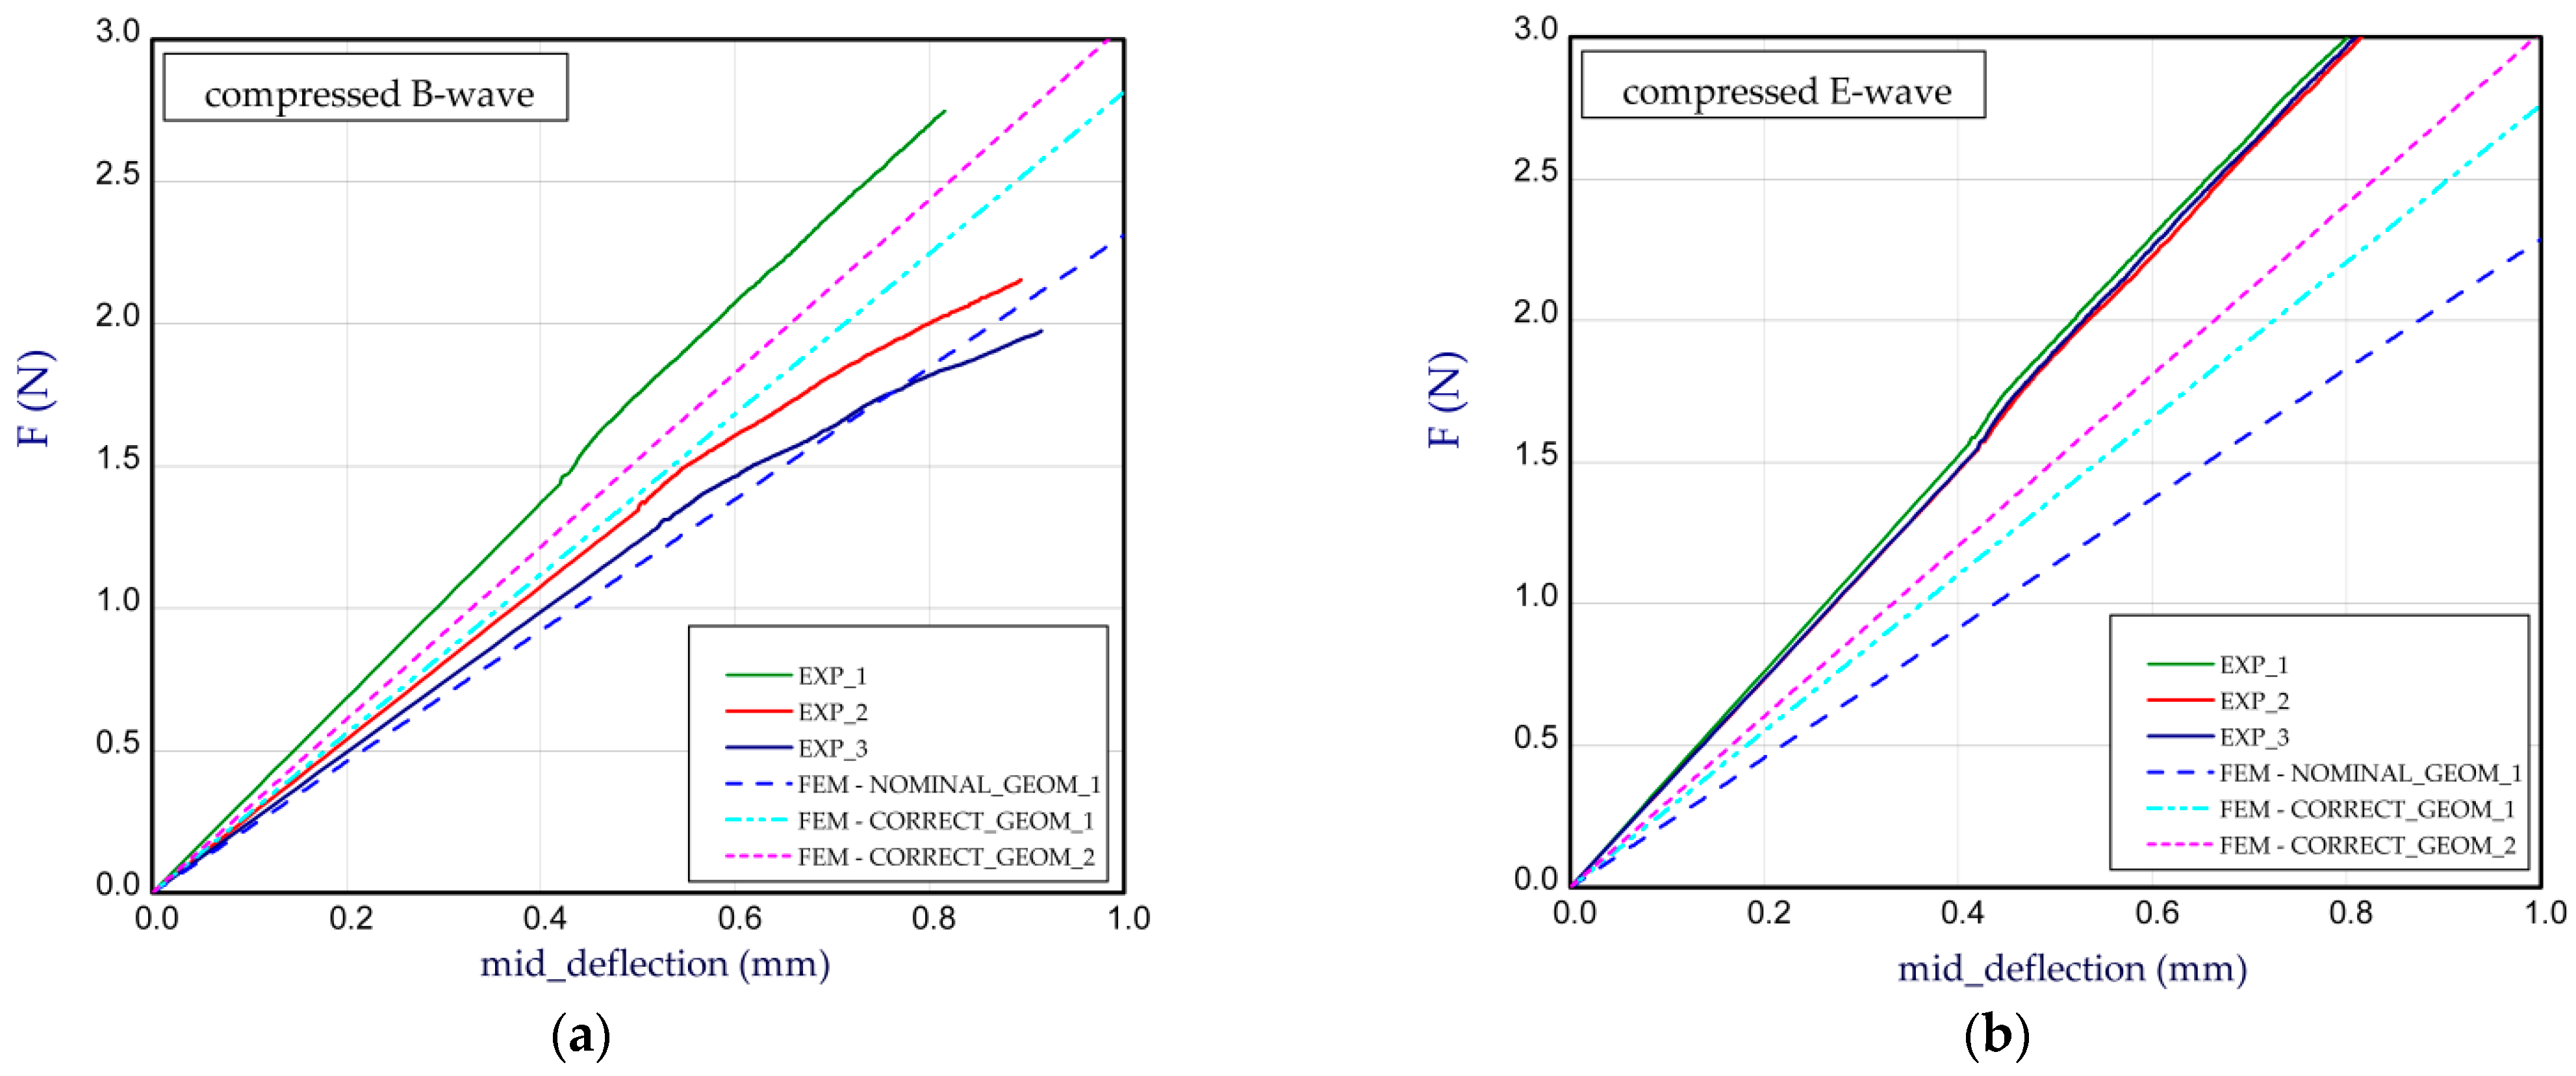
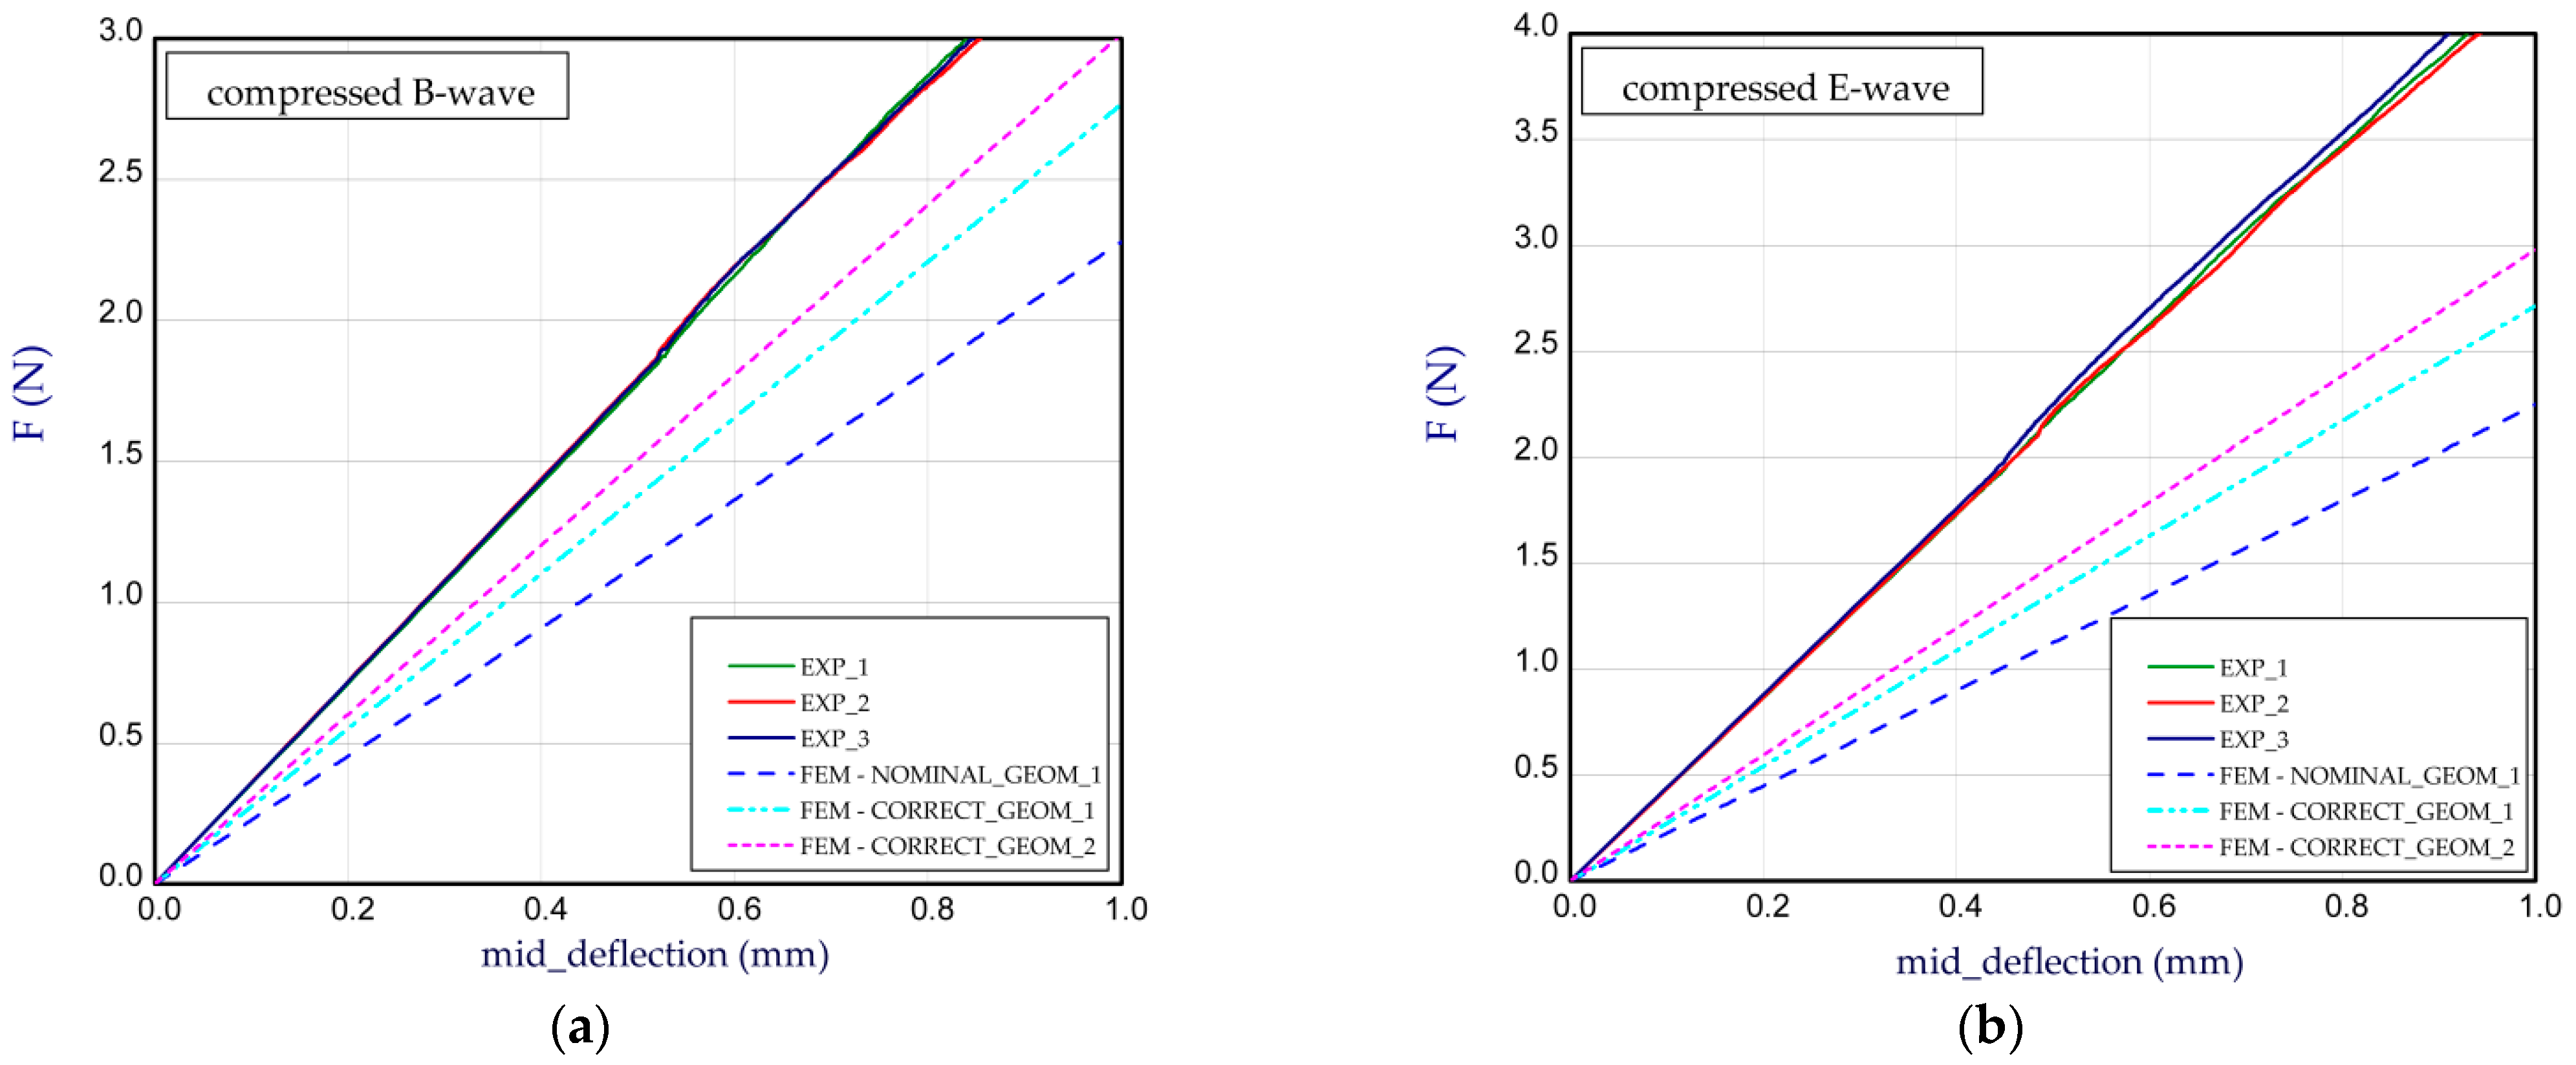
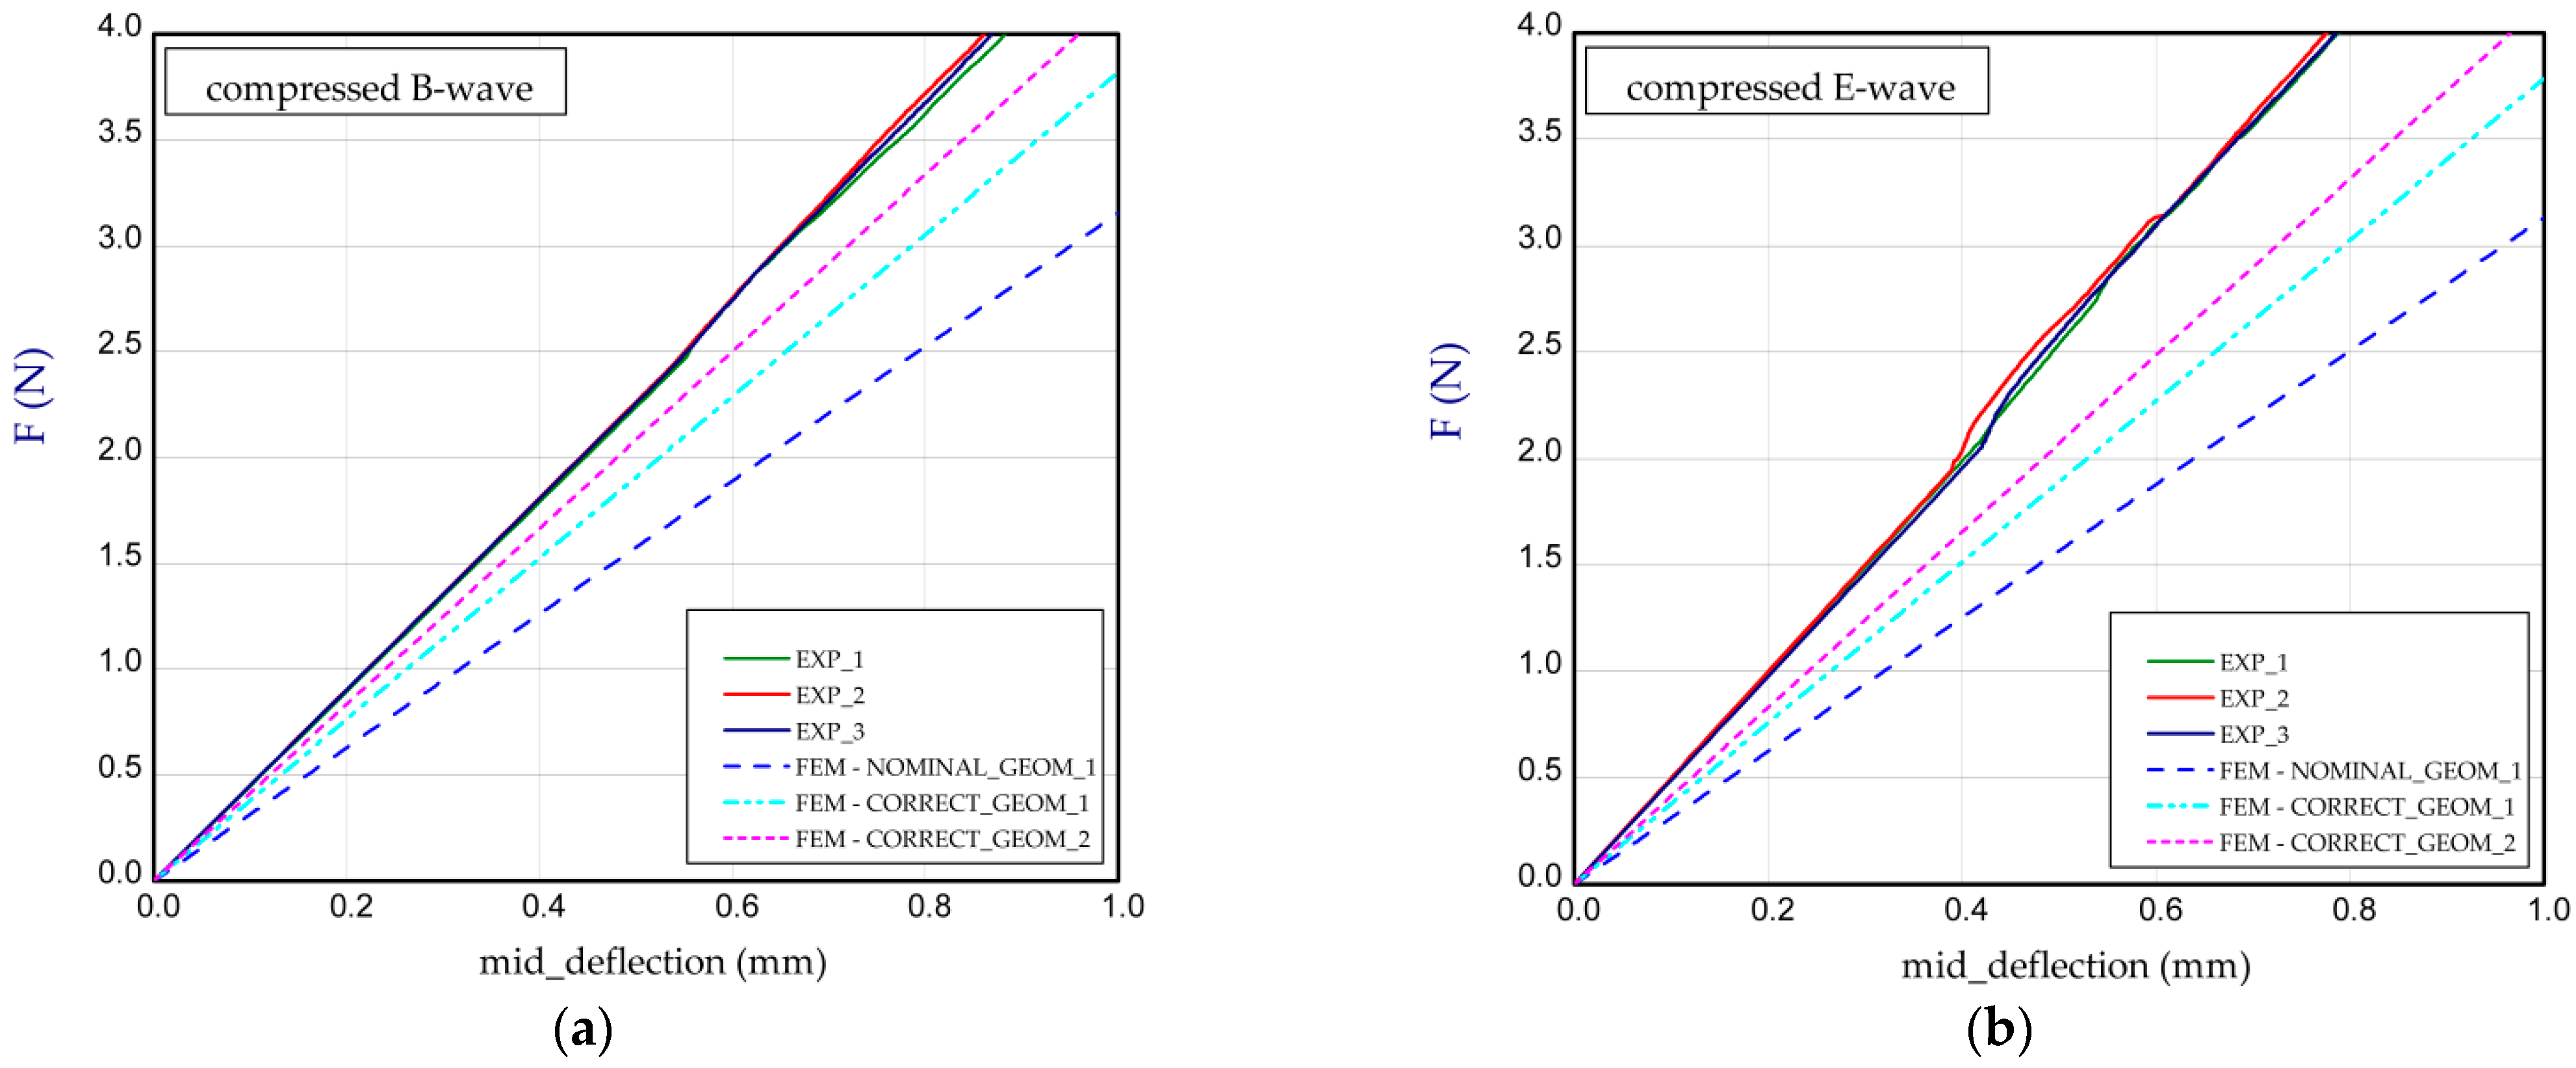
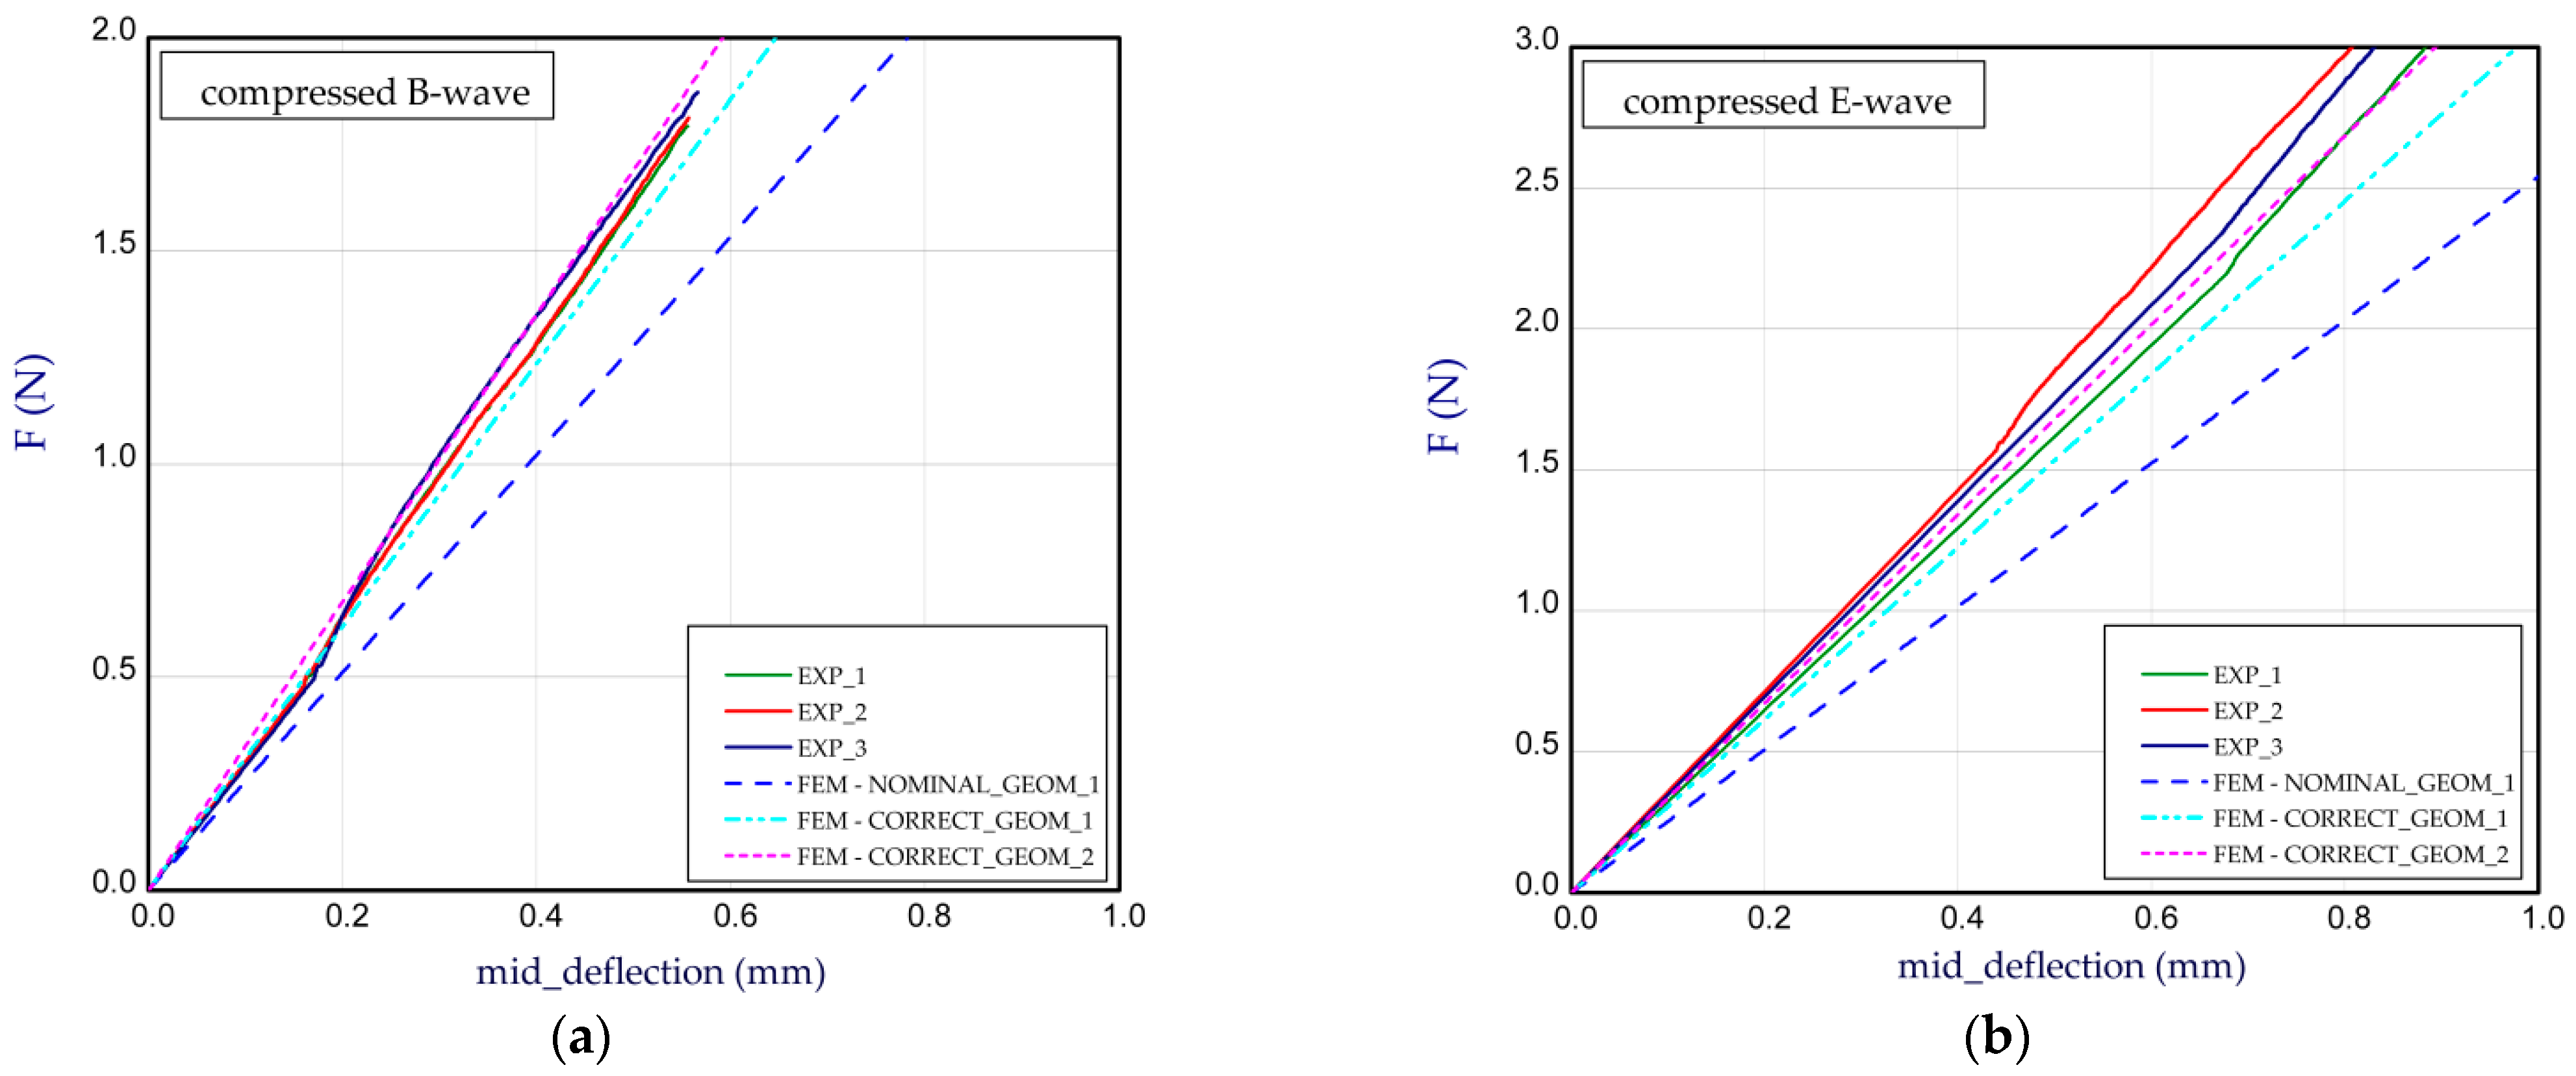
- The assumption of nominal thicknesses of the paper provides the lower stiffnesses in reference to those obtained in the experiment. Moreover, implementations of perfect structures with corrected thicknesses of paperboard also do not correlate well.
- The numerical results for perfect structures do not show the differences in BS between compressed B-wave and compressed E-wave.
- The measure results indicate a slight difference between the values of BS obtained at different signs of moments when bending paperboard in the machine direction. When an upper layer glued to the E-wave is compressed, the BS is higher in comparison to the BS of a compressed layer at the B-wave. This can be explained by a local deflection between joints (connection between waves and flat layers) that is greater if wave pitches are greater as well.
- The course of the curve seen in Figure 13 is characterized by a mild change between the initial part of chart (where compression dominates) and the field where buckling of the compressed plate occurs.
- We showed that numerically analysing of the behaviour of multilayer paperboard panels by including the aforementioned imperfections can reveal distinct differences in the BS for different signs of moment (in the case of compressed B-wave and E-wave). The lack of visible border in the results of the numerical simulation might just be caused by preliminary deflections.
- Depending on the analysed variant and arrangement of the panel, the mean values from the experiment were slightly higher than in the simulation but the discrepancies ranged from 3% up to almost 33%, at most (based on variant: CORRECT_GEOM_2). Firstly, it can be justified because in general, a realistic shape of paperboard can differ in the details from the numerical (idealized) model. Secondly, in the present simulation, the influence of the adhesive connecting all the layers of paper was not taken into account. This effect cannot be so significant, but the mentioned factors might have had an influence on the final scores.
Author Contributions
Funding
Acknowledgments
Conflicts of Interest
References
- Fadiji, T.; Coetzeea, C.J.; Berry, T.M.; Opara, U.L. Investigating the role of geometrical configurations of ventilated fresh produce packaging to improve the mechanical strength—Experimental and numerical approaches. Food Packag. Shelf Life 2019, 20, 100312. [Google Scholar] [CrossRef]
- Fadiji, T.; Ambaw, A.; Coetzee, C.J.; Berry, T.M.; Opara, U.L. Application of finite element analysis to predict the mechanical strength of ventilated corrugated paperboard packaging for handling fresh produce. Biosyst. Eng. 2018, 174, 260–281. [Google Scholar] [CrossRef]
- Fadiji, T.; Coetzee, C.J.; Oparab, U.L. Analysis of the creep behaviour of ventilated corrugated paperboard packaging for handling fresh produce—An experimental study. Food Packag. Shelf Life 2019, 117, 126–137. [Google Scholar] [CrossRef]
- Li, X.; Wang, J.; Chuang, C.; Gao, D.; Lu, G.; Lu, L.; Wang, Z. Mathematical models for predicting the quasi-static stress characteristics of corrugated paperboard with sinusoidal core along the longitudinal compression. Int. J. Mech. Sci. 2018, 149, 136–149. [Google Scholar] [CrossRef]
- Bai, J.; Wang, J.; Pan, L.; Lu, L.; Lu, G. Quasi-static axial crushing of single wall corrugated paperboard. Compos. Struct. 2019, 226, 111237. [Google Scholar] [CrossRef]
- Zaheer, M.; Awais, M.; Rautkari, L.; Sorvari, J. Finite element analysis of paperboard package under compressional load. Procedia Manuf. 2018, 17, 1162–1170. [Google Scholar] [CrossRef]
- Huang, H.; Hagman, A.; Nygards, M. Quasi static analysis of creasing and folding for three paperboards. Mech. Mater. 2014, 69, 11–34. [Google Scholar] [CrossRef] [Green Version]
- Wallmeier, M.; Linvill, E.; Hauptmann, M.; Majschak, J.P.; Östlund, S. Explicit FEM analysis of the deep drawing of paperboard. Mech. Mater. 2015, 89, 202–215. [Google Scholar] [CrossRef]
- Czechowski, L.; Bieńkowska, M.; Szewczyk, W. Paperboard tubes failure due to lateral compression—Experimental and numerical study. Compos. Struct. 2018, 203, 132–141. [Google Scholar] [CrossRef]
- Kołakowski, Z.; Szewczyk, W.; Bieńkowska, M.; Czechowski, L. New method for evaluation of radial crush strength of paper cores. Mechanika 2018, 24, 169–173. [Google Scholar] [CrossRef]
- Hua, G.J.; Luo, D.T.; Wu, R.M. Simulation analysis of corrugated board strength based on buckling criteria. Packag. J. 2010, 2, 18–20. [Google Scholar]
- Liao, Z.S.; Hua, G.J.; Xie, Y.; Shao, Z. Finite element analysis on transverse compressive strength of corrugated board Edge. Packag. Eng. 2014, 35, 56–60. [Google Scholar]
- Abbès, B.; Guo, Y.Q. Analytic homogenization for torsion of orthotropic sandwich plates: Application to corrugated cardboard. Compos. Struct. 2010, 92, 699–706. [Google Scholar] [CrossRef]
- Beldie, L.; Sandberg, G.; Sandberg, L. Paperboard packages exposed to static loads-finite element modelling and experiments. Packag. Technol. Sci. 2001, 14, 171–178. [Google Scholar] [CrossRef]
- Talbi, N.; Batti, A.; Ayad, R.; Guo, Y.Q. An analytical homogenization model for finite element modelling of corrugated cardboard. Compos. Struct. 2009, 88, 280–289. [Google Scholar] [CrossRef]
- Hua, G.J.; Shen, Y.; Zhao, D.; Xie, Y. Experimental and Numerical Analysis of the Edge Effect for Corrugated and Honeycomb Fiberboard. Strength Mater. 2017, 49, 188–197. [Google Scholar] [CrossRef]
- Wang, Z.W.; Yao, Z. Experimental investigation and finite element analysis for impact compression of honeycomb paperboards. J. Mech. Eng. 2012, 48, 49–55. [Google Scholar] [CrossRef]
- Hua, G.J.; Xie, Y. Finite element analysis of honeycomb and corrugated fiberboard side compression strength. Packag. Eng. 2009, 30, 1–2. [Google Scholar]
- Gao, S.; Wang, B.Z. Finite element analysis of double deck honeycomb board based on ANSYS. Mech. Eng. Autom. 2012, 14, 69–71. [Google Scholar]
- Hernández-Pérez, A.; Hägglund, R.; Carlsson, L.A.; Avilés, F. Analysis of twist stiffness of single and double-wall corrugated boards. Compos. Struct. 2014, 110, 7–15. [Google Scholar] [CrossRef]
- Hämäläine, P.; Hallbäck, N.; Gäärd, A.; Lestelius, M. On the determination of transverse shear properties of paper using the short span compression test. Mech. Mater. 2017, 107, 22–30. [Google Scholar] [CrossRef]
- Bolzon, G.; Talassi, M. A combined experimental and numerical study of the behaviour of paperboard composites up to failure. Compos. Part B 2014, 66, 358–367. [Google Scholar] [CrossRef]
- Mentrasti, L.; Cannella, F.; Pupilli, M.; Dai, J.S. Large bending behavior of creases paperboard. I. Experimental investigations. Int. J. Solid Struct. 2013, 50, 3089–3096. [Google Scholar] [CrossRef] [Green Version]
- Mentrasti, L.; Cannella, F.; Pupilli, M.; Dai, J.S. Large bending behavior of creases paperboard. II. Experimental investigations. Int. J. Solid Struct. 2013, 50, 3097–3105. [Google Scholar] [CrossRef] [Green Version]
- Czechowski, L.; Śmiechowicz, W.; Kmita-Fudalej, G.; Szewczyk, W. Flexural Damage of Honeycomb Paperboard—A Numerical and Experimental Study. Materials 2020, 13, 2601. [Google Scholar] [CrossRef]
- Muc, A.; Barski, M. Design of Particulate-Reinforced Composite Materials. Materials 2018, 11, 234. [Google Scholar] [CrossRef] [PubMed] [Green Version]
- Tornabene, F.; Fantuzzi, N.; Bacciocchi, M. Linear Static Behavior of Damaged Laminated Composite Plates and Shell. Materals 2017, 10, 811. [Google Scholar] [CrossRef] [PubMed] [Green Version]
- Zaczynska, M.; Kołakowski, Z. The influence of the internal forces of the buckling modes on the load-carrying capacity of composite medium-length beams under bending. Materials 2020, 13, 455. [Google Scholar] [CrossRef] [PubMed] [Green Version]
- Koławski, Z.; Mania, J.R. Semi-analytical method versus the FEM for analysis of the local post-buckling. Compos. Struct. 2013, 97, 99–106. [Google Scholar] [CrossRef]
- Kopecki, T.; Mazurek, P.; Lis, T. Experimental and Numerical Analysis of a Composite Thin-Walled Cylindrical Structures with Different Variants of Stiffeners, Subjected to Torsion. Materials 2019, 12, 3230. [Google Scholar] [CrossRef] [Green Version]
- Zhang, G.; Mao, C.; Wang, J.; Fan, N.; Guo, T. Numerical Analysis and Experimental Studies on the Residual Stress of W/2024Al Composites. Materials 2019, 12, 2746. [Google Scholar] [CrossRef] [PubMed] [Green Version]
- Urbaniak, M.; Teter, A.; Kubiak, T. Influence of boundary conditions on the critical and failure load in the GFPR channel cross-section columns subjected to compression. Compos. Struct. 2015, 134, 199–208. [Google Scholar] [CrossRef]
- Kubiak, T.; Kolakowski, Z.; Swiniarski, J.; Urbaniak, M.; Gliszczynski, A. Local buckling and post-buckling of composite channel-section beams—Numerical and experimental investigations. Compos. Part B 2016, 91, 176–188. [Google Scholar] [CrossRef]
- Zhou, F.; Zhang, J.; Song, S.; Yang, D.; Wang, C. Effect of Temperature on Material Properties of Carbon Fiber Reinforced Polymer (CFRP) Tendons: Experiments and Model Assessment. Materials 2019, 12, 1025. [Google Scholar] [CrossRef] [PubMed] [Green Version]
- Kubiak, T.; Borkowski, Ł.; Wiacek, N. Experimental Investigations of Impact Damage Influence on Behavior of Thin-Walled Composite Beam Subjected to Pure Bending. Materials 2019, 12, 1127. [Google Scholar] [CrossRef] [PubMed] [Green Version]
- Zhu, X.; Xiong, C.; Yin, J.; Yin, D.; Deng, H. Bending Experiment and Mechanical Properties Analysis of Composite Sandwich Laminated Box Beams. Materials 2019, 12, 2959. [Google Scholar] [CrossRef] [PubMed] [Green Version]
- Khaneghahi, M.H.; Najafabadi, E.P.; Bazli, M.; Oskouei, A.V.; Zhao, X.L. The effect of elevated temperatures on the compressive section capacity of pultruded GFRP profiles. Constr. Build. Mater. 2020, 249, 118725. [Google Scholar] [CrossRef]
- Chen, J.F.; Morozov, E.V.; Shankar, K. A combined elastoplastic damage model for progressive failure analysis of composite materials and structures. Compos. Struct. 2012, 94, 3478–3489. [Google Scholar] [CrossRef]
- Gliszczyński, A.; Kubiak, T. Progressive failure analysis of thin-walled composite columns subjected to uniaxial compression. Compos. Struct. 2017, 169, 52–61. [Google Scholar] [CrossRef]
- Lapczyk, I.; Hurtado, J.A. Progressive damage modeling in fiber-reinforced materials. Compos. Part A Appl. Sci. 2007, 38, 2333–2341. [Google Scholar] [CrossRef]
- Minh, D.P.T. Modeling and Numerical Simulation for the Double Corrugated Cardboard under Transverse Loading by Homogenization Method. Int. J. Eng. Sci. 2017, 6, 16–25. [Google Scholar]
- Gajewski, T.; Garbowski, T.; Staszak, N.; Kuca, M. Crushing of double-walled corrugated board and its influence on the load capacity of various boxes. Energies 2021, 14, 4321. [Google Scholar] [CrossRef]
- Han, X.; Akhmet, G.; Hu, P.; Hou, W.; Baubekov, Y.; Akhmetov, M. Numerical prediction on the mechanical degradation of adhesively bonded corrugated sandwich beam after hygrothermal ageing. Compos. Struct. 2020, 241, 112131. [Google Scholar] [CrossRef]
- PN-EN 20187:2000: Paper, board and pulps—Standard atmosphere for conditioning and testing and procedure for monitoring the atmosphere and conditioning of samples. Released 24 February 2000.
- User’s Guide ANSYS 18.2; Ansys®, Inc.: Houston, TX, USA, 2017.


| Model Number | Layer Number | Thickness (mm) | EMD (GPa) | ECD (GPa) | nMD (-) | nCD (-) | GMD-CD (GPa) |
|---|---|---|---|---|---|---|---|
| Model_1 | 1-flat (t1) | 0.142 | 5.70 | 2.24 | 0.118 | 0.3 | 2.06 |
| E-wave (tE) | 0.164 | 5.73 | 1.56 | 0.082 | 0.3 | 1.73 | |
| 3-flat (t2) | 0.126 | 6.46 | 1.97 | 0.091 | 0.3 | 2.06 | |
| B-wave (tB) | 0.164 | 5.73 | 1.56 | 0.082 | 0.3 | 1.73 | |
| 5-flat (t3) | 0.146 | 5.65 | 2.47 | 0.131 | 0.3 | 2.16 | |
| Model_2 | 1-flat (t1) | 0.185 | 6.69 | 2.50 | 0.112 | 0.3 | 2.36 |
| E-wave (tE) | 0.227 | 5.49 | 1.87 | 0.102 | 0.3 | 1.85 | |
| 3-flat (t2) | 0.177 | 5.20 | 1.80 | 0.104 | 0.3 | 1.77 | |
| B-wave (tB) | 0.199 | 6.64 | 1.95 | 0.088 | 0.3 | 2.08 | |
| 5-flat (t3) | 0.186 | 5.52 | 1.86 | 0.101 | 0.3 | 1.85 | |
| Model_3 | 1-flat (t1) | 0.142 | 5.7 | 2.24 | 0.118 | 0.3 | 2.06 |
| E-wave (tE) | 0.199 | 6.64 | 1.95 | 0.088 | 0.3 | 2.08 | |
| 3-flat (t2) | 0.126 | 6.46 | 1.97 | 0.091 | 0.3 | 2.06 | |
| B-wave (tB) | 0.139 | 5.72 | 2.13 | 0.112 | 0.3 | 2.02 | |
| 5-flat (t3) | 0.146 | 5.65 | 2.47 | 0.131 | 0.3 | 2.16 | |
| Model_4 | 1-flat (t1) | 0.142 | 5.70 | 2.24 | 0.118 | 0.3 | 2.06 |
| E-wave (tE) | 0.177 | 5.20 | 1.80 | 0.104 | 0.3 | 1.77 | |
| 3-flat (t2) | 0.139 | 5.72 | 2.13 | 0.112 | 0.3 | 2.02 | |
| B-wave (tB) | 0.177 | 5.20 | 1.80 | 0.104 | 0.3 | 1.77 | |
| 5-flat (t3) | 0.146 | 5.65 | 2.47 | 0.131 | 0.3 | 2.16 | |
| Model_5 | 1-flat (t1) | 0.185 | 6.69 | 2.50 | 0.112 | 0.3 | 2.36 |
| E-wave (tE) | 0.199 | 6.64 | 1.95 | 0.088 | 0.3 | 2.08 | |
| 3-flat (t2) | 0.177 | 5.20 | 1.80 | 0.104 | 0.3 | 1.77 | |
| B-wave (tB) | 0.199 | 6.64 | 1.95 | 0.088 | 0.3 | 2.08 | |
| 5-flat (t3) | 0.186 | 5.52 | 1.86 | 0.101 | 0.3 | 1.85 | |
| Model_6 | 1-flat (t1) | 0.142 | 5.70 | 2.24 | 0.118 | 0.3 | 2.06 |
| E-wave (tE) | 0.177 | 5.20 | 1.80 | 0.104 | 0.3 | 1.77 | |
| 3-flat (t2) | 0.164 | 5.73 | 1.56 | 0.082 | 0.3 | 1.73 | |
| B-wave (tB) | 0.177 | 5.20 | 1.80 | 0.104 | 0.3 | 1.77 | |
| 5-flat (t3) | 0.186 | 5.52 | 1.86 | 0.101 | 0.3 | 1.85 |
| Variant | EXP | FEM_1 NOMINAL_GEOM_1 (Nm) | FEM_1 CORRECT_GEOM_1 (Nm) | FEM_2 CORRECT_GEOM_2 (Nm) | FEM_1 NOMINAL Decrease (+)/ Increase (−) with Respect Mean Value (%) | FEM_1 CORRECT Decrease (+)/ Increase (−) with Respect Mean Value (%) | FEM_2 CORRECT Decrease (+)/ Increase (−) with Respect Mean Value (%) | |||
|---|---|---|---|---|---|---|---|---|---|---|
| 1 (Nm) | 2 (Nm) | 3 (Nm) | Mean Value (Nm) | |||||||
| Model_1_B | 8.50 | 8.20 | 8.25 | 8.32 | 5.80 | 6.98 | 7.62 | 30.29 | 16.11 | 8.41 |
| Model_1_E | 8.43 | 8.48 | 8.50 | 8.47 | 5.70 | 6.89 | 7.58 | 32.70 | 18.65 | 10.51 |
| Model_2_B | 11.10 | 11.00 | 10.80 | 10.97 | 7.47 | 9.04 | 9.88 | 31.91 | 17.59 | 9.94 |
| Model_2_E | 11.45 | 11.50 | 11.80 | 11.58 | 7.43 | 8.96 | 9.81 | 35.84 | 22.63 | 15.28 |
| Model_3_B | 8.67 | 6.96 | 6.13 | 7.25 | 5.76 | 7.01 | 7.61 | 20.55 | 3.31 | −4.97 |
| Model_3_E | 9.65 | 9.40 | 9.45 | 9.50 | 5.72 | 6.89 | 7.53 | 39.79 | 27.47 | 20.74 |
| Model_4_B | 9.01 | 9.17 | 9.13 | 9.10 | 5.68 | 6.88 | 7.53 | 37.58 | 24.40 | 17.25 |
| Model_4_E | 10.95 | 11.10 | 11.25 | 11.10 | 5.63 | 6.80 | 7.45 | 49.28 | 38.74 | 32.88 |
| Model_5_B | 11.47 | 11.51 | 11.43 | 11.46 | 7.88 | 9.52 | 10.42 | 31.24 | 16.93 | 9.08 |
| Model_5_E | 12.70 | 13.25 | 12.95 | 12.97 | 7.83 | 9.46 | 10.37 | 39.63 | 27.06 | 20.05 |
| Model_6_B | 8.20 | 8.10 | 8.30 | 8.20 | 6.39 | 7.73 | 8.45 | 22.07 | 5.73 | −3.05 |
| Model_6_E | 9.25 | 9.00 | 9.10 | 9.12 | 6.35 | 7.67 | 8.40 | 30.37 | 15.90 | 7.89 |
| Force F (N) | FEM_1 CORRECT_GEOM_1 | FEM_2 CORRECT_GEOM_2 |
|---|---|---|
| 1 | 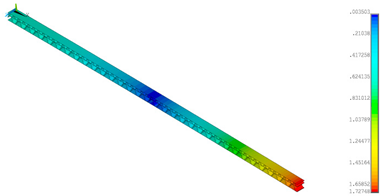 |  |
| 2 | 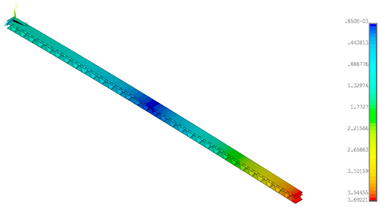 |  |
| 4 | 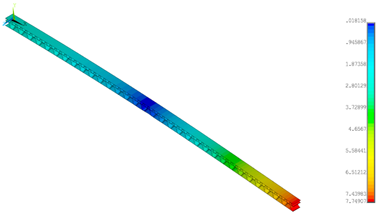 |  |
| 8 | 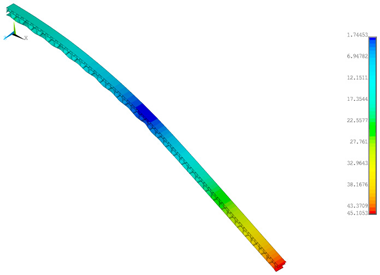 |  |
| Force F (N) | FEM_1 CORRECT_GEOM_1 | FEM_2 CORRECT_GEOM_2 |
|---|---|---|
| 1 |  | 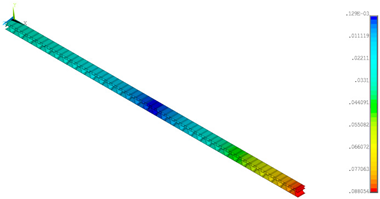 |
| 2 |  | 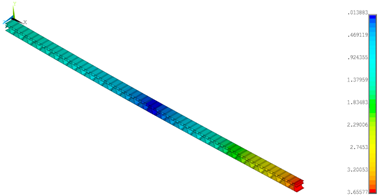 |
| 4 | 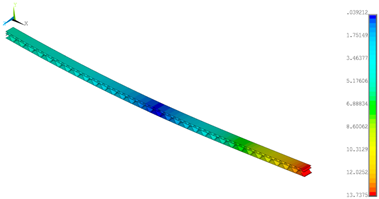 | 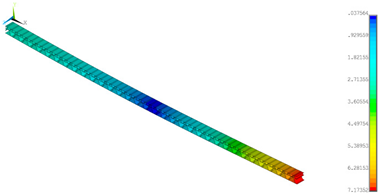 |
| 8 | 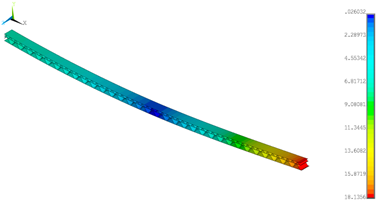 | 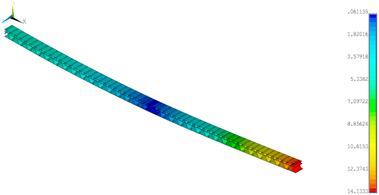 |
| Point/ Force (N) | View | Magnified View of Bent Paperboard |
|---|---|---|
| B1 (2) | 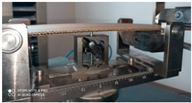 | 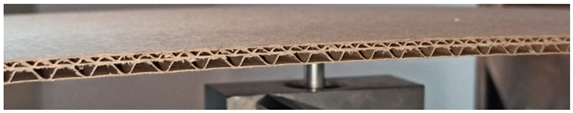 |
| B2 (3) | 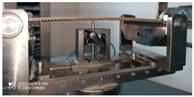 |  |
| B3 (5) | 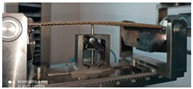 | 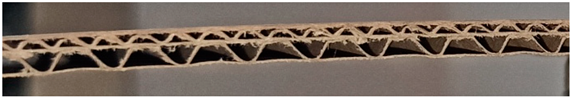 |
| B4 (6) | 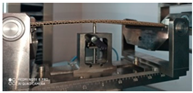 |  |
| B5 (7) |  | 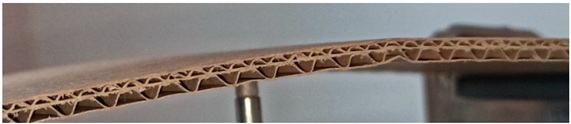 |
| Point/ Force (N) | View | Magnified View of Paperboard |
|---|---|---|
| E1 (2) | 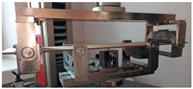 |  |
| E2 (3) |  | 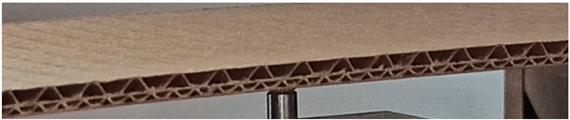 |
| E3 (5) | 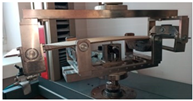 | 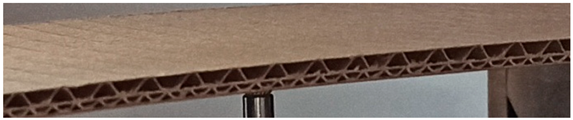 |
| E4 (6) | 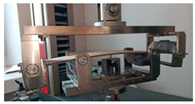 |  |
| E5 (10) | 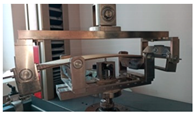 |  |
| E6 (16.5) | 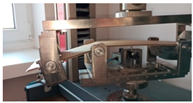 | 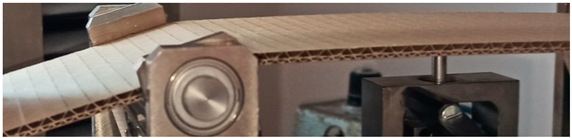 |
Publisher’s Note: MDPI stays neutral with regard to jurisdictional claims in published maps and institutional affiliations. |
© 2021 by the authors. Licensee MDPI, Basel, Switzerland. This article is an open access article distributed under the terms and conditions of the Creative Commons Attribution (CC BY) license (https://creativecommons.org/licenses/by/4.0/).
Share and Cite
Czechowski, L.; Kmita-Fudalej, G.; Szewczyk, W.; Gralewski, J.; Bienkowska, M. Numerical and Experimental Study of Five-Layer Non-Symmetrical Paperboard Panel Stiffness. Materials 2021, 14, 7453. https://doi.org/10.3390/ma14237453
Czechowski L, Kmita-Fudalej G, Szewczyk W, Gralewski J, Bienkowska M. Numerical and Experimental Study of Five-Layer Non-Symmetrical Paperboard Panel Stiffness. Materials. 2021; 14(23):7453. https://doi.org/10.3390/ma14237453
Chicago/Turabian StyleCzechowski, Leszek, Gabriela Kmita-Fudalej, Włodzimierz Szewczyk, Jacek Gralewski, and Maria Bienkowska. 2021. "Numerical and Experimental Study of Five-Layer Non-Symmetrical Paperboard Panel Stiffness" Materials 14, no. 23: 7453. https://doi.org/10.3390/ma14237453