
Effects of Fillet Weld Size and Sleeve Material Strength on the Residual Stress Distribution and Structural Safety While Implementing the New Sleeve Repair Process


Abstract
:1. Introduction
2. Materials and Experimental Procedure
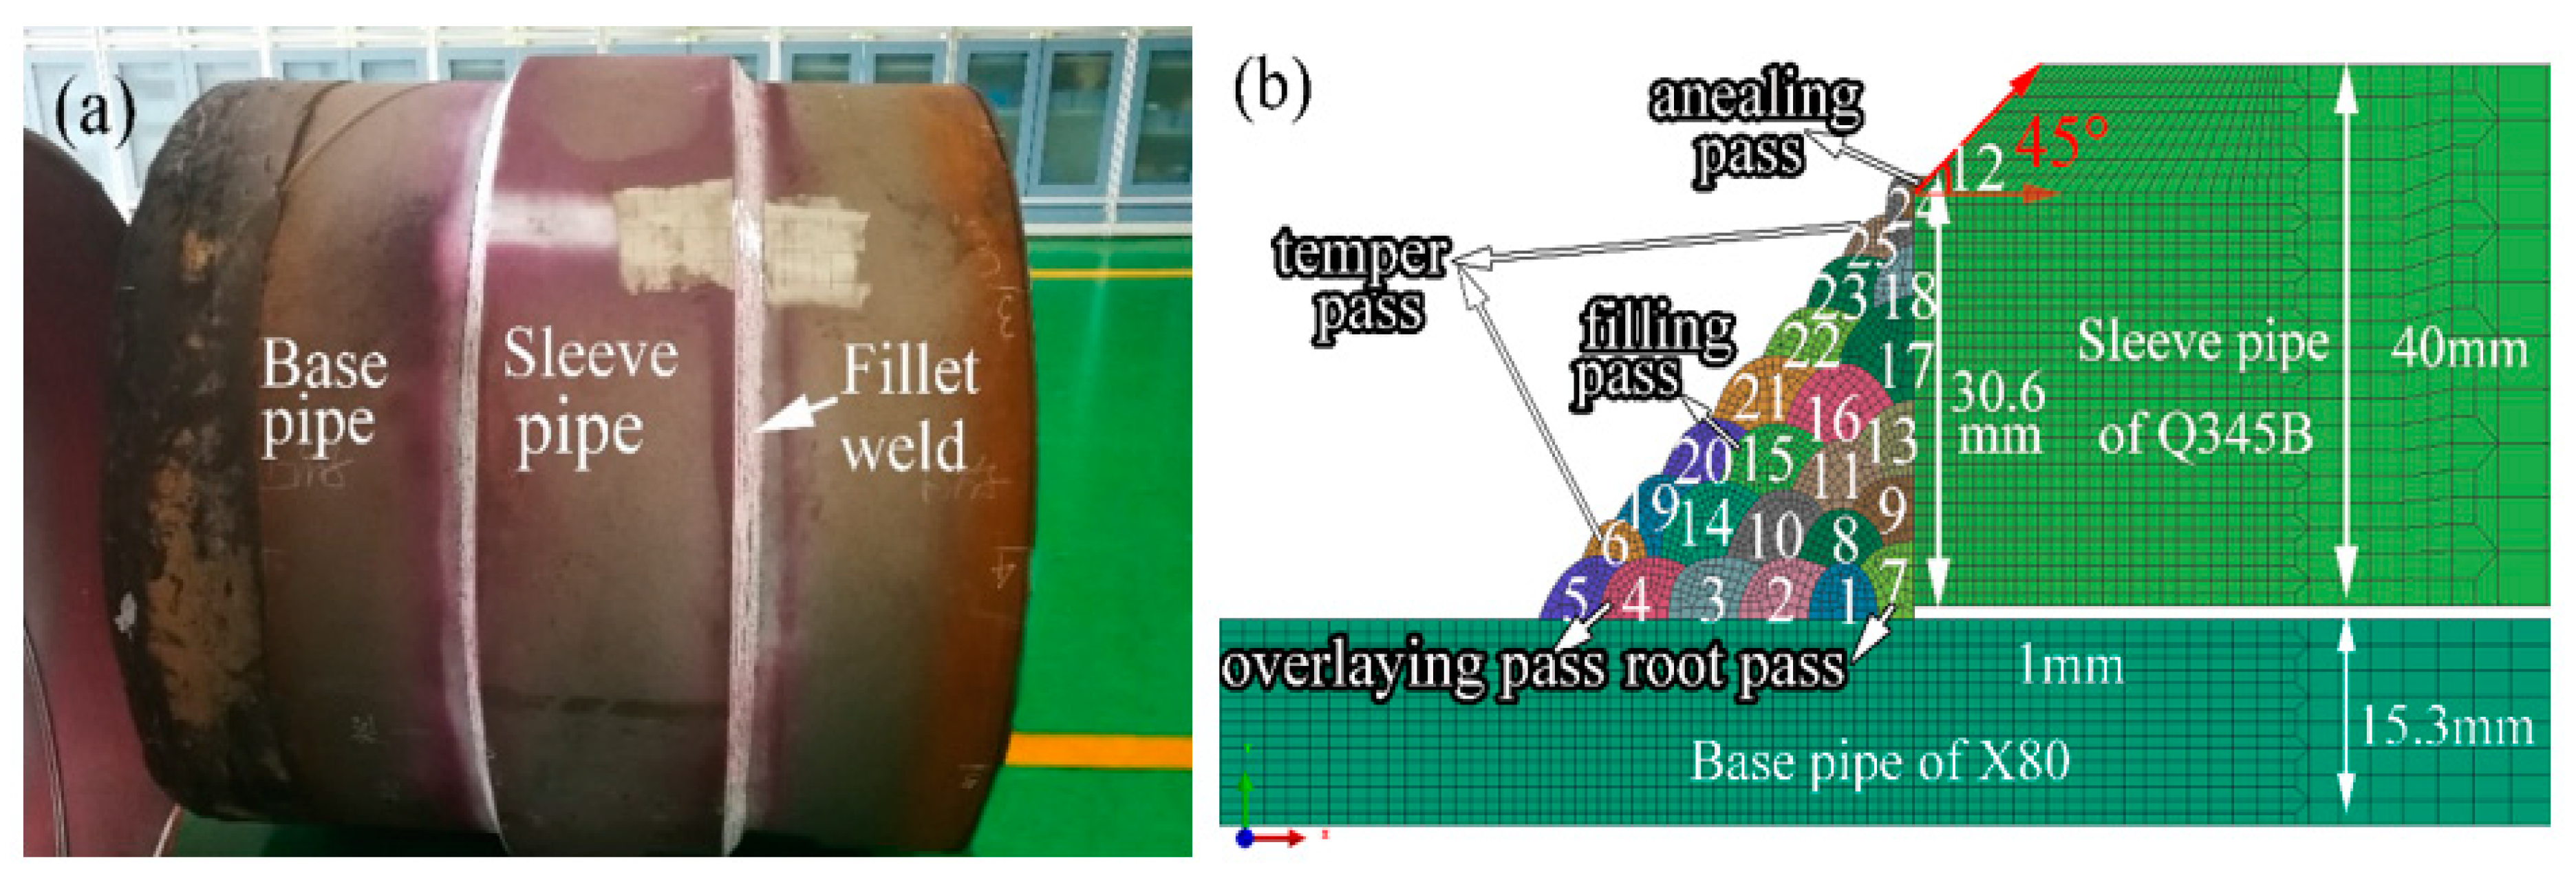
2.1. Material and Experimental Process Description
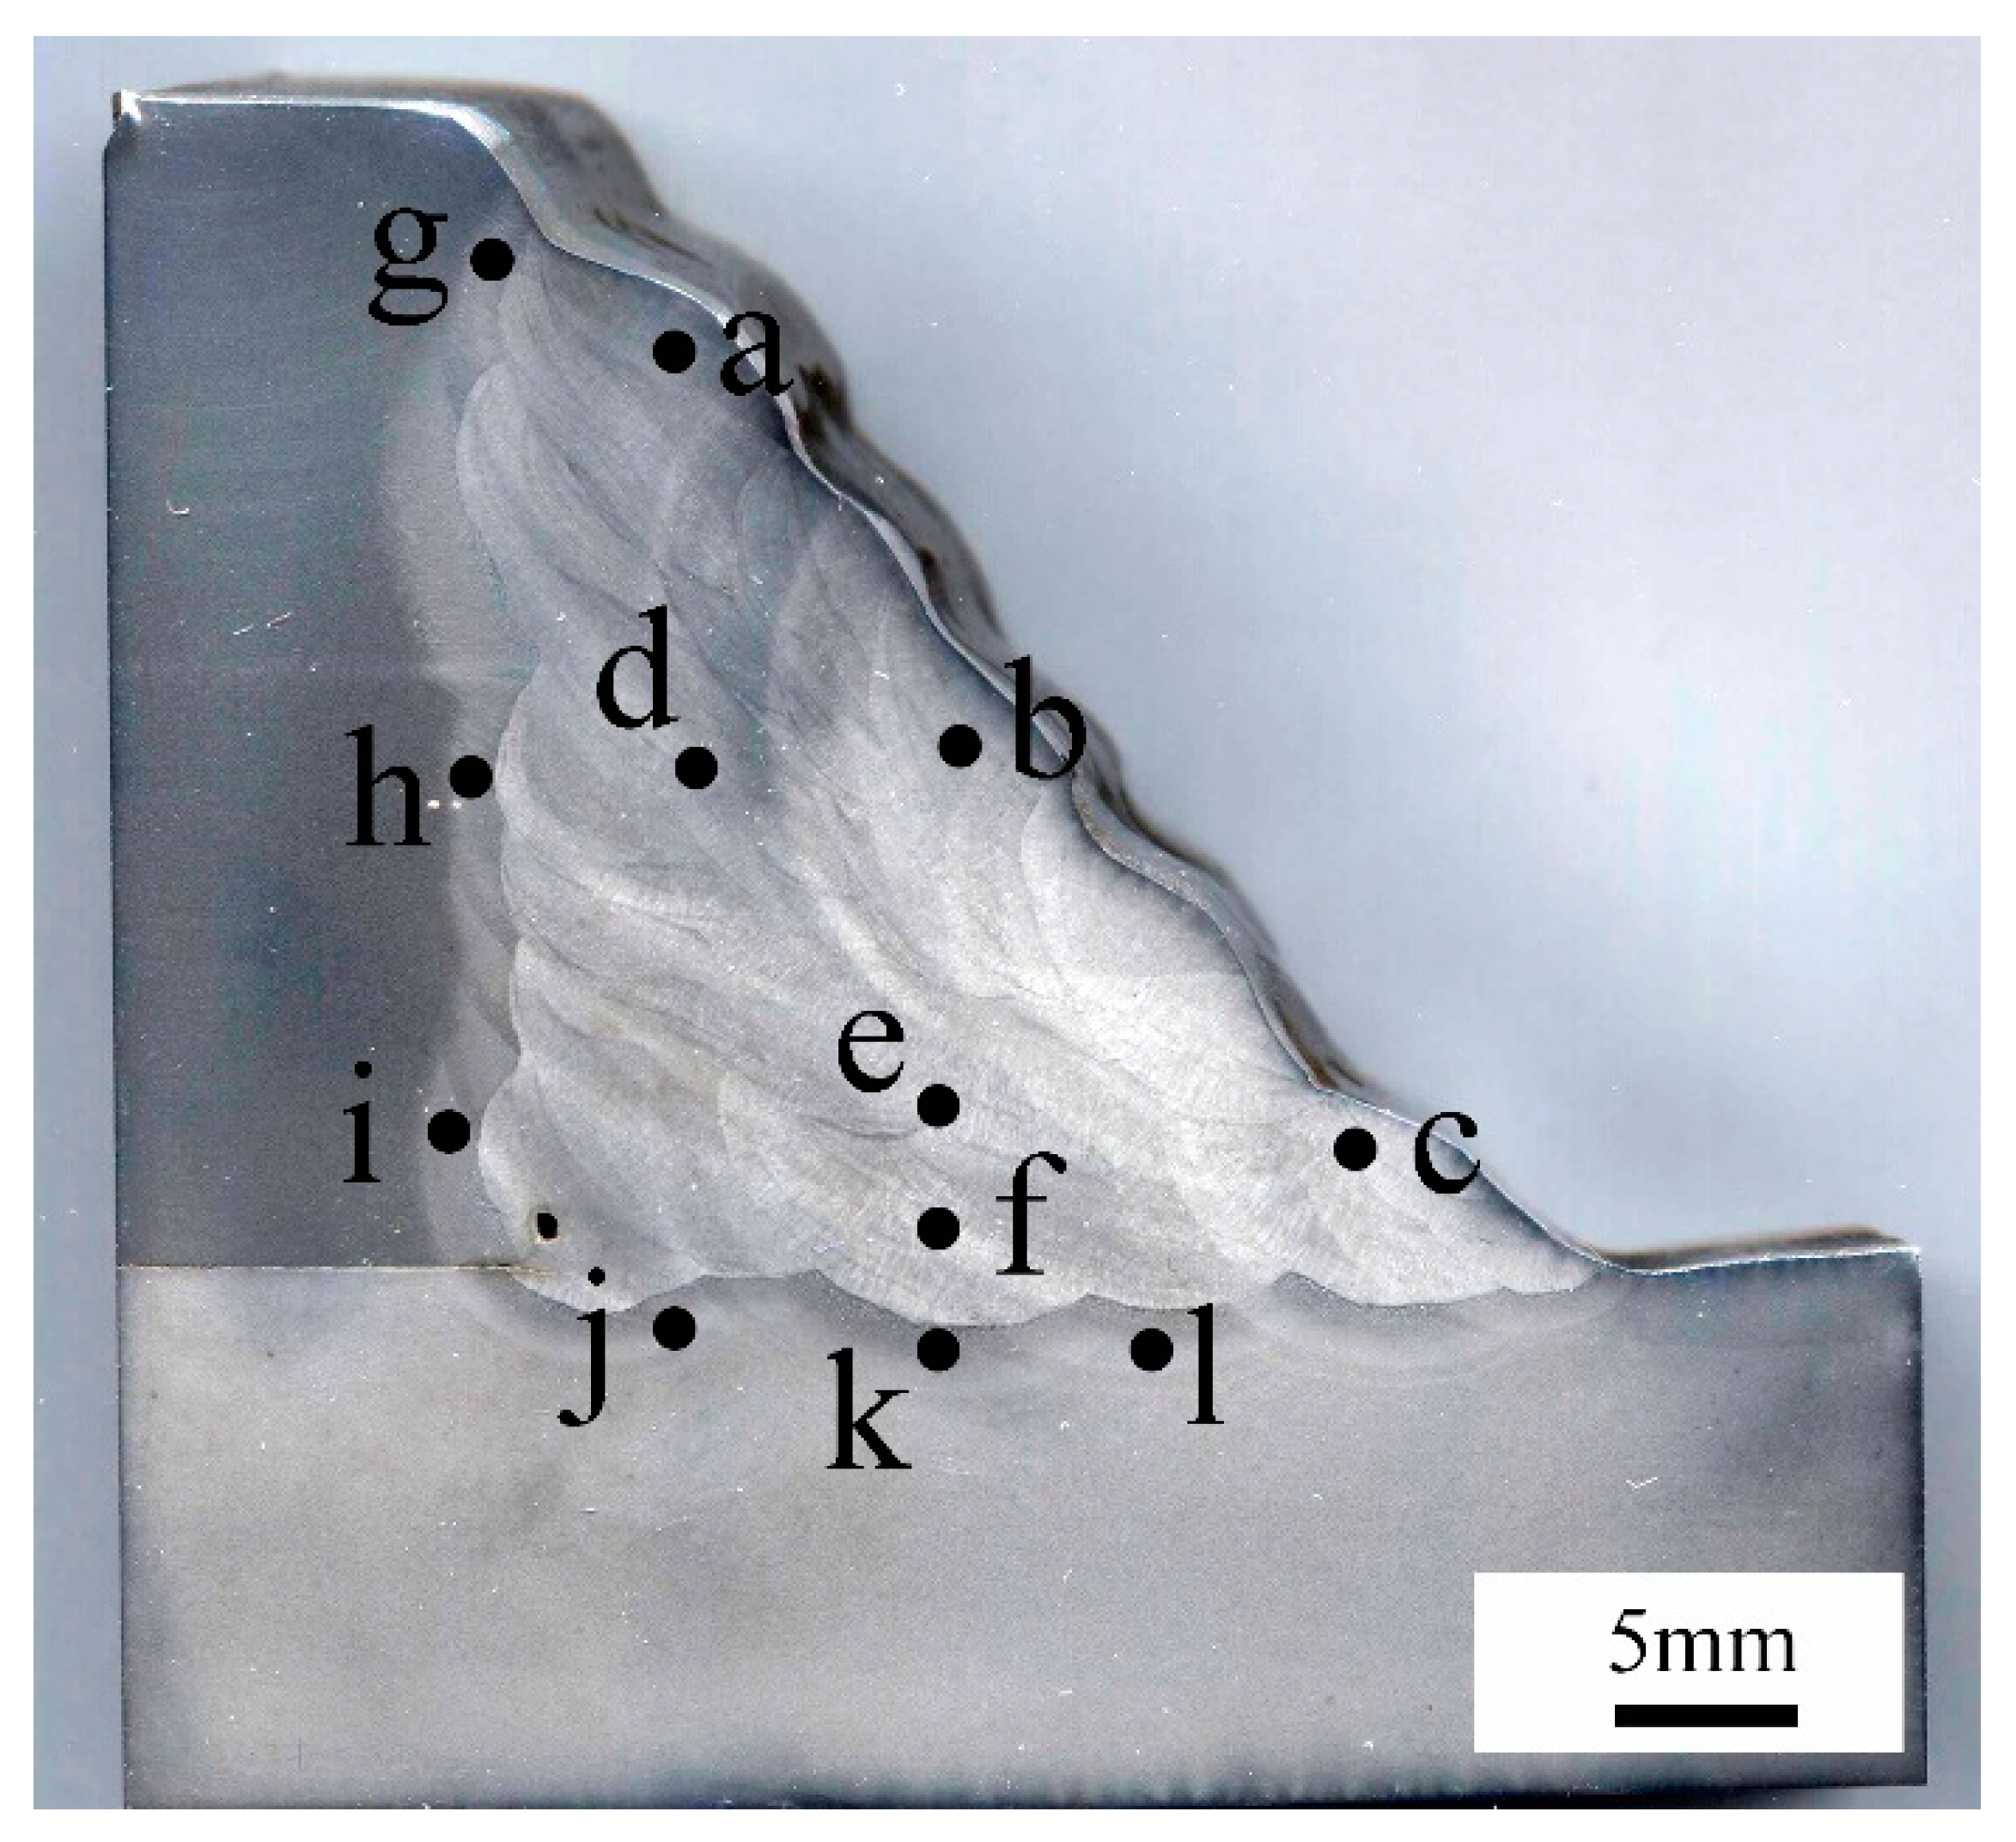
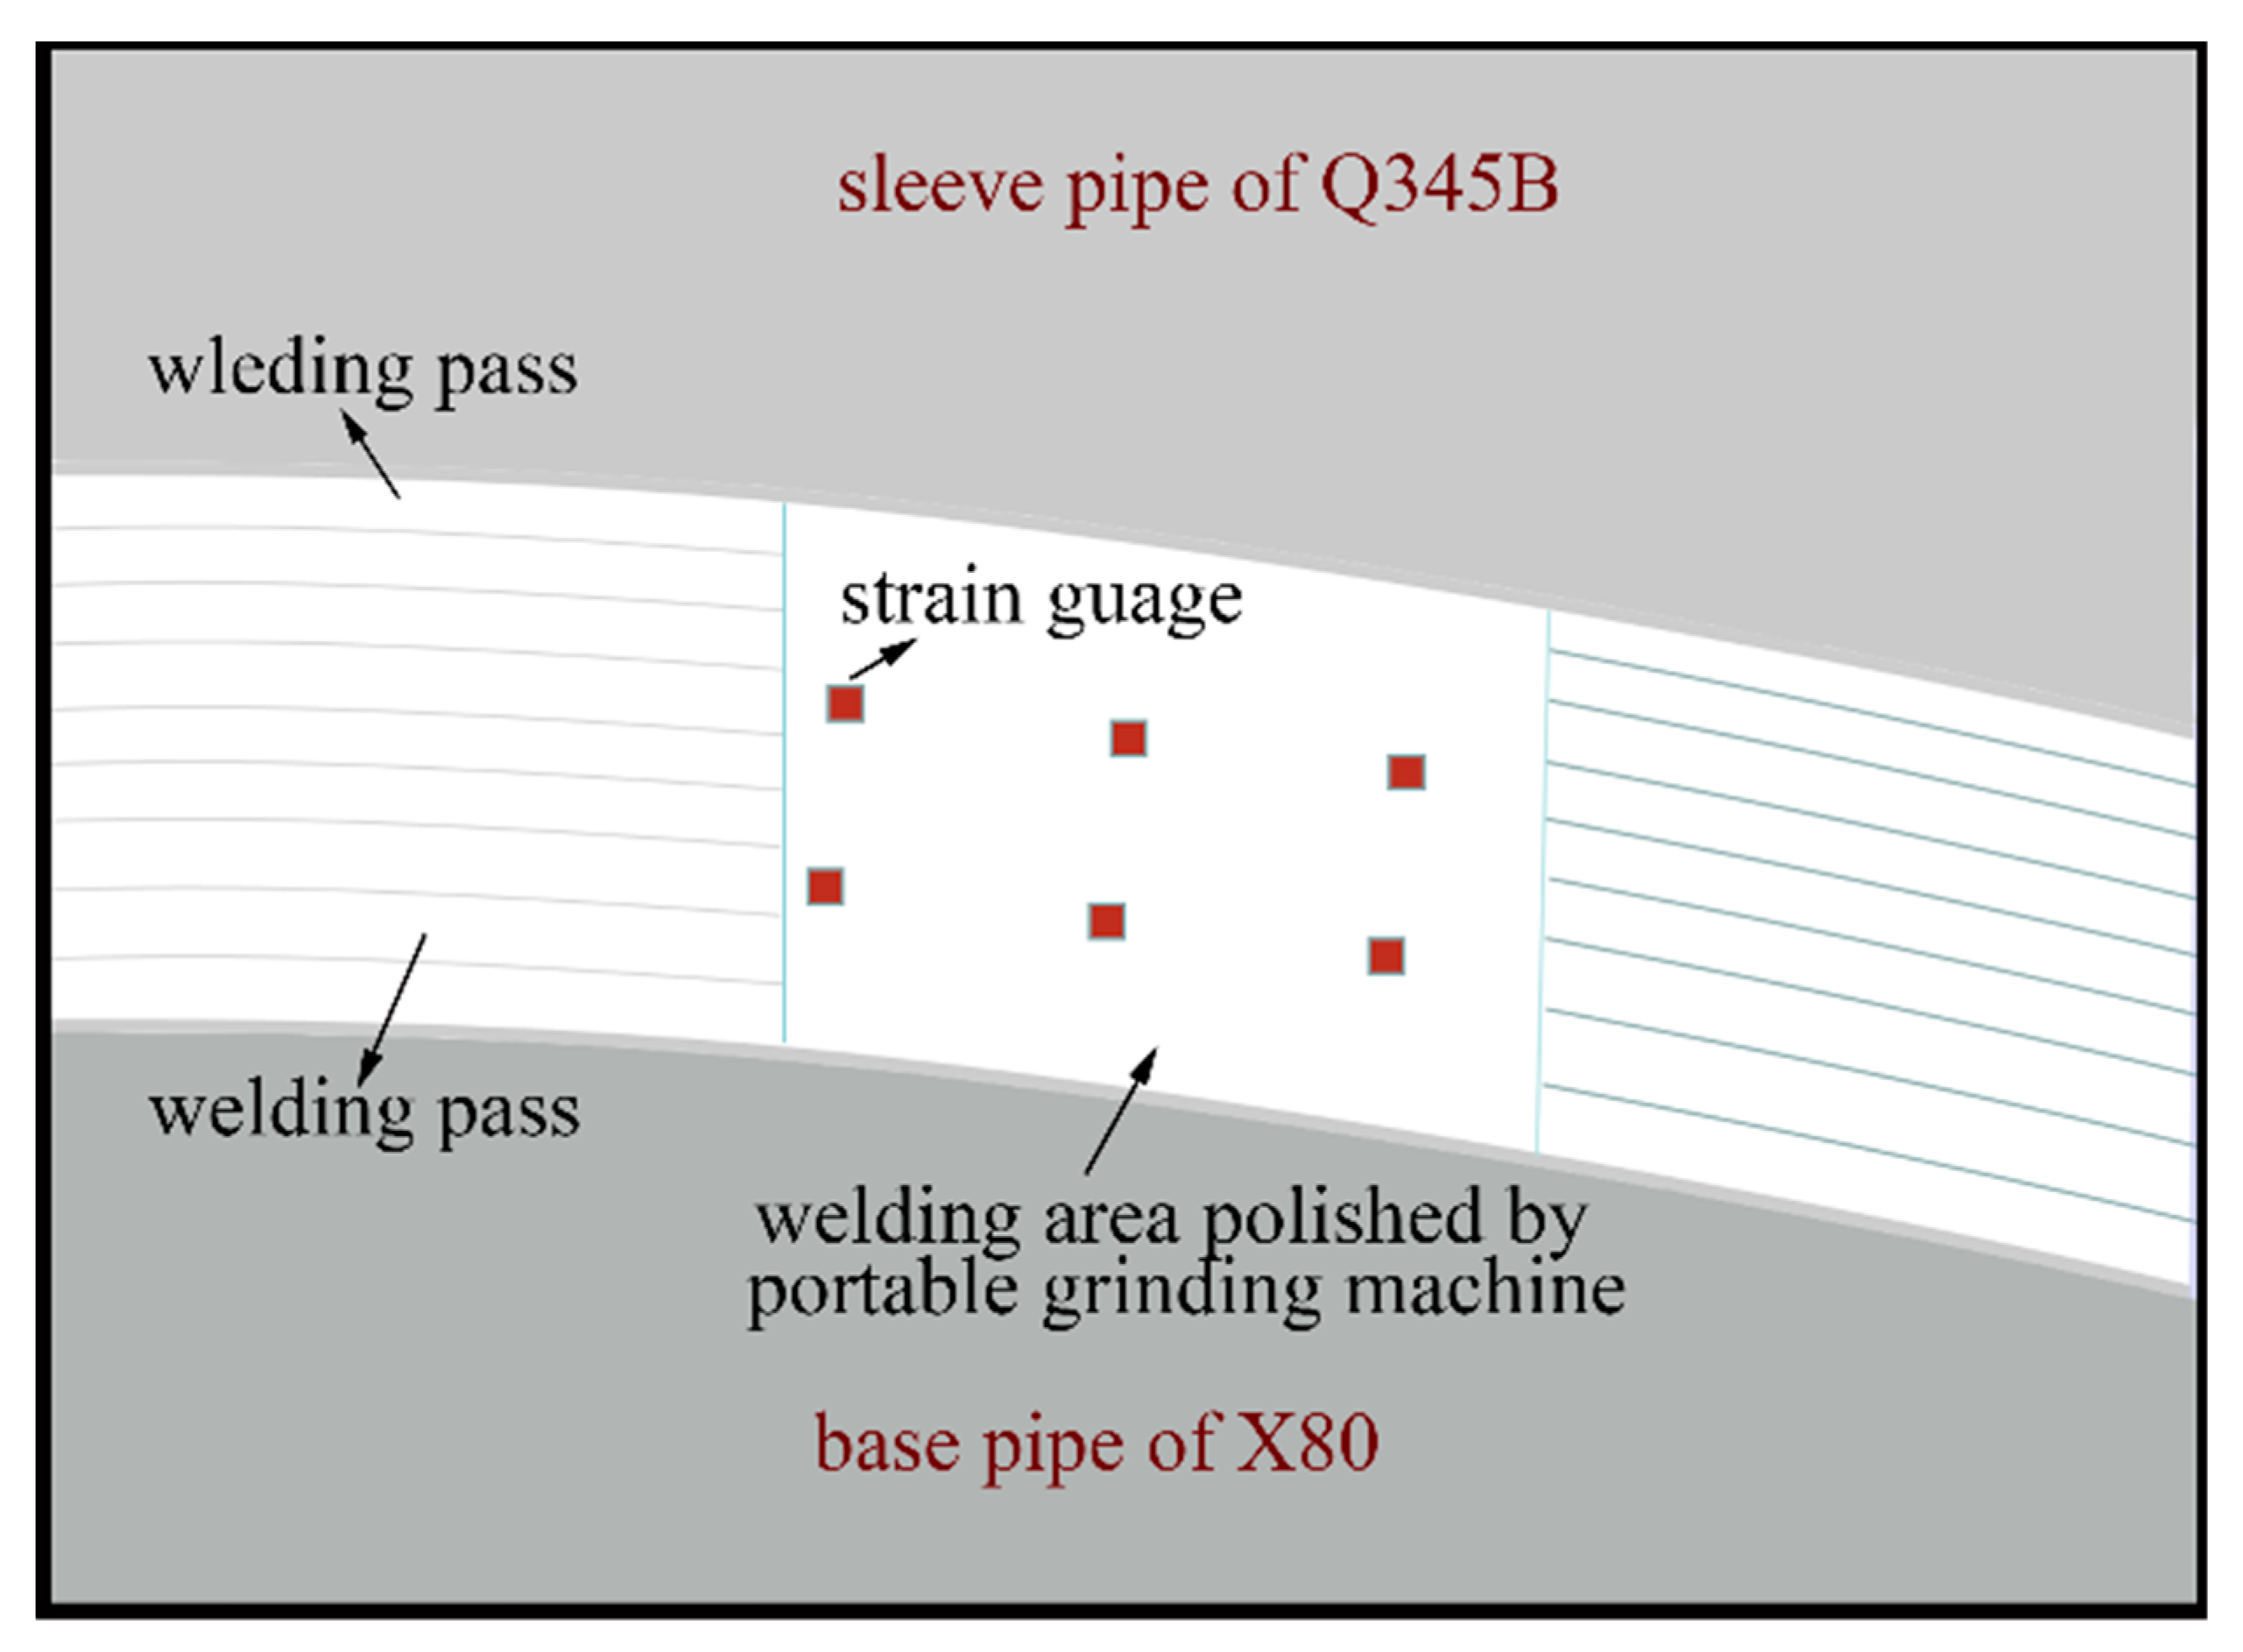
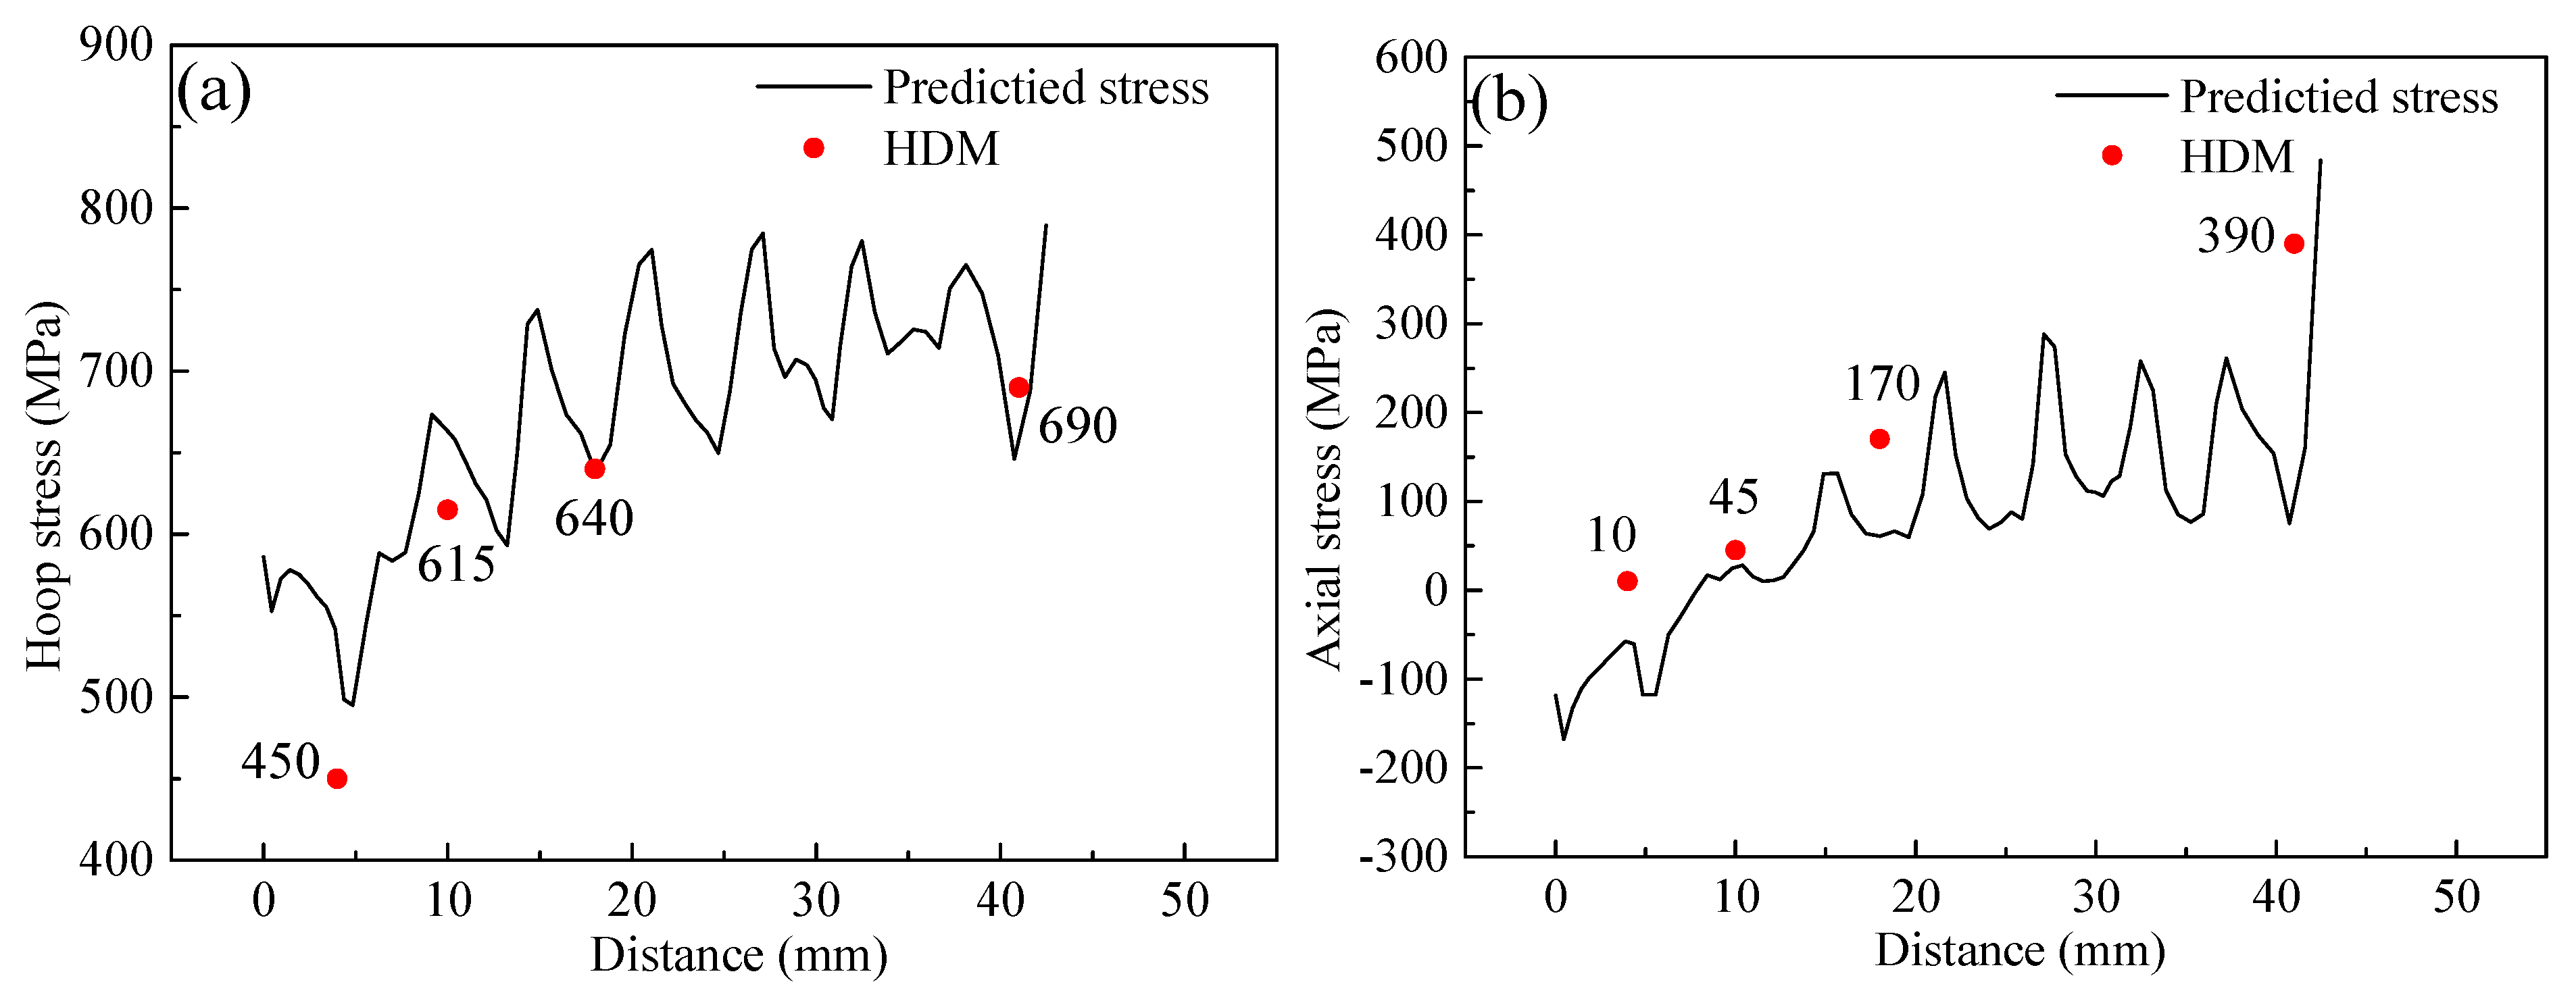
2.2. Verification Experiments
3. Finite Element Modeling
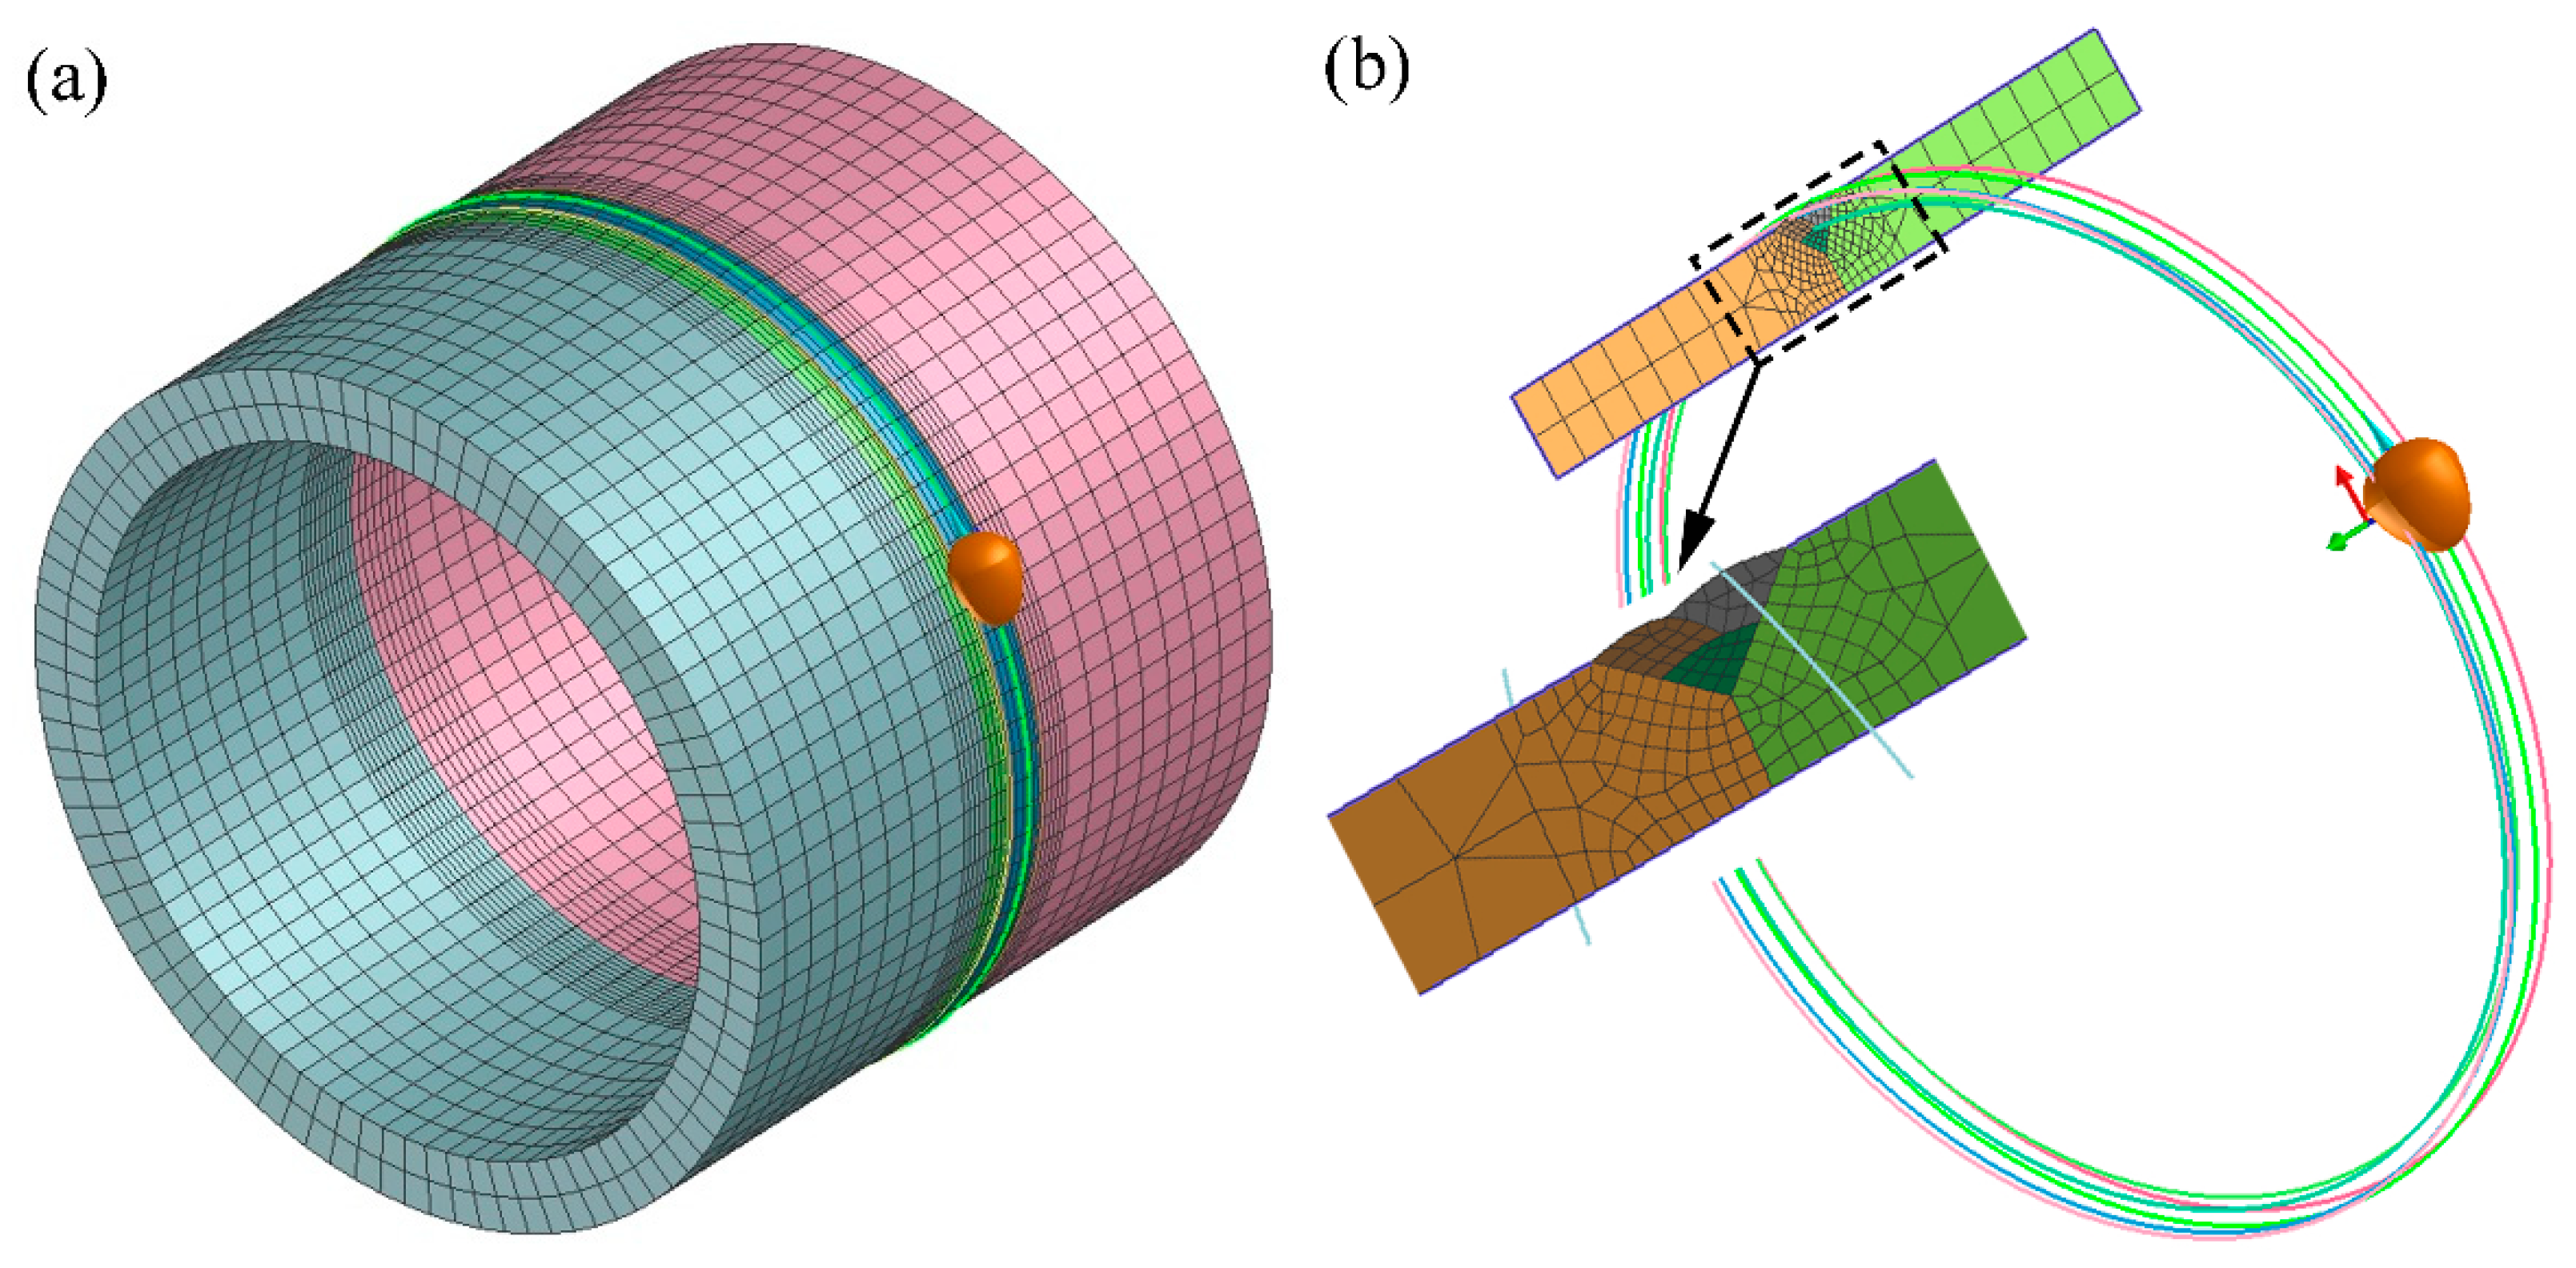
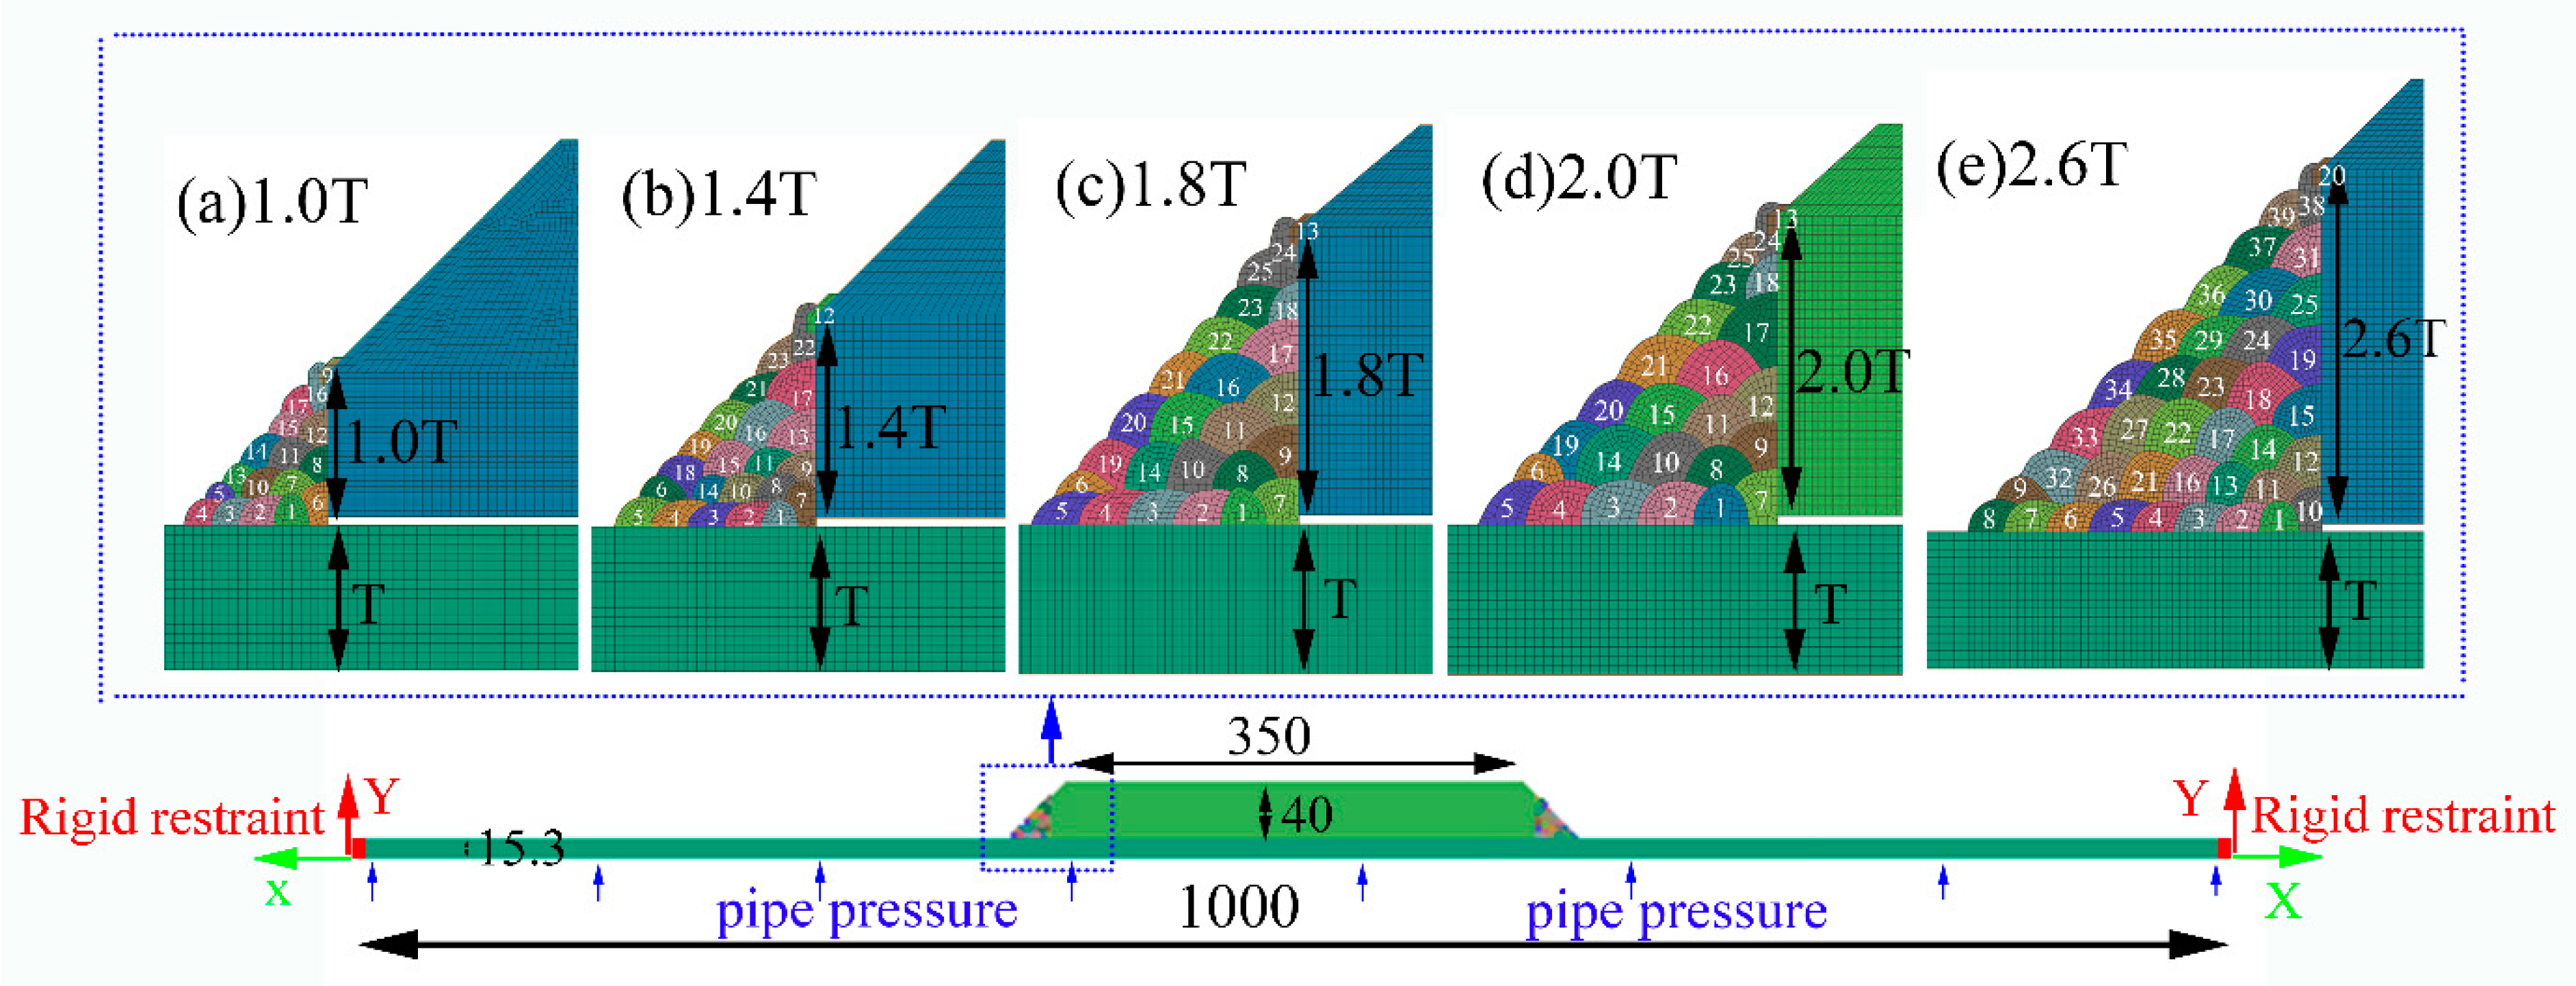
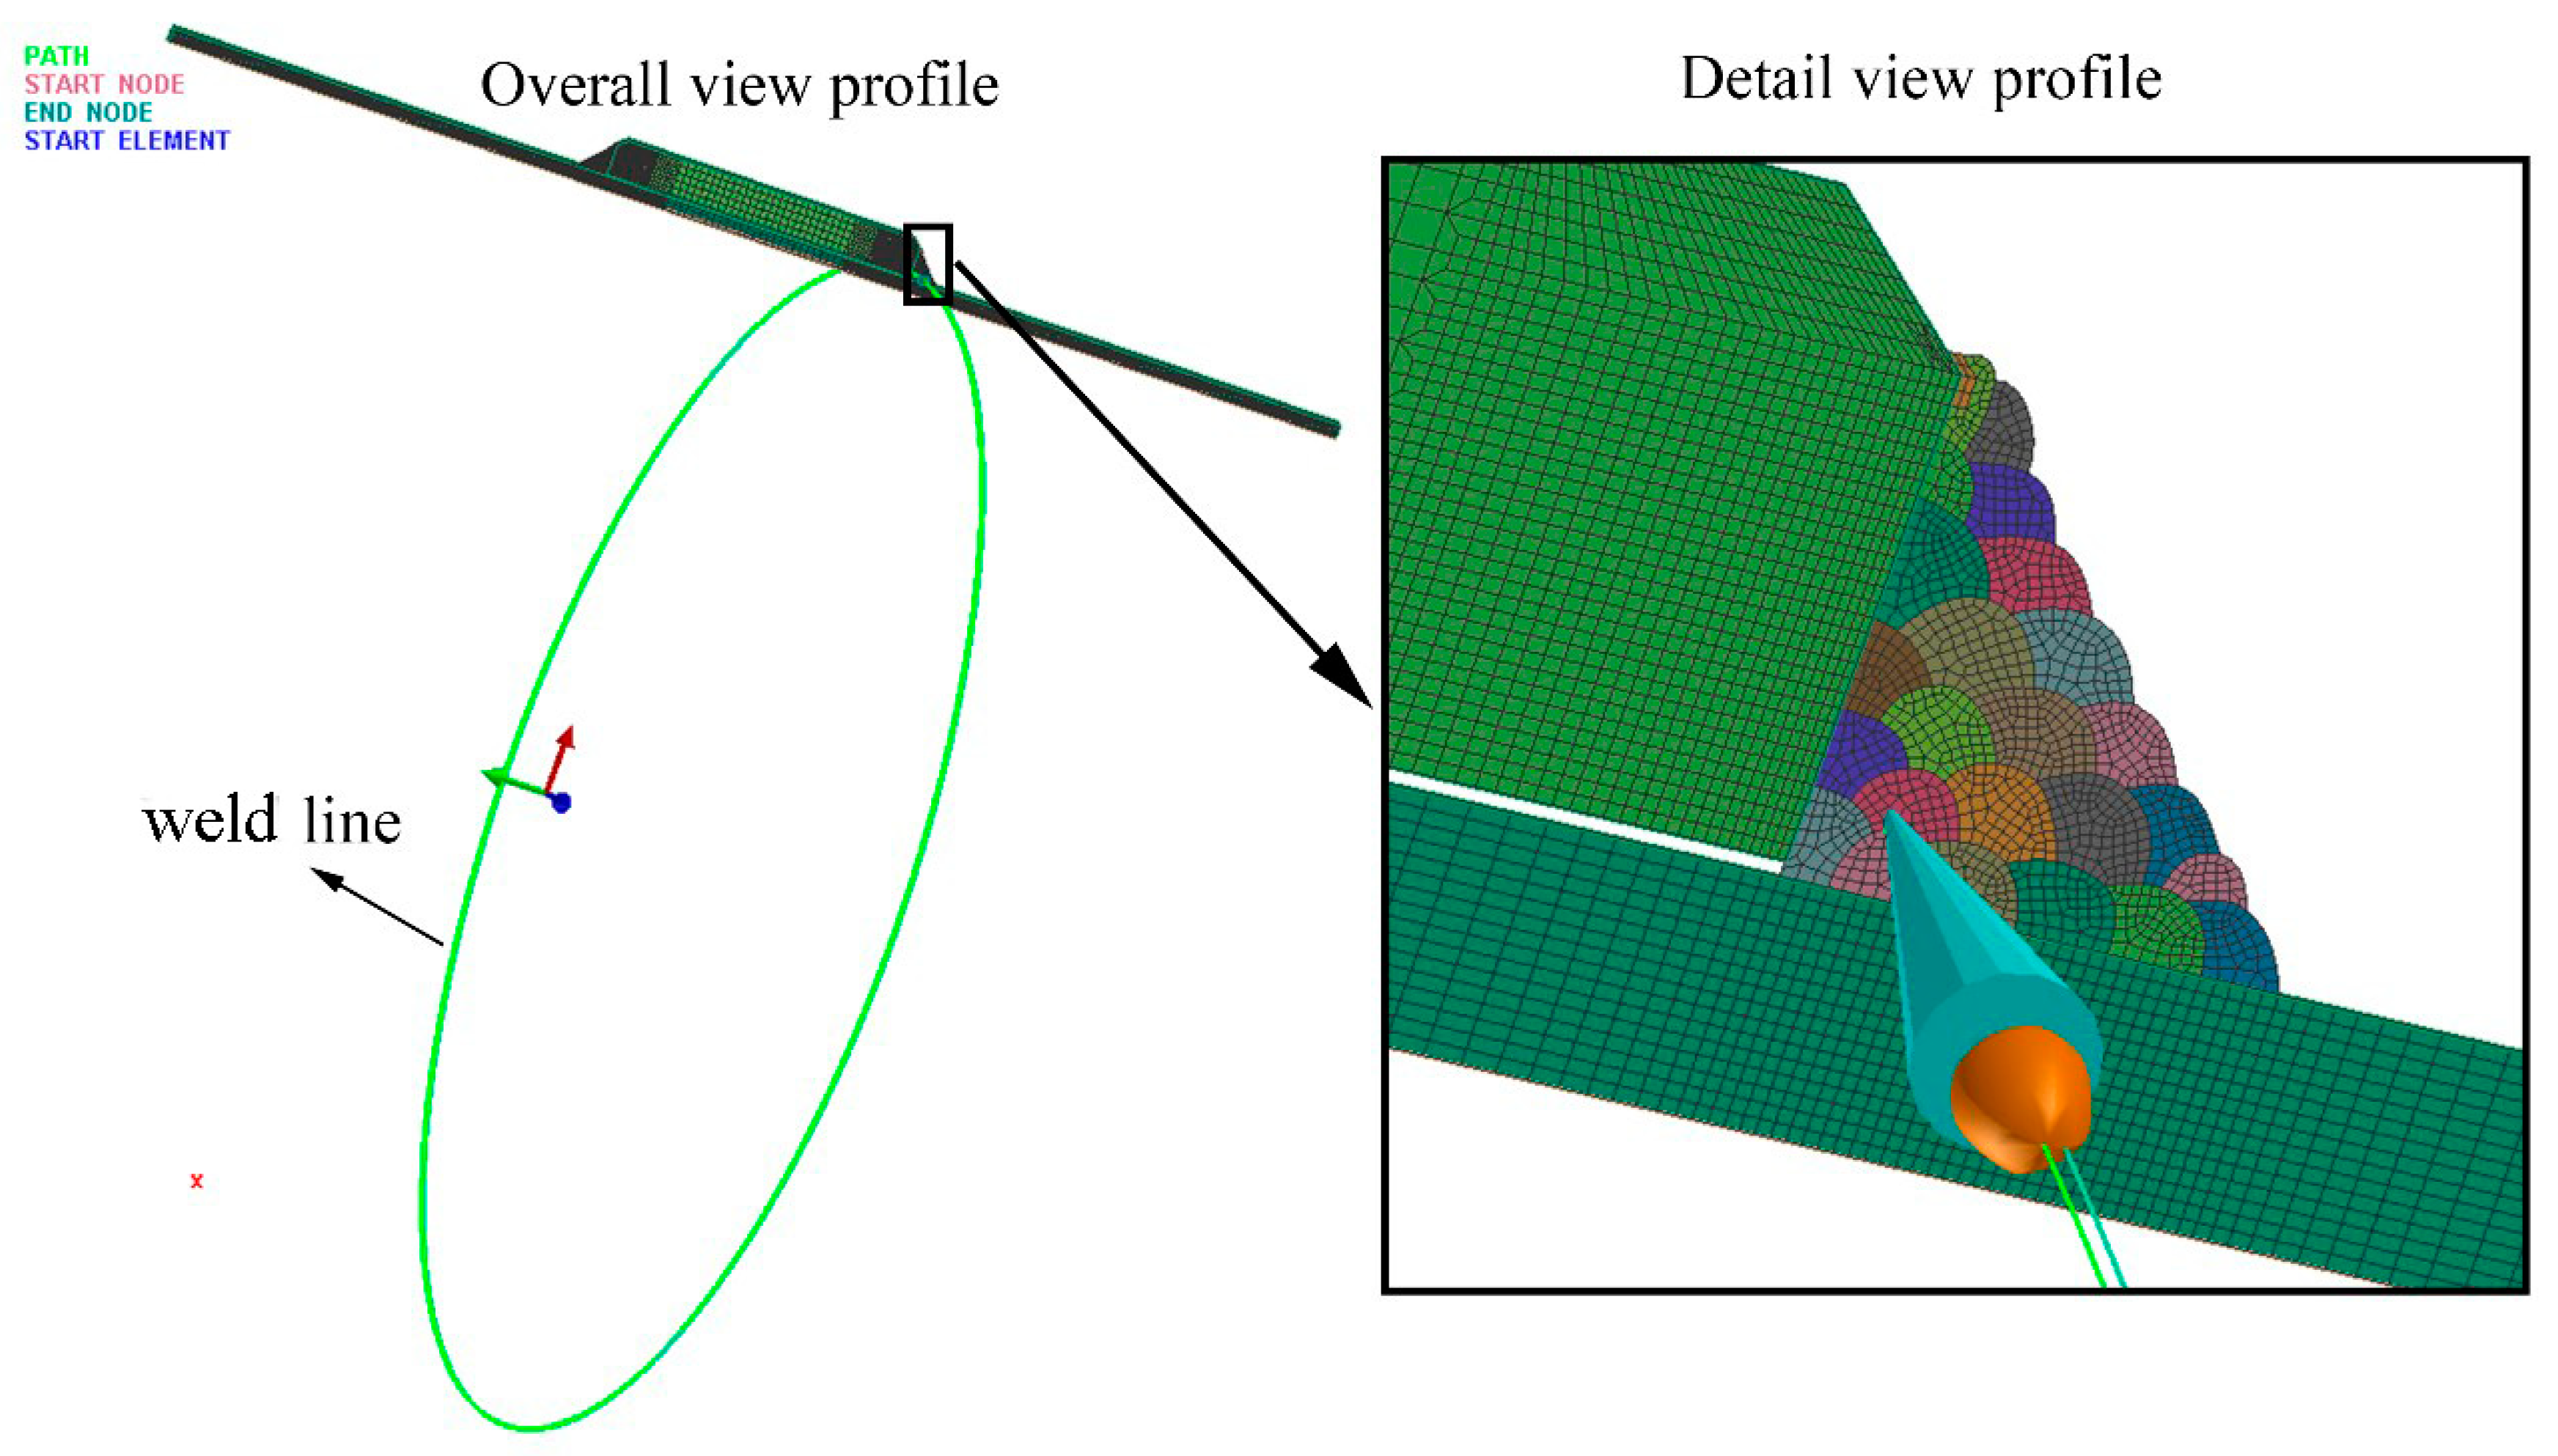
3.1. Finite Element Model
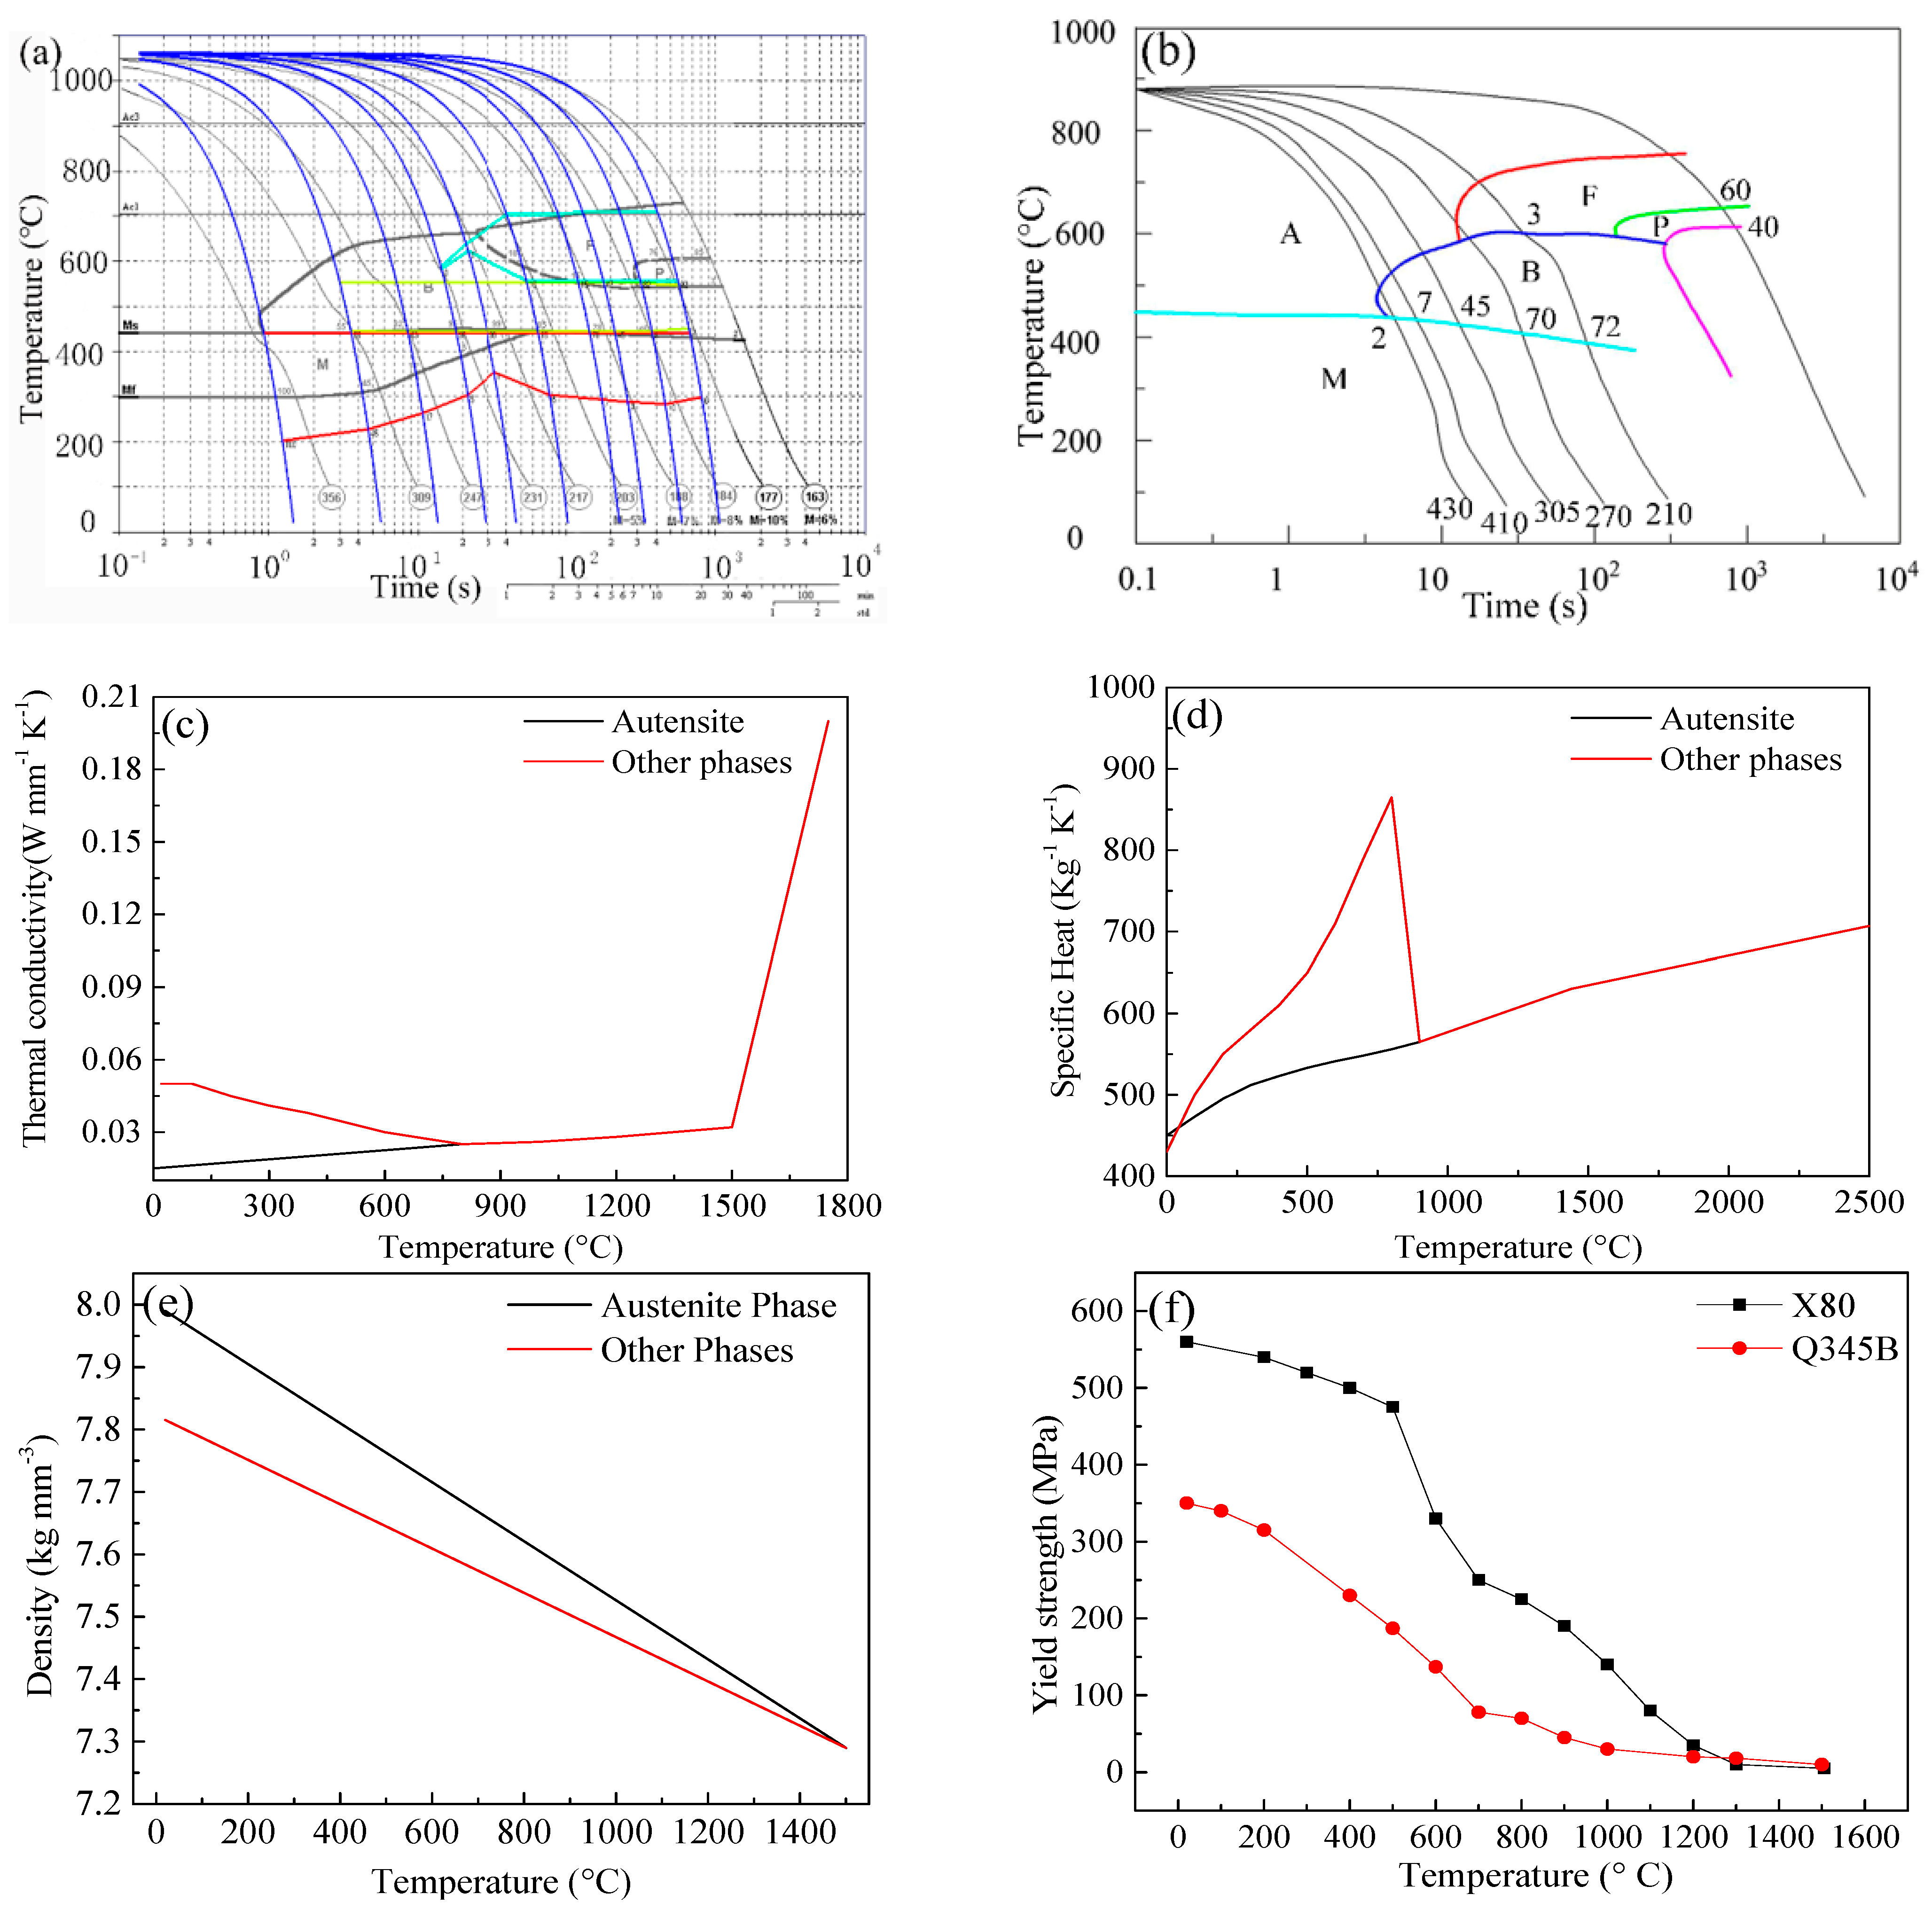
3.2. Thermal Analysis
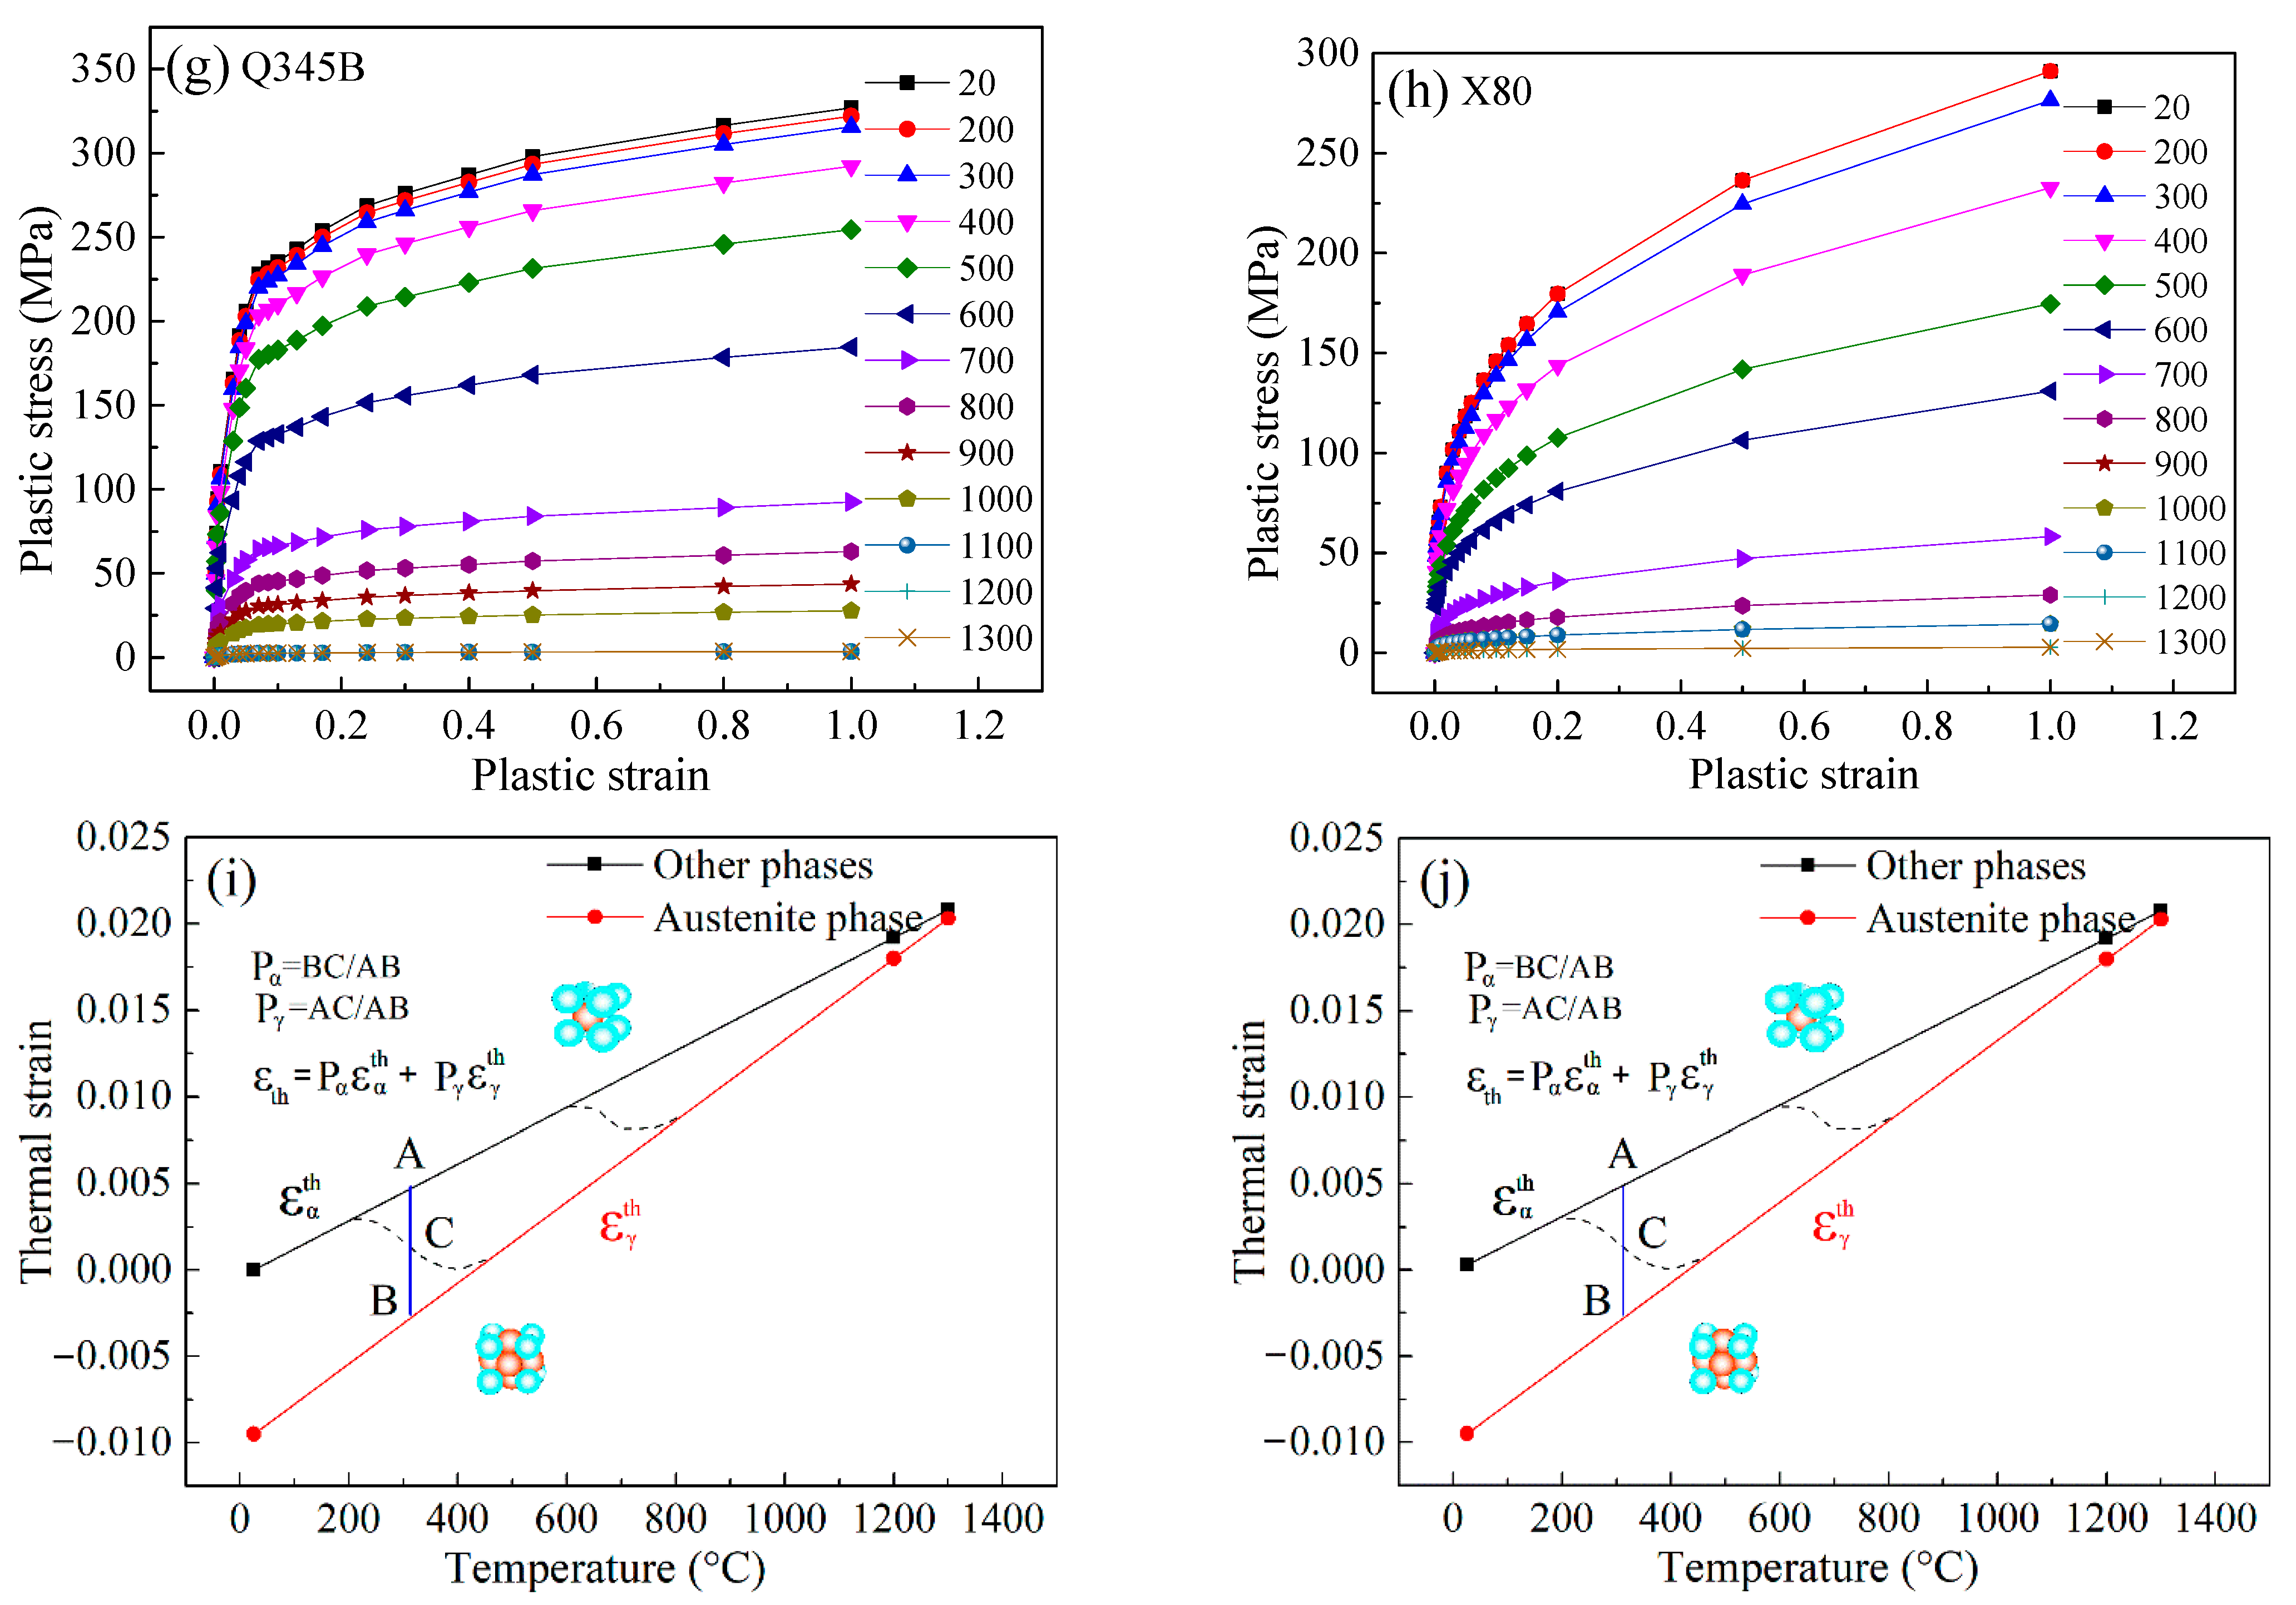
3.3. Metallurgical and Mechanical Analysis
4. Results and Discussions
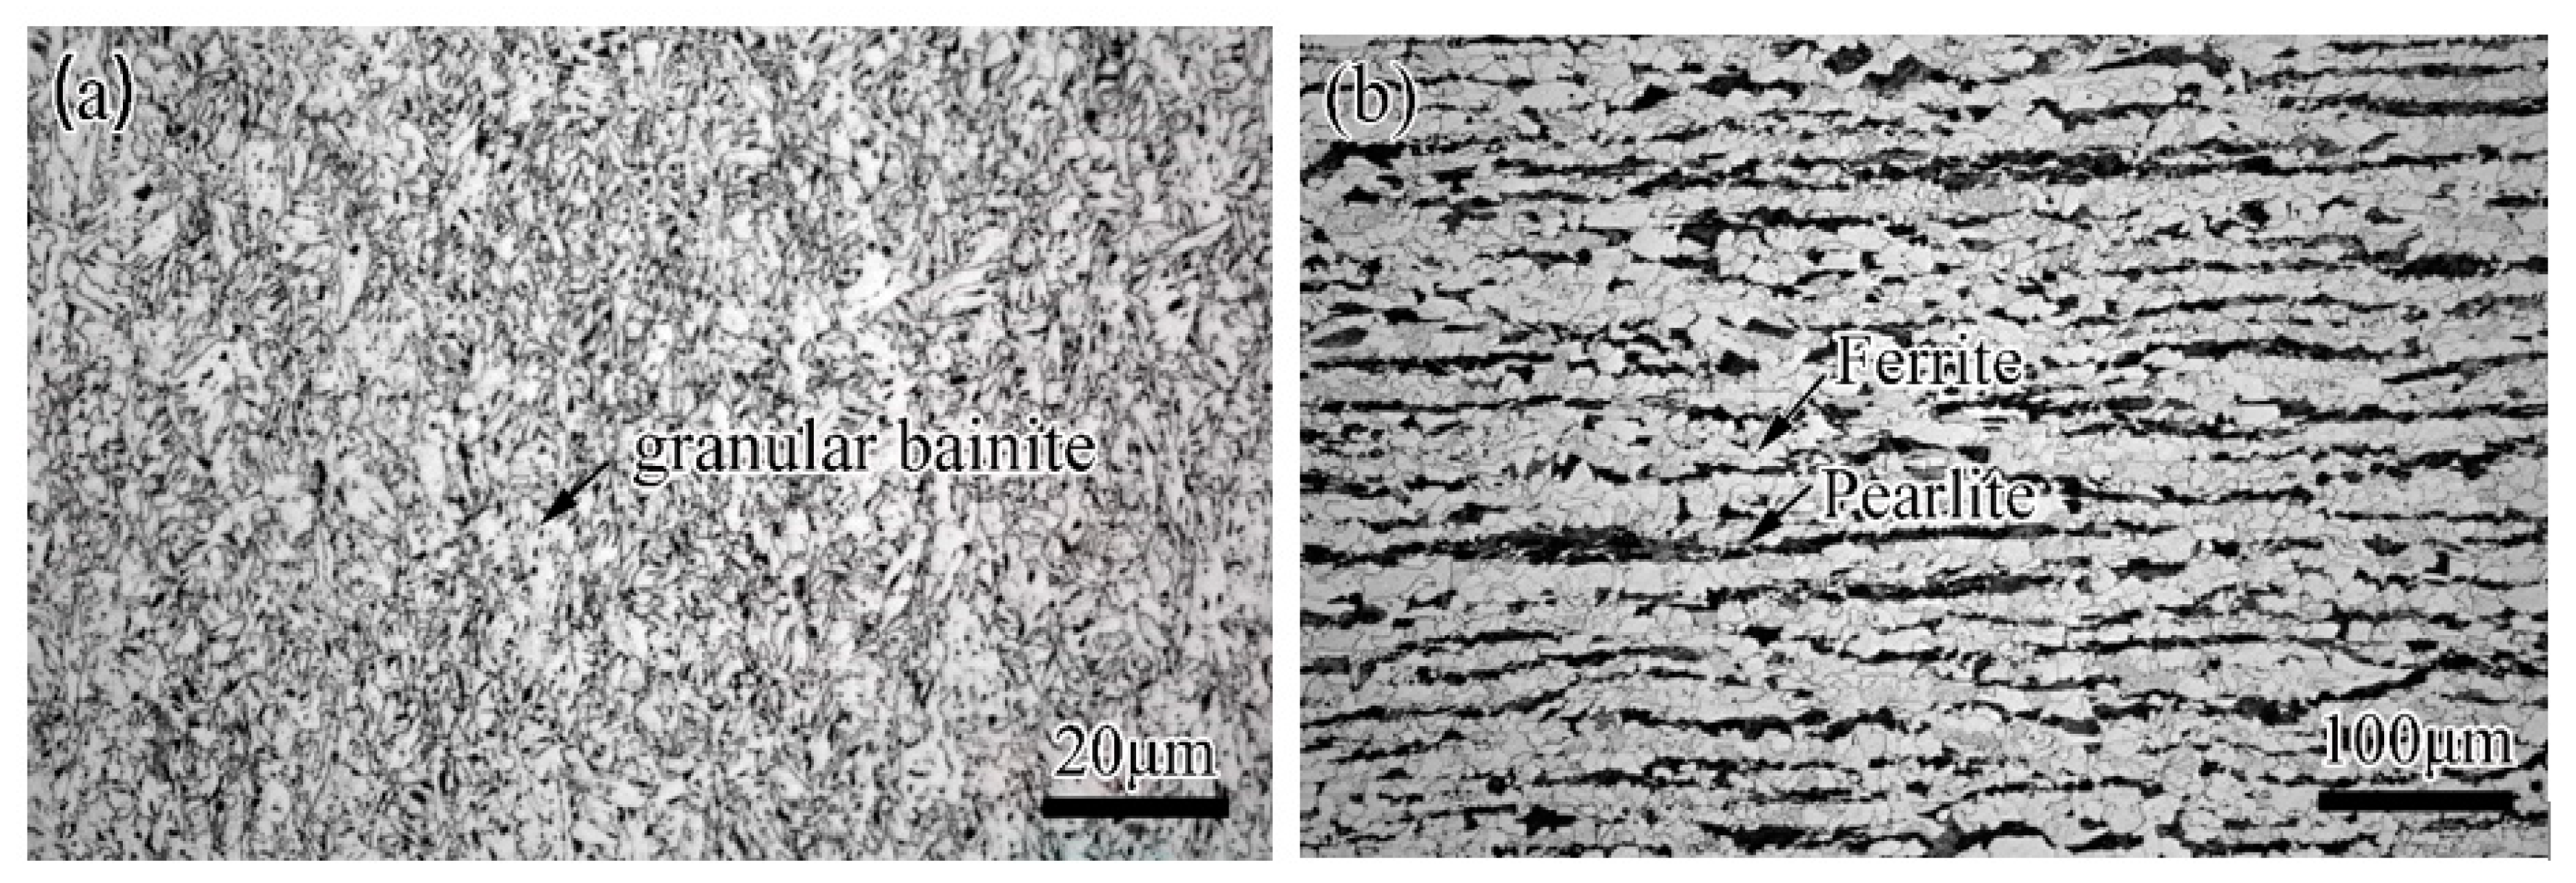
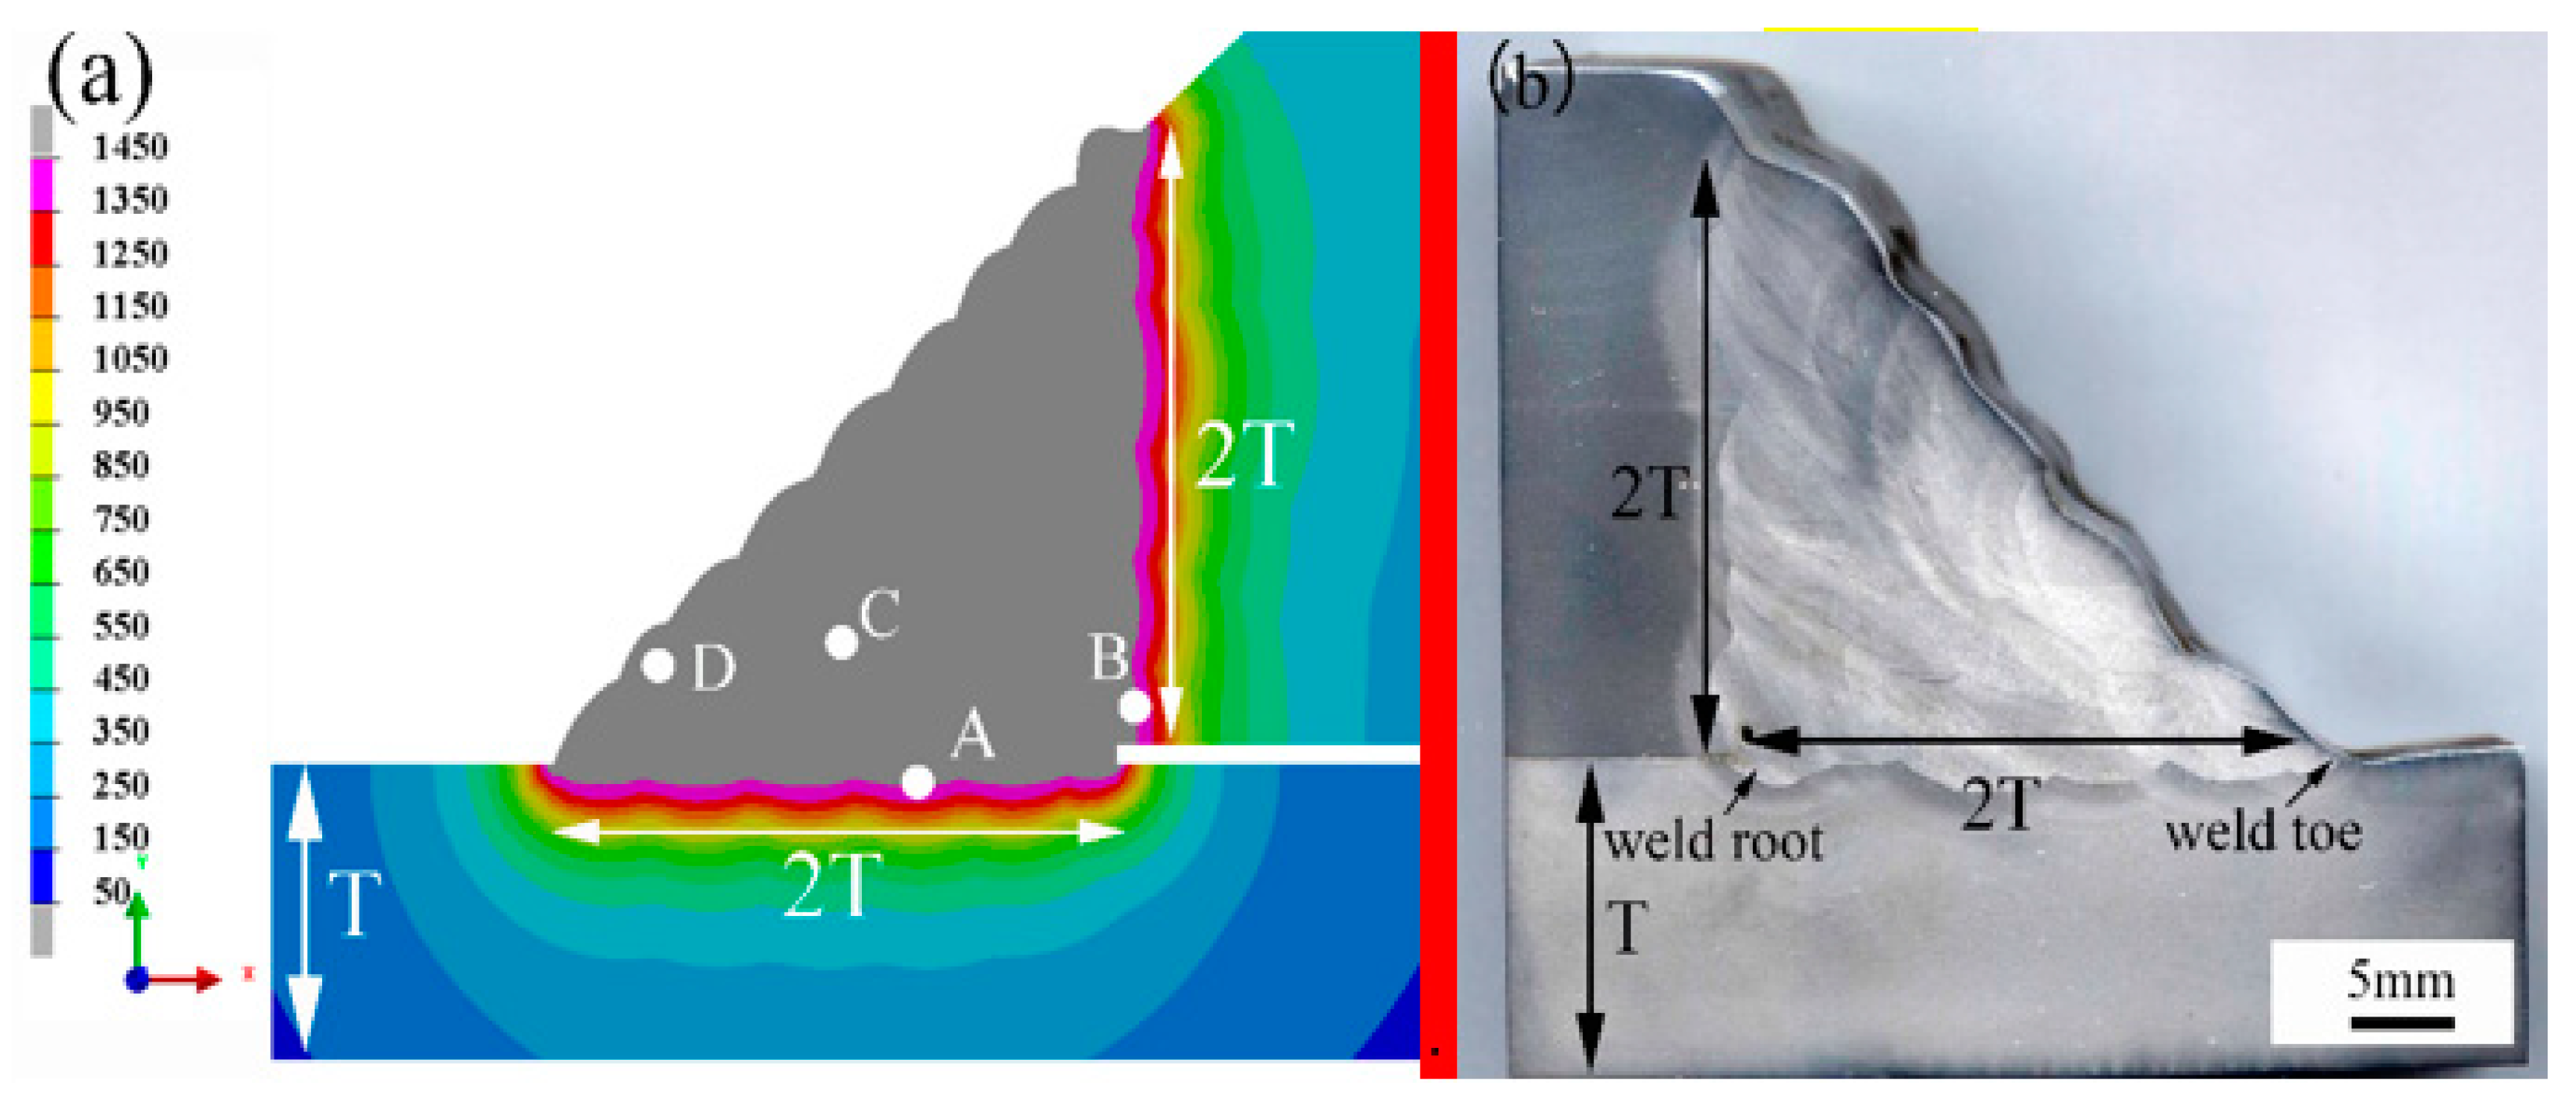
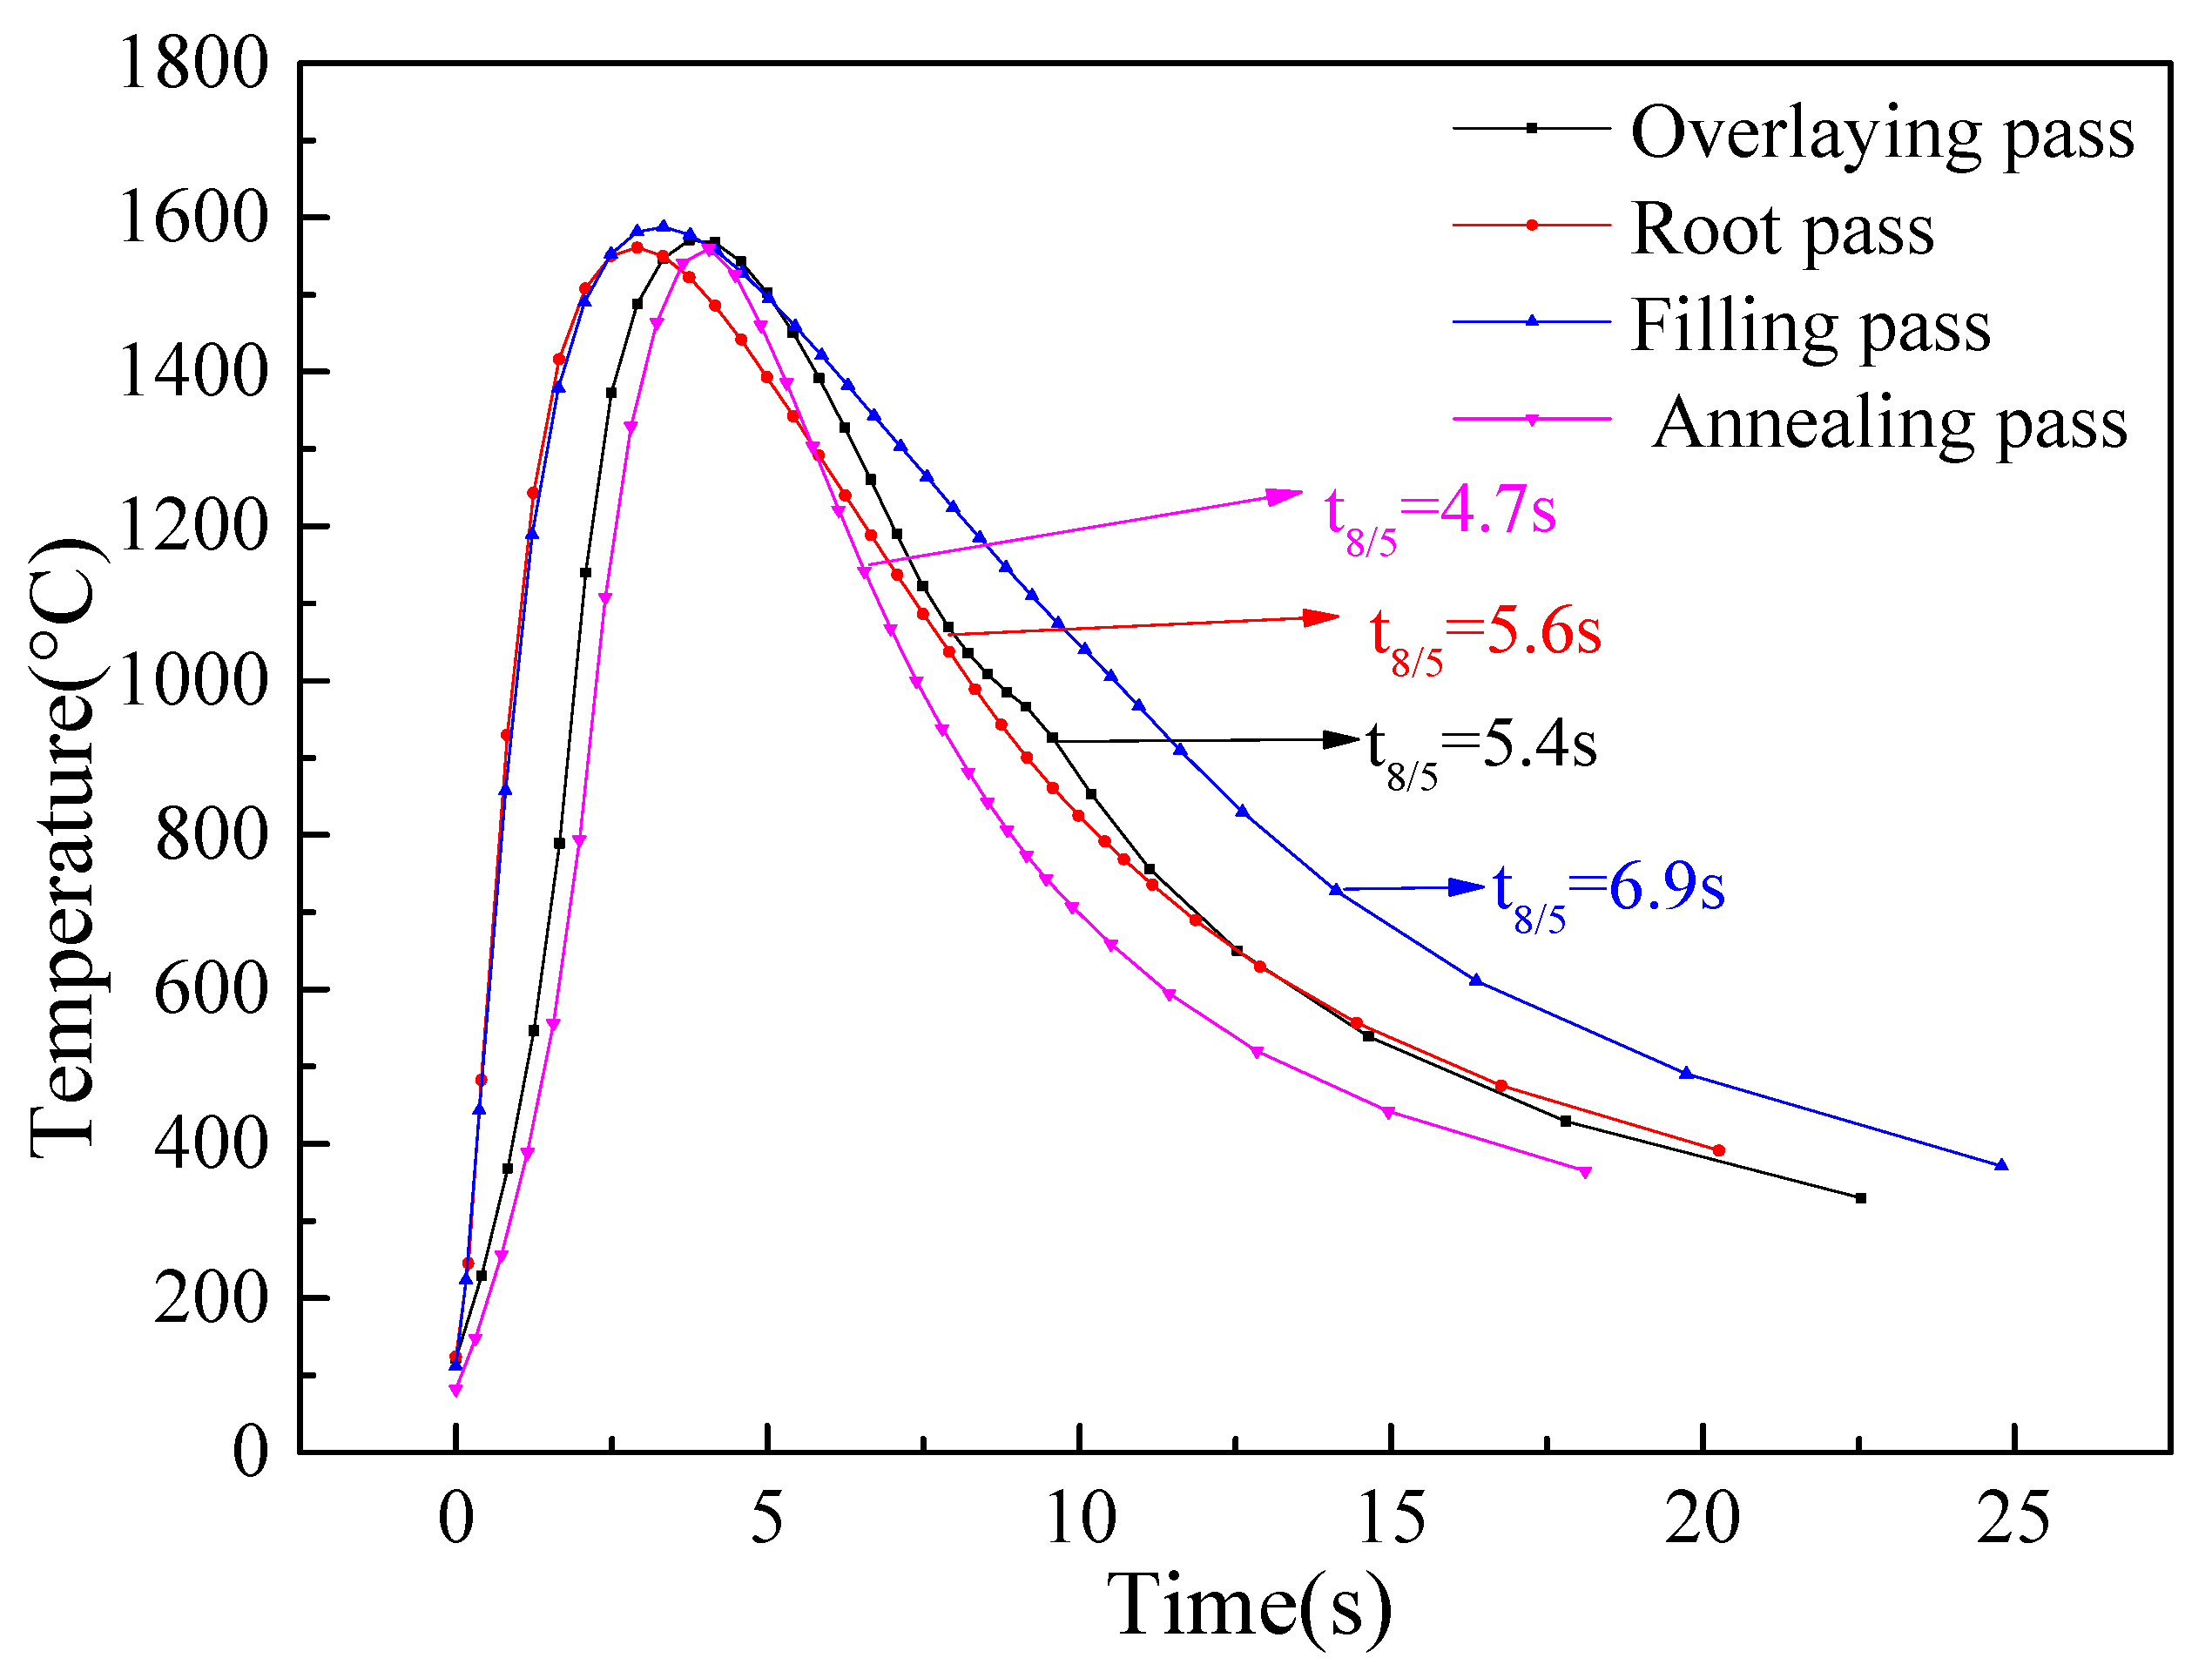
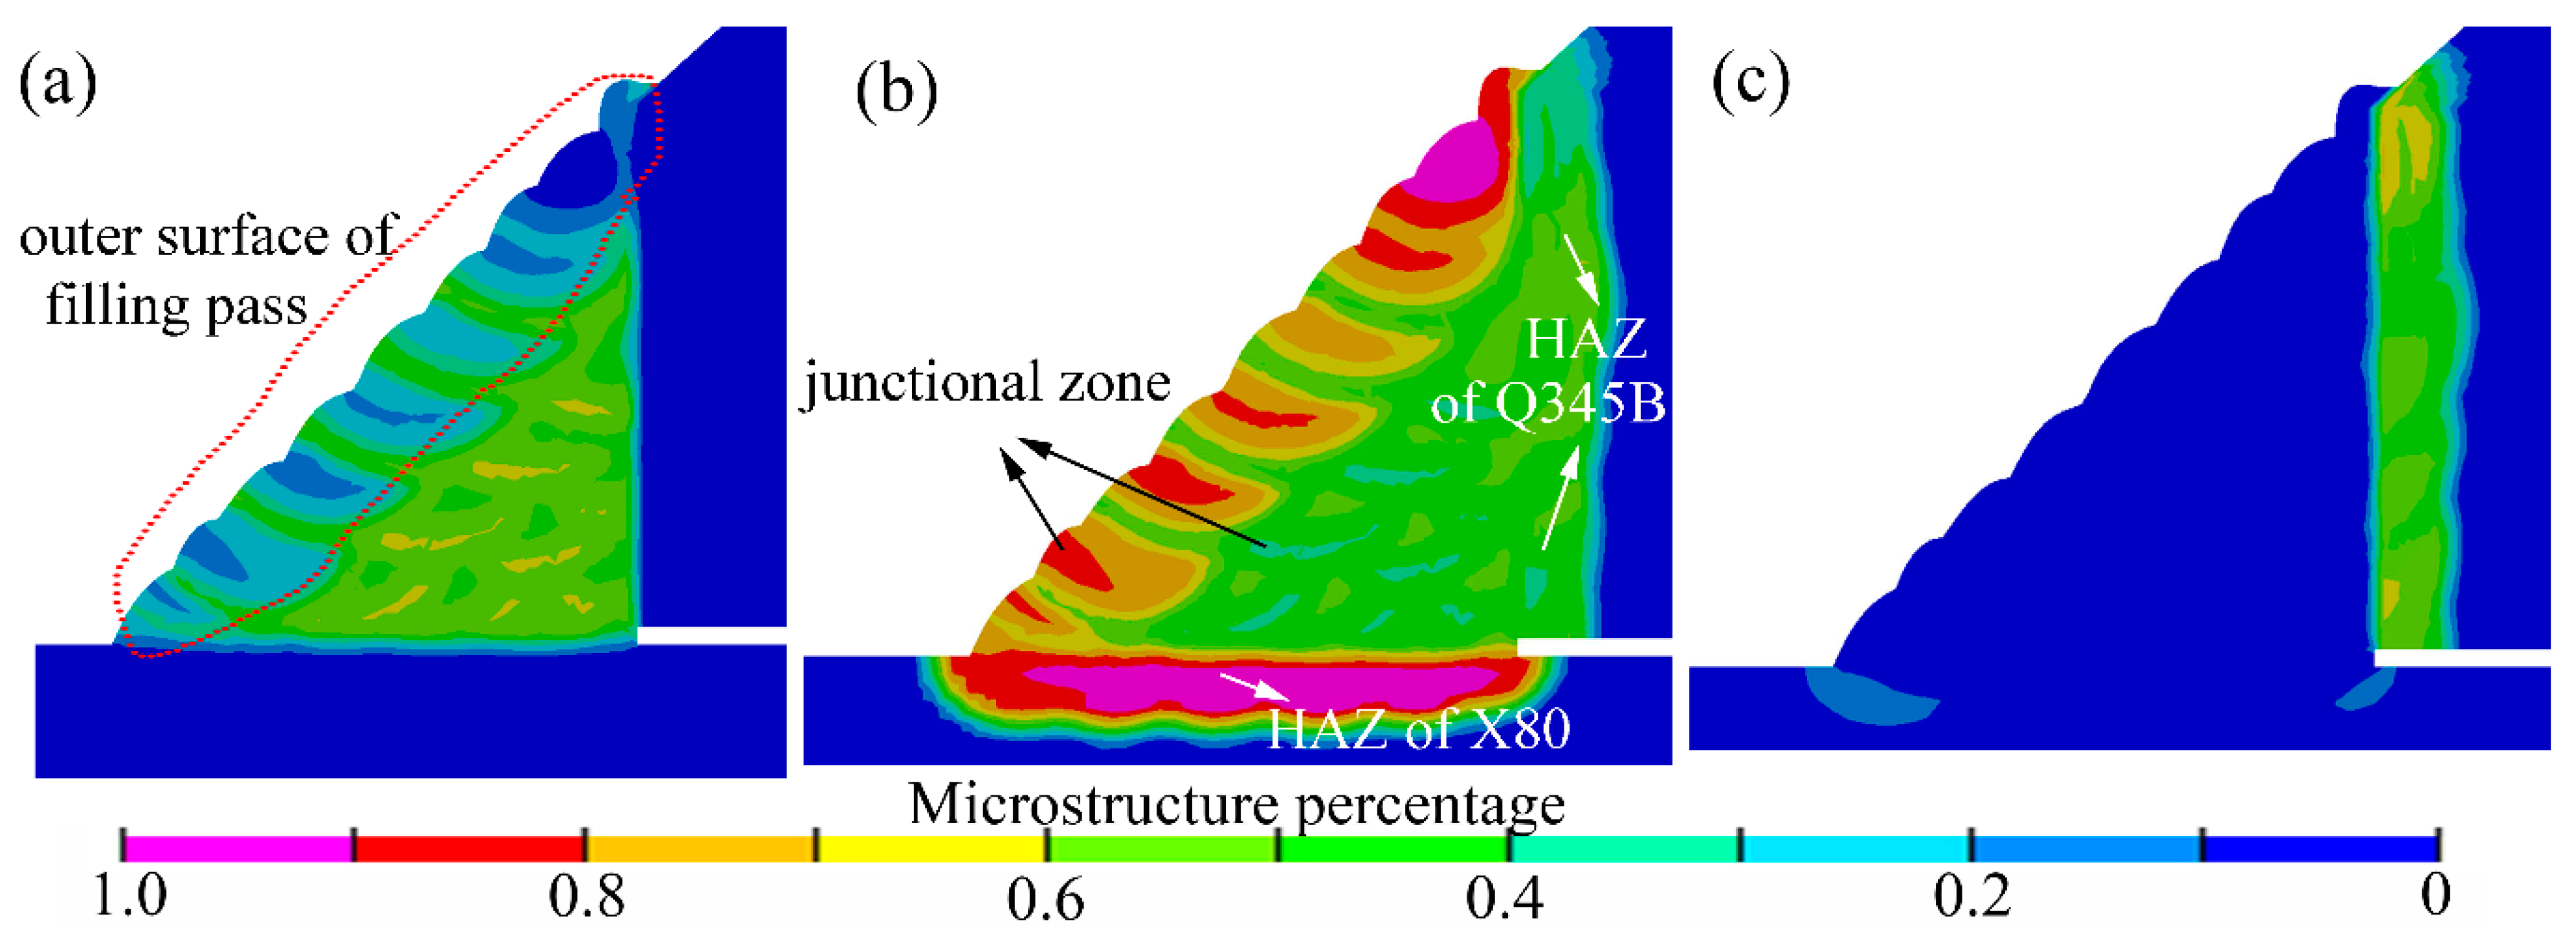
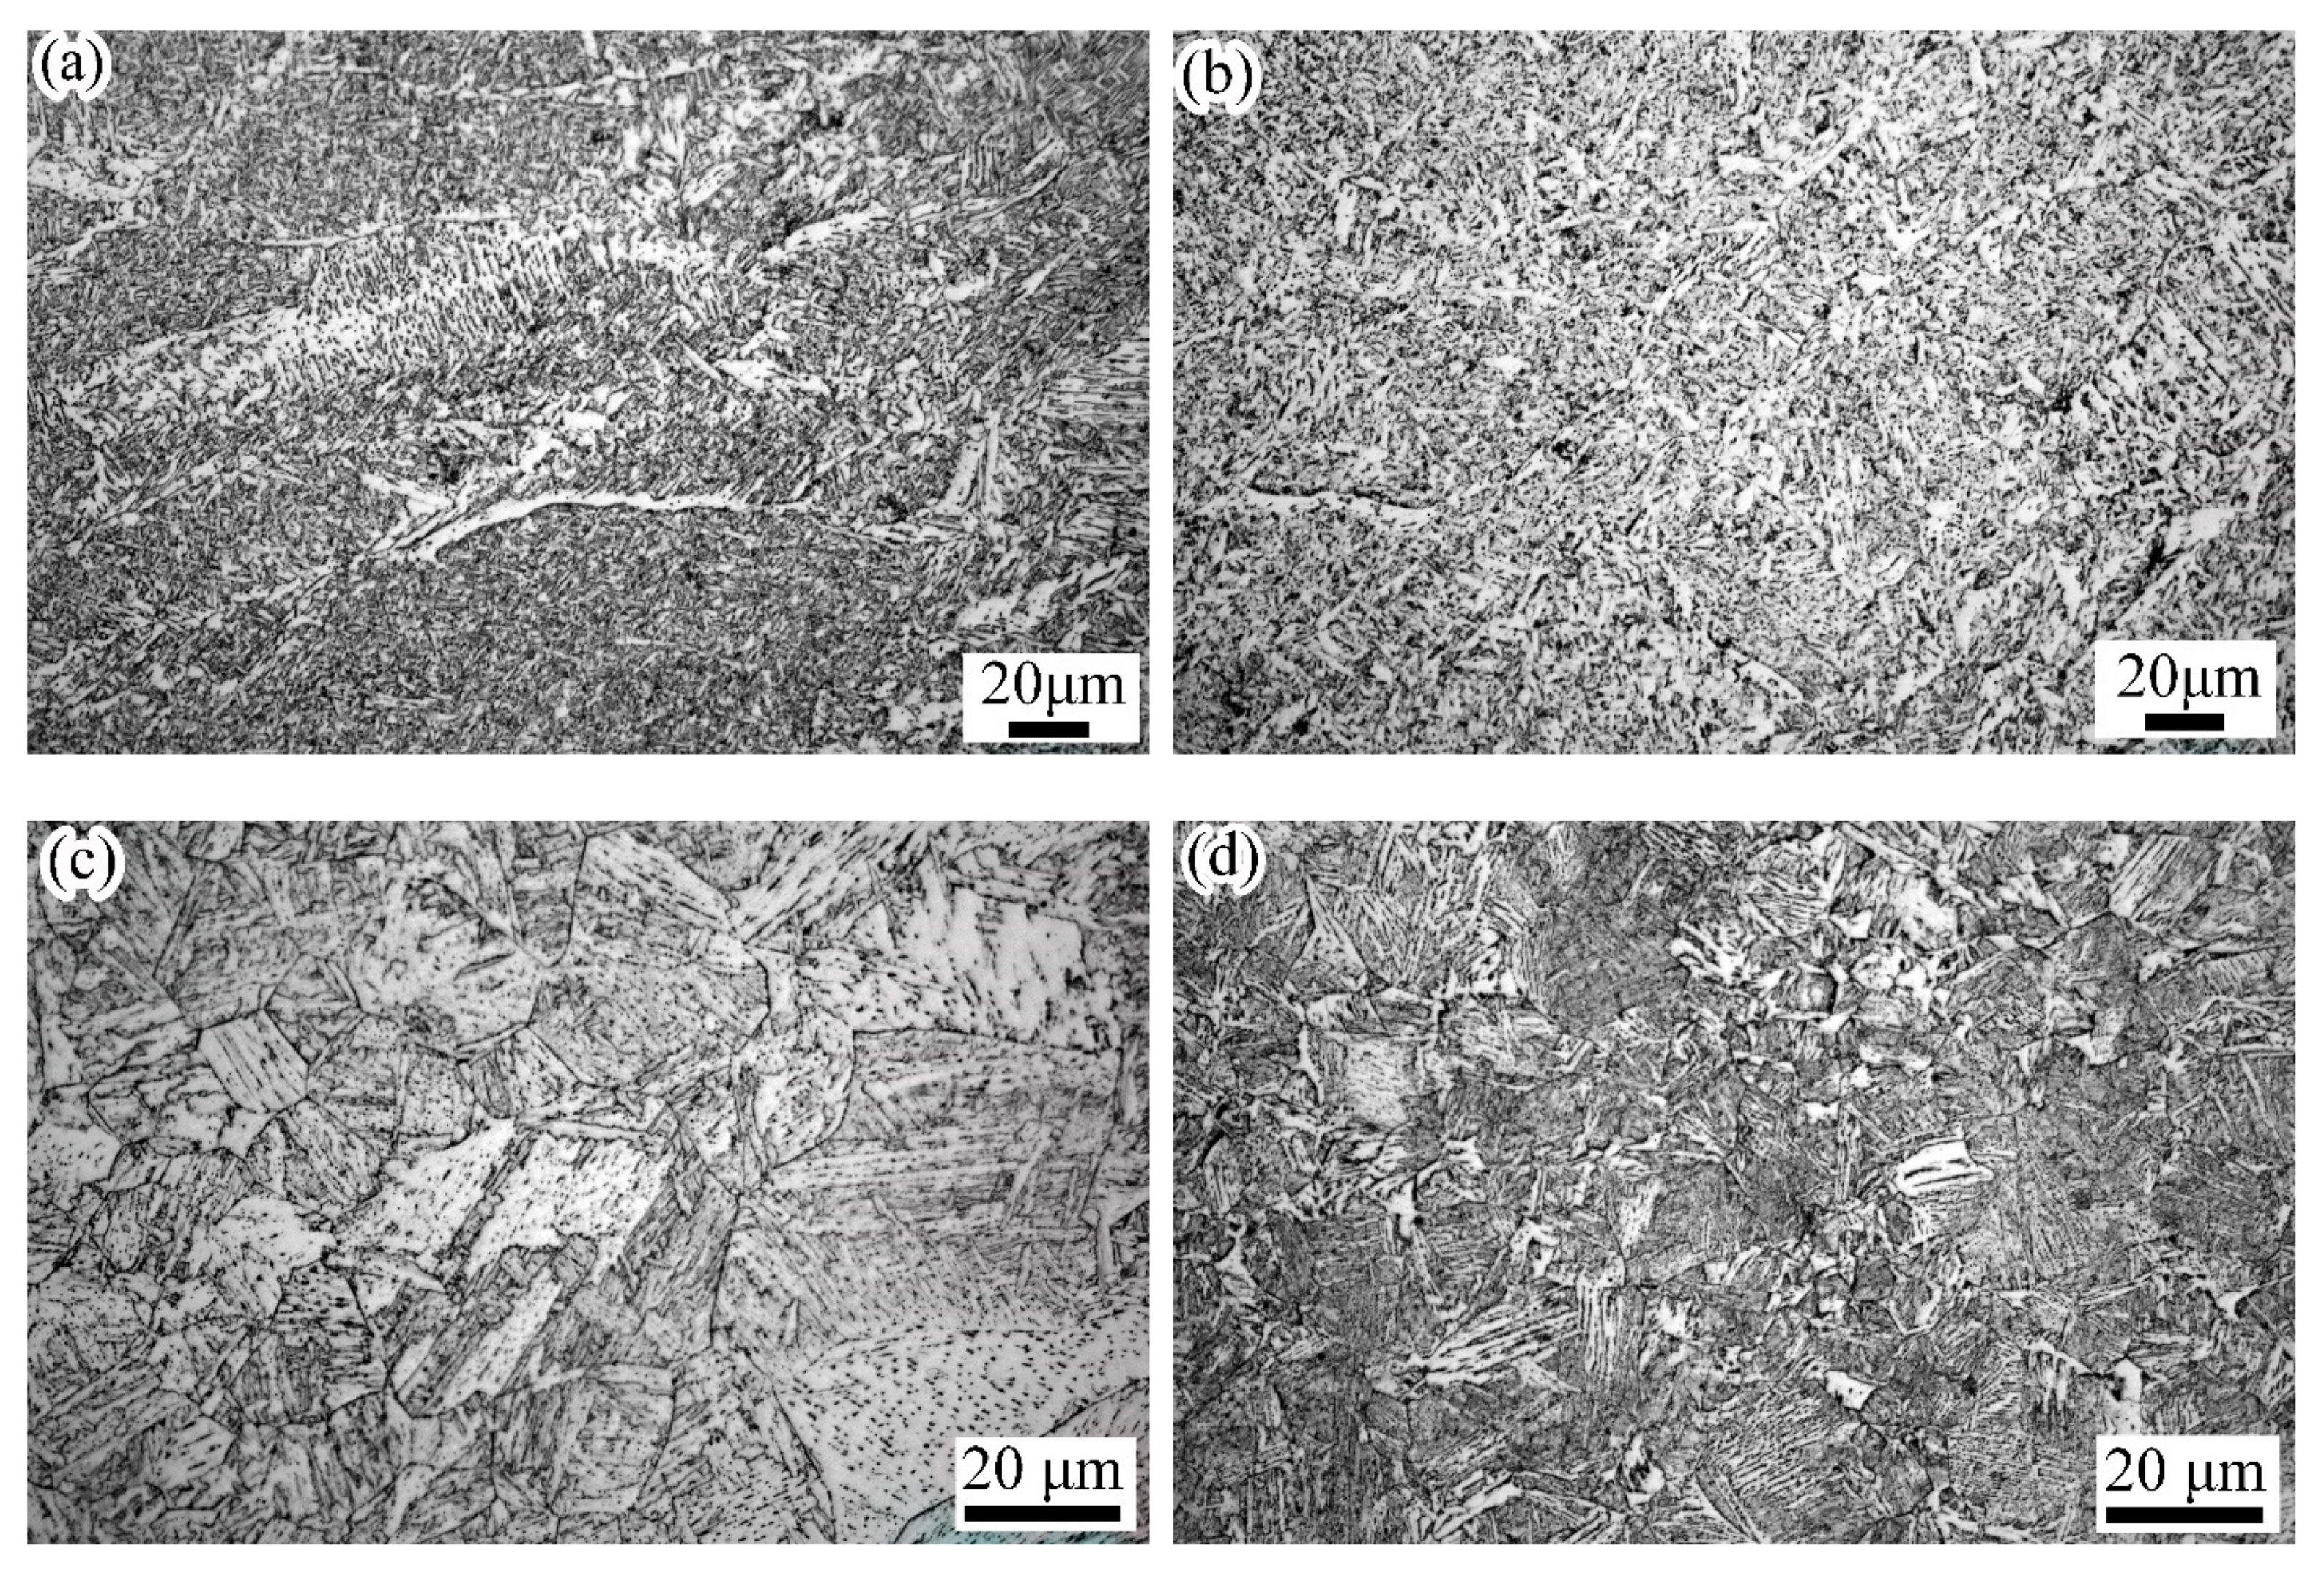
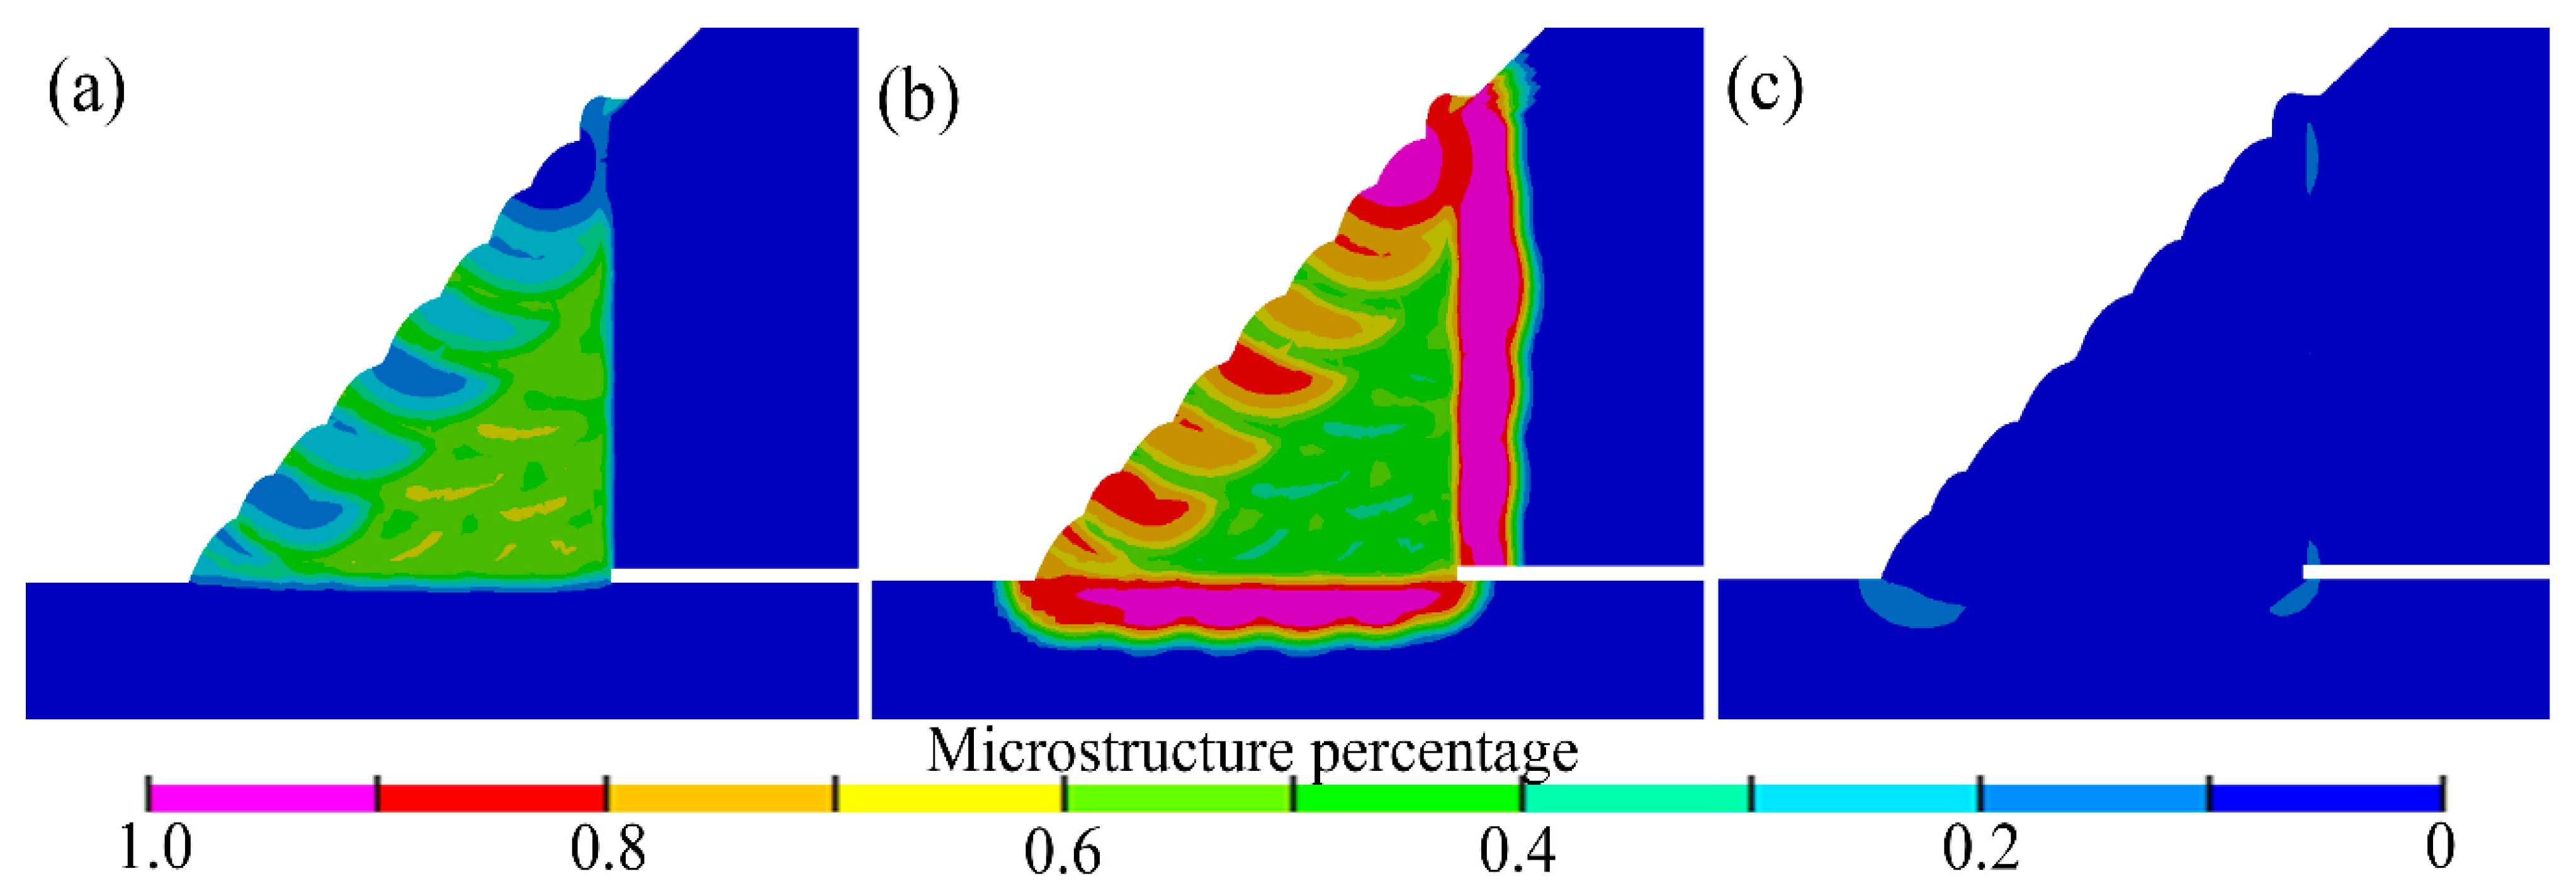
4.1. Temperature and Microstructure Fields Analysis
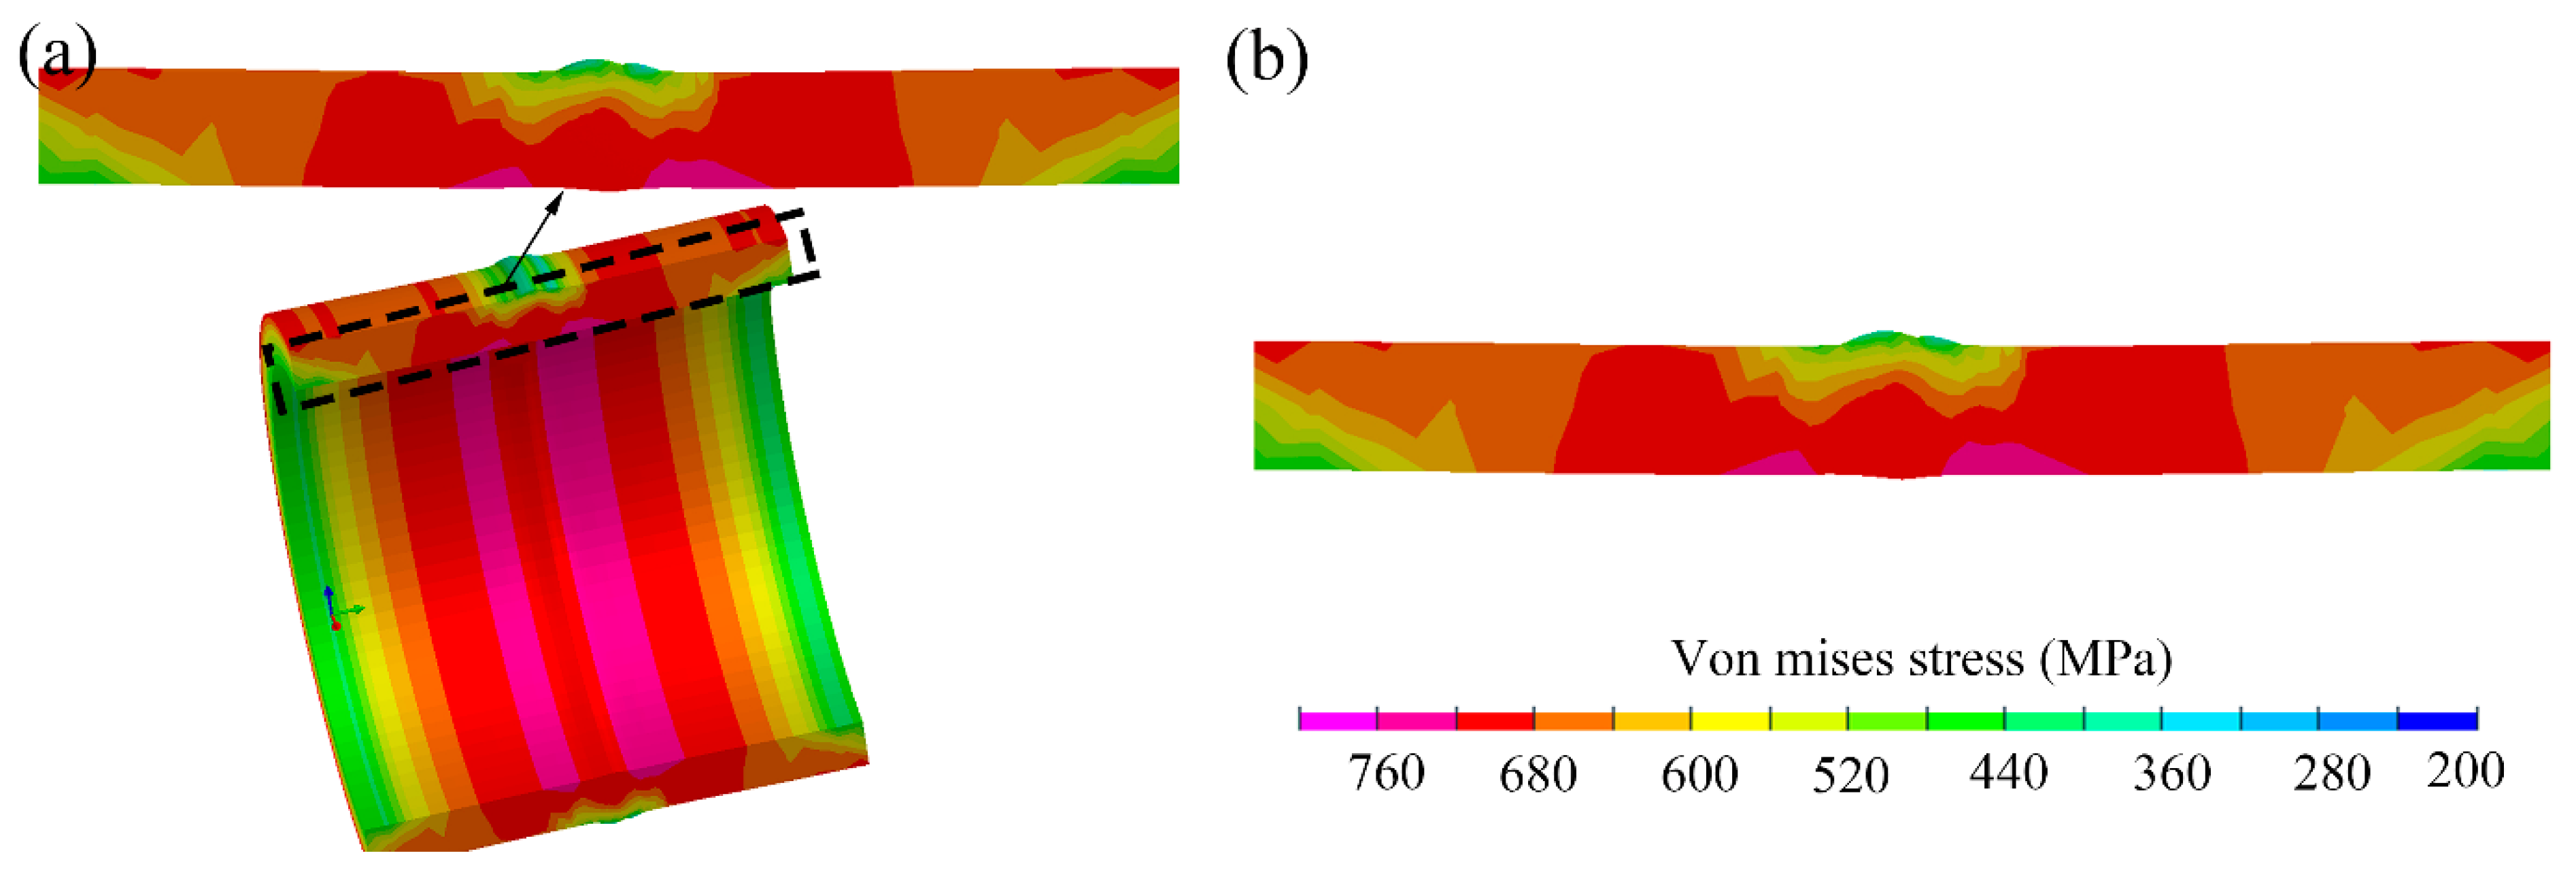
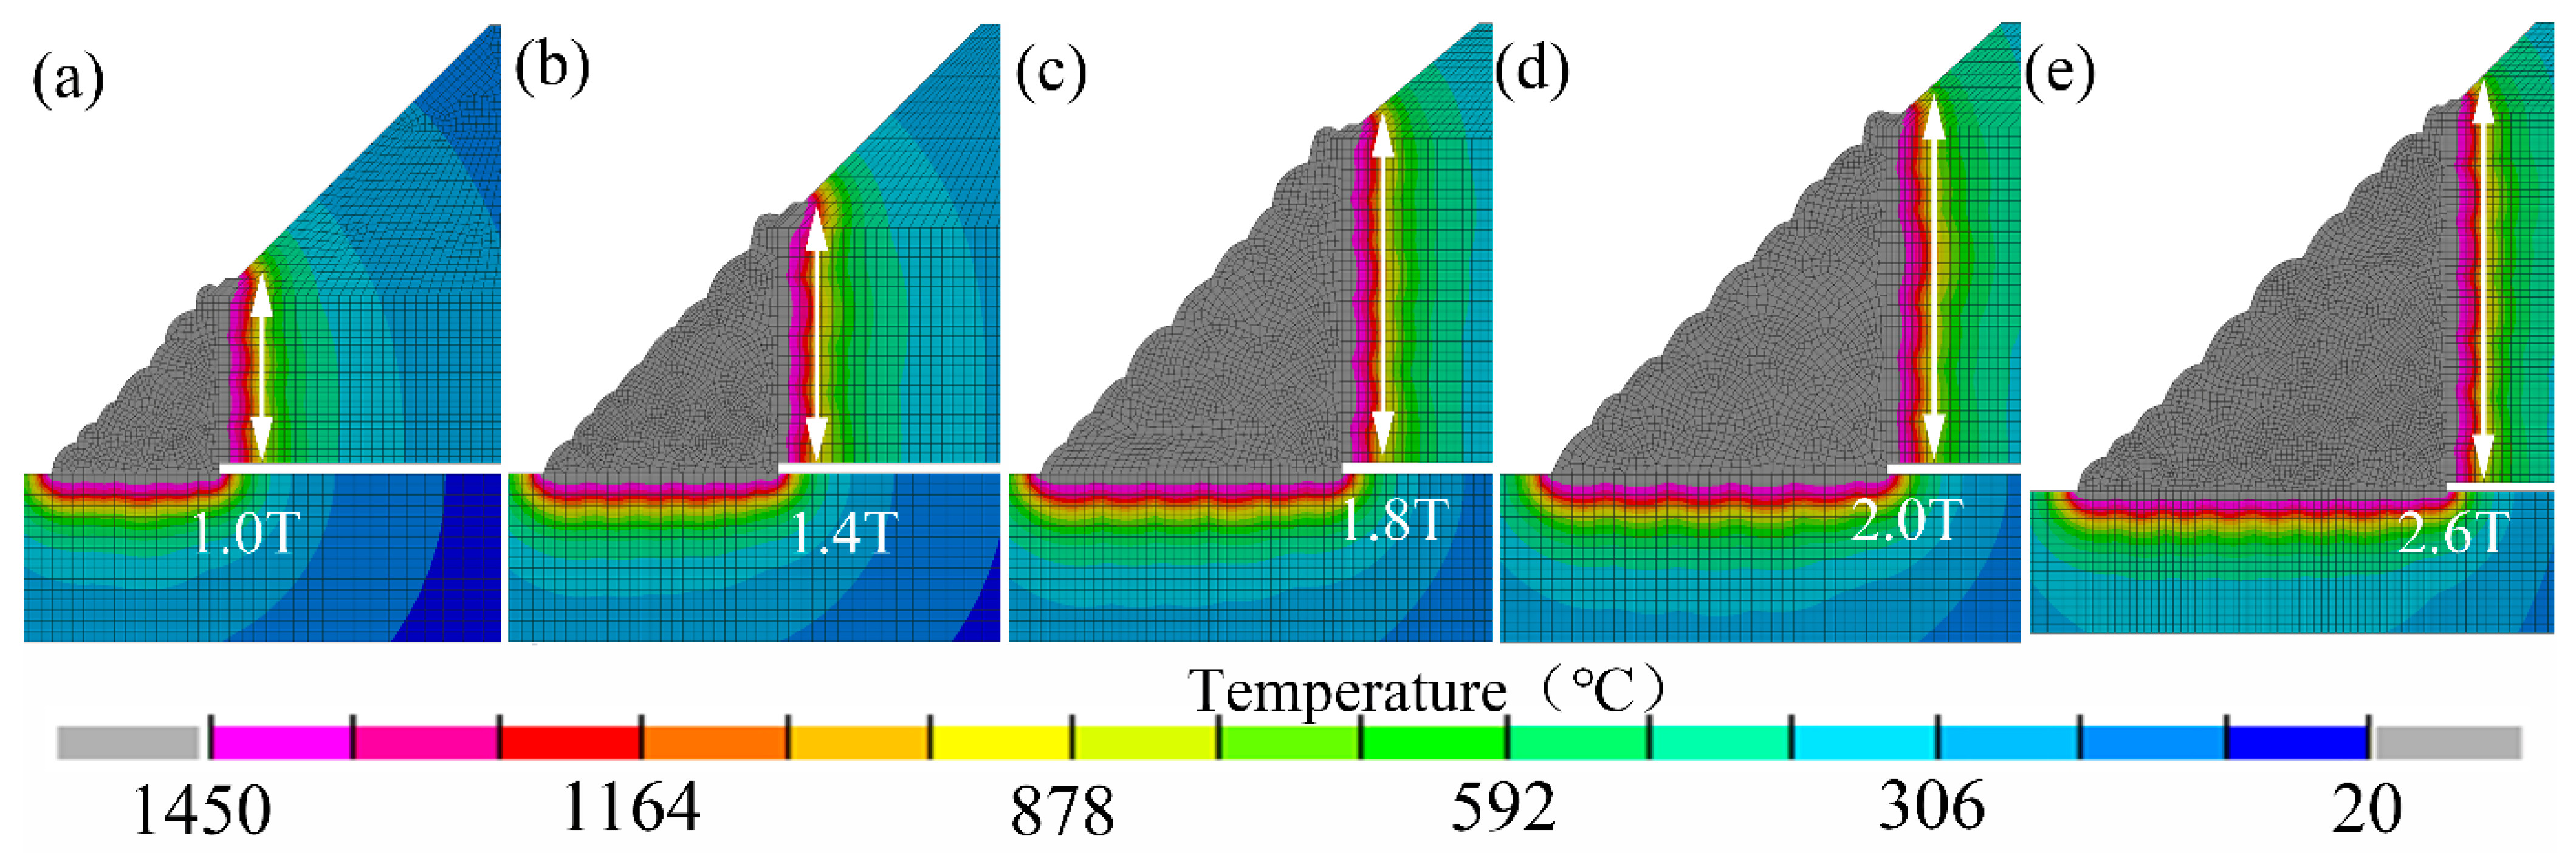
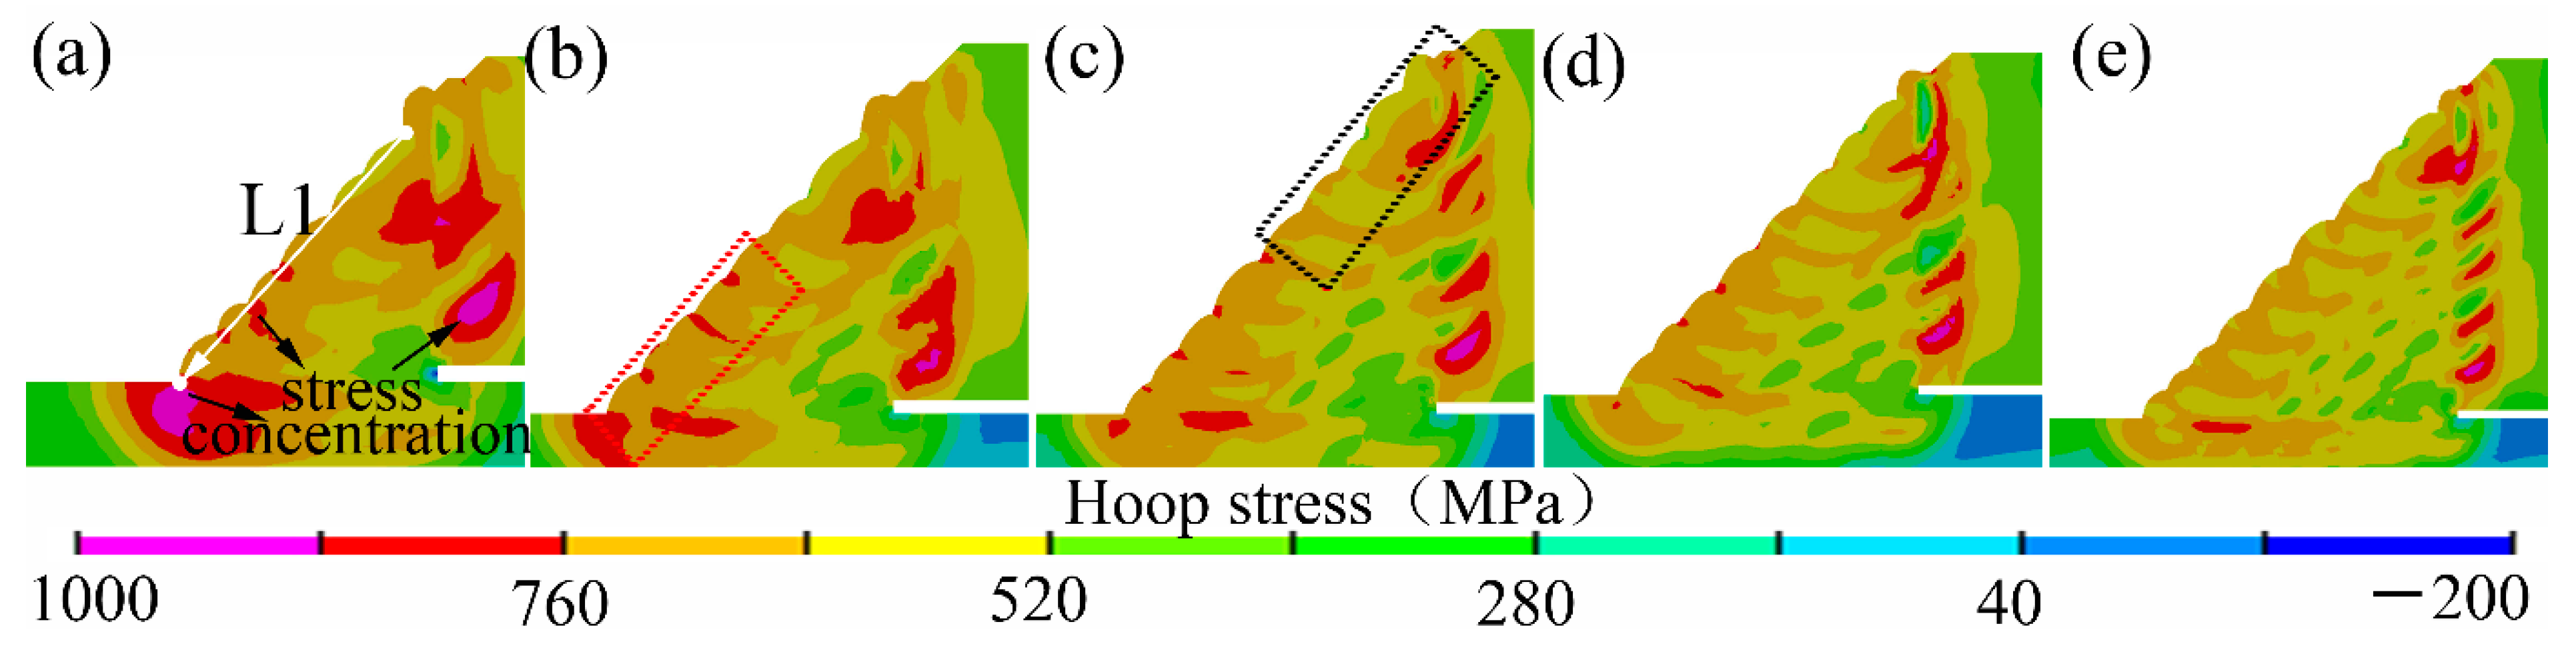
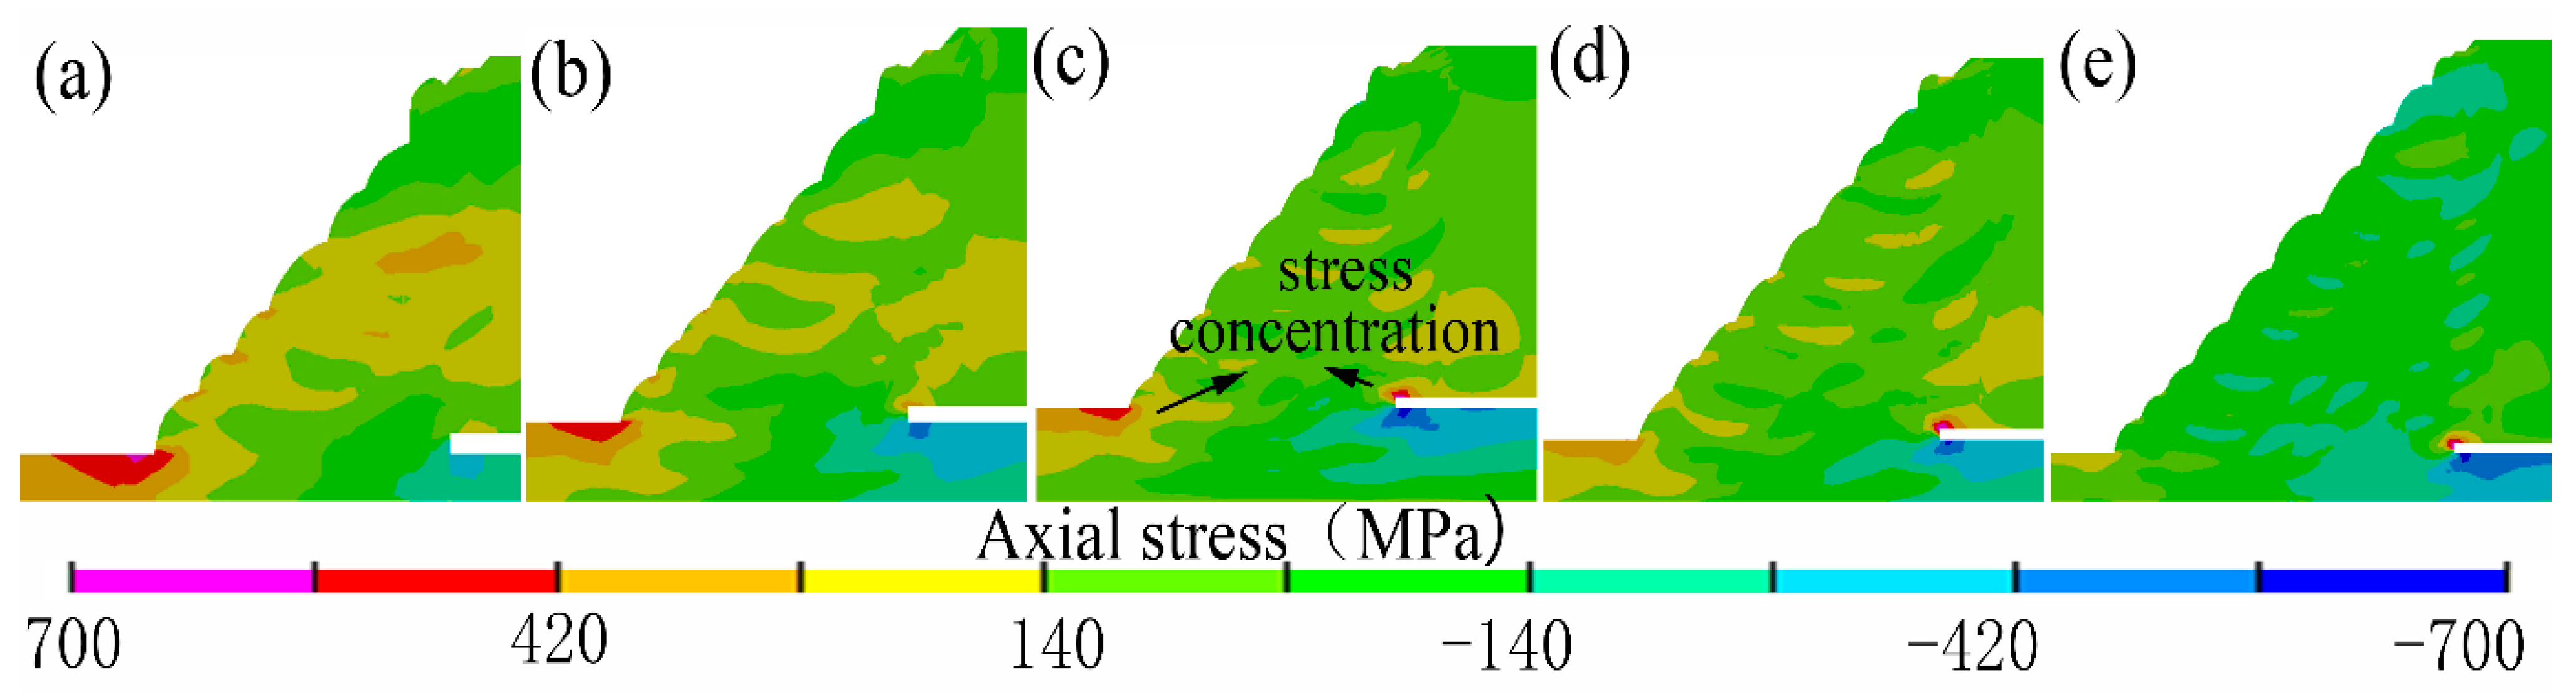
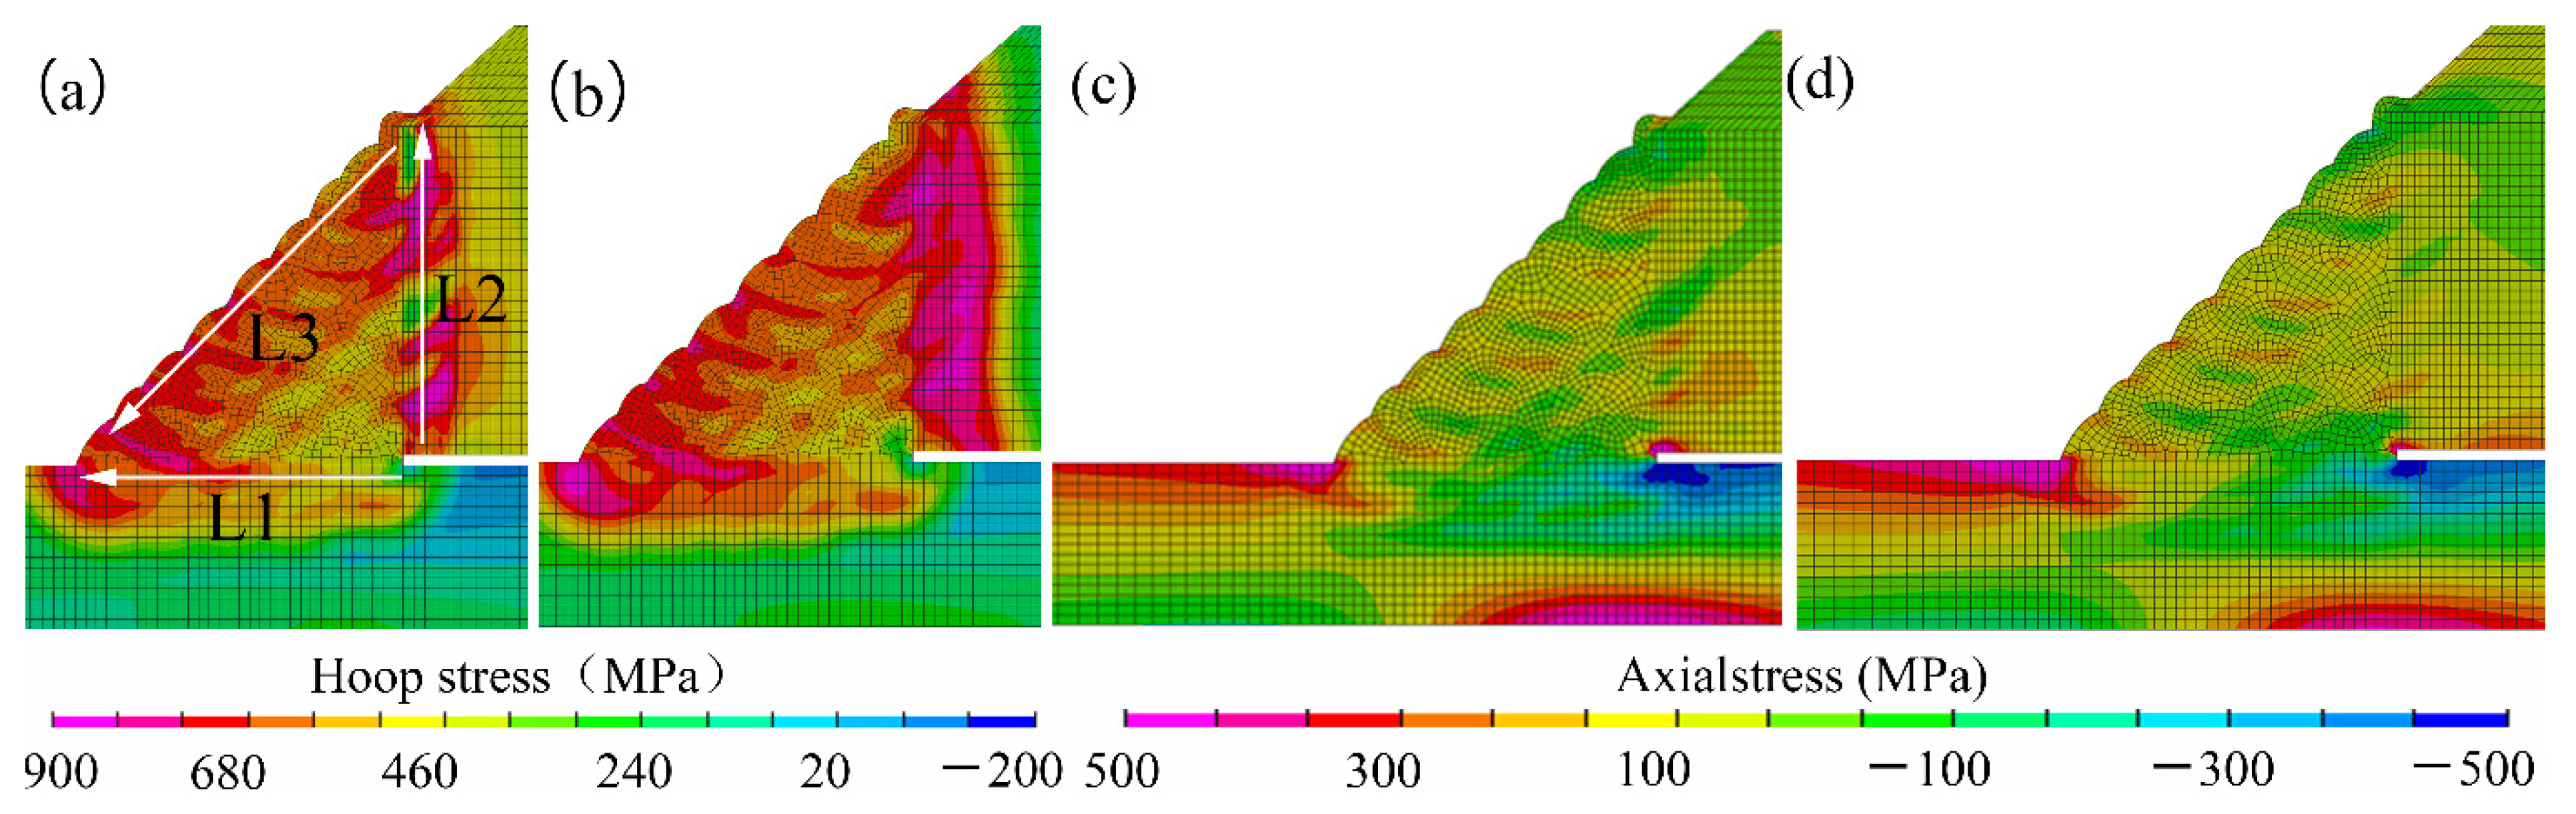
4.2. Effects of Fillet Weld Size on Welding Residual Stress
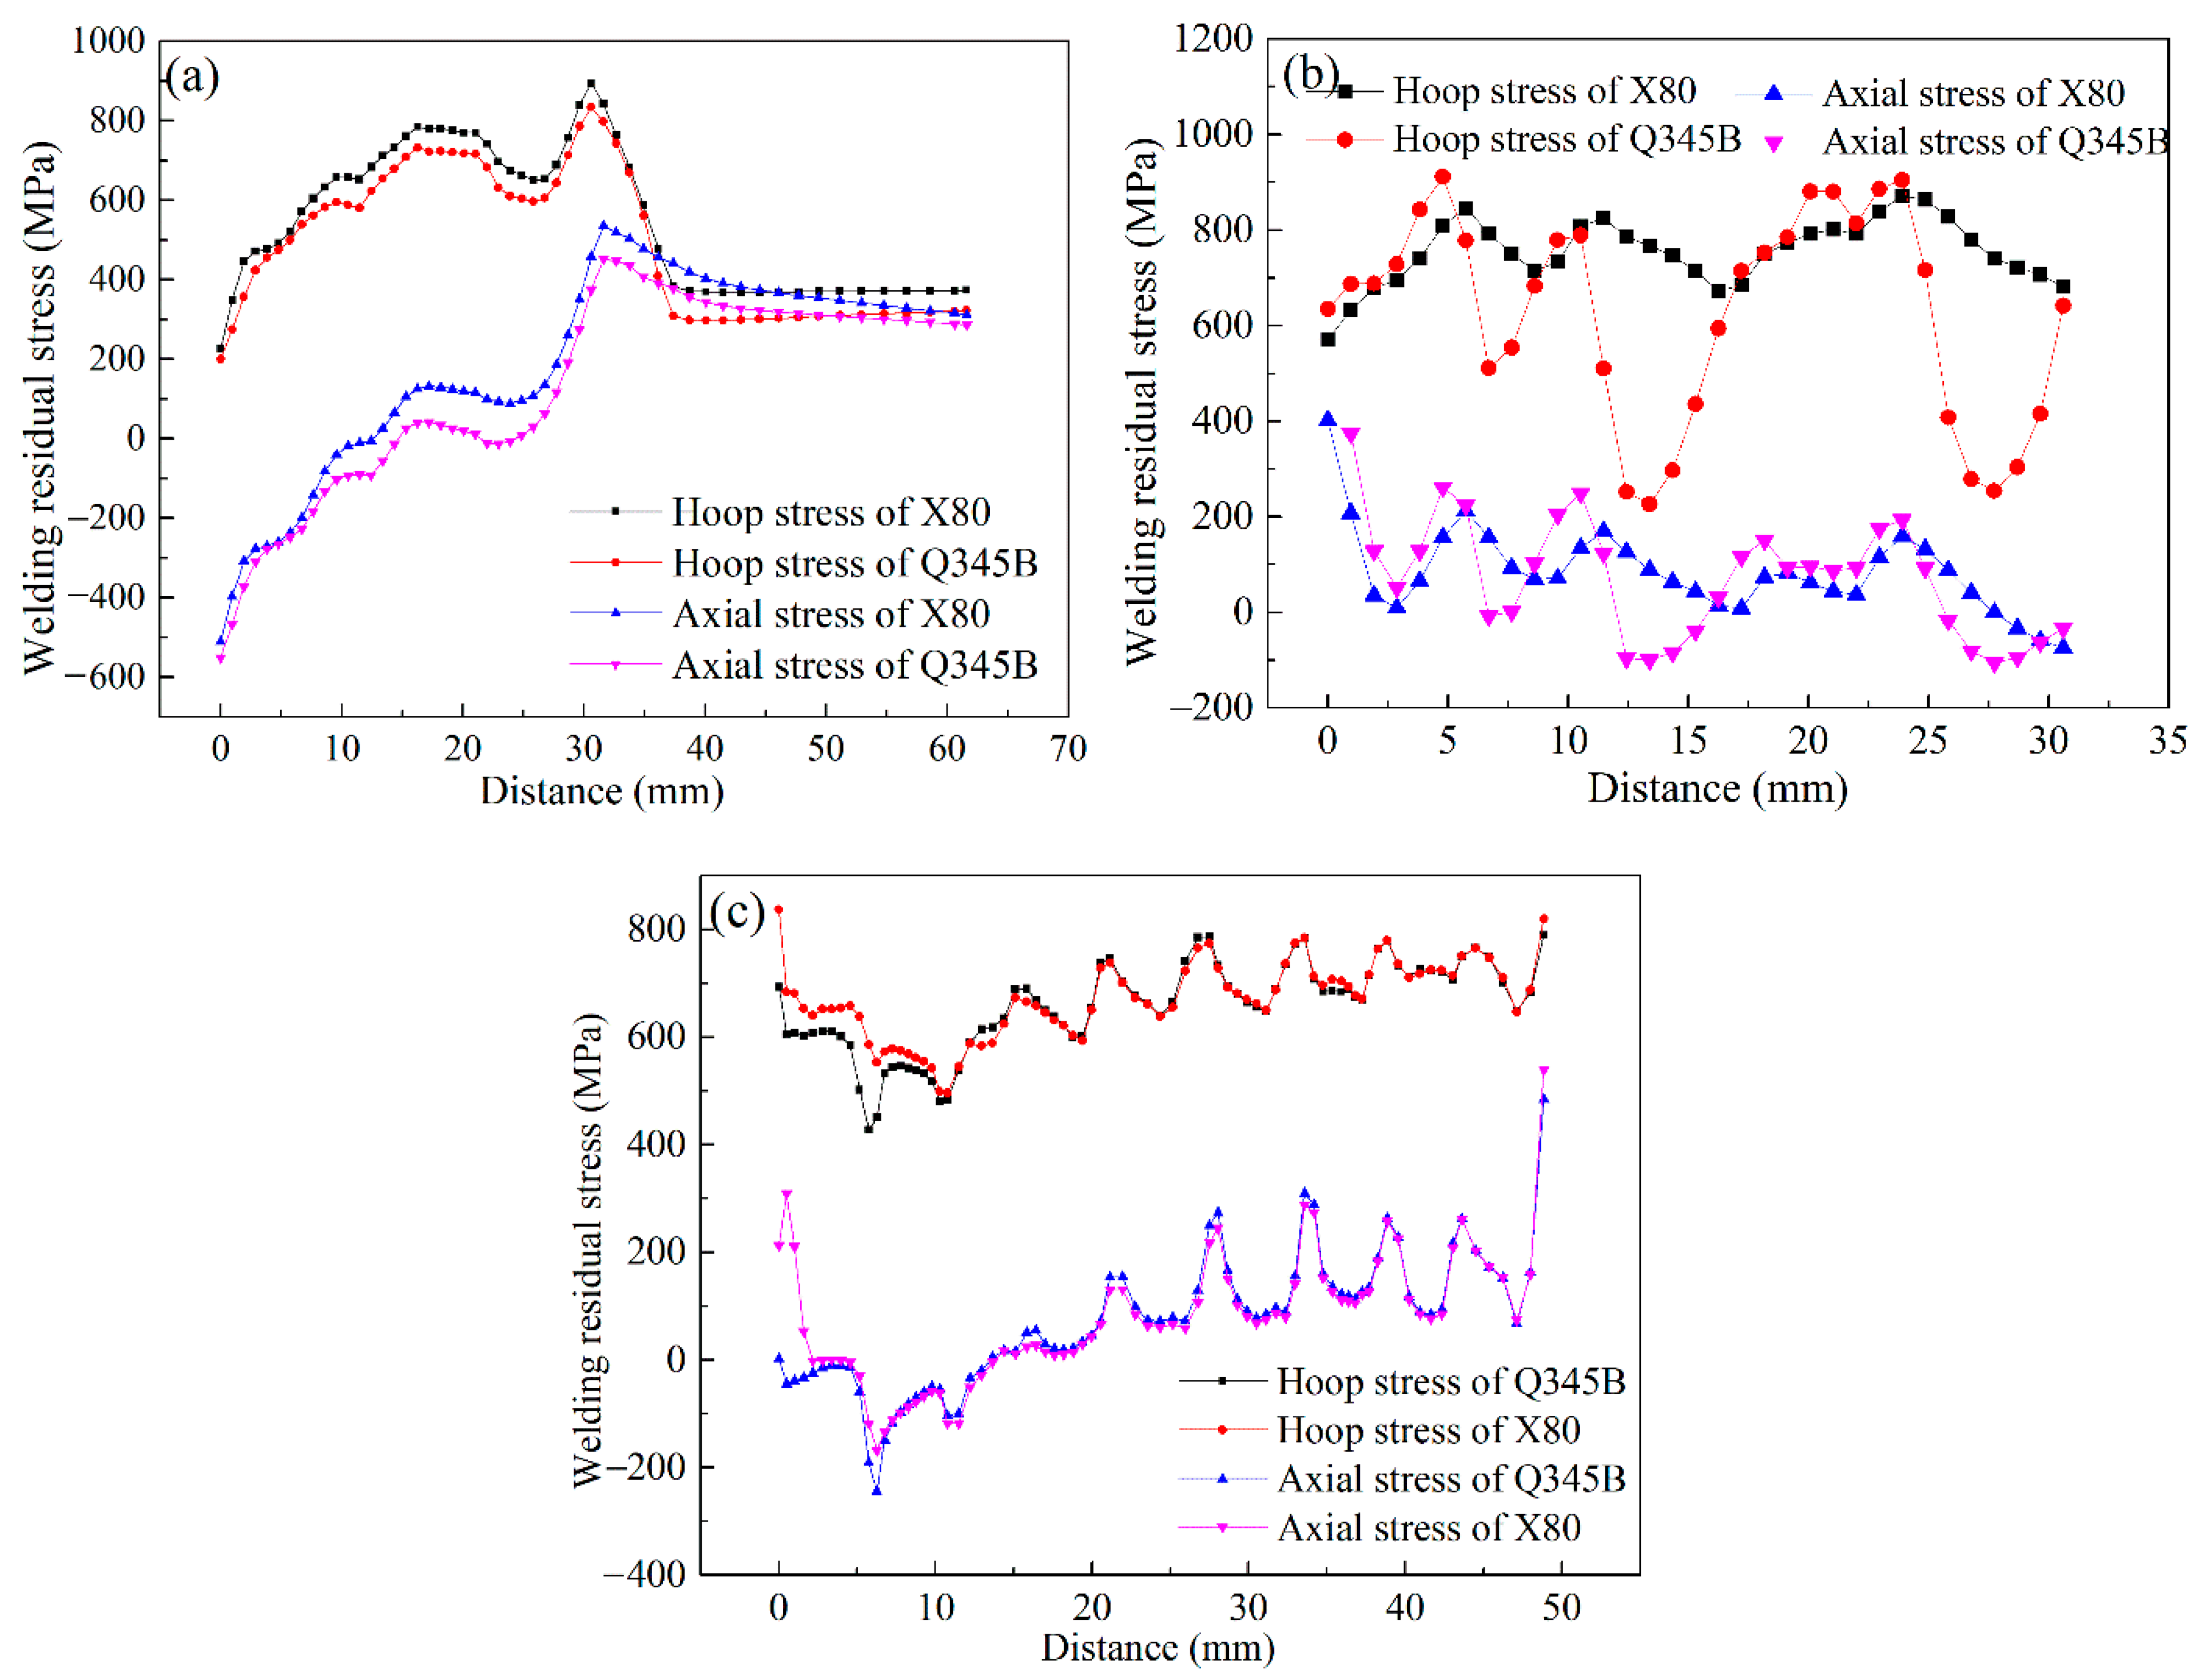
4.3. Effects of Sleeve Pipe Material on Microstructure and Residual Stress Distributions
5. Conclusions
Author Contributions
Funding
Institutional Review Board Statement
Informed Consent Statement
Data Availability Statement
Acknowledgments
Conflicts of Interest
References
- Sharma, S.K.; Maheshwari, S. A review on welding of high strength oil and gas pipeline steels. J. Nat. Gas Sci. Eng. 2016, 38, 203–217. [Google Scholar] [CrossRef]
- Bogatov, A.A. Crack Resistance of High-Strength Steel and Breakage of a Gas Pipeline. Metallurgist 2017, 61, 47–52. [Google Scholar] [CrossRef]
- Huo, C.; Li, H.; Zhang, W.W.; Yang, K.; Chi, Q.; Ma, Q.R. Crack control technology for the X80 large OD 1422 mm line pipes. Nat. Gas Ind. B 2017, 3, 479–484. [Google Scholar]
- Schipaanboord, W.N.; Marquering, J.; Bruce, W.A. Benefits of low-yield weld filler metals for safe welding on live gas transmission pipelines. Weld World 2014, 59, 97–118. [Google Scholar] [CrossRef]
- Zhang, W.; Li, H.; Qiang, C.; Zhao, X.; Yang, K. Technical specifications for X80 OD 1422 mm line pipes and corresponding products. Nat. Gas Ind. B 2016, 3, 485–492. [Google Scholar] [CrossRef]
- Soanes, T.; Bell, W.; Vibert, A.J. Optimising residual stresses at a repair in a steam header to tubeplate weld. Int. J. Press. Vessel. Pip. 2005, 82, 311–318. [Google Scholar] [CrossRef]
- Dong, P.; Hong, J.K.; Bouchard, P.J. Analysis of residual stresses at weld repairs. Int. J. Press. Vessel. Pip. 2005, 82, 258–269. [Google Scholar] [CrossRef]
- API 1104, Welding of Pipelines and Related Facilities. Appendix B: In-Service Welding. Available online: https://www.techstreet.com/api/standards/api-std-1104?product_id=2229358 (accessed on 1 December 2021).
- Deng, Q.S.; Zhao, W.M.; Jiang, W.; Zhang, T.M.; Li, T.T.; Zhao, Y.J. Hydrogen Embrittlement Susceptibility and Safety Control of Reheated CGHAZ in X80 Welded Pipeline. J. Mater. Eng. Perform. 2018, 27, 1654–1663. [Google Scholar] [CrossRef]
- Otegui, J.L.; Rivas, A.; Manfredi, C.; Martins, C. Weld failures in sleeve reinforcements of pipelines. Eng. Fail. Anal. 2001, 8, 57–73. [Google Scholar] [CrossRef]
- Huang, Z.Q.; Tang, H.P.; Ding, Y.P.; Wei, Q.W.; Xia, G.F. Numerical Simulations of temperature for the in-service welding of gas pipeline. J. Mater. Process. Technol. 2017, 248, 72–78. [Google Scholar] [CrossRef]
- Sun, J.M.; Hensel, J.; Nitschke-Pagel, T.; Dilger, K. Influence of Restraint Conditions on Welding Residual Stresses in H-Type Cracking Test Specimens. Materials 2019, 12, 2700. [Google Scholar] [CrossRef] [PubMed] [Green Version]
- Javadi, Y.; Sweeney, N.E.; Mohseni, E.; MacLeod, C.N.; Lines, D.; Vasilev, M.; Qiu, Z.; Mineo, C.; Pierce, S.G.; Gachagan, A. Investigating the effect of residual stress on hydrogen cracking in multi-pass robotic welding through process compatible non-destructive testing. J. Manuf. Process. 2021, 63, 80–87. [Google Scholar] [CrossRef]
- Hu, X.D.; Jiang, H.Y.; Luo, Y.; Jin, Q.; Peng, W.; Yi, C.M. A Study on Microstructure, Residual Stresses and Stress Corrosion Cracking of Repair Welding on 304 Stainless Steel: Part II-Effects of Reinforcement Height. Materials 2020, 13, 2434. [Google Scholar] [CrossRef]
- GB/T 31032-2014, Welding and Acceptance for Steel Pipepings and Pipelines. Available online: http://c.gb688.cn/bzgk/gb/showGb?type=online&hcno=DDB1AE5BB49DCDDFC9E9066C56D929D3 (accessed on 1 December 2021).
- ASME B31.8-2007, Gas Transmission and Distribution Piping Systems. Available online: https://www.asme.org/codes-standards/find-codes-standards/b31-8-gas-transmission-distribution-piping-systems (accessed on 1 December 2021).
- GB/T 28055-2011, Technical Standard for Hot Tapping and Plagging on Steel Pipeline. Available online: http://c.gb688.cn/bzgk/gb/showGb?type=online&hcno=A154F99A0231ECCC6AB28A35943173C8 (accessed on 1 December 2021).
- SYT6150-2011, Technical Standard of Tapping and Plagging on Steel Pipeline. Available online: http://std.samr.gov.cn/hb/search/stdHBDetailed?id=8B1827F2418DBB19E05397BE0A0AB44A (accessed on 1 December 2021).
- Zhang, H.J.; Wang, Y.; Han, T.; Bao, L.L.; Wu, Q.; Gu, S.W. Numerical and experimental investigation of the formation mechanism and the distribution of the welding residual stress induced by the hybrid laser arc welding of AH36 steel in a butt joint configuration. J. Manuf. Process. 2020, 51, 95–108. [Google Scholar] [CrossRef]
- Xu, J.; Jia, X.L.; Fan, Y.; Sun, Z.; Liu, A.M.; Zhang, C.H. A Comparison of 3D and Axi-Symmetric Models in Pipe Welding Simulation Process. Appl. Mech. Mater. 2014, 529, 277–281. [Google Scholar] [CrossRef]
- Alberg, H.; Berglund, D.; Ghosh, S.; Castro, J.C.; Lee, J.K. Comparison of an axisymmetric and a three-dimensional model for welding and stress relief heat treatment. Am. Inst. Phys. 2004, 712, 1230–1235. [Google Scholar]
- Pakkanen, J.; Vallant, R.; Kičin, M. Experimental investigation and numerical simulation of resistance spot welding for residual stress evaluation of dp1000 steel. Weld World 2016, 60, 393–402. [Google Scholar] [CrossRef]
- Brown, S.; Song, H. Finite element simulation of welding of large structures. Trans. ASME J. Eng. Ind. 1992, 114, 441–451. [Google Scholar] [CrossRef]
- Sun, S.N.; Yu, D.J.; Qiu, Y.; Dong, Y.Y.; Chen, X. Finite Element Simulation on Welding Process of Nuclear Reactor Pressure Vessel’s Inner Ring. Press. Vessel Technol. 2016, 33, 24–32. [Google Scholar]
- Goldak, J.; Chakravarti, A.; Bibby, M. A new finite element model for welding heat sources. Metall. Trans. B 1984, 15, 299–305. [Google Scholar] [CrossRef]
- Chen, Y.H.; Wang, Y.; Wang, Z.F. Numerical Simulation of Thermal Cycle of In-Service Welding on X70 Steel Gas Pipeline. Adv. Mater. Res. 2009, 79-82, 1169–1172. [Google Scholar] [CrossRef]
- Zhao, W.M.; Jiang, W.; Zhang, H.J.; Han, B.; Jin, H.C.; Gao, Q. 3D finite element analysis and optimization of welding residual stress in the girth joints of X80 steel pipeline. J. Manuf. Process. 2021, 66, 166–178. [Google Scholar] [CrossRef]
- Li, S.; Ren, S.D.; Zhang, Y.B.; Deng, D.A.; Murakawab, H. Numerical investigation of formation mechanism of welding residual stress in P92 steel multi-pass joints. J. Mater. Process. Technol. 2017, 244, 240–252. [Google Scholar] [CrossRef]
- Fortunier, R.; Leblond, J.B.; Bergheau, J.M. A numerical model for multiple phase transformations in steels during thermal processes. J. Shanghai Jiaotong Univ. 2000, E-5, 213–220. [Google Scholar]
- Alian, A.R.; Shazly, M.; Megahed, M.M. 3D finite element modeling of in-service sleeve repair welding of gas pipelines. Int. J. Press. Vessel. Pip. 2016, 146, 216–229. [Google Scholar] [CrossRef]
- Wang, Y.; Wang, L.; Di, X.; Shi, Y.; Bao, X. Simulation and analysis of temperature field for in-service multi-pass welding of a sleeve fillet weld. Comput. Mater. Sci. 2013, 68, 198–205. [Google Scholar] [CrossRef]
- Deng, D.A.; Zhang, C.H.; Pu, X.W.; Liang, W. Influence of Material Model on Prediction Accuracy of Welding Residual Stress in an Austenitic Stainless Steel Multi-pass Butt-Welded Joint. J. Mater. Eng. Perform. 2017, 26, 1494–1505. [Google Scholar] [CrossRef]
- Zerbst, U. Application of fracture mechanics to welds with crack origin at the weld toe: A review Part 1: Consequences of inhomogeneous microstructure for materials testing and failure assessment. Weld World 2019, 63, 1–18. [Google Scholar] [CrossRef]
- Schork, B.; Kucharczyk, P.; Madia, M.; Zerbst, U.; Hensel, J.; Bernhard, J.; Tchuindjang, D.; Kaffenberger, M.; Oechsner, M. The effect of the local and global weld geometry as well as material defects on crack initiation and fatigue strength. Eng. Fract. Mech. 2018, 198, 103–122. [Google Scholar] [CrossRef]
- Zerbst, U. Application of fracture mechanics to welds with crack origin at the weld toe-a review. Part 2: Welding residual stresses. Residual and total life assessment. Weld World 2020, 64, 151–169. [Google Scholar] [CrossRef]
- Farajian, M. Welding residual stress behavior under mechanical loading. Weld World 2013, 57, 157–169. [Google Scholar] [CrossRef]


| Material | C | Si | Mn | S | P | Cr | Ni | Mo | V |
|---|---|---|---|---|---|---|---|---|---|
| X80 | 0.12 | 0.45 | 1.85 | 0.025 | 0.015 | -- | 0.013 | -- | <0.012 |
| Q345B | 0.20 | 0.55 | 1.48 | 0.013 | 0.0071 | -- | -- | -- | -- |
| E5515-G | 0.090 | 0.45 | 1.81 | 0.013 | 0.0081 | 0.034 | 0.018 | 0.18 | 0.010 |
| Material | Tensile Strengh (MPa) | Yield Strength (MPa) | Elongation (%) | Charpy Impact Energy (J) |
|---|---|---|---|---|
| X80 | 625–825 | 555–690 | ≥14.5 | -- |
| Q345B | ≥510 | ≥345 | ≥21 | >34 (0 °C) |
| E5515-G | ≥550 | ≥460 | ≥17 | 102, 96, 94 (−30 °C) |
| Welding Passes | Welding Voltage (V) | Welding Current (A) | Welding Speed (cm/min) | Heat Input (KJ/mm) |
|---|---|---|---|---|
| Overlaying/temper pass | 22–28 | 100–130 | 10–16 | 0.7–1.7 |
| Root pass | 22–28 | 100–130 | 6–15 | 0.7–3.0 |
| Filling pass | 22–28 | 100–130 | 6–15 | 0.7–3.0 |
| Annealing pass | 22–28 | 100–130 | 10–15 | 0.7–1.7 |
| Welding Pass Number | 1 | 2 | 3 | 4 | 5 |
|---|---|---|---|---|---|
| Numerical penetration (mm) | 1.2 | 1.25 | 1.3 | 1.28 | 1.15 |
| Experimental penetration (mm) | 1.3 | 0.5 | 1.6 | 1.32 | 1.07 |
| Point | a | b | c | d | e | f |
|---|---|---|---|---|---|---|
| Hardness (HV10) | 277.3 | 254.9 | 255.3 | 250.8 | 239.8 | 255.1 |
| Point | g | h | i | j | k | l |
| Hardness (HV10) | 289.7 | 285.7 | 279.5 | 279.5 | 269.6 | 272.3 |
| Case | A | B | C | D | E |
|---|---|---|---|---|---|
| Welding fillet size | 1.0 T | 1.4 T | 1.8 T | 2.0 T | 2.6 T |
Publisher’s Note: MDPI stays neutral with regard to jurisdictional claims in published maps and institutional affiliations. |
© 2021 by the authors. Licensee MDPI, Basel, Switzerland. This article is an open access article distributed under the terms and conditions of the Creative Commons Attribution (CC BY) license (https://creativecommons.org/licenses/by/4.0/).
Share and Cite
Zhang, H.; Han, T.; Wang, Y.; Wu, Q. Effects of Fillet Weld Size and Sleeve Material Strength on the Residual Stress Distribution and Structural Safety While Implementing the New Sleeve Repair Process. Materials 2021, 14, 7463. https://doi.org/10.3390/ma14237463
Zhang H, Han T, Wang Y, Wu Q. Effects of Fillet Weld Size and Sleeve Material Strength on the Residual Stress Distribution and Structural Safety While Implementing the New Sleeve Repair Process. Materials. 2021; 14(23):7463. https://doi.org/10.3390/ma14237463
Chicago/Turabian StyleZhang, Hongjie, Tao Han, Yong Wang, and Qian Wu. 2021. "Effects of Fillet Weld Size and Sleeve Material Strength on the Residual Stress Distribution and Structural Safety While Implementing the New Sleeve Repair Process" Materials 14, no. 23: 7463. https://doi.org/10.3390/ma14237463
APA StyleZhang, H., Han, T., Wang, Y., & Wu, Q. (2021). Effects of Fillet Weld Size and Sleeve Material Strength on the Residual Stress Distribution and Structural Safety While Implementing the New Sleeve Repair Process. Materials, 14(23), 7463. https://doi.org/10.3390/ma14237463