
Hydrothermal Treatment of Arsenopyrite Particles with CuSO4 Solution


Abstract
:1. Introduction
2. Materials and Methods
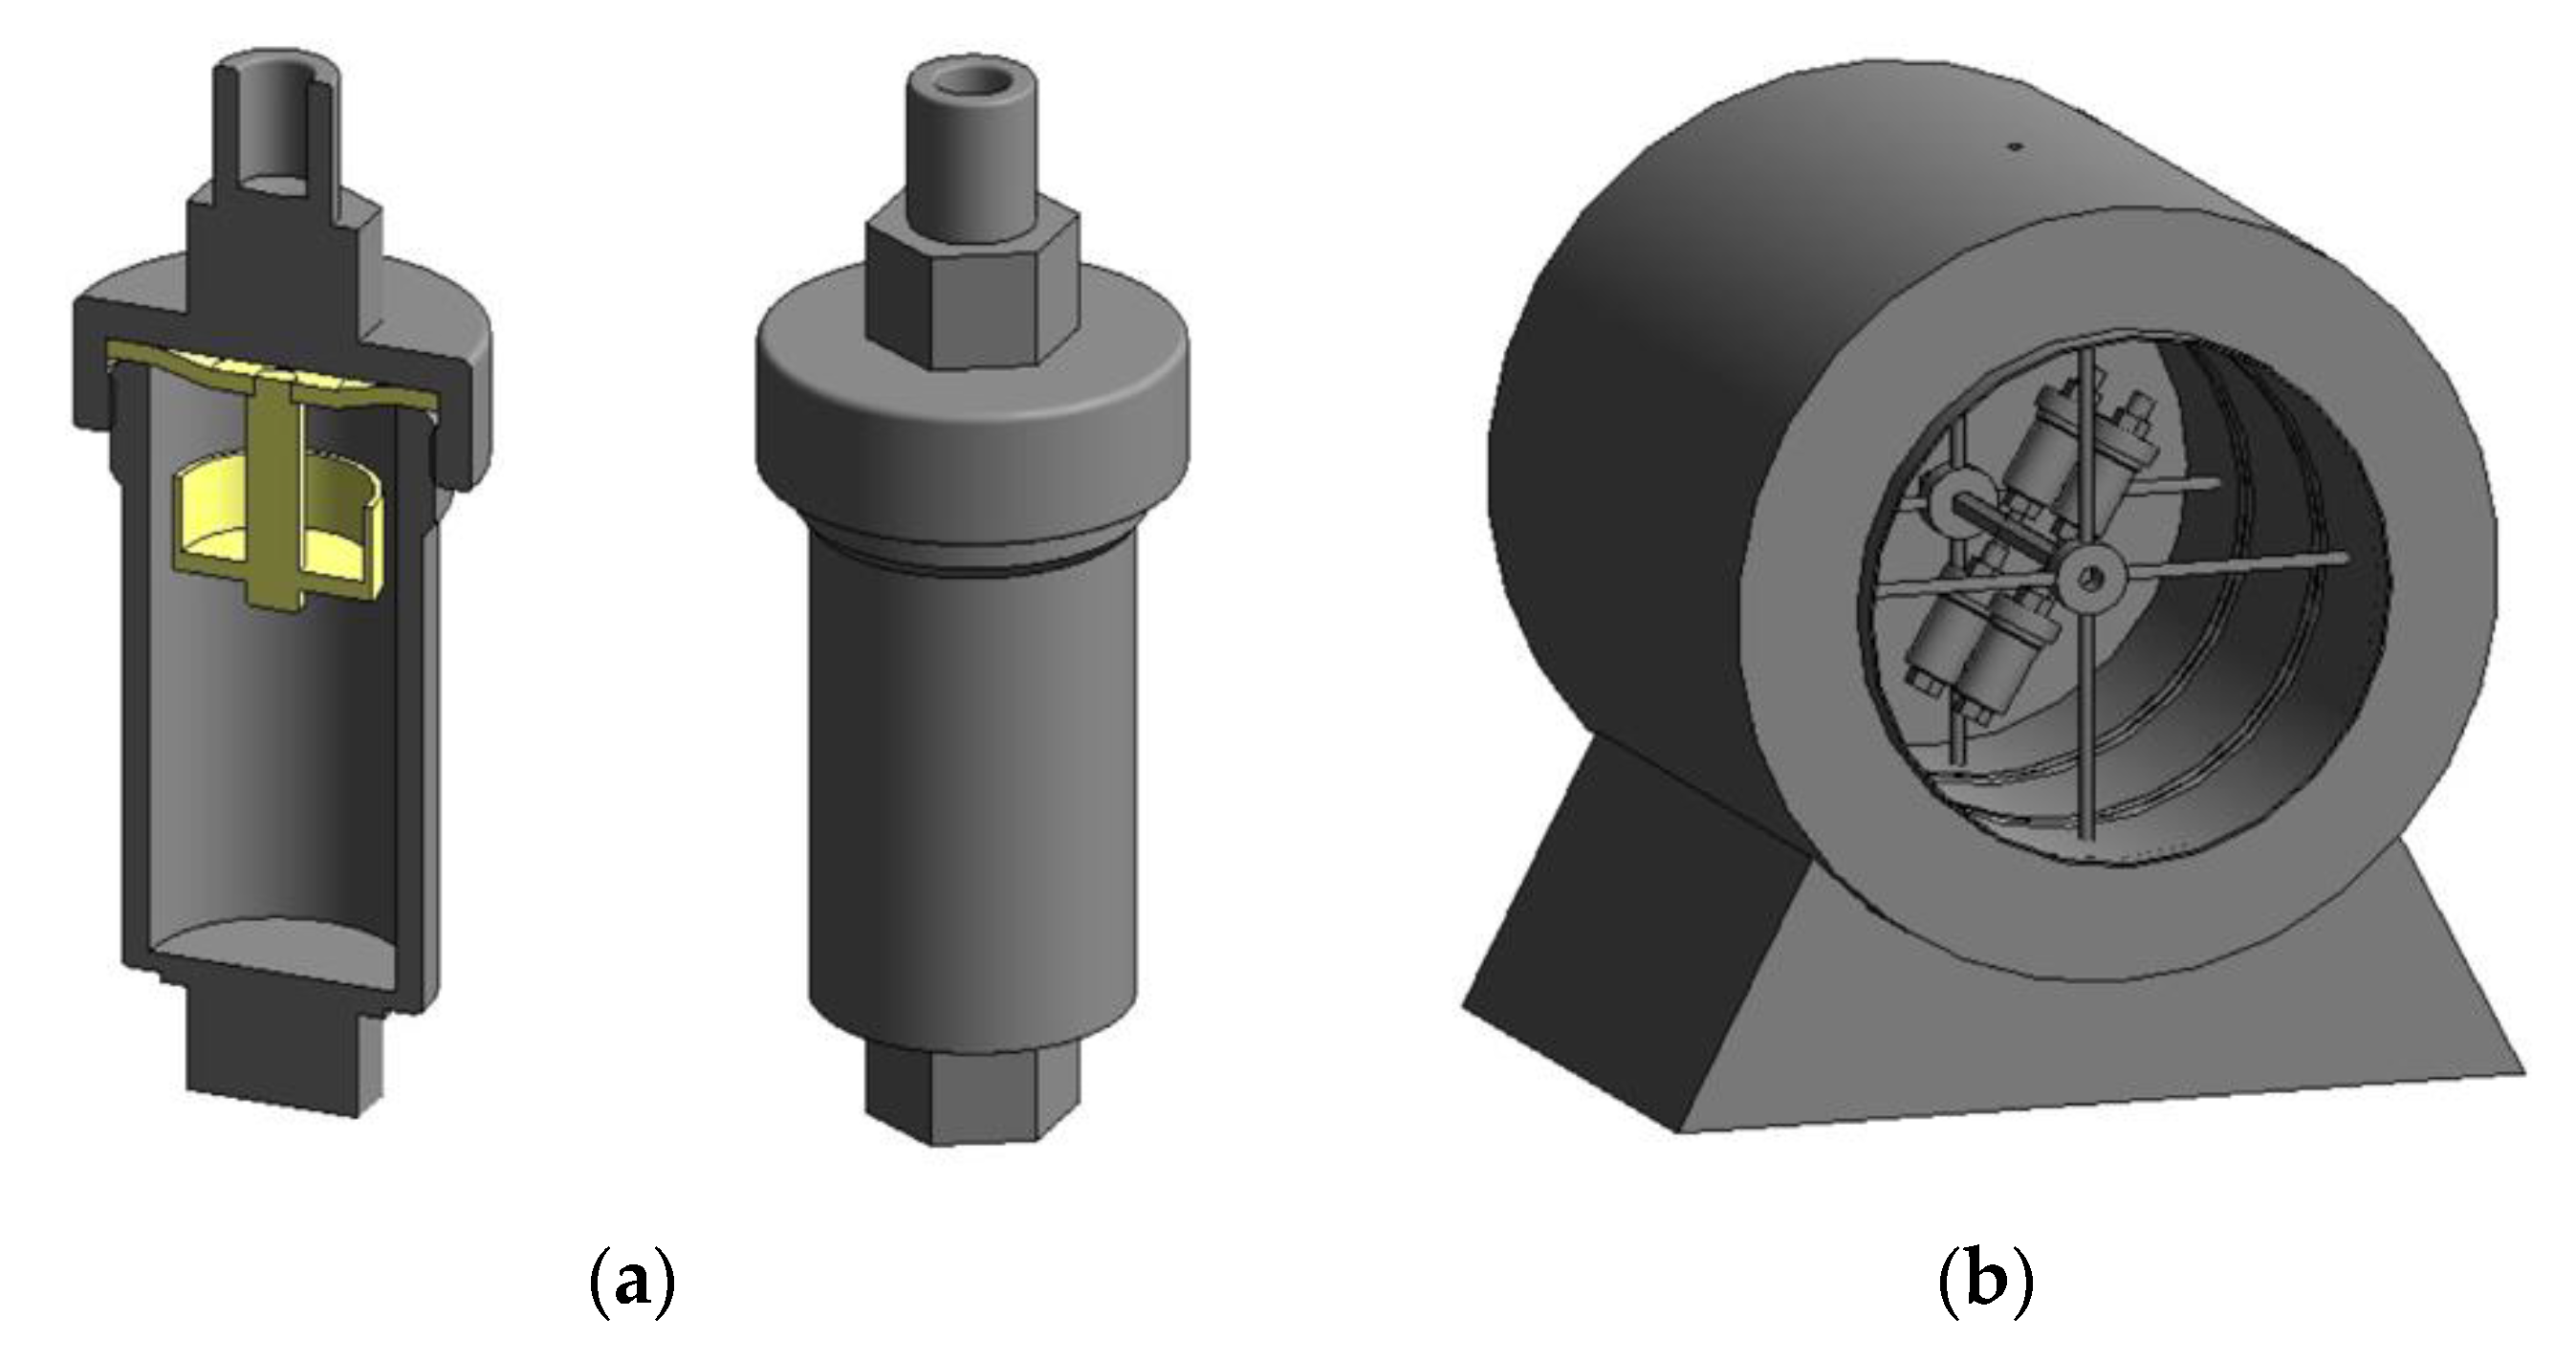
2.1. Methodology
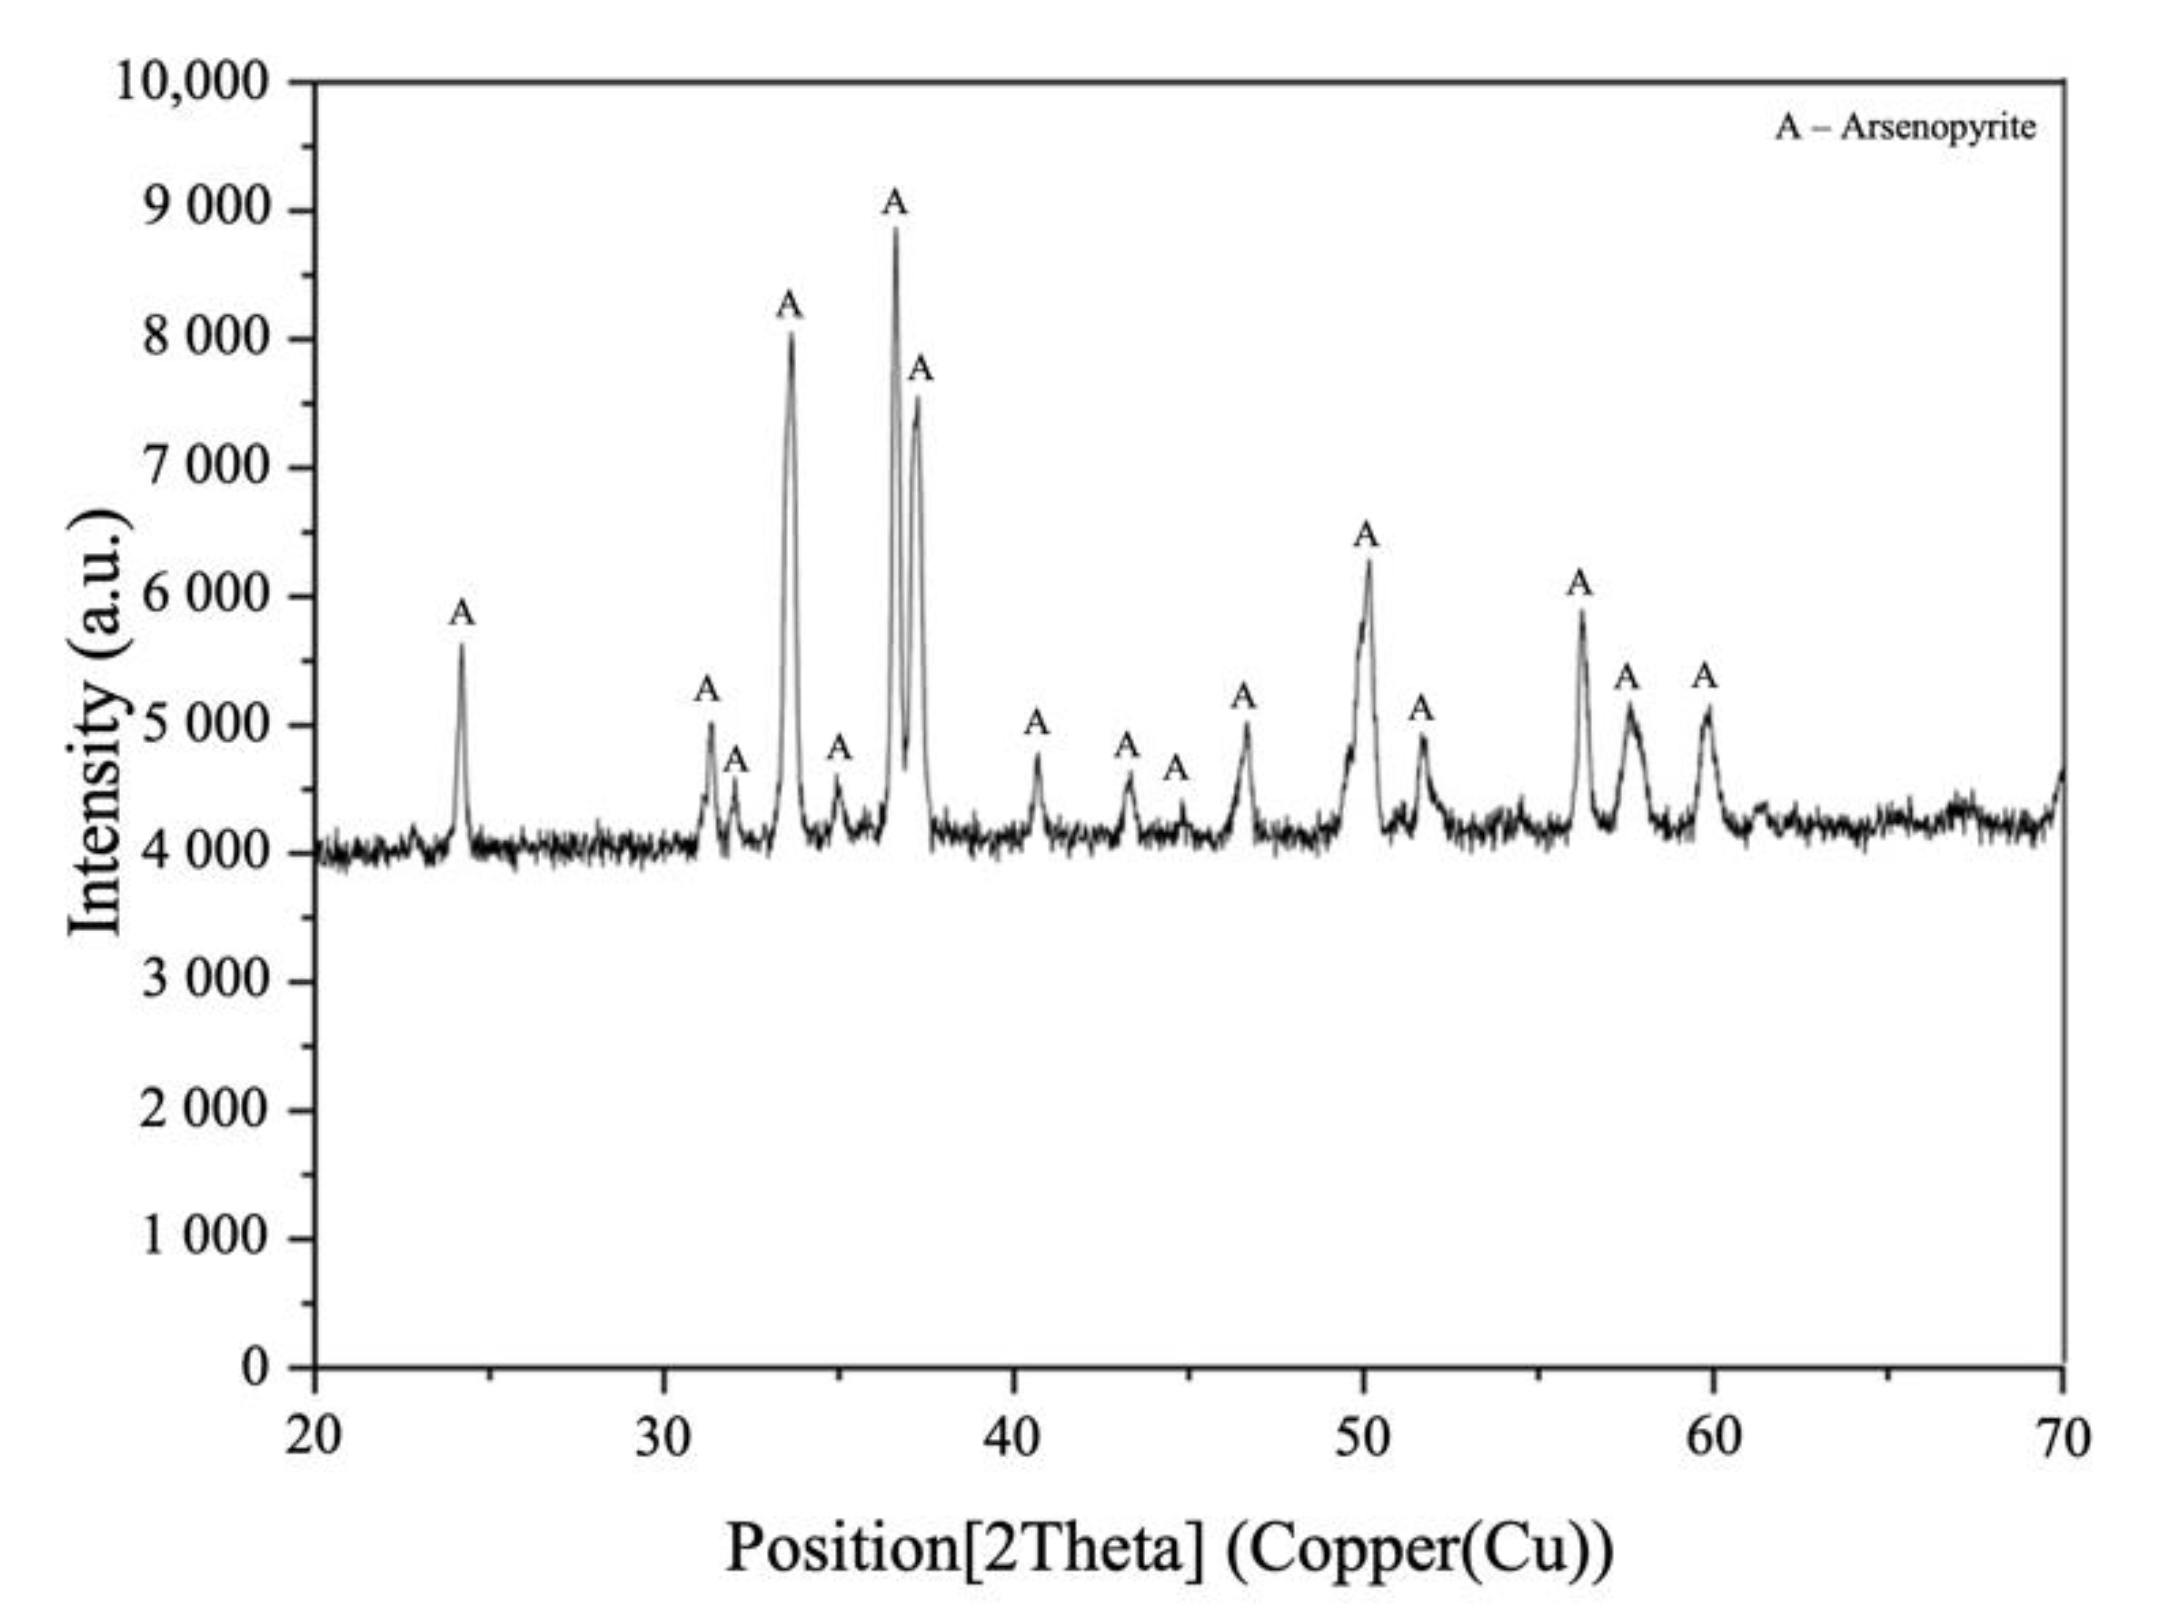
2.2. Materials and Characterization
3. Results and Discussion
3.1. Discussion Details
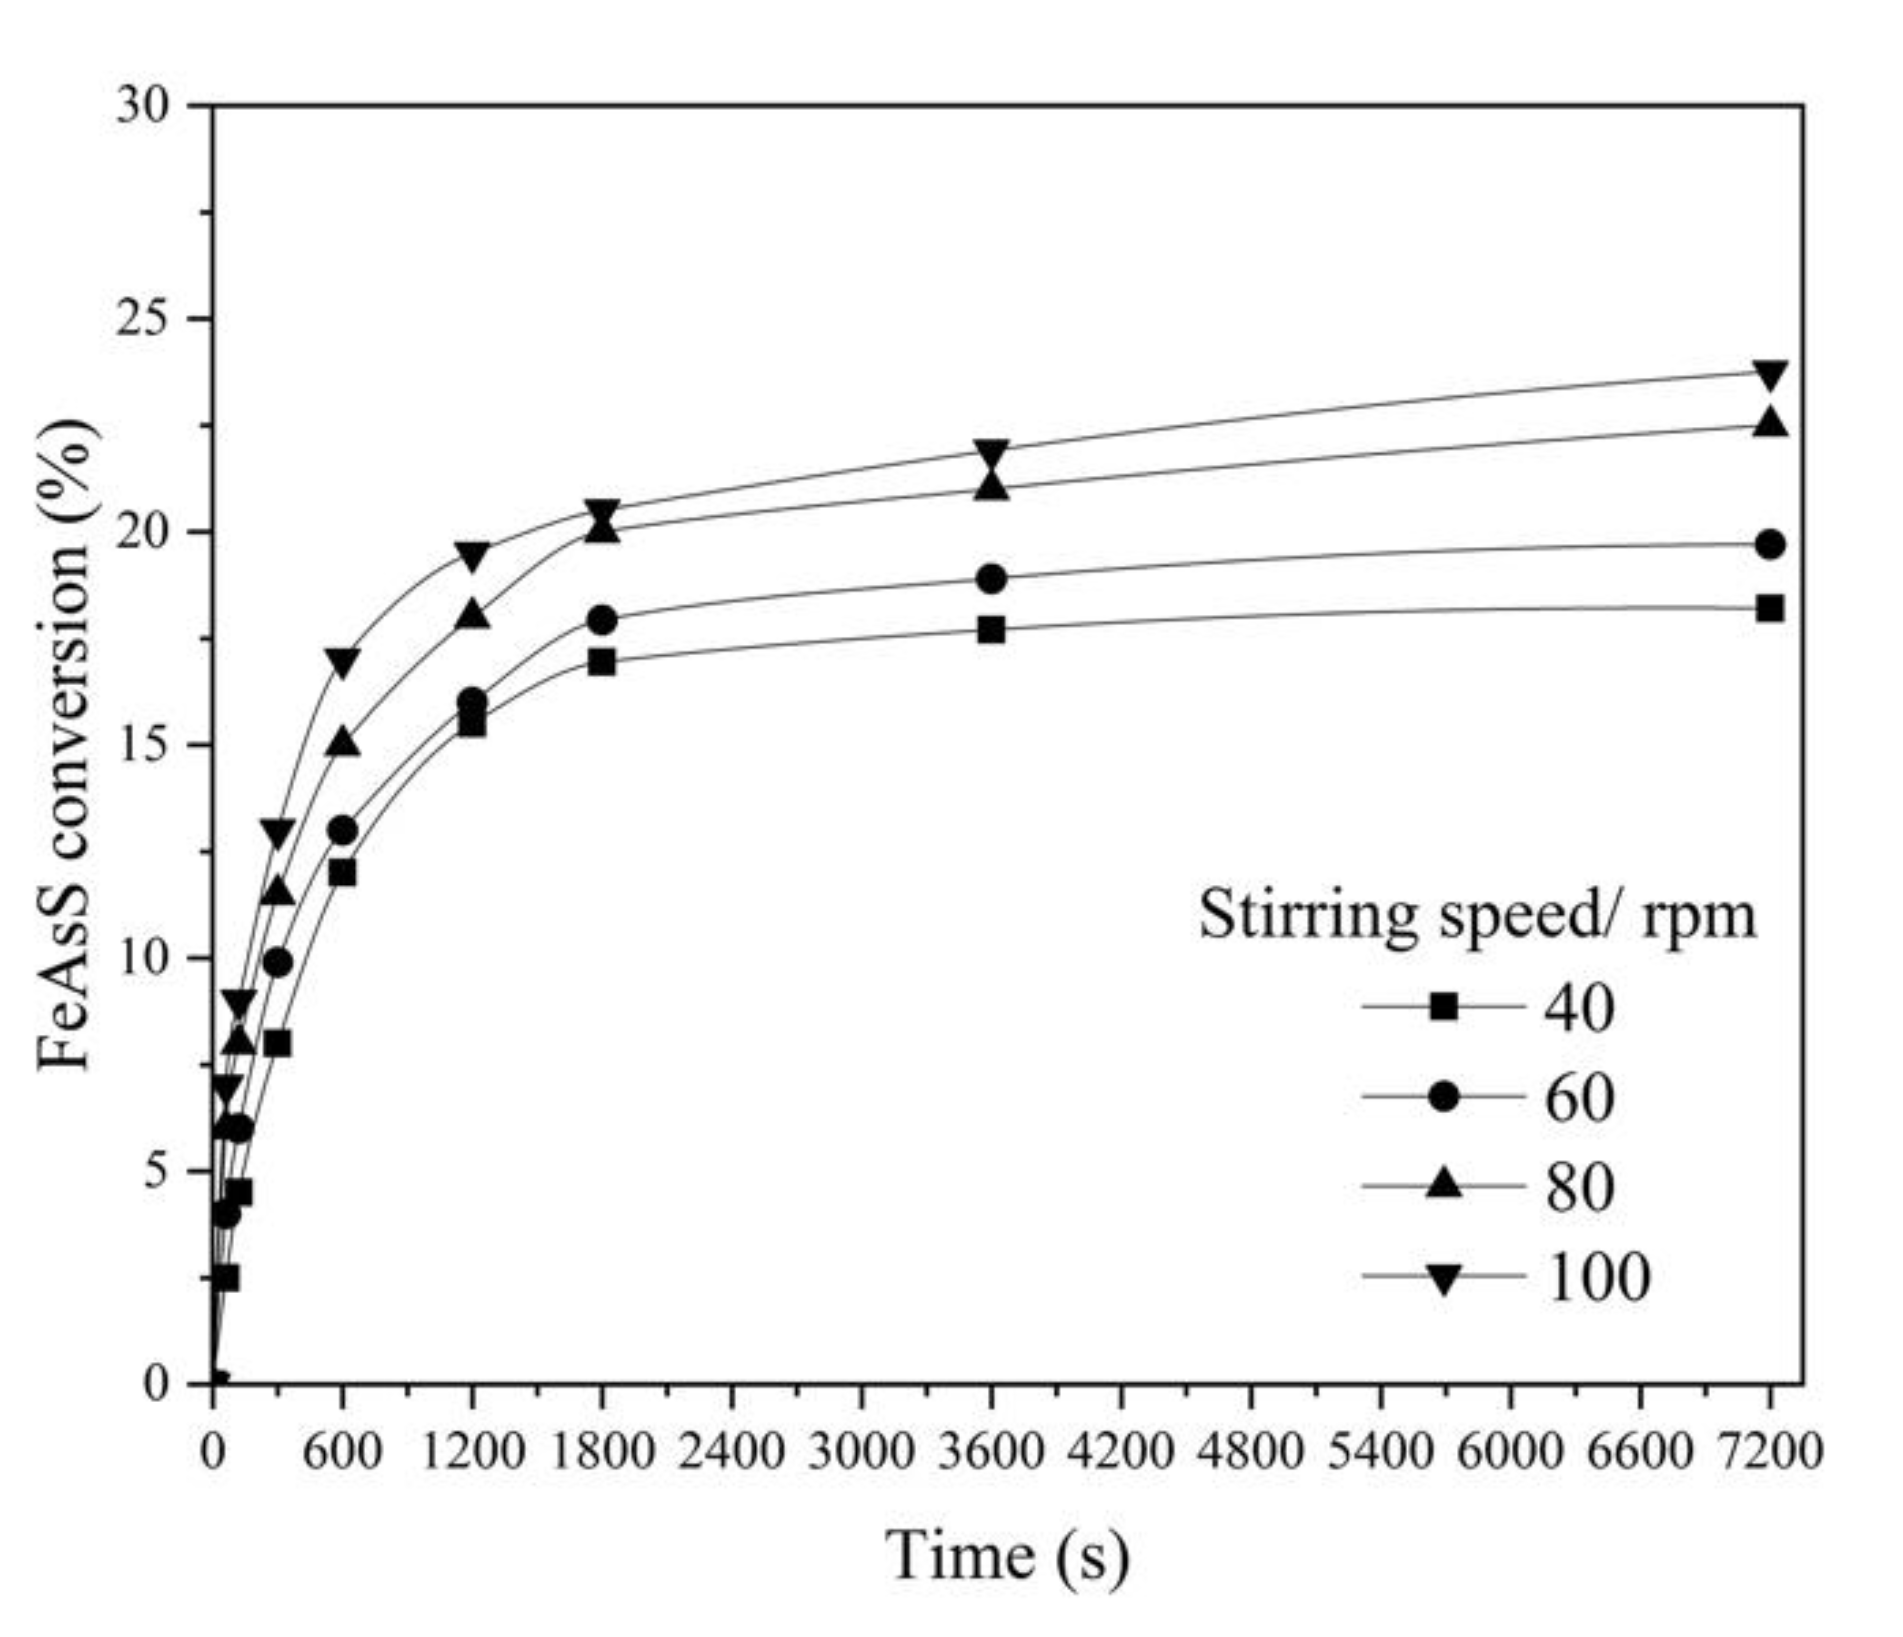
3.1.1. Effect of Stirring Speed
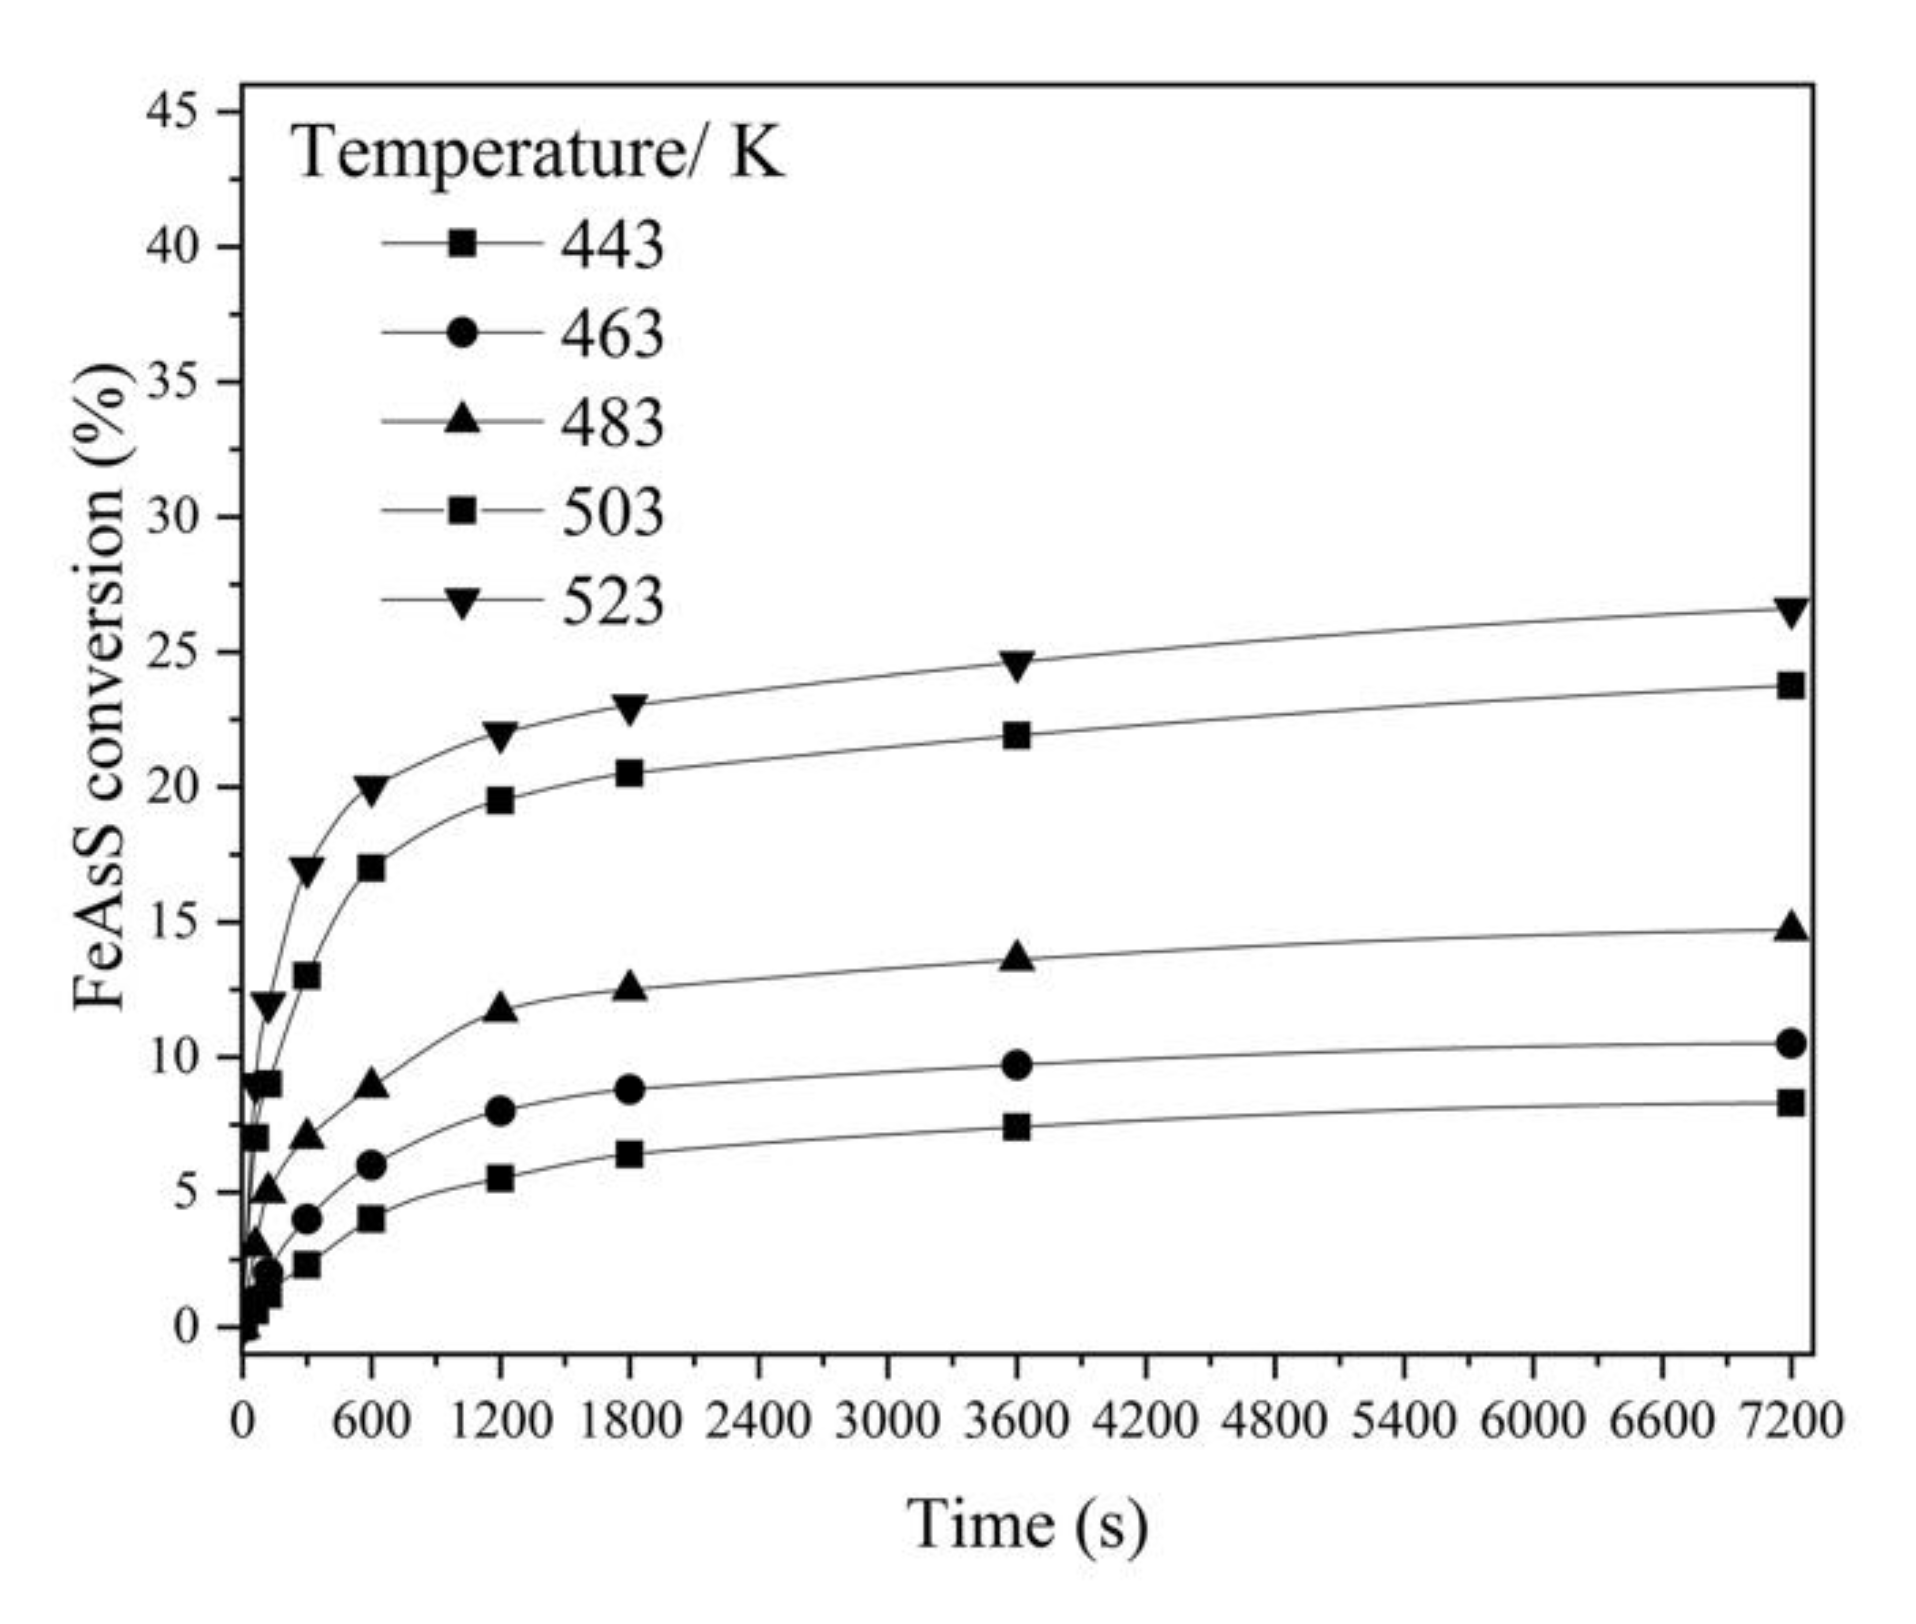
3.1.2. Effect of Temperature
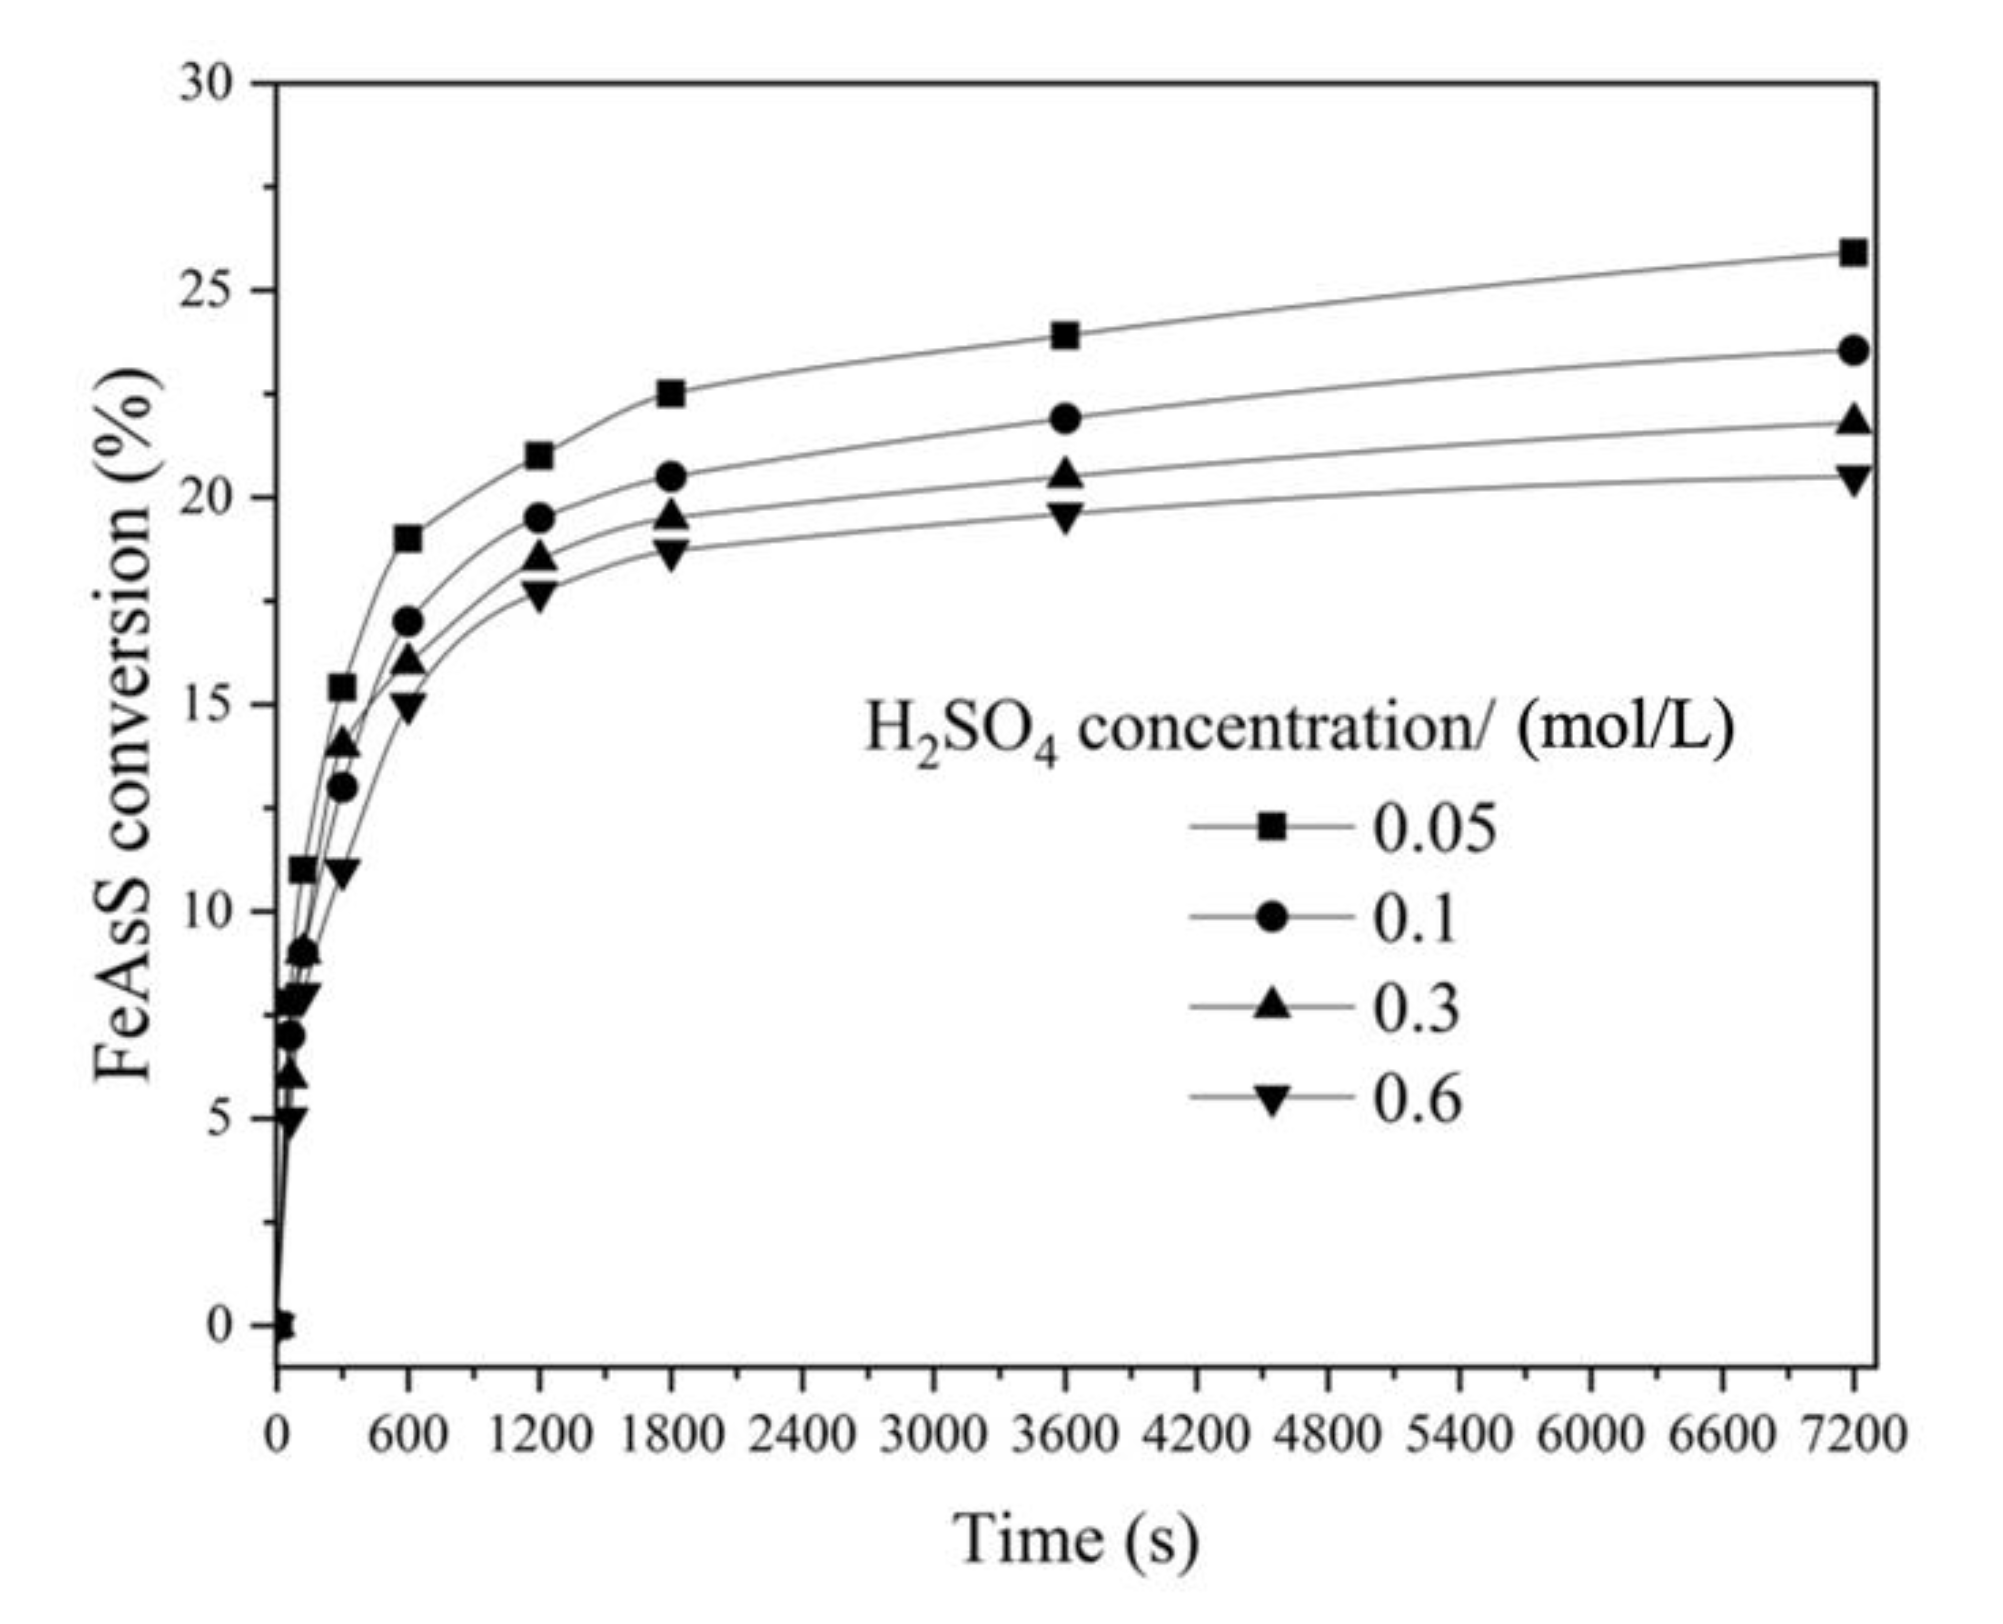
3.1.3. Effect of H2SO4 Concentration
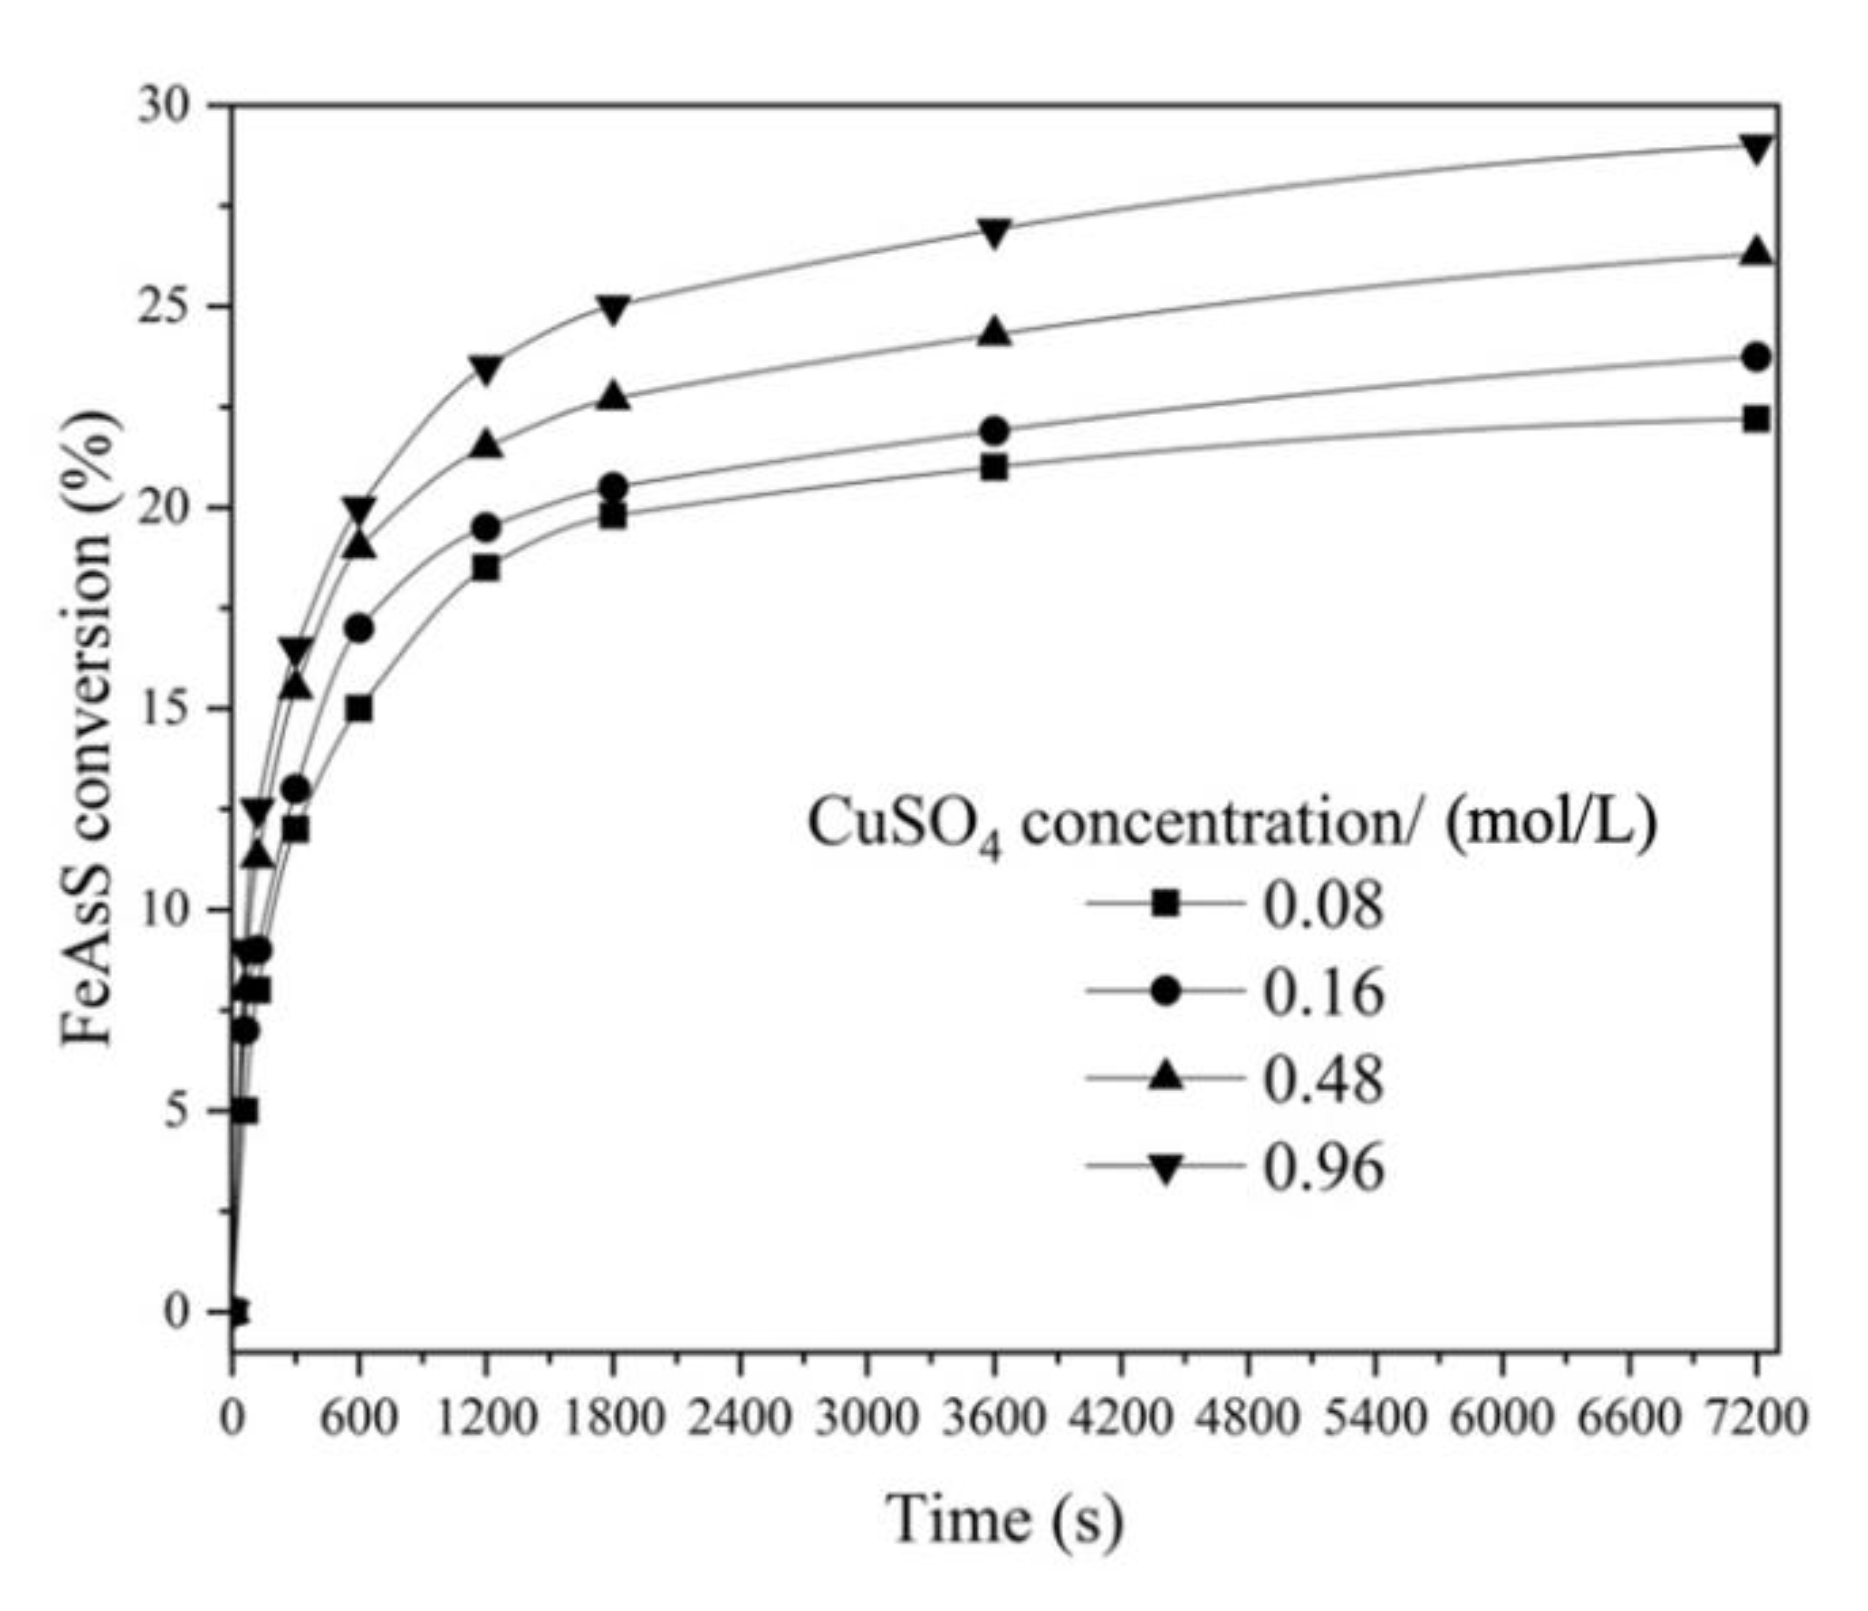
3.1.4. Effect of CuSO4 Concentration
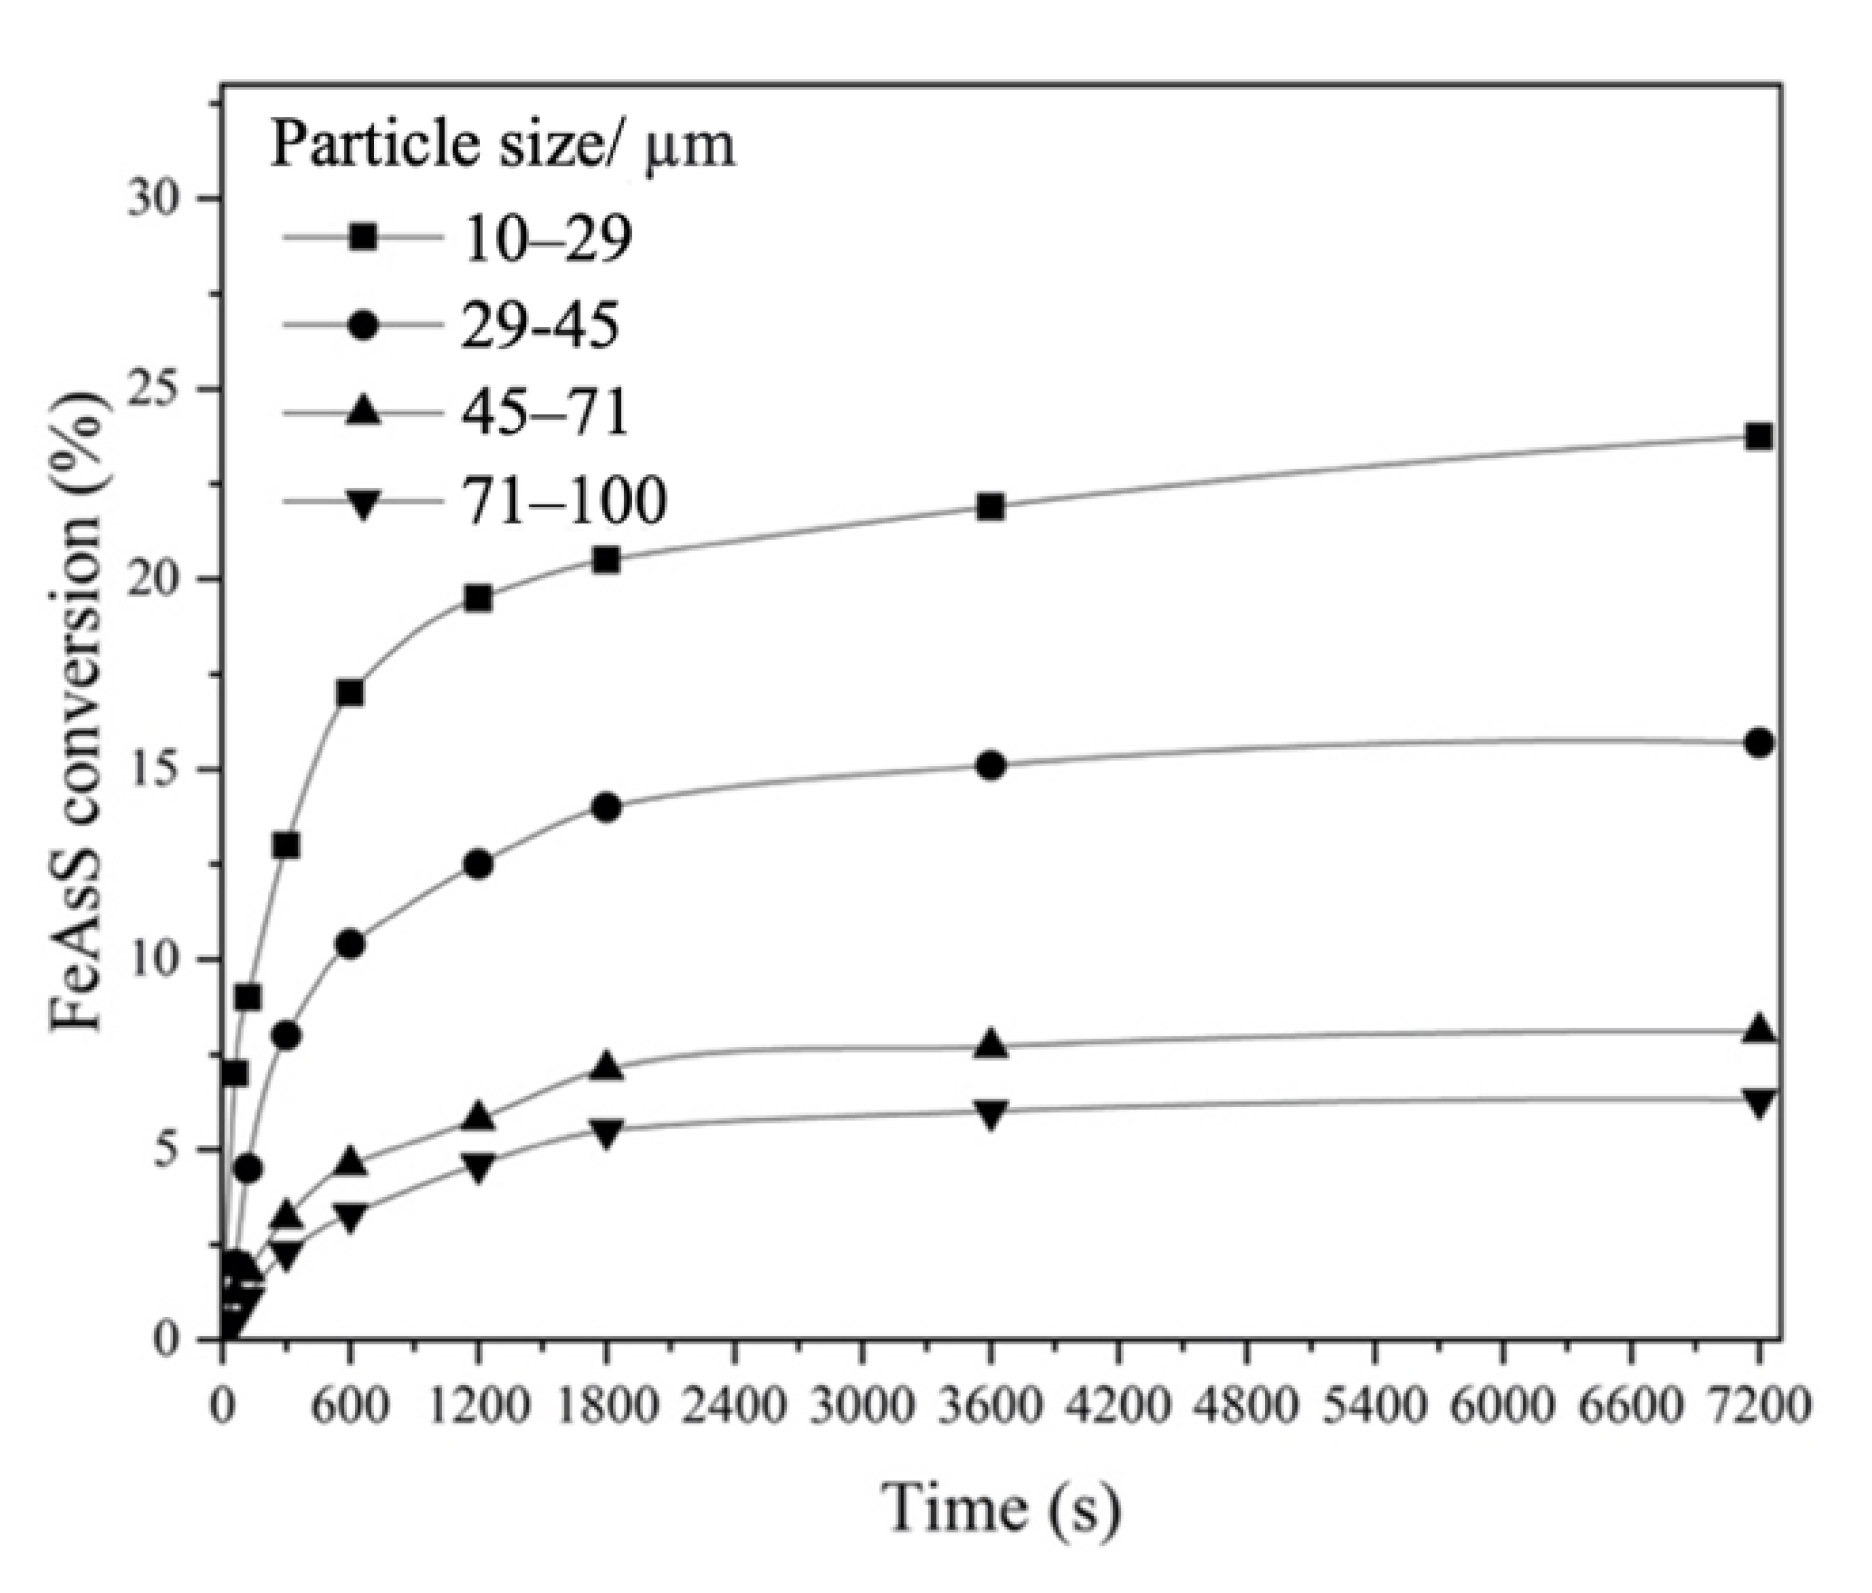
3.1.5. Effect of FeAsS Particle Size
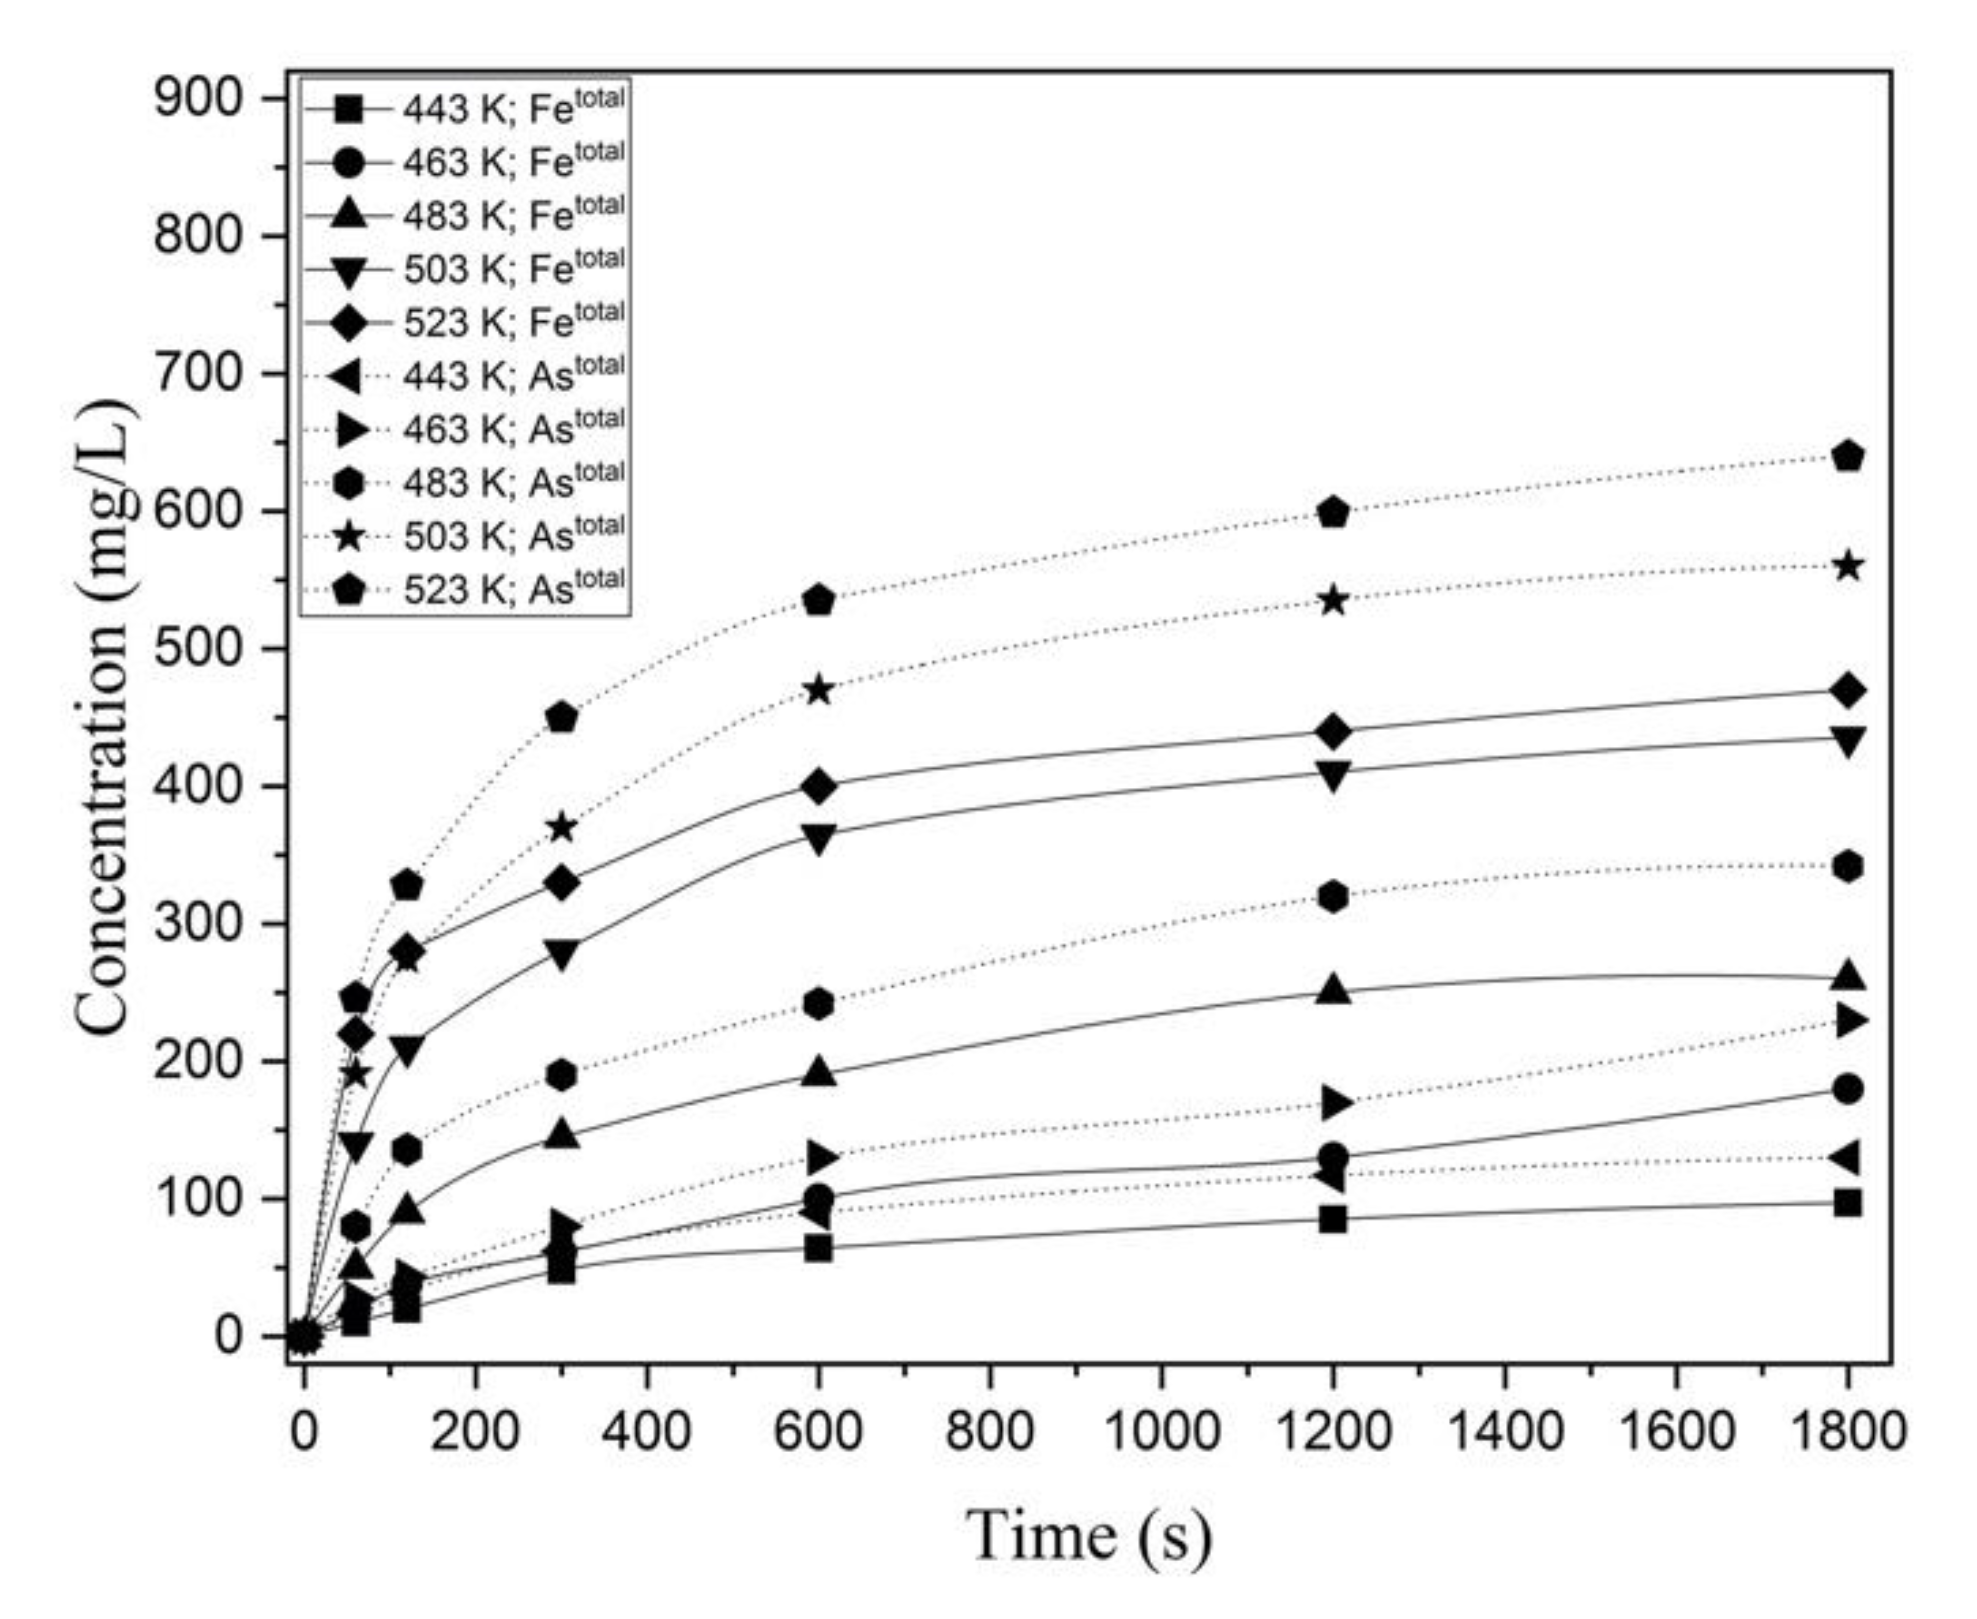
3.1.6. Behavior of Iron in Hydrothermal Interaction of FeAsS with CuSO4
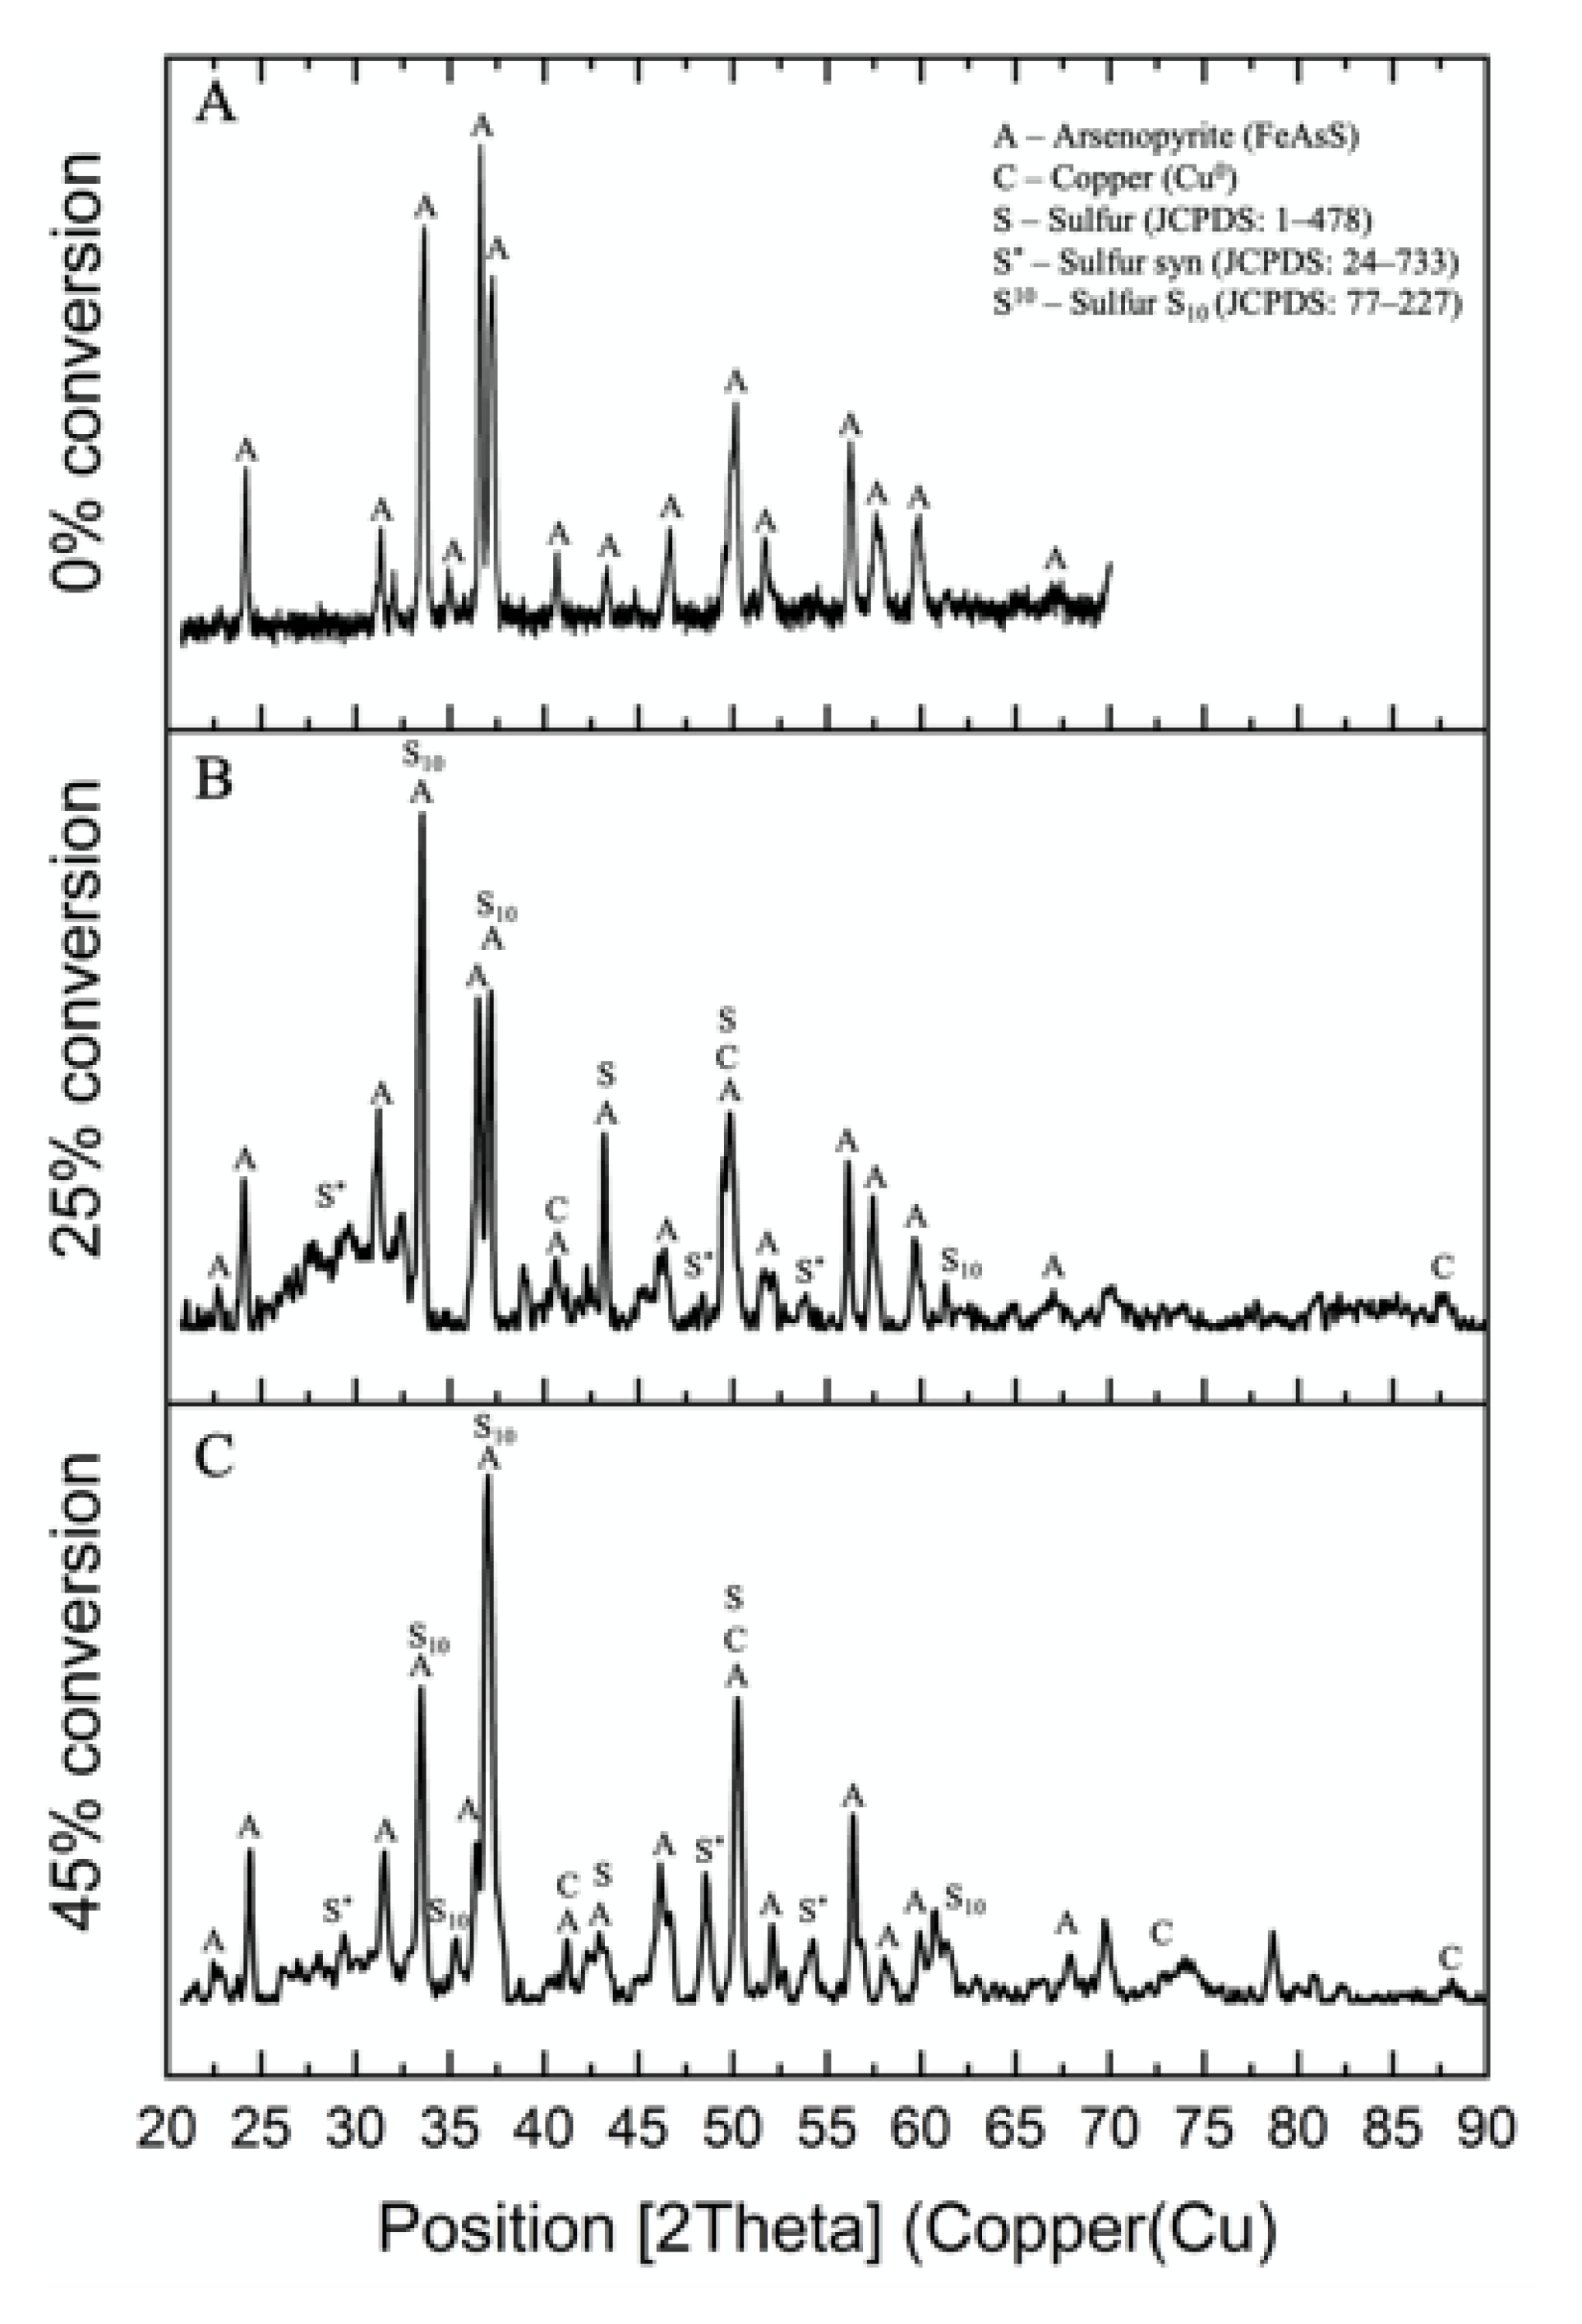
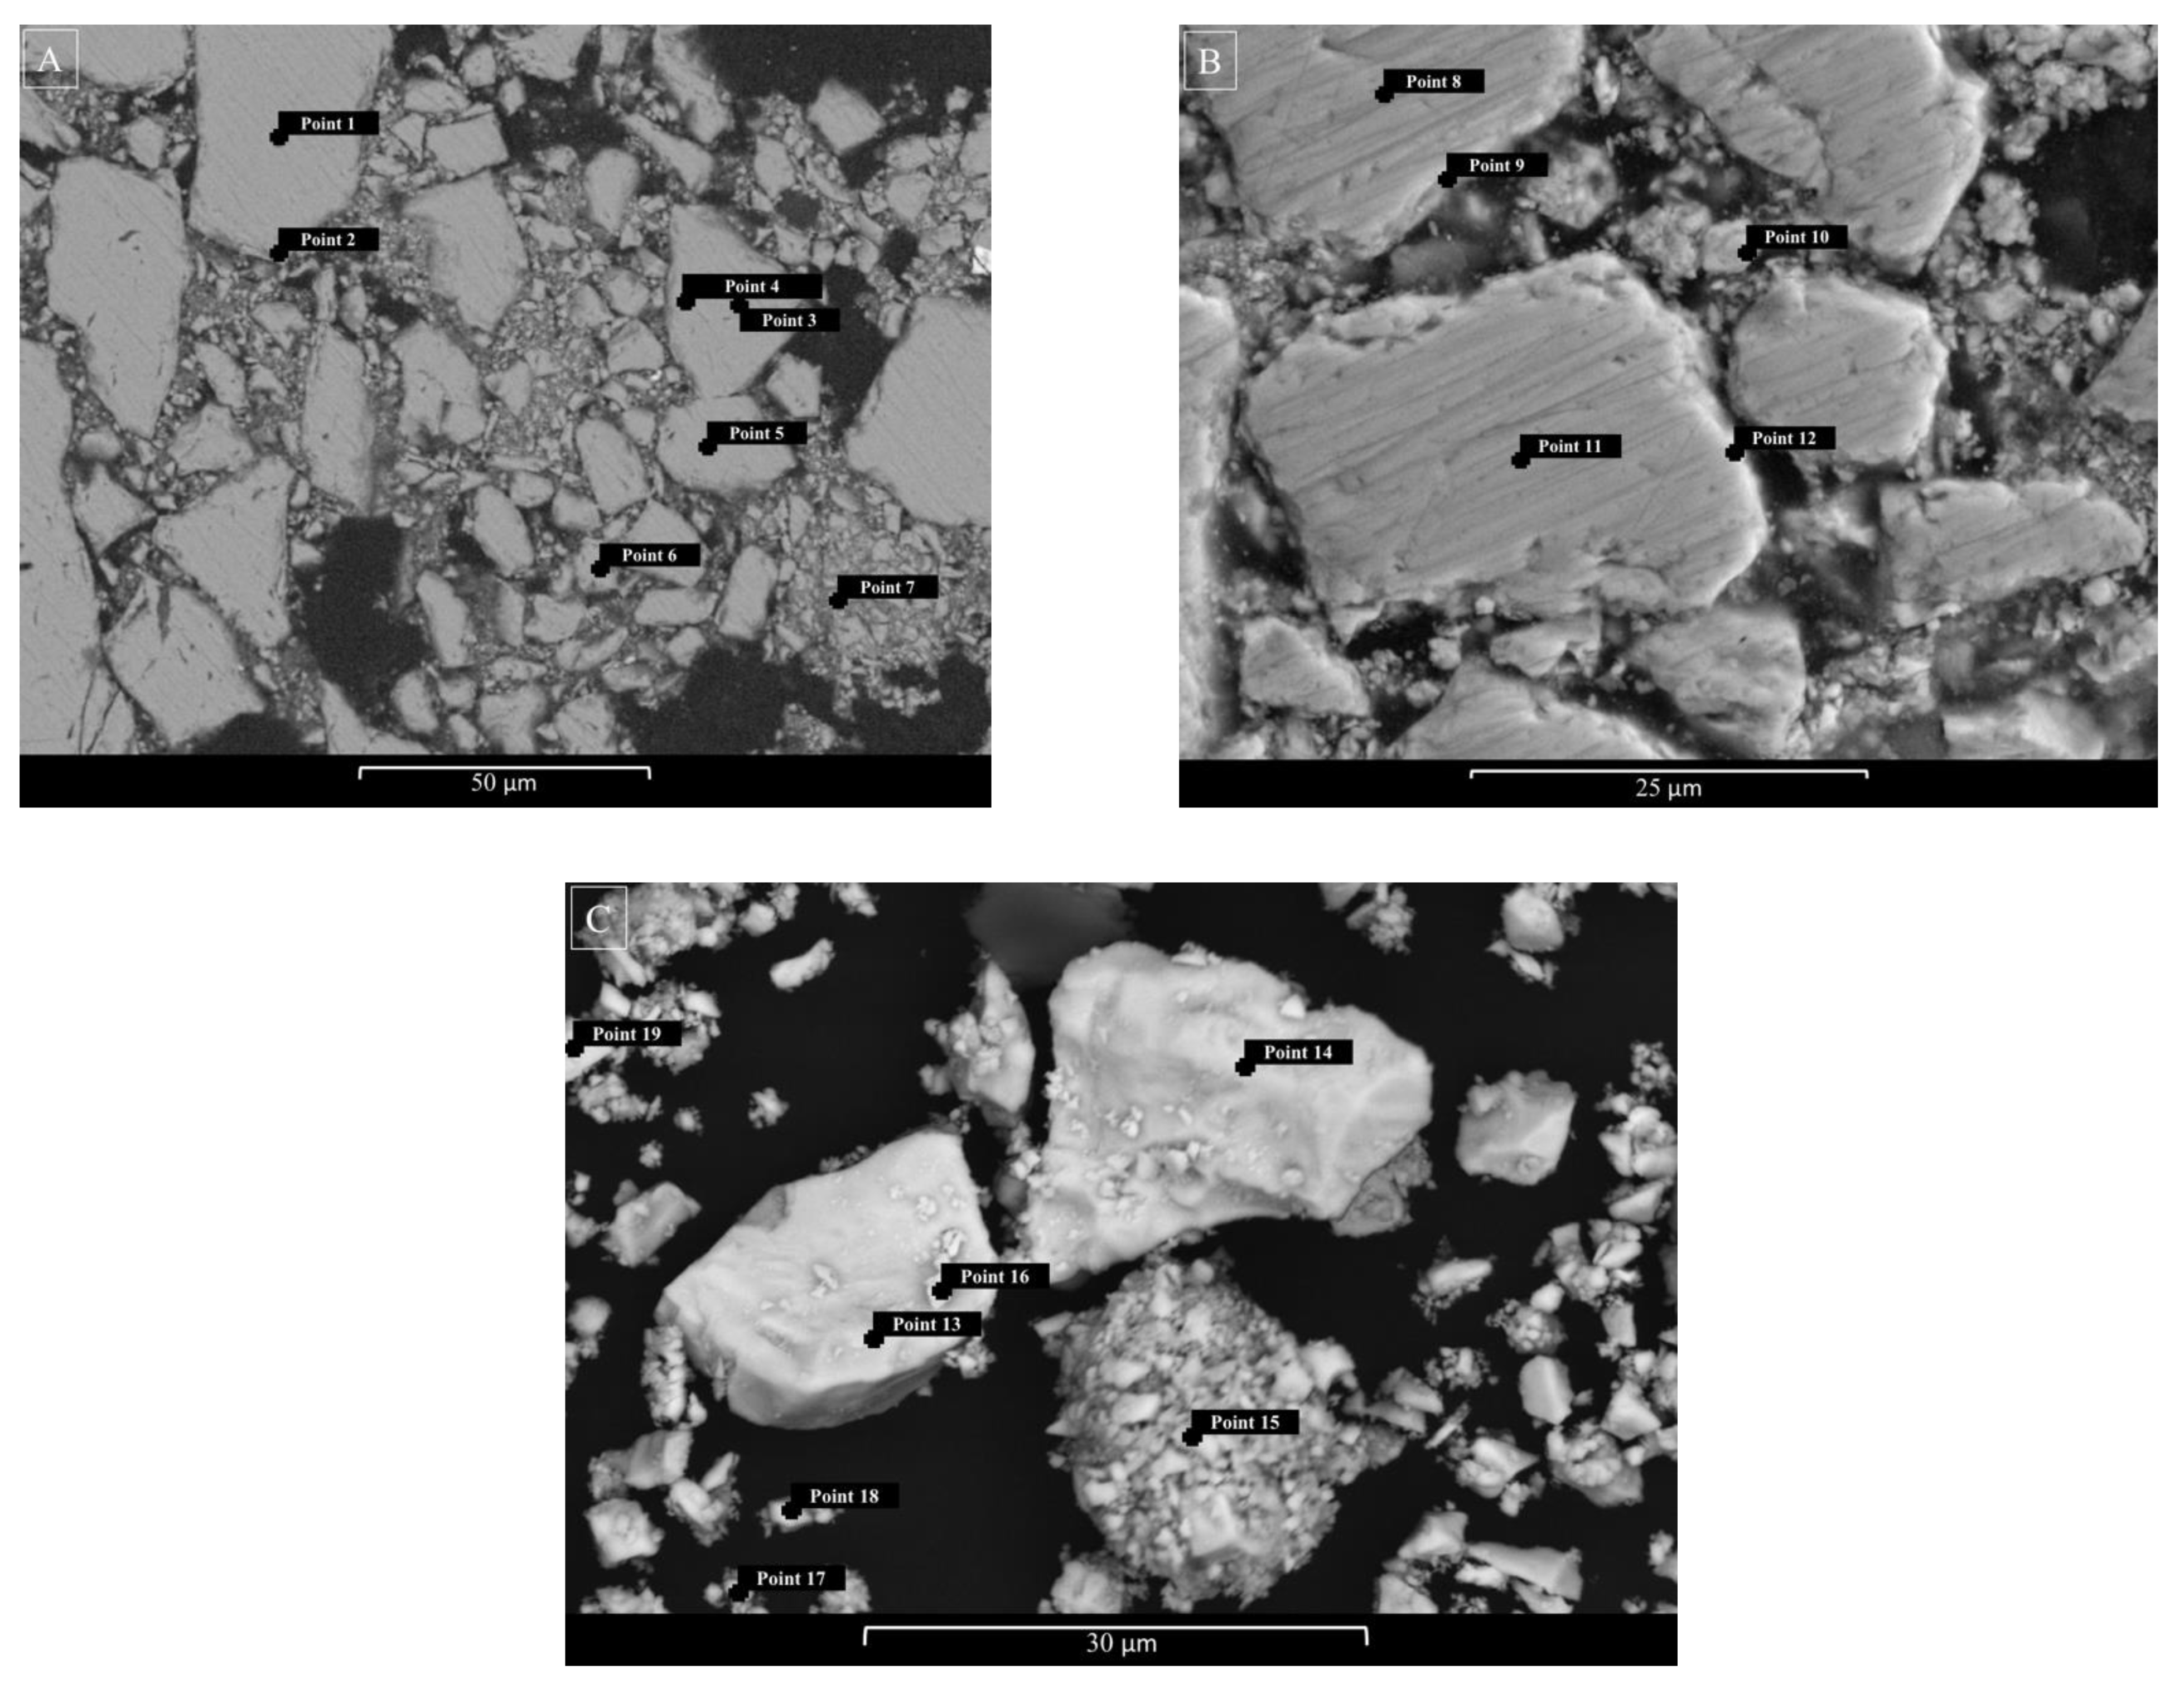
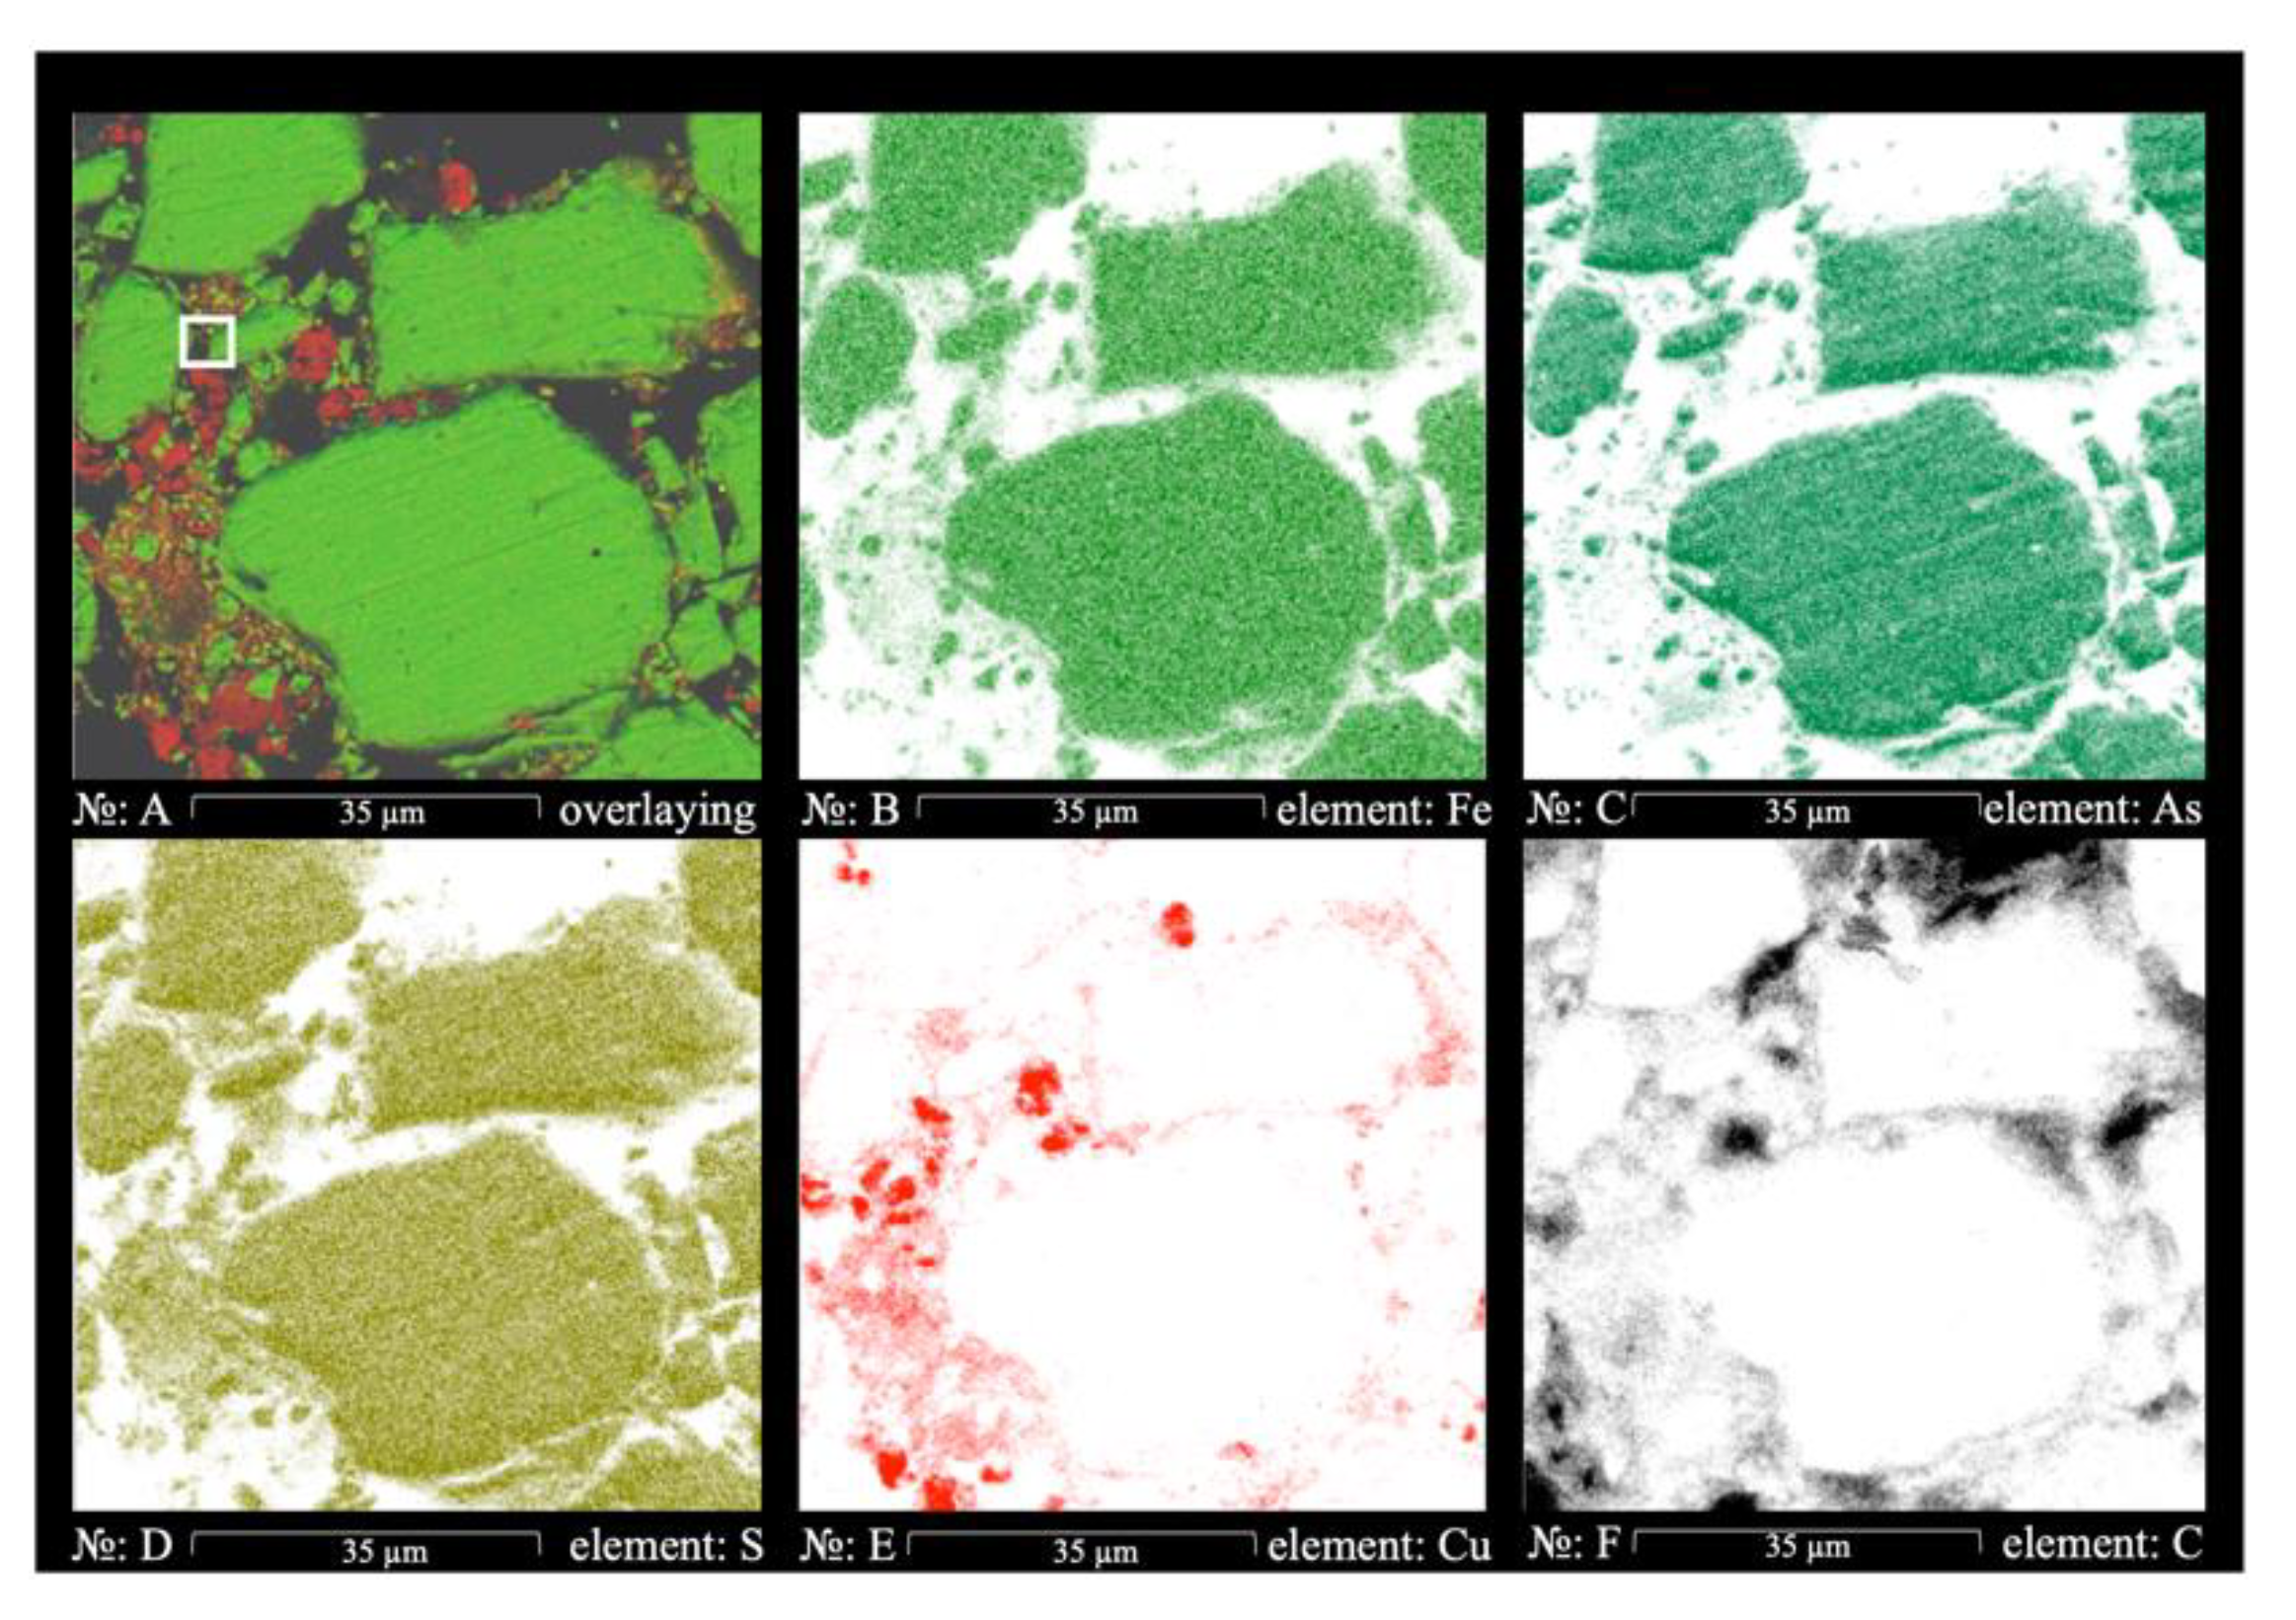
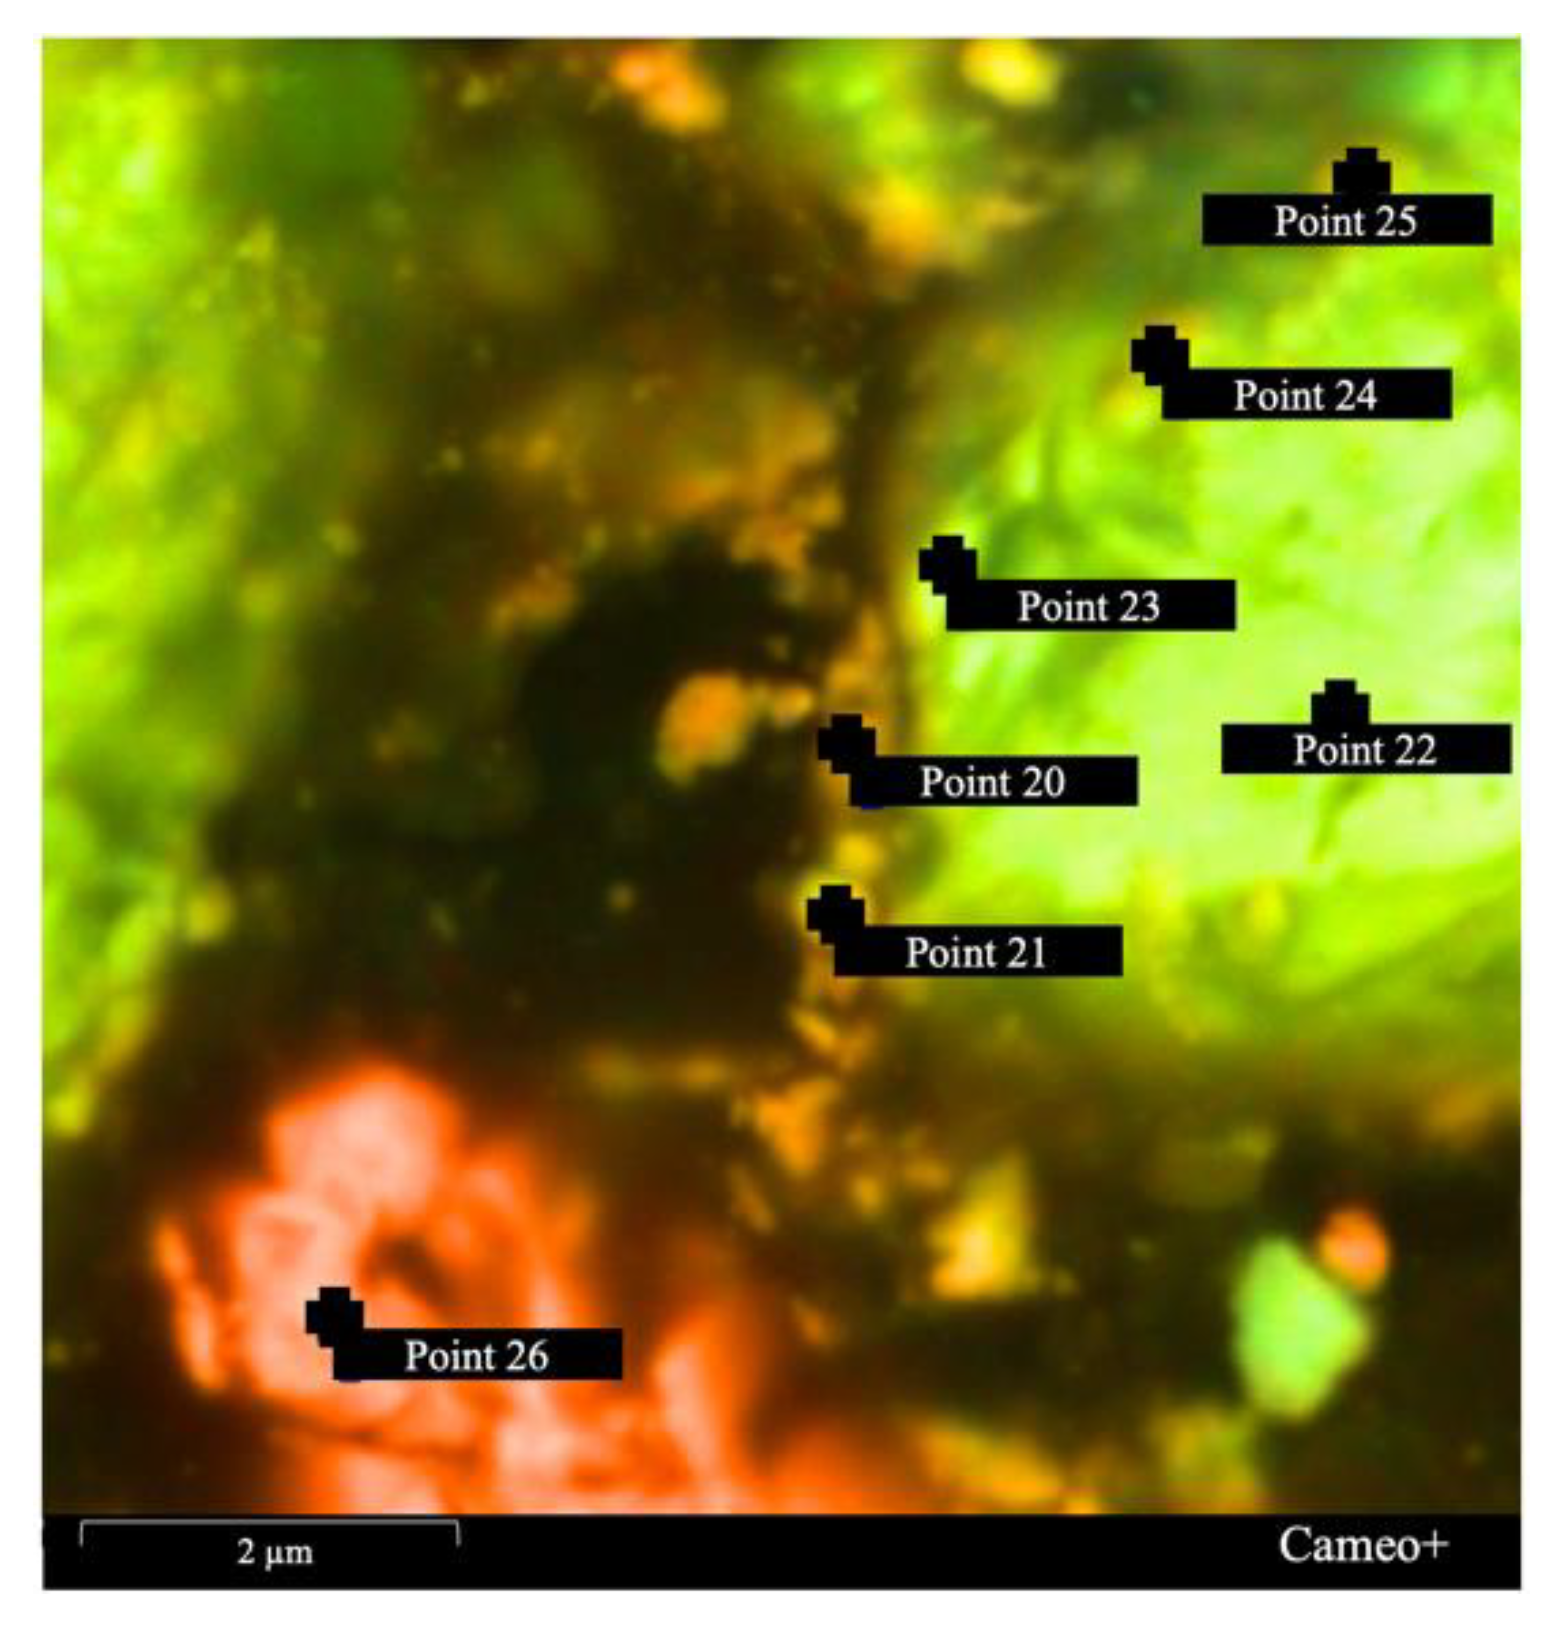
3.2. Characterization of Residue
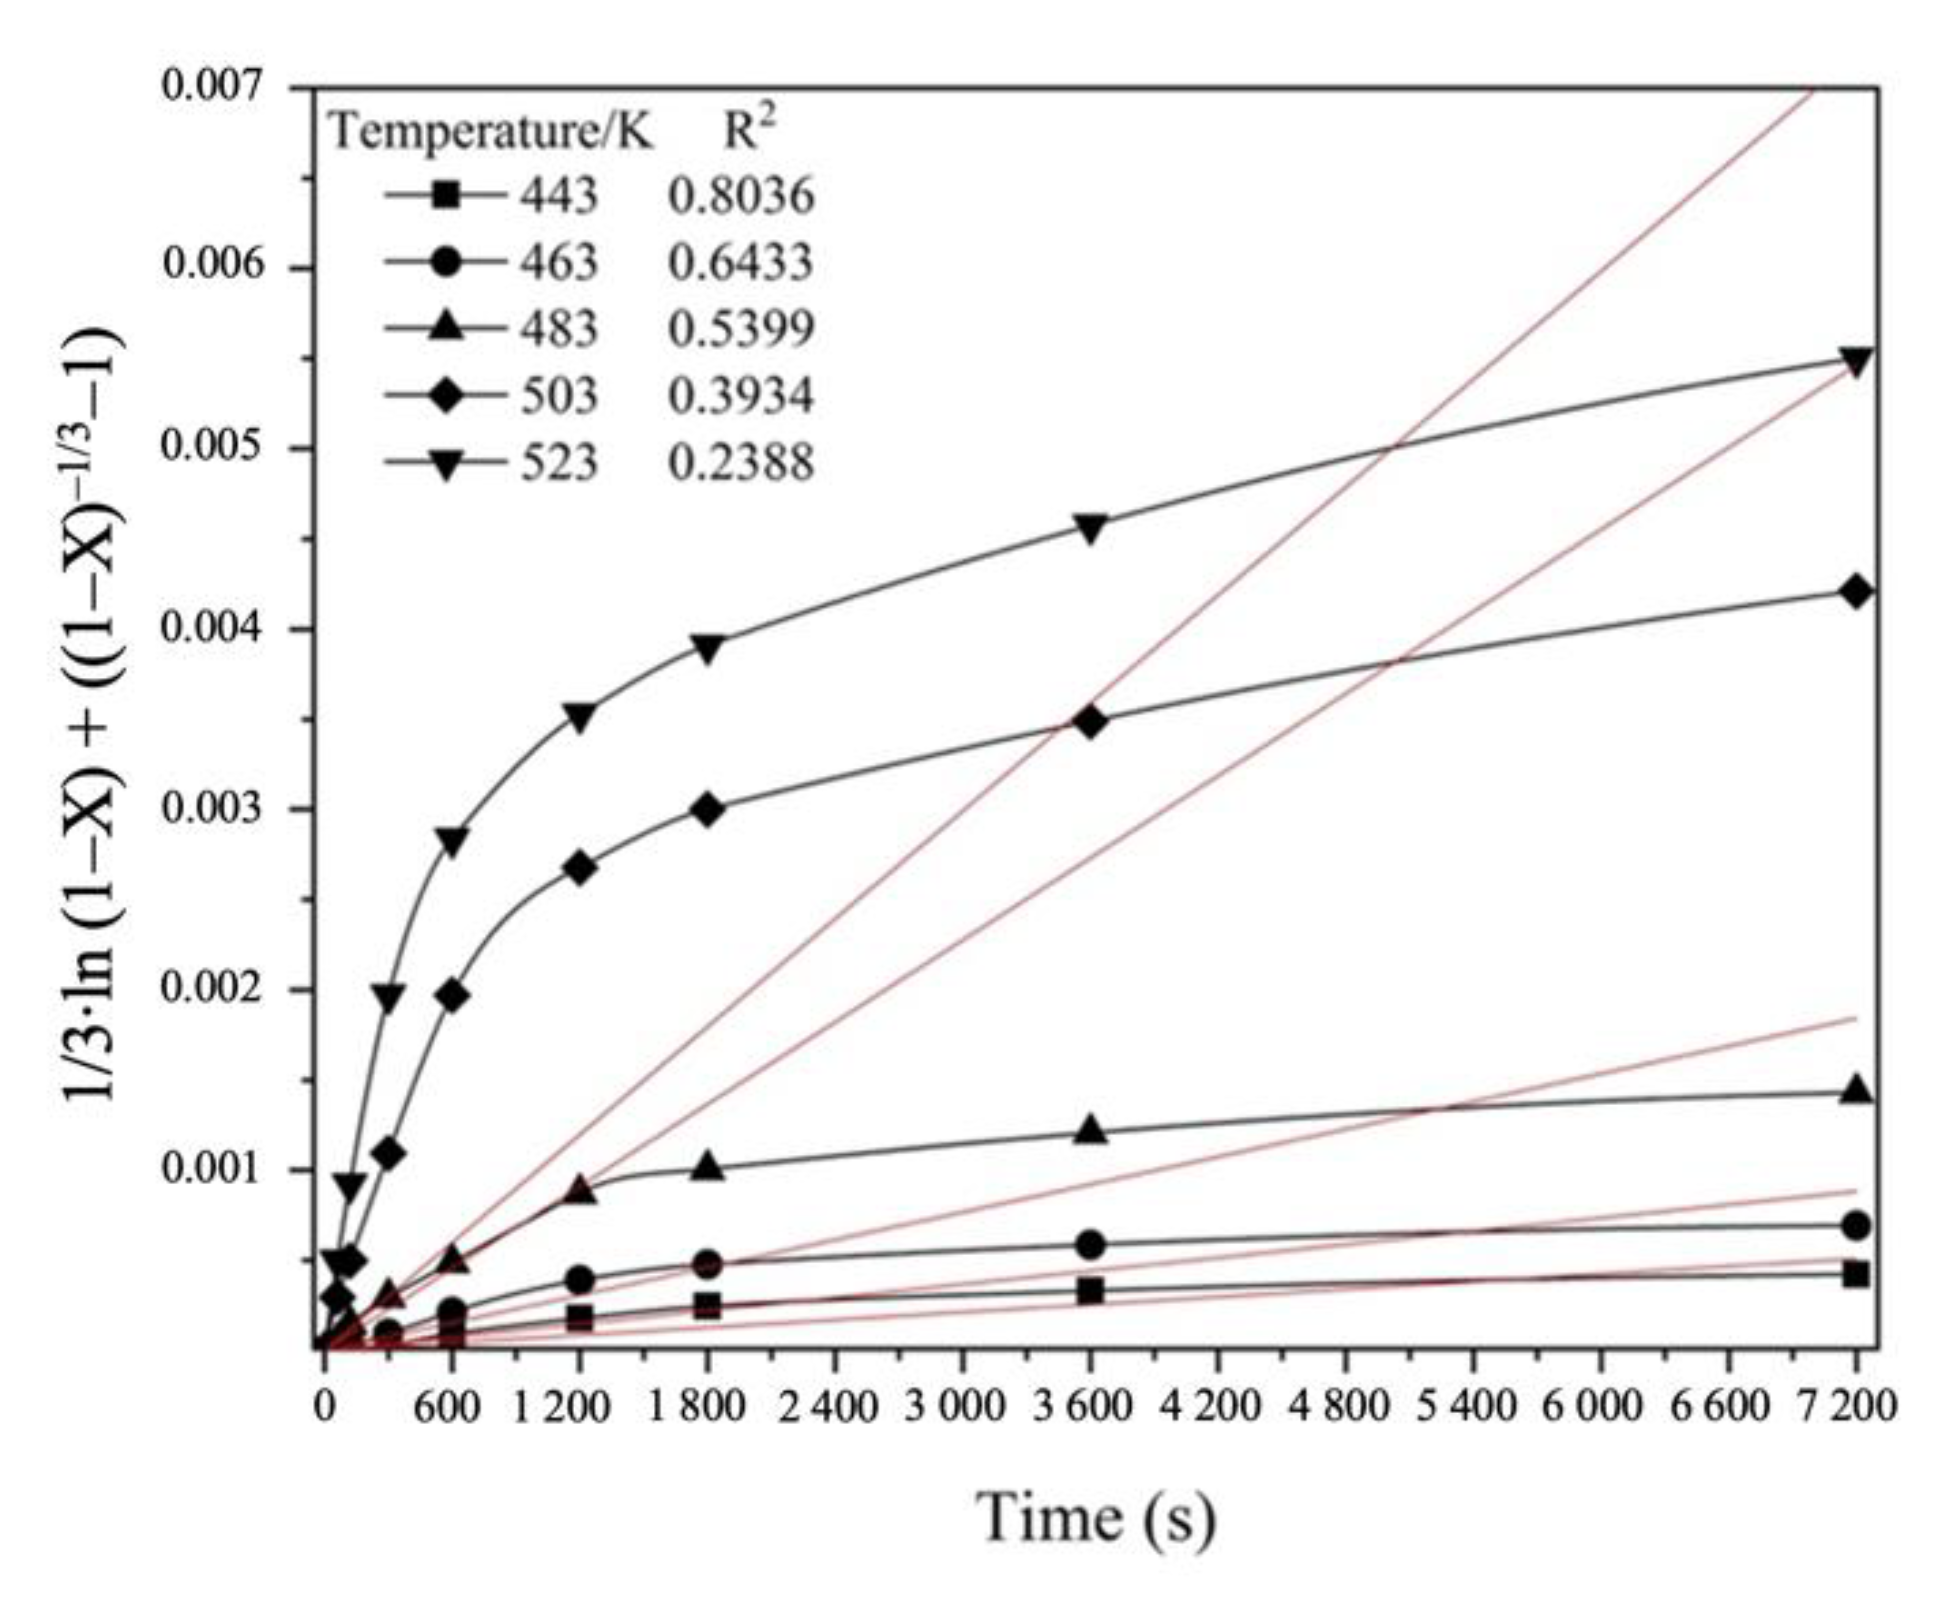
3.3. Hydrothermal Treatment Kinetics
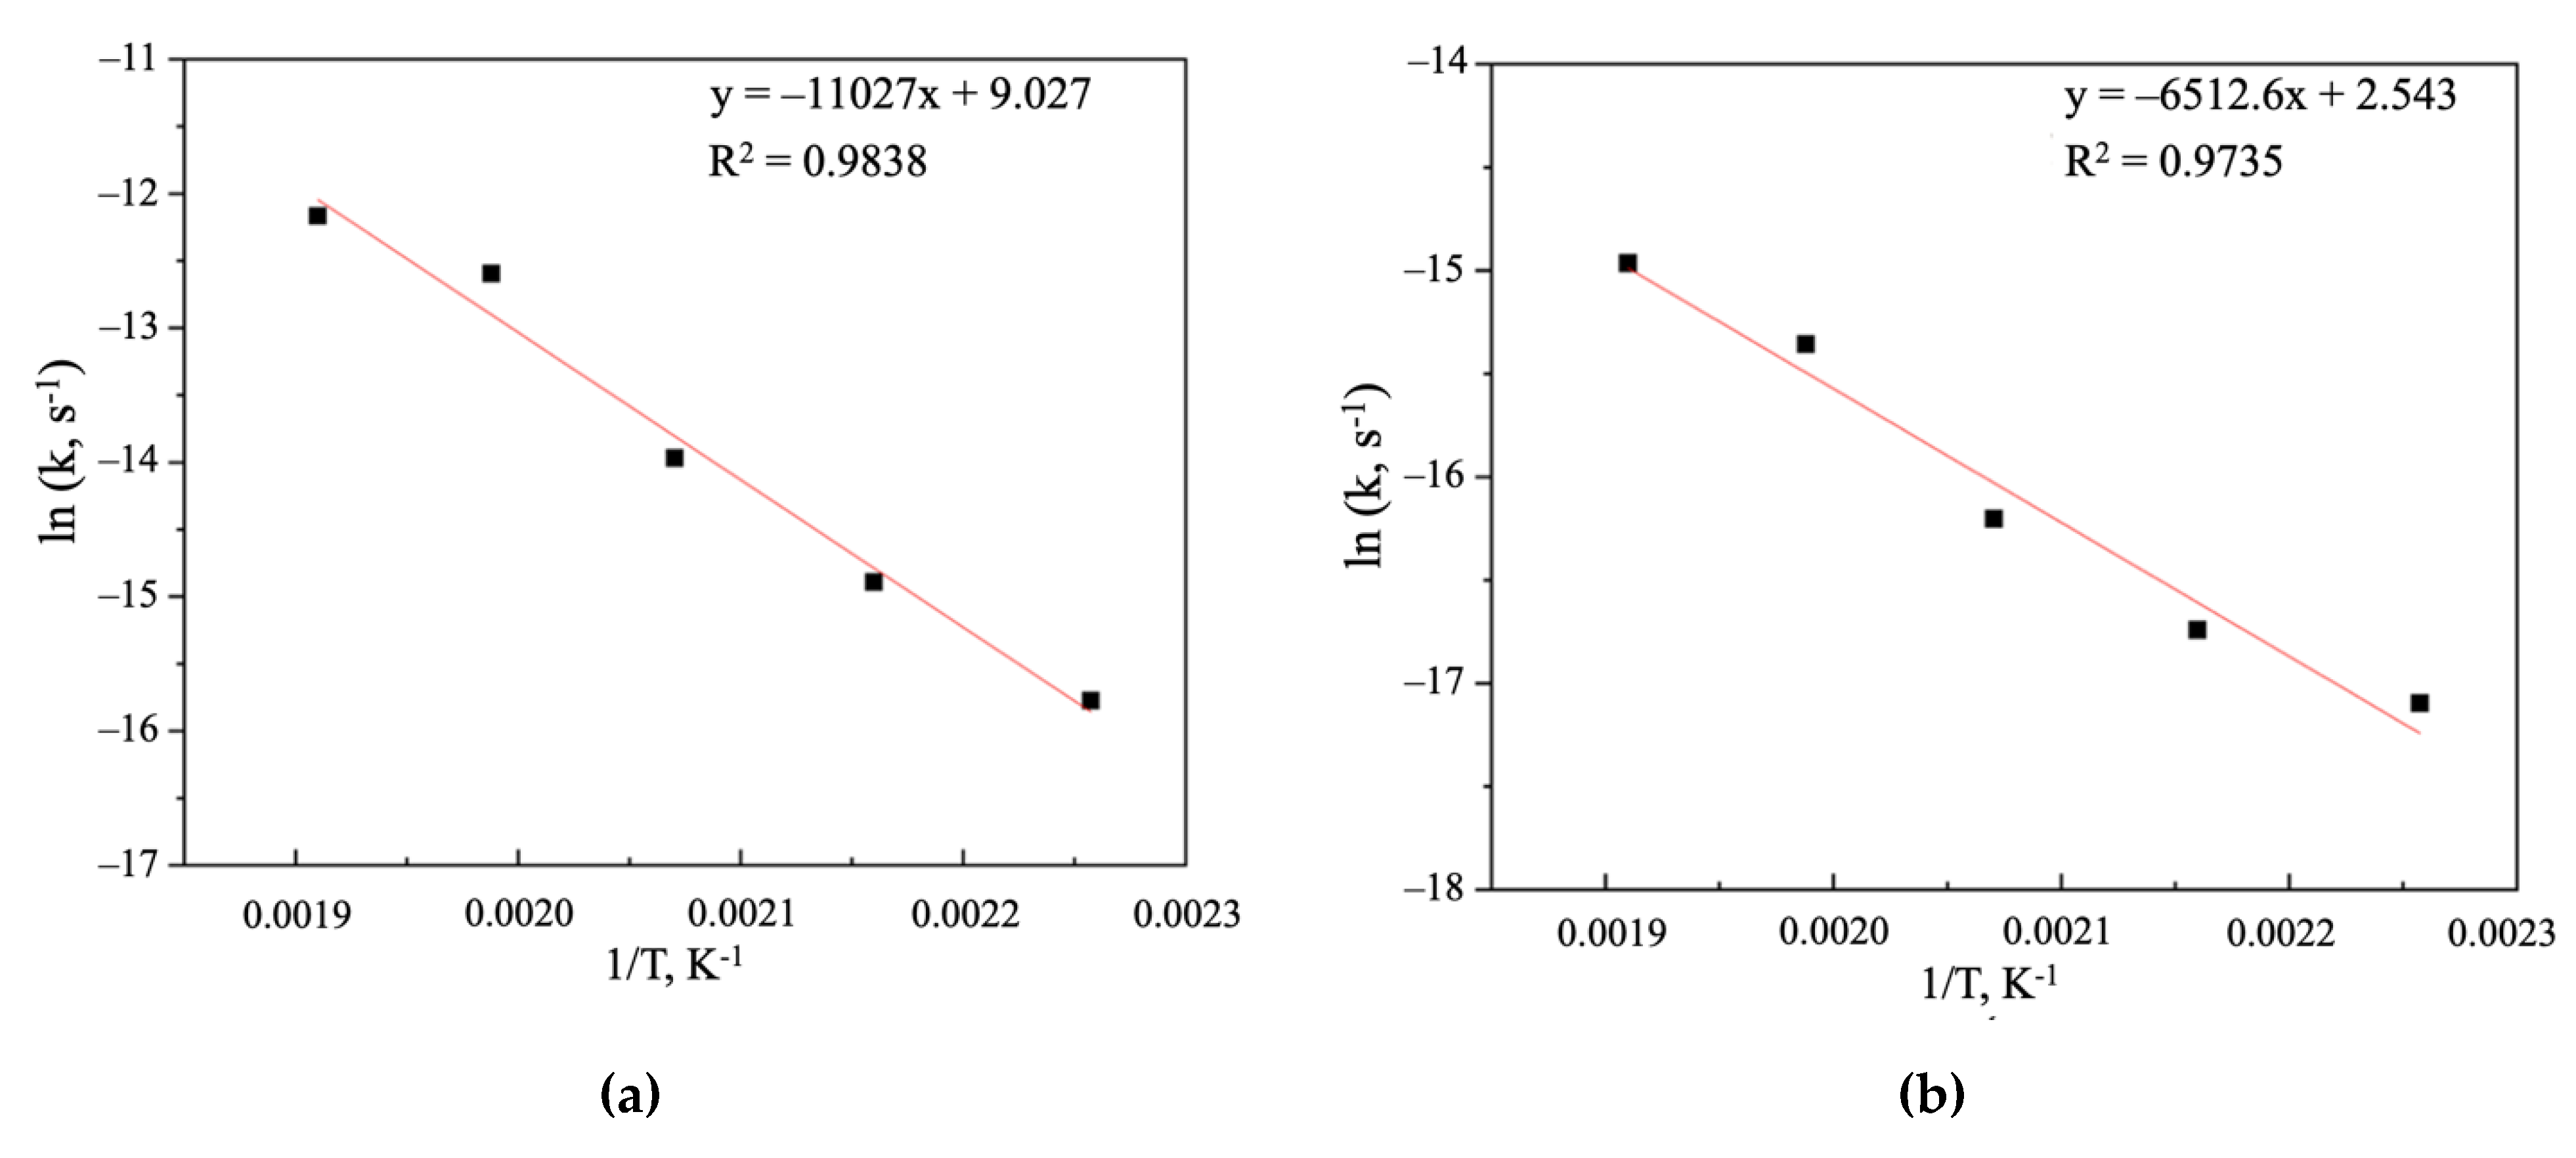
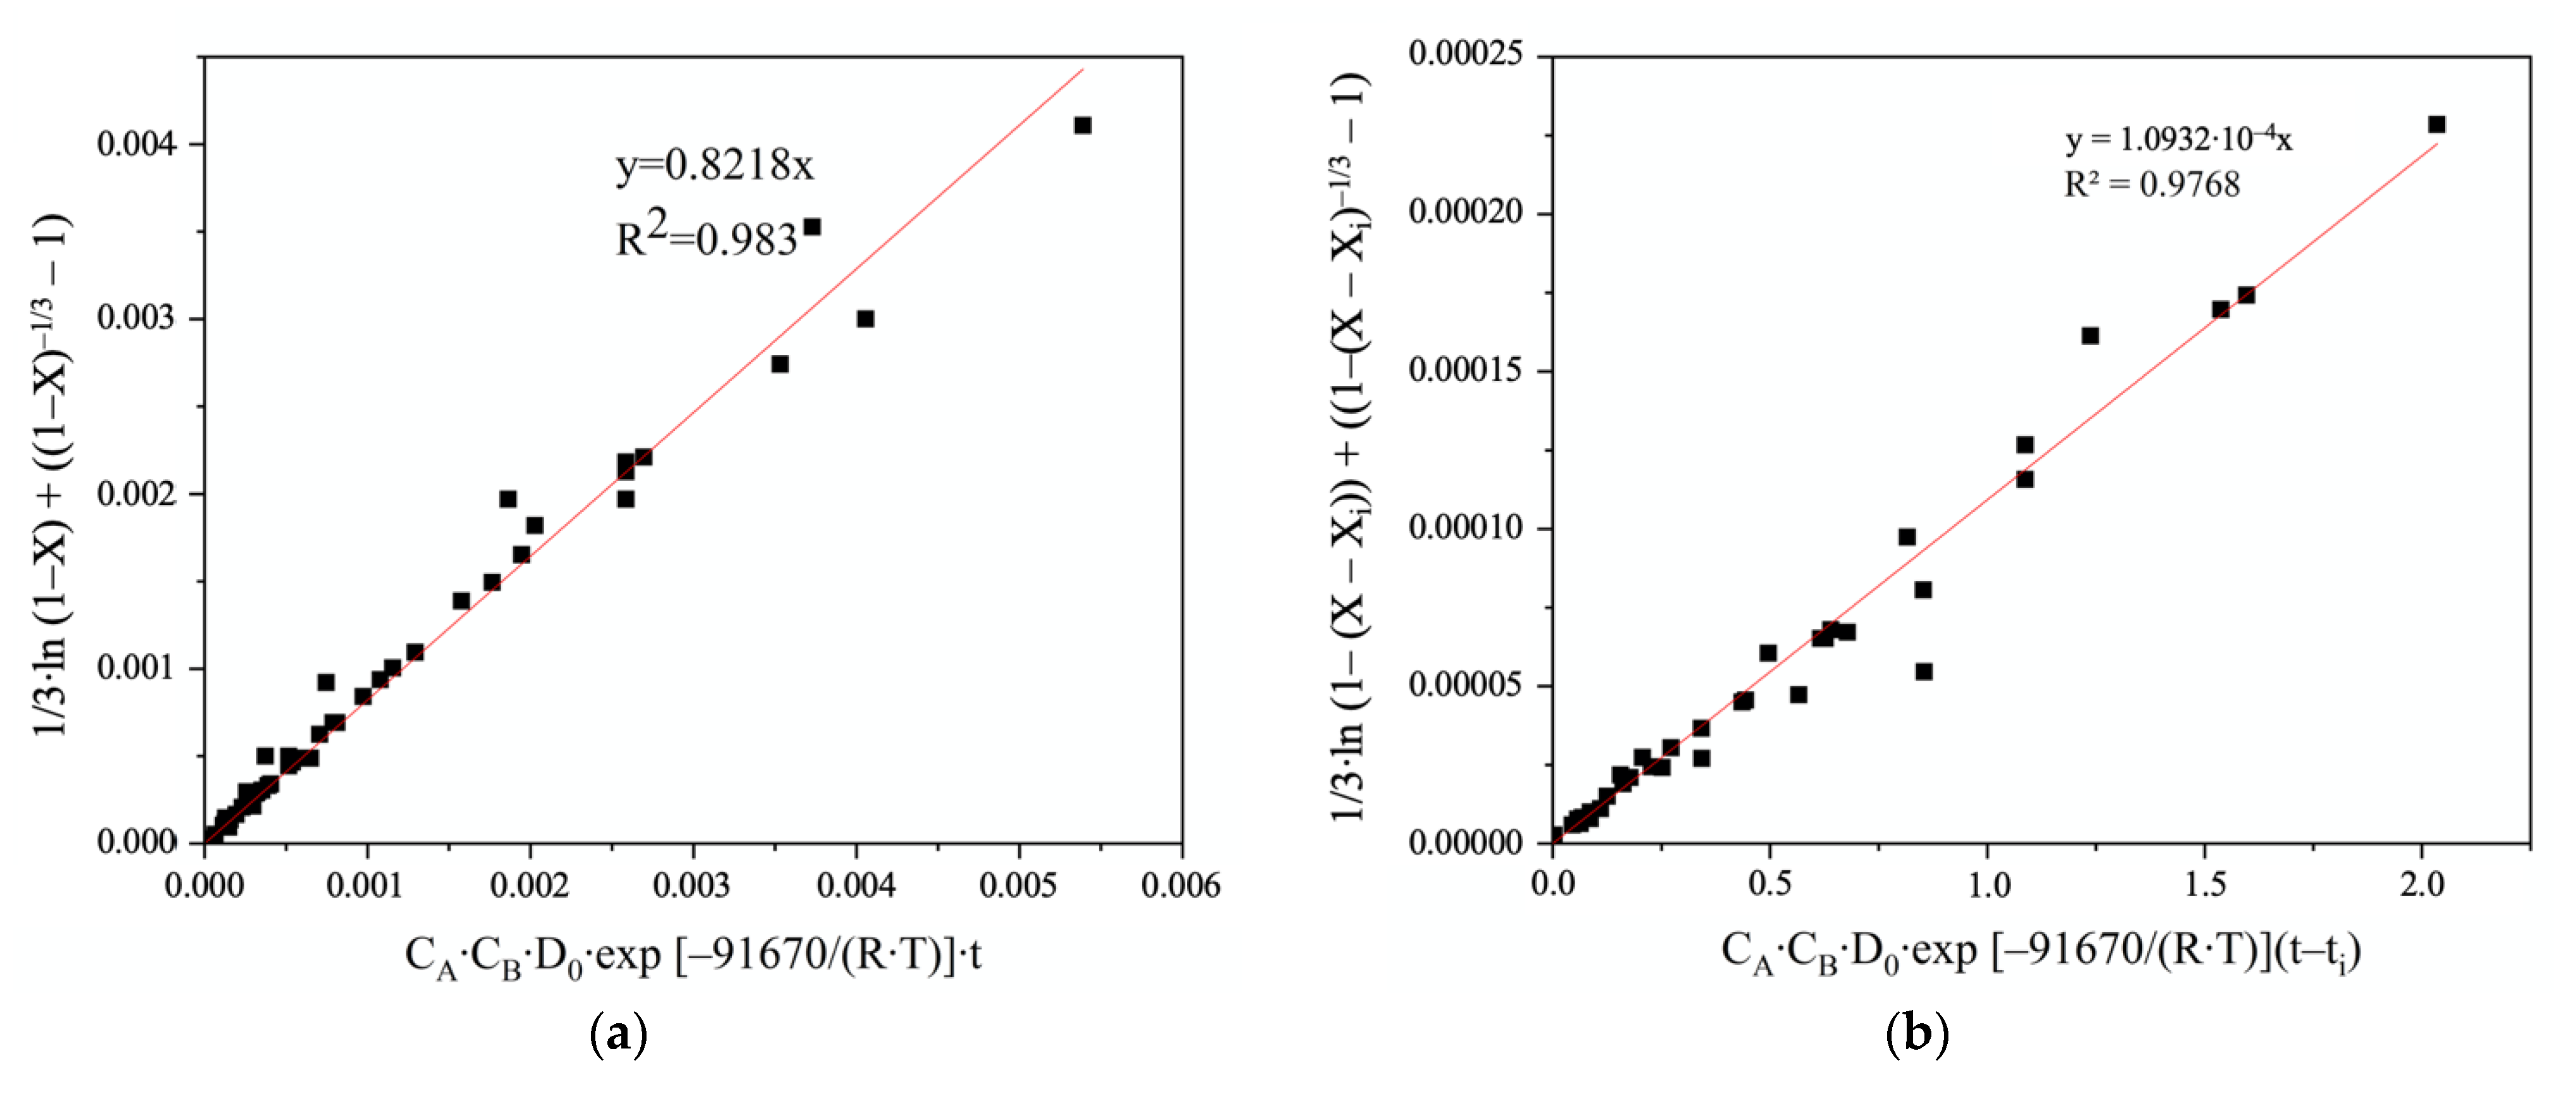
3.4. Establishment of the Kinetic Equations
4. Conclusions
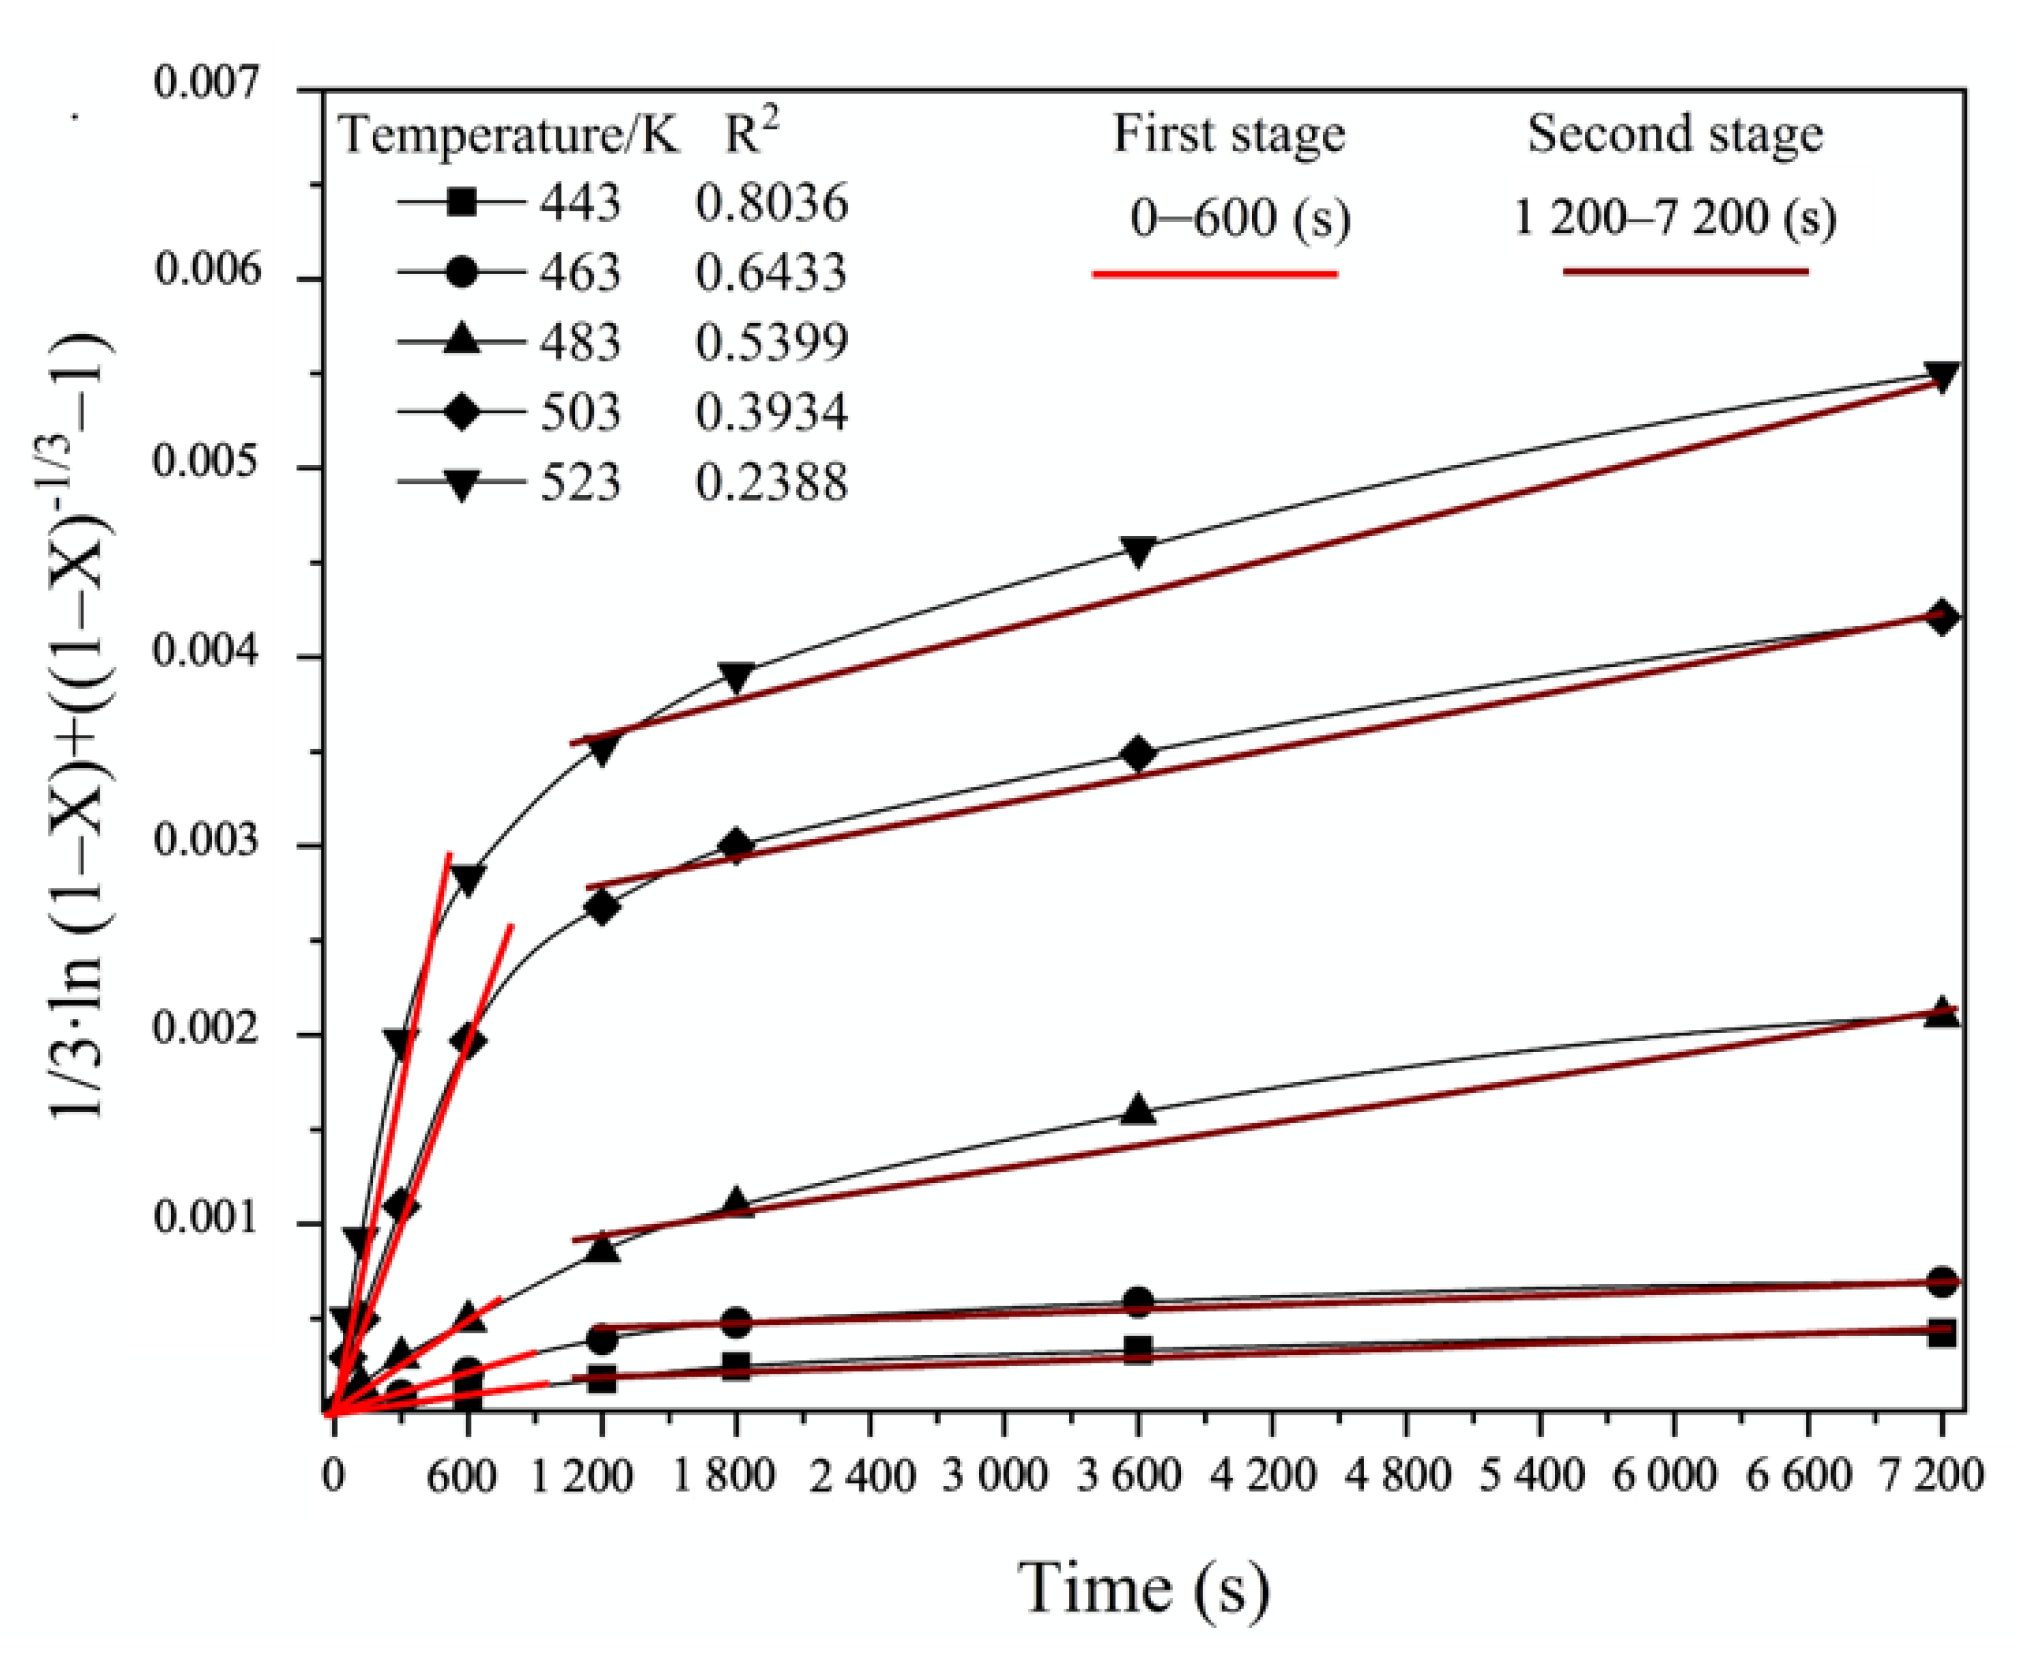
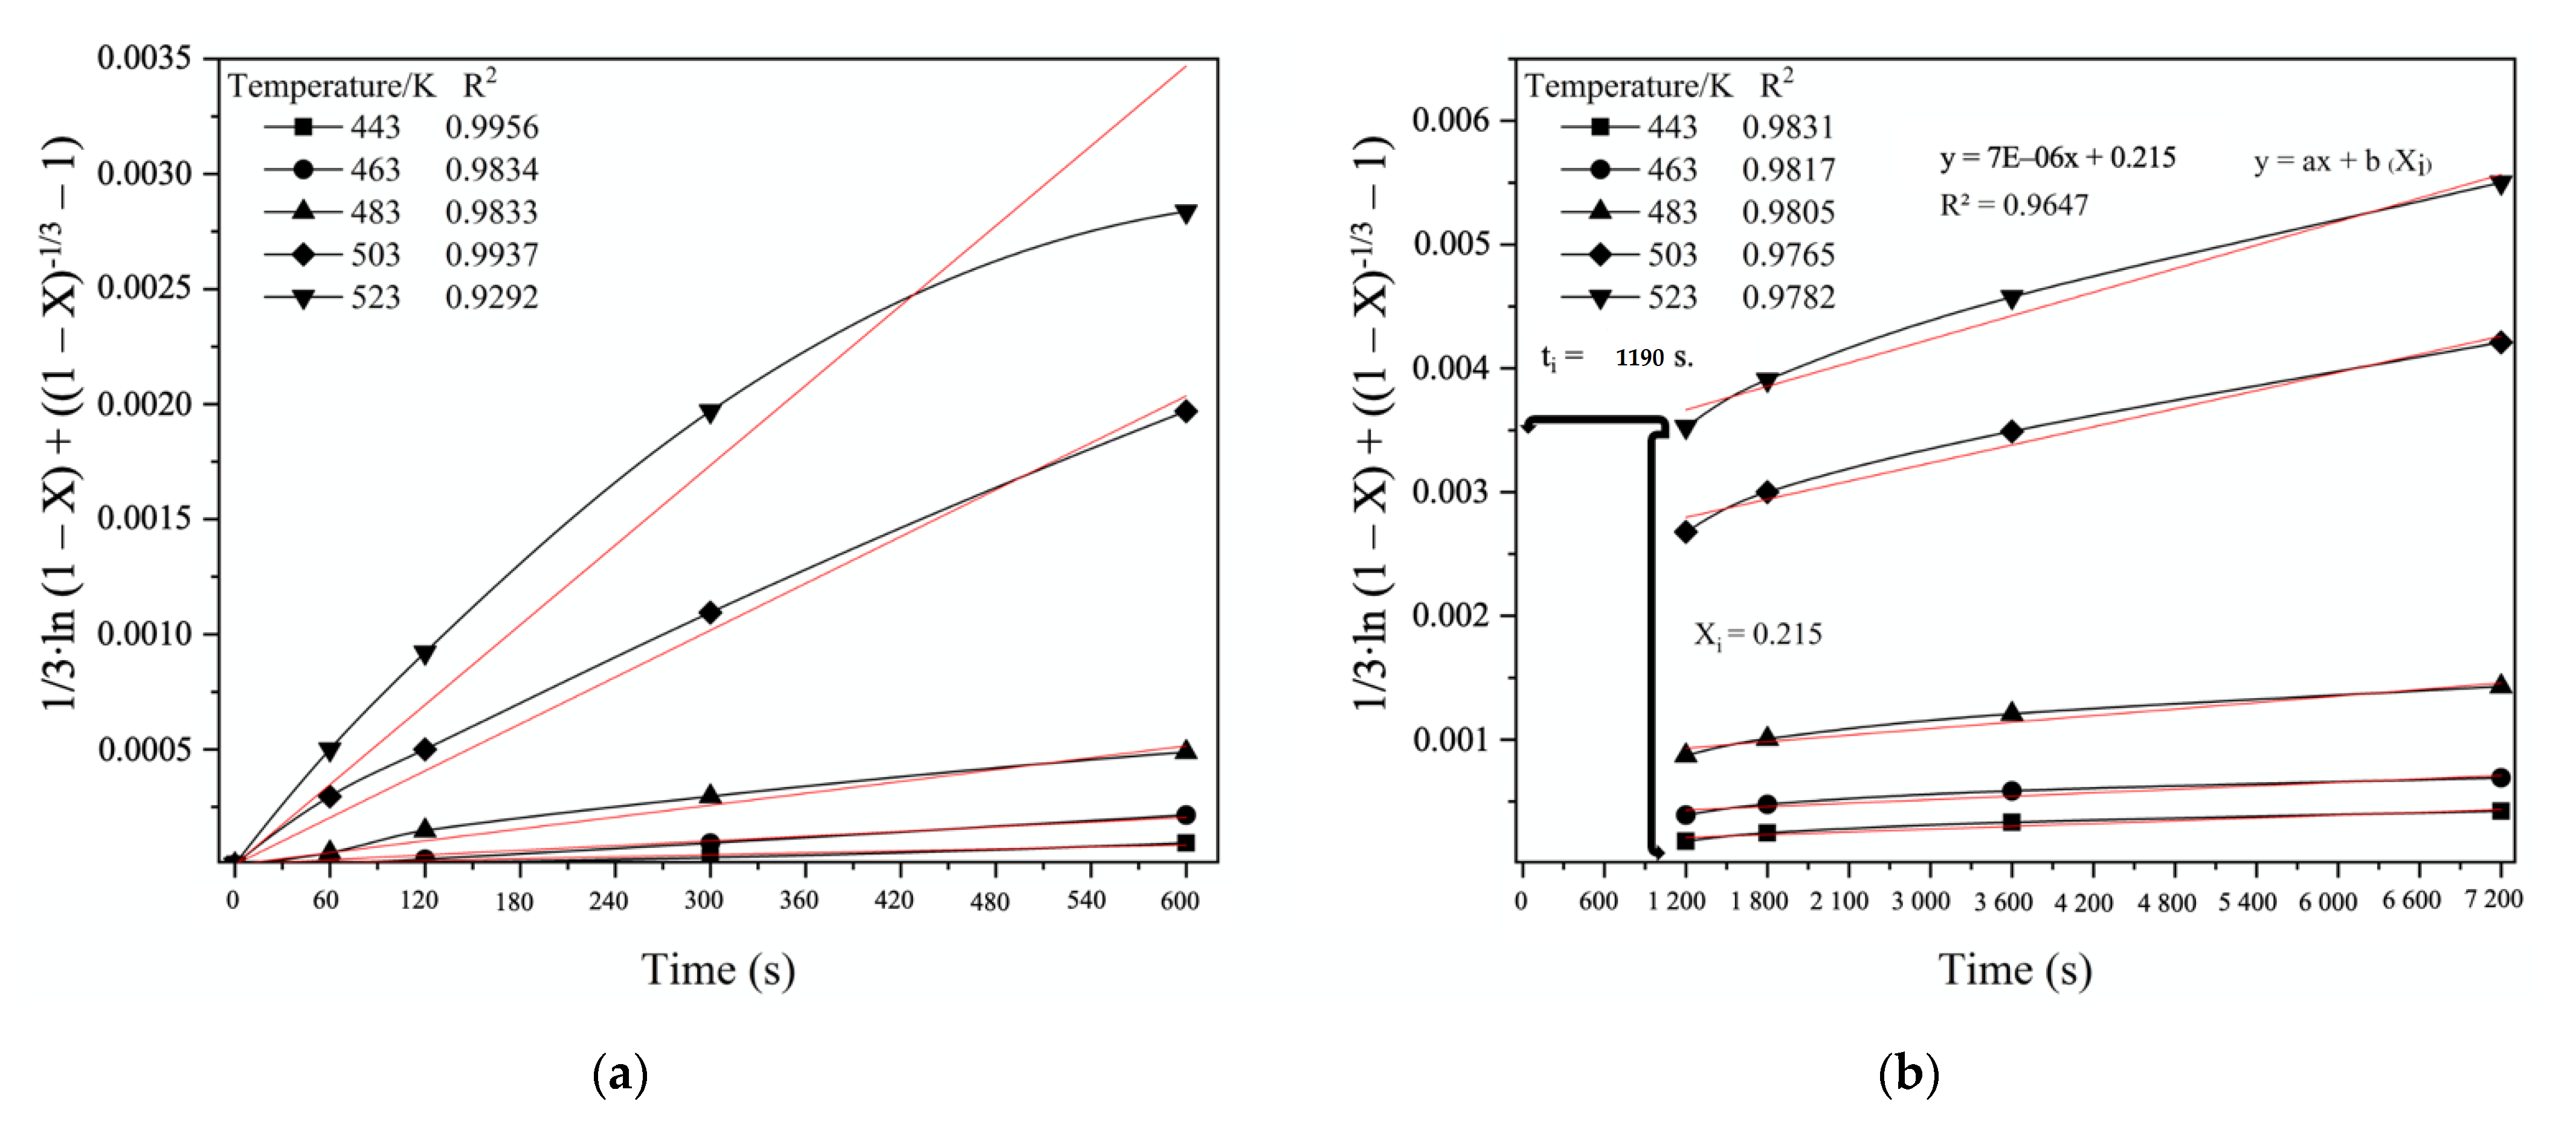
- (Stage 1) 0–600 s kinetics is controlled by mixed chemical reaction (chemical interaction of FeAsS with CuSO4 on the FeAsS surface) and diffusion (diffusion of CuSO4 across the primary Cu0-S0 layer);
- (Stage 2) 1200–7200 s kinetics is controlled by diffusion through the product layer (diffusion of CuSO4 across the condensed Cu0-S0 layer to unreacted FeAsS core).
Author Contributions
Funding
Institutional Review Board Statement
Informed Consent Statement
Data Availability Statement
Conflicts of Interest
References
- Achimovičová, M.; Baláž, P. Influence of mechanical activation on selectivity of acid leaching of arsenopyrite. Hydrometallurgy 2005, 77, 3–7. [Google Scholar] [CrossRef]
- Arkipova, G.P.; Kogan, I.A.; Tagunov, A.A. Autoclave oxidation of arsenopyrite in gold-containing products. Tr. Vses. Nauchno-Issled. Inst. Zolota Redk. Met. 1975, 35, 454–461. (In Russian) [Google Scholar]
- Berezowsky, R.M.G.S.; Collins, M.J.; Kerfoot, D.G.E.; Torres, N. The commercial status of pressure leaching technology. JOM 1991, 43, 9–15. [Google Scholar] [CrossRef]
- Berezowsky, R.M.G.S.; Weir, D.R. Pressure oxidation for treating refractory uranium and gold ores. In Proceedings of the 22nd Annual Conference of Metallurgists of CIM, Edmonton, AB, Canada, 21–24 August 1983. [Google Scholar]
- Berezowsky, R.M.G.S.; Weir, D.R. Pressure Oxidation Pretreatment of Refractory Gold. Min. Met. Explor. 1984, 1, 1–4. [Google Scholar] [CrossRef]
- Kryashchev, S.V.; Lobanova, T.A. Autoclave treatment of gold containing pyritearsenic concentrates of Sod deposit. Sov. J. Non-Ferr. Met. 1970, 2, 85–86. (In Russian) [Google Scholar]
- Kryashchev, S.V.; Berezkin, O.P.; Sirotinin, V.G.; Lobanova, T.A. Autoclave treatment of gold-containing concentrates. Sov. J. Non-Ferr. Met. 1969, 10, 15–17. (In Russian) [Google Scholar]
- Thomas, K.G. Alkaline and acidic autoclaving of refractory gold ores. JOM 1991, 43, 16–19. [Google Scholar] [CrossRef]
- Papangelakis, V.G.; Demopoulos, G.P. Acid Pressure Oxidation of Arsenopyrite: Part I, Reaction Chemistry. Can. Met. Q. 1990, 29, 1–12. [Google Scholar] [CrossRef]
- Papangelakis, V.G.; Demopoulos, G.P. Acid Pressure Oxidation of Arsenopyrite: Part II, Reaction Kinetics. Can. Met. Q. 1990, 29, 13–20. [Google Scholar] [CrossRef]
- Riveros, P.; Dutrizac, J.; Spencer, P. Arsenic Disposal Practices in the Metallurgical Industry. Can. Met. Q. 2001, 40, 395–420. [Google Scholar] [CrossRef]
- Yazawa, A.; Azakami, T. Thermodynamics of removing impurities during copper smelting. Can. Met. Q. 1969, 8, 257–261. [Google Scholar] [CrossRef]
- Taylor, P.R.; Putra, T.A.R. Pyrometallurgical Processing Technologies for Treating High Arsenic Copper Concentrates. In Celebrating the Megascale; Springer: New York, NY, USA, 2014; pp. 197–211. [Google Scholar] [CrossRef]
- Morales, A.; Cruells, M.; Roca, A.; Bergó, R. Treatment of copper flash smelter flue dusts for copper and zinc extraction and arsenic stabilization. Hydrometallurgy 2010, 105, 148–154. [Google Scholar] [CrossRef]
- Weisenberg, I.J.; Bakshi, P.S.; Vervaert, A.E. Arsenic Distribution and Control in Copper Smelters. JOM 1979, 31, 38–44. [Google Scholar] [CrossRef]
- Bartlett, R.W. Upgrading copper concentrate by hydrothermally converting chalcopyrite to digenite. Metall. Mater. Trans. B 1992, 23, 241–248. [Google Scholar] [CrossRef]
- Fuentes, G.; Viñals, J.; Herreros, O. Hydrothermal purification and enrichment of Chilean copper concentrates. Part 2: The behavior of the bulk concentrates. Hydrometallurgy 2009, 95, 113–120. [Google Scholar] [CrossRef]
- Neustroyev, V.I.; Naboichenko, S.S.; Khudyakov, I.F. Hydrothermal processing of polymetallic chalcopyrite concentrates by copper sulfate solutions. Tsvetniye Met. 1981, 4, 40–43. (In Russian) [Google Scholar]
- Viñals, J.; Fuentes, G.; Hernández, M.C.; Herreros, O. Hydrothermal removal of zinc and iron from Chilean copper concentrates. In Proceedings of the VI International Conference Metallurgy, Refractories and Environment, High Tatras, Slovakia, 25–27 May 2004; Palfy, P., Halperin, H., Solc, P., Vircikova, E., Eds.; Technical University: Kosice, Slovakia, 2004; pp. 255–260. [Google Scholar]
- Fuentes, G.; Viñals, J.; Herreros, O. Hydrothermal purification and enrichment of Chilean copper concentrates: Part 1: The behavior of bornite, covellite and pyrite. Hydrometallurgy 2009, 95, 104–112. [Google Scholar] [CrossRef]
- Naboichenko, S.S.; Neustroyev, V.I.; Pinigin, V.K.; Khudyakov, I.F. About hydrothermal interaction of chalcopyrite with copper sulfate solution. Tsvetniye Met. 1978, 6, 8–11. (In Russian) [Google Scholar]
- Naboichenko, S.S.; Lebed, A.B. Hydrothermal interactions in the system CuS–CuSO4. Izv. Vyss. Uchebnykh Zaved. Tsvetnaya Metall. 1984, 6, 99–102. (In Russian) [Google Scholar]
- Peterson, R.D.; Wadsworth, M.E. Solid, solution reactions in the hydrothermal enrichment of chalcopyrite at elevated temperatures. In Proceedings of the EPD Congress, San Francisco, CA, February, 27 February–3 March 1993; Warren, G.W., Ed.; TMS: Warrendale, PA, USA, 1994; pp. 275–291. [Google Scholar]
- Zies, E.G. Some reactions involved in secondary copper sulphide enrichment. Econ. Geol. 1916, 11, 407–503. [Google Scholar] [CrossRef] [Green Version]
- Naboichenko, S.S.; Neustroev, V.I.; Pinigin, V.K.; Khudyakov, I.F. Kinetics and mechanism of the hydrothermal interaction of sphalerite with copper sulfate. Izv. Vyss. Uchebnykh Zaved. Tsvetnaya Metall. 1979, 5, 18–23. (In Russian) [Google Scholar]
- Naboichenko, S.S.; Khudyakov, I.F. Properties of hydrothermal interactions of sulfide materials with copper sulfate solution. Tsvetniye Met. 1981, 8, 19–23. (In Russian) [Google Scholar]
- Neustroyev, V.I.; Naboichenko, S.S. About hydrothermal interaction of pyrite with copper sulfate solution. Izv. Vyss. Uchebnykh Zaved. Tsvetnaya Metall. 1980, 1, 22–28. (In Russian) [Google Scholar]
- Viñals, J.; Fuentes, G.; Hernández, M.; Herreros, O. Transformation of sphalerite particles into copper sulfide particles by hydrothermal treatment with Cu(II) ions. Hydrometallurgy 2004, 75, 177–187. [Google Scholar] [CrossRef]
- Fuentes, G. Arsenic extraction from Chilean copper concentrates. In Proceedings of the 58th Annual Conference of Metallurgists (Com) Hosting The 10th International Copper Conference 2019, Vancouver, BC, Canada, 18–21 August 2019. [Google Scholar]
- Dreisinger, D. Copper leaching from primary sulfides: Options for biological and chemical extraction of copper. Hydrometallurgy 2006, 83, 10–20. [Google Scholar] [CrossRef]
- Levenspiel, O. Chemical Reaction Engineering, 3rd ed.; Wiley: New York, NY, USA, 1999; ISBN 978-0-471-25424-9. [Google Scholar]
- Naboichenko, S.S.; Ni, L.P.; Shneerson, Y.M.; Chugaev, L.V. Autoclave Hydrometallurgy of Non-Ferrous Metals, 2nd ed.; UGTU-UPI: Yekaterinburg, Russia, 2002. (In Russian) [Google Scholar]
- Sohn, H.Y.; Wadsworth, M.E. Rate Processes of Extractive Metallurgy; Plenum Press: New York, NY, USA, 1979; 472p. [Google Scholar] [CrossRef]
- Bronusiene, A.; Ancutiene, I. Elemental sulfur as a precursor for CuxS layer formation. Chalcogenide Lett. 2018, 15, 483–489. [Google Scholar]
- Dickinson, C.F.; Heal, G.R. Solid–liquid diffusion controlled rate equations. Thermochim. Acta 1999, 340–341, 89–103. [Google Scholar] [CrossRef]
- Rogozhnikov, D.; Karimov, K.; Shoppert, A.; Dizer, O.; Naboichenko, S. Kinetics and mechanism of arsenopyrite leaching in nitric acid solutions in the presence of pyrite and Fe(III) ions. Hydrometallurgy 2021, 199, 105525. [Google Scholar] [CrossRef]
- Tsuchida, H.; Narita, E.; Takeuchi, H.; Adachi, M.; Okabe, T. Manufacture of High Pure Titanium(IV) Oxide by the Chloride Process. I. Kinetic Study on Leaching of Ilmenite Ore in Concentrated Hydrochloric Acid Solution. Bull. Chem. Soc. Jpn. 1982, 55, 1934–1938. [Google Scholar] [CrossRef] [Green Version]
- Paspaliaris, Y.; Tsolakis, Y. Reaction kinetics for the leaching of iron oxides in diasporic bauxite from the parnassus-giona zone (Greece) by hydrochloric acid. Hydrometallurgy 1987, 19, 259–266. [Google Scholar] [CrossRef]
- Olanipekun, E. A kinetic study of the leaching of a Nigerian ilmenite ore by hydrochloric acid. Hydrometallurgy 1999, 53, 1–10. [Google Scholar] [CrossRef]


| Size Fraction (μm) | Weight Percent (%) |
|---|---|
| 100+ | 1.1 |
| 71–100 | 4.8 |
| 45–71 | 10.1 |
| 29–45 | 16.8 |
| 10–29 | 57.2 |
| 0–10 | 10 |
| №/Component | Cu | Fe | As | S |
|---|---|---|---|---|
| 1 | 44.38 | 16.97 | 24.40 | 14.26 |
| 2 | 43.98 | 18.90 | 26.30 | 10.81 |
| №\Element | Fe | As | S | Cu | Total |
|---|---|---|---|---|---|
| Point 1 | 37.79 | 44.26 | 17.95 | 0 | 100 |
| Point 2 | 38.02 | 44.06 | 17.92 | 0 | 100 |
| Point 3 | 37.02 | 45.30 | 17.68 | 0 | 100 |
| Point 4 | 35.28 | 47.33 | 17.39 | 0 | 100 |
| Point 5 | 37.91 | 45.69 | 16.40 | 0 | 100 |
| Point 6 | 35.00 | 46.64 | 18.36 | 0 | 100 |
| Point 7 | 35.14 | 45.97 | 18.89 | 0 | 100 |
| Point 8 | 35.09 | 46.72 | 17.96 | 0.24 | 100 |
| Point 9 | 27.69 | 37.89 | 24.18 | 10.24 | 100 |
| Point 10 | 2.72 | 1.46 | 20.97 | 74.84 | 100 |
| Point 11 | 35.46 | 45.72 | 18.16 | 0.67 | 100 |
| Point 12 | 30.01 | 40.36 | 24.85 | 4.78 | 100 |
| Point 13 | 23.01 | 34.79 | 19.21 | 22.99 | 100 |
| Point 14 | 33.77 | 40.31 | 18.85 | 7.07 | 100 |
| Point 15 | 28.62 | 38.21 | 18.74 | 14.43 | 100 |
| Point 16 | 19.93 | 31.68 | 19.08 | 29.31 | 100 |
| Point 17 | 27.51 | 40.62 | 18.71 | 13.16 | 100 |
| Point 18 | 26.02 | 37.19 | 19.7 | 17.09 | 100 |
| Point 19 | 30.03 | 45.37 | 18.43 | 6.17 | 100 |
| Point 20 | 7.04 | 11.49 | 19.09 | 62.38 | 100 |
| Point 21 | 6.9 | 10.29 | 15.36 | 67.65 | 100 |
| Point 22 | 34.69 | 43.37 | 18.25 | 3.70 | 100 |
| Point 23 | 29.52 | 39.49 | 18.25 | 12.09 | 100 |
| Point 24 | 32.26 | 41.33 | 16.43 | 9.98 | 100 |
| Point 25 | 26.84 | 36.79 | 17.16 | 19.21 | 100 |
| Point 26 | 0 | 0.3 | 0.46 | 99.12 | 100 |
| № | Limiting Step | Equation |
|---|---|---|
| A | Diffusion through the product layer | |
| B | New shrinking core model | |
| C | Surface chemical reactions |
| № | SCM Equation | R2 | ||||
|---|---|---|---|---|---|---|
| 443 K | 463 K | 483 K | 503 K | 523 K | ||
| A | 0.7938 | 0.6274 | 0.5085 | 0.3236 | 0.1373 | |
| B | 0.8036 | 0.6433 | 0.5399 | 0.3934 | 0.2388 | |
| C | 0.3384 | 0.0795 | −0.322 | −0.6867 | −0.1044 | |
| № | SCM Equation | R2 | ||||
|---|---|---|---|---|---|---|
| 443 K | 463 K | 483 K | 503 K | 523 K | ||
| Stage 1 | ||||||
| A | 0.9463 | 0.9792 | 0.9694 | 0.9816 | 0.9101 | |
| B | 0.9956 | 0.9834 | 0.9833 | 0.9937 | 0.9292 | |
| C | 0.9773 | 0.9425 | 0.6445 | 0.6224 | 0.4826 | |
| Stage 2 | ||||||
| A | 0.9519 | 0.9518 | 0.8909 | 0.9605 | 0.9814 | |
| B | 0.9831 | 0.9817 | 0.9805 | 0.9765 | 0.9782 | |
| C | 0.9568 | 0.9671 | 0.8977 | 0.9649 | 0.9853 | |
Publisher’s Note: MDPI stays neutral with regard to jurisdictional claims in published maps and institutional affiliations. |
© 2021 by the authors. Licensee MDPI, Basel, Switzerland. This article is an open access article distributed under the terms and conditions of the Creative Commons Attribution (CC BY) license (https://creativecommons.org/licenses/by/4.0/).
Share and Cite
Kritskii, A.; Naboichenko, S. Hydrothermal Treatment of Arsenopyrite Particles with CuSO4 Solution. Materials 2021, 14, 7472. https://doi.org/10.3390/ma14237472
Kritskii A, Naboichenko S. Hydrothermal Treatment of Arsenopyrite Particles with CuSO4 Solution. Materials. 2021; 14(23):7472. https://doi.org/10.3390/ma14237472
Chicago/Turabian StyleKritskii, Aleksei, and Stanislav Naboichenko. 2021. "Hydrothermal Treatment of Arsenopyrite Particles with CuSO4 Solution" Materials 14, no. 23: 7472. https://doi.org/10.3390/ma14237472
APA StyleKritskii, A., & Naboichenko, S. (2021). Hydrothermal Treatment of Arsenopyrite Particles with CuSO4 Solution. Materials, 14(23), 7472. https://doi.org/10.3390/ma14237472