
Impact of Carbon Particle Character on the Cement-Based Composite Electrical Resistivity

 , , ,
, , ,
Abstract
:1. Introduction
2. Materials
2.1. The Bonding Agent
2.2. Fillers
2.2.1. Silica Sands
2.2.2. Limestone
2.3. Admixture
2.4. Primary Conductive Fillers
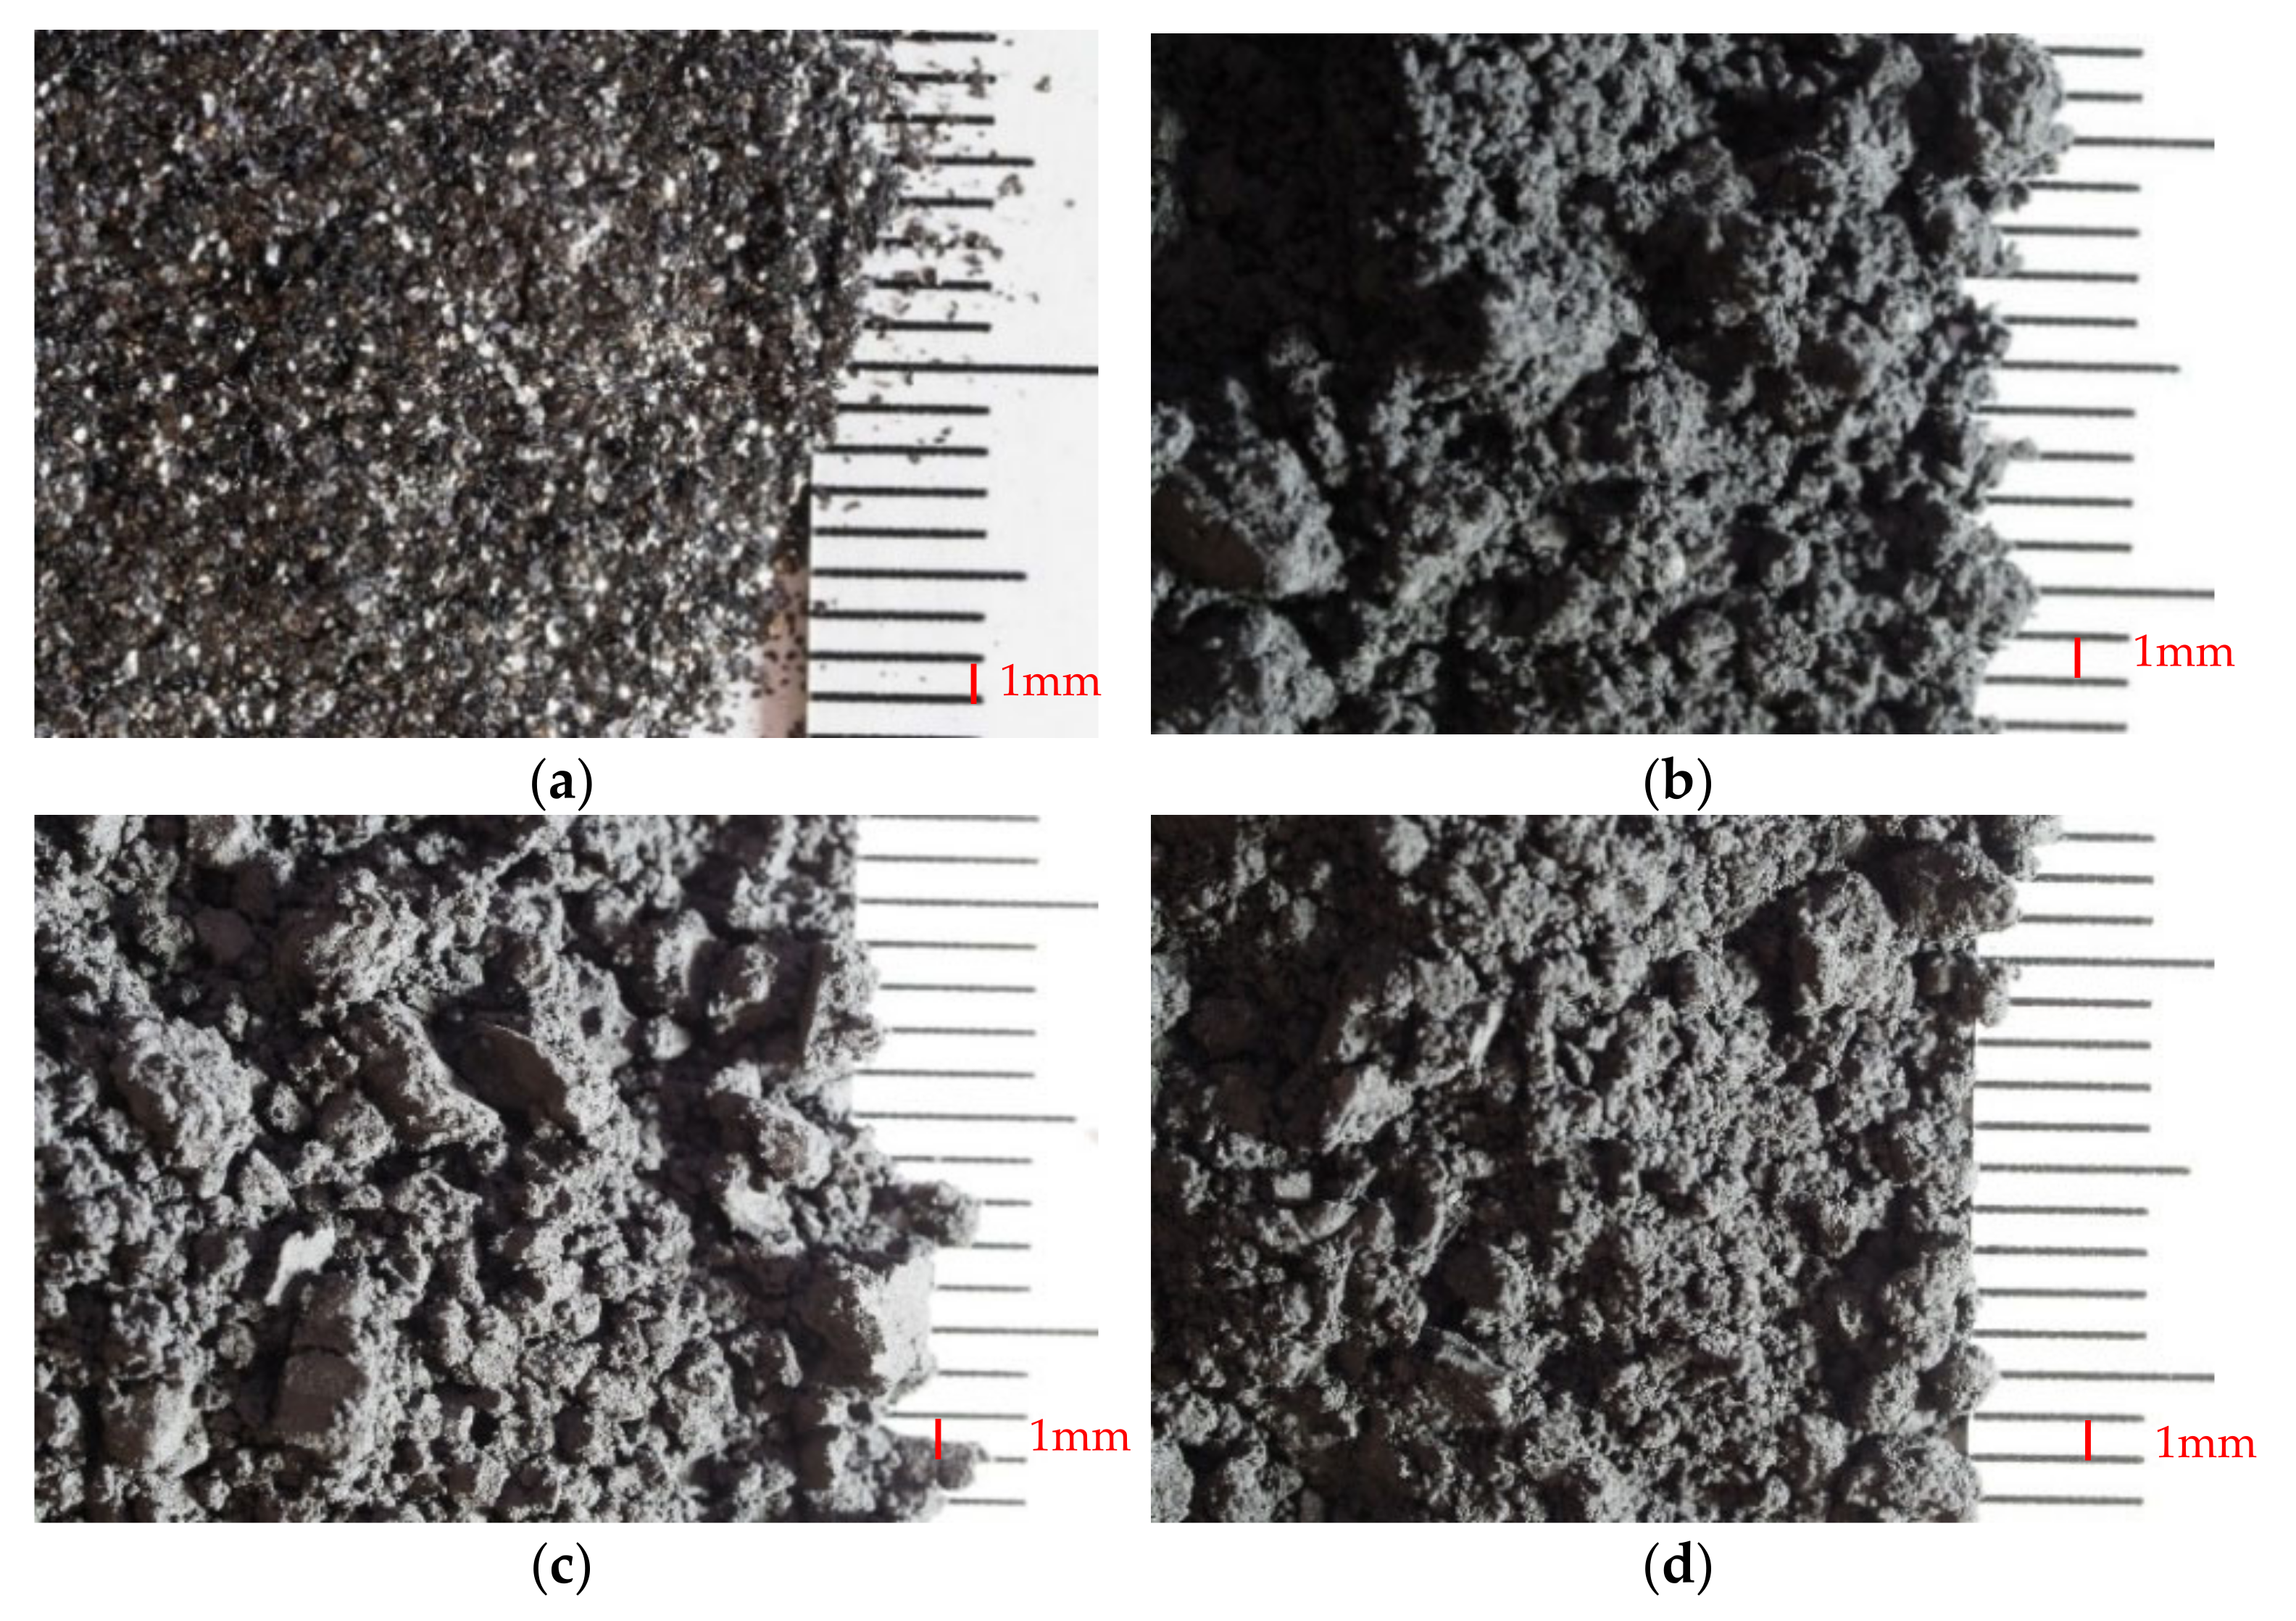
2.4.1. Supragraphite C300
2.4.2. Micrographite C4
2.4.3. Condufit C4
2.4.4. Micrographite UC4
2.5. Formulae
2.5.1. Cement Paste
2.5.2. The Cement Composites
3. Methods
3.1. Loose Bulk Density of the Fillers
3.2. Volumetric Density
3.3. Specific Weight
3.4. Establishing the Distribution of Particles and Sieve Analysis
3.5. Specific Surface
3.6. Material Water Absorption Capacity
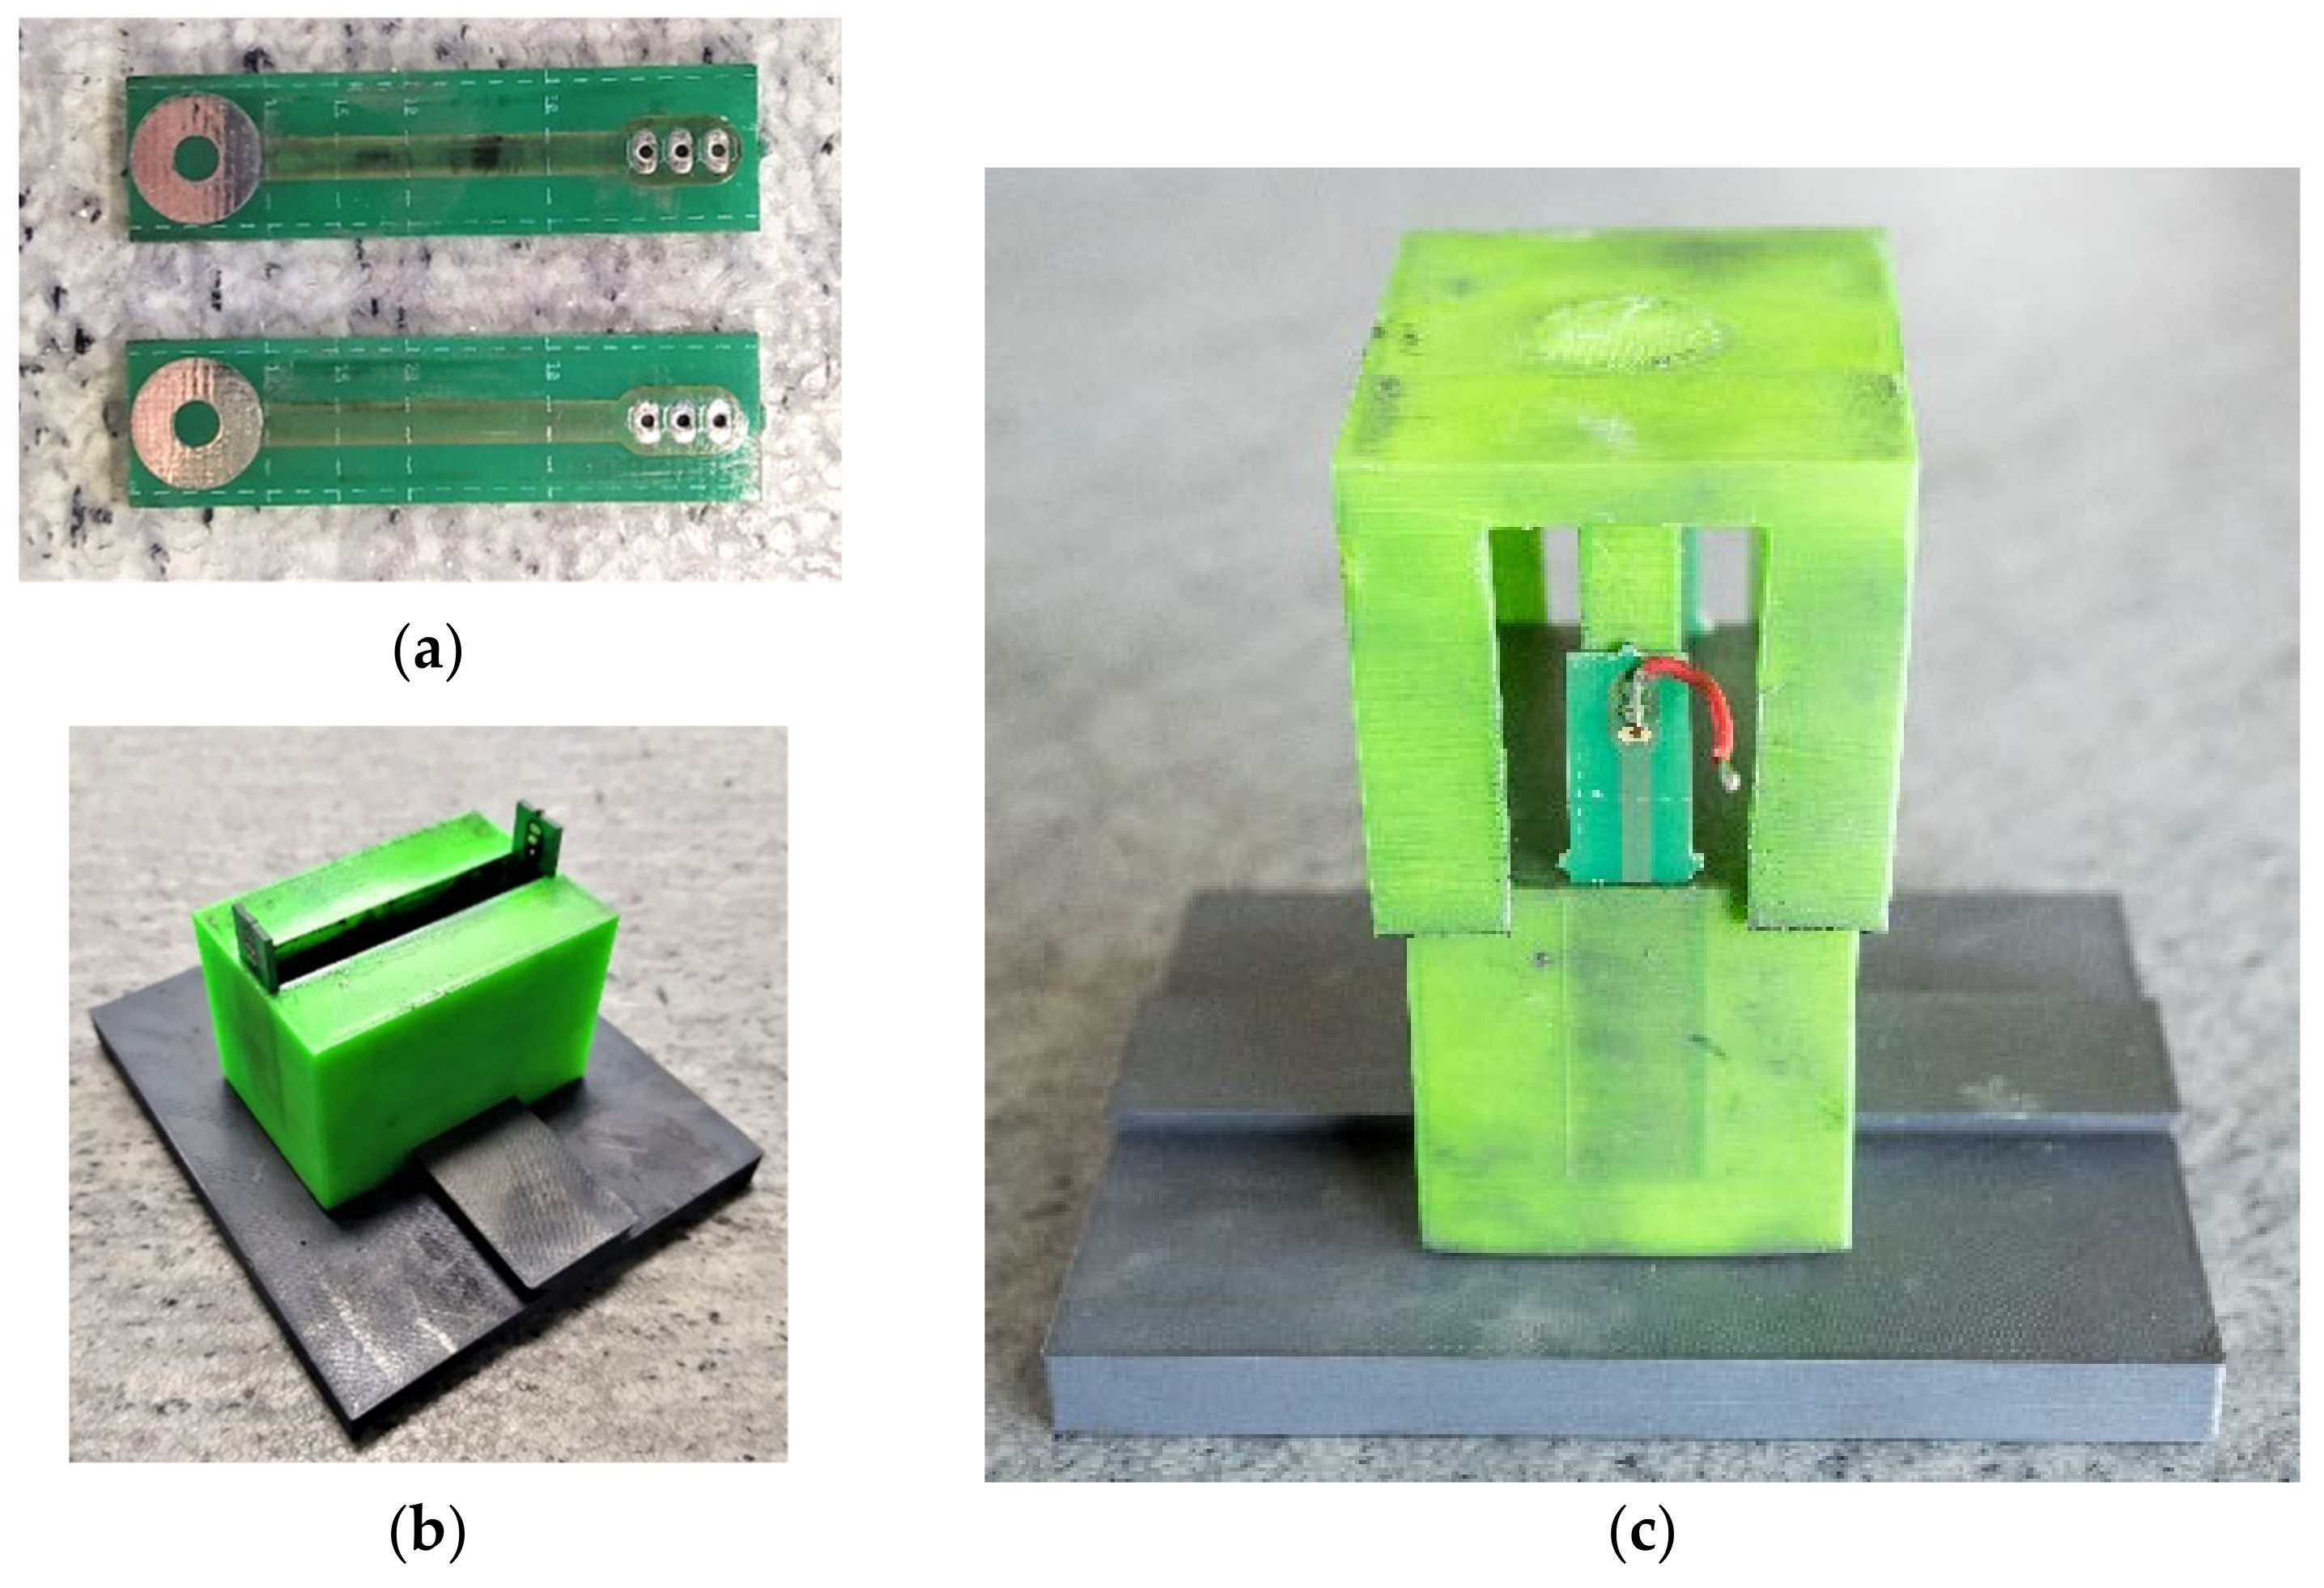
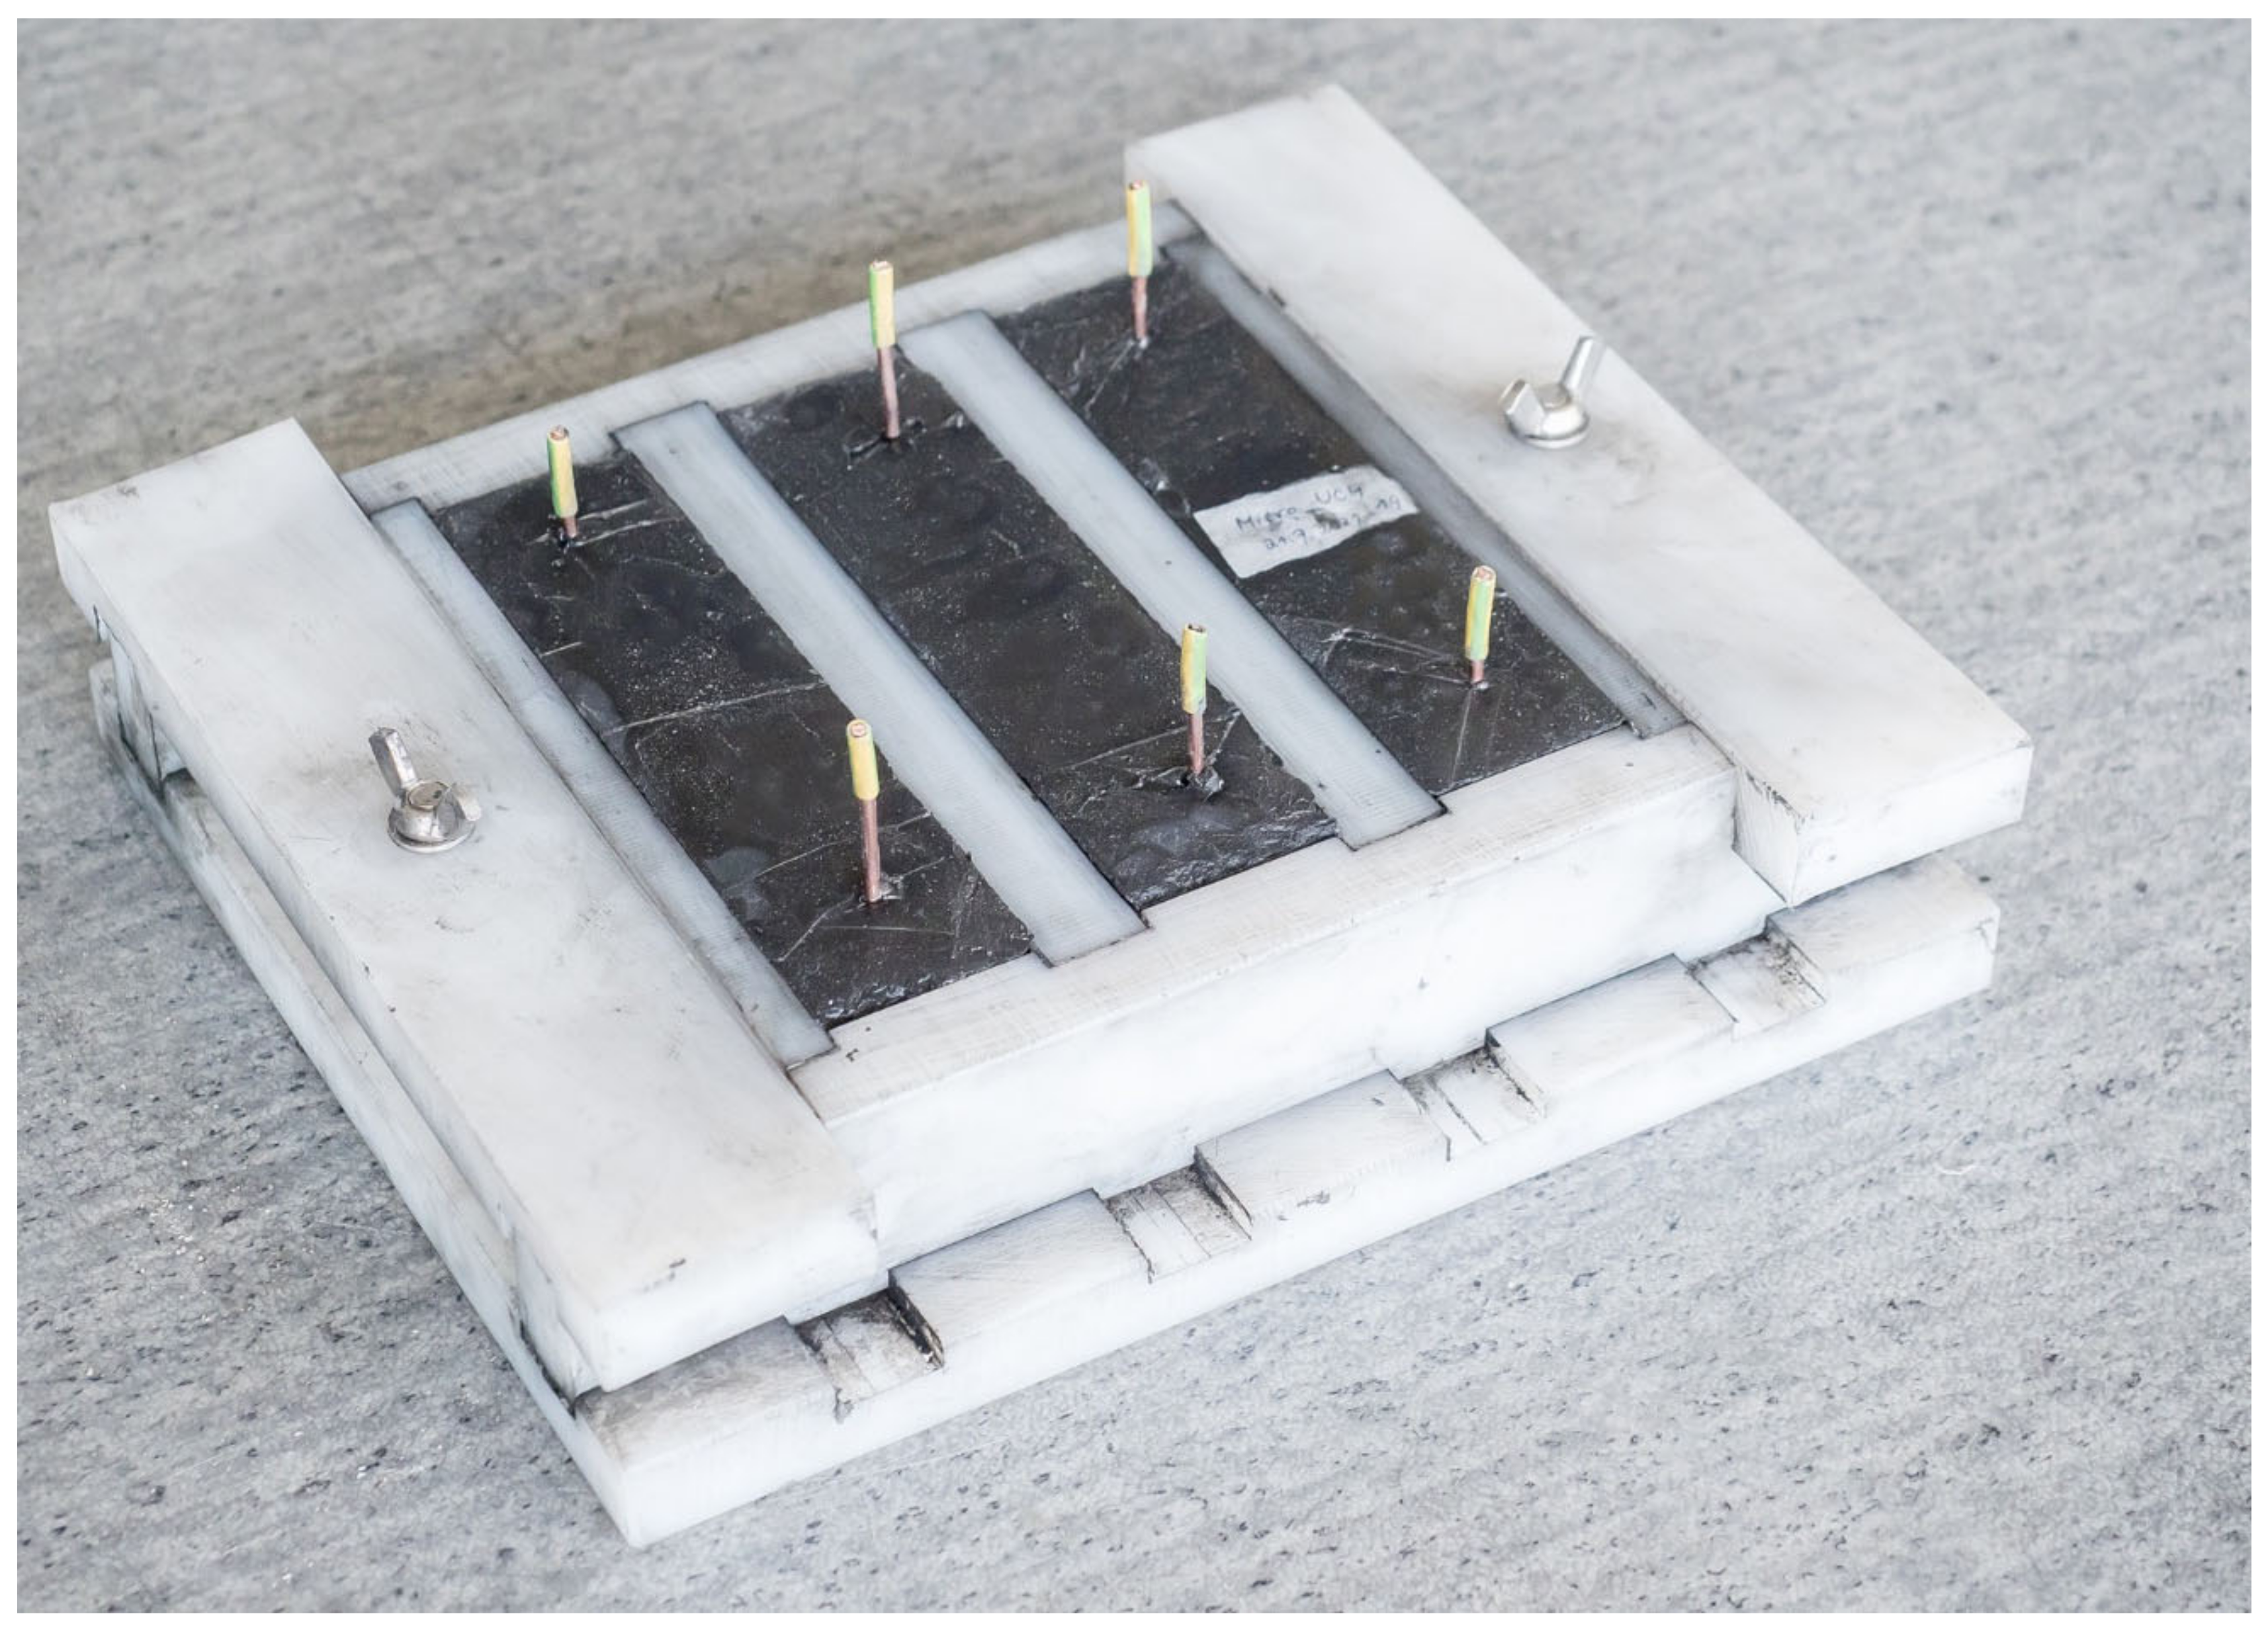
3.7. Determination of the Resistivity of Materials
3.8. Determination of the Processability of the Fresh Mixture
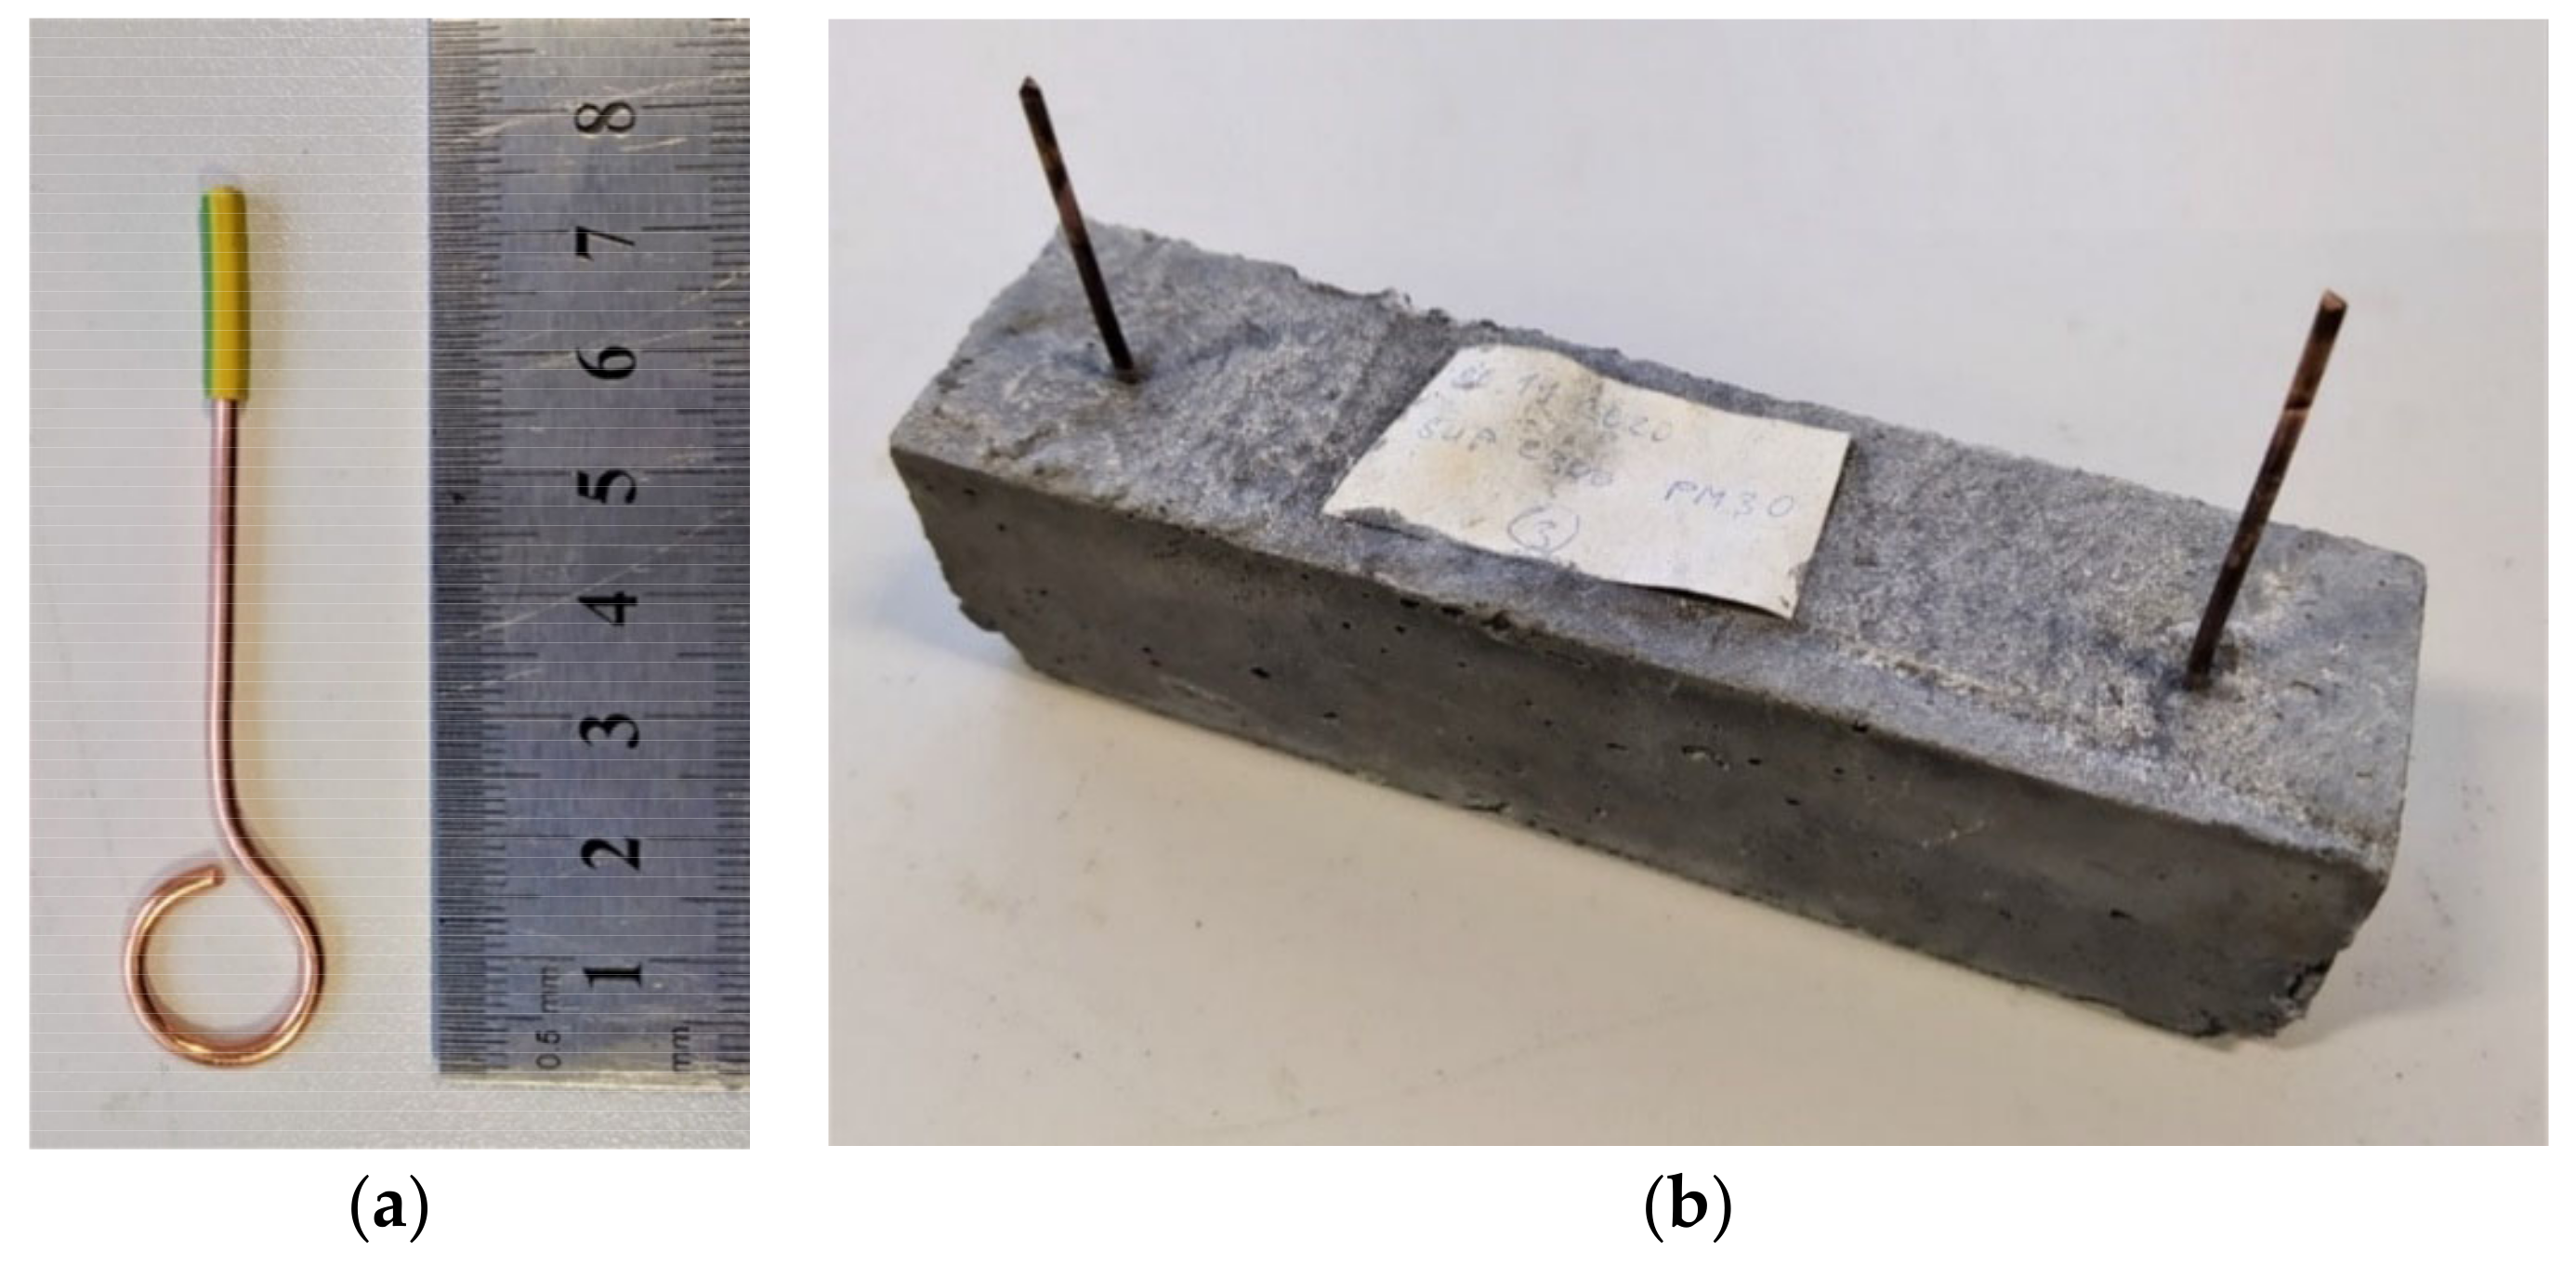
3.9. The Production and Storage of Test Specimens
3.10. Determining the Resistivity of Cured Specimens
3.11. Verification of Mechanical Properties
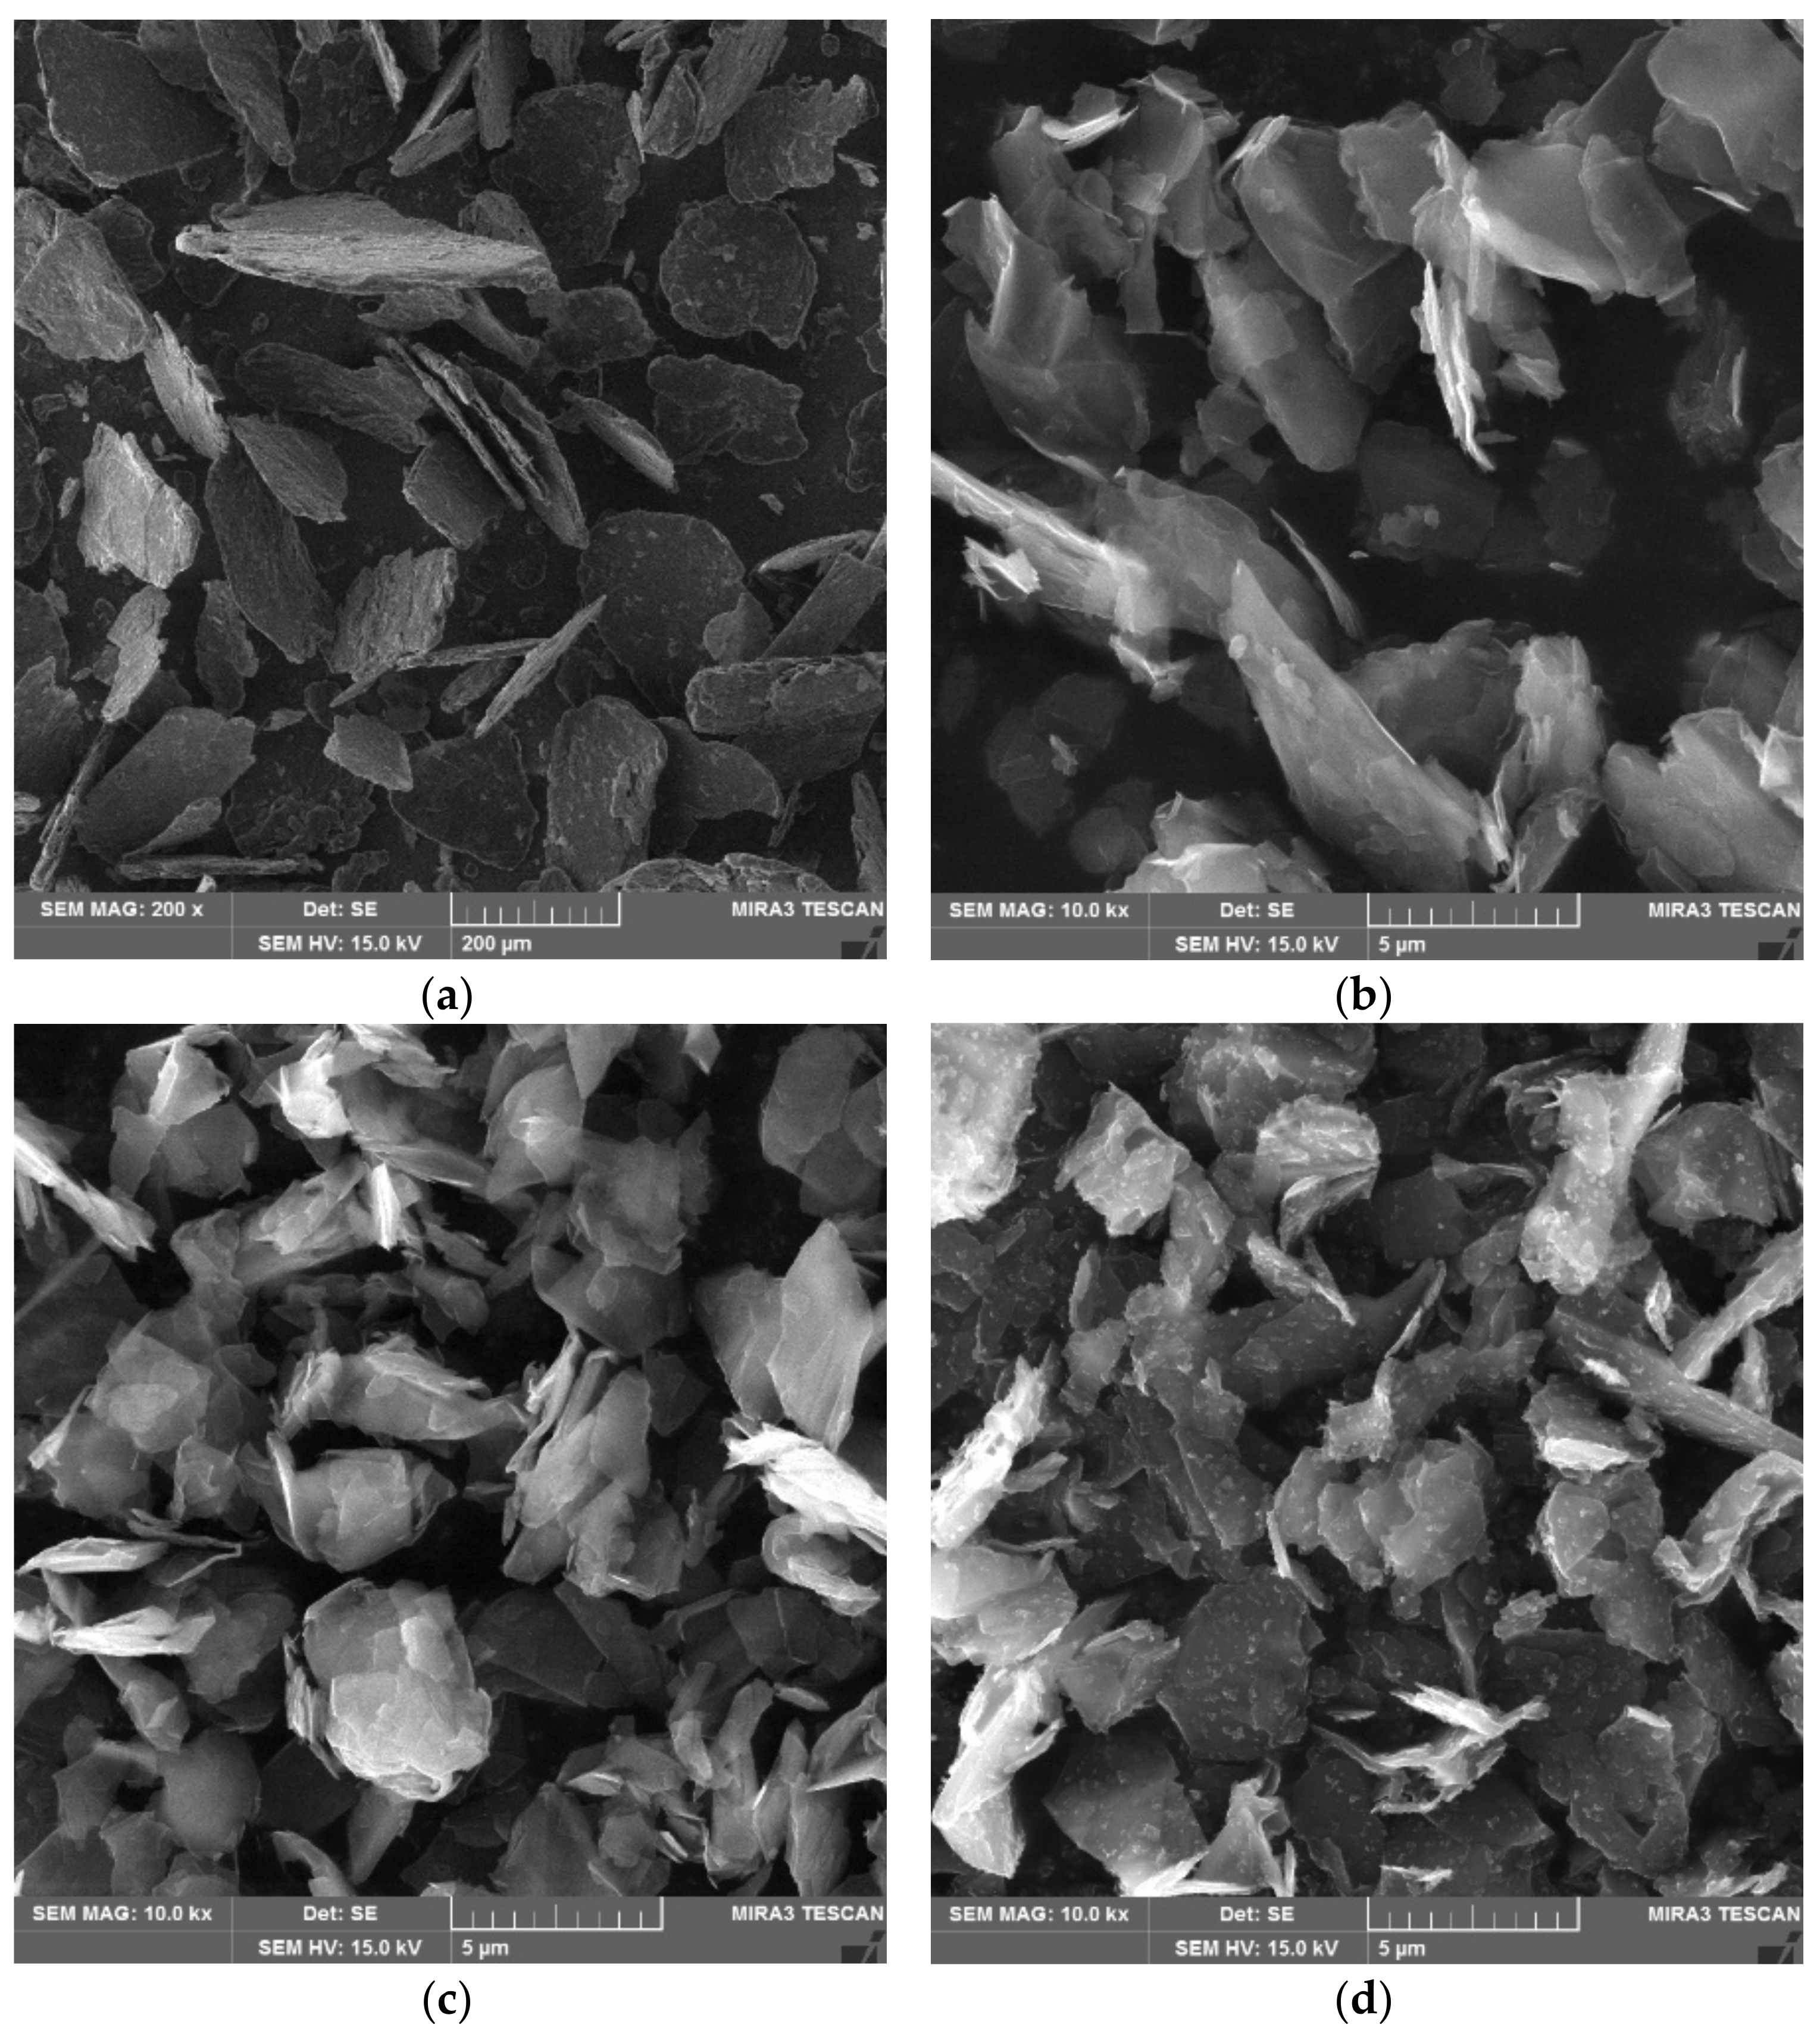
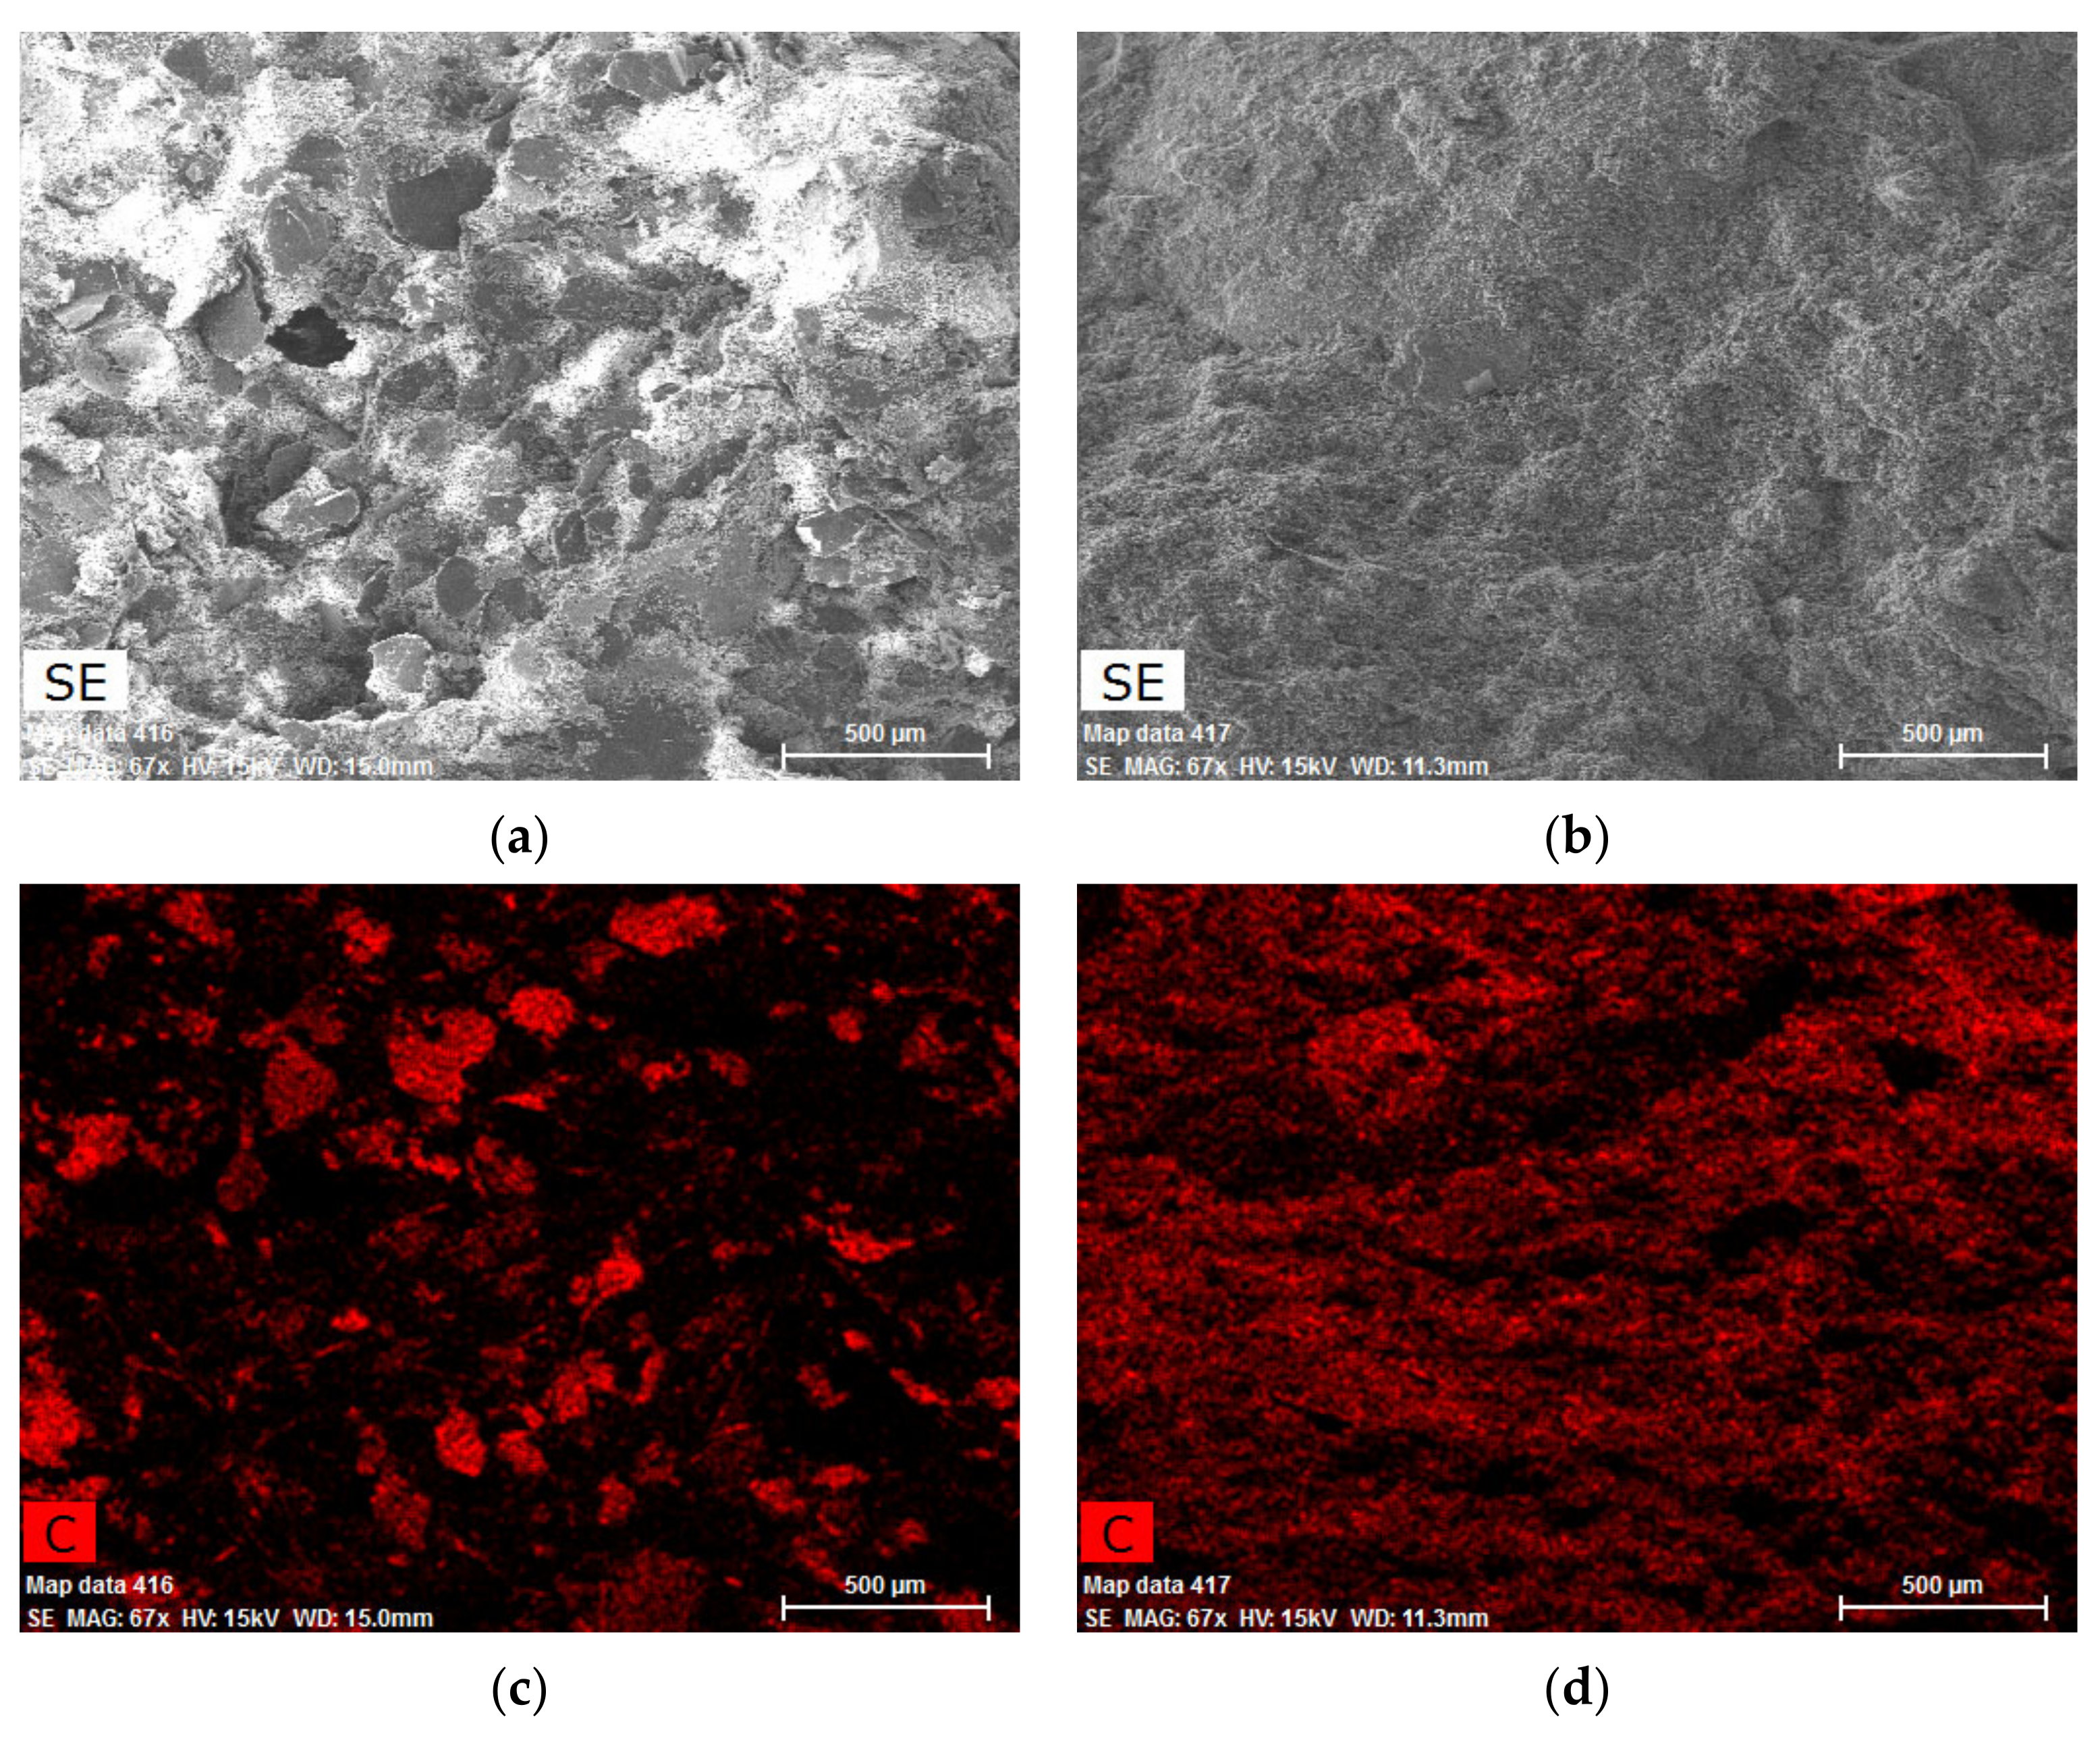
3.12. SEM (Scanning Electron Microscope)
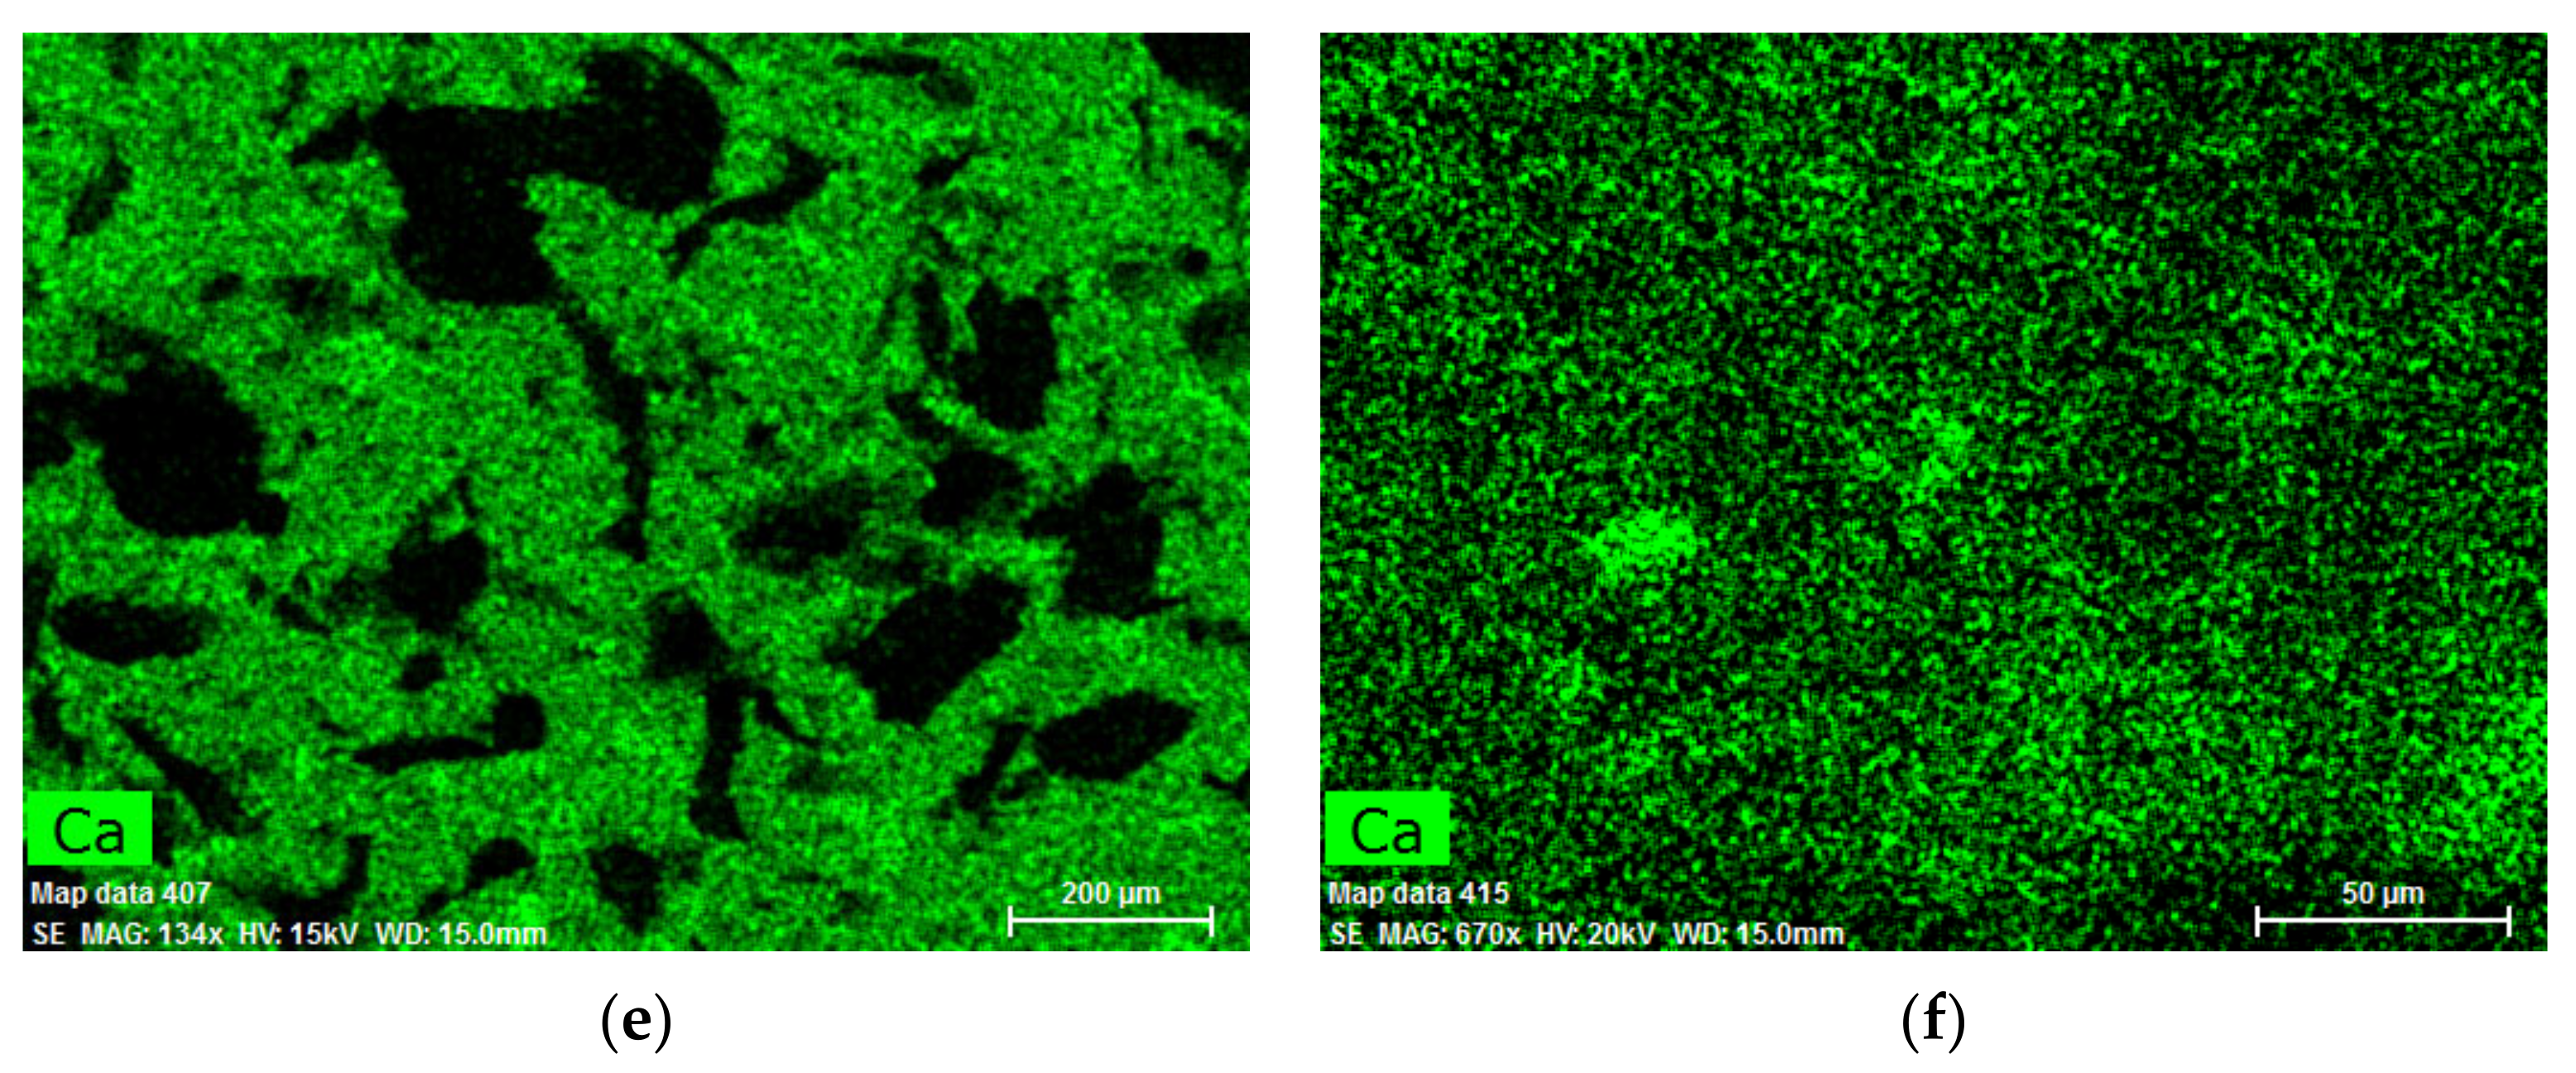
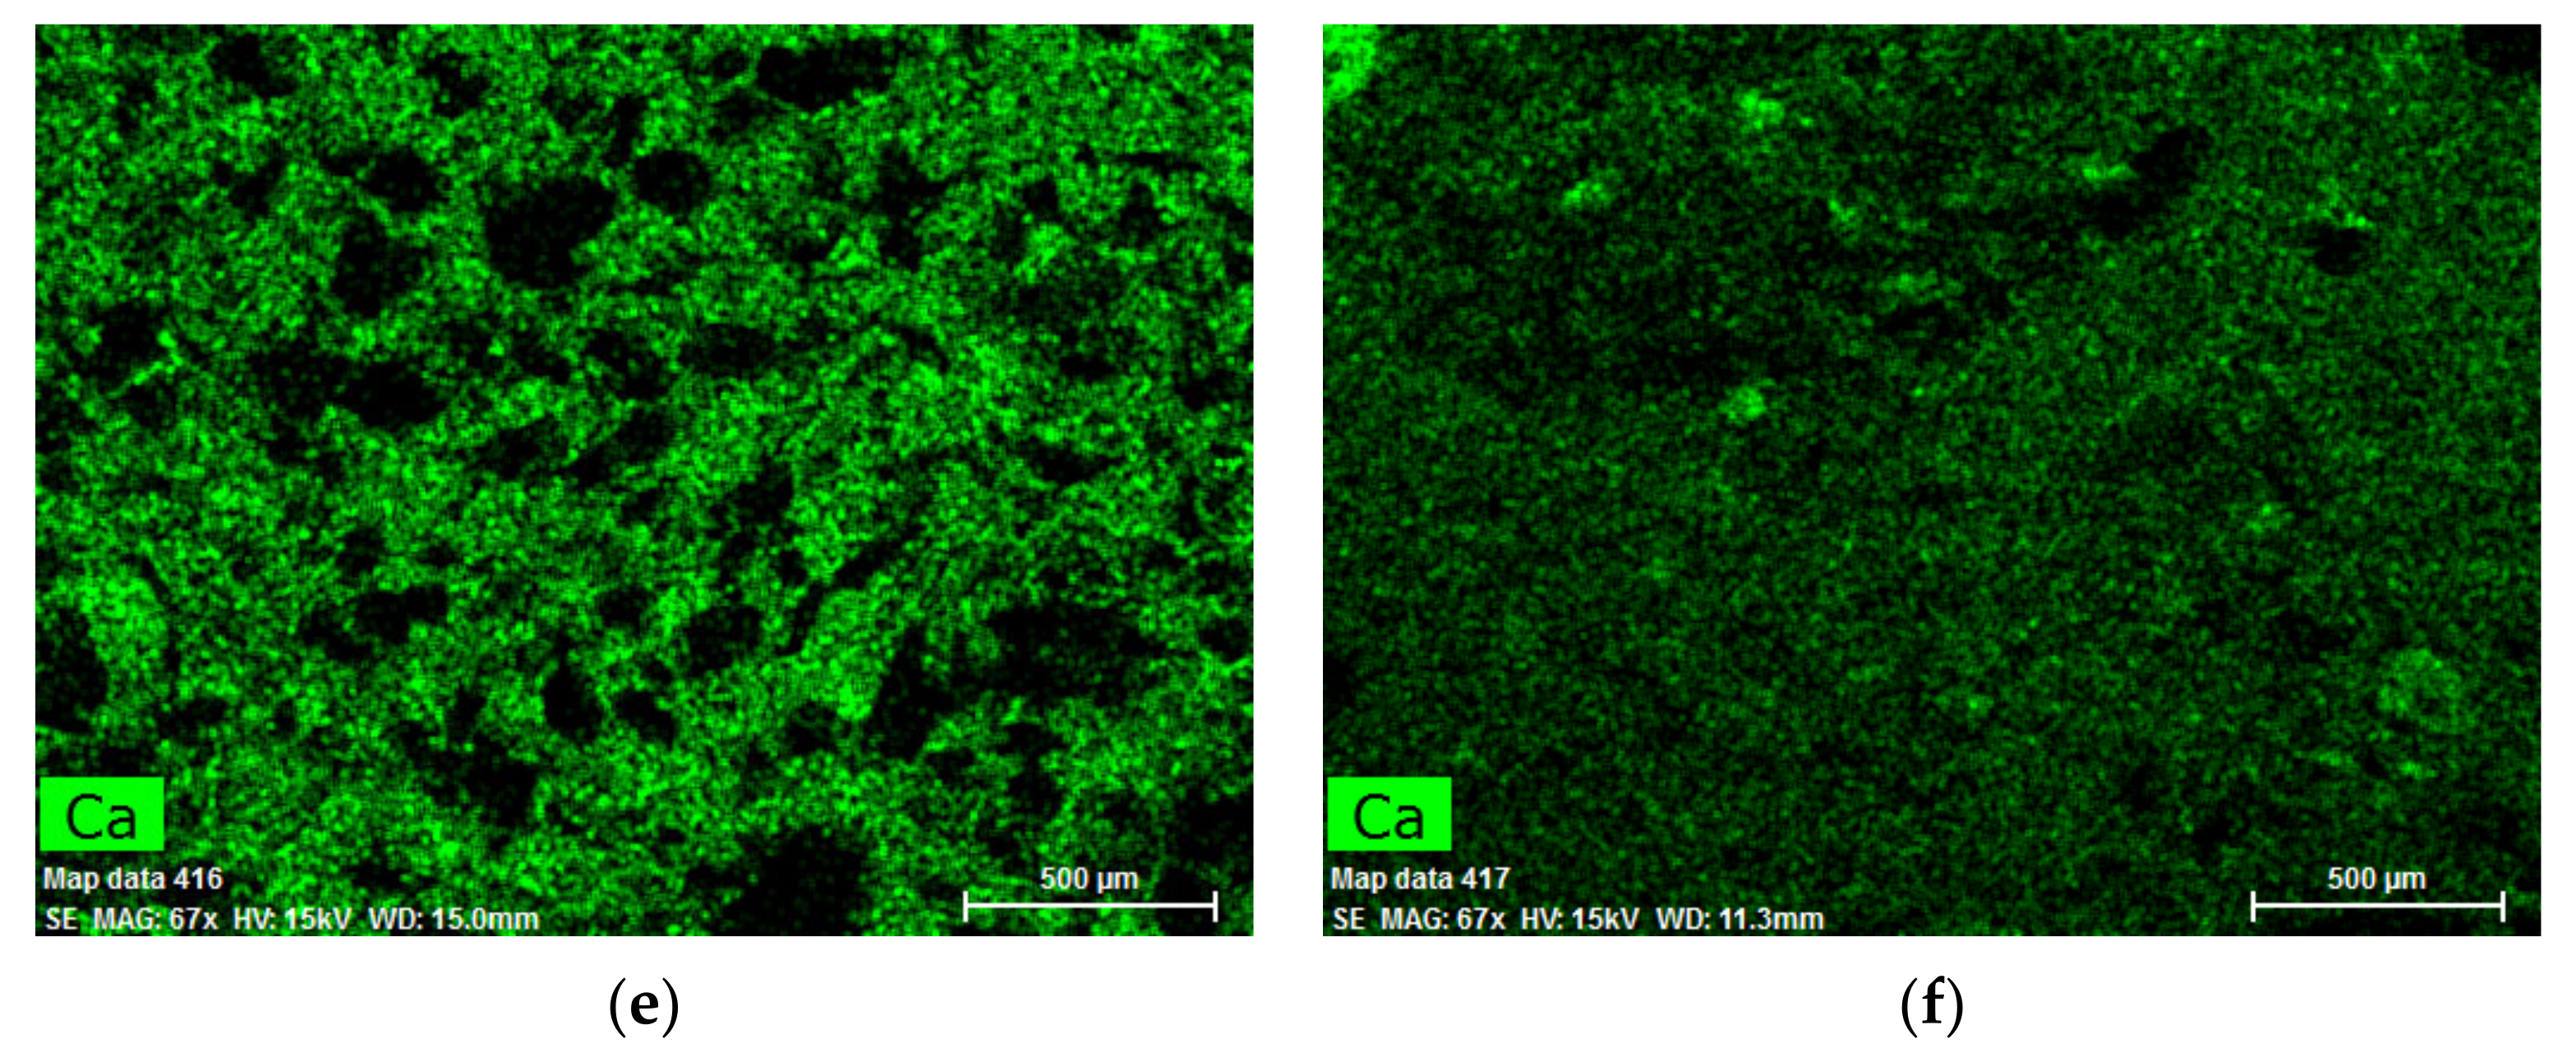
3.13. EDX (Energy Dispersive Analysis)
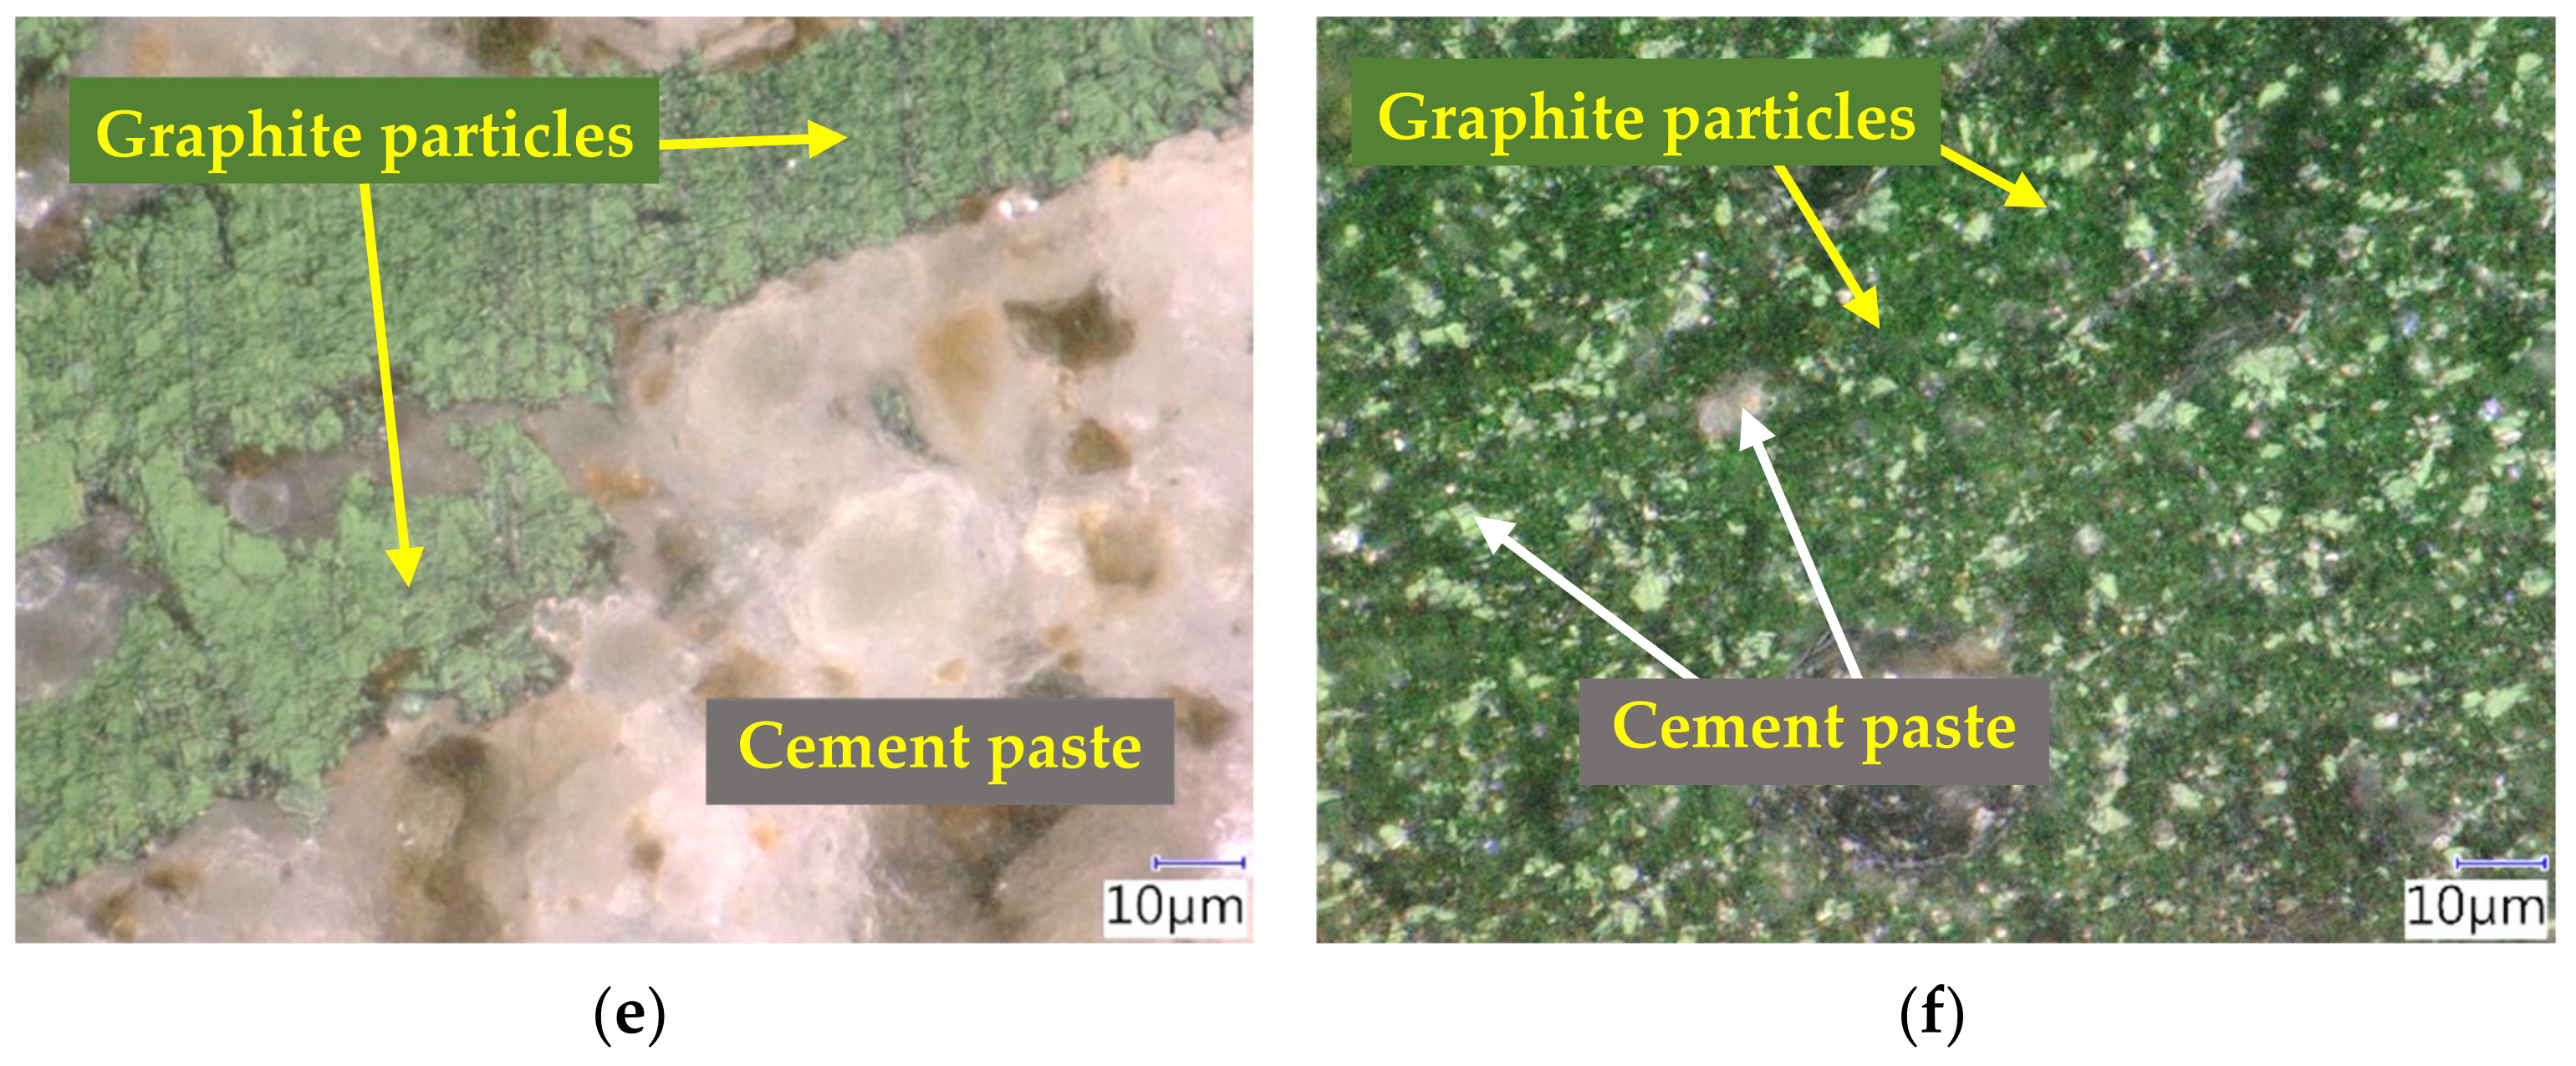
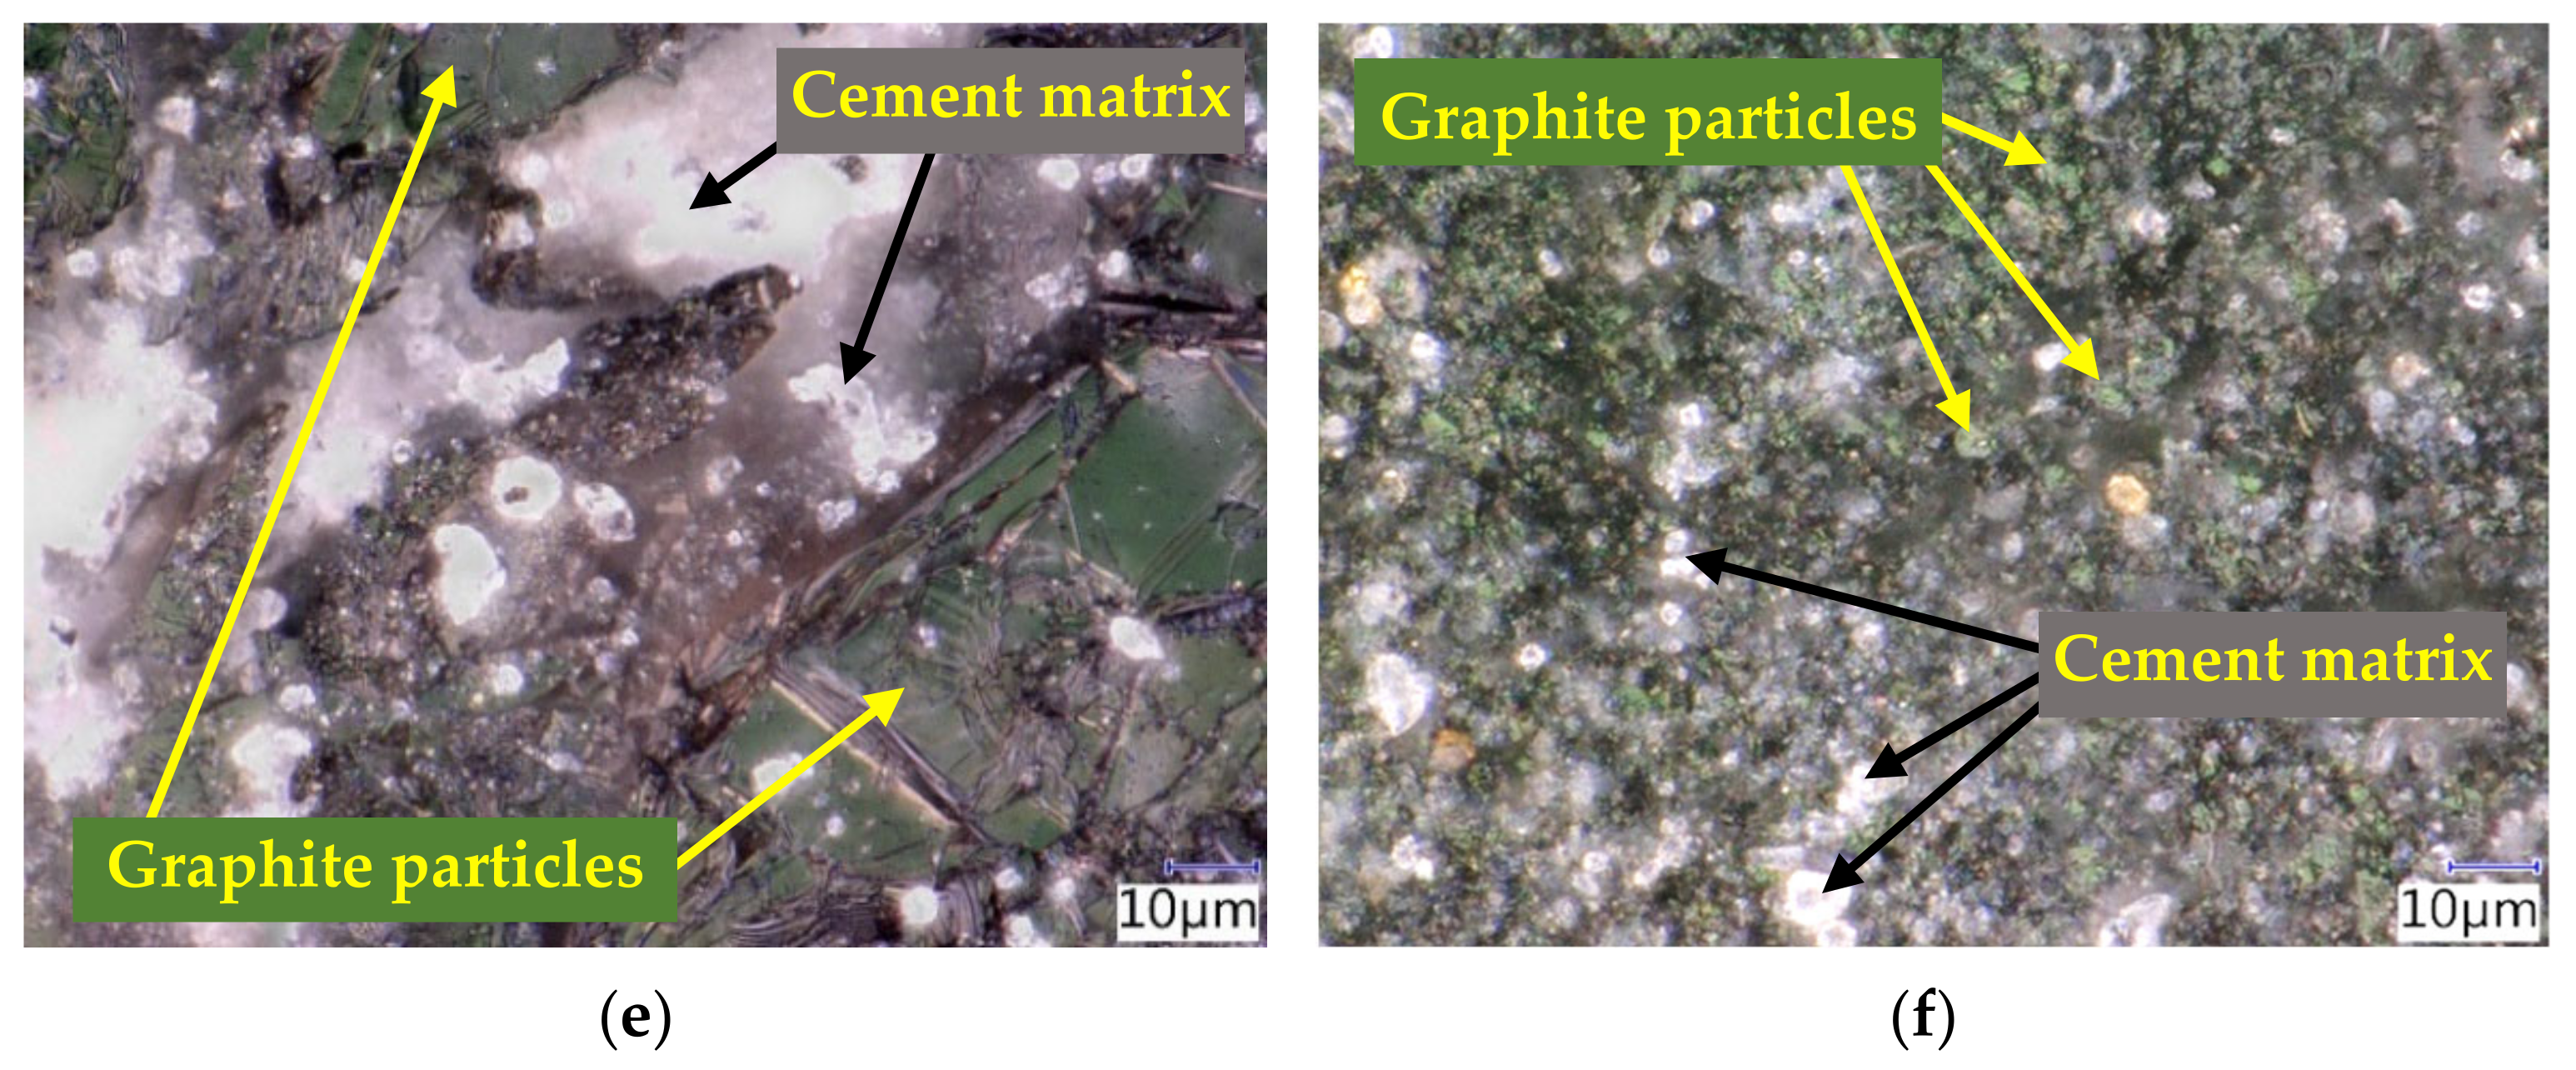
3.14. Optical Microscopy
4. Results
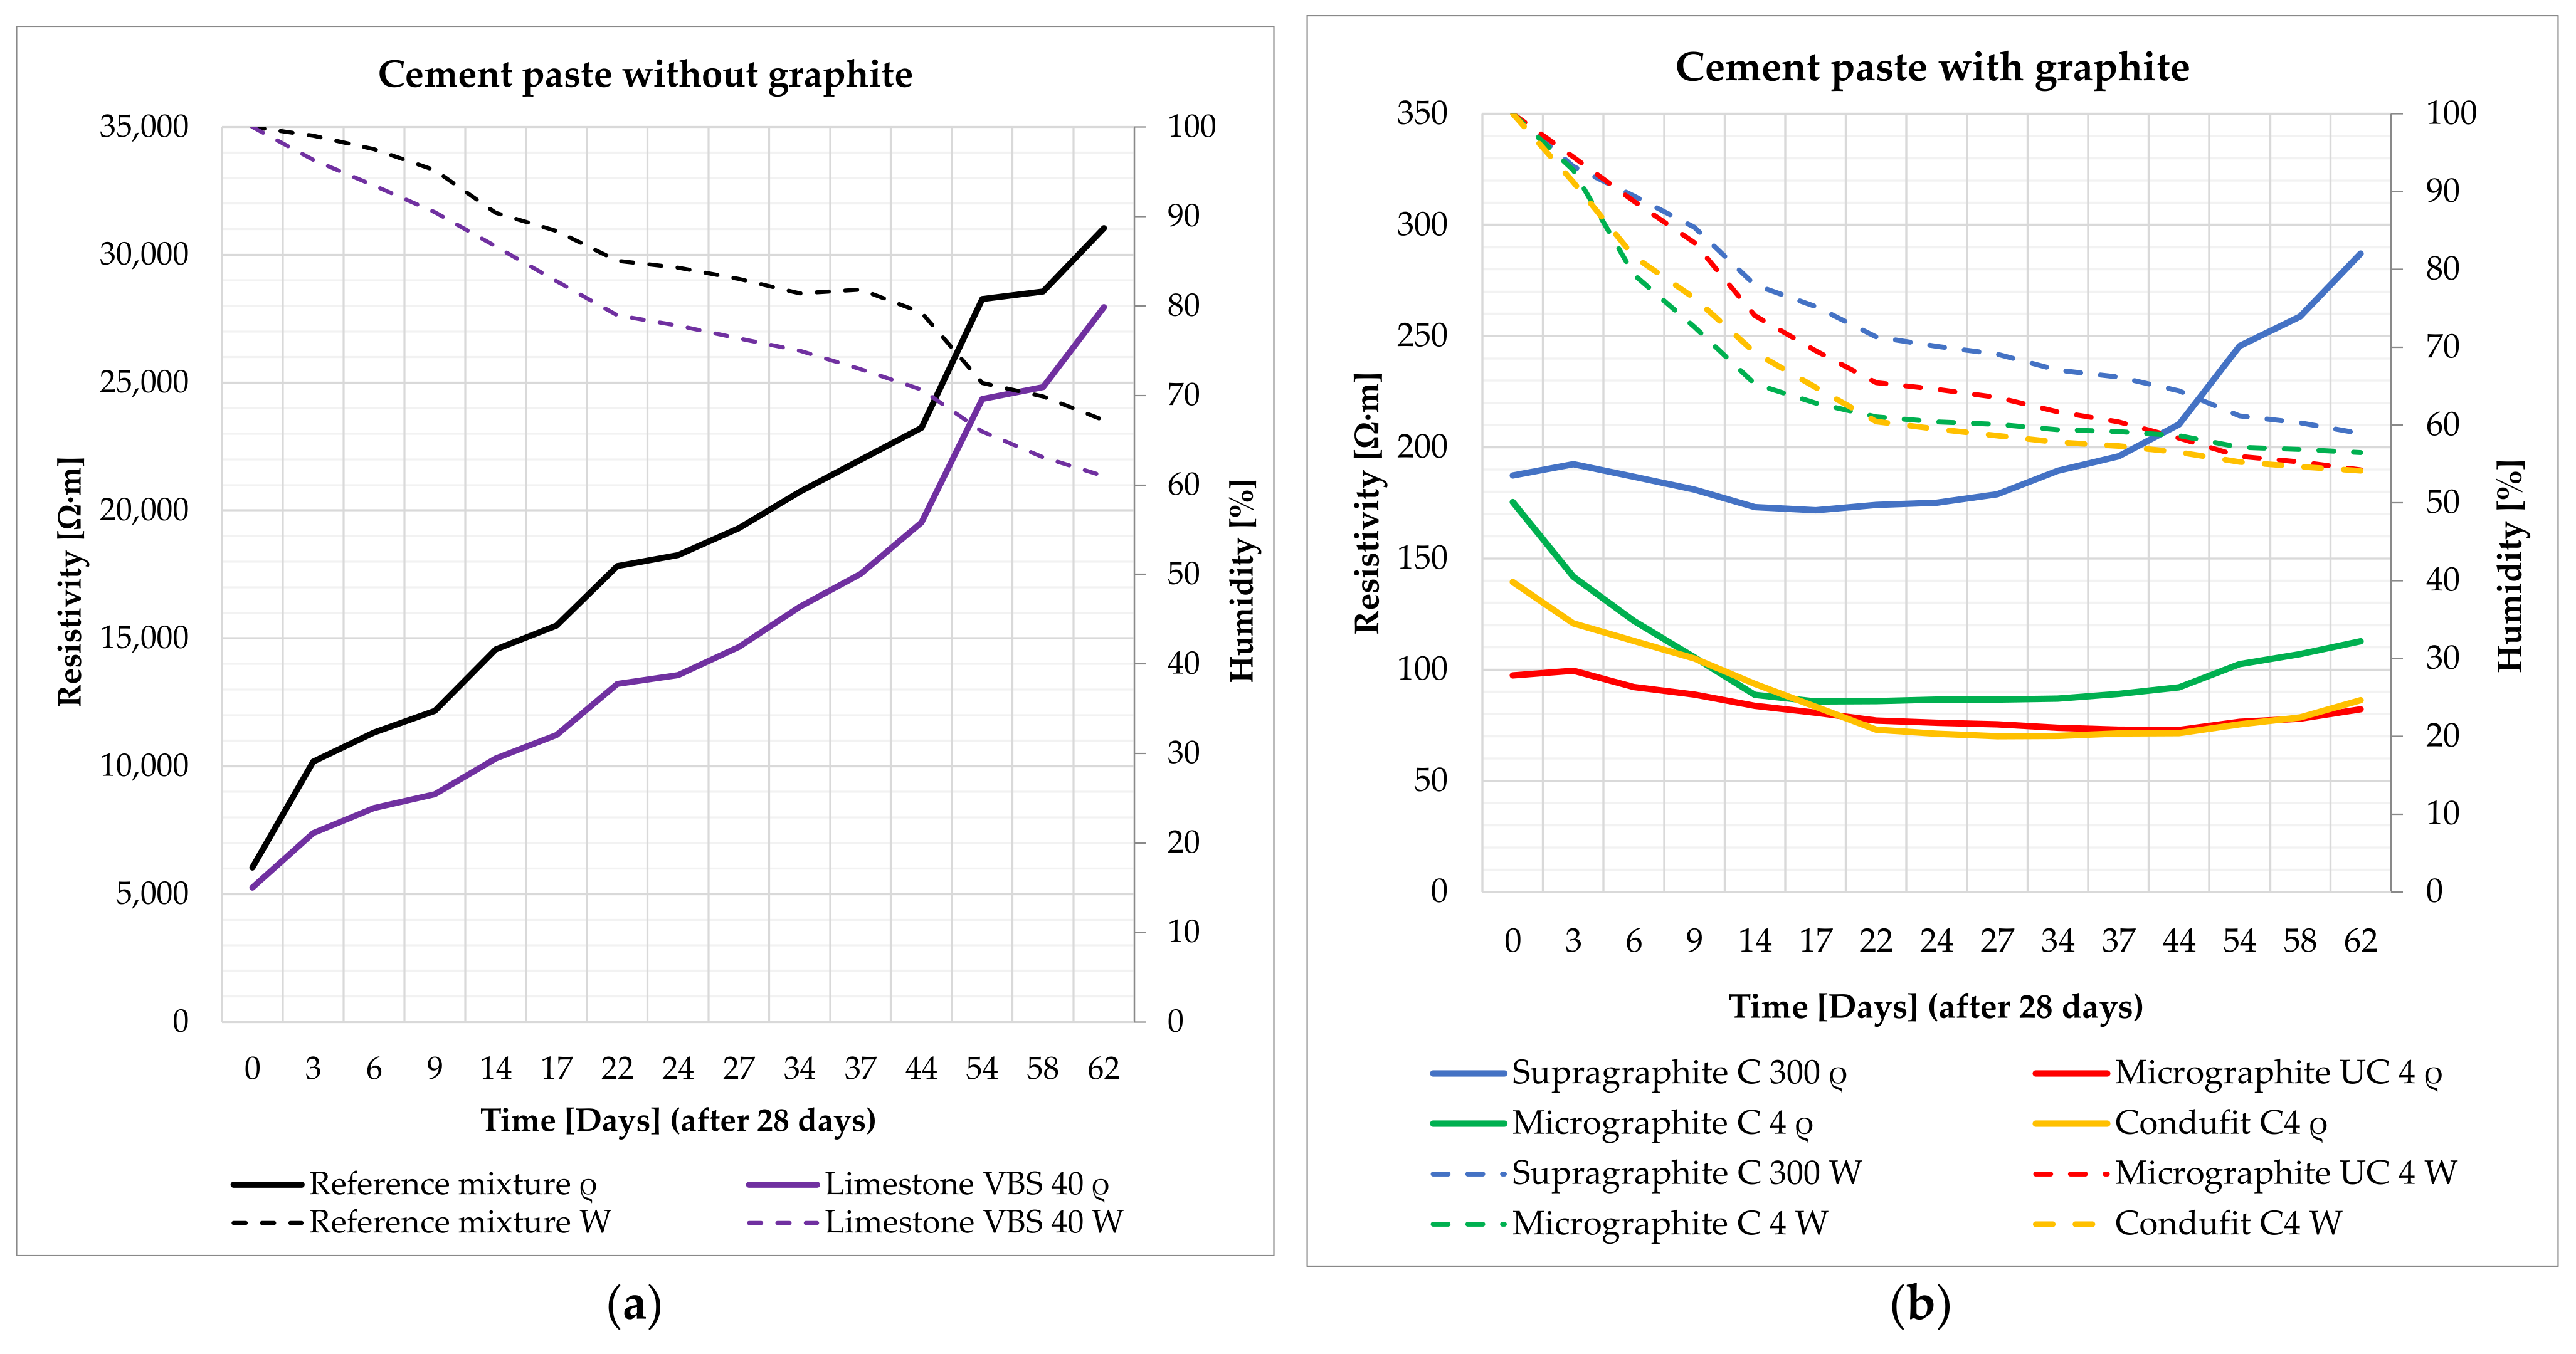
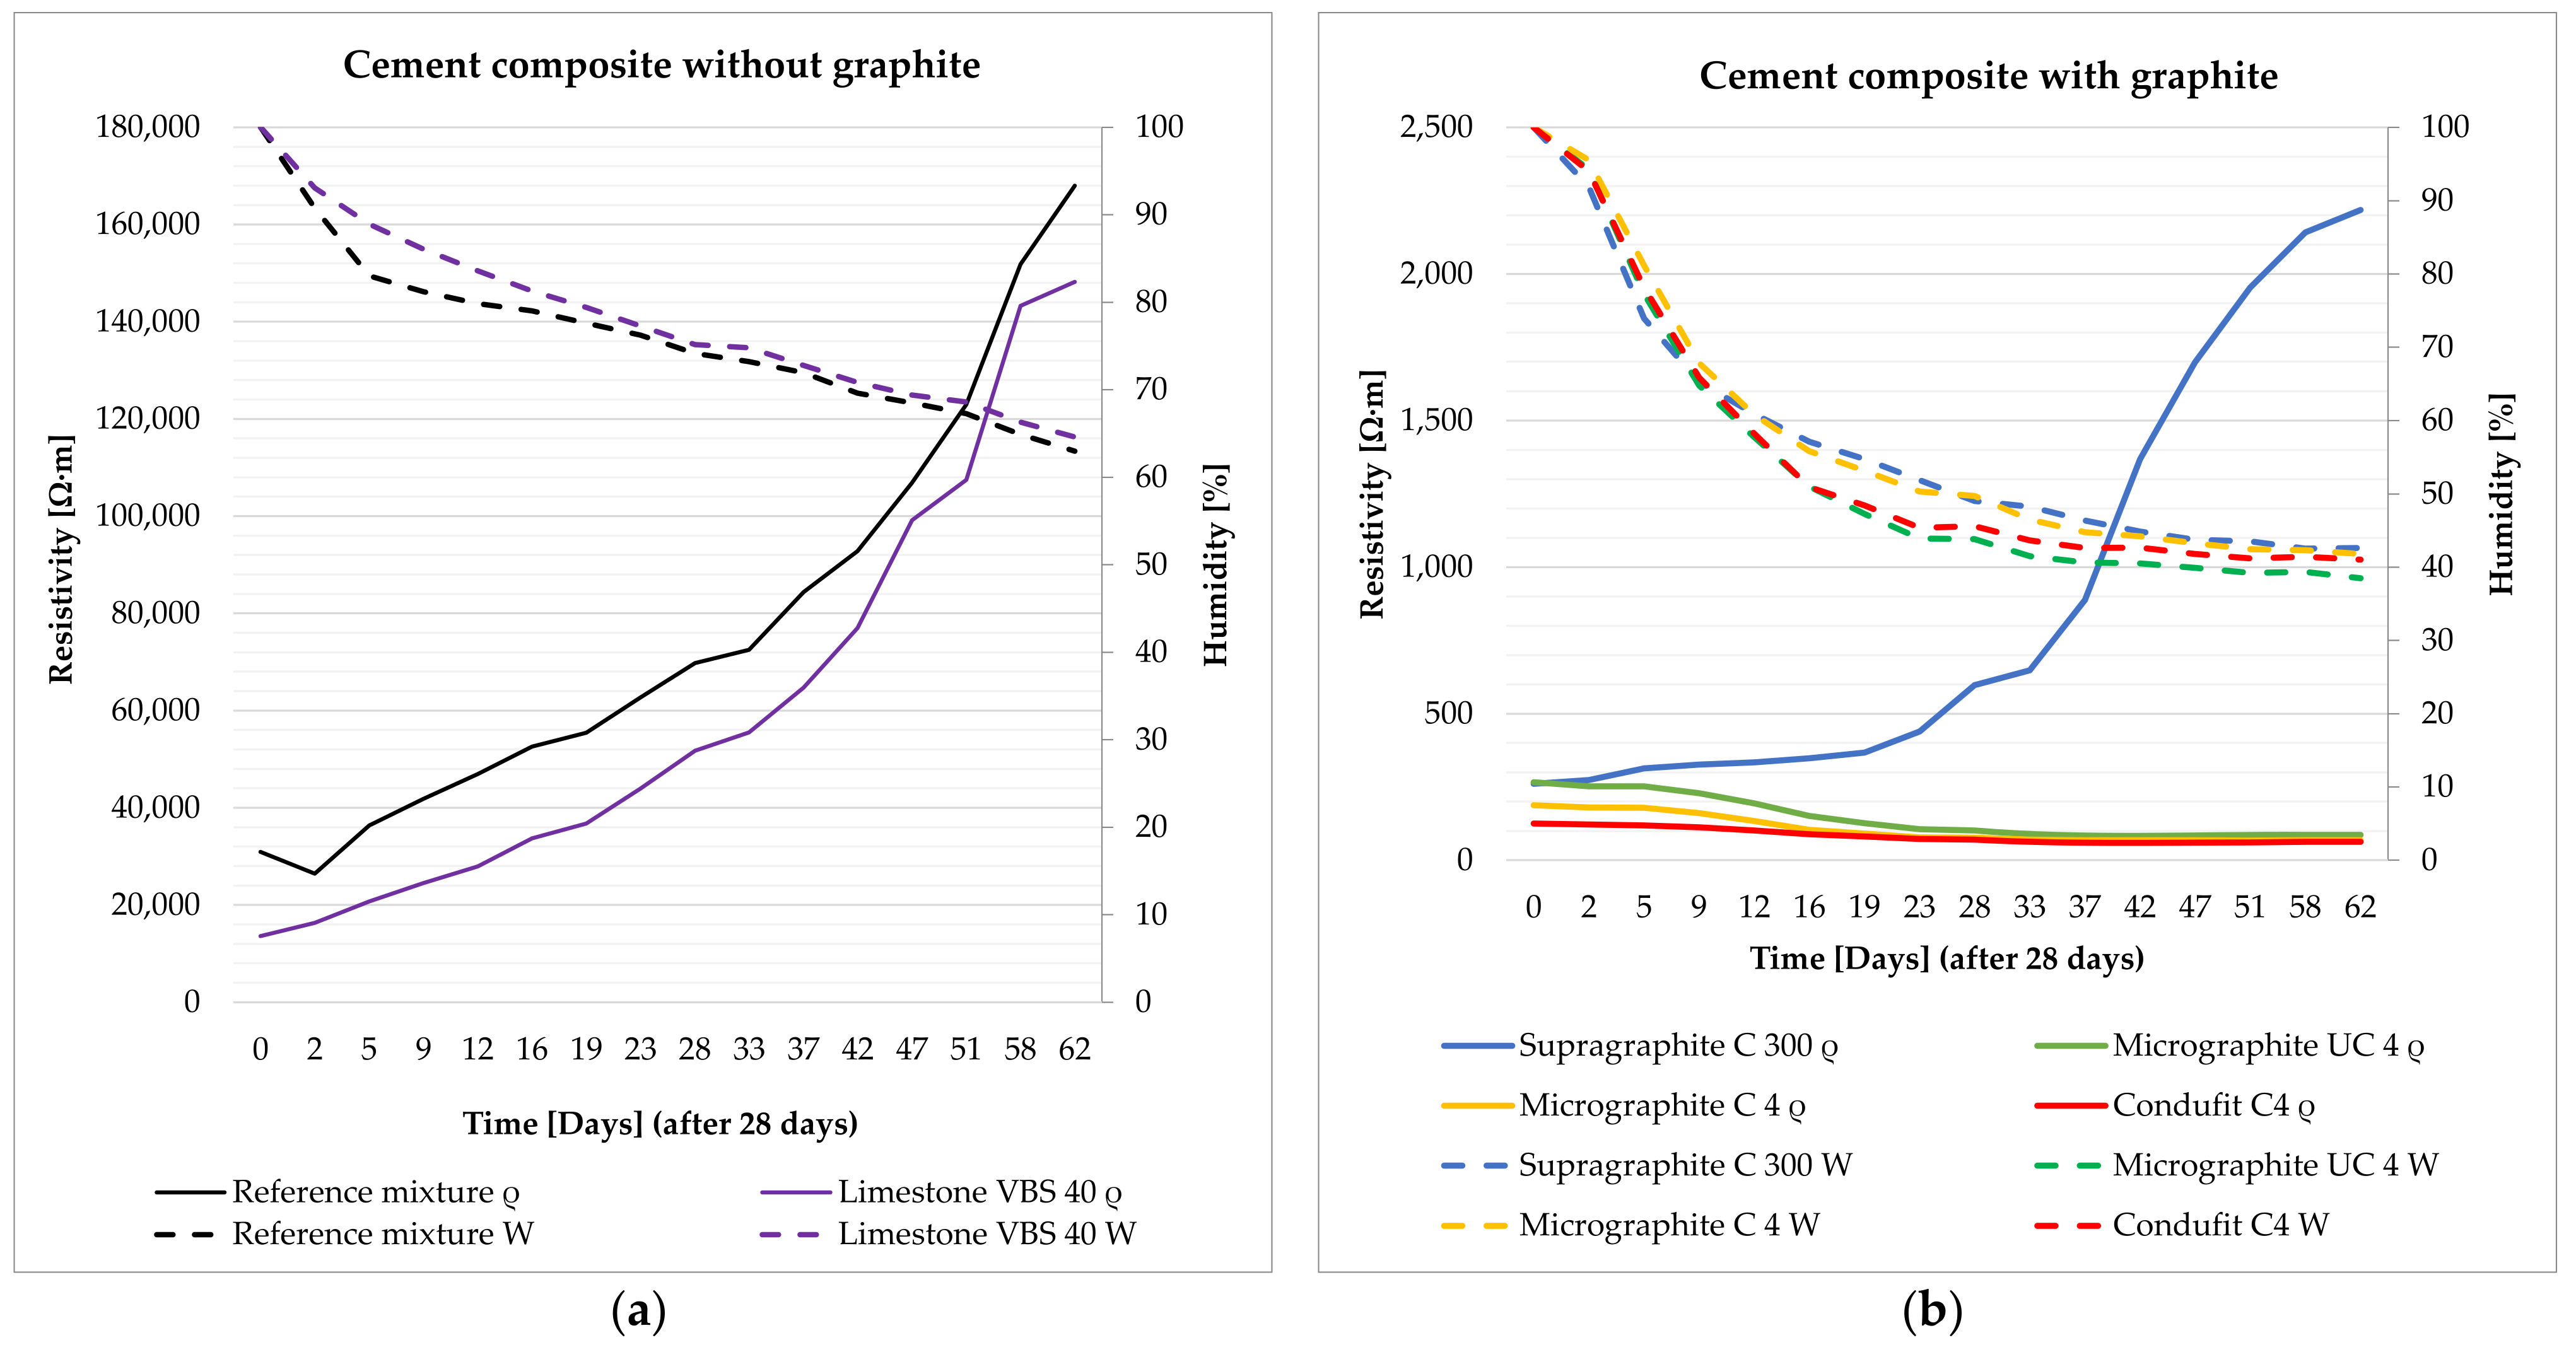
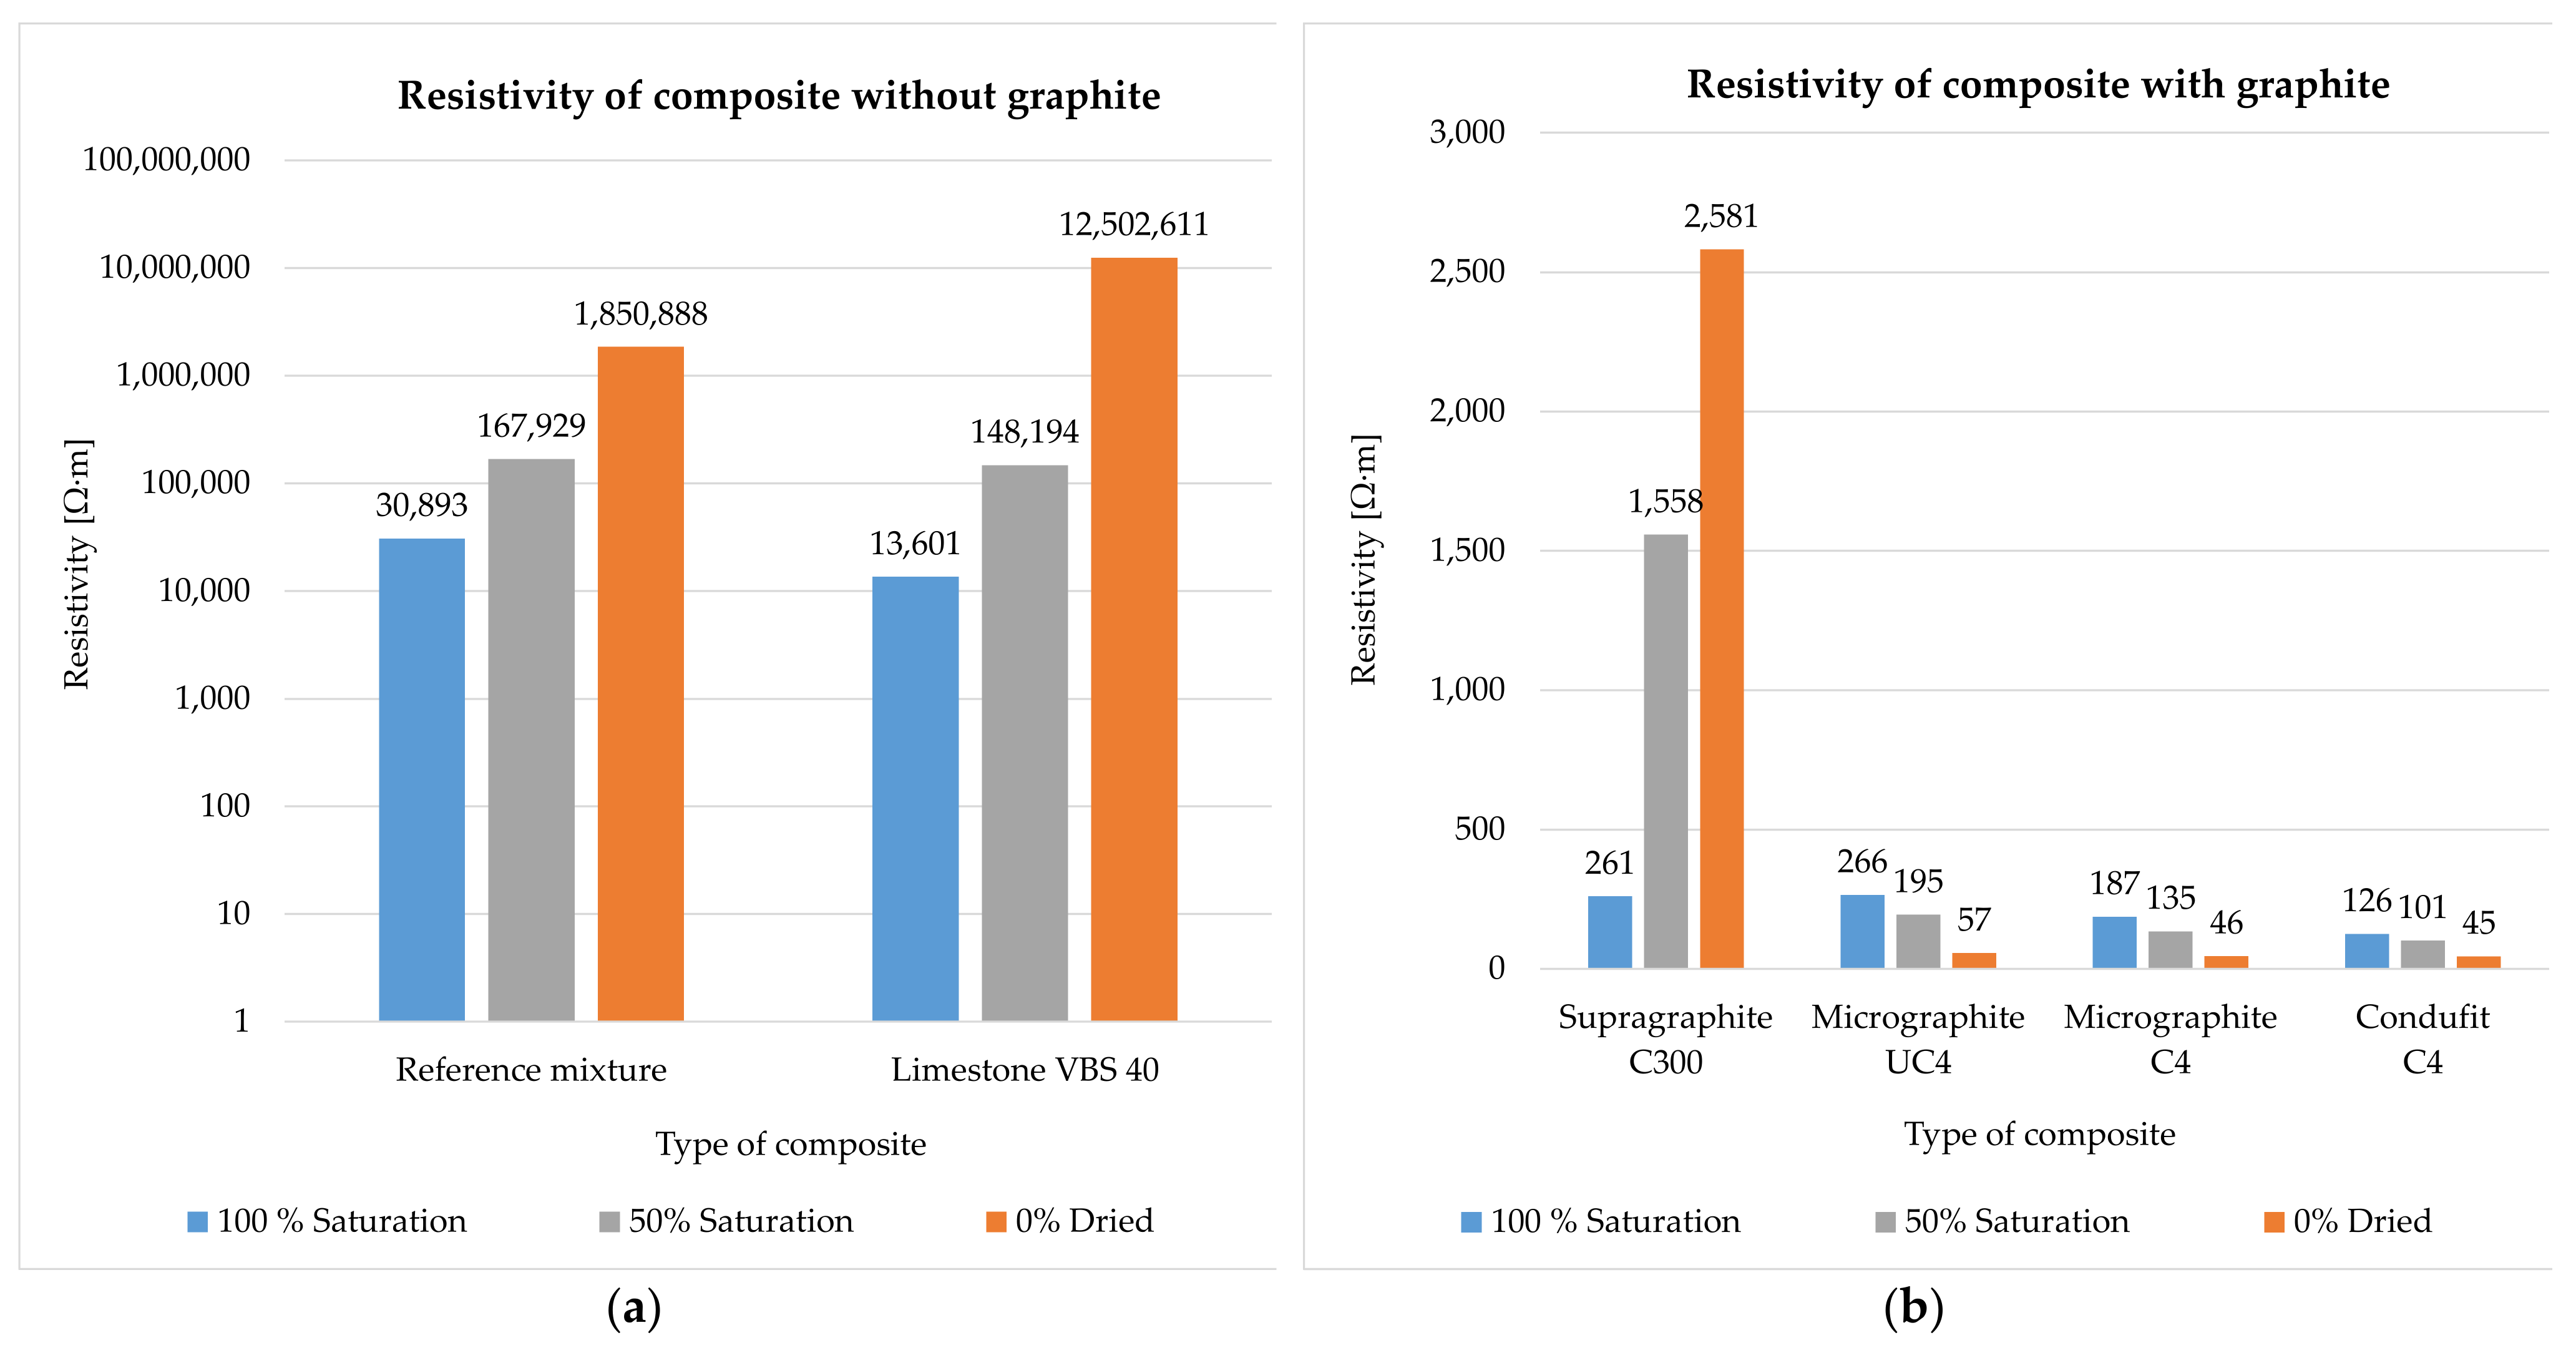
4.1. The Verification of the Electrically Conductive Properties of the Cement Paste, with a Graphite Filler
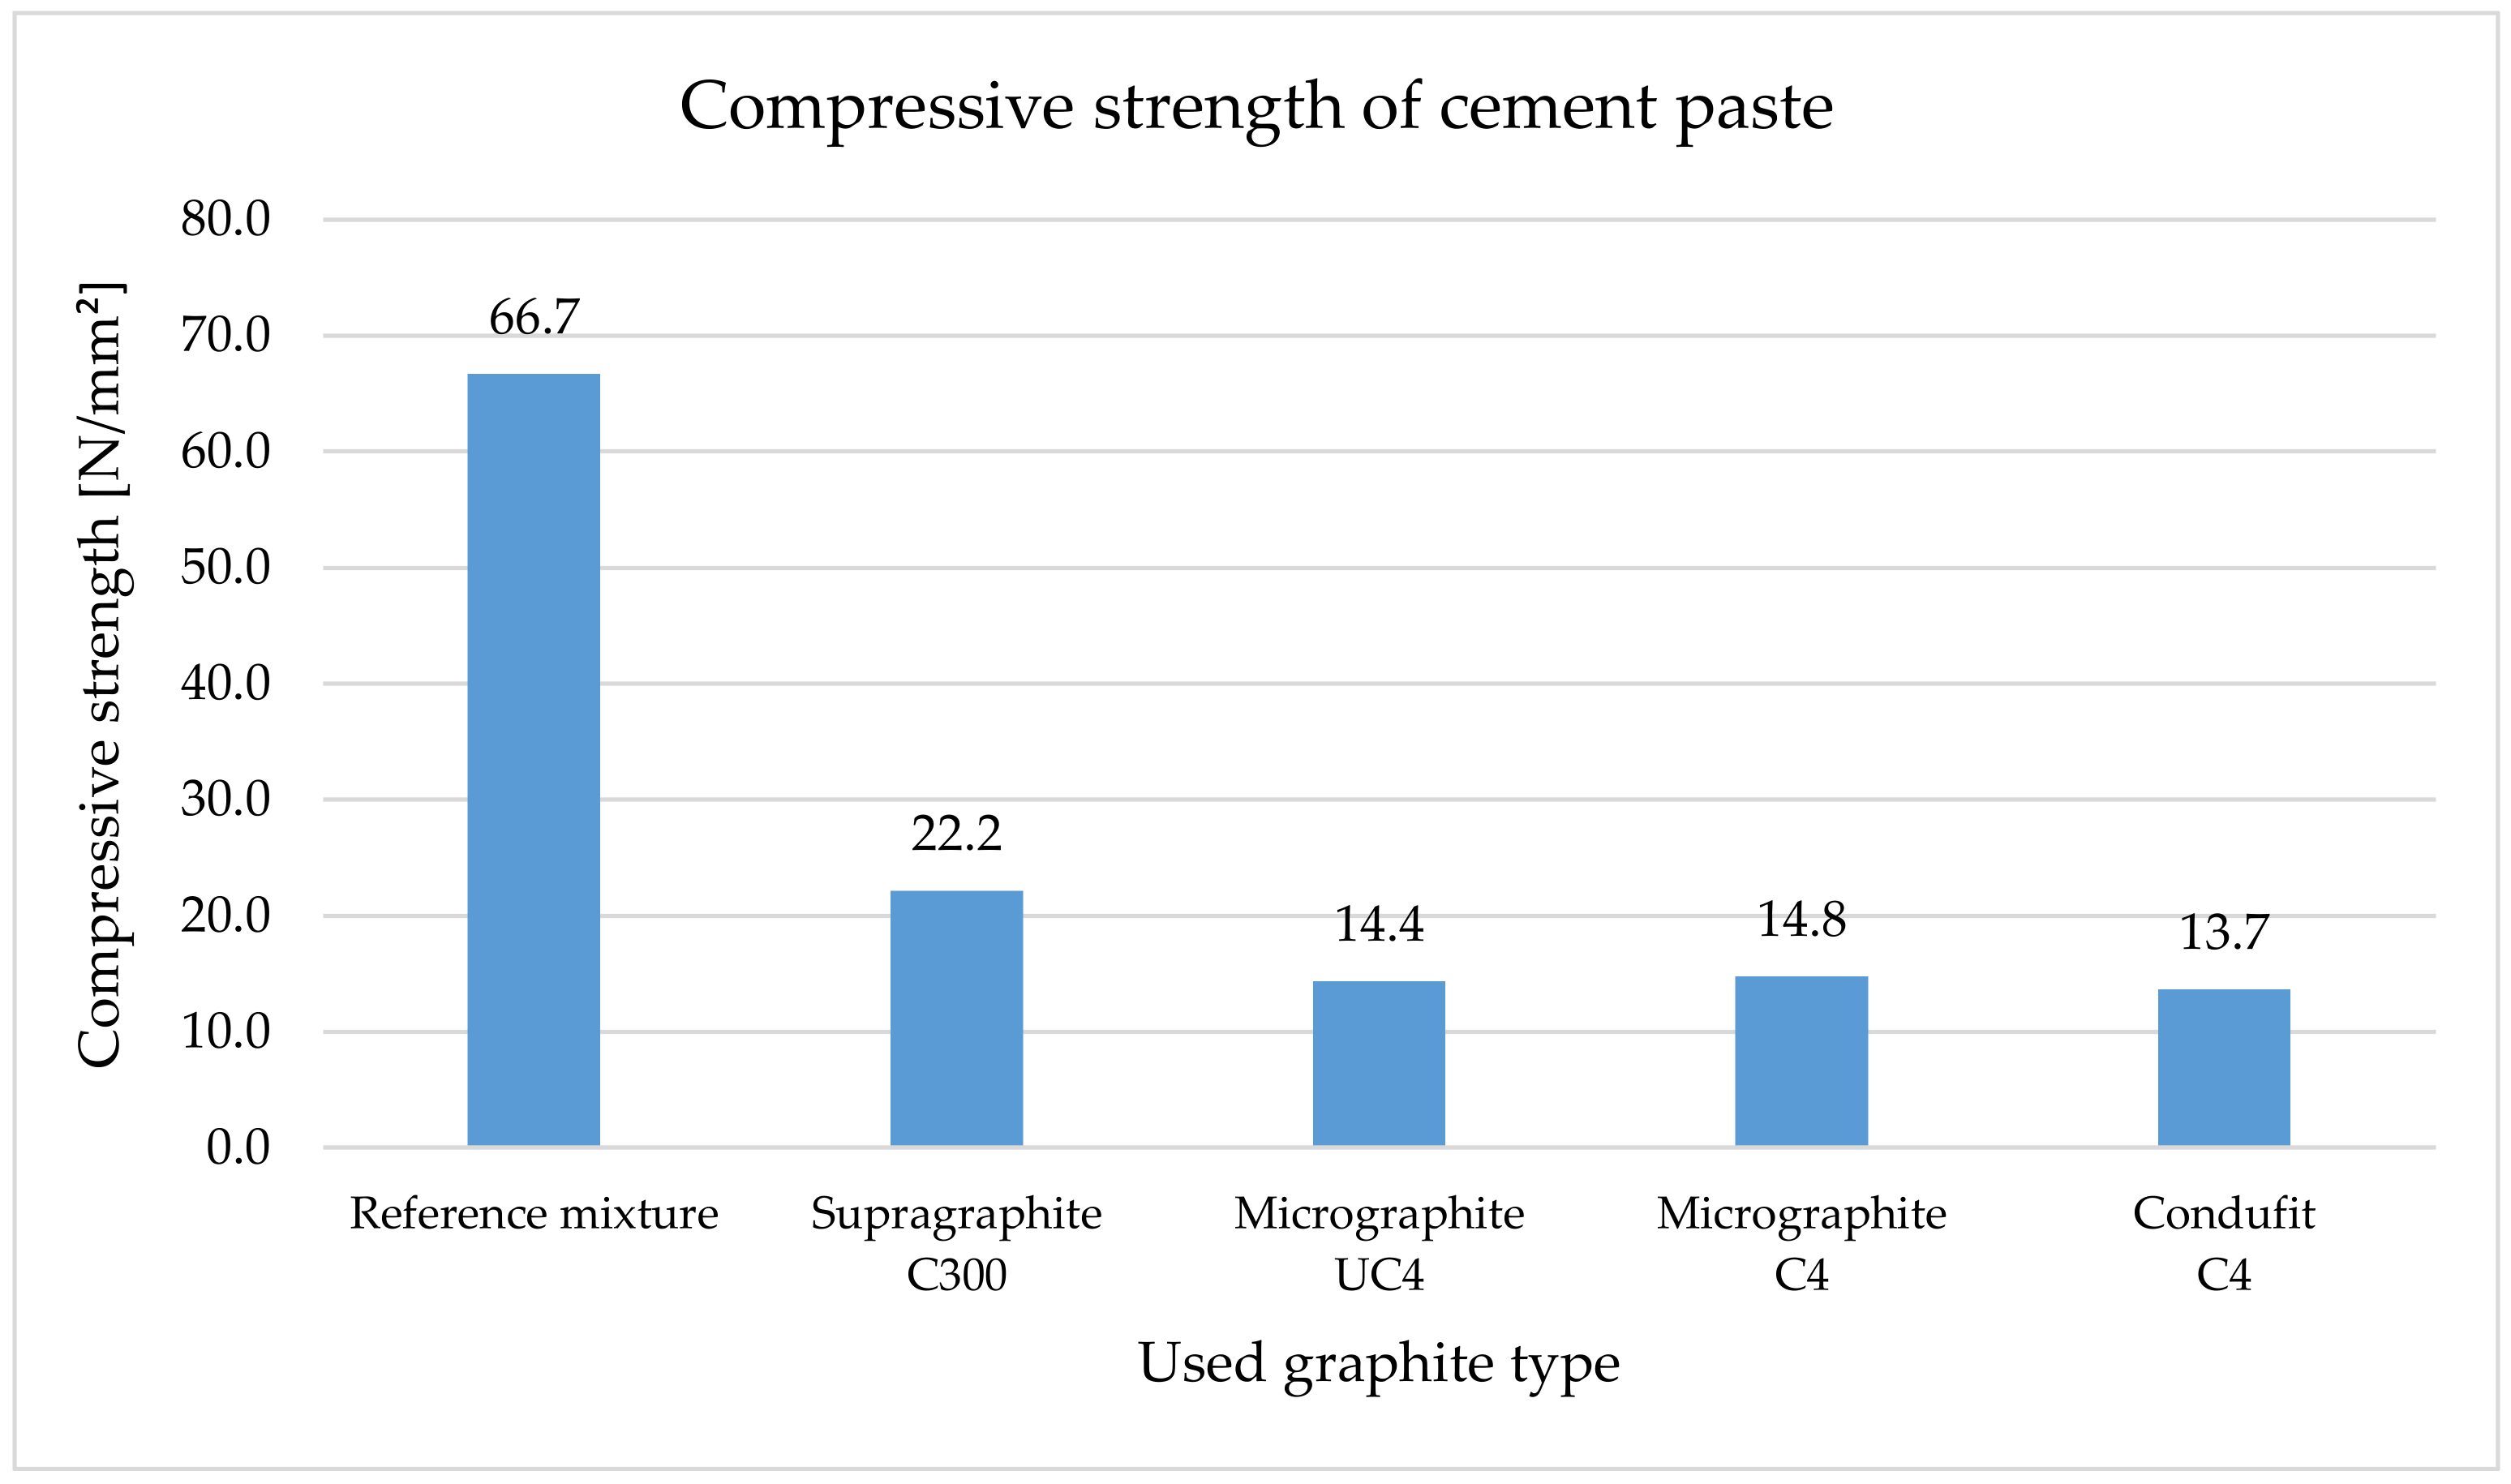
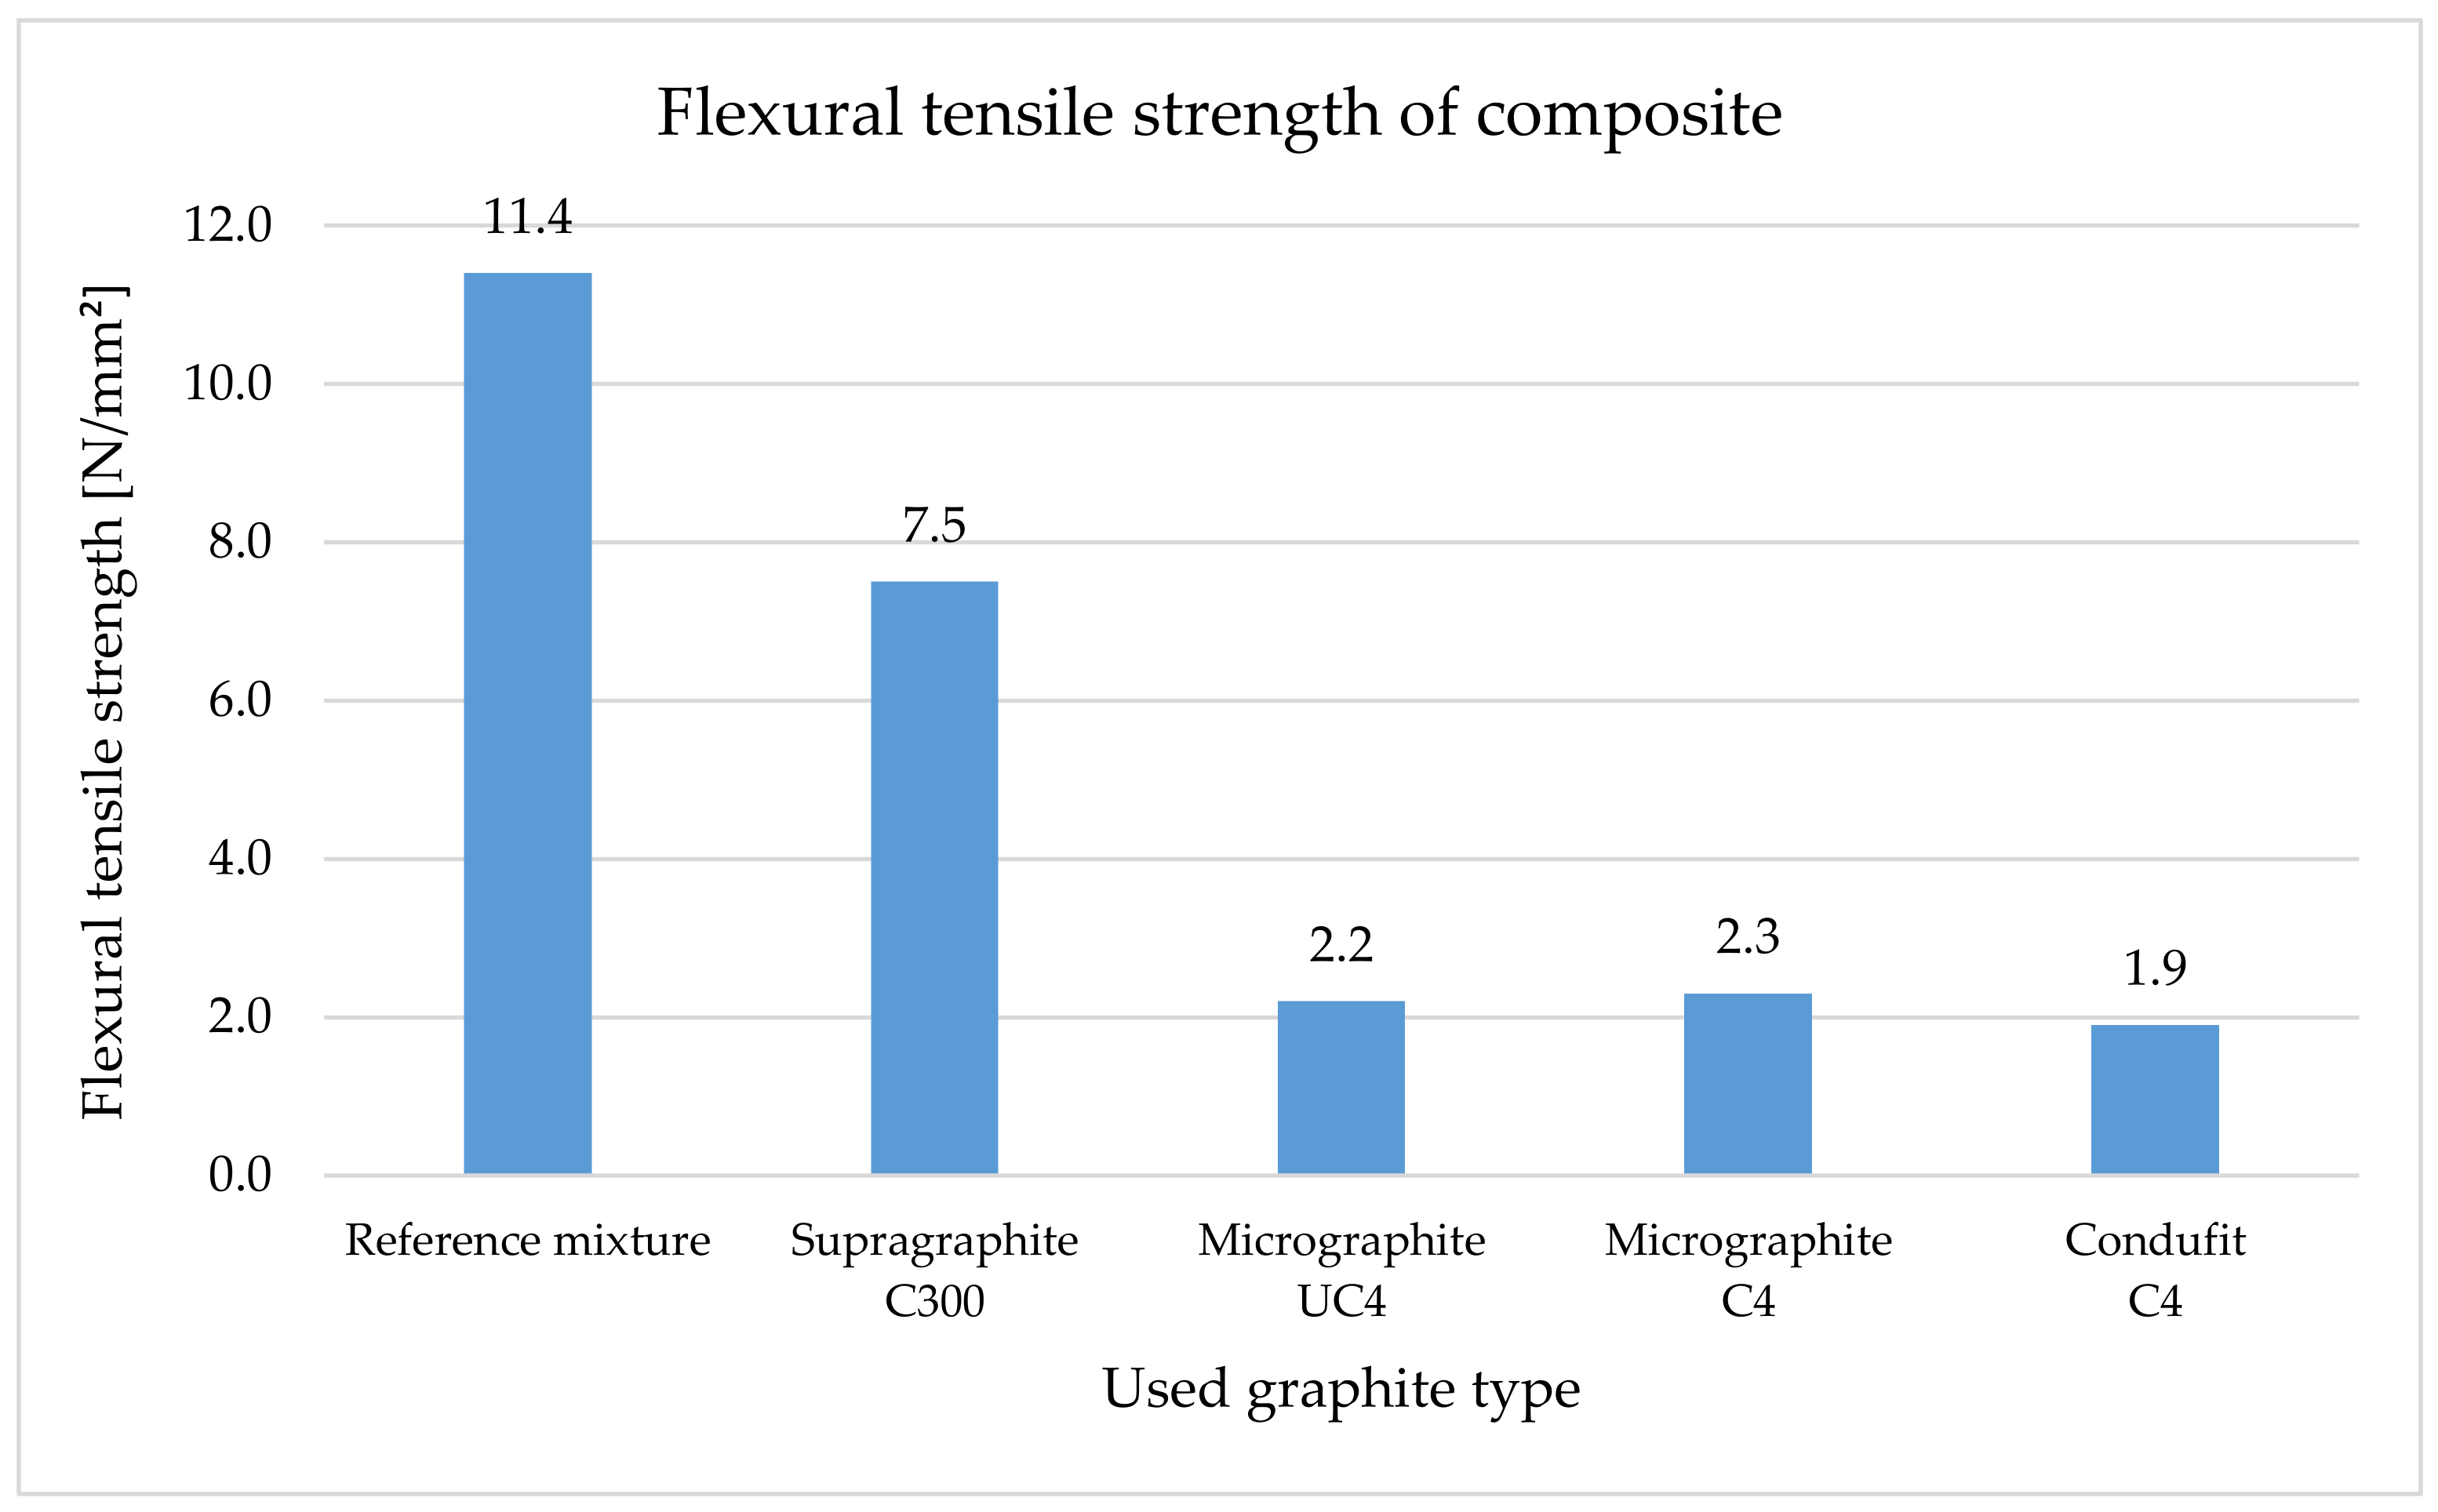
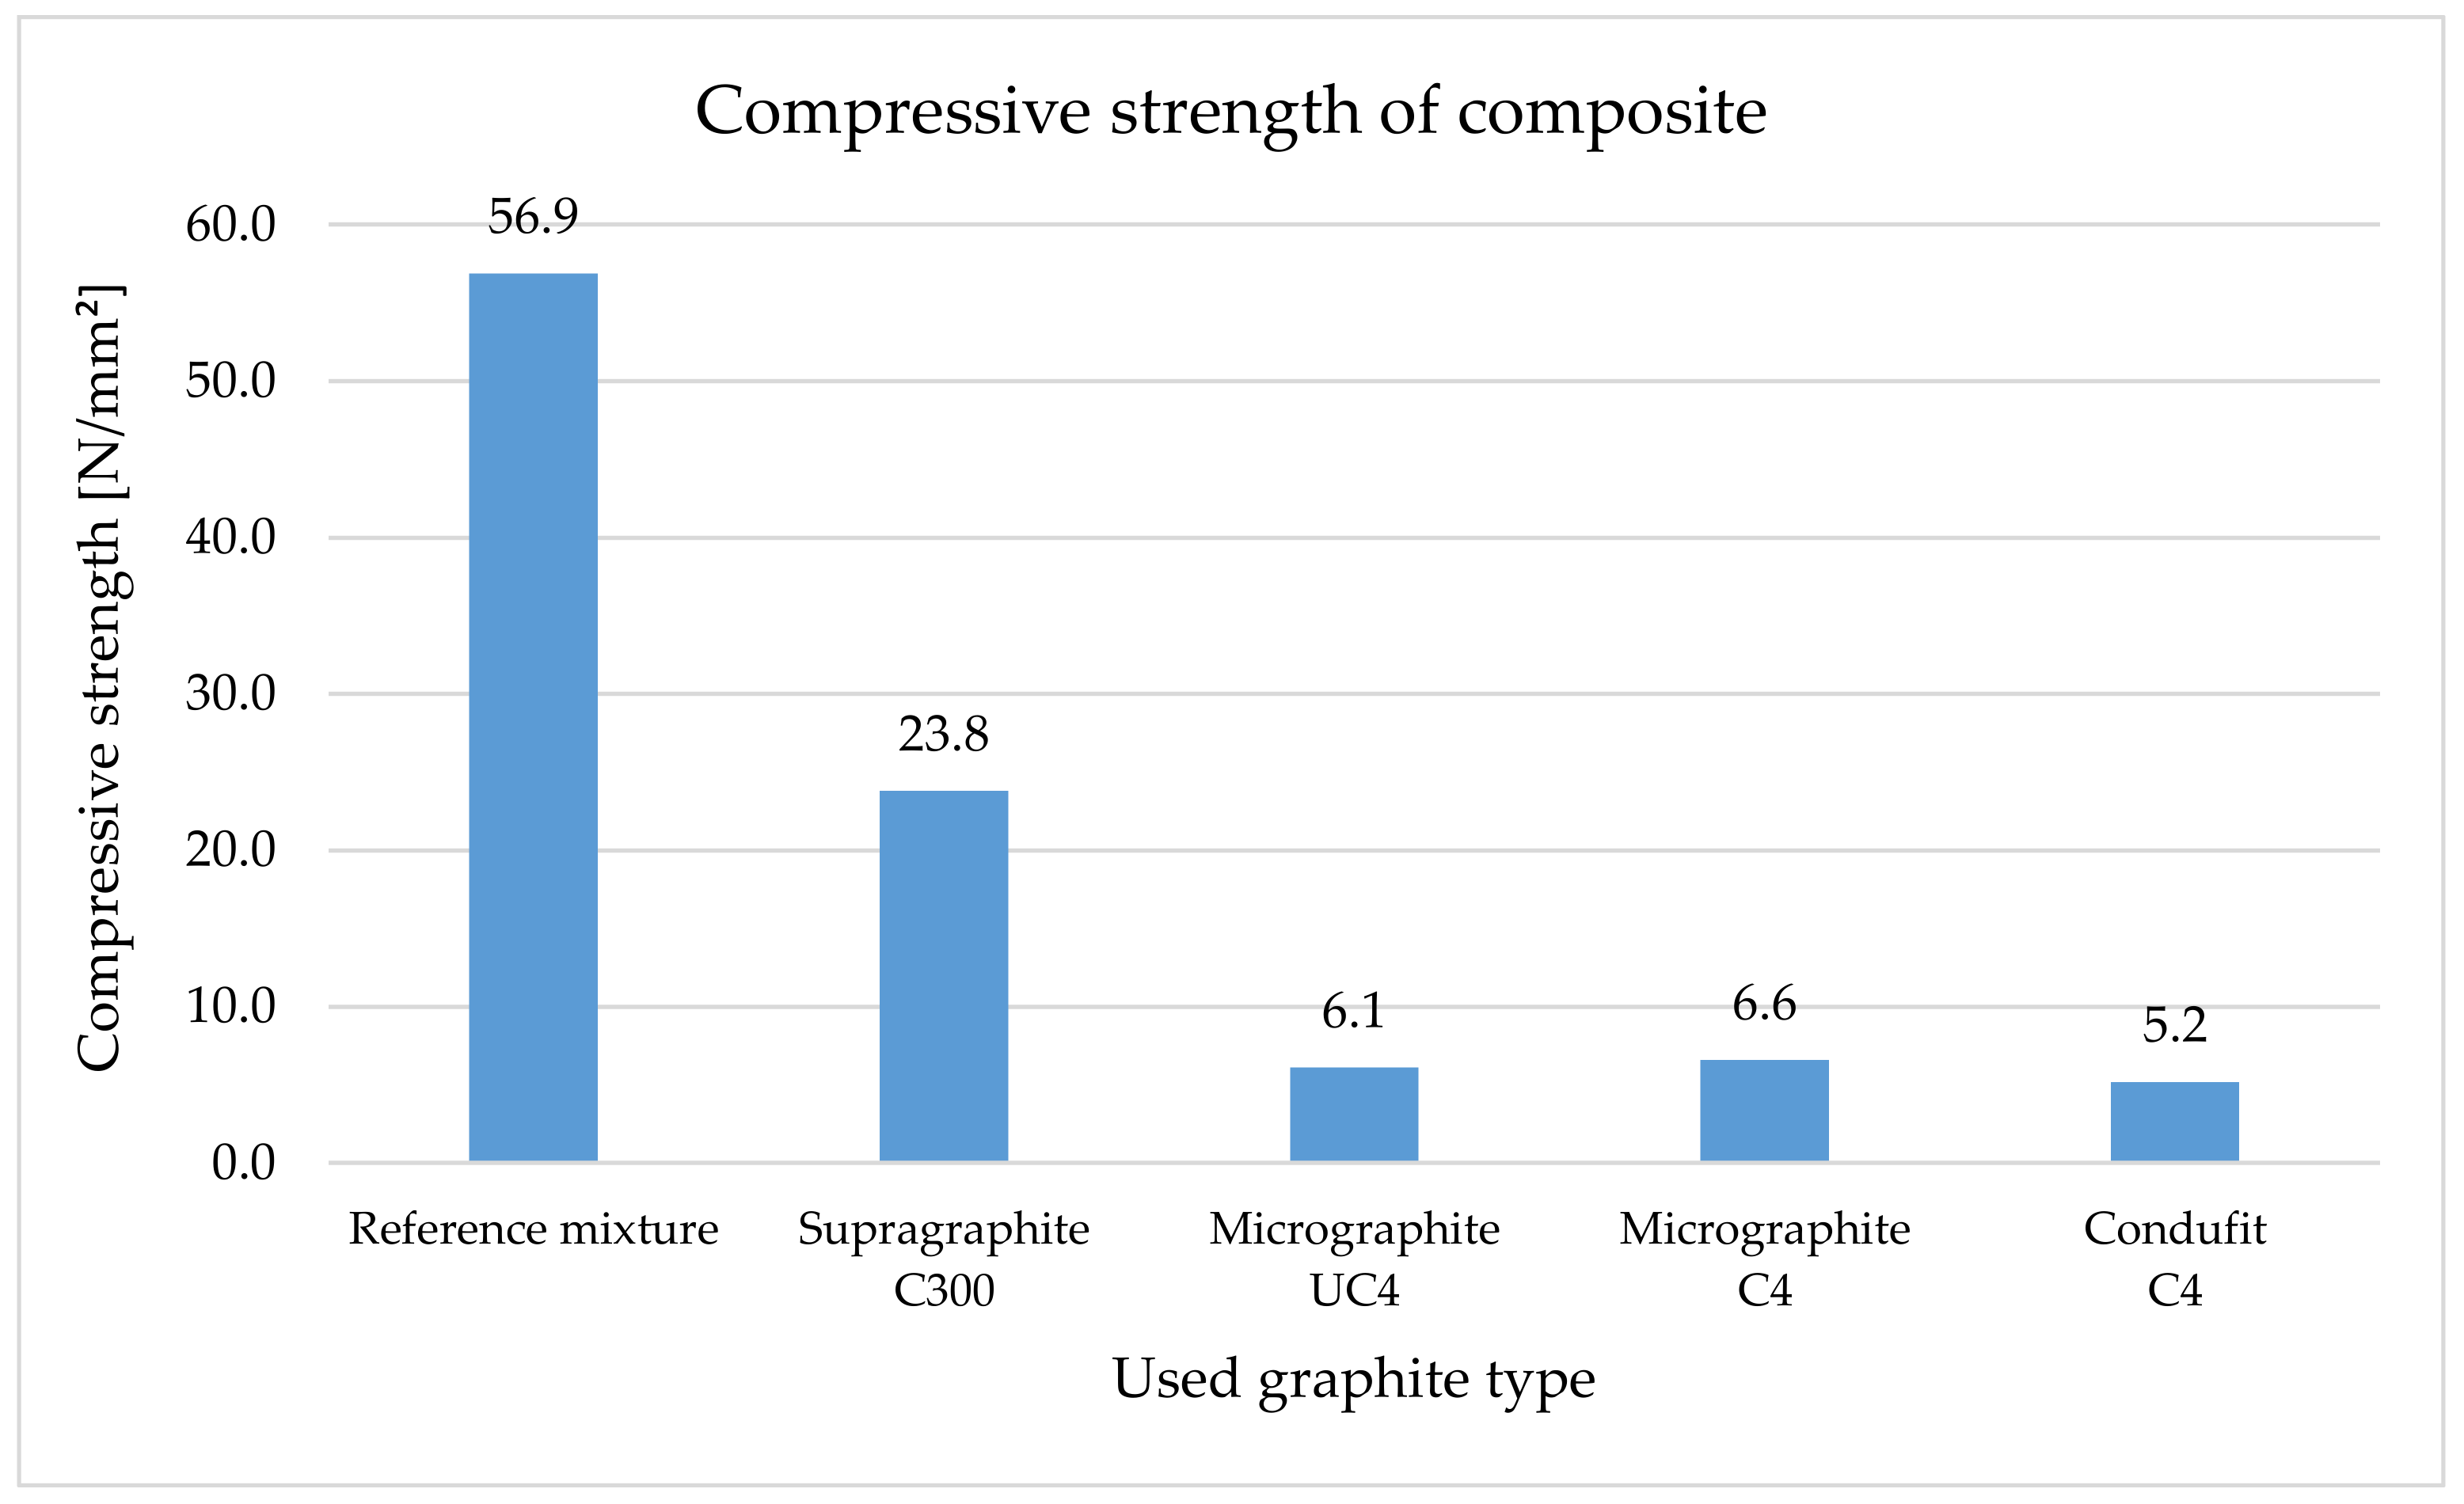
4.2. The Physical and Mechanical Properties of Cement Pastes and Composites
4.3. The Study of the Structure Using Optical Microscope
4.4. The Study of the Structure Using a Scanning Electron Microscope
5. Discussion
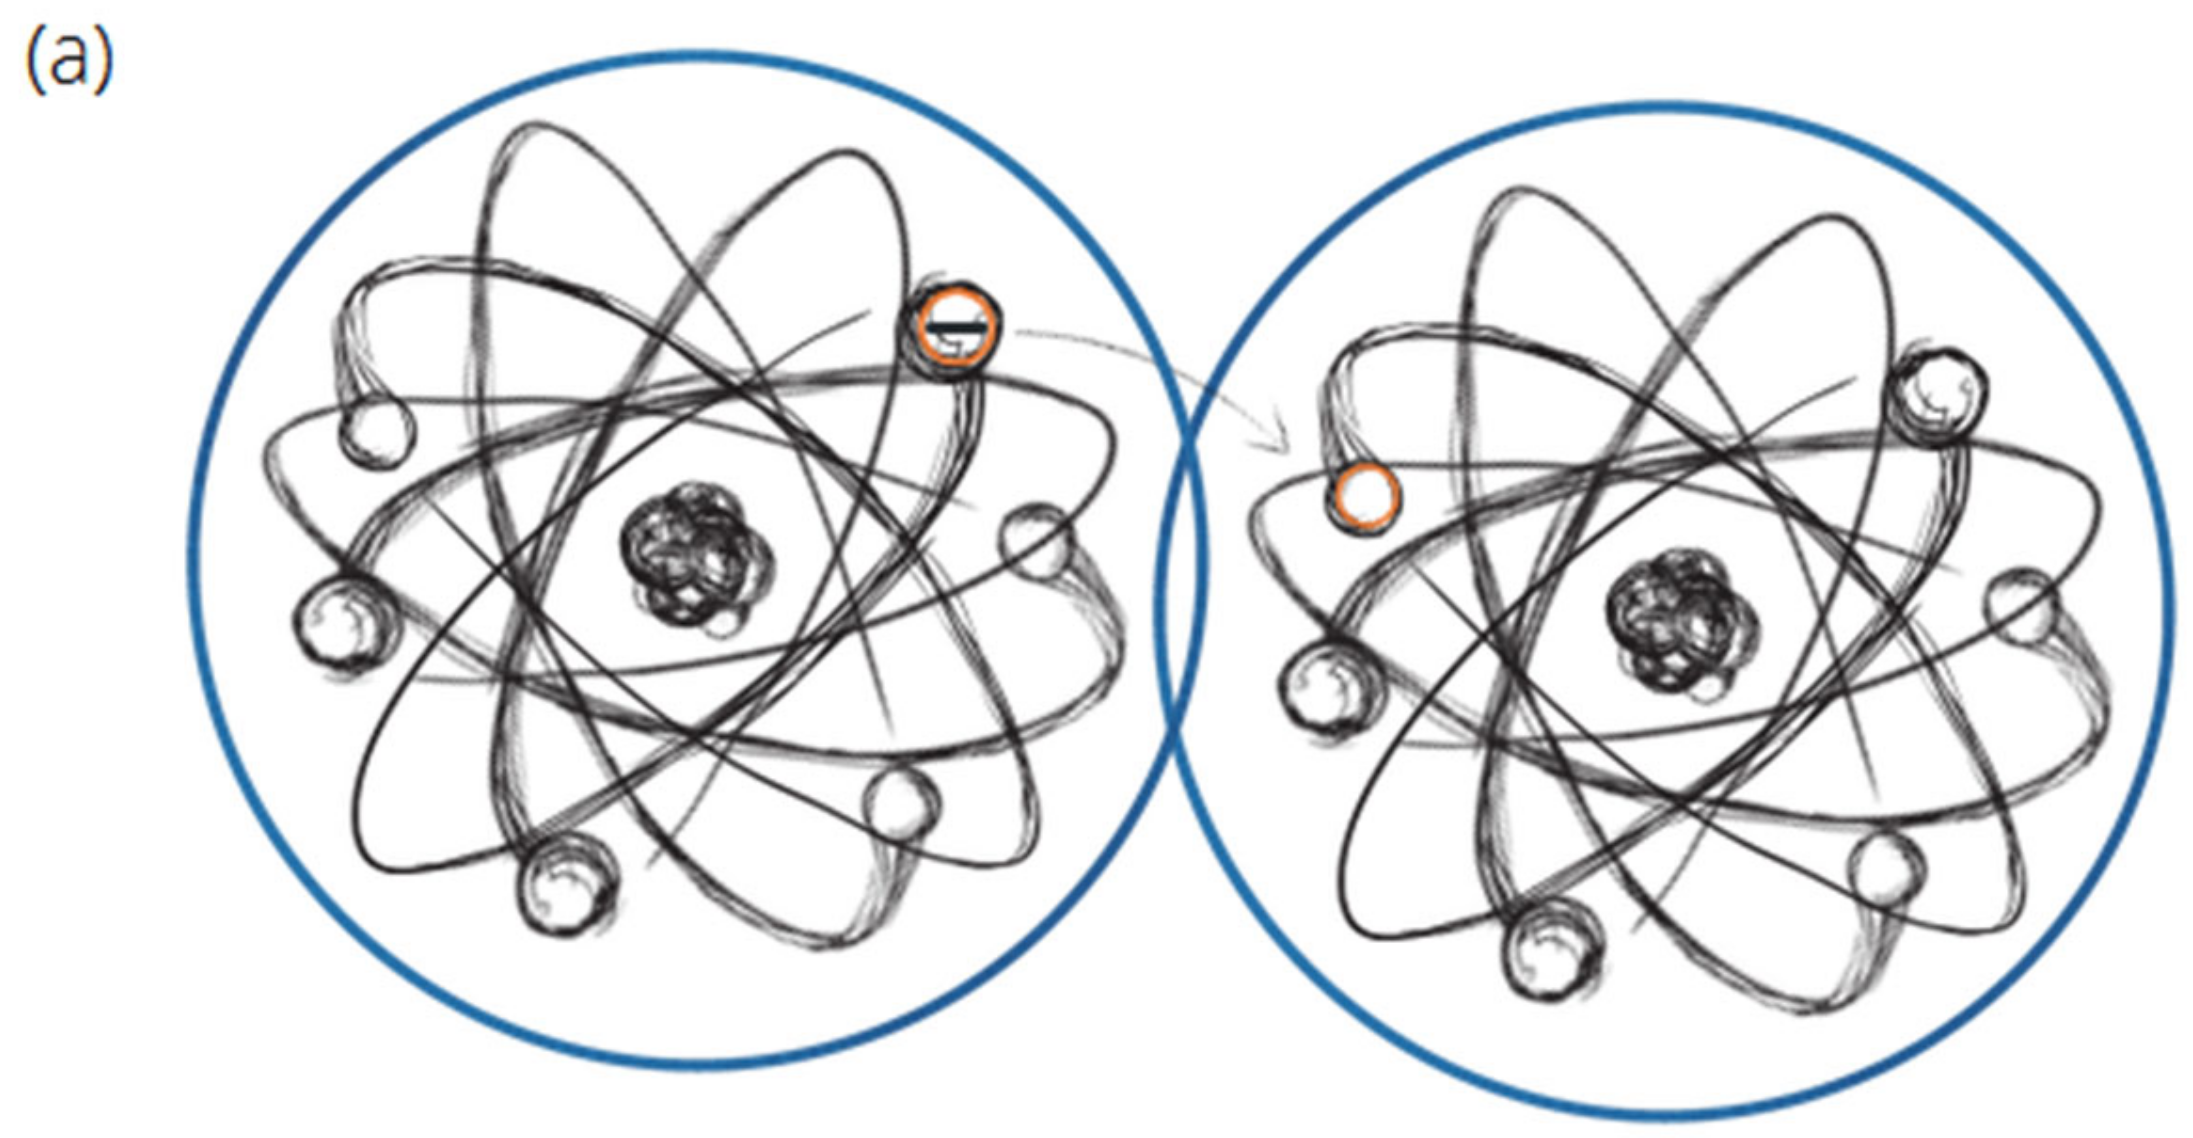
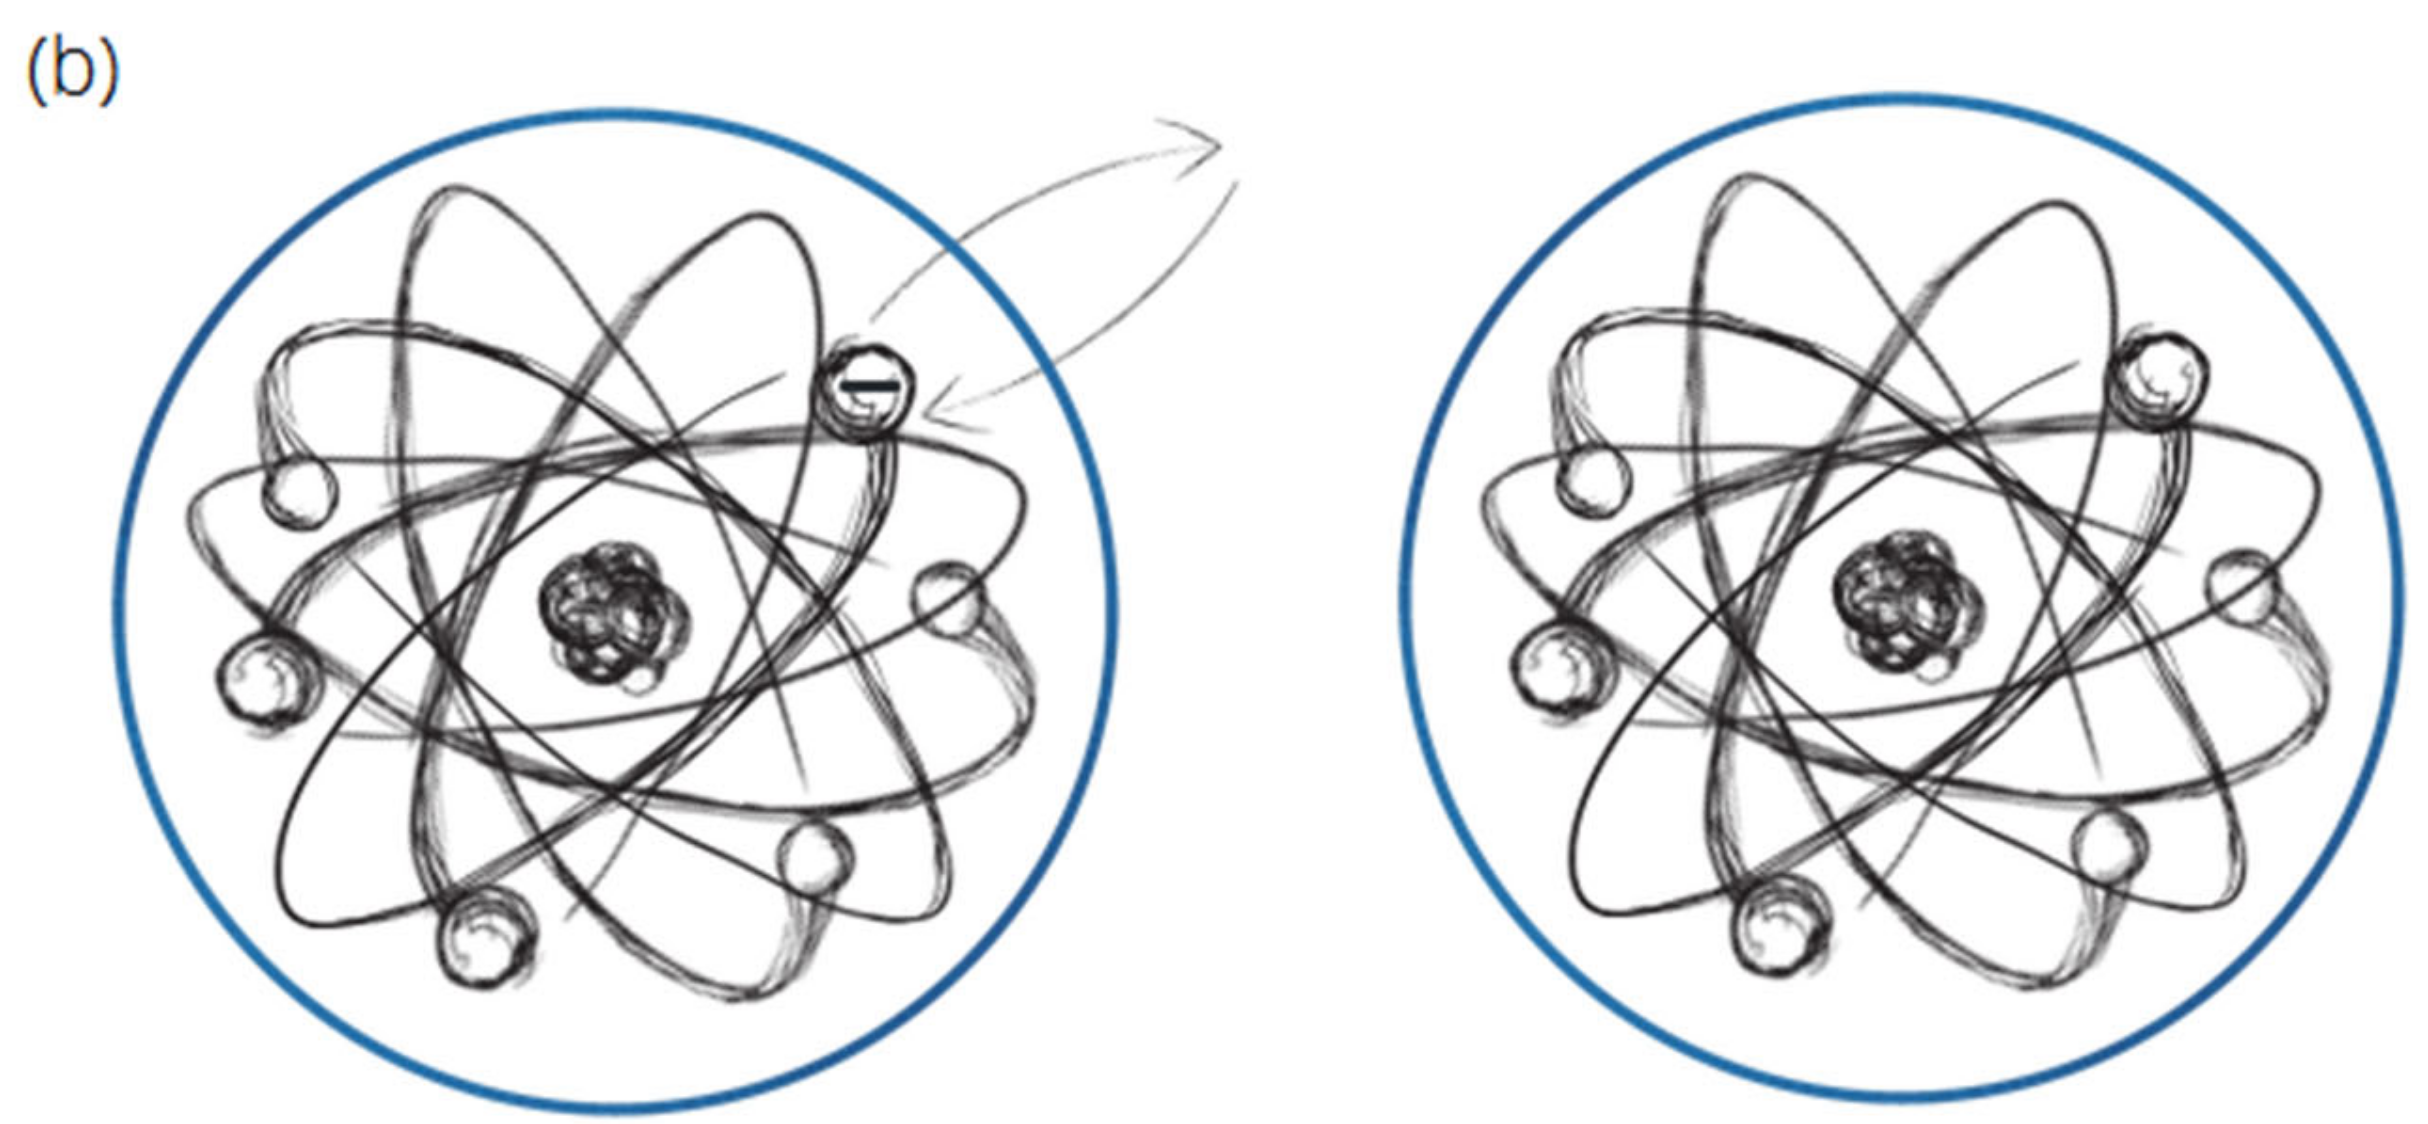
- Principles of the formation of a conductive network:
- The effect of the structure on the resistivity of cement pastes/silicate composites:
- The evaluation of the character of the fillers on the resistivity of cement pastes/silicate composites with various types of fillers
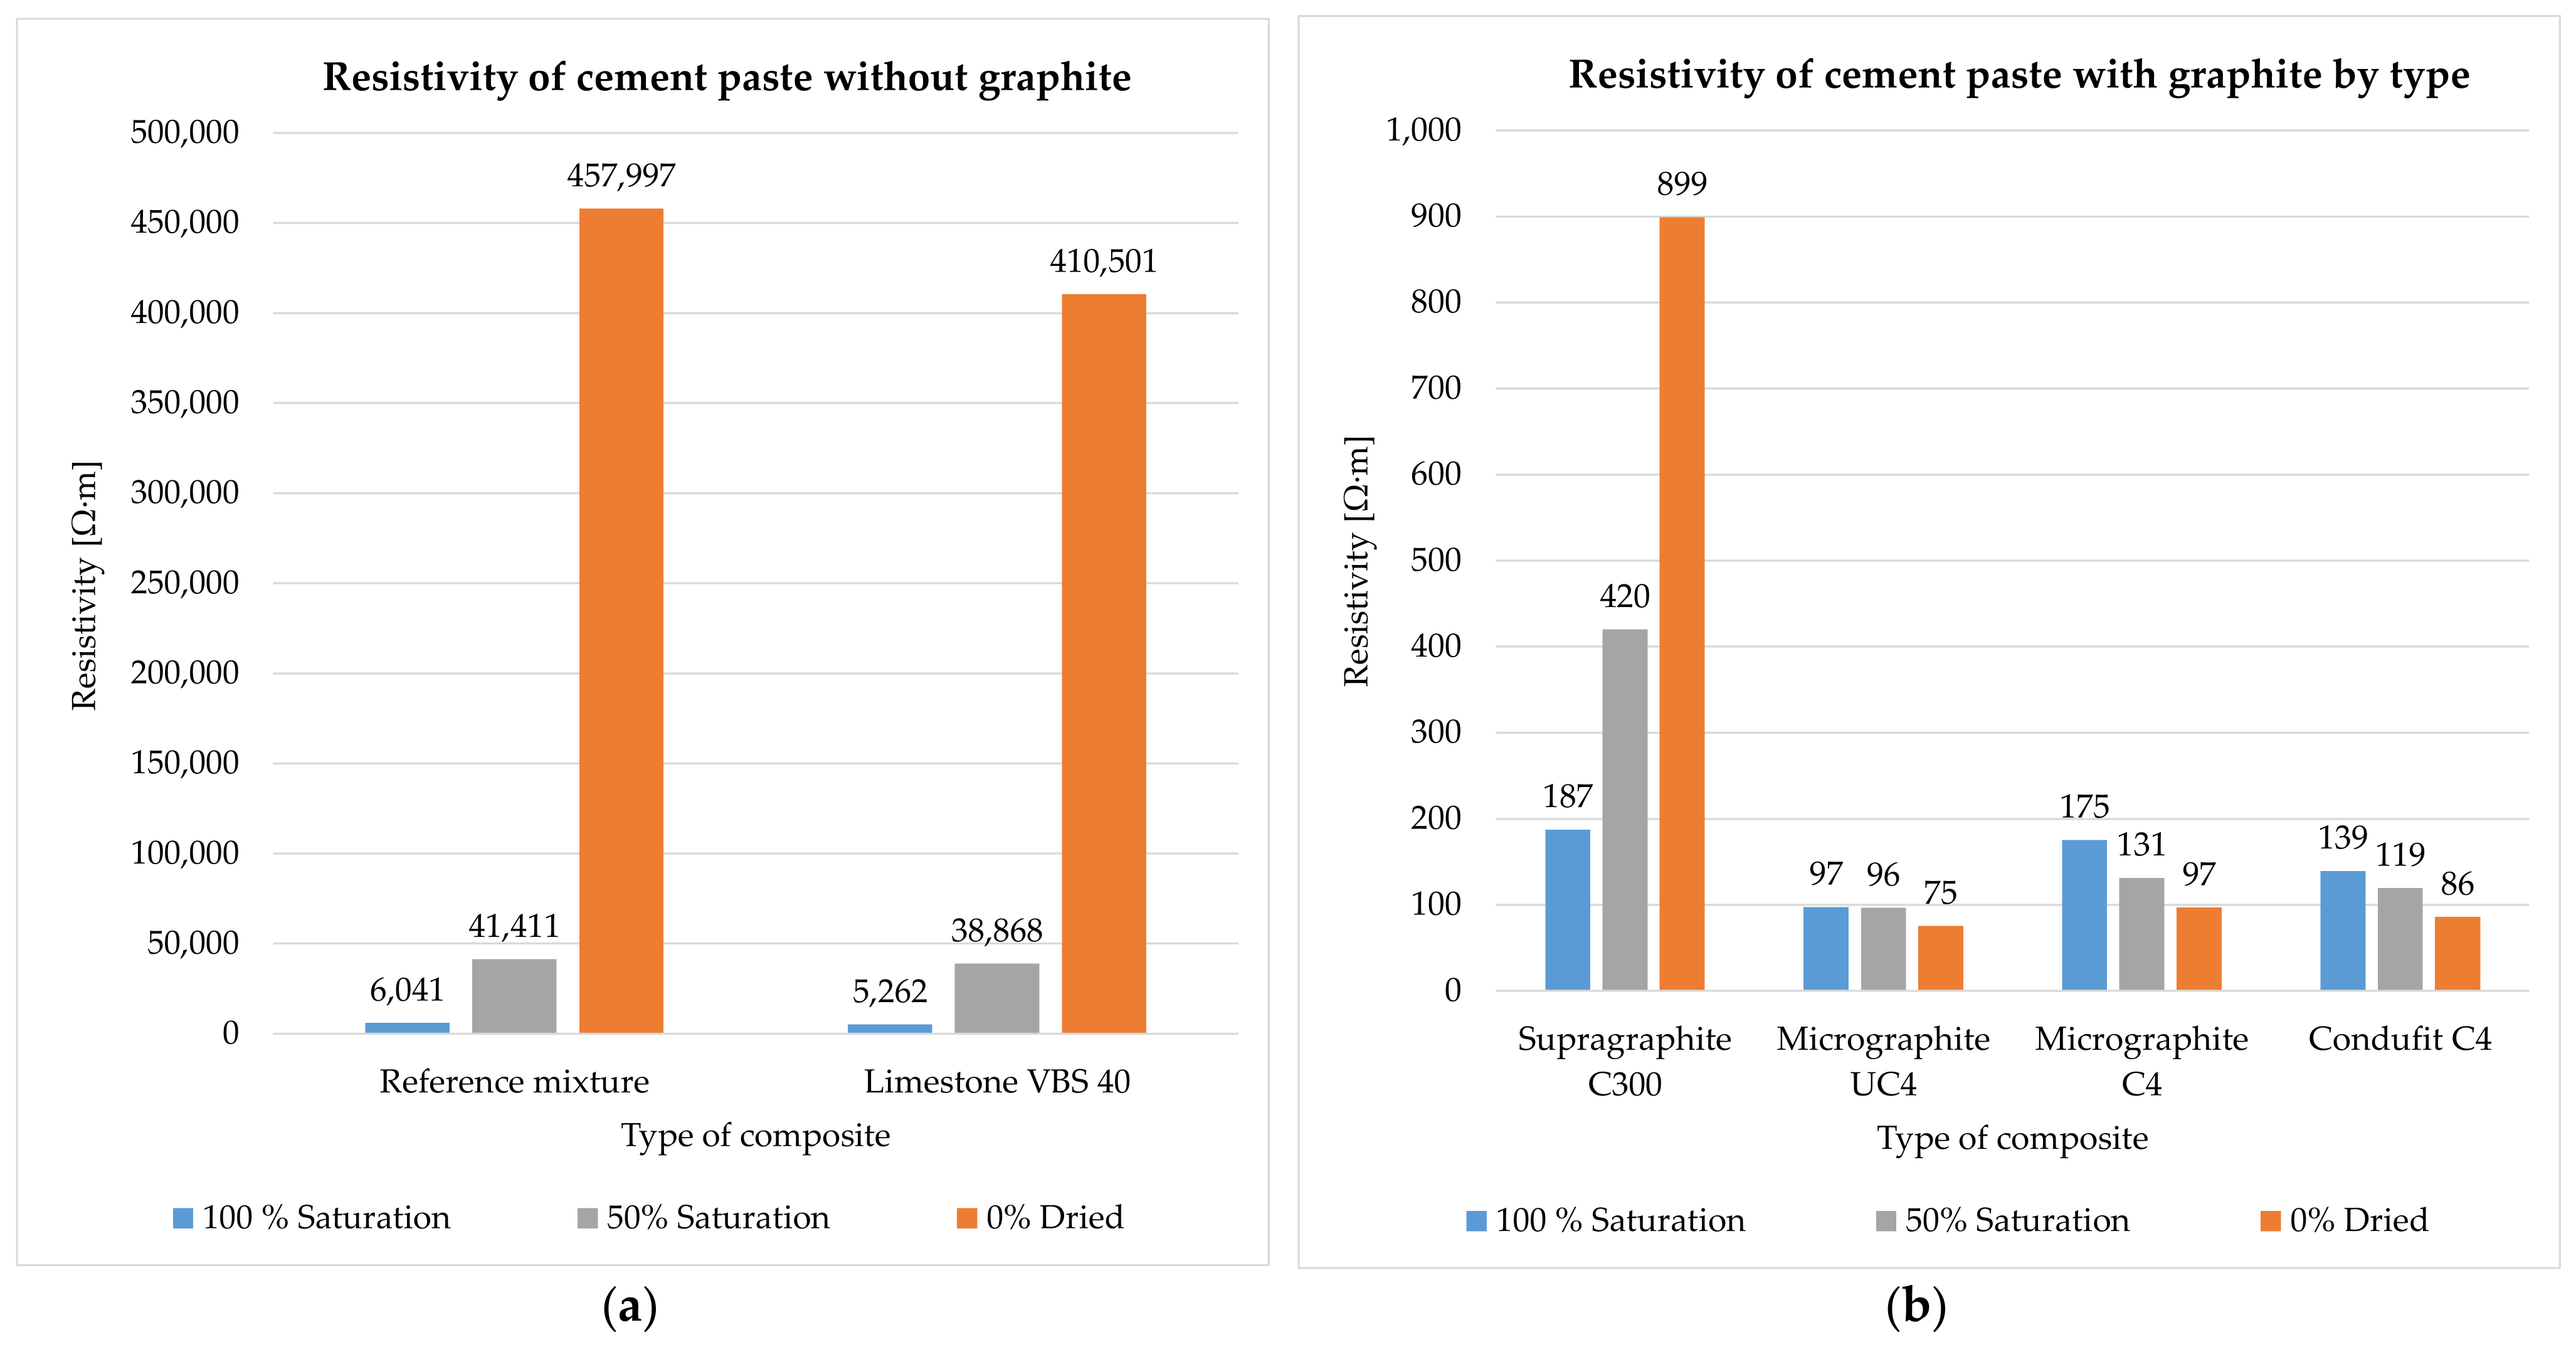
- The evaluation of the effect of water saturation on the resistivity of cement pastes/silicate composites with various types of fillers:
- The evaluation of the effect of type of fillers on the resistivity of cement pastes and silicate composites:
- The evaluation of the effects of the character of the filler on the strength of cement pastes/silicate composites with various types of fillers:
6. Conclusions
- Principles of the formation of a conductive network:
- The effect of the structure on the resistivity of cement pastes/silicate composites:
- The evaluation of the character of the fillers on the resistivity of cement pastes/silicate composites with various types of fillers:
- The evaluation of the effect of water saturation on the resistivity of cement pastes/silicate composites with various types of fillers:
- The evaluation of the effect of type of fillers on the resistivity of cement pastes and silicate composites:
- The evaluation of the effects of the character of the filler on the strength of cement pastes/silicate composites with various types of fillers:
Author Contributions
Funding
Institutional Review Board Statement
Informed Consent Statement
Data Availability Statement
Acknowledgments
Conflicts of Interest
References
- Zhang, L.; Li, L.; Wang, Y.; Yu, X.; Han, B. Multifunctional cement-based materials modified with electrostatic self-assembled CNT/TiO2 composite filler. Constr. Build. Mater. 2020, 238, 117787. [Google Scholar] [CrossRef]
- Melichar, T.; Bydžovský, J.; Dufka, Á. Composites based on alternative raw materials at high temperature conditions. Period. Polytech. Civ. Eng. 2017, 61, 911–919. [Google Scholar] [CrossRef] [Green Version]
- Singh, V.P.; Kumar, M.; Srivastava, R.S.; Vaish, R. Thermoelectric energy harvesting using cement-based composites: A review. Mater. Today Energy 2021, 21, 100714. [Google Scholar] [CrossRef]
- El-Dieb, A.S.; El-Ghareeb, M.A.; Abdel-Rahman MA, H.; Nasr, E.S.A. Multifunctional electrically conductive concrete using different fillers. J. Build. Eng. 2018, 15, 61–69. [Google Scholar] [CrossRef]
- El-Enein, S.A.A.; Hanna, M. Electrical conductivity of concrete containing silica fume. Cem. Concr. Res. 1995, 25, 1615–1620. [Google Scholar] [CrossRef]
- McCarter, W.J.; Starrs, G.; Chrisp, T.M. Electrical conductivity, diffusion, and permeability of Portland cement-based mortars. Cem. Concr. Res. 2000, 30, 1395–1400. [Google Scholar] [CrossRef]
- Cosarinsky, G.; Fava, J.; Ruch, M.; Bonomi, A. Material characterization by electrical conductivity assessment using impedance analysis. Procedia Mater. Sci. 2015, 9, 156–162. [Google Scholar] [CrossRef] [Green Version]
- Terashita, K.; Tanaka, T.; Nishimura, K.; Miyanami, K. Continuous kneading for electrically conductive composite materials and evaluation of filler dispersion state. Bull. Univ. Osaka Prefect. Ser. A Eng. Nat. Sci. 1993, 42, 51–67. [Google Scholar]
- Wu, J.; Liu, J.; Yang, F. Three-phase composite conductive concrete for pavement deicing. Constr. Build. Mater. 2015, 2015, 129–135. [Google Scholar] [CrossRef]
- Yehia, S.; Tuan, C.Y. Conductive concrete overlay for bridge deck deicing. ACI Mater. J. 1999, 96, 382–390. [Google Scholar]
- Danoglidis, P.A.; Konsta-Gdoutos, M.S.; Shah, S.P. Relationship between the carbon nanotube dispersion state, electrochemical impedance and capacitance and mechanical properties of percolative nanoreinforced OPC mortars. Carbon 2019, 145, 218–228. [Google Scholar] [CrossRef]
- Mori, T.; Tanaka, K. Average stress in matrix and average elastic energy of materials with misfitting inclusions. Acta Metall. 1973, 21, 571–574. [Google Scholar] [CrossRef]
- Dehghanpour, H.; Yilmaz, K.; Ipek, M. Evaluation of recycled nano carbon black and waste erosion wires in electrically conductive concretes. Constr. Build. Mater. 2019, 221, 109–121. [Google Scholar] [CrossRef]
- Arabzadeh, A.; Ceylan, H.; Kim, S.; Gopalakrishnan, K.; Sassani, A. Fabrication of polytetrafluoroethylene-coated asphalt concrete biomimetic surfaces: A nanomaterials-based pavement winter maintenance approach. Int. Conf. Transp. Dev. 2016, 2016, 54–64. [Google Scholar]
- Arabzadeh, A.; Ceylan, H.; Kim, S.; Gopalakrishnan, K.; Sassani, A.; Sundararajan, S.; Taylor, P.C. Superhydrophobic coatings on Portland cement concrete surfaces. Constr. Build. Mater. 2017, 141, 393–401. [Google Scholar] [CrossRef]
- Ceylan, H.; Arabzadeh, A.; Sassani, A.; Kim, S.; Gopalakrishnan, K. Innovative Nano-engineered asphalt concrete for ice and snow controls in pavement systems. In Proceedings of the 6th Eurasphalt & Eurobitume Congress, Prague, Czech Republic, 1–3 June 2016. [Google Scholar]
- Arabzadeh, A.; Ceylan, H.; Kim, S.; Gopalakrishnan, K.; Sassani, A.; Sundararajan, S.; Taylor, P.C.; Abdullah, A. Influence of deicing salts on the water-repellency of Portland cement concrete coated with polytetrafluoroethylene and polyetheretherketone. In Proceedings of the International Conference on Highway Pavements and Airfield Technology 2017, Philadelphia, PA, USA, 27–30 August 2017; ASCE: Reston, VA, USA, 2017. [Google Scholar]
- Whittington, H.; McCarter, J.; Forde, M. The conduction of electricity through concrete. Mag. Concr. Res. 1981, 33, 48–60. [Google Scholar] [CrossRef]
- Tang, Z.; Li, Z.; Qian, J.; Wang, K. Experimental study on deicing performance of carbon fiber reinforced conductive concrete. J. Mater. Sci. Technol. 2005, 21, 113–117. [Google Scholar]
- Donnini, J.; Bellezze, T.; Corinaldesi, V. Mechanical, electrical and self-sensing properties of cementitious mortars containing short carbon fibers. J. Build. Eng. 2018, 20, 8–14. [Google Scholar] [CrossRef]
- Arabzadeh, A.; Notani, M.A.; Kazemiyan Zadeh, A.; Nahvi, A.; Sassani, A.; Ceylan, H. Electrically conductive asphalt concrete: An alternative for automating the winter maintenance operations of transportation infrastructure. Compos. Part B Eng. 2019, 173, 106985. [Google Scholar] [CrossRef]
- Pantoja, J.J.; Roman, F.; Amortegui, F.; Rivera, C. Lightning grounding system of a tall-mast for human safety. Electr. Power Syst. Res. 2017, 153, 119–127. [Google Scholar] [CrossRef]
- Gomes, C.; Diego, A.G. Lightning protection scenarios of communication tower sites; human hazards and equipment damage. Saf. Sci. 2011, 49, 1355–1364. [Google Scholar] [CrossRef]
- Zhang, J.; Xu, L.; Zhao, Q. Investigation of carbon fillers modified electrically conductive concrete as grounding electrodes for transmission towers: Computational model and case study. Constr. Build. Mater. 2017, 145, 347–353. [Google Scholar] [CrossRef]
- Abdul Hamead, A.A.; Ahmed, S.S.; Ahmed Azzat, S.R.; Abed, M.S.; Zubaidi, A.B.; Hammod, G.K. Employing recycling materials for the fabrication of smart mortar. Mater. Today Proc. 2020, 20, 397–402. [Google Scholar] [CrossRef]
- Plugin, A.A.; Pluhin, O.A.; Kasyanov, V.V.; Dyomina, O.I.; Bondarenko, D.O. Portland cement-based penetrating electrically conductive composition for protection against electrocorrosion. Funct. Mater. 2021, 28, 121–130. [Google Scholar] [CrossRef]
- Pluhin, O.; Plugin, A.; Plugin, D.; Borziak, O.; Dudin, O. The effect of structural characteristics on electrical and physical properties of electrically conductive compositions based on mineral binders. Matec Web Conf. 2017, 116, 01013. [Google Scholar] [CrossRef] [Green Version]
- Lopanov, A.N.; Fanina, E.A.; Guzeeva, O.N. Cement-quartz electrically conductive composites based on graphite dispersions. ARPN J. Eng. Appl. Sci. 2014, 9, 2250–2253. [Google Scholar]
- Afroughsabet, V.; Ozbakkaloglu, T. Mechanical and durability properties of high-strength concrete containing steel and polypropylene fibers. Constr. Build. Mater. 2015, 94, 73–82. [Google Scholar] [CrossRef]
- Alvarez, G.L.; Nazari, A.; Bagheri, A.; Sanjayan, J.G.; De Lange, C. Microstructure, electrical and mechanical properties of steel fibres reinforced cement mortars with partial metakaolin and limestone addition. Constr. Build. Mater. 2017, 135, 8–20. [Google Scholar] [CrossRef]
- Androvitsaneas, V.P.; Gonos, I.F.; Stathopulos, I.A. Experimental study on transient impedance of grounding rods encased in ground enhancing compounds. Electr. Power Syst. Res. 2016, 139, 109–115. [Google Scholar] [CrossRef]
- Shi, C. Effect of mixing proportions of concrete on its electrical conductivity and the rapid chloride permeability test (ASTM C1202 or ASSHTO T277) results. Cem. Concr. Res. 2004, 34, 537–545. [Google Scholar] [CrossRef]
- Gui, Q.; Qin, M.; Li, K. Gas permeability and electrical conductivity of structural concretes: Impact of pore structure and pore saturation. Cem. Concr. Res. 2016, 89, 109–119. [Google Scholar] [CrossRef]
- Otten, K.A.; Brischke, C.; Meyer, C. Material moisture content of wood and cement mortars—Electrical resistance-based measurements in the high ohmic range. Constr. Build. Mater. 2017, 153, 640–646. [Google Scholar] [CrossRef]
- Gawel, K.; Khadrbeik MA, T.; Bjørge, R.; Wenner, S.; Gawel, B.; Ghaderi, A.; Cerasi, P. Effects of water content and temperature on bulk resistivity of hybrid cement/carbon nanofiber composites. Materials 2020, 13, 2884. [Google Scholar] [CrossRef]
- Alderete, N.; Villagrán Zaccardi, Y.; Snoeck, D.; Van Belleghem, B.; Van den Heede, P.; Van Tittelboom, K.; De Belie, N. Capillary imbibition in mortars with natural pozzolan, limestone powder and slag evaluated through neutron radiography, electrical conductivity, and gravimetric analysis. Cem. Concr. Res. 2019, 118, 57–68. [Google Scholar] [CrossRef]
- Kim, J.; Suryanto, B.; McCarter, W.J. Conduction, relaxation and complex impedance studies on Portland cement mortars during freezing and thawing. Cold Reg. Sci. Technol. 2019, 166, 102819. [Google Scholar] [CrossRef]
- Liu, K.; Cheng, X.; Li, J.; Gao, X.; Cao, Y.; Guo, X.; Zhang, C. Effects of microstructure and pore water on electrical conductivity of cement slurry during early hydration. Compos. Part B Eng. 2019, 177, 107435. [Google Scholar] [CrossRef]
- Khajehnouri, Y.; Chouteau, M.; Rivard, P.; Bérubé, C. Measuring electrical properties of mortar and concrete samples using the spectral induced polarization method: Laboratory set-up. Constr. Build. Mater. 2019, 210, 1–12. [Google Scholar] [CrossRef]
- Kim, T.; Ley, M.T.; Kang, S.; Davis, J.M.; Kim, S.; Amrollahi, P. Using particle composition of fly ash to predict concrete strength and electrical resistivity. Cem. Concr. Compos. 2020, 107, 103493. [Google Scholar] [CrossRef]
- Layssi, H.; Ghods, P.; Alizadeh, A.R.; Salehi, M. Electrical resistivity of concrete. Concr. Int. 2015, 37, 41–46. [Google Scholar]
- Baeza, F.J.; Galao, O.; Vegas, I.J.; Cano, M.; Garcés, P. Influence of recycled slag aggregates on the conductivity and strain sensing capacity of carbon fiber reinforced cement mortars. Constr. Build. Mater. 2018, 184, 311–319. [Google Scholar] [CrossRef]
- Yehia, S.A.; Tuan, C.Y. Thin conductive concrete overlay for bridge deck deicing and anti-icing. Transp. Res. Rec. 2007, 1698, 45–53. [Google Scholar] [CrossRef]
- Banthia, N.; Djeridane, S.; Pigeon, M. Electrical resistivity of carbon and steel micro-fiber reinforced cements. Cem. Concr. Res. 1992, 22, 804–814. [Google Scholar] [CrossRef]
- Tuan, C.Y. Electrical resistance heating of conductive concrete containing steel fibers and shavings. Mater. J. 2004, 101, 65–71. [Google Scholar]
- Zhang, D.; Le, H.; Yan, X.; Yuan, T.; Li, J. Preparation of steel fiber/graphite con- ductive concrete for grounding in substation. Proceedings of International Conference of High Voltage Engineering and Application, Poznan, Poland, 8–11 September 2014. [Google Scholar]
- Liu, Q.; Liu, Y.; Tang, S.; Cheng, J.; Chen, Y.; Wang, F.; Lv, Z. Effects of morphological characteristics of graphite fi llers on the thermal conductivity of the graphite / copper composites fabricated by vacuum hot pressing sintering. Vacuum 2019, 167, 199–206. [Google Scholar] [CrossRef]
- Anwar, M.S.; Suitha, B.; Vedalakshmi, R. Light-weight cementitious anode for impressed current cathodic protection of steel reinforced concrete application. Constr. Build. Mater. 2014, 71, 167–180. [Google Scholar] [CrossRef]
- Sassani, A.; Ceylan, H.; Kim, S.; Gopalakrishnan, K.; Arabzadeh, A.; Taylor, P.C. Influence of mix design variables on engineering properties of carbon fiber-modified electrically conductive concrete. Constr. Build. Mater. 2017, 152, 168–181. [Google Scholar] [CrossRef] [Green Version]
- Holčapek, O.; Reiterman, P.; Konvalinka, P. Applicability of carbon fibres in refractory cement composites. Acta Polytech. 2018, 58, 346–354. [Google Scholar] [CrossRef]
- Sassani, A.; Arabzadeh, A.; Ceylan, H.; Kim, S.; Sadati, S.M.S.; Gopalakrishnan, K.; Abdualla, H. Carbon fiber-based electrically conductive concrete for salt-free deicing of pavements. J. Clean. Prod. 2018, 203, 799–809. [Google Scholar] [CrossRef]
- Kim, G.M.; Yoon, H.N.; Lee, H.K. Autogenous shrinkage and electrical characteristics of cement pastes and mortars with carbon nanotube and carbon fiber. Constr. Build. Mater. 2018, 177, 428–435. [Google Scholar] [CrossRef]
- Galao, O.; Baeza, F.J.; Zornoza, E.; Garcés, P. Strain and damage sensing properties on multifunctional cement composites with CNF admixture. Cem. Concr. Compos. 2014, 46, 90–98. [Google Scholar] [CrossRef] [Green Version]
- Wen, S.; Chung, D.D.L. A comparative study of steel- and carbon-fiber cement as piezoresistive strain sensors. Adv. Cem. Res. 2003, 15, 119–128. [Google Scholar] [CrossRef]
- Wen, S.; Chung, D.D.L. Strain-sensing characteristics of carbon fiber-reinforced cement. Mater. J. 2005, 102, 244–248. [Google Scholar]
- Zhu, S.; Chung, D.D.L. Numerical assessment of the methods of measurement of the electrical resistance in carbon fiber reinforced cement. Smart Mater. Struct. 2007, 16, 1164–1170. [Google Scholar] [CrossRef] [Green Version]
- Xu, J.; Yao, W. Current distribution in reinforced concrete cathodic protection system with conductive mortar overlay anode. Constr. Build. Mater. 2009, 23, 2220–2226. [Google Scholar] [CrossRef]
- He, Y.; Lu, L.; Jin, S.; Hu, S. Conductive aggregate prepared using graphite and clay and its use in conductive mortar. Constr. Build. Mater. 2014, 53, 131–137. [Google Scholar] [CrossRef]
- Camacho-Ballesta, C.; Zornoza, E.; Garcés, P. Performance of cement-based sensors with CNT for strain sensing. Adv. Cem. Res. 2016, 28, 274–284. [Google Scholar] [CrossRef] [Green Version]
- García-Macías, E.; D’Alessandro, A.; Castro-Triguero, R.; Pérez-Mira, D.; Ubertini, F. Micromechanics modeling of the electrical conductivity of carbon nanotube cement-matrix composites. Compos. Part B Eng. 2017, 108, 451–469. [Google Scholar] [CrossRef]
- Konsta-Gdoutos, M.S.; Batis, G.; Danoglidis, P.A.; Zacharopoulou, A.K.; Zacharopoulou, E.K.; Falara, M.G.; Shah, S.P. Effect of CNT and CNF loading and count on the corrosion resistance, conductivity and mechanical properties of nanomodified OPC mortars. Constr. Build. Mater. 2017, 147, 48–57. [Google Scholar] [CrossRef]
- Azhari, F.; Banthia, N. Cement-based sensors with carbon fibers and carbon nanotubes for piezoresistive sensing. Cem. Concr. Compos. 2012, 34, 866–873. [Google Scholar] [CrossRef]
- Kim, G.M.; Park, S.M.; Ryu, G.U.; Lee, H.K. Electrical characteristics of hierarchical conductive pathways in cementitious composites incorporating CNT and carbon fiber. Cem. Concr. Compos. 2017, 82, 165–175. [Google Scholar] [CrossRef]
- Park, H.M.; Kim, G.M.; Lee, S.Y.; Jeon, H.; Kim, S.Y.; Kim, M.; Kim, J.W.; Jung, Y.C.; Yang, B.J. Electrical resistivity reduction with pitch-based carbon fiber into multi-walled carbon nanotube (MWCNT)-embedded cement composites. Constr. Build. Mater. 2018, 165, 484–493. [Google Scholar] [CrossRef]
- Zuo, J.; Yao, W.; Liu, X.; Qin, J. Sensing properties of carbon nanotube–carbon fiber/cement nanocomposites. J. Test. Eval. 2012, 40, 838–843. [Google Scholar] [CrossRef]
- Baeza, F.J.; Galao, O.; Zornoza, E.; Garcés, P. Effect of aspect ratio on strain sensing capacity of carbon fiber reinforced cement composites. Mater. Des. 2013, 51, 1085–1094. [Google Scholar] [CrossRef]
- López-Pernía, C.; Muñoz-Ferreiro, C.; González-Orellana, C.; Morales-Rodríguez, A.; Gallardo-López Poyato, R. Optimizing the homogenization technique for graphene nanoplatelet/yttria tetragonal zirconia composites: Influence on the microstructure and the electrical conductivity. J. Alloy. Compd. 2018, 767, 994–1002. [Google Scholar] [CrossRef]
- Rhee, I.; Lee, J.S.; Kim, Y.A.; Kim, J.H.; Kim, J.H. Electrically conductive cement mortar: Incorporating rice husk-derived high-surface-area graphene. Constr. Build. Mater. 2016, 125, 632–642. [Google Scholar] [CrossRef]
- Payot, F.; Begin, D.; Celzard, A.; Mareche, J.F.; Furdin, G. Electrical conductivity of anthracites as a function of heat treatment temperature. Carbon 2000, 38, 1207–1215. [Google Scholar] [CrossRef]
- Li, H.; Xiao, H.; Ou, J. Effect of compressive strain on electrical resistivity of carbon black-filled cement-based composites. Cem. Concr. Compos. 2006, 28, 824–828. [Google Scholar] [CrossRef]
- Monteiro, A.O.; Cachim, P.B.; Costa, P.M.F.J. Electrical properties of cement-based composites containing carbon black particles. Mater. Today 2015, 2, 193–199. [Google Scholar] [CrossRef]
- Liu, Y.; Song, C.; Lv, G.; Fan, C.; Zhang, X. Relationships between the electrical properties and nanostructure of soot particles in a laminar inverse diffusion flame. Proc. Combust. Inst. 2019, 37, 1185–1192. [Google Scholar] [CrossRef]
- Velay-Lizancos, M.; Azenha, M.; Martínez-Lage, I.; Vázquez-Burgo, P. Addition of biomass ash in concrete: Effects on E-Modulus, electrical conductivity at early ages and their correlation. Constr. Build. Mater. 2017, 157, 1126–1132. [Google Scholar] [CrossRef]
- García, Á.; Schlangen, E.; van de Ven, M.; Liu, Q. Electrical conductivity of asphalt mortar containing conductive fibers and fillers. Constr. Build. Mater. 2009, 23, 3175–3181. [Google Scholar] [CrossRef]
- Rew, Y.; Baranikumar, A.; Tamashausky, A.V.; El-Tawil, S.; Park, P. Electrical and mechanical properties of asphaltic composites containing carbon based fillers. Constr. Build. Mater. 2017, 135, 394–404. [Google Scholar] [CrossRef]
- Wang, H.; Yang, J.; Liao, H.; Chen, X. Electrical and mechanical properties of asphalt concrete containing conductive fibers and fillers. Constr. Build. Mater. 2016, 122, 184–190. [Google Scholar] [CrossRef] [Green Version]
- Zeng, X.; Xie, Y.; Deng, D. Conductivity behavior of the fresh CA mortar and its relationship with the fluidity properties. Constr. Build. Mater. 2012, 36, 890–894. [Google Scholar] [CrossRef]
- Rovnaník, P.; Kusák, I.; Bayer, P.; Schmid, P.; Fiala, L. Comparison of electrical and self-sensing properties of Portland cement and alkali-activated slag mortars. Cem. Concr. Res. 2019, 118, 84–91. [Google Scholar] [CrossRef]
- Lunak, M.; Kusak, I.; Chobola, Z. Carbon admixtures influence on the electrical properties of slag mortars focusing on alternating conductivity and permittivity. Procedia Eng. 2016, 151, 236–240. [Google Scholar] [CrossRef] [Green Version]
- Nayak, S.; Das, S. Spatial damage sensing ability of metallic particulate-reinforced cementitious composites: Insights from electrical resistance tomography. Mater. Des. 2019, 175, 107817. [Google Scholar] [CrossRef]
- Norambuena-Contreras, J.; Quilodran, J.; Gonzalez-Torre, I.; Chavez, M.; Borinaga-Treviño, R. Electrical and thermharacterizationion of cement-based mortars containing recycled metallic waste. J. Clean. Prod. 2018, 190, 737–751. [Google Scholar] [CrossRef]
- Guo, W.; Hu, J.; Wang, Y.; Zhang, Z.; Yin, S.; Wei, J.; Yu, Q. Preparation and performance of conductive mortar based on lightweight conductive aggregates. Constr. Build. Mater. 2017, 156, 340–350. [Google Scholar] [CrossRef]
- Bragança, M.O.G.P.; Portella, K.F.; Bonato, M.M.; Marino, C.E.B. Electrochemical impedance behavior of mortar subjected to a sulfate environment—A comparison with chloride exposure models. Constr. Build. Mater. 2014, 68, 650–658. [Google Scholar] [CrossRef]
- Flores Medina, N.; del Mar Barbero-Barrera, M.; Jové-Sandoval, F. Improvement of the mechanical and physical properties of cement pastes and mortars through the addition isostatic graphite. Constr. Build. Mater. 2018, 189, 898–905. [Google Scholar] [CrossRef]
- Chen, P.H.; Chung, D.D.L. Comparative evaluation of cement-matrix composites with distributed versus networked exfoliated graphite. Carbon 2013, 63, 446–453. [Google Scholar] [CrossRef]
- Fulham-Lebrasseur, R.; Sorelli, L.; Conciatori, D. Development of electrically conductive concrete and mortars with hybrid conductive inclusions. Constr. Build. Mater. 2020, 237, 117470. [Google Scholar] [CrossRef]
- Duran-Herrera, A.; De-León-Esquivel, J.; Bentz, D.P.; Valdez-Tamez, P. Self-compacting concretes using fly ash and fine limestone powder: Shrinkage and surface electrical resistivity of equivalent mortars. Constr. Build. Mater. 2019, 199, 50–62. [Google Scholar] [CrossRef]
- Belli, A.; Mobili, A.; Bellezze, T.; Tittarelli, F. Commercial and recycled carbon/steel fibers for fiber-reinforced cement mortars with high electrical conductivity. Cem. Concr. Compos. 2020, 109, 103569. [Google Scholar] [CrossRef]
- EN 197-1—Composition, Specifications and Conformity Criteria for Common Cements; European Committee for Standardization (CEN): Brussels, Belgium, 2011.
- EN 12620:2002+A1:2013—Aggregates for Concrete; European Committee for Standardization (CEN): Brussels, Belgium, 2013.
- EN 934-1—Admixtures for Concrete, Mortar and Grout—Part 1: Common Requirements; European Committee for Standardization (CEN): Brussels, Belgium, 2008.
- EN 1015-3 Methods of Test for Mortar for Masonry—Part 3: Determination of Consistence of Fresh Mortar (by Flow Table); European Committee for Standardization (CEN): Brussels, Belgium, 1999.
- EN 1097-3—Tests for Mechanical and Physical Properties of Aggregates—Part 3: Determination of Loose Bulk Density and Voids; European Committee for Standardization (CEN): Brussels, Belgium, 1998.
- EN 1097-6—Tests for Mechanical and Physical Properties of Aggregates—Part 6: Determination of Particle Density and Water Absorption; European Committee for Standardization (CEN): Brussels, Belgium, 2013.
- EN 933-1—Tests for Geometrical Properties of Aggregates—Part 1: Determination of Particle Size Distribution—Sieving Method; European Committee for Standardization (CEN): Brussels, Belgium, 2012.
- EN 13055—Lightweight Aggregates; European Committee for Standardization (CEN): Brussels, Belgium, 2016.
- EN 196-1—Methods of Testing Cement—Part 1: Determination of Strength; European Committee for Standardization (CEN): Brussels, Belgium, 2016.
- EN 12390-5—Testing Hardened Concrete—Part 5: Flexural Strength of Test Specimens; European Committee for Standardization (CEN): Brussels, Belgium, 2019.
- EN 12390-4—Testing Hardened Concrete—Part 4: Compressive Strength—Specification for Testing Machines; European Committee for Standardization (CEN): Brussels, Belgium, 2019.
- EN 12390-3—Testing Hardened Concrete—Part 3: Compressive Strength of Test Specimens; European Committee for Standardization (CEN): Brussels, Belgium, 2019.
- Xu, D.; Cheng, X.; Banerjee, S.; Huang, S. Dielectric and electromechanical properties of modified cement/polymer based 1-3 connectivity piezoelectric composites containing inorganic fillers. Compos. Sci. Technol. 2015, 114, 72–78. [Google Scholar] [CrossRef]
- Xie, N.; Shi, X.; Feng, D.; Kuang, B.; Li, H. Percolation backbone structure analysis in electrically conductive carbon fiber reinforced cement composites. Compos. Part B Eng. 2012, 43, 3270–3275. [Google Scholar] [CrossRef]
- Tumidajski, P.J. Electrical conductivity of Portland cement mortars. Cem. Concr. Res. 1996, 26, 529–534. [Google Scholar] [CrossRef]
- Zhang, L.; Ding, S.; Han, B.; Yu, X.; Ni, Y.-Q. Effect of water content on the piezoresistive property of smart cement-based materials with carbon nanotube/nanocarbon black composite filler. Compos. Part A Appl. Sci. Manuf. 2019, 119, 8–20. [Google Scholar] [CrossRef]
- Tzounis, L.; Liebscher, M.; Fuge, R.; Leonhardt, A.; Mechtcherine, V. P- and n-type thermoelectric cement composites with CVD grown p- and n-doped carbon nanotubes: Demonstration of a structural thermoelectric generator. Energy Build. 2019, 191, 151–163. [Google Scholar] [CrossRef]
- Princigallo, A.; Van Breugel, K.; Levita, G. Influence of the aggregate on the electrical conductivity of Portland cement concretes. Cem. Concr. Res. 2003, 33, 1755. [Google Scholar] [CrossRef]
- Wen, S.; Chung, D.D.L. The role of electronic and ionic conduction in the electrical conductivity of carbon fiber reinforced cement. Carbon 2006, 44, 2130–2138. [Google Scholar] [CrossRef]
- Sun, M.; Li, Z.; Mao, Q.; Shen, D. Study of the hole conduction phenomenon in carbon fiber-reinforced concrete. Cem. Concr. Res. 1998, 28, 549–554. [Google Scholar] [CrossRef]
- Chen, P.-W.; Chung, D.D.L. Improving the electrical conductivity of composites comprised of short conducting fibers in a non-conducting matrix: The addition of a non-conducting particulate filler. J. Electron. Mater. 1995, 24, 47–51. [Google Scholar] [CrossRef]
- Guerrero, V.H.; Wang, S.; Wen, S.; Chung, D.D.L. Thermoelectric property tailoring by composite engineering. J. Mater. Sci. 2002, 37, 4127–4136. [Google Scholar] [CrossRef]
- Wang, D.; Wang, Q.; Huang, Z. Investigation on the poor fluidity of electrically conductive cement-graphite paste: Experiment and simulation. Mater. Des. 2019, 169, 107679. [Google Scholar] [CrossRef]
- Chougan, M.; Marotta, E.; Lamastra, F.R.; Vivio, F.; Montesperelli, G.; Ianniruberto, U.; Bianco, A. A systematic study on EN-998-2 premixed mortars modified with graphene-based materials. Constr. Build. Mater. 2019, 227, 116701. [Google Scholar] [CrossRef]
- Alatawna, A.; Birenboim, M.; Nadiv, R.; Buzaglo, M.; Peretz-Damari, S.; Peled, A.; Regev, O.; Sripada, R. The effect of compatibility and dimensionality of carbon nanofillers on cement composites. Constr. Build. Mater. 2020, 232, 117141. [Google Scholar] [CrossRef]
- Lamastra, F.R.; Chougan, M.; Marotta, E.; Ciattini, S.; Ghaffar, S.H.; Caporali, S.; Bianco, A. Toward a better understanding of multifunctional cement-based materials: The impact of graphite nanoplatelets (GNPs). Ceram. Int. 2021, 47, 20019–20031. [Google Scholar] [CrossRef]


| Selected Properties | CEM I 42,5 R |
|---|---|
| Specific surface (m2/kg) | 391 (EN 196-6, Blaine) |
| Volumetric mass density (kg/m3) | 3 110 |
| Resistivity (Ω·m) | 9.12 × 10⁶ |
| Selected Properties | Silica Sand 1.6/4 | Silica Sand 30/31 | Silica Sand 35 | Lime Stone VBS 40 |
|---|---|---|---|---|
| Bulk density loose (kg/m3) | 1540 | 1460 | 1380 | 1050 |
| Bulk density of compacted aggregate (kg/m3) | 1590 | 1600 | 1470 | 1190 |
| Water absorption capacity WA5 (%) | 3 | 4 | 11 | 22 |
| Volumetric mass density (pycnometric) (kg/m3) | 3120 | 2630 | 3380 | 2660 |
| Resistivity (Ω·m) | * | * | * | 38.89 × 10⁶ |
| Grain size (mm) | 1.4–4.0 | 0.3–1.0 | 0.1–0.3 | 0.0–0.4 |
| Selected Properties | Plasticizer |
|---|---|
| Density (kg/m3) | 1055 ± 20 |
| Dry mass content (% of weight) | 25 ± 2 |
| Maximum chloride content (% of weight) | 0.1 |
| Maximum alkaline content (% equivalent to Na2O) | 2 |
| Recommended amount (% of the cement weight) | 0.4–1.4 |
| Commercial Name | Granularity | Genesis |
|---|---|---|
| Supragraphite C300 | Coarse | Natural |
| Micrographite UC4 | Fine | Synthetic |
| Micrographite C4 | Fine | Natural |
| Condufit C4 * | Fine | Natural |
| Selected Properties | Unit | Supragraphite C 300 | Micrographite UC 4 | Micrographite C4 | Condufit C4 |
|---|---|---|---|---|---|
| Particle type | Flat flakes | Flat, irregular | Irregular | Irregular with rough surface | |
| Bulk density loose | (kg/m3) | 450 | 170 | 150 | 180 |
| Bulk density of compacted aggregate | (kg/m3) | 550 | 220 | 190 | 230 |
| Volumetric mass density (pycnometric) | (kg/m3) | 2200 | 2060 | 2100 | 2100 |
| Volumetric weight (helium pycnometer) | (kg/m3) | 2250 | 2650 | 2500 | 2410 |
| Granularity D (0.1) | (μm) | 83.118 | 1.994 | 2.004 | 1.504 |
| D (0.5) | (μm) | 197.019 | 3.478 | 3.375 | 2.905 |
| D (0.9) | (μm) | 390.432 | 5.884 | 5.487 | 5.261 |
| Specific surface | (m2/kg) | 1194 | 12454 | 11933 | 20418 |
| Water absorption capacity WA (5) | (%) | 26 | 174 | 172 | 190 |
| Resistivity | (Ω·m) | 1.06 | 1.33 | 1.95 | 1.68 |
| Resistivity (Ω·m) | Water Absorption Capacity (WA5 %) | Particle Size (mm) | Volumetric Weight (kg/m3) | ||
|---|---|---|---|---|---|
| Basic Materials | Cement CEM I 42,5 R | 9.12 × 10⁶ | * | 0.0–0.25 | 3100 |
| Limestone VBS 40 | 38.89 × 10⁶ | 22 | 0.0–0.4 | 2660 | |
| Silica sand 30/31 | * | 4 | 0.3–1.0 | 2630 | |
| Silica sand 35 | * | 11 | 0.1–0.3 | 3380 | |
| Silica sand 1,6-4 | * | 3 | 1.4–4.0 | 3120 | |
| Conductive Fillers (Graphite powder) | Supragraphite C300 | 1.06 | 26 | 0.10–0.25 | 2200 |
| Micrographite UC4 | 1.33 | 174 | 3.5–5.0 × 10³ | 2060 | |
| Micrographite C4 | 1.95 | 172 | 3.5–5.0 × 10³ | 2100 | |
| Condufit C4 | 1.68 | 190 | 3.5–5.0 × 10³ | 2110 |
| Type of Admixture | Amount (Weight in %) | w/c Ratio | |
|---|---|---|---|
| CEM I 42,5 R | Graphite | ||
| Reference mixture | 100% | 0% | 0.35 |
| Supragraphite C 300 | 80% | 20% | 0.48 |
| Micrographite UC 4 | 80% | 20% | 0.65 |
| Micrographite C 4 | 80% | 20% | 0.65 |
| Condufit C4 | 80% | 20% | 0.72 |
| Component | Amount (Weight in %) | |
|---|---|---|
| Reference Mixture | Mixture with the Conductive Filler | |
| CEM I 42,5 R Portland Cement | 21.0% | 16.8% |
| VBS40 Micro-ground Limestone | 8.4% | 6.7% |
| Mixture of Silica Sands 0–4 mm | 70.5% | 56.4% |
| Plasticizer | 0.2% | 0.1% |
| Conductive Filler | 0.00% | 20.0% |
Publisher’s Note: MDPI stays neutral with regard to jurisdictional claims in published maps and institutional affiliations. |
© 2021 by the authors. Licensee MDPI, Basel, Switzerland. This article is an open access article distributed under the terms and conditions of the Creative Commons Attribution (CC BY) license (https://creativecommons.org/licenses/by/4.0/).
Share and Cite
Černý, V.; Yakovlev, G.; Drochytka, R.; Baránek, Š.; Mészárosová, L.; Melichar, J.; Hermann, R. Impact of Carbon Particle Character on the Cement-Based Composite Electrical Resistivity. Materials 2021, 14, 7505. https://doi.org/10.3390/ma14247505
Černý V, Yakovlev G, Drochytka R, Baránek Š, Mészárosová L, Melichar J, Hermann R. Impact of Carbon Particle Character on the Cement-Based Composite Electrical Resistivity. Materials. 2021; 14(24):7505. https://doi.org/10.3390/ma14247505
Chicago/Turabian StyleČerný, Vít, Grigory Yakovlev, Rostislav Drochytka, Šimon Baránek, Lenka Mészárosová, Jindřich Melichar, and Radek Hermann. 2021. "Impact of Carbon Particle Character on the Cement-Based Composite Electrical Resistivity" Materials 14, no. 24: 7505. https://doi.org/10.3390/ma14247505