
Application of Mathematical and Experimental Approach in Description of Sedimentation of Powder Fillers in Epoxy Resin

 , , ,
, , ,  and
and 
Abstract
:1. Introduction
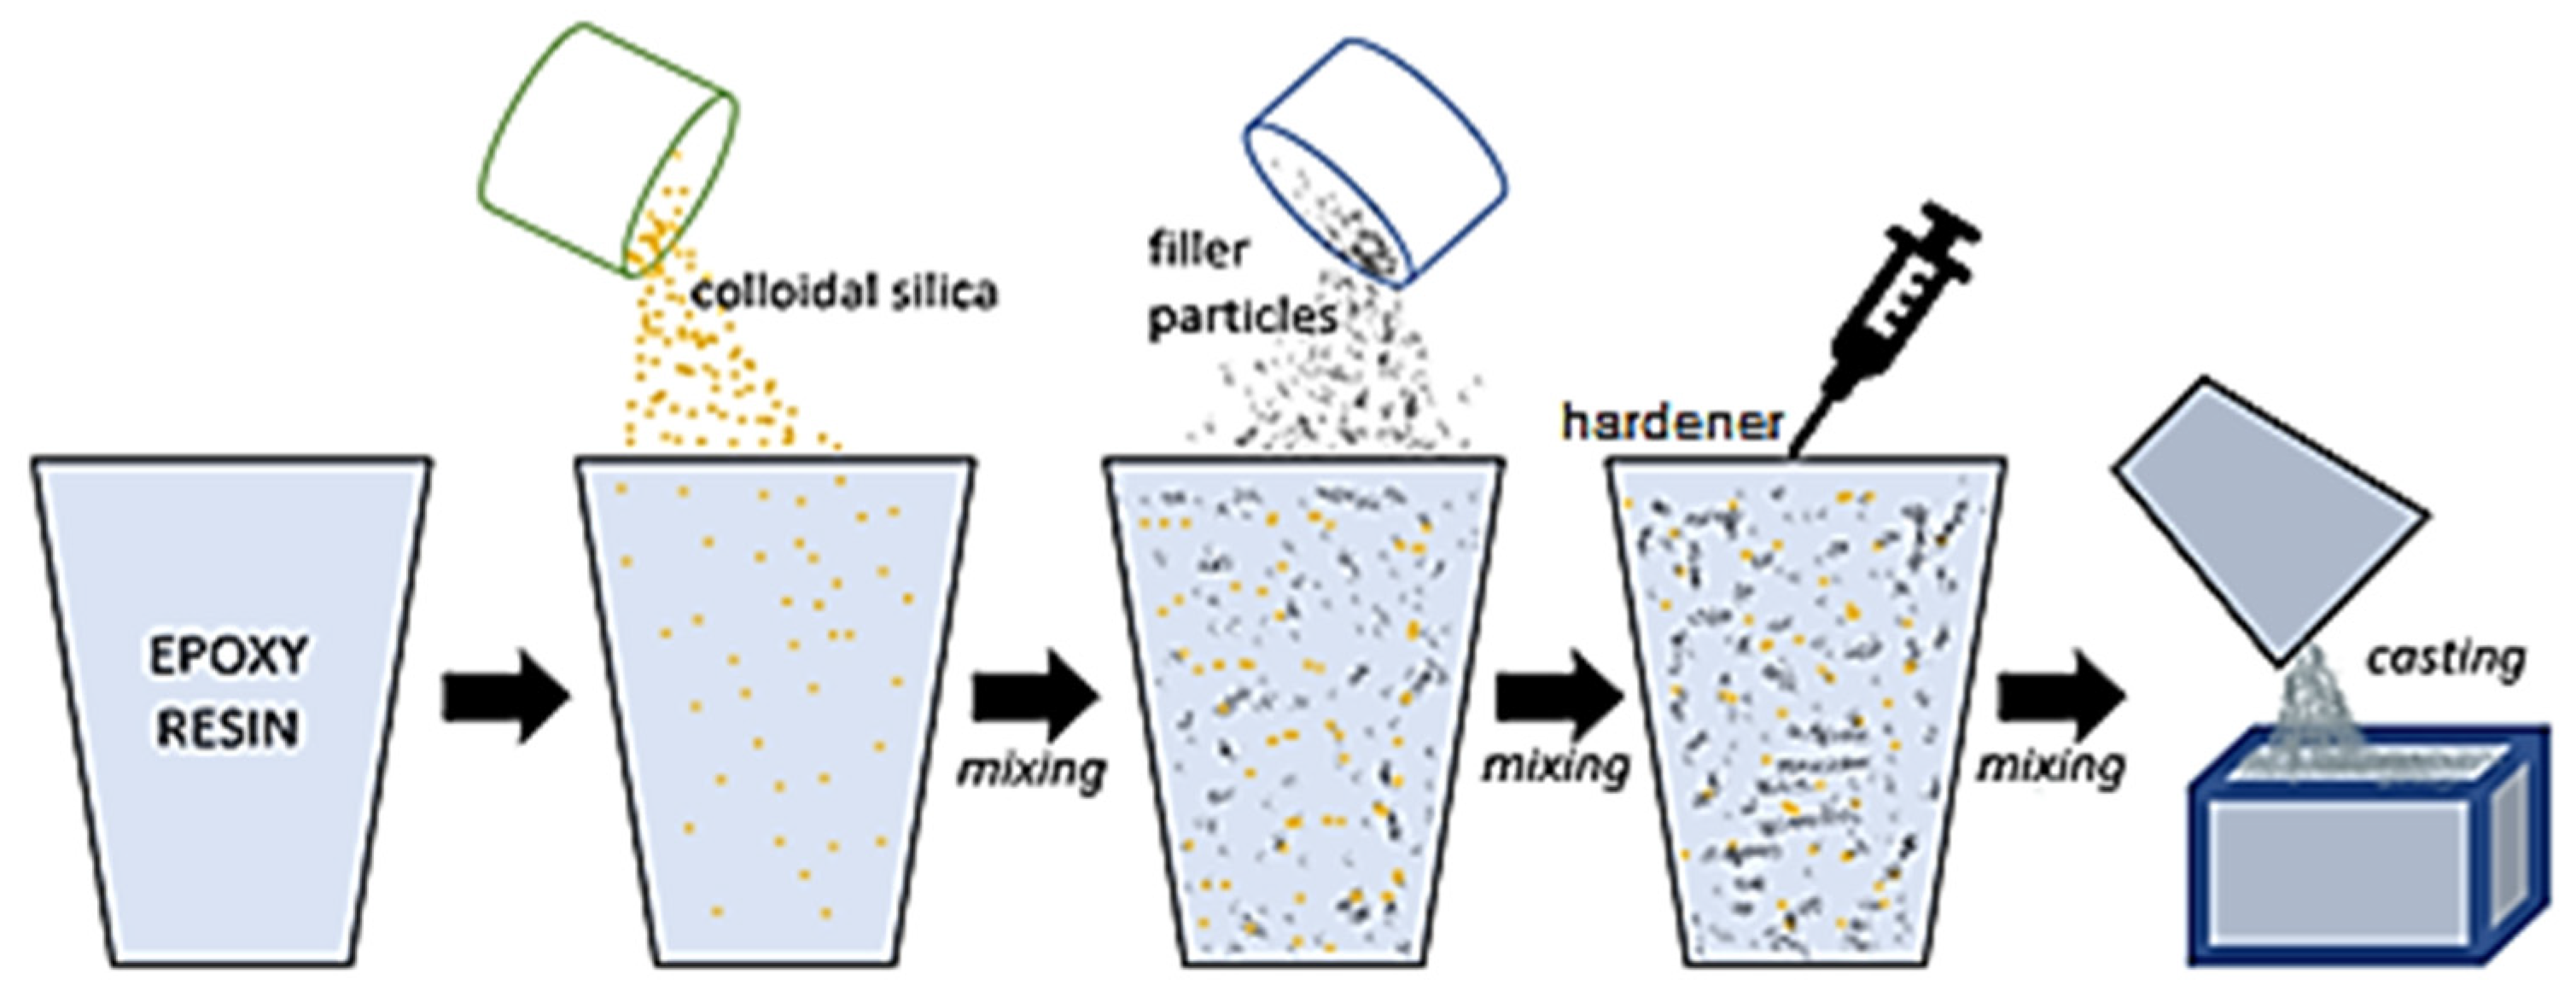
2. Materials and Methods
3. Results
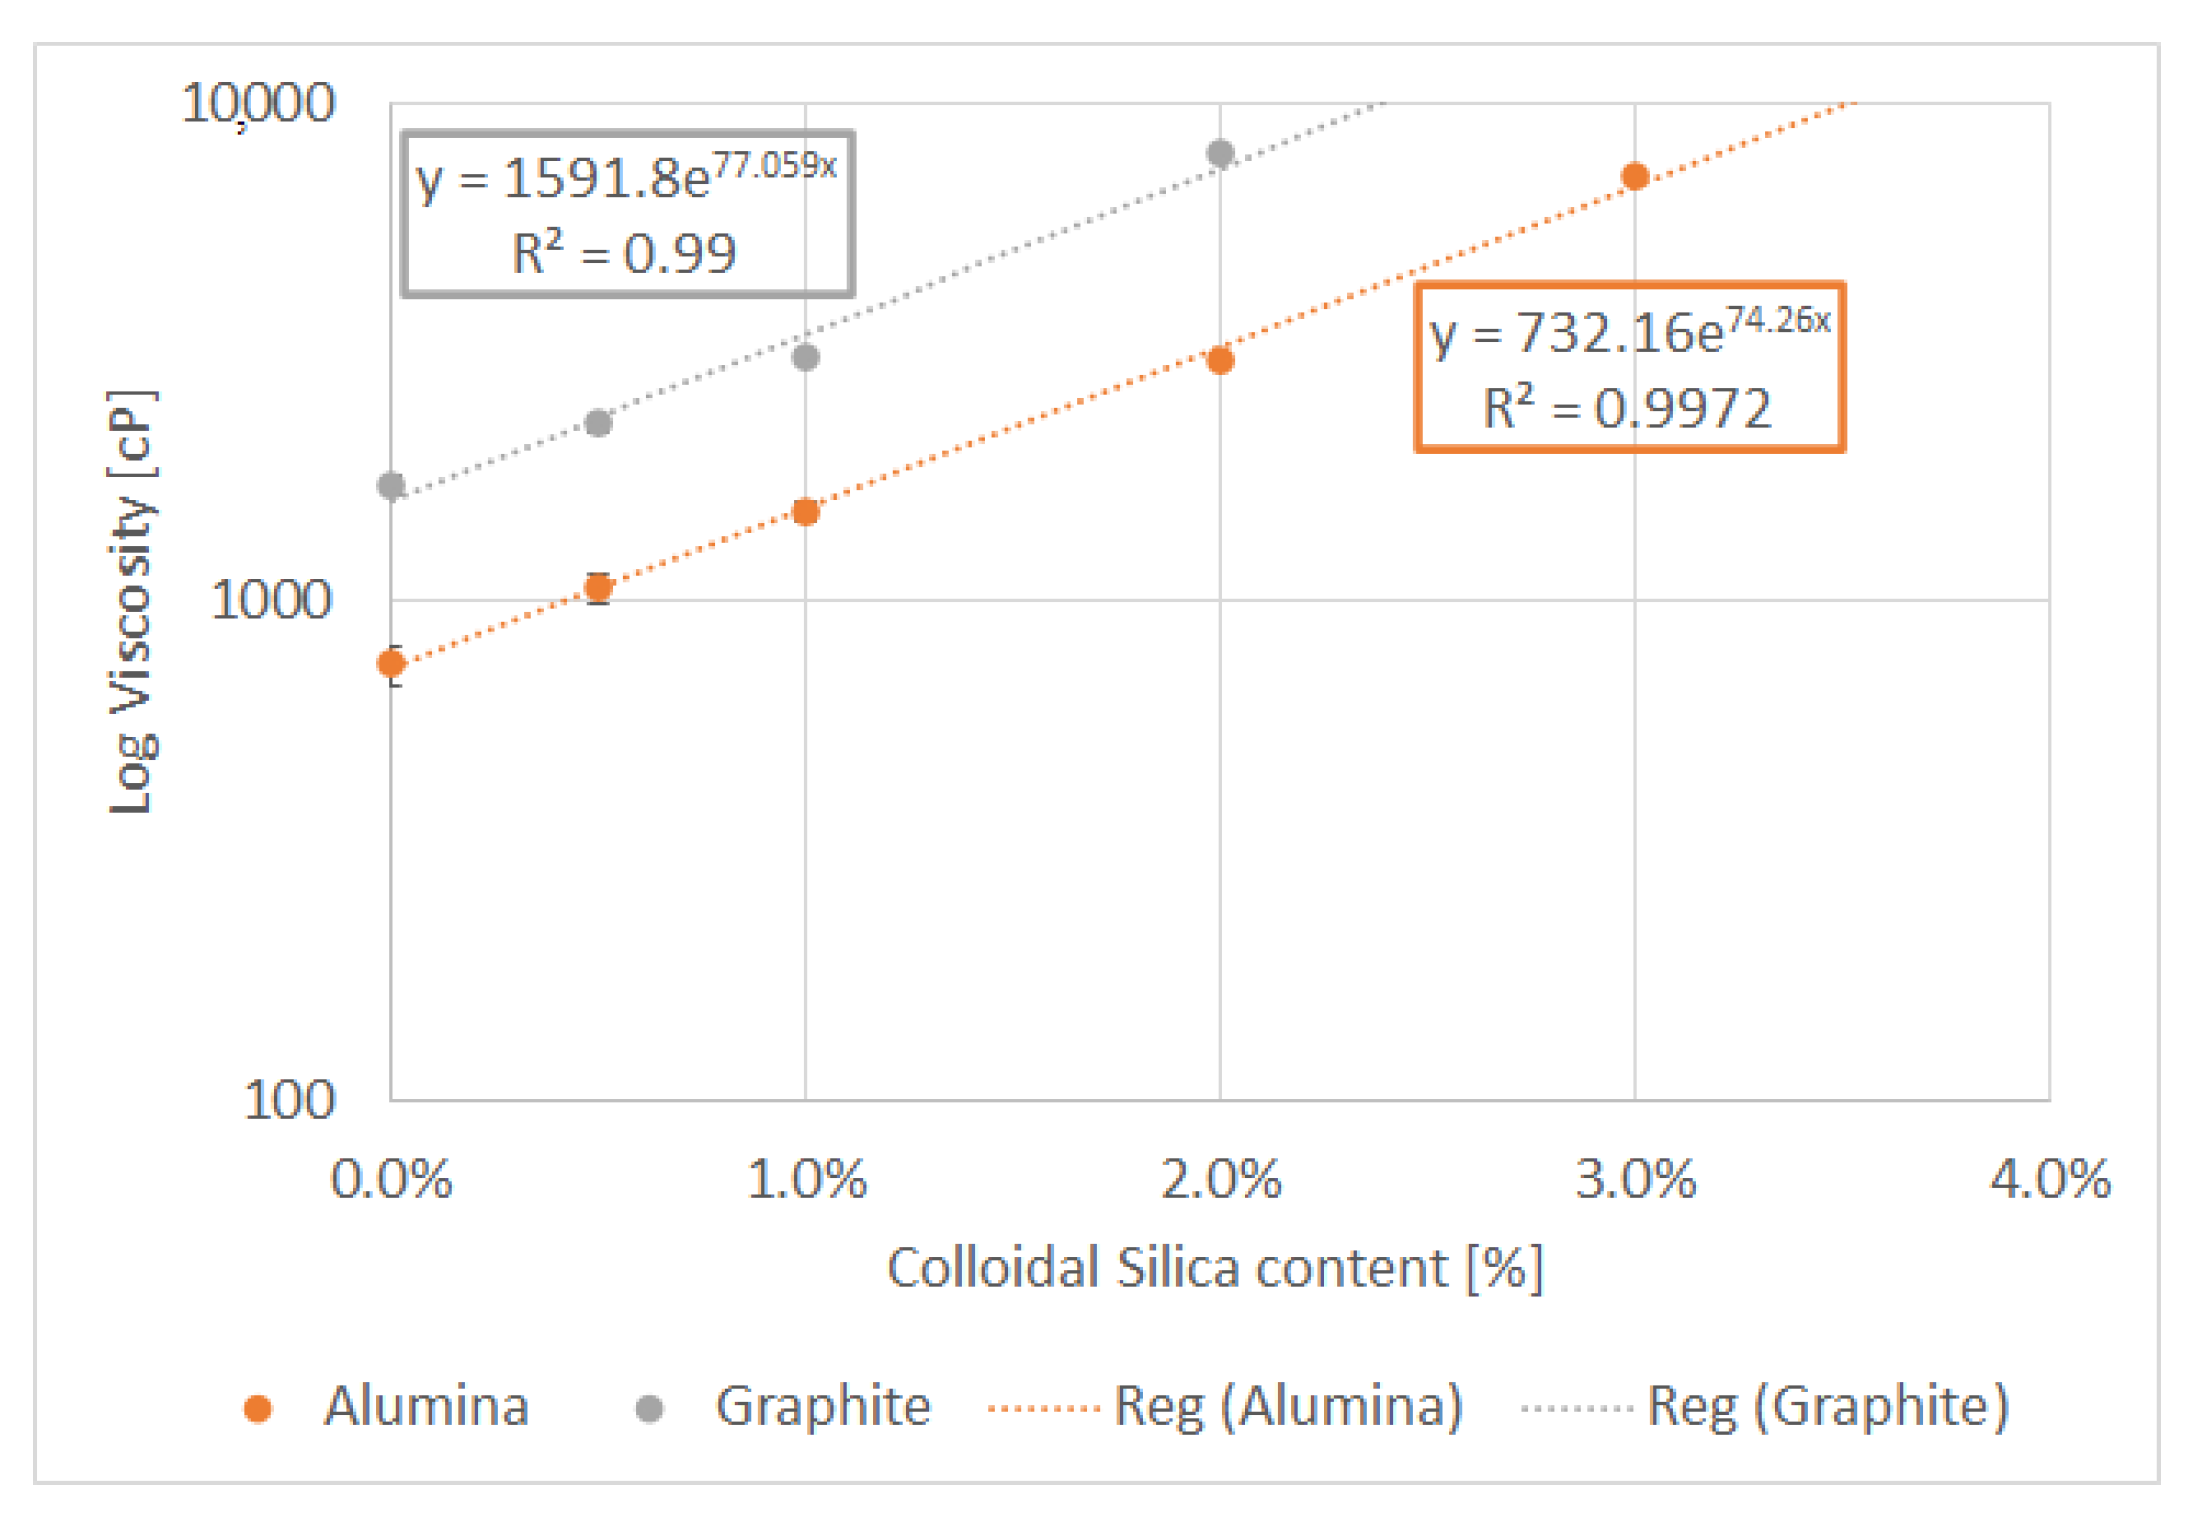
3.1. Viscosity Measurements and Stokes’ Law Formula
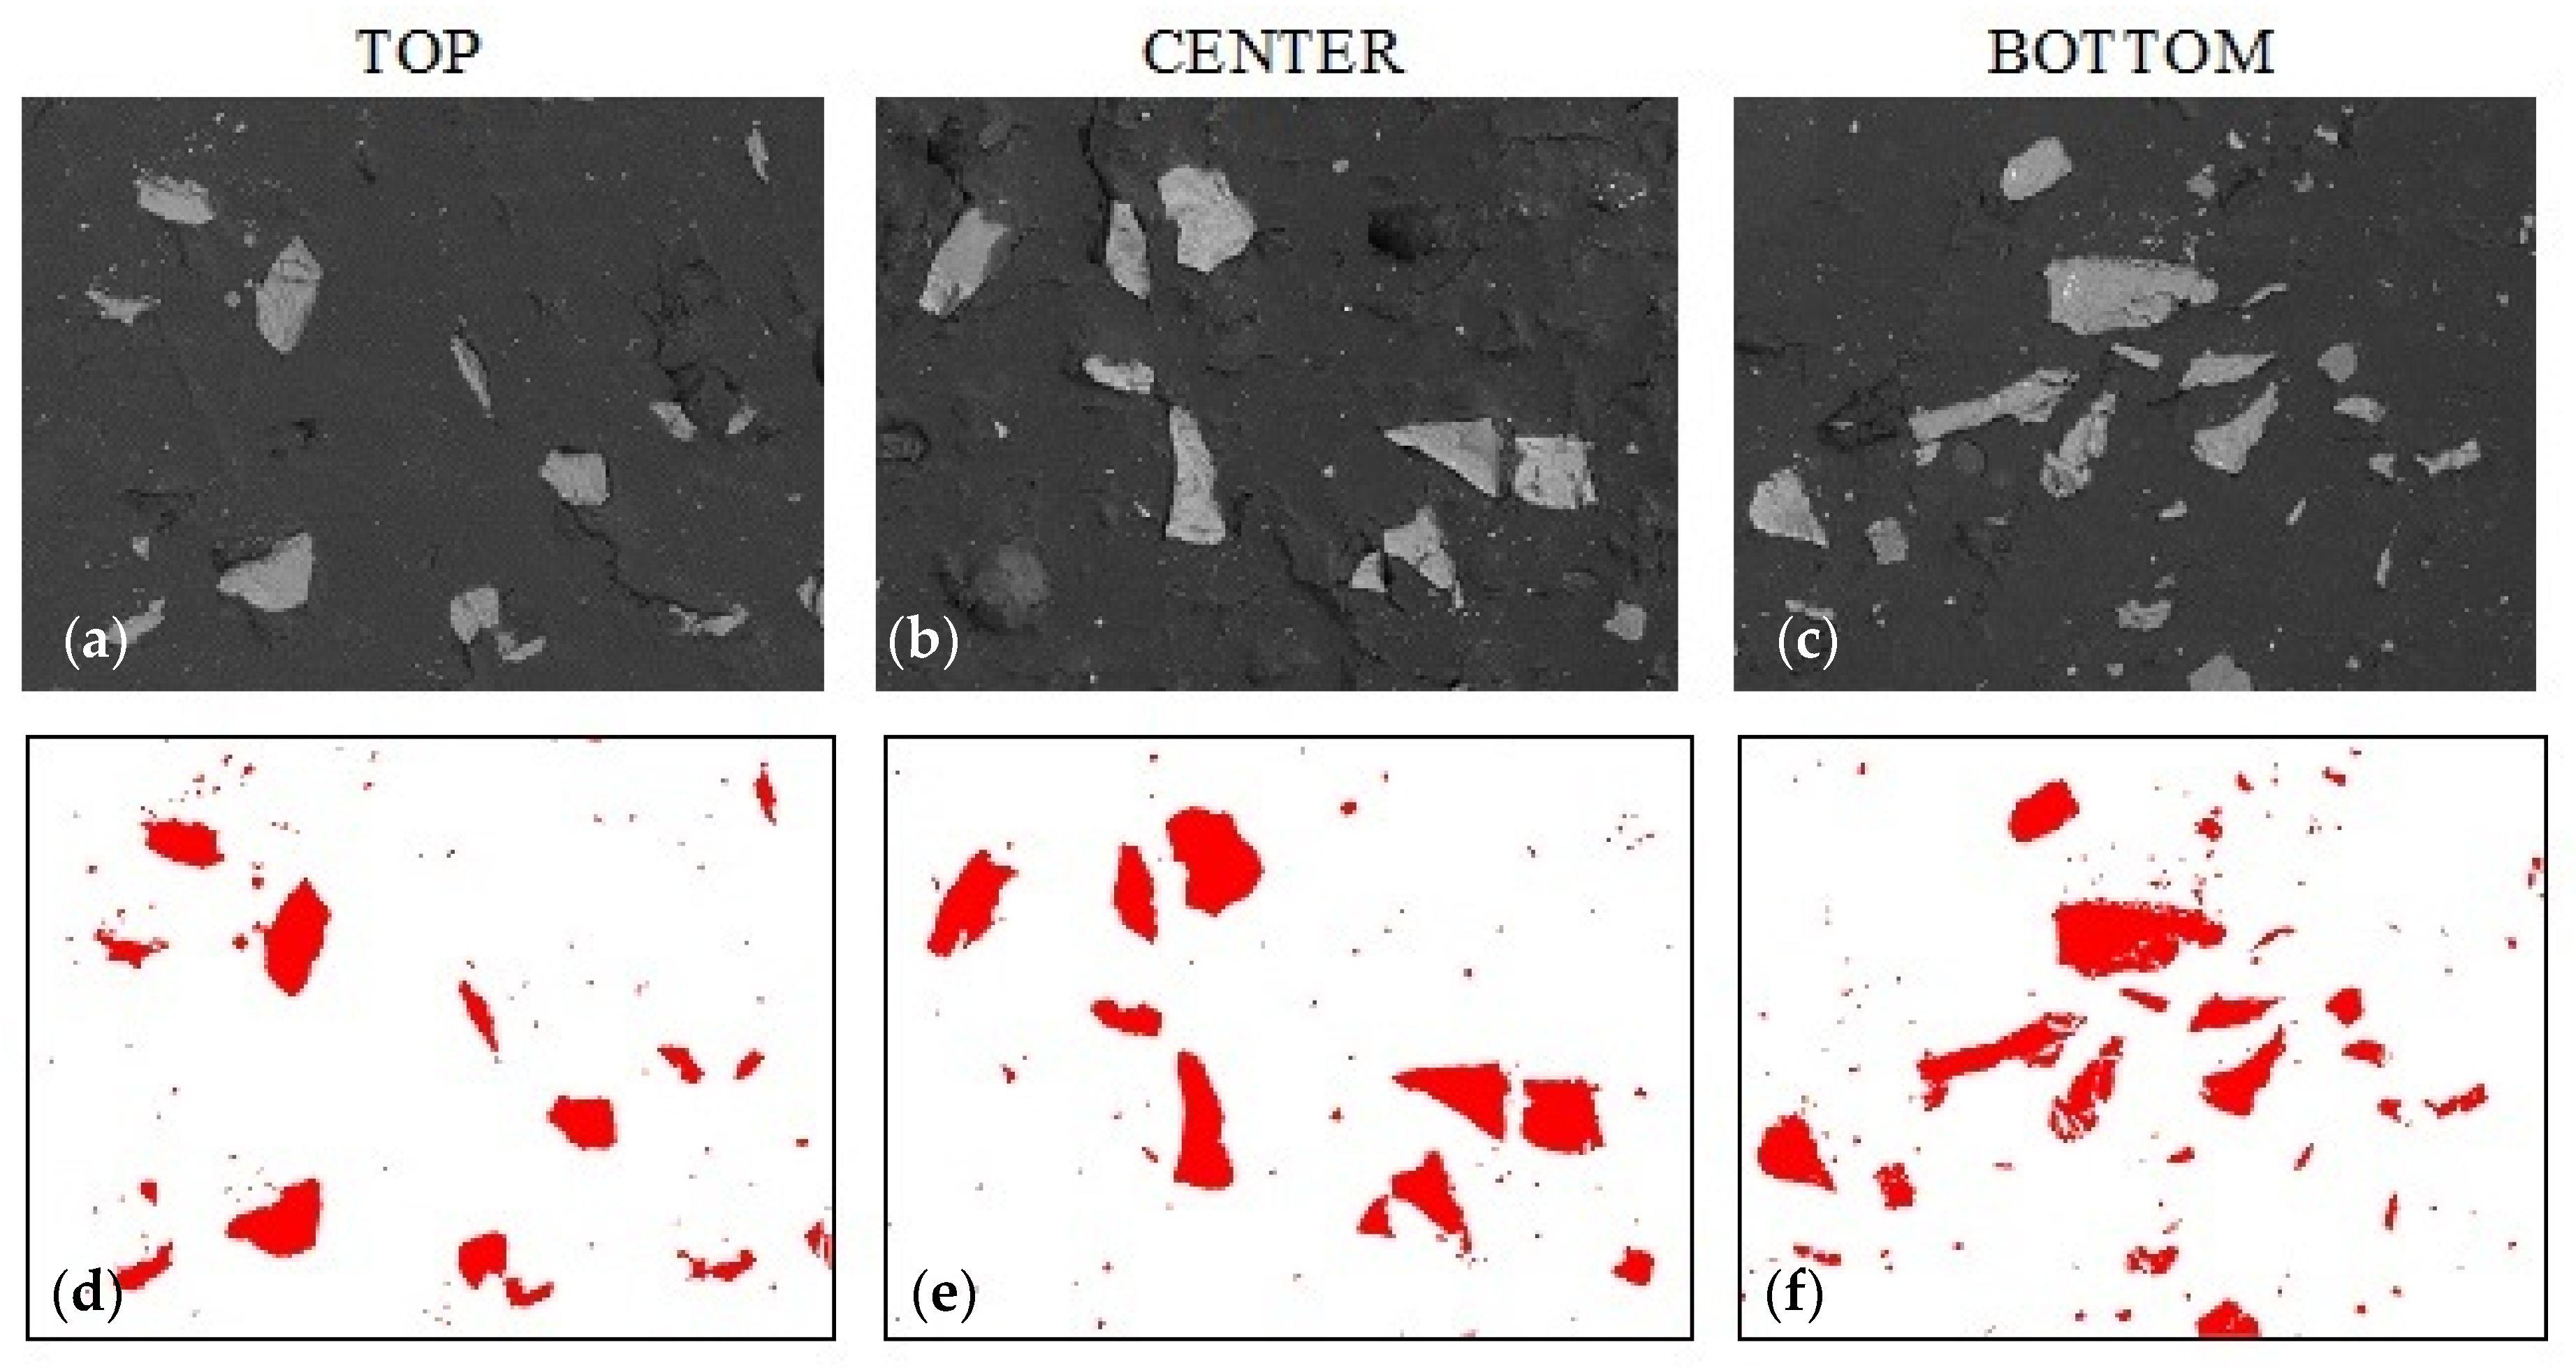
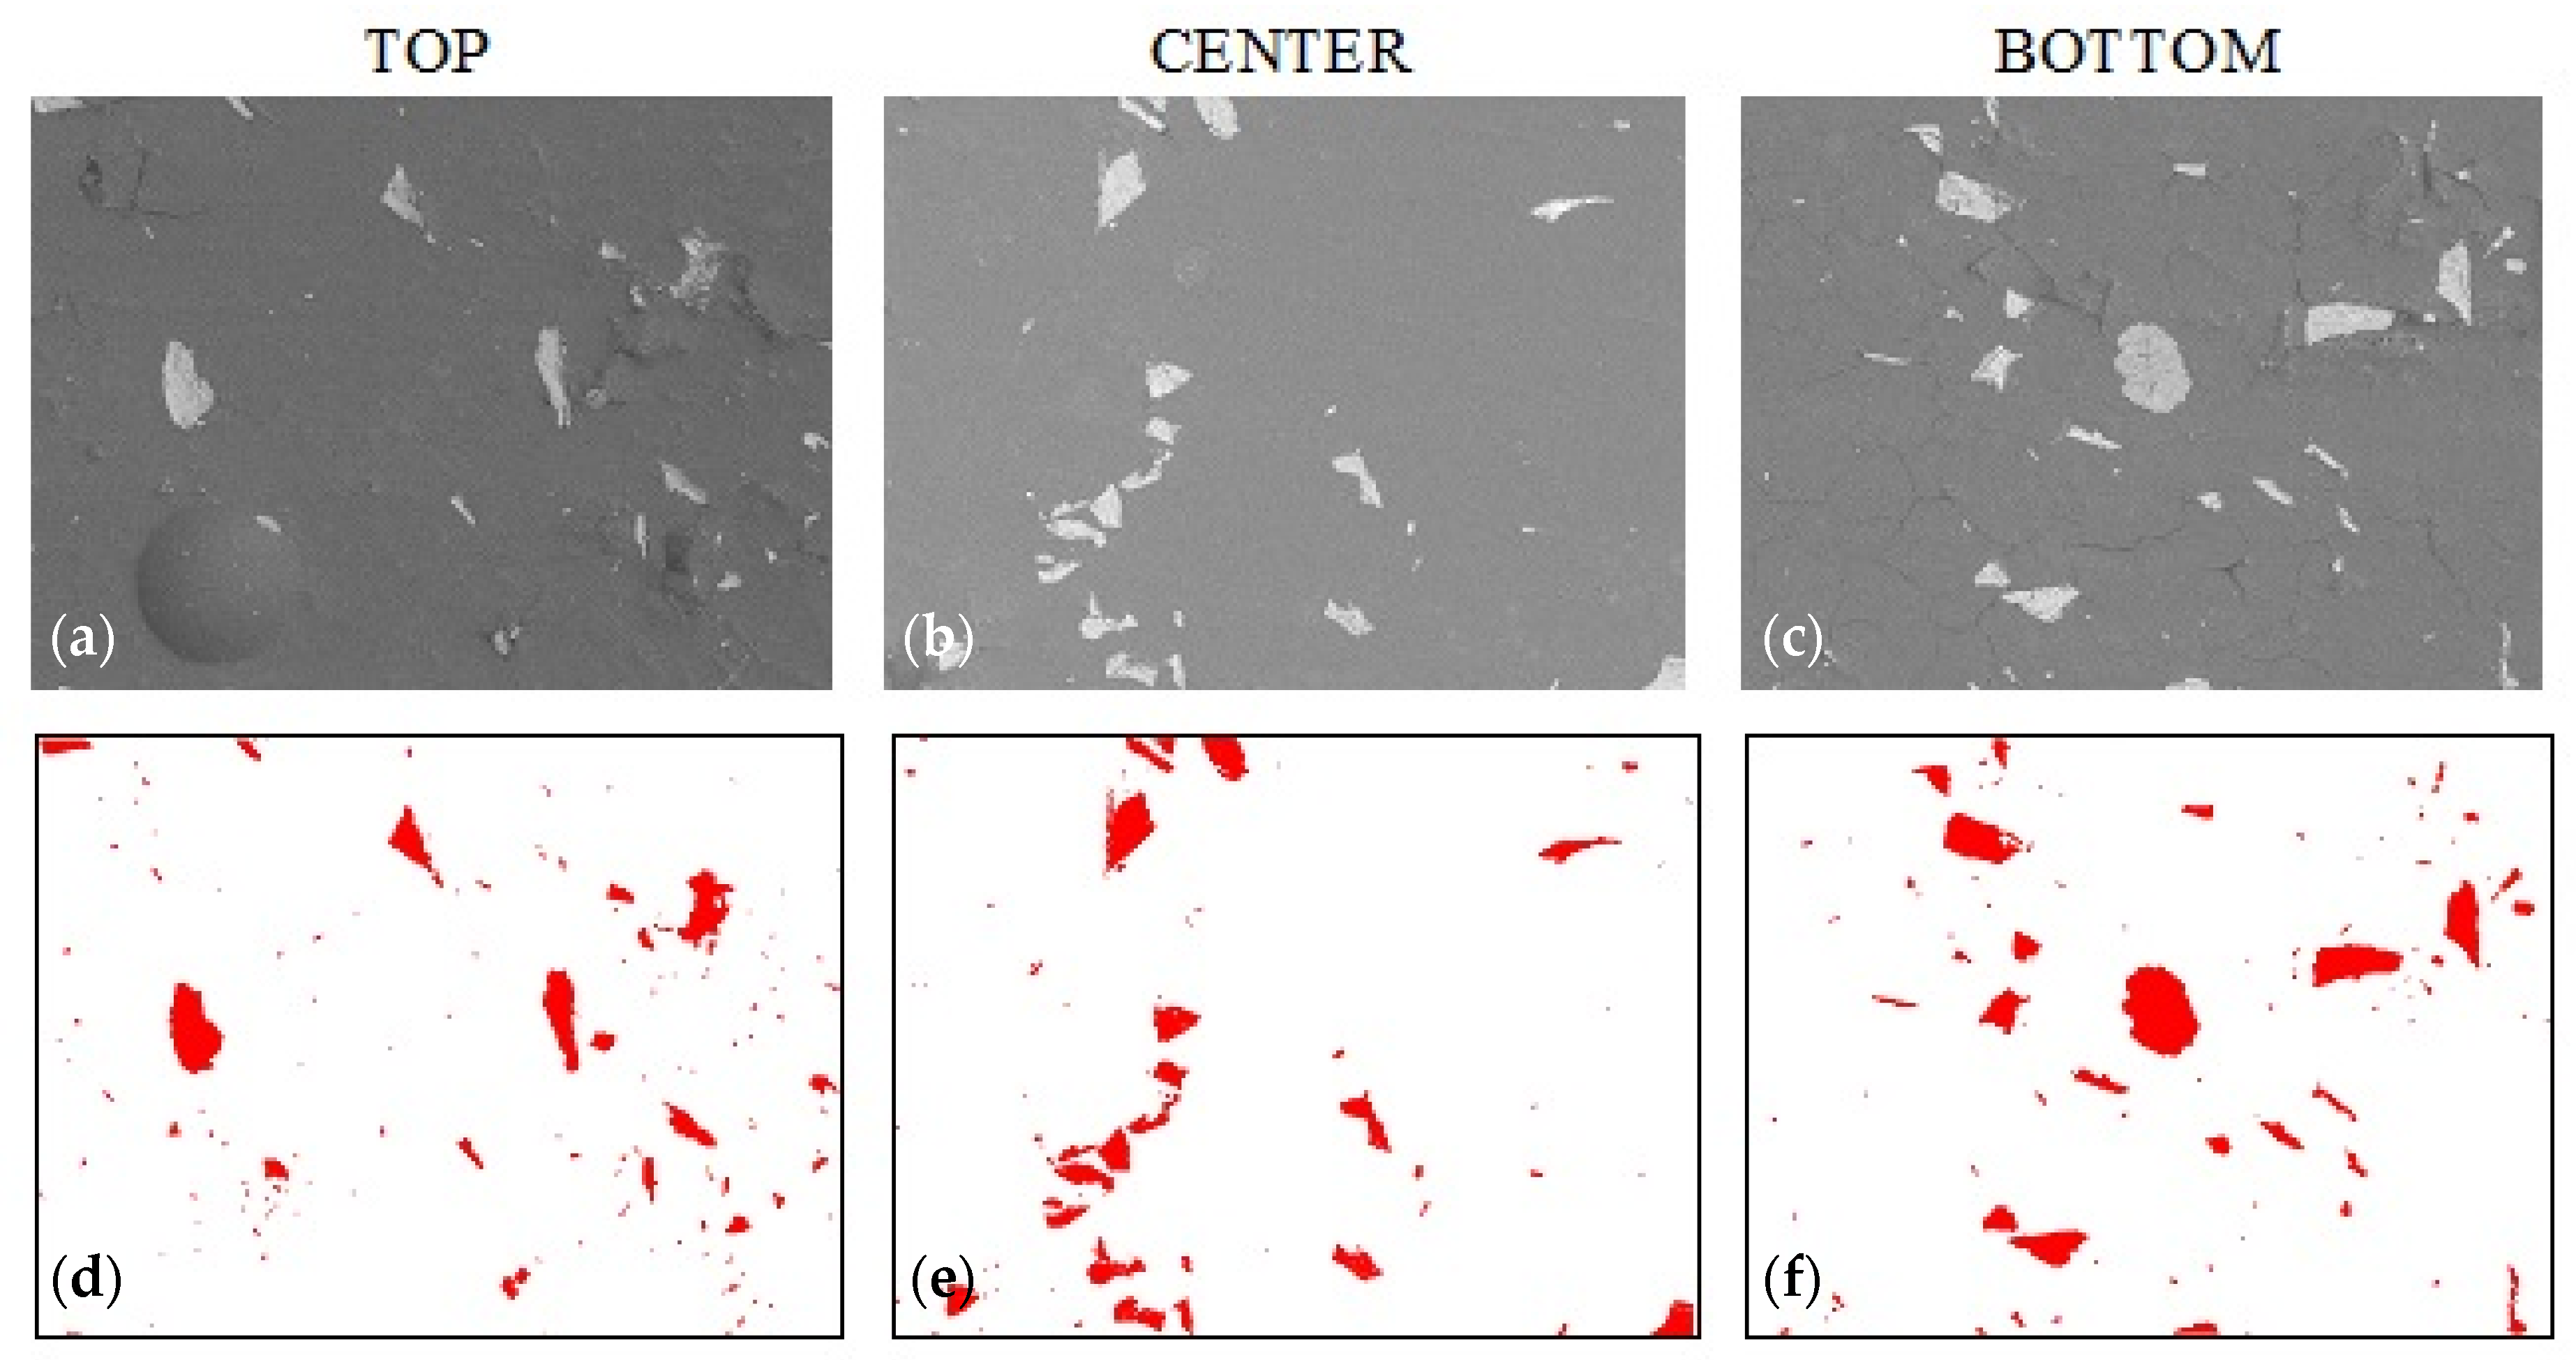
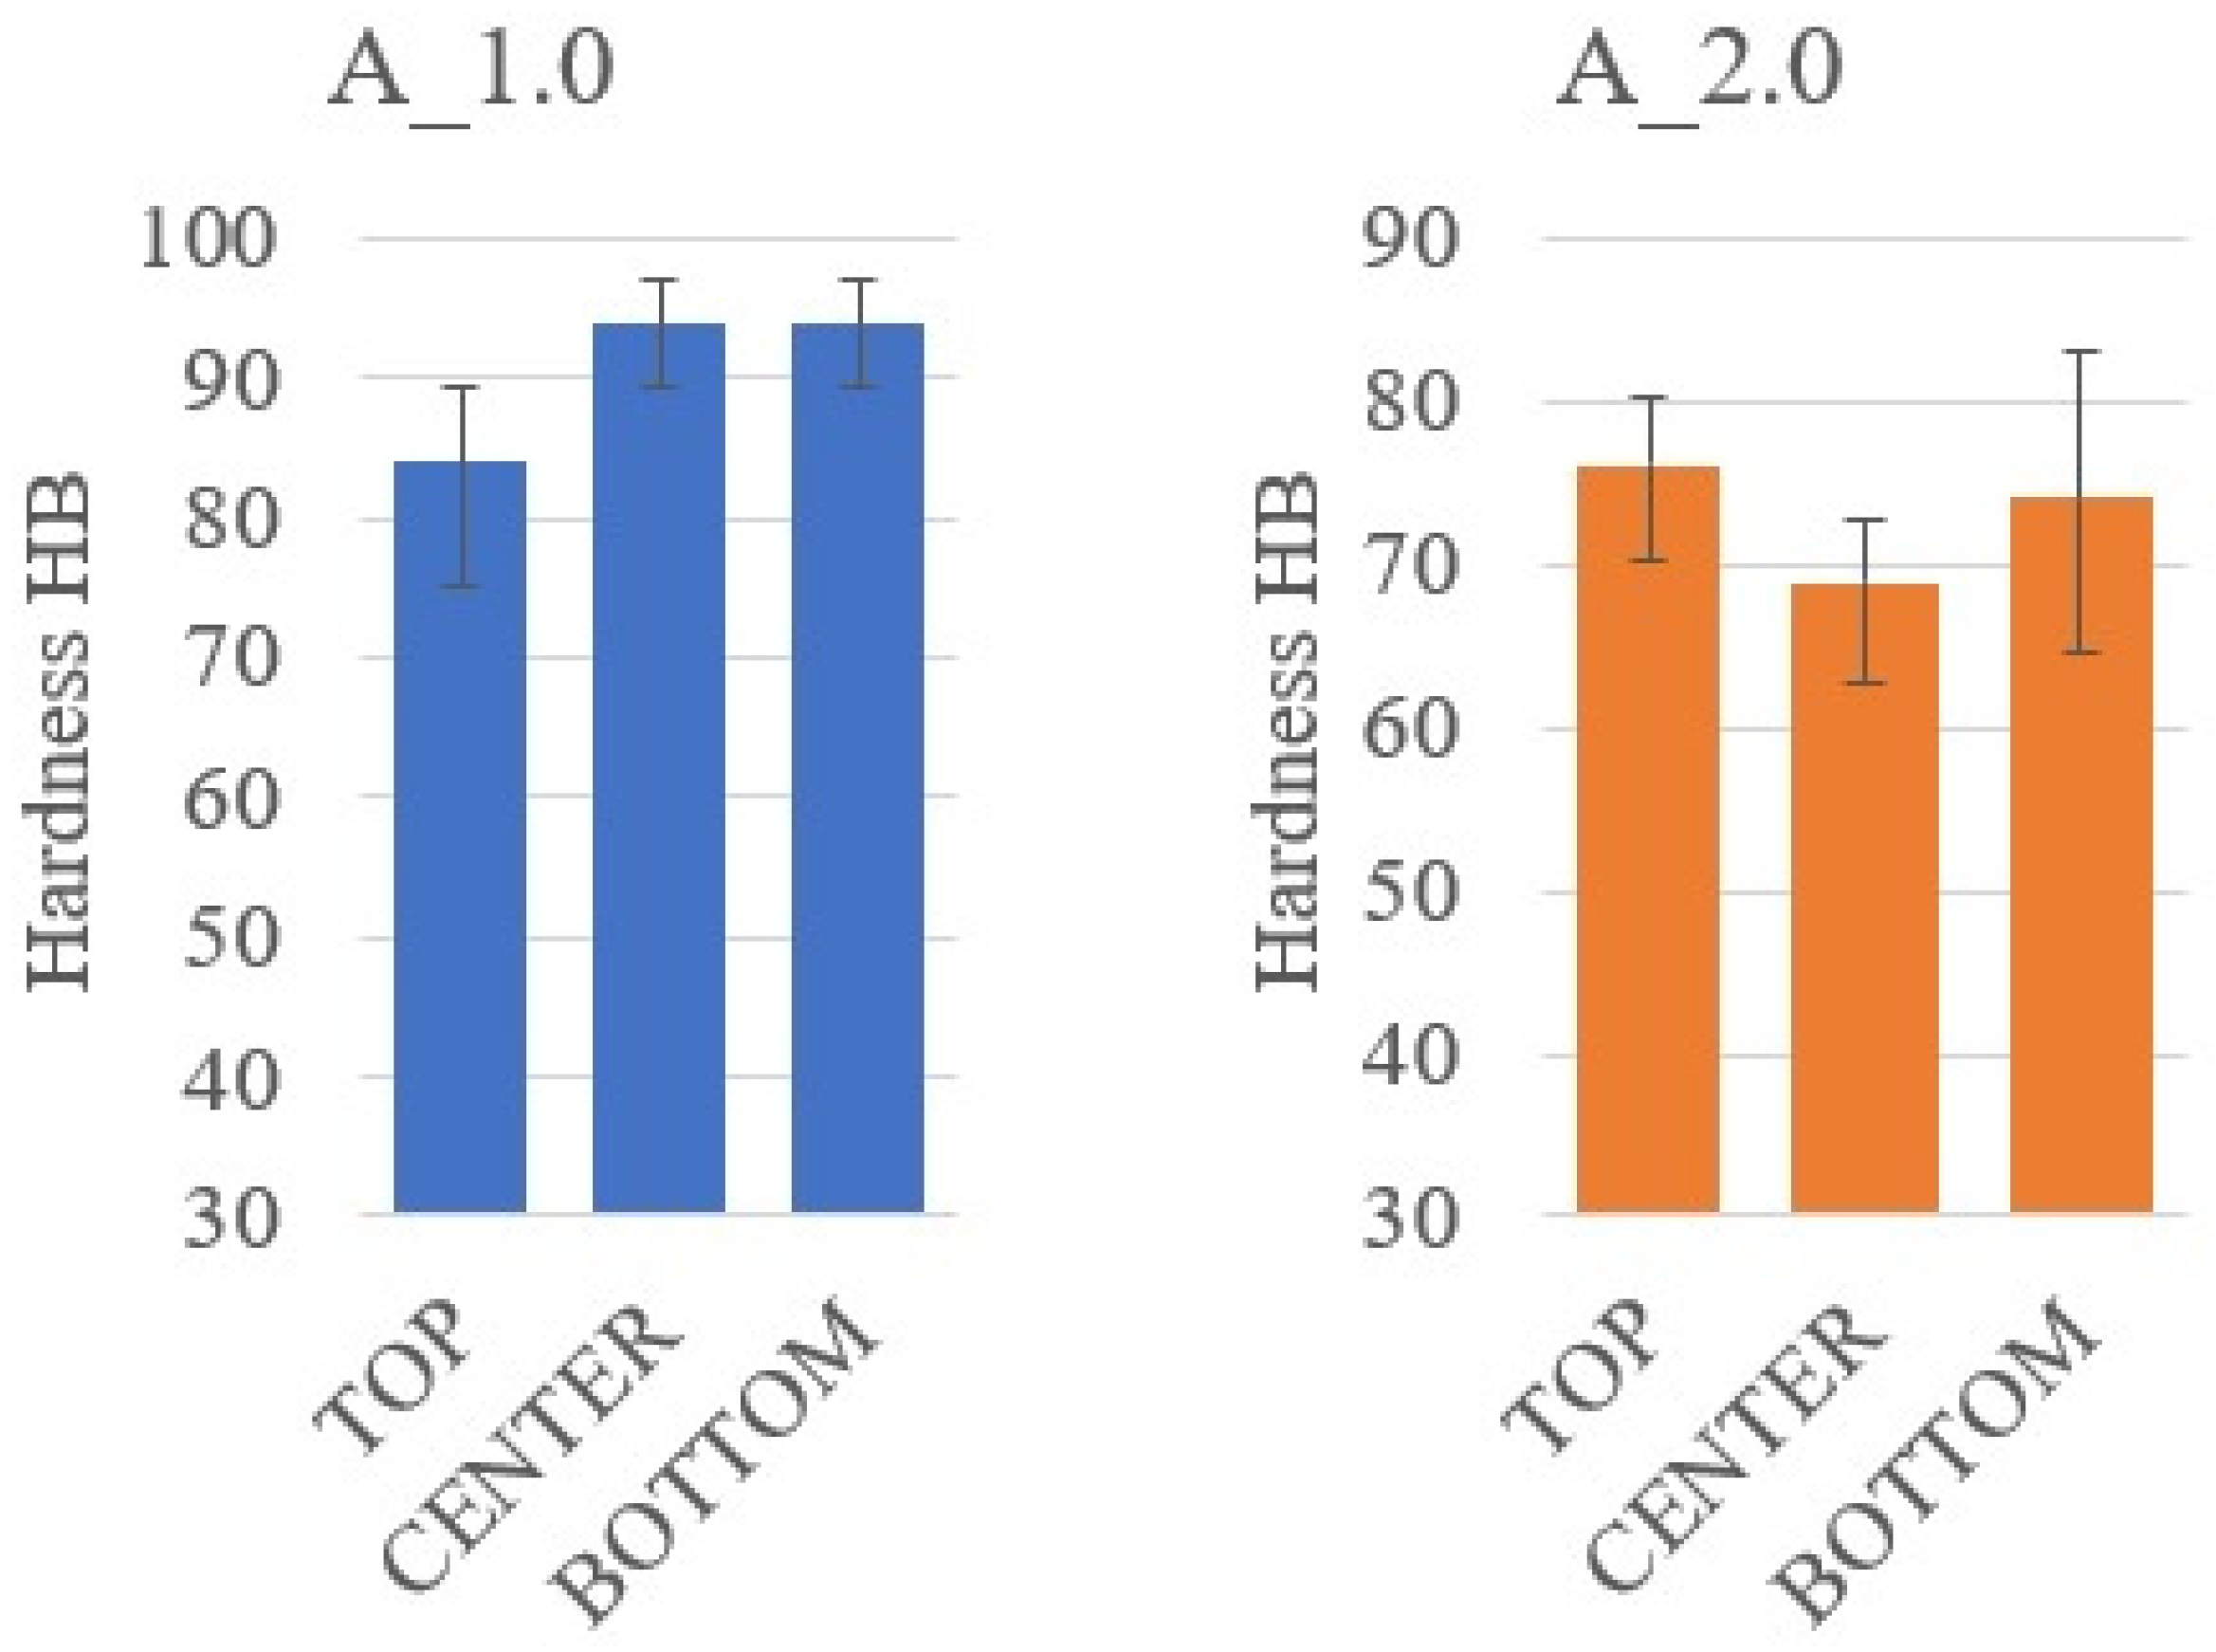
3.2. Sedimentation in Composites with Alumina
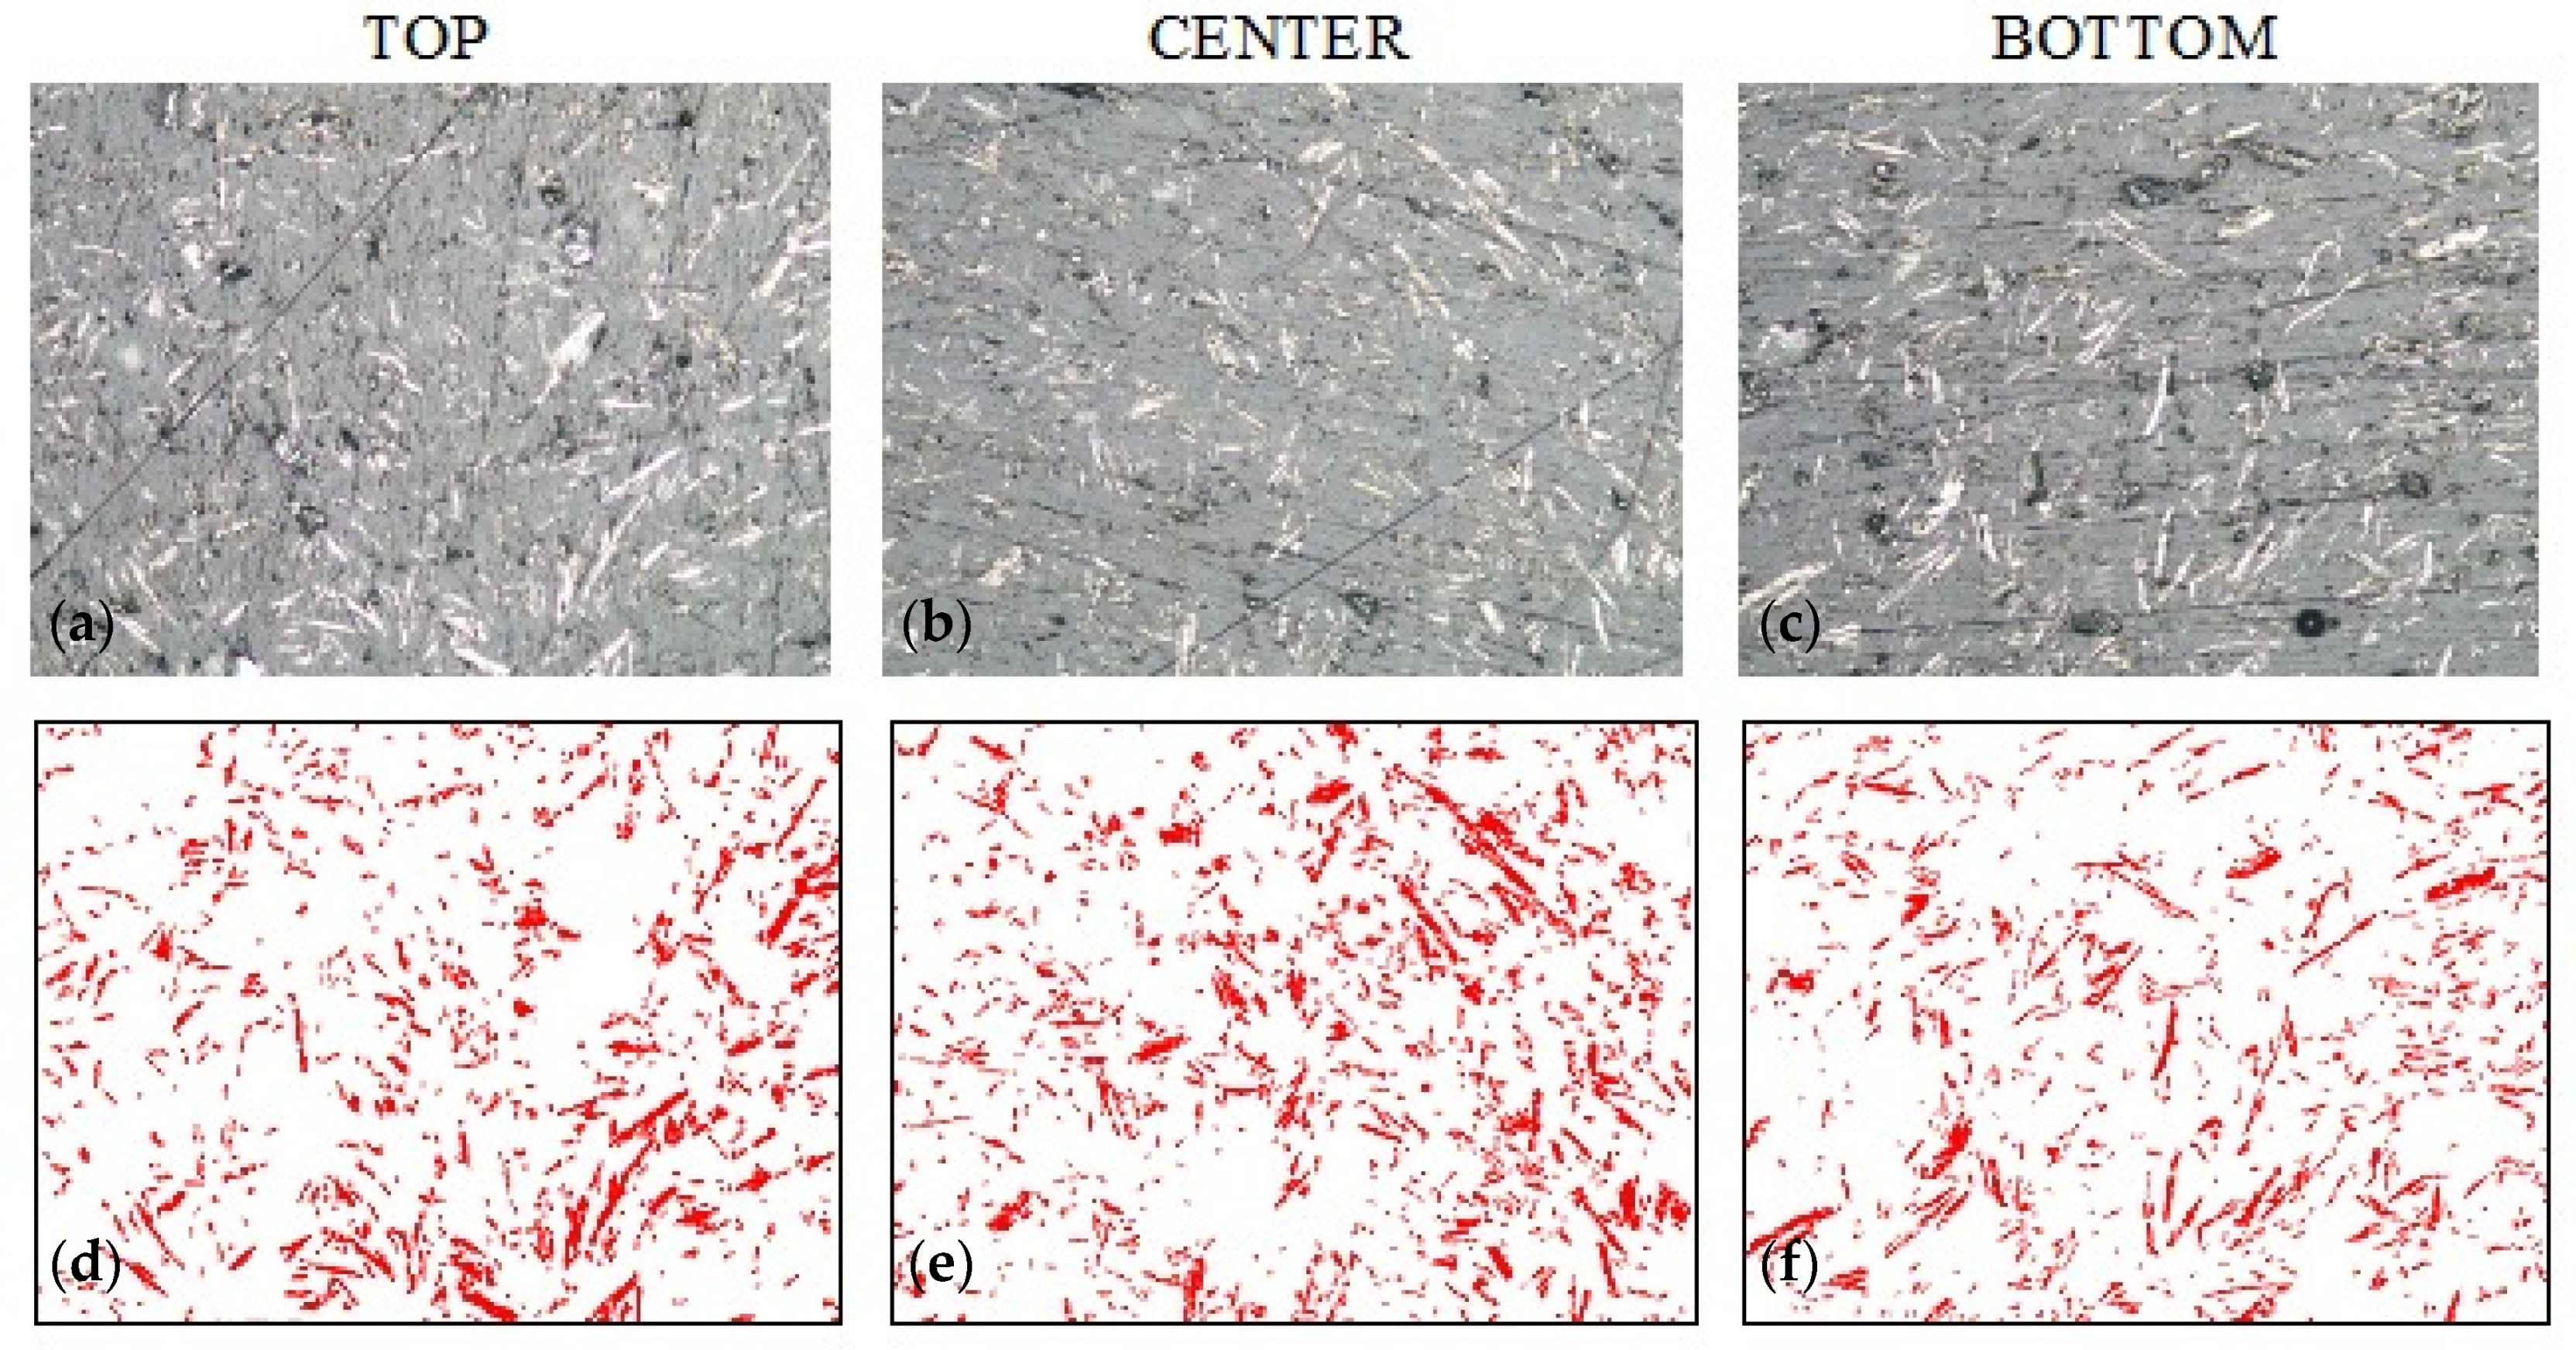
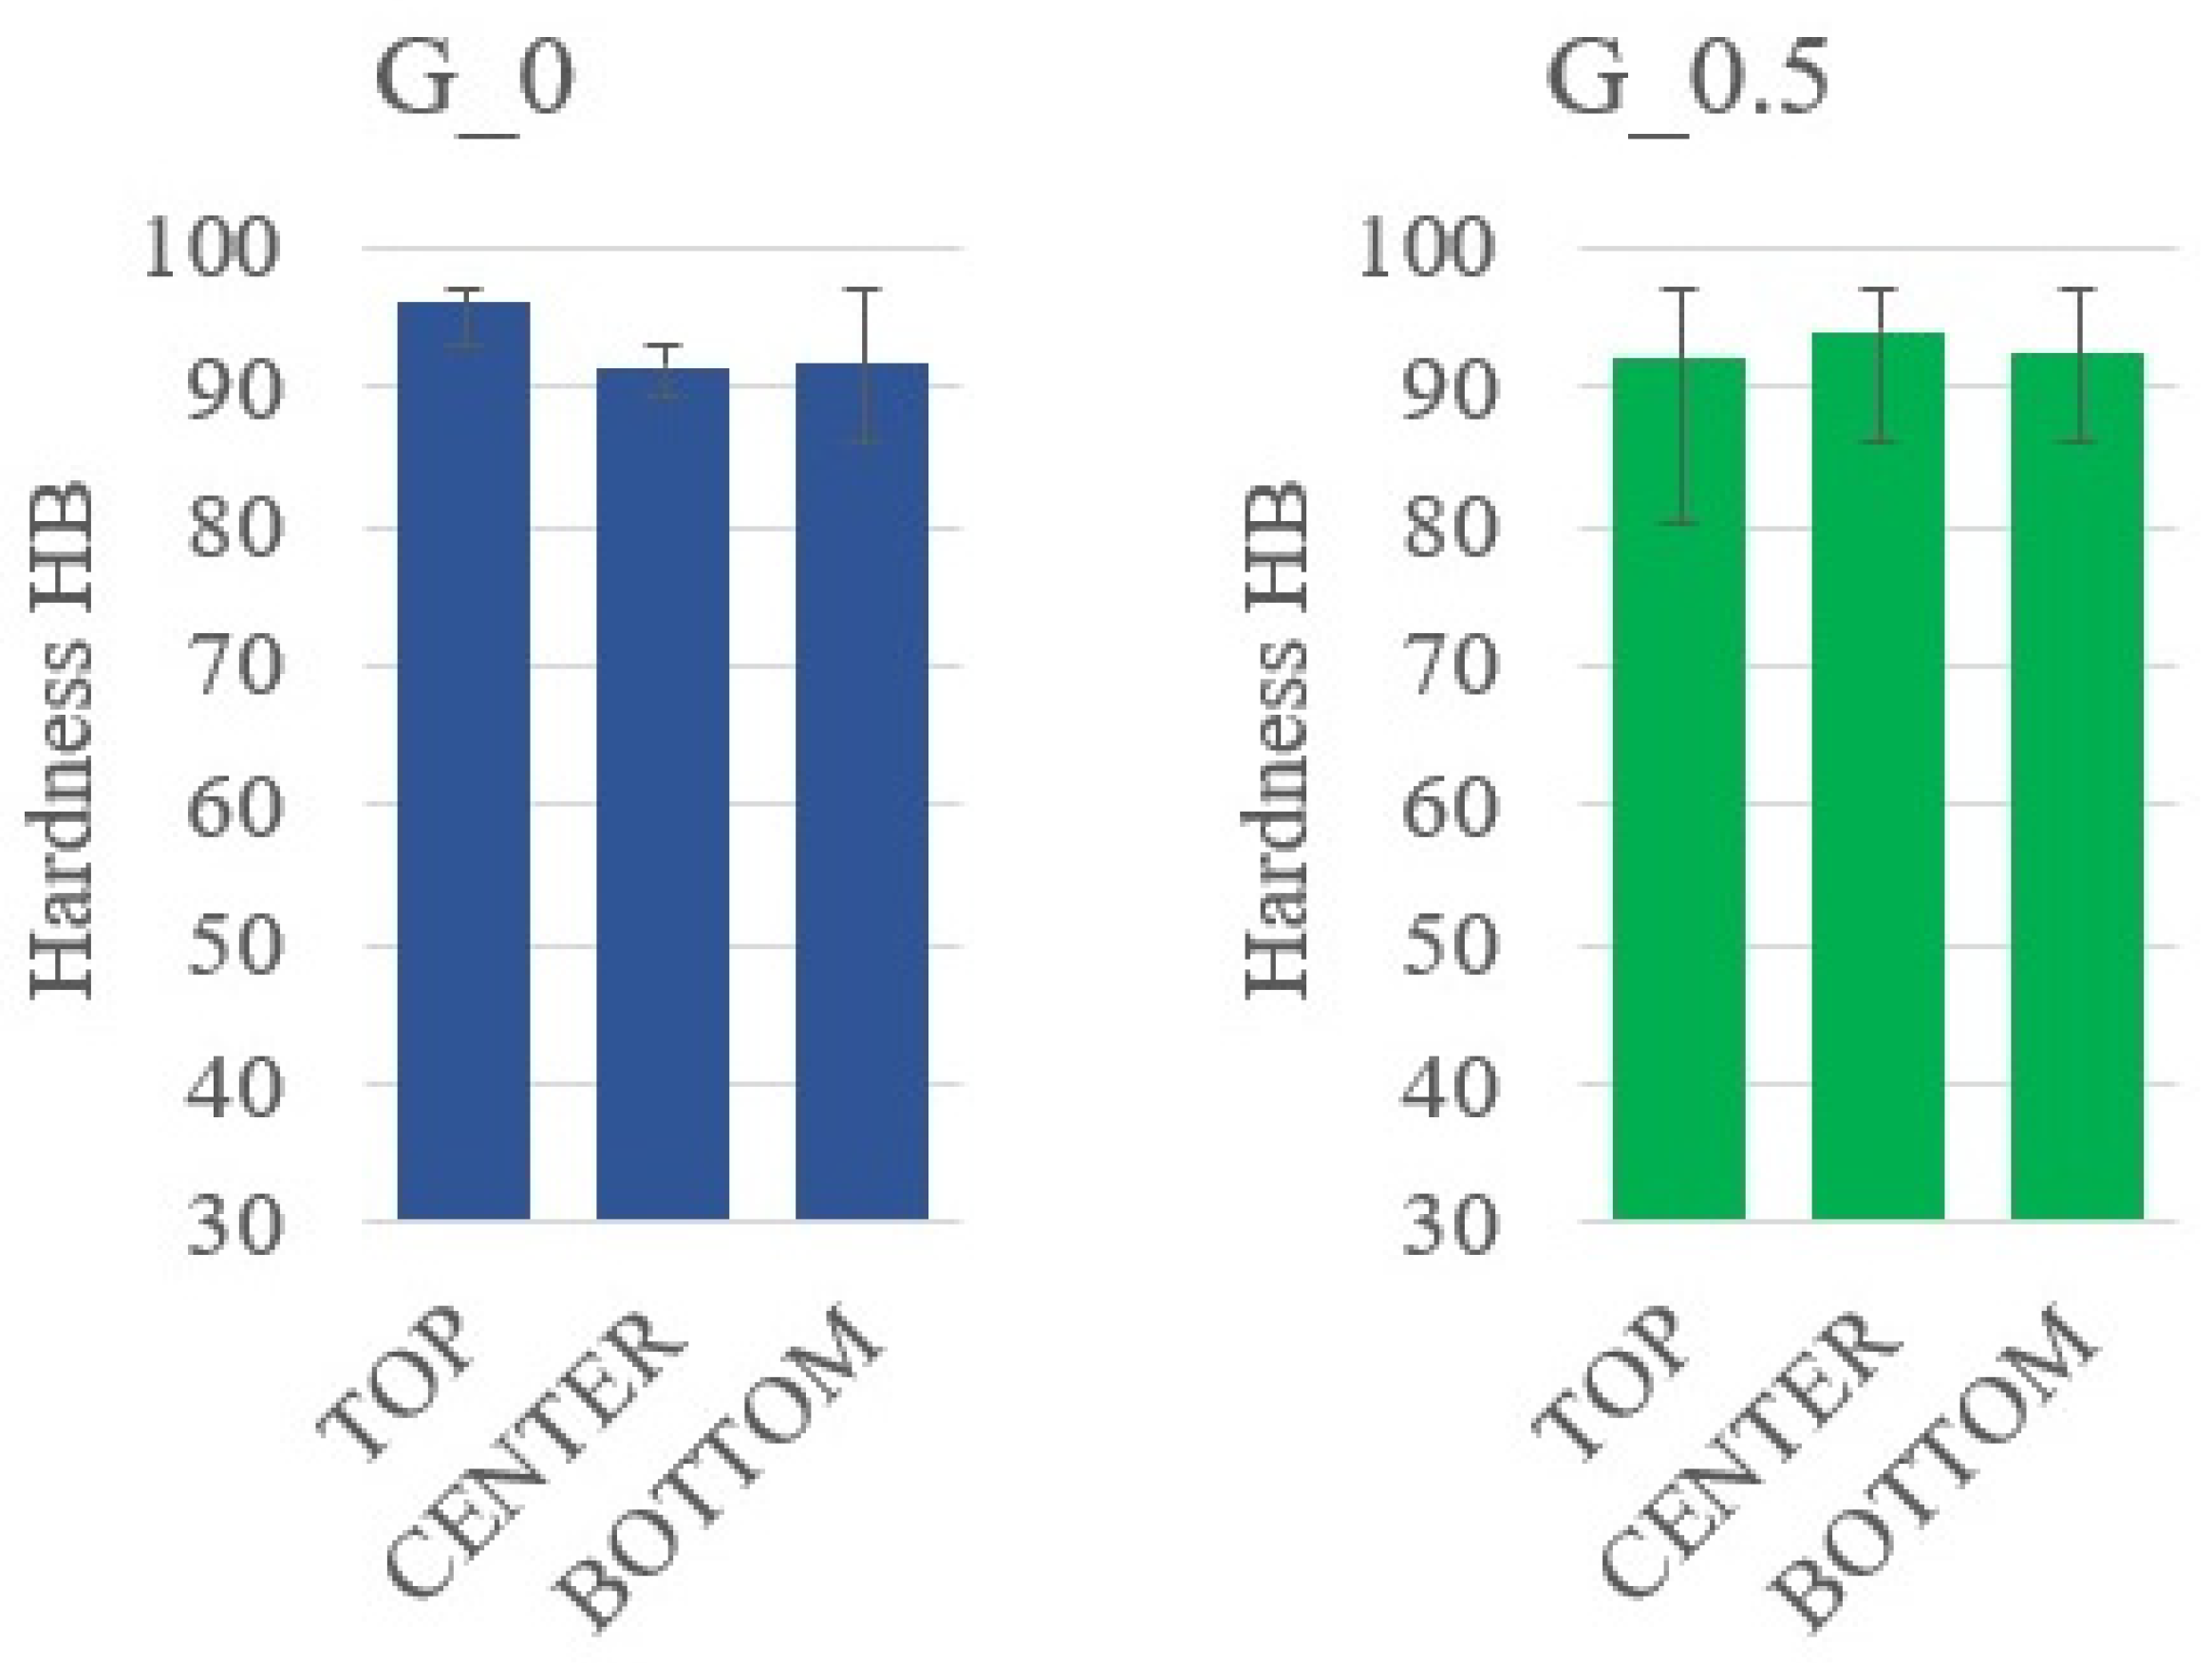
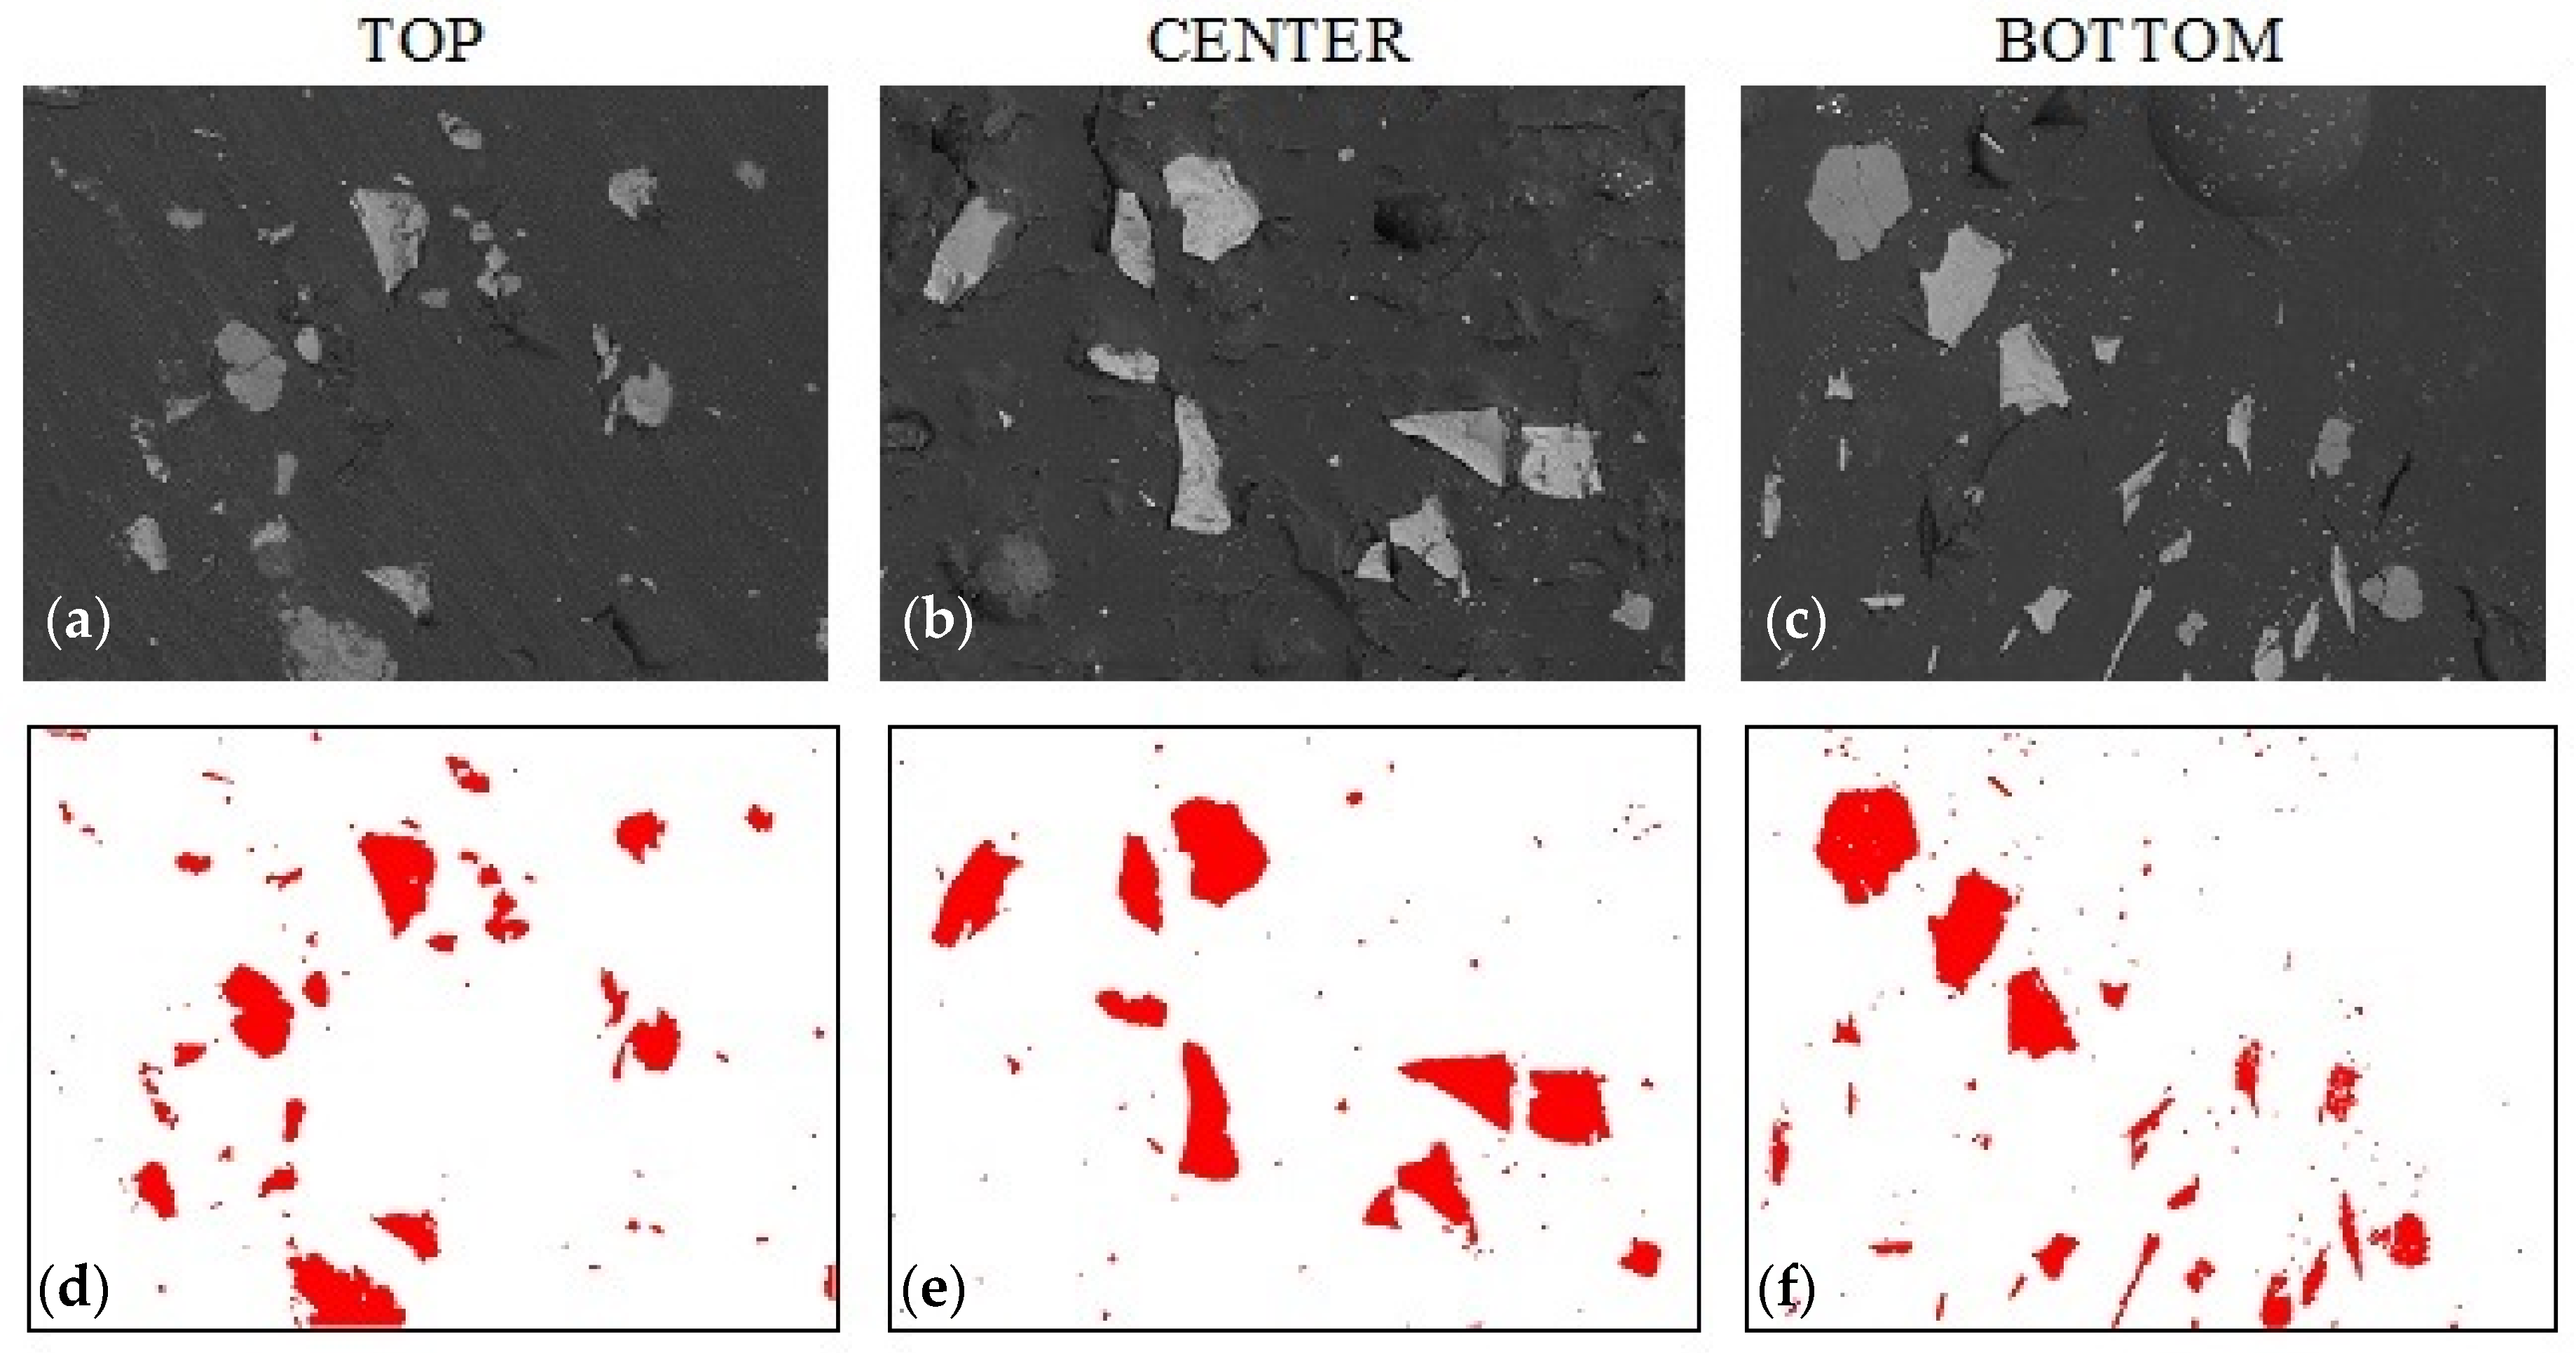
3.3. Sedimentation in Composites with Graphite
3.4. Stoke’s Formula Modification
3.5. Model Verification
4. Conclusions
- The sedimentation process has a different nature when different fillers are applied. Various changes in resin viscosity occur as a result of powder density, morphology, size and hydrophobicity. Thus, different amounts of silica content should be applied depending on used powder characteristics. Additionally, the gelation and curing process may affect the sedimentation distance of the filler.
- The proposed mathematical model based on Stokes’ law allows the optimization of the colloidal silica addition to resin. Such an approach leads to an inhibited sedimentation process. Moreover, that model can be easily modified and applied for various fillers.
- To obtain more precise values, variables should be considered as functions, i.e., tgel in relation to filler content, sample size, and ambient temperature.
- The proposed evaluation methodology, consisting of hardness measurements and quantitative metallography, gives well-correlated results; thus, it can be simplified to only hardness measurements. That improvement allows us to strongly shorten evaluation time and might be applied in cast polymer design and production, due to the simplicity of the measurement procedure and easy interpretation of results.
Author Contributions
Funding
Institutional Review Board Statement
Informed Consent Statement
Data Availability Statement
Conflicts of Interest
References
- Jayalakshmi, C.G.; Inamdar, A.; Anand, A.; Kandasubramanian, B. Polymer matrix composites as broadband radar absorbing structures for stealth aircrafts. J. Appl. Polym. Sci. 2018, 136, 47241. [Google Scholar] [CrossRef] [Green Version]
- Królikowski, W. Polimerowe Kompozyty Konstrukcyjne, 1st ed.; Wydawnictwo Naukowe PWN: Warsaw, Poland, 2017; ISBN 9788301168810. [Google Scholar]
- Wang, R.; Zheng, S.; Zheng, Y. Polymer Matrix Composites and Technology; Woodhead Pub.; Science Press: Oxford, UK; Philadelphia, PA, USA; Beijing, China, 2011. [Google Scholar]
- Matsui, J. Polymer matrix composites (PMC) in aerospace. Adv. Compos. Mater. 1995, 4, 197–208. [Google Scholar] [CrossRef]
- Sharma, S.; Sudhakara, P.; Misra, S.K.; Singh, J. A comprehensive review of current developments on the waste-reinforced polymer-matrix composites for automotive, sports goods and construction applications: Materials, processes and properties. Mater. Today Proc. 2020, 33, 1671–1679. [Google Scholar] [CrossRef]
- Çakmakkaya, M.; Kunt, M.; Terzi, O. Investigation of polymer matrix composites in automotive consoles. Int. J. Automot. Sci. Technol. 2019, 3, 51–56. [Google Scholar] [CrossRef]
- Sunder Selwyn, T. Formation, characterization and suitability analysis of polymer matrix composite materials for automotive bumper. Mater. Today Proc. 2021, 43, 1197–1203. [Google Scholar] [CrossRef]
- Murray, R.E.; Beach, R.; Barnes, D.; Snowberg, D.; Berry, D.; Rooney, S.; Jenks, M.; Gage, B.; Boro, T.; Wallen, S.; et al. Structural validation of a thermoplastic composite wind turbine blade with comparison to a thermoset composite blade. Renew. Energy 2021, 164, 1100–1107. [Google Scholar] [CrossRef]
- Shahinoor, A.; Chowdhury, M.A. Micromechanical analysis of glass fiber reinforced epoxy composites and case study of macro-mechanical observation. Compos. Theory Pract. 2020, 20, 23–34. [Google Scholar]
- Myalski, J. Determination of conditions of infiltration in infusion method of glass fibers laminates. Compos. Theory Pract. 2009, 9, 138–143. [Google Scholar]
- Safdari, M.; Al-Haik, M.S. Optimization of stress wave propagation in a multilayered elastic/viscoelastic hybrid composite based on carbon fibers/carbon nanotubes. Polym. Compos. 2012, 33, 196–206. [Google Scholar] [CrossRef]
- Reis, J. Fracture and flexural characterization of natural fiber-reinforced polymer concrete. Constr. Build. Mater. 2006, 20, 673–678. [Google Scholar] [CrossRef]
- Jo, B.-W.; Park, S.-K.; Park, J.-C. Mechanical properties of polymer concrete made with recycled PET and recycled concrete aggregates. Constr. Build. Mater. 2008, 22, 2281–2291. [Google Scholar] [CrossRef]
- Vipulanandan, C.; Dharmarajan, N. Flexural behavior of polyester polymer concrete. Cem. Concr. Res. 1987, 17, 219–230. [Google Scholar] [CrossRef]
- Yavana Rani, S.; Saleh Nusari, M.; bin Non, J.; Poddar, S.; Bhaumik, A. Durability of geopolymer concrete with addition of polypropylene fibre. Mater. Today Proc. 2021, (in press). [Google Scholar] [CrossRef]
- Blagojević, J.; Mijatović, B.; Kočović, D.; Stojanović, B.; Ivanović, L.; Gajević, S. A review to cast polymer composite materials for interior environments. Appl. Eng. Lett. J. Eng. Appl. Sci. 2020, 5, 1–7. [Google Scholar] [CrossRef] [Green Version]
- Schruben, D.L.; Gonzalez, P. Dispersity improvement in solvent casting particle/polymer composite. Polym. Eng. Sci. 2000, 40, 139–142. [Google Scholar] [CrossRef]
- Ferreira, J.M.; Costa, J.D.; Capela, C. Fracture assessment of PMMA/Si kitchen sinks made from acrylic casting dispersion. Theor. Appl. Fract. Mech. 1997, 26, 105–116. [Google Scholar] [CrossRef]
- Kashim, I.B.; Shado, A.S. Sink fabrication from limestone-clay reinforced polyester composite. J. Mater. Sci. 2020, 8, 11–21. [Google Scholar] [CrossRef]
- Narasimhulu, A.; Shandley, R. Effect of marble powder concentration on Mechanical Properties of unsaturated polyster resin for the development of rock climbing holds. In Proceedings of the International Conference on Advances in Materials & Manufacturing (ICAMM-2016), Bangkok, Thailand, 29–30 October 2016. [Google Scholar] [CrossRef] [Green Version]
- Hedrick, J.L.; Yilgor, I.; Jurek, M.; Hedrick, J.C.; Wilkes, G.L.; McGrath, J.E. Chemical modification of matrix resin networks with engineering thermoplastics: 1. Synthesis, morphology, physical behaviour and toughening mechanisms of poly(arylene ether sulphone) modified epoxy networks. Polymer 1991, 32, 2020–2032. [Google Scholar] [CrossRef]
- Wang, B.; Yin, J.; Wang, L.; Gao, Y. Influence of surfactant modification on structure and properties of CNT hybrid multiscale composites. Macromol. Mater. Eng. 2014, 299, 344–352. [Google Scholar] [CrossRef]
- Hsiue, G.H.; Wei, H.F.; Shiao, S.J.; Kuo, W.J.; Sha, Y.A. Chemical modification of dicyclopentadiene-based epoxy resins to improve compatibility and thermal properties. Polym. Degrad. Stab. 2001, 73, 309–318. [Google Scholar] [CrossRef]
- Derouet, D.; Morvan, F.; Brosse, J.C. Chemical modification of epoxy resins by dialkyl (or aryl) phosphates: Evaluation of fire behavior and thermal stability. J. Appl. Polym. Sci. 1996, 62, 1855–1868. [Google Scholar] [CrossRef]
- Ratna, D. Modification of epoxy resins for improvement of adhesion: A critical review. J. Adhes. Sci. Technol. 2003, 17, 1655–1668. [Google Scholar] [CrossRef]
- Yang, G.; Fu, S.Y.; Yang, J.P. Preparation and mechanical properties of modified epoxy resins with flexible diamines. Polymer 2007, 48, 302–310. [Google Scholar] [CrossRef]
- Chruściel, J.J.; Leśniak, E. Modification of epoxy resins with functional silanes, polysiloxanes, silsesquioxanes, silica and silicates. Prog. Polym. Sci. 2015, 41, 67–121. [Google Scholar] [CrossRef]
- Mulfinger, L.; Solomon, S.D.; Bahadory, M.; Jeyarajasingam, A.V.; Rutkowsky, S.A.; Boritz, C. Synthesis and study of silver nanoparticles. J. Chem. Educ. 2007, 84, 322. [Google Scholar] [CrossRef]
- Kumar, A.; Dhawan, A. Genotoxic and carcinogenic potential of engineered nanoparticles: An update. Arch. Toxicol. 2013, 87, 1883–1900. [Google Scholar] [CrossRef]
- Afkhami, A.; Moosavi, R. Adsorptive removal of Congo red, a carcinogenic textile dye, from aqueous solutions by maghemite nanoparticles. J. Hazard. Mater. 2010, 174, 398–403. [Google Scholar] [CrossRef]
- Hougaard, K.S.; Fadeel, B.; Gulumian, M.; Kagan, V.E.; Savolainen, K.M. Developmental toxicity of engineered nanoparticles. In Reproductive and Developmental Toxicology; Academic Press: Cambridge, MA, USA, 2011; pp. 269–290. [Google Scholar]
- Baller, J.; Becker, N.; Ziehmer, M.; Thomassey, M.; Zielinski, B.; Müller, U.; Sanctuary, R. Interactions between silica nanoparticles and an epoxy resin before and during network formation. Polymer 2009, 50, 3211–3219. [Google Scholar] [CrossRef]
- Papageorgiou, D.G.; Li, Z.; Liu, M.; Kinloch, I.A.; Young, R.J. Mechanisms of mechanical reinforcement by graphene and carbon nanotubes in polymer nanocomposites. Nanoscale 2020, 12, 2228–2267. [Google Scholar] [CrossRef] [Green Version]
- Tarrio-Saavedra, J.; López-Beceiro, J.; Naya, S.; Artiaga, R. Effect of silica content on thermal stability of fumed silica/epoxy composites. Polym. Degrad. Stab. 2008, 93, 2133–2137. [Google Scholar] [CrossRef]
- Valášek, P.; Müller, M.; Proshlyakov, A. Effect of sedimentation on the final hardness of polymeric particle composites. Res. Agric. Eng. 2012, 58, 92–98. [Google Scholar] [CrossRef] [Green Version]
- Shojaei, A.; Arefinia, R. Analysis of the sedimentation process in reactive polymeric suspensions. Chem. Eng. Sci. 2006, 61, 7565–7578. [Google Scholar] [CrossRef]
- Samal, S. Effect of shape and size of filler particle on the aggregation and sedimentation behavior of the polymer composite. Powder Technol. 2020, 366, 43–51. [Google Scholar] [CrossRef]
- Xu, A.; Shi, L.; Zhao, T.S. Thermal effects on the sedimentation behavior of elliptical particles. Int. J. Heat Mass Transf. 2018, 126, 753–764. [Google Scholar] [CrossRef]
- Karimnejad, S.; Amiri Delouei, A.; Nazari, M.; Shahmardan, M.M.; Mohamad, A.A. Sedimentation of elliptical particles using Immersed Boundary—Lattice Boltzmann Method: A complementary repulsive force model. J. Mol. Liq. 2018, 262, 180–193. [Google Scholar] [CrossRef]
- Krishnamoorthy, P. Sedimentation model and analysis for differential settling of two-particle-size suspensions in the Stokes region. Int. J. Sediment Res. 2010, 25, 119–133. [Google Scholar] [CrossRef]
- Pavlenko, I.; Ochowiak, M.; Agarwal, P.; Olszewski, R.; Michałek, B.; Krupińska, A. Improvement of mathematical model for sedimentation process. Energies 2021, 14, 4561. [Google Scholar] [CrossRef]
- Höfer, R.M.; Schubert, R. The influence of Einstein’s effective viscosity on sedimentation at very small particle volume fraction. Ann. L’institut Henri Poincaré C Anal. Non Linéaire 2021, 38, 1897–1927. [Google Scholar] [CrossRef]
- Saiyad, M.; Devashrayee, N.M.; Mevada, R.K. Study the effect of dispersion of filler in polymer composite for radiation shielding. Polym. Compos. 2014, 35, 1263–1266. [Google Scholar] [CrossRef]
- Dobrosielska, M.; Dobrucka, R.; Brząkalski, D.; Gloc, M.; Rębiś, J.; Głowacka, J.; Kurzydłowski, K.J.; Przekop, R.E. Methodological aspects of obtaining and characterizing composites based on biogenic diatomaceous silica and epoxy resins. Materials 2021, 14, 4607. [Google Scholar] [CrossRef]
- Abd El-Fattah, M.; El Saeed, A.M.; El-Ghazawy, R.A. Chemical interaction of different sized fumed silica with epoxy via ultrasonication for improved coating. Prog. Org. Coat. 2019, 129, 1–9. [Google Scholar] [CrossRef]
- Szala, J. MetIlo, authorized program; Department of Materials Science 3, Silesian University of Technology: Gliwice, Ploand, Unpublished Work; 2021. [Google Scholar]
- Smoleń, J.; Olesik, P.; Gradoń, P.; Chudy, M.; Mendala, B.; Kozioł, M. The use of the ATD technique to measure the gelation time of epoxy resins. Materials 2021, 14, 6022. [Google Scholar] [CrossRef] [PubMed]


| Sample Name | Alumina Content | Graphite Content | Colloidal Silica Content |
|---|---|---|---|
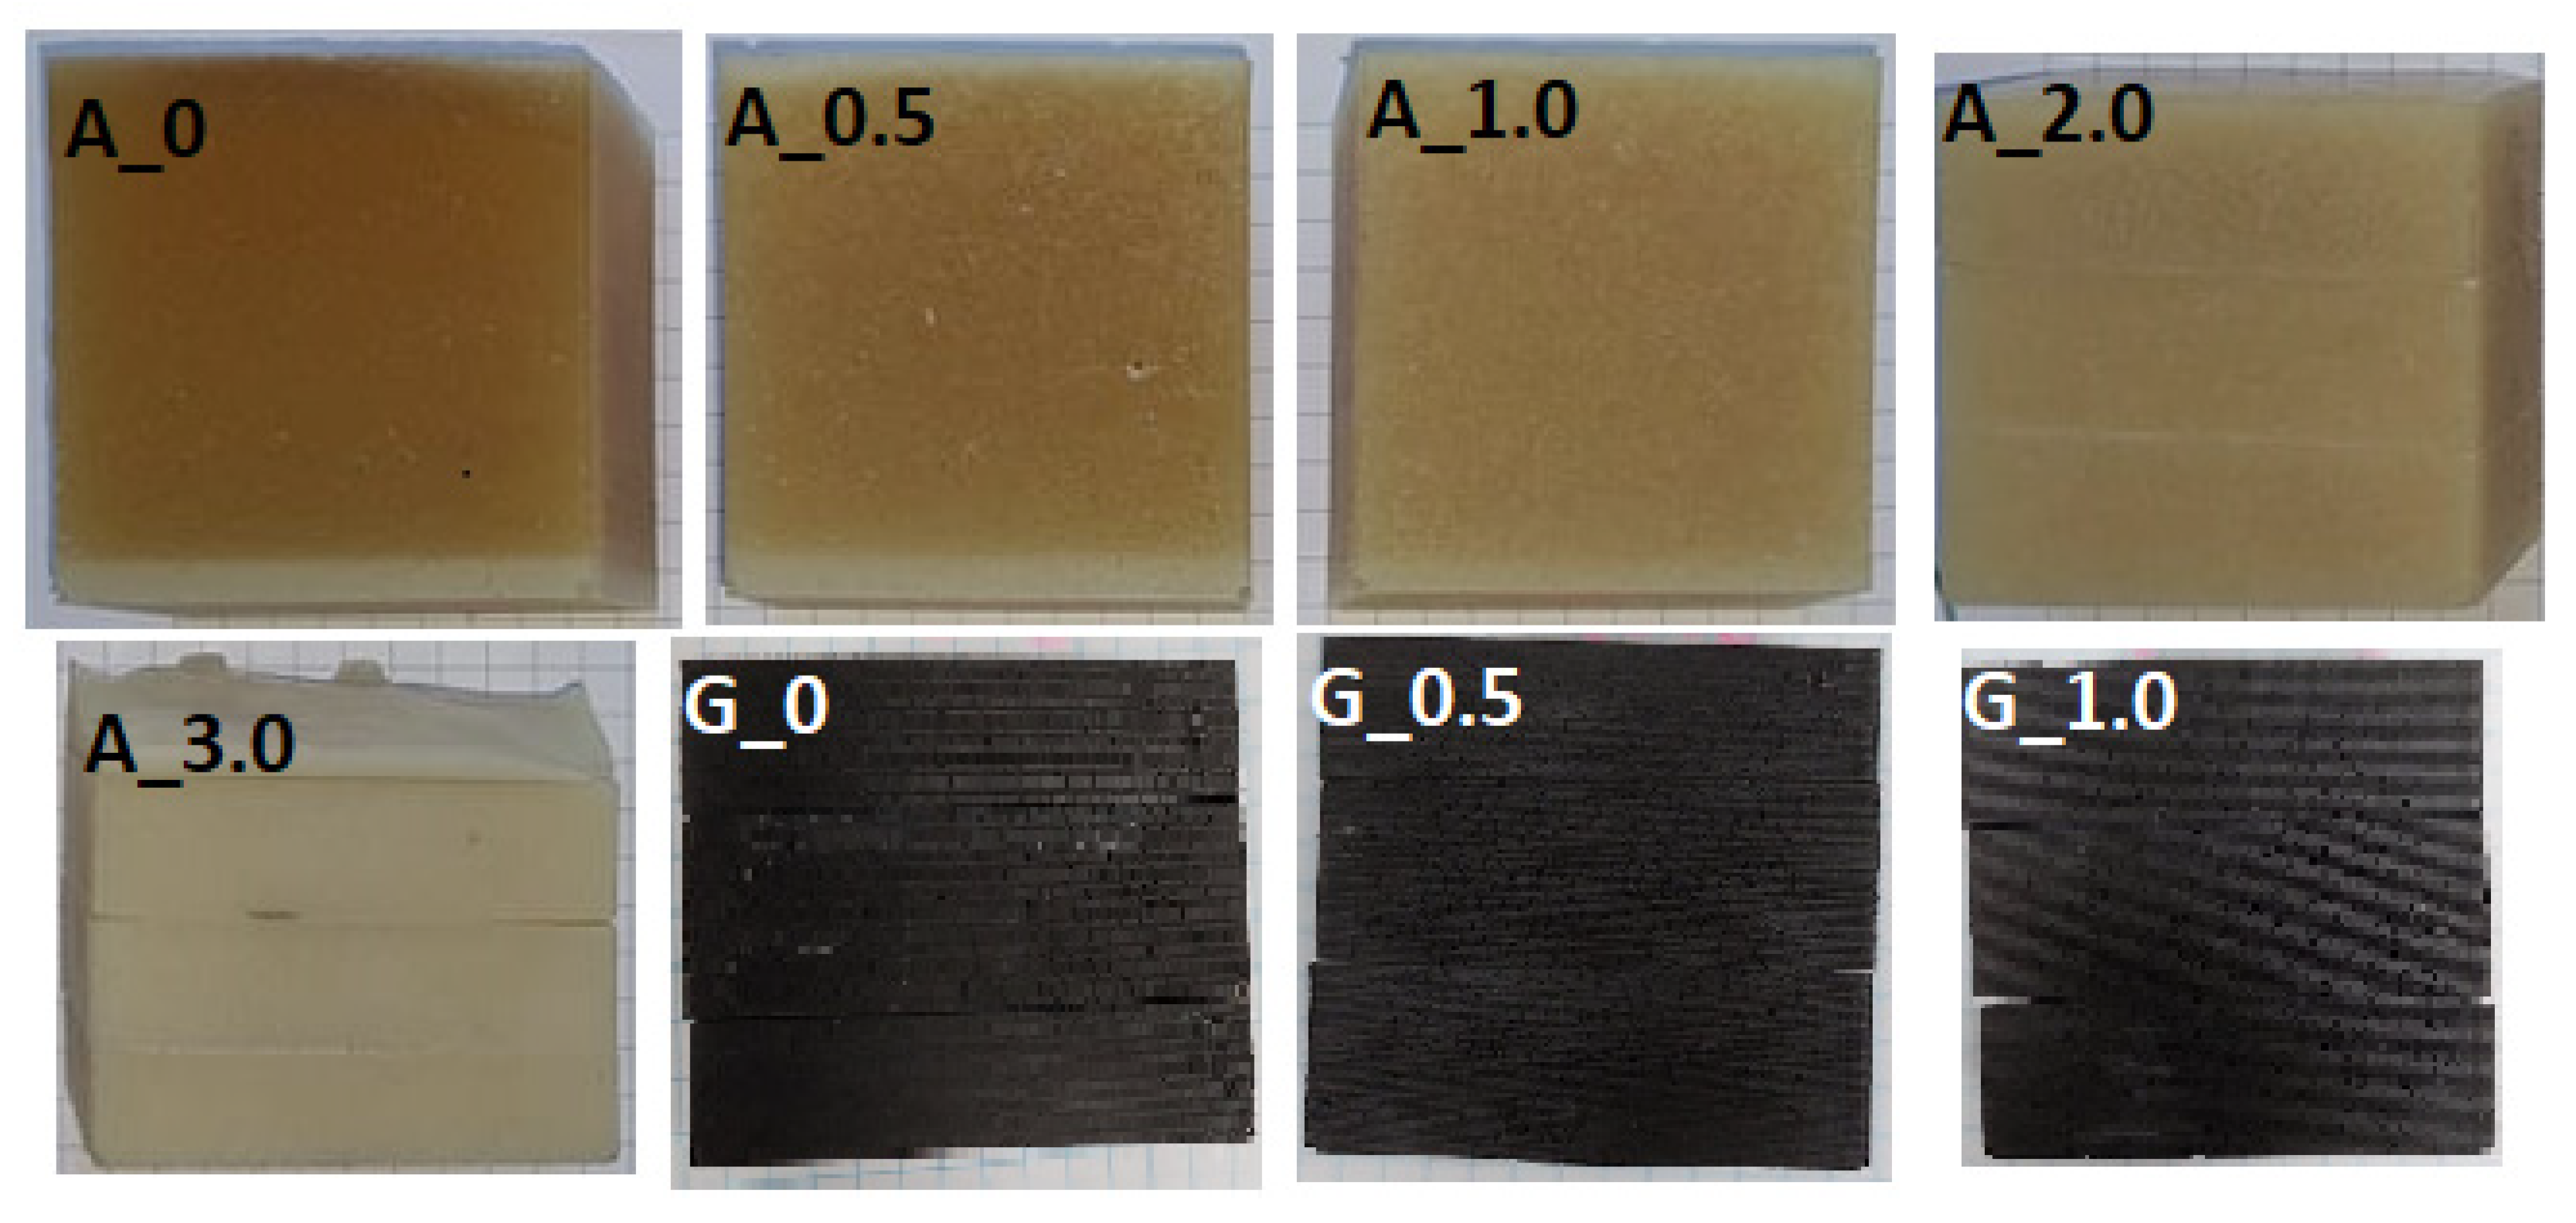
| A_0 | 20% | 0% | 0% |
| A_0.5 | 20% | 0% | 0.5% |
| A_1.0 | 20% | 0% | 1% |
| A_2.0 | 20% | 0% | 2% |
| A_3.0 | 20% | 0% | 3% |
| G_0 | 0% | 20% | 0% |
| G_0.5 | 0% | 20% | 0.5% |
| G_1.0 | 0% | 20% | 1% |
| G_2.0 | 0% | 20% | 2% |
| Sample | Top | Center | Bottom |
|---|---|---|---|
| A_1.0 | 2.62 ± 0.98 | 5.04 ± 2.83 | 3.37 ± 0.99 |
| A_2.0 | 4.35 ± 1.85 | 4.52 ± 1.42 | 4.78 ± 1.57 |
| Sample | Top | Center | Bottom |
|---|---|---|---|
| G_0 | 8.96 ± 1.29 | 8.80 ± 1.79 | 11.47 ± 3.12 |
| G_0.5 | 9.65 ± 1.12 | 10.20 ± 1.07 | 10.02 ± 1.33 |
| G_1.0 | 10.30 ± 1.69 | 11.46 ± 1.30 | 10.90 ± 1.32 |
Publisher’s Note: MDPI stays neutral with regard to jurisdictional claims in published maps and institutional affiliations. |
© 2021 by the authors. Licensee MDPI, Basel, Switzerland. This article is an open access article distributed under the terms and conditions of the Creative Commons Attribution (CC BY) license (https://creativecommons.org/licenses/by/4.0/).
Share and Cite
Smoleń, J.; Olesik, P.; Jała, J.; Myalska-Głowacka, H.; Godzierz, M.; Kozioł, M. Application of Mathematical and Experimental Approach in Description of Sedimentation of Powder Fillers in Epoxy Resin. Materials 2021, 14, 7520. https://doi.org/10.3390/ma14247520
Smoleń J, Olesik P, Jała J, Myalska-Głowacka H, Godzierz M, Kozioł M. Application of Mathematical and Experimental Approach in Description of Sedimentation of Powder Fillers in Epoxy Resin. Materials. 2021; 14(24):7520. https://doi.org/10.3390/ma14247520
Chicago/Turabian StyleSmoleń, Jakub, Piotr Olesik, Jakub Jała, Hanna Myalska-Głowacka, Marcin Godzierz, and Mateusz Kozioł. 2021. "Application of Mathematical and Experimental Approach in Description of Sedimentation of Powder Fillers in Epoxy Resin" Materials 14, no. 24: 7520. https://doi.org/10.3390/ma14247520
APA StyleSmoleń, J., Olesik, P., Jała, J., Myalska-Głowacka, H., Godzierz, M., & Kozioł, M. (2021). Application of Mathematical and Experimental Approach in Description of Sedimentation of Powder Fillers in Epoxy Resin. Materials, 14(24), 7520. https://doi.org/10.3390/ma14247520