
Multiblock Elastomers TPEAA and TPEEA: Physical Structure and Properties

 , ,
, ,
Abstract
:1. Introduction
- insoluble in the other two—new phase structures will probably arise;
- partially soluble in one and insoluble in the other—it may change the properties of the phase in which it partially dissolves and may possibly form new phase structures;
- completely soluble in one and insoluble in the other—changes the properties of the phase in which it dissolves;
- partially soluble in the other two—it may enlarge the transition area and may change the properties of the phases in which it partially dissolves;
- completely soluble in one and partially soluble in the other—changes the properties of the phase in which it dissolves, probably affects the properties of the entire system; or
- completely soluble in the other two—changes the properties of both phases, can destroy the heterophasic structure [39].
2. Materials and Methods
2.1. Materials
2.2. Determination
2.3. Sample Preparation
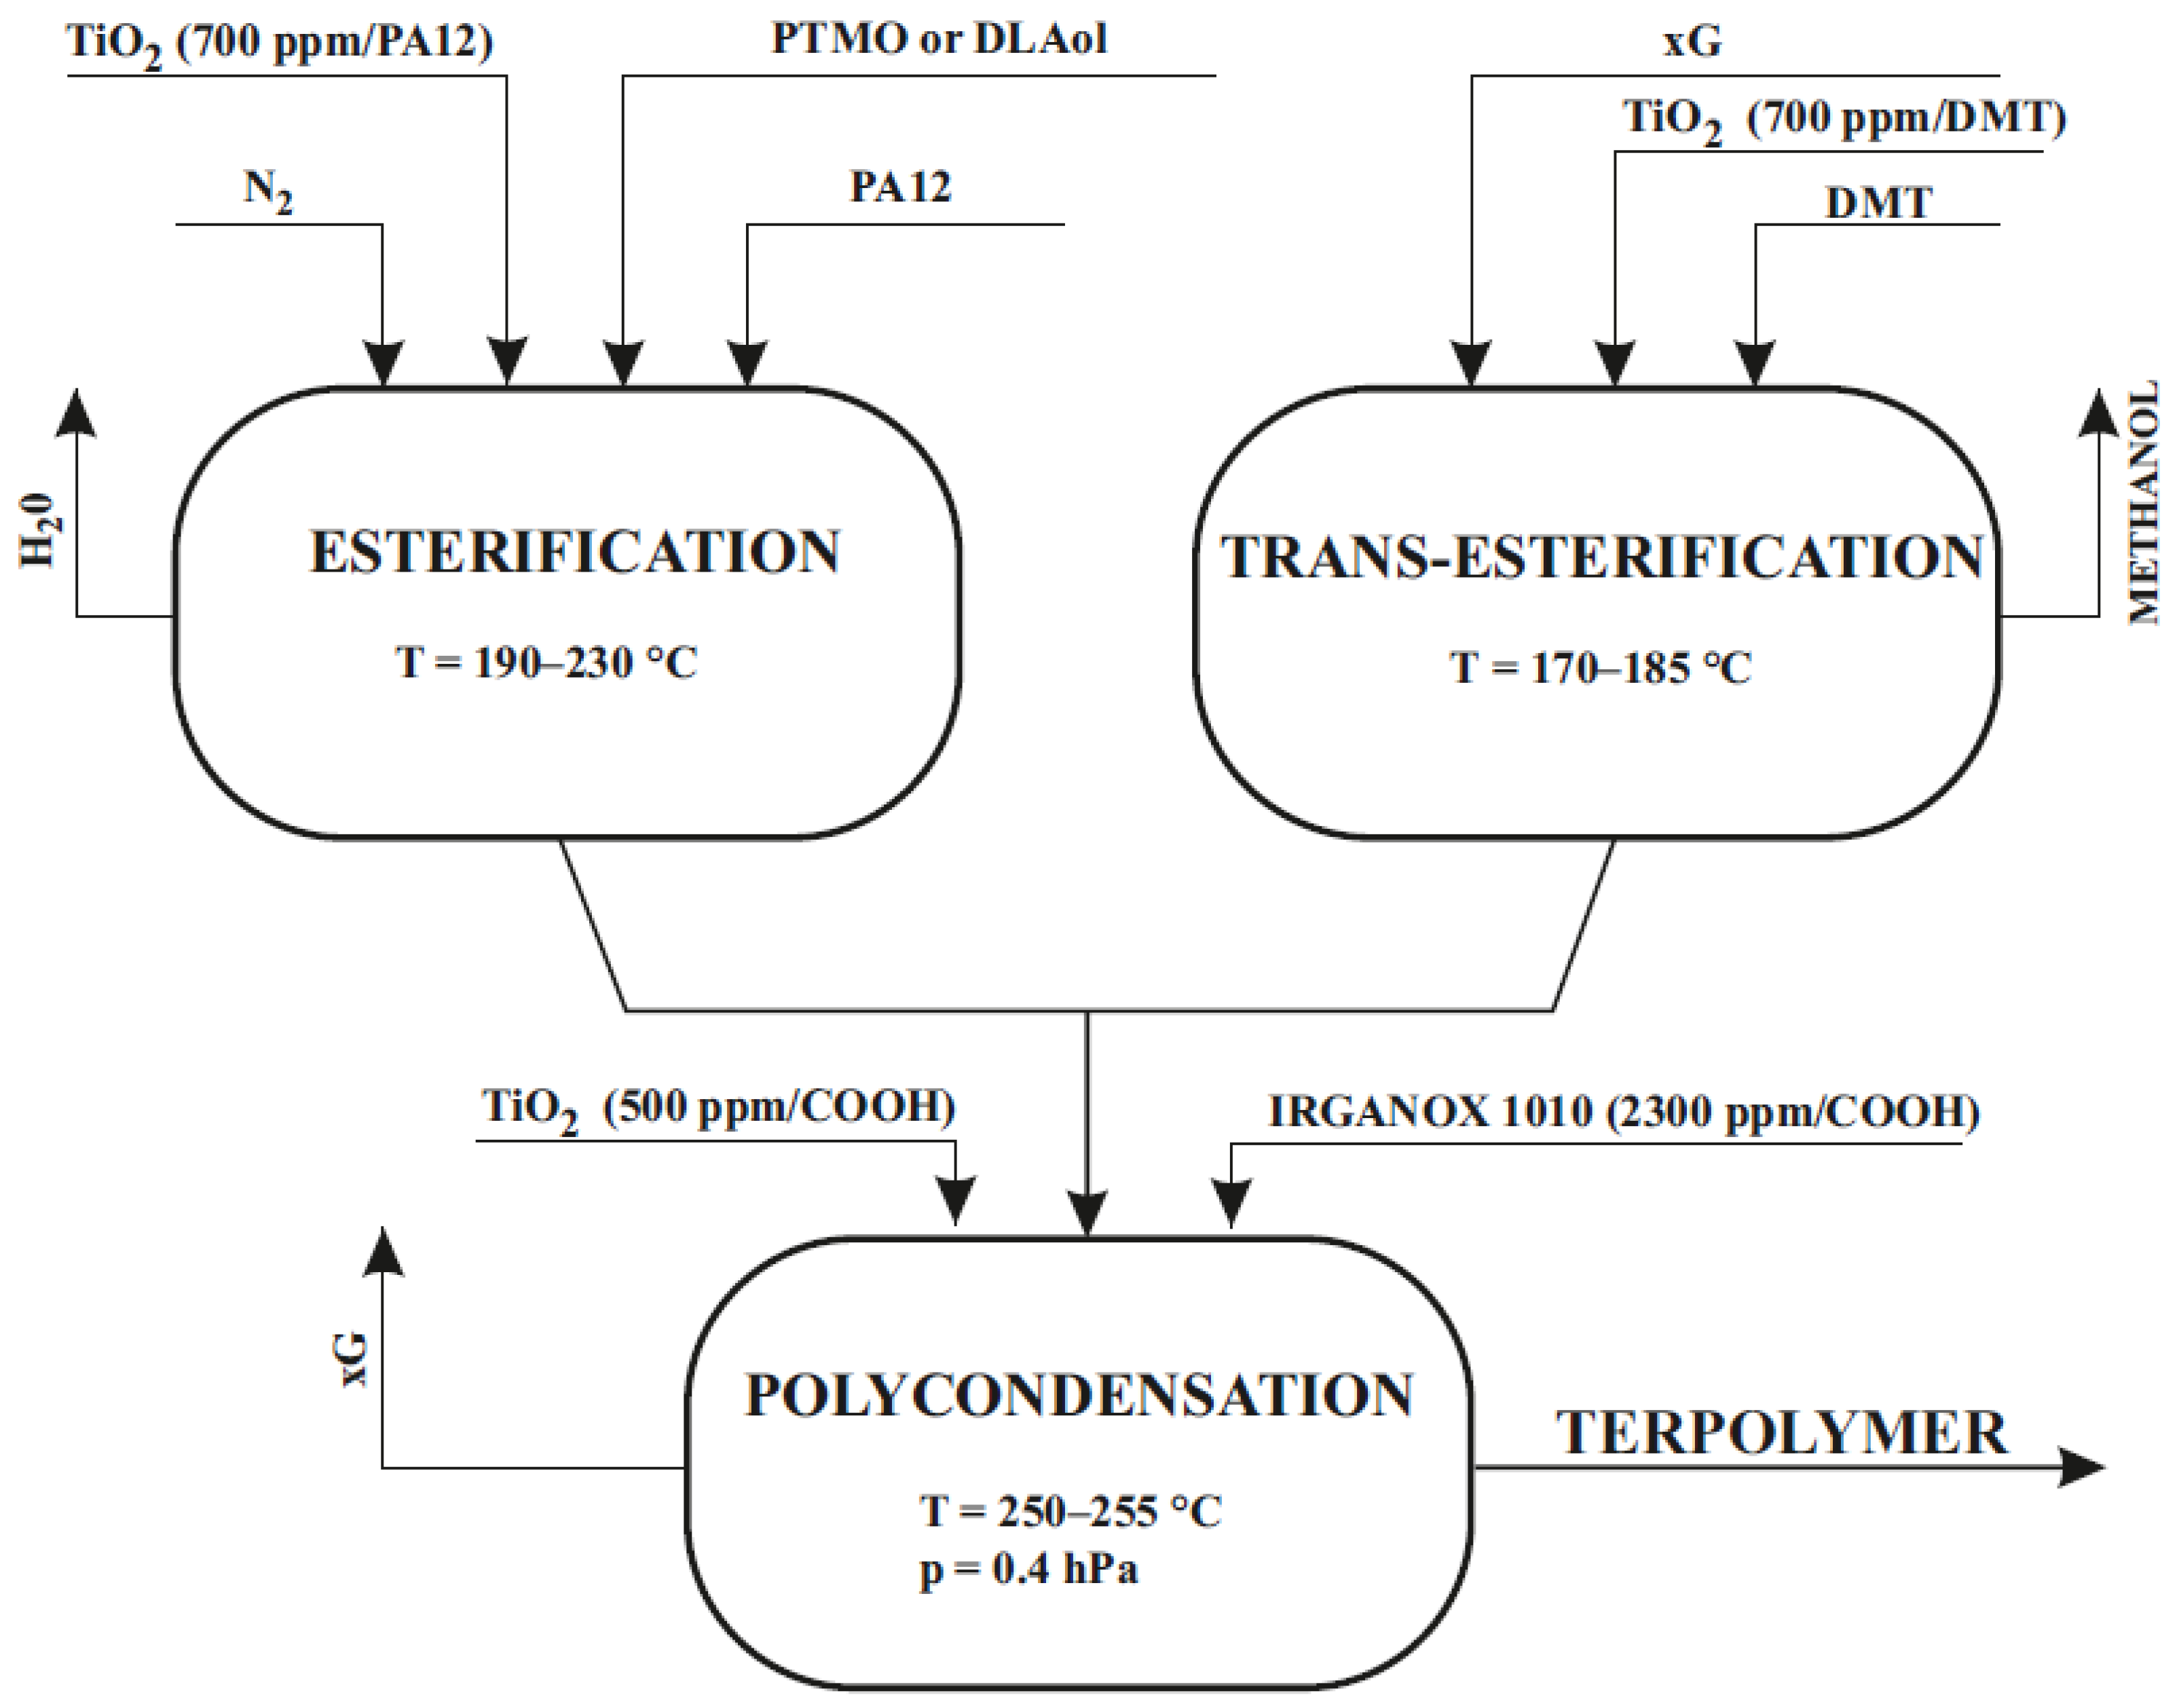
2.4. Synthesis of TPEs
3. Results
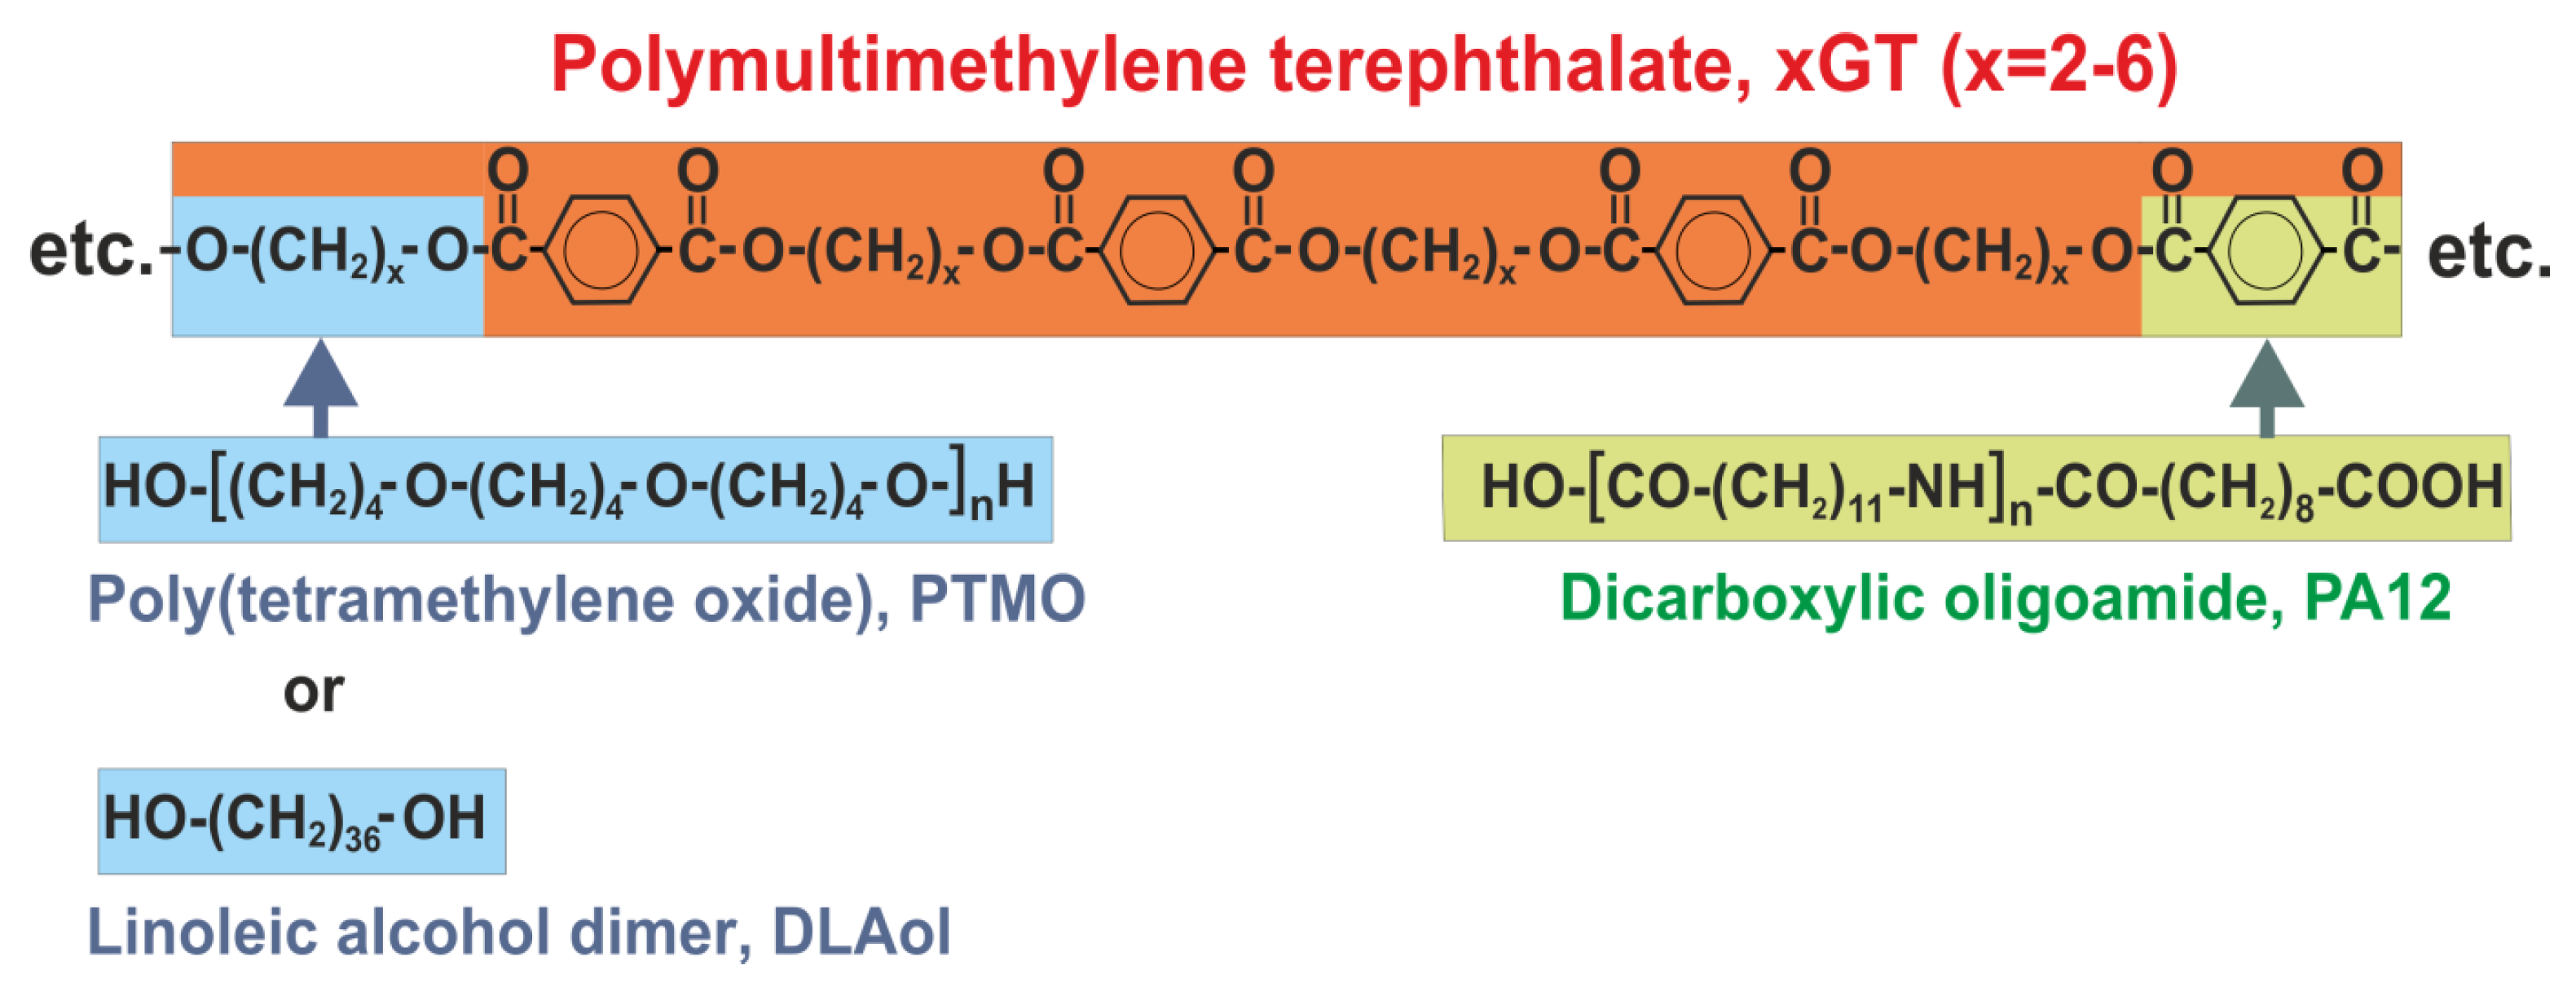
3.1. Chemical Structure
3.2. Main Properties of TPEs
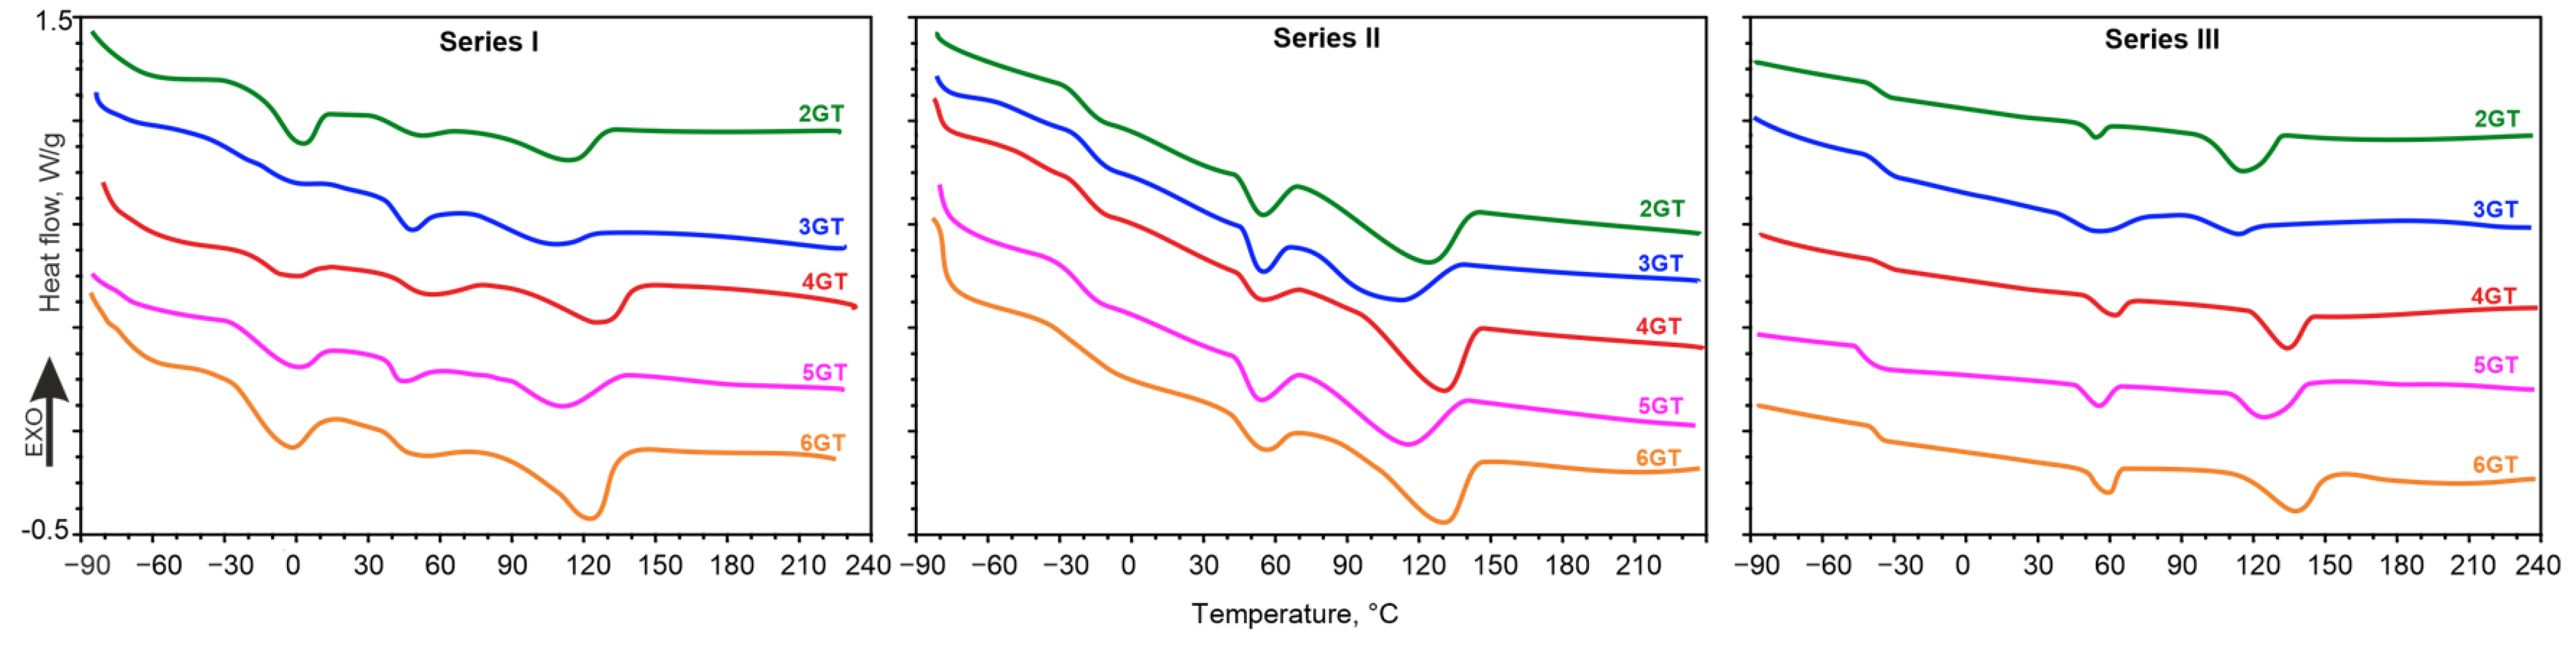
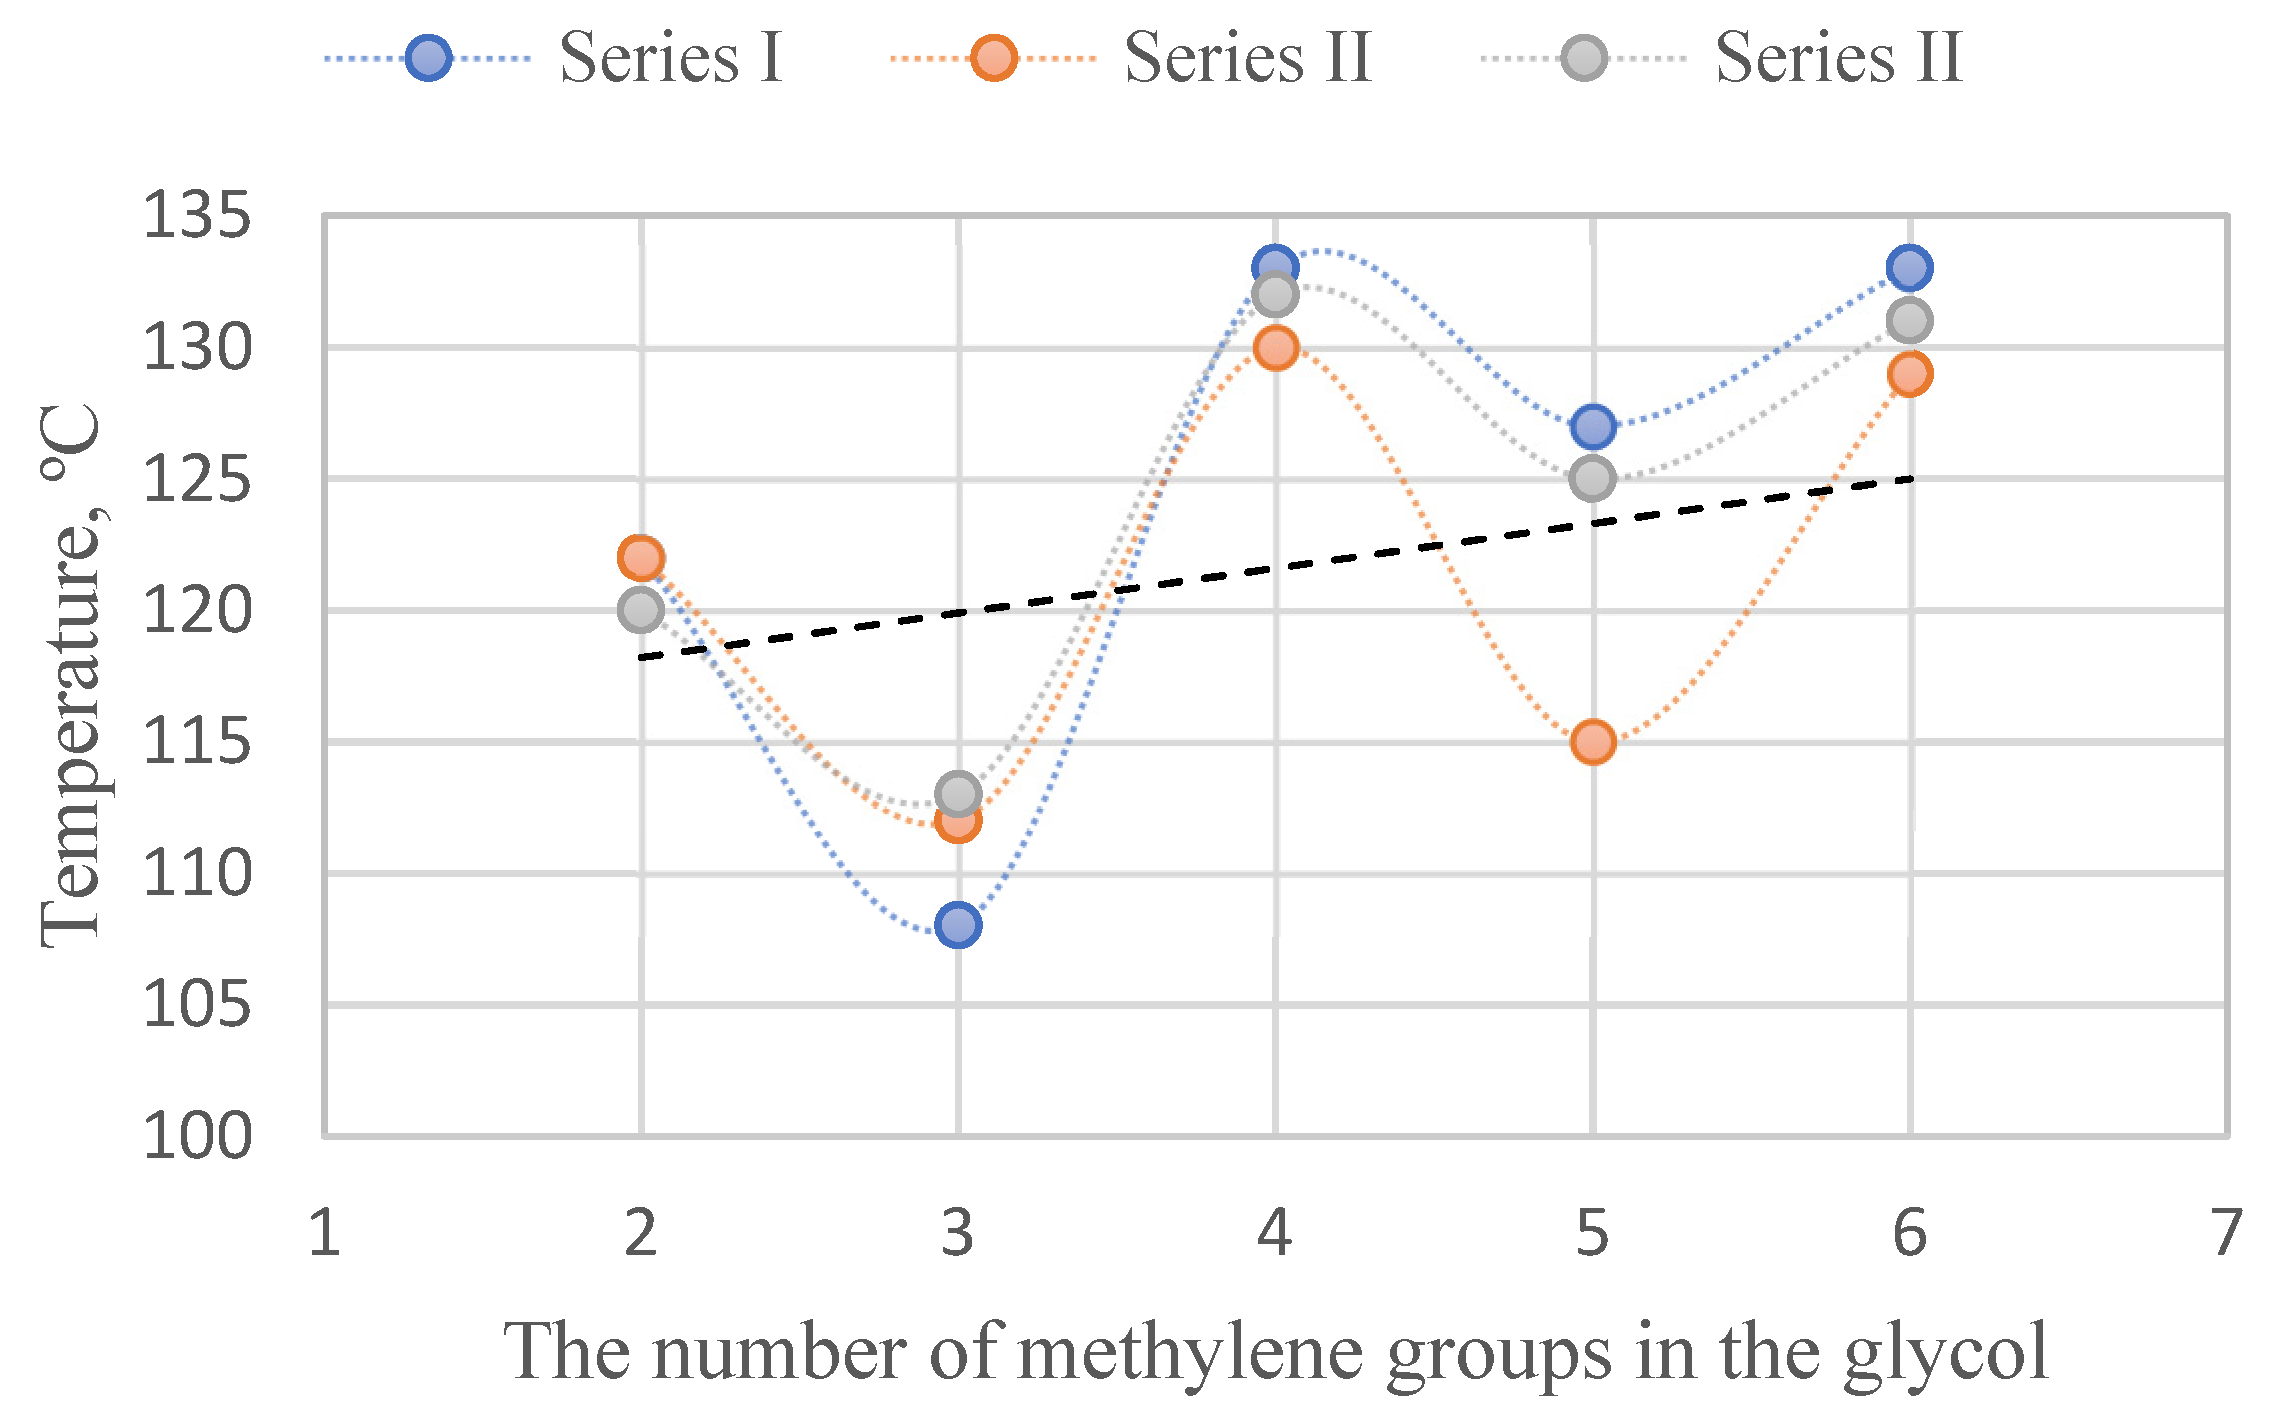
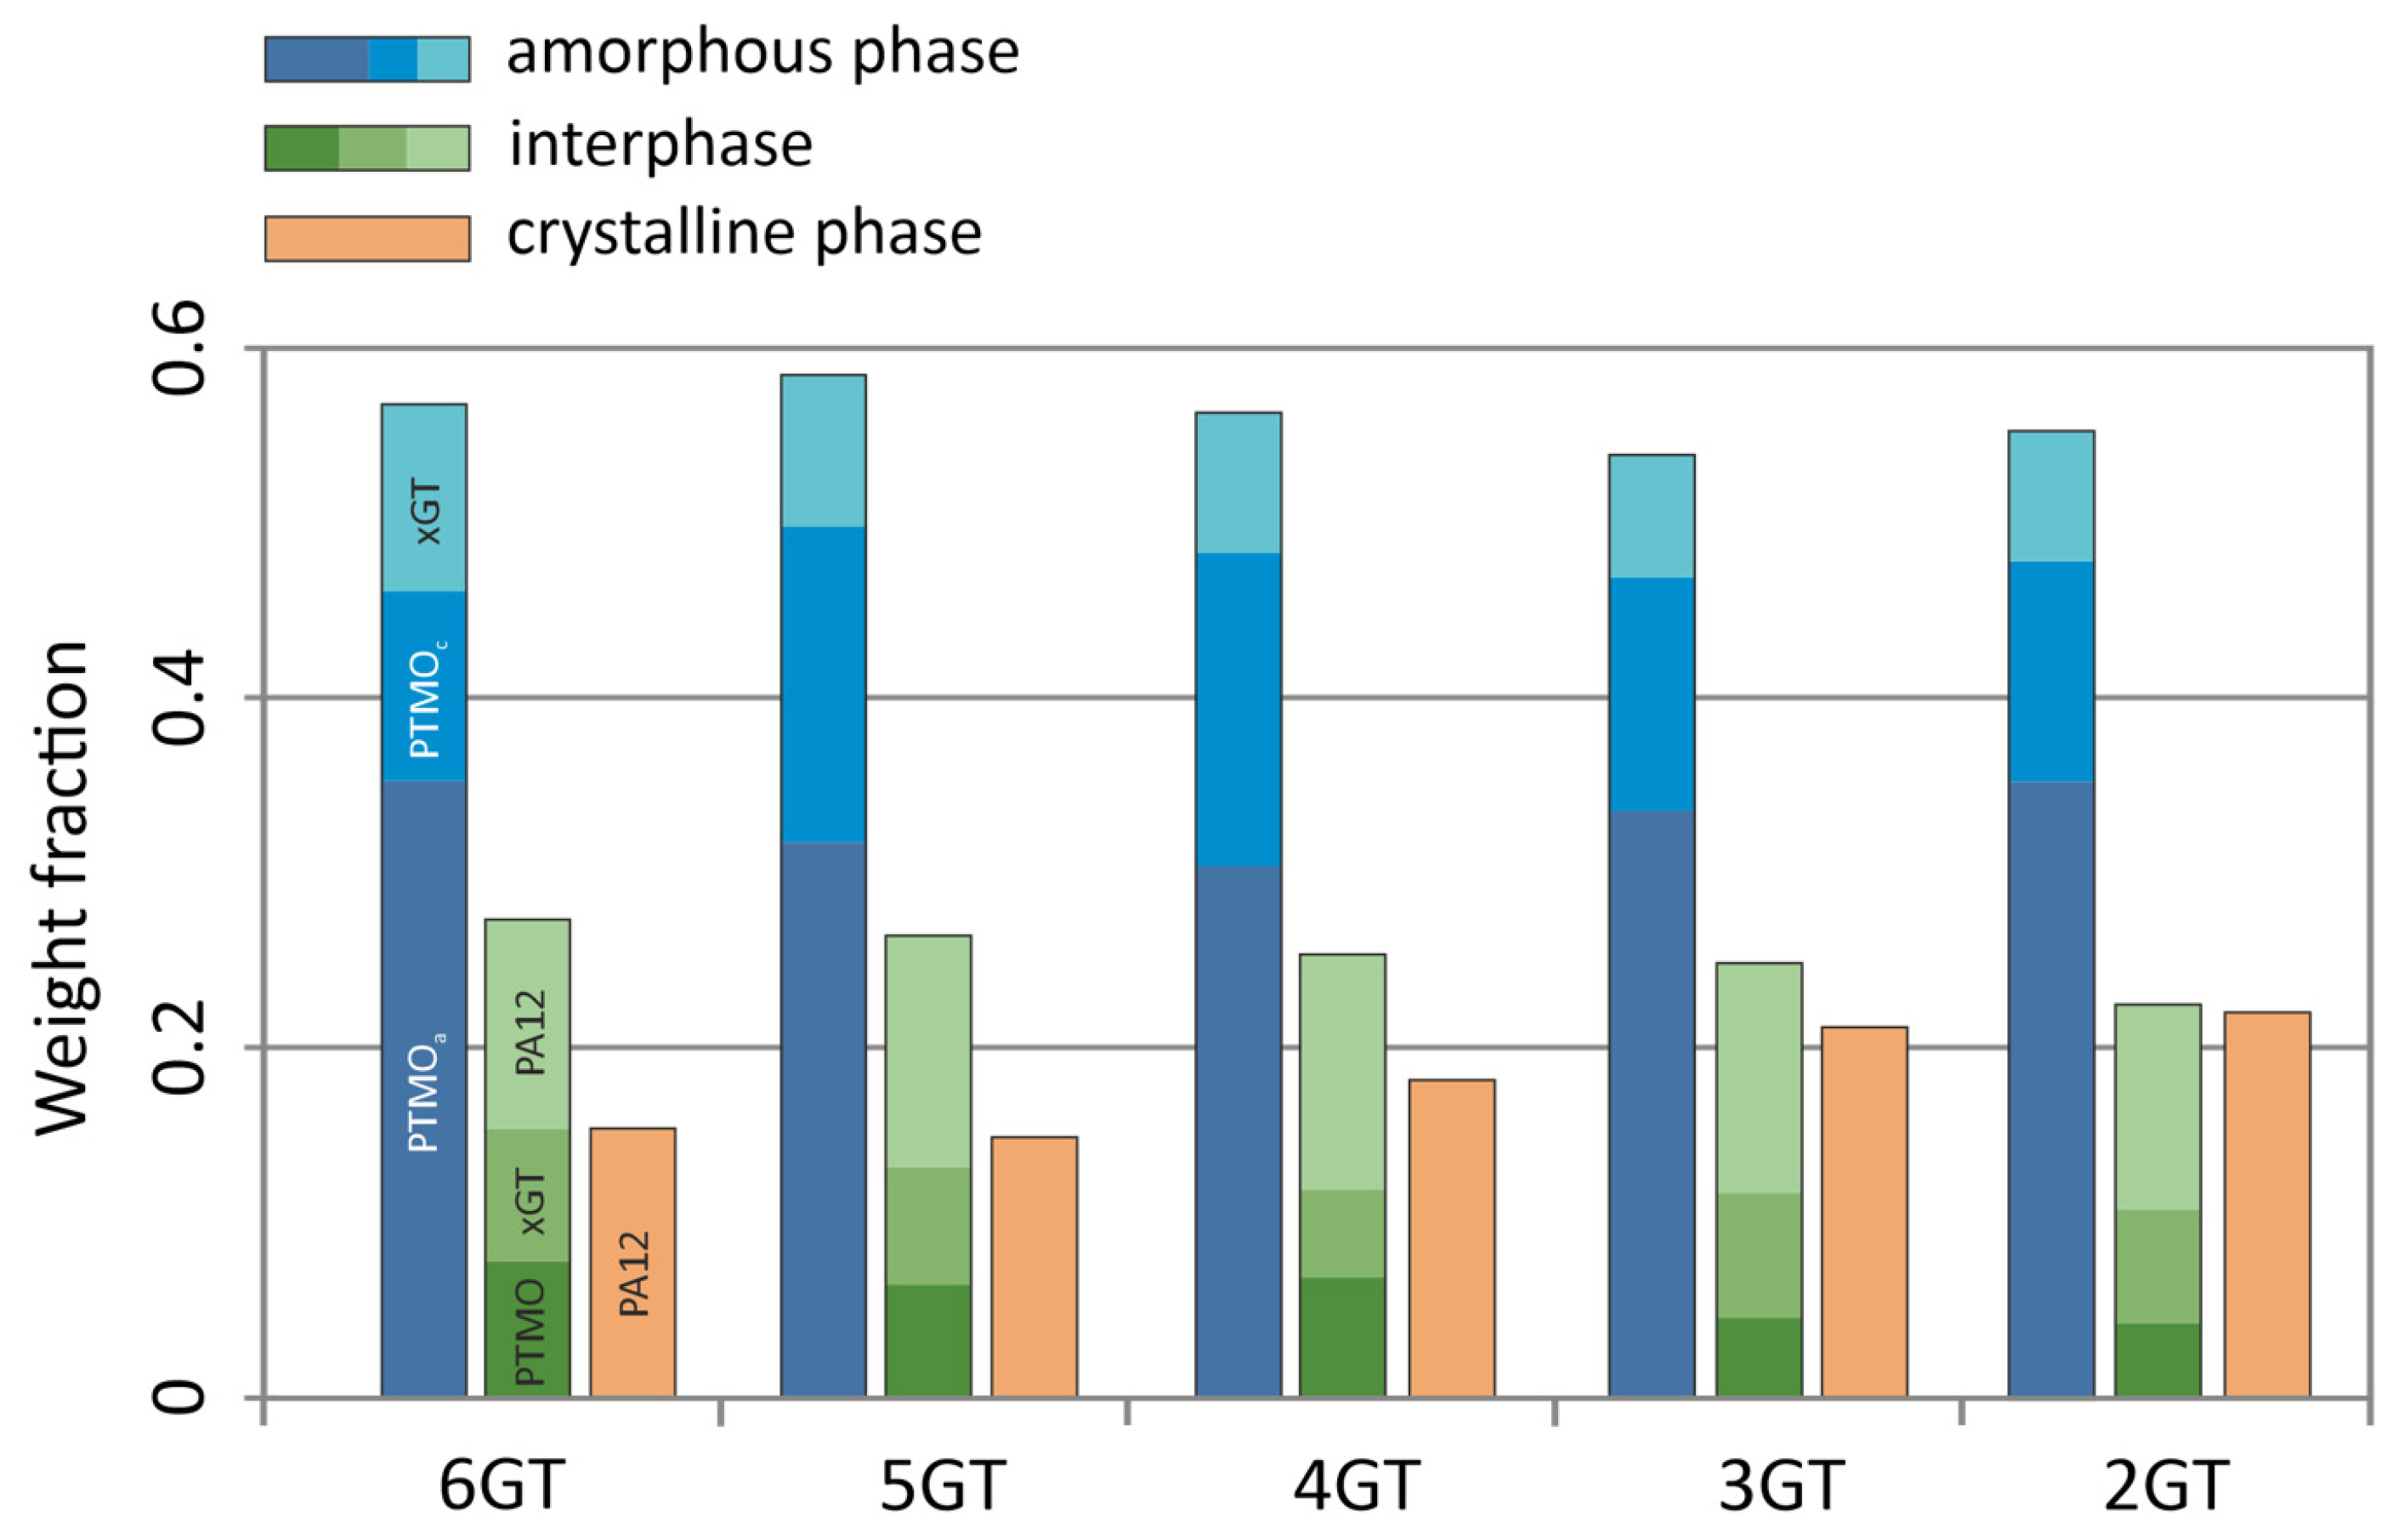
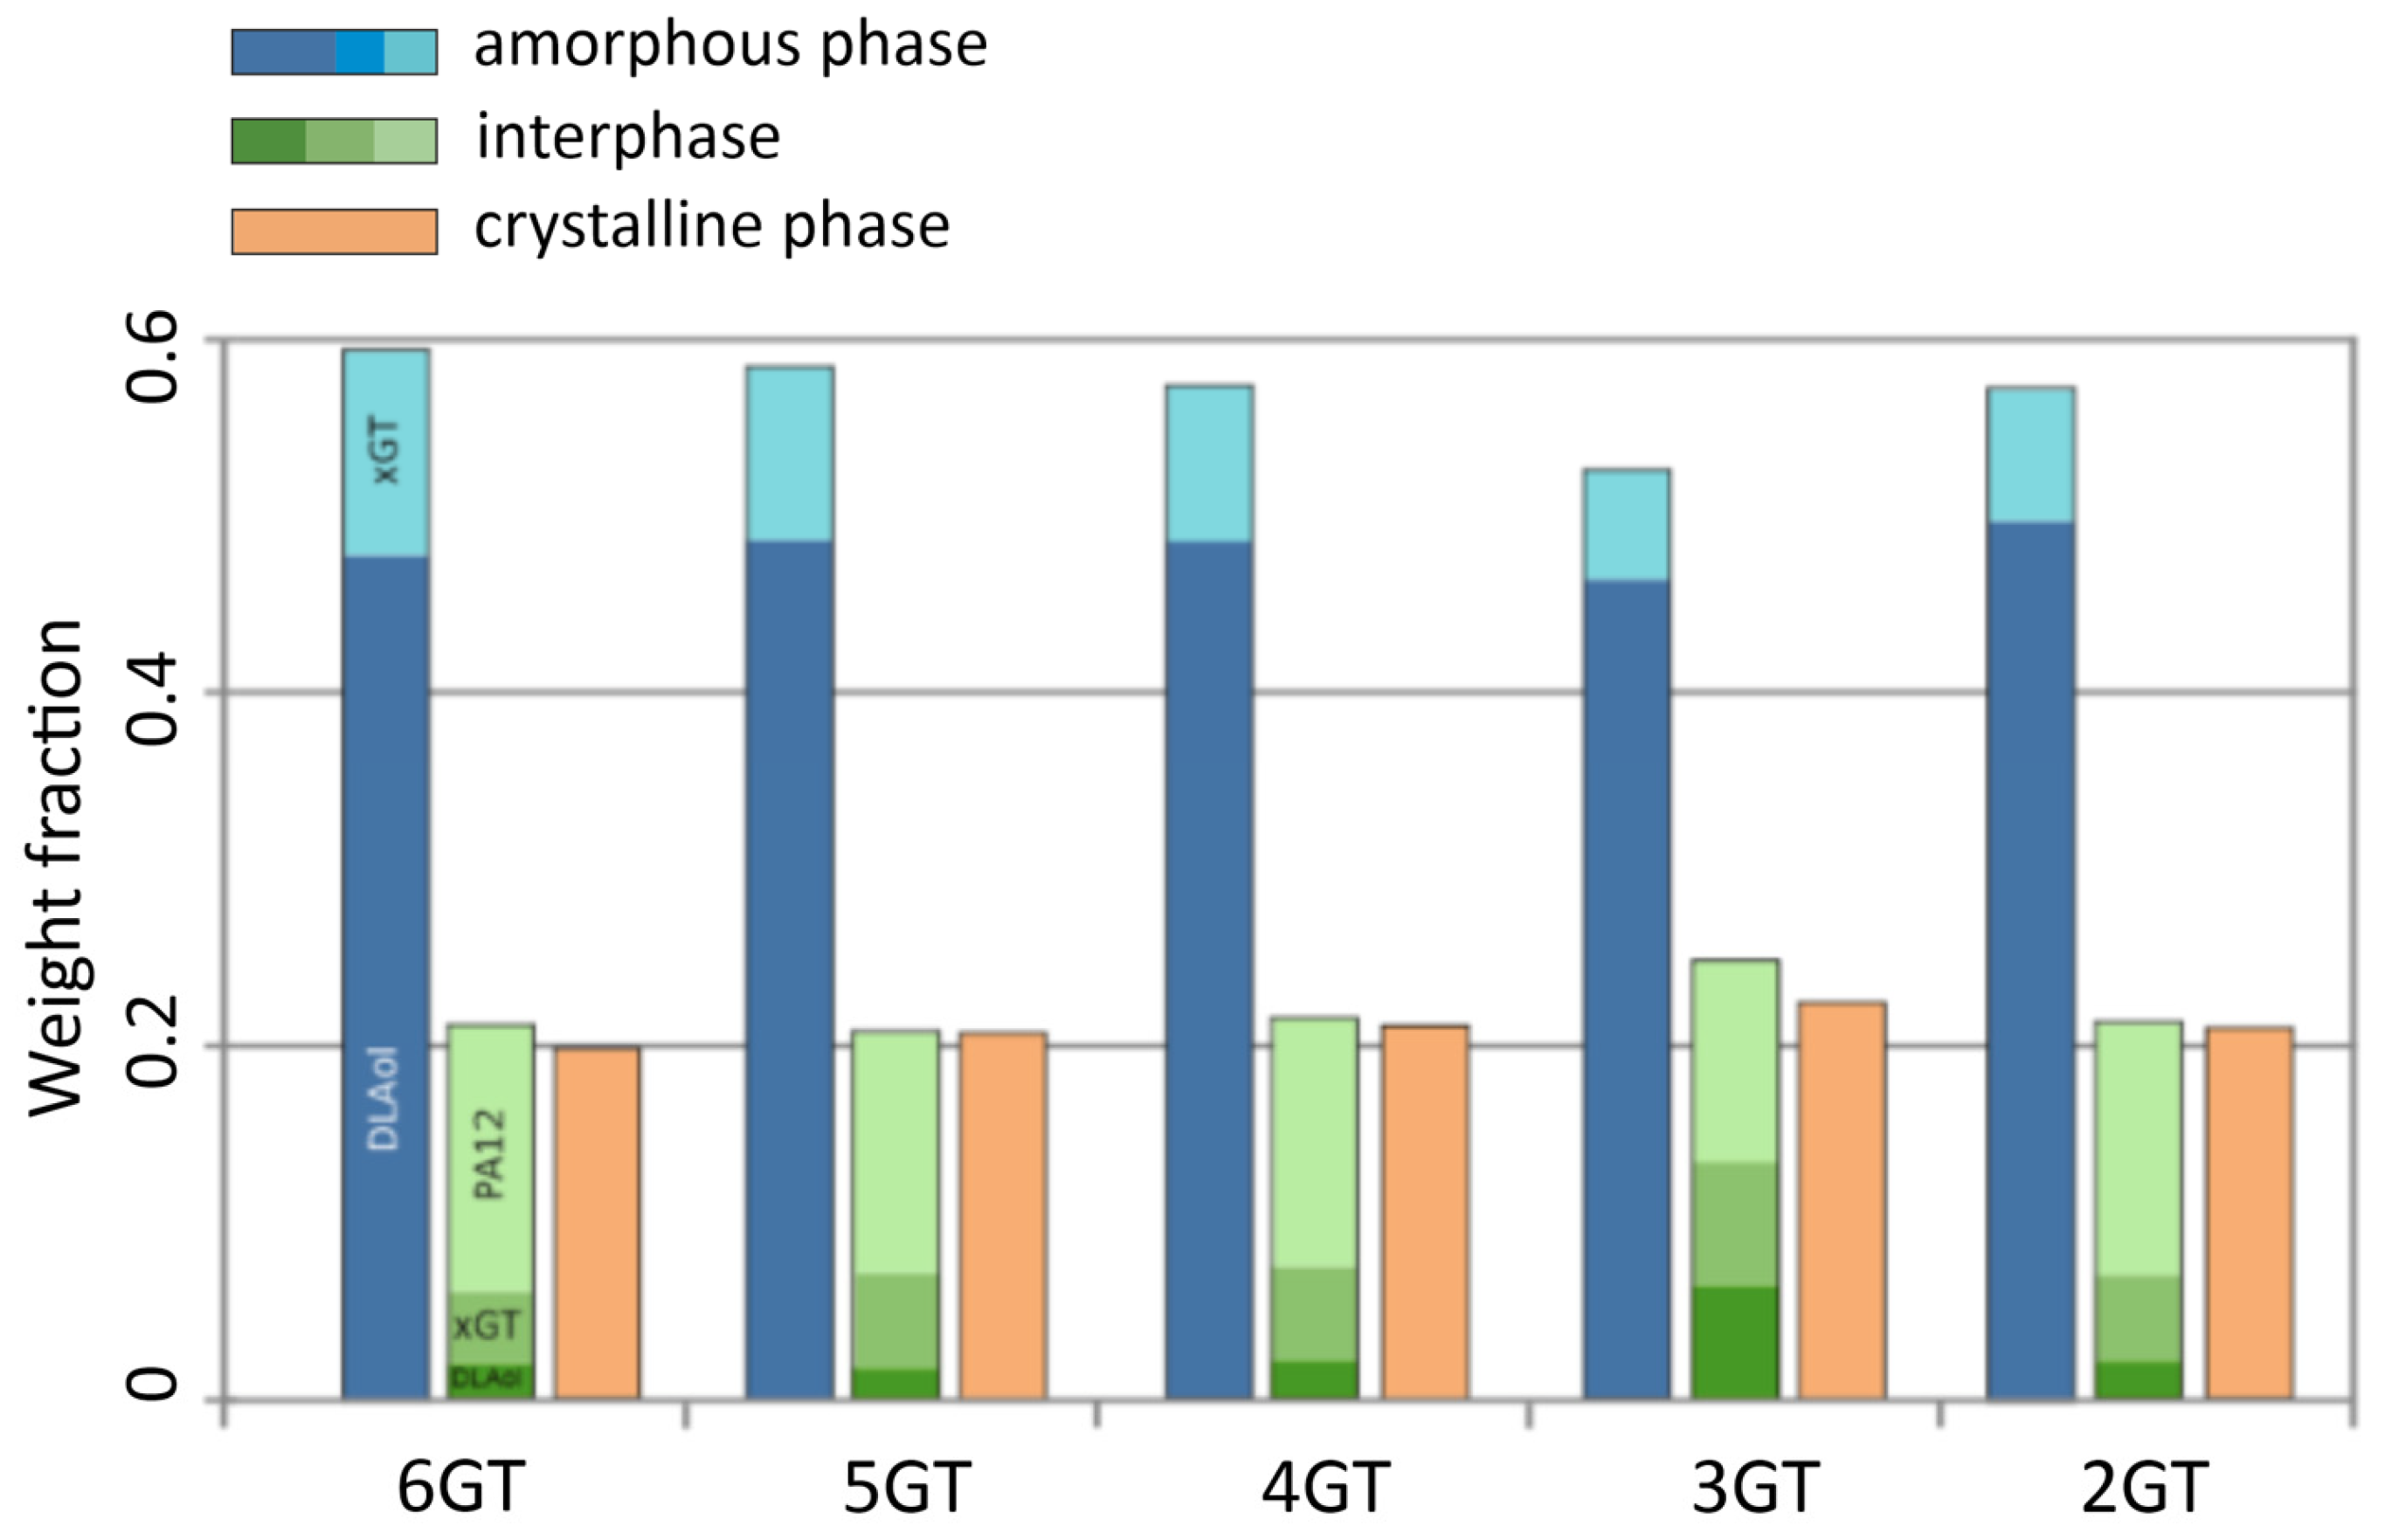
3.3. Physical Structure
- Degree of phase separation (SRs) of the soft phase (Equation (1)):
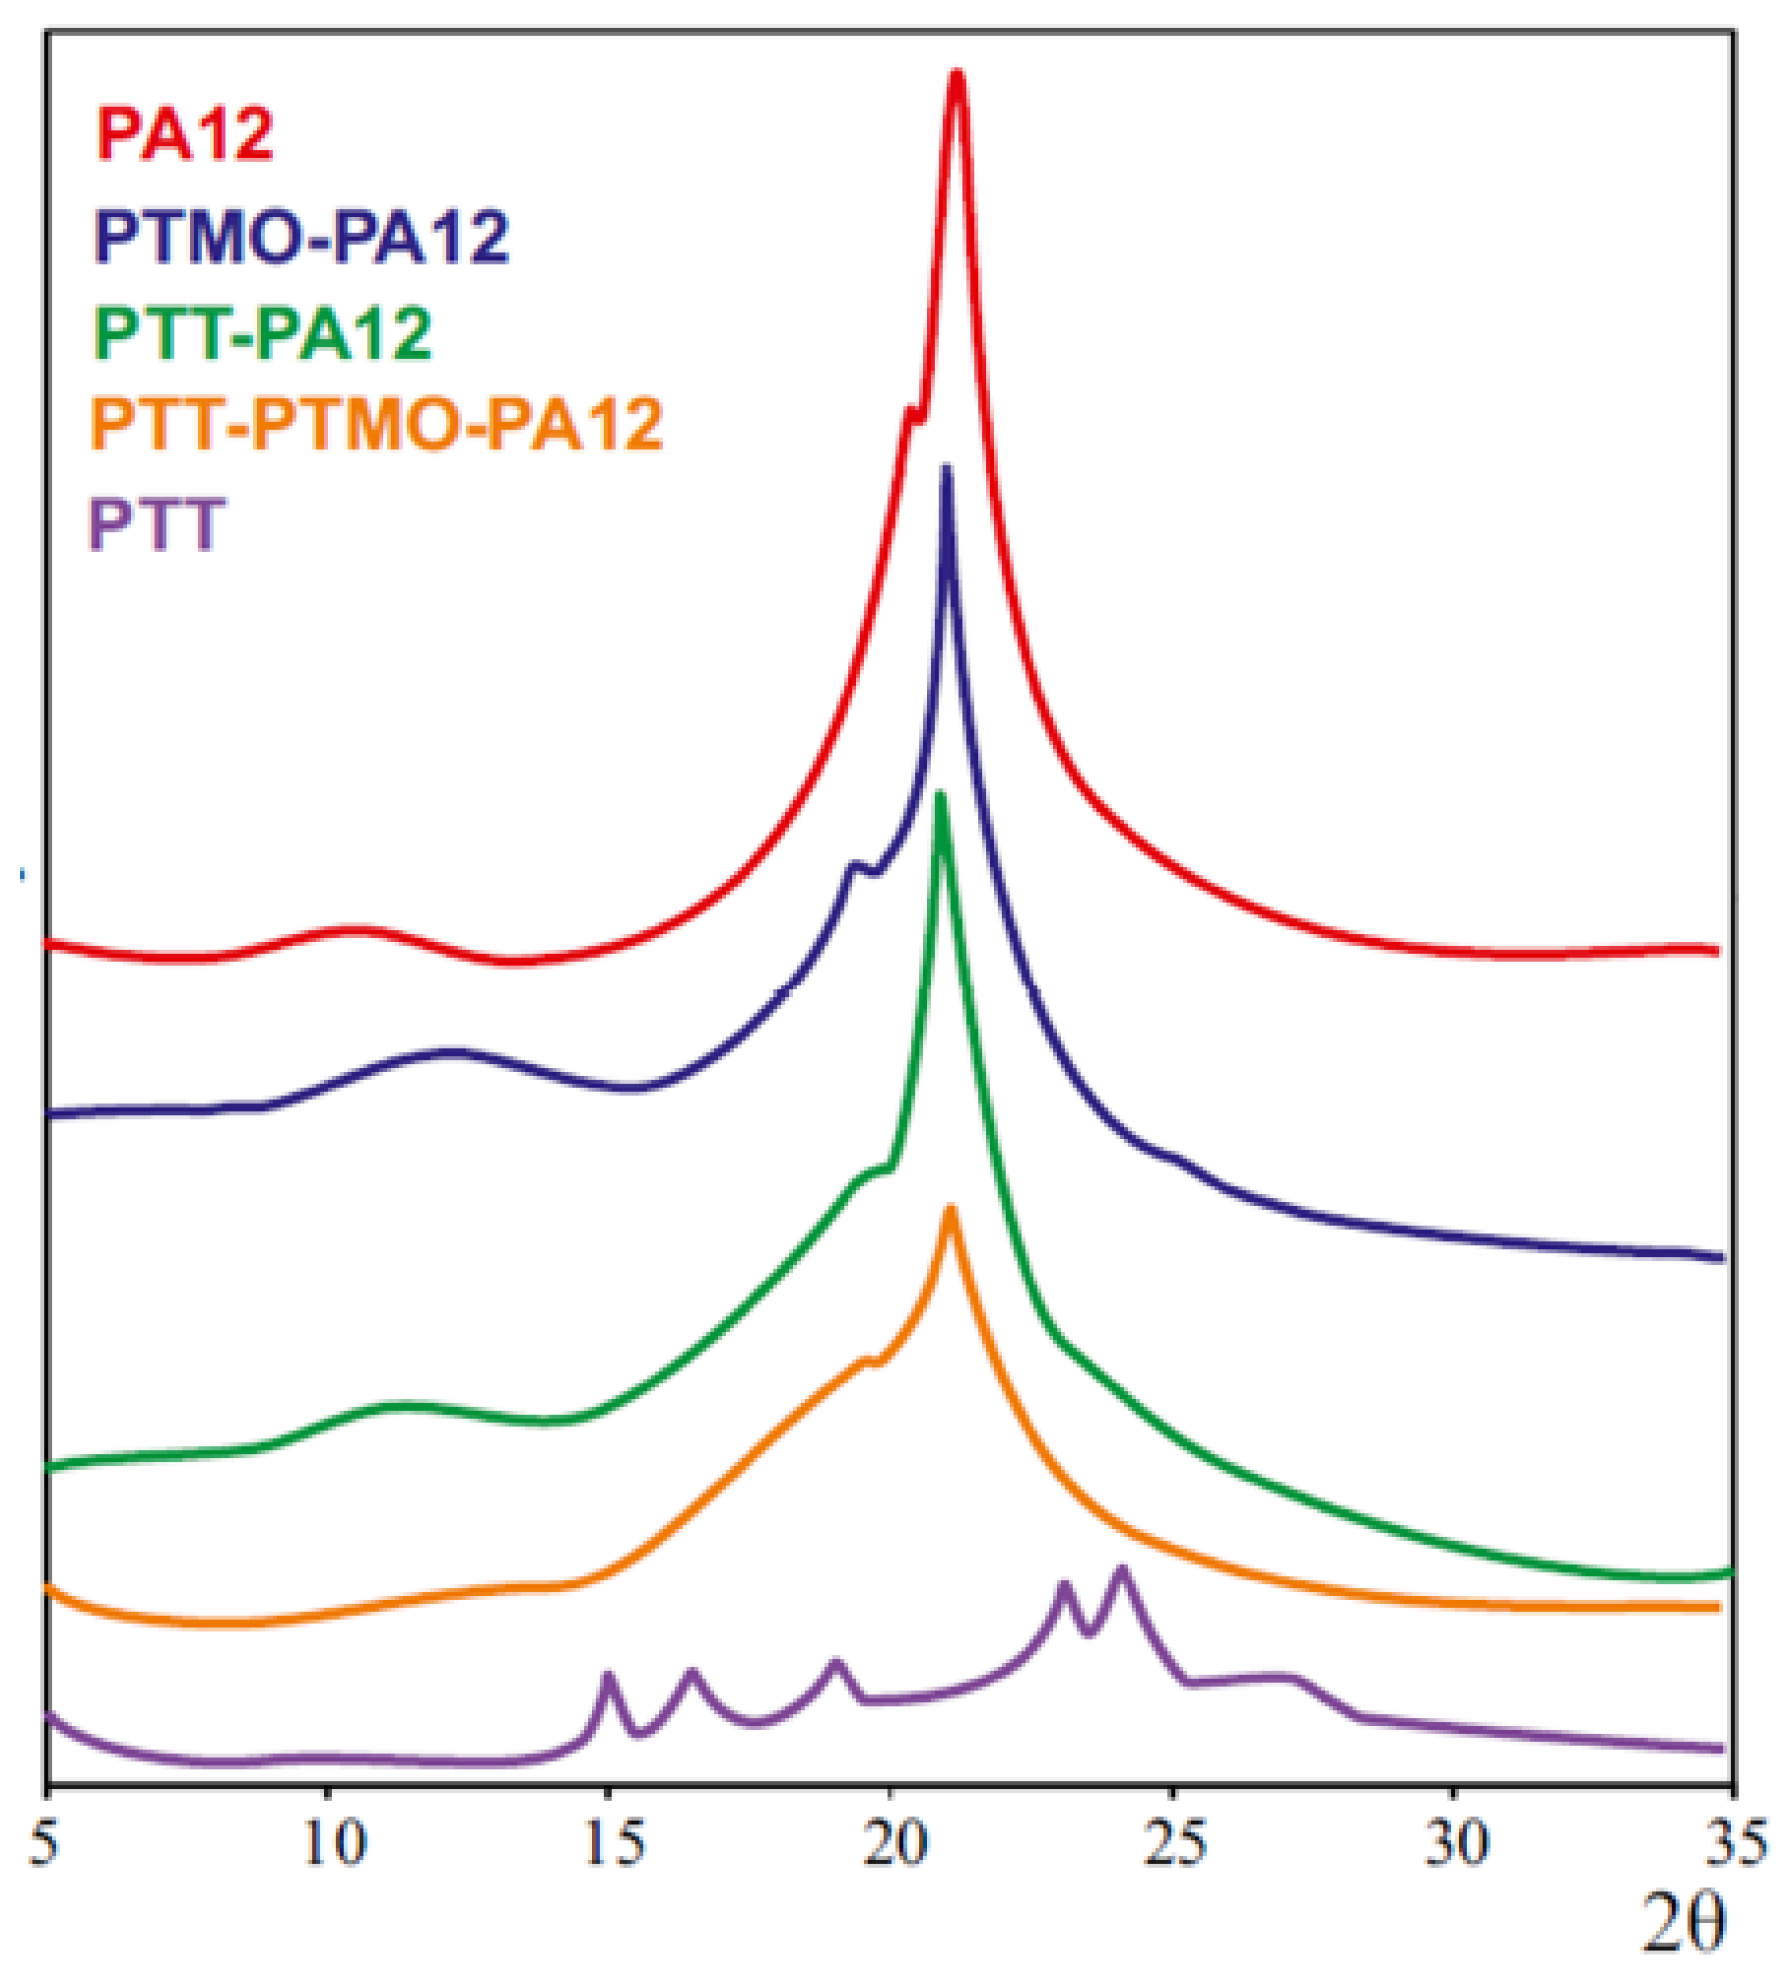
- Degree of crystallinity (wc) of the hard phase (Equation (2)):
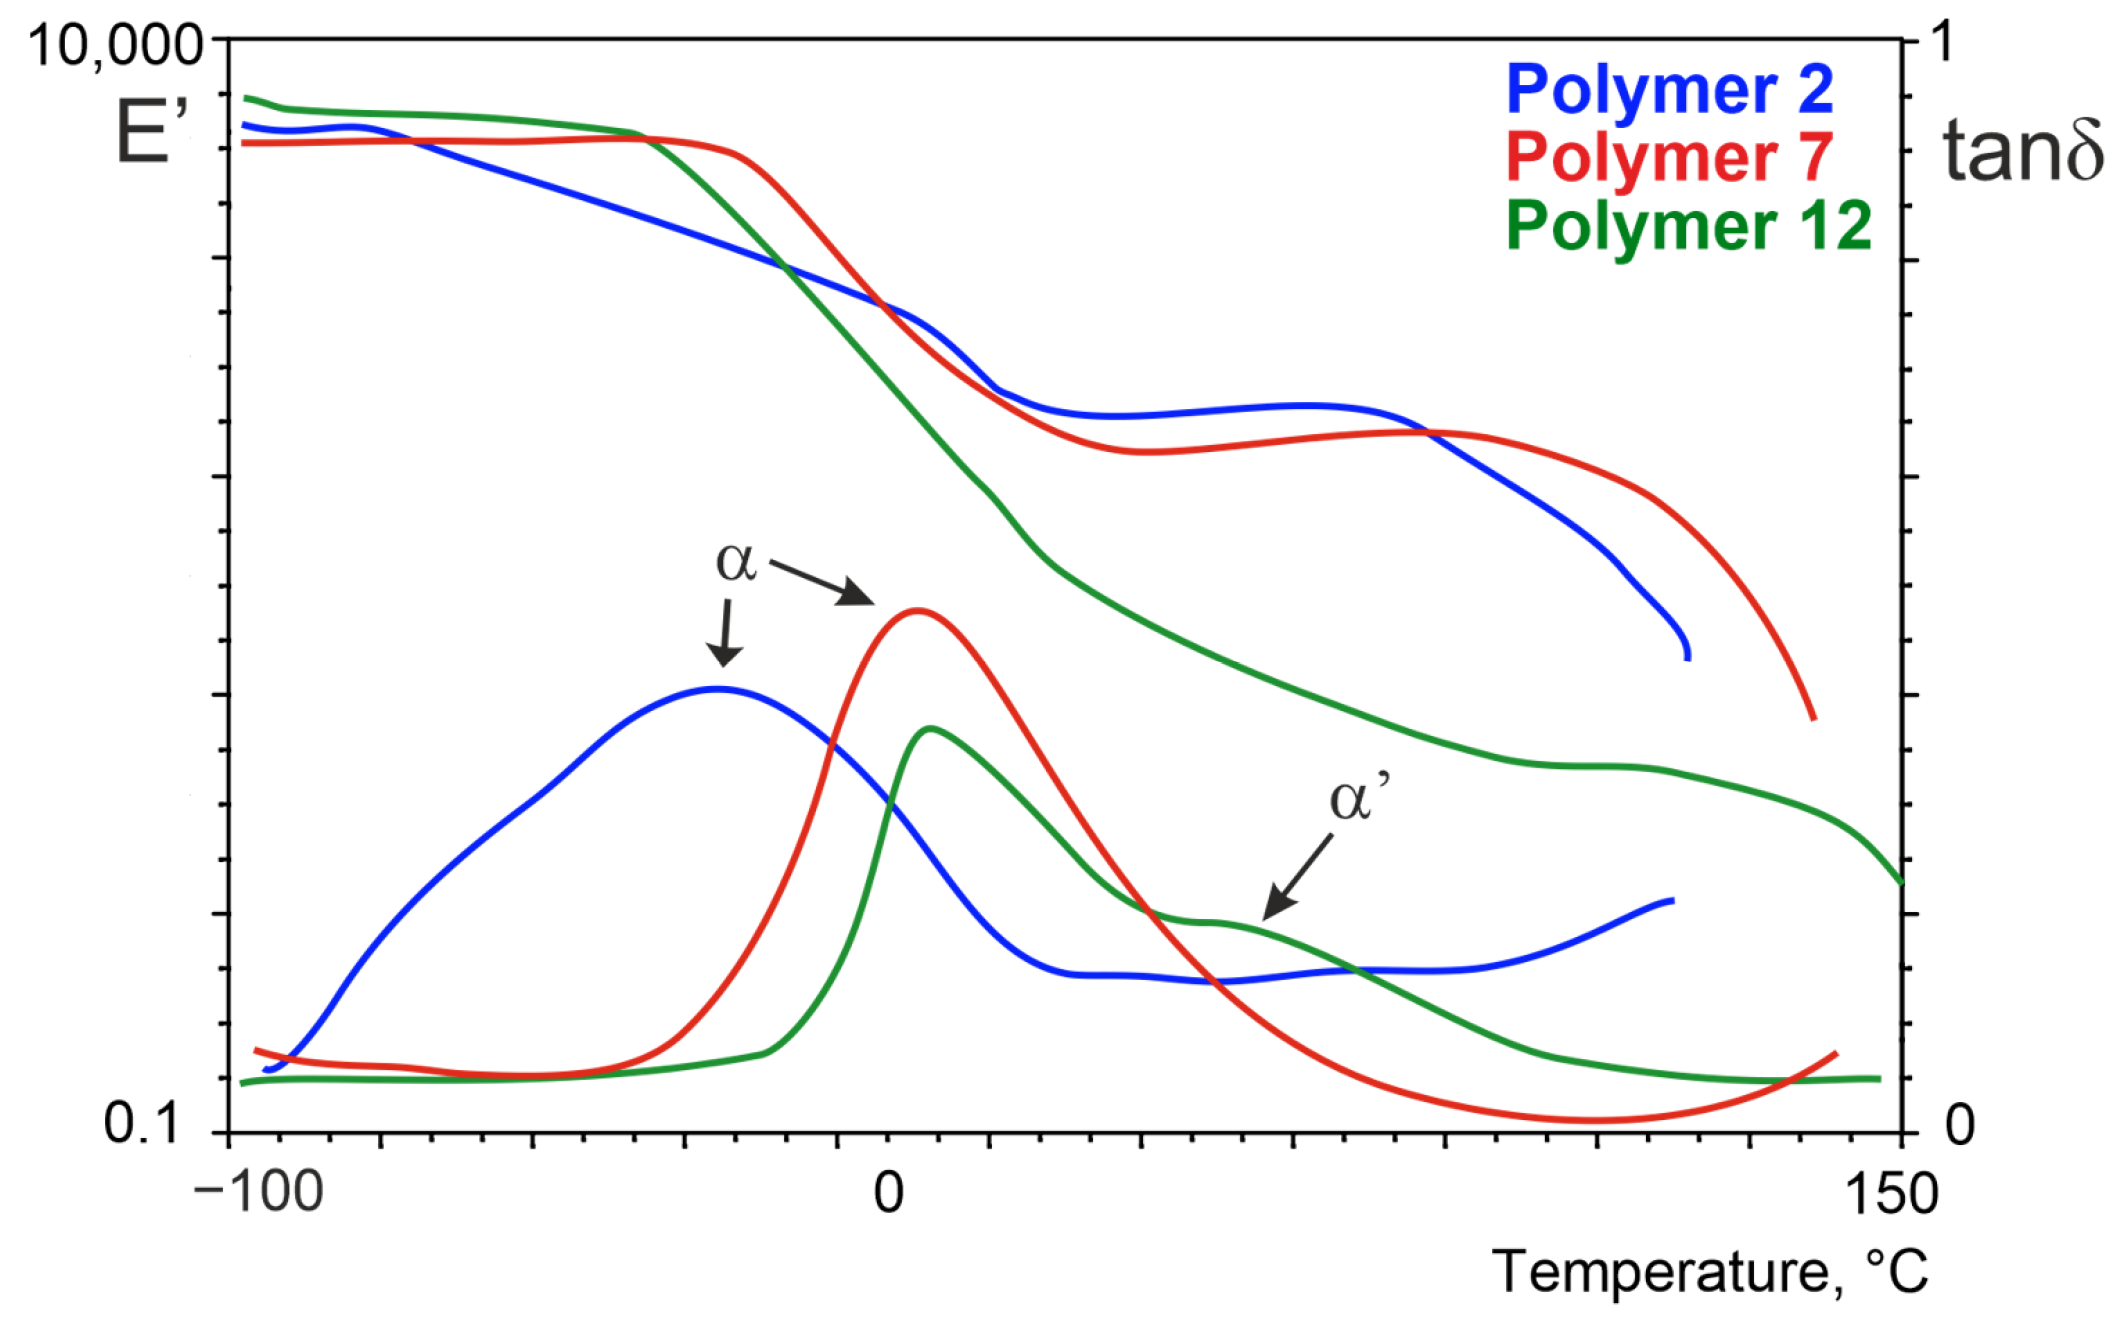
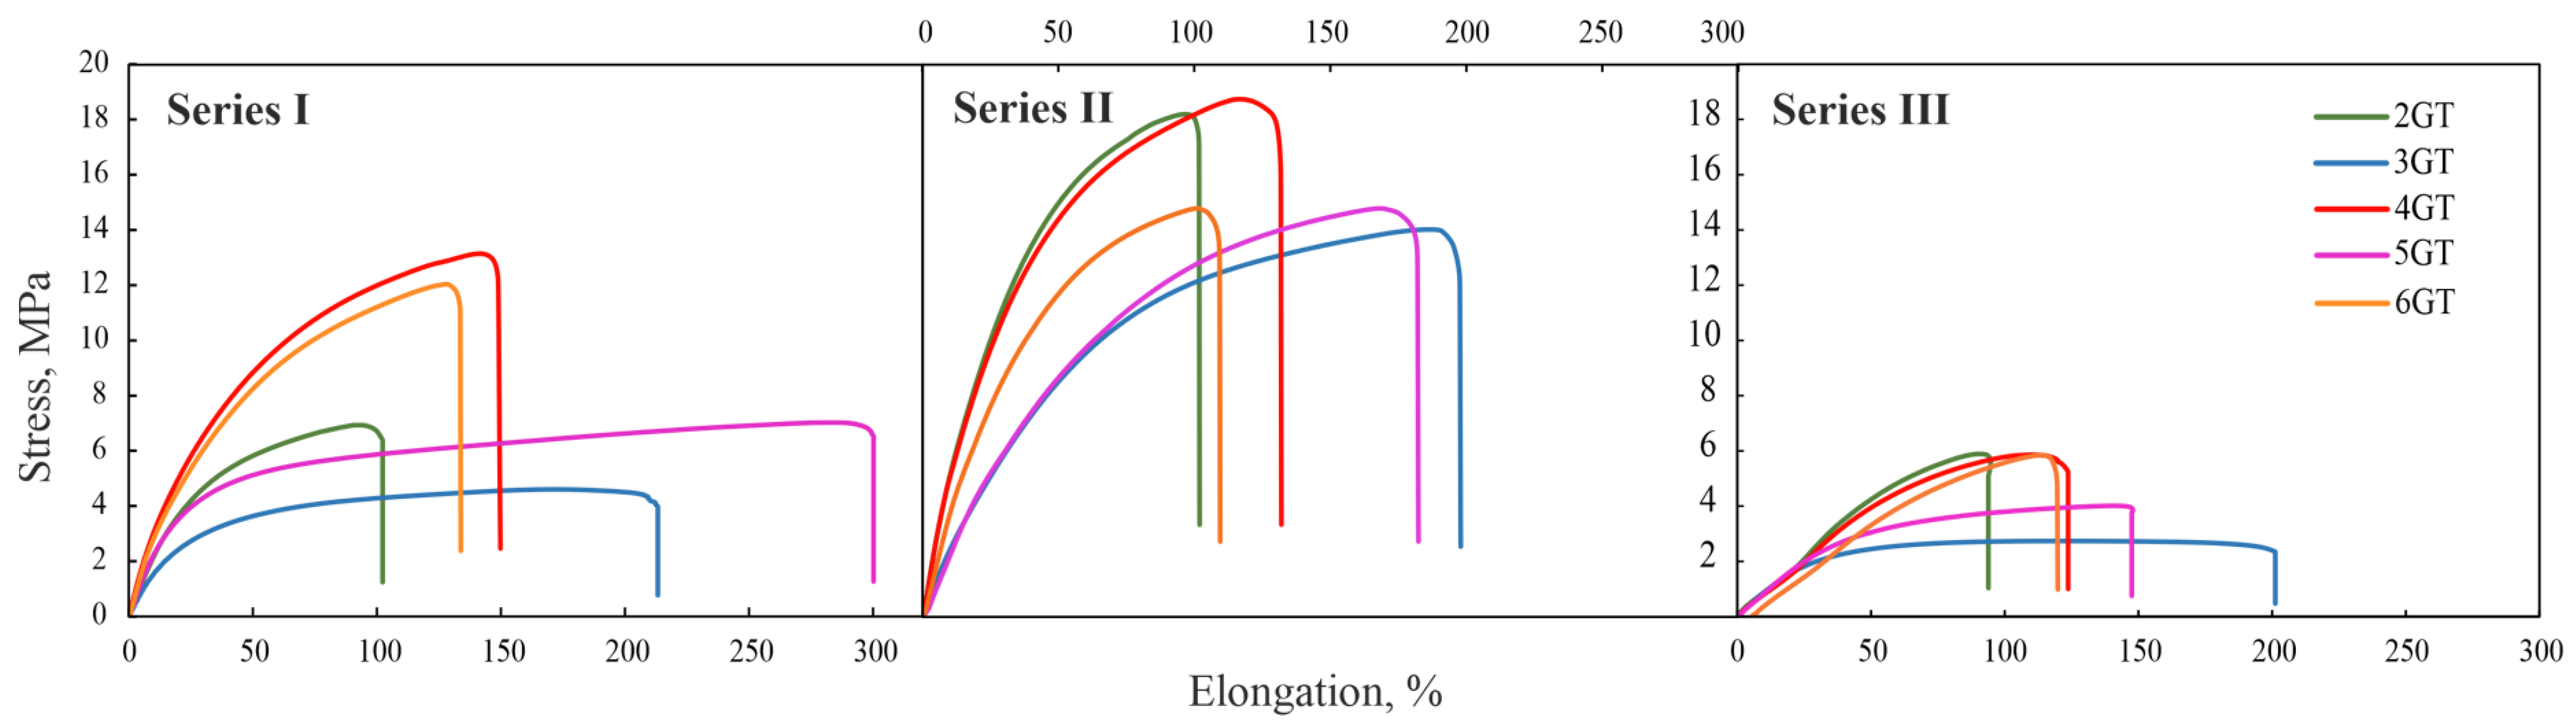
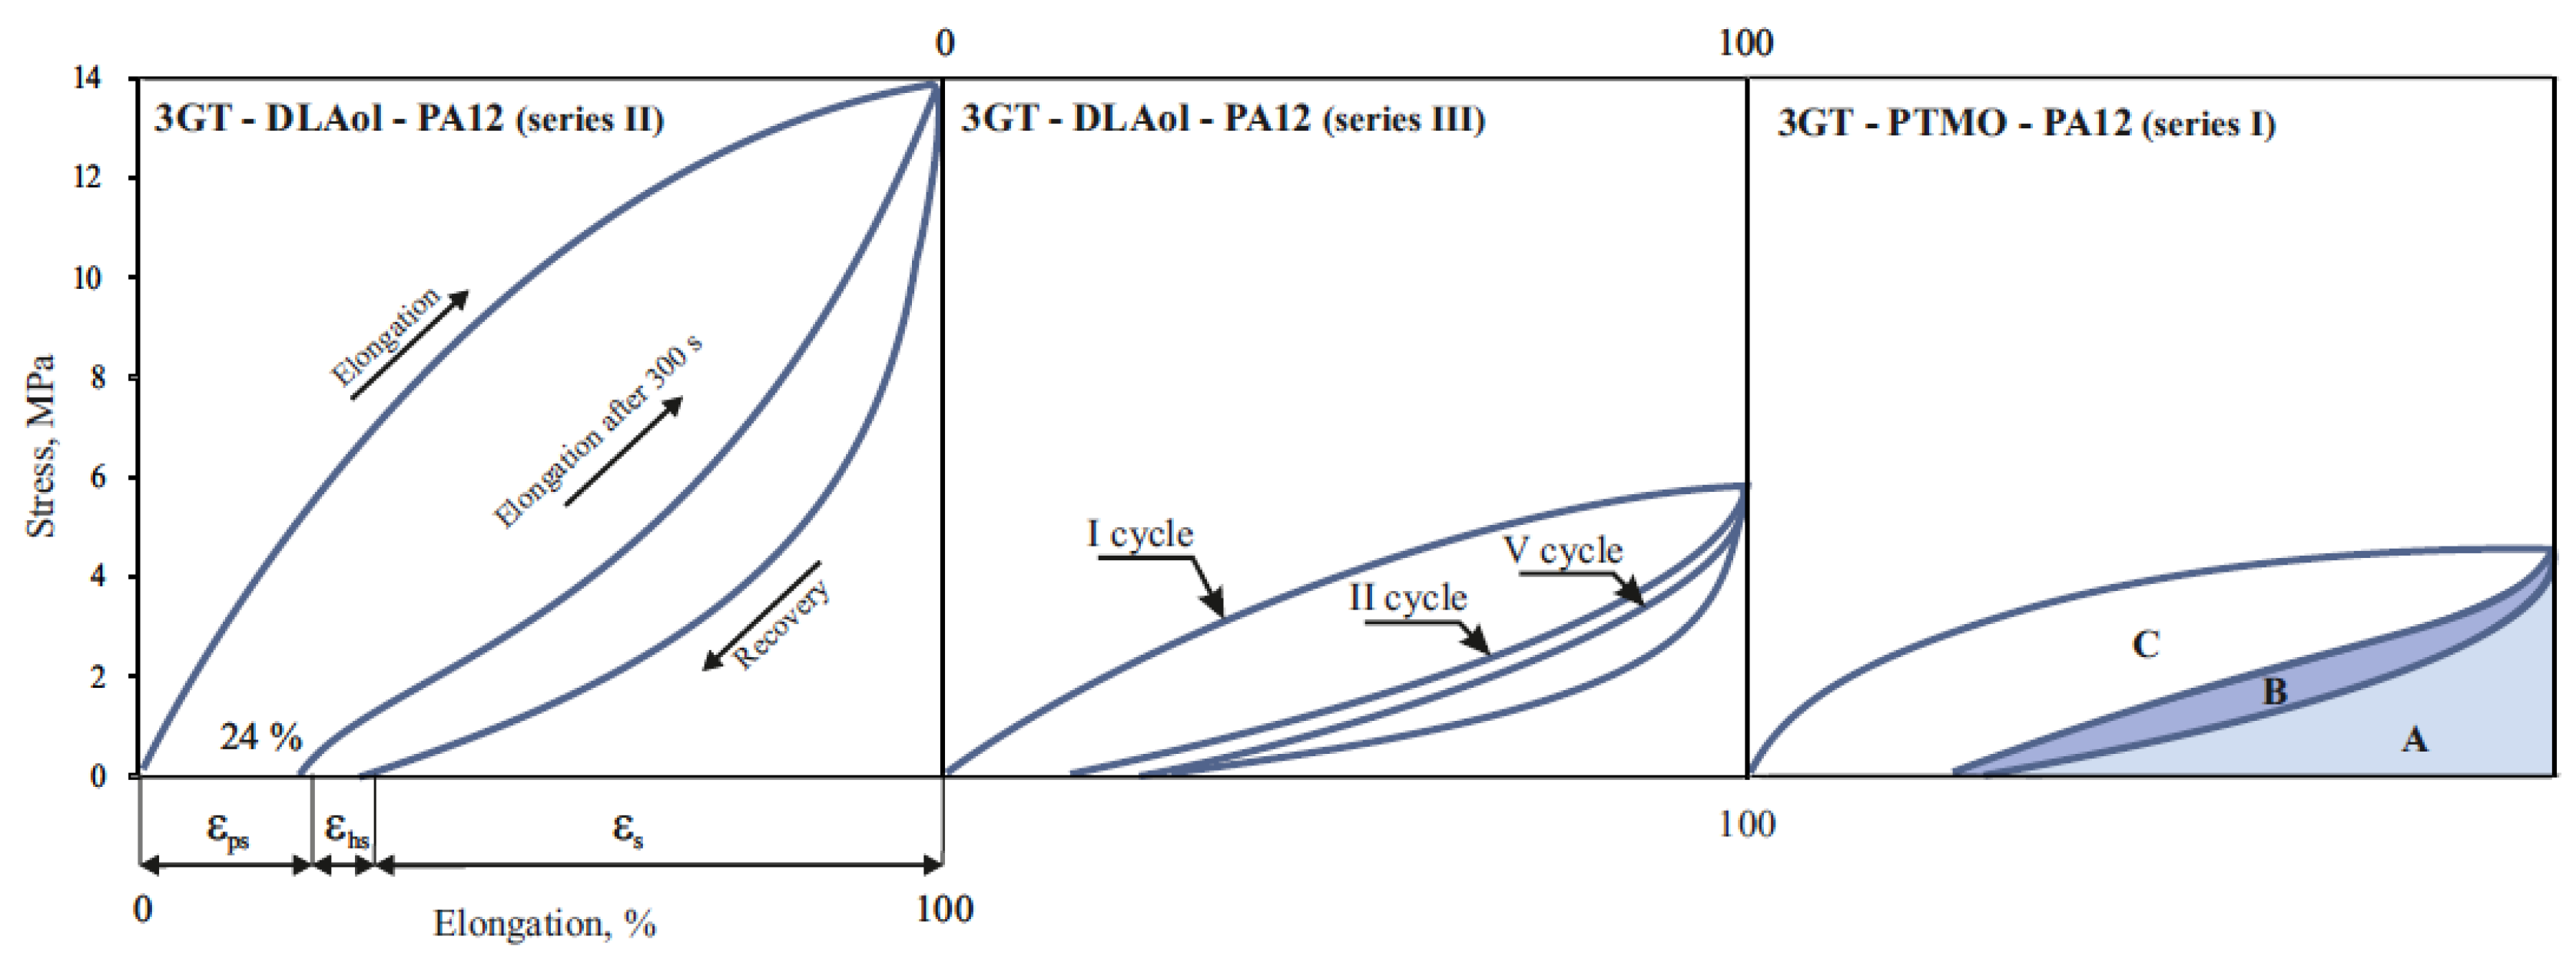
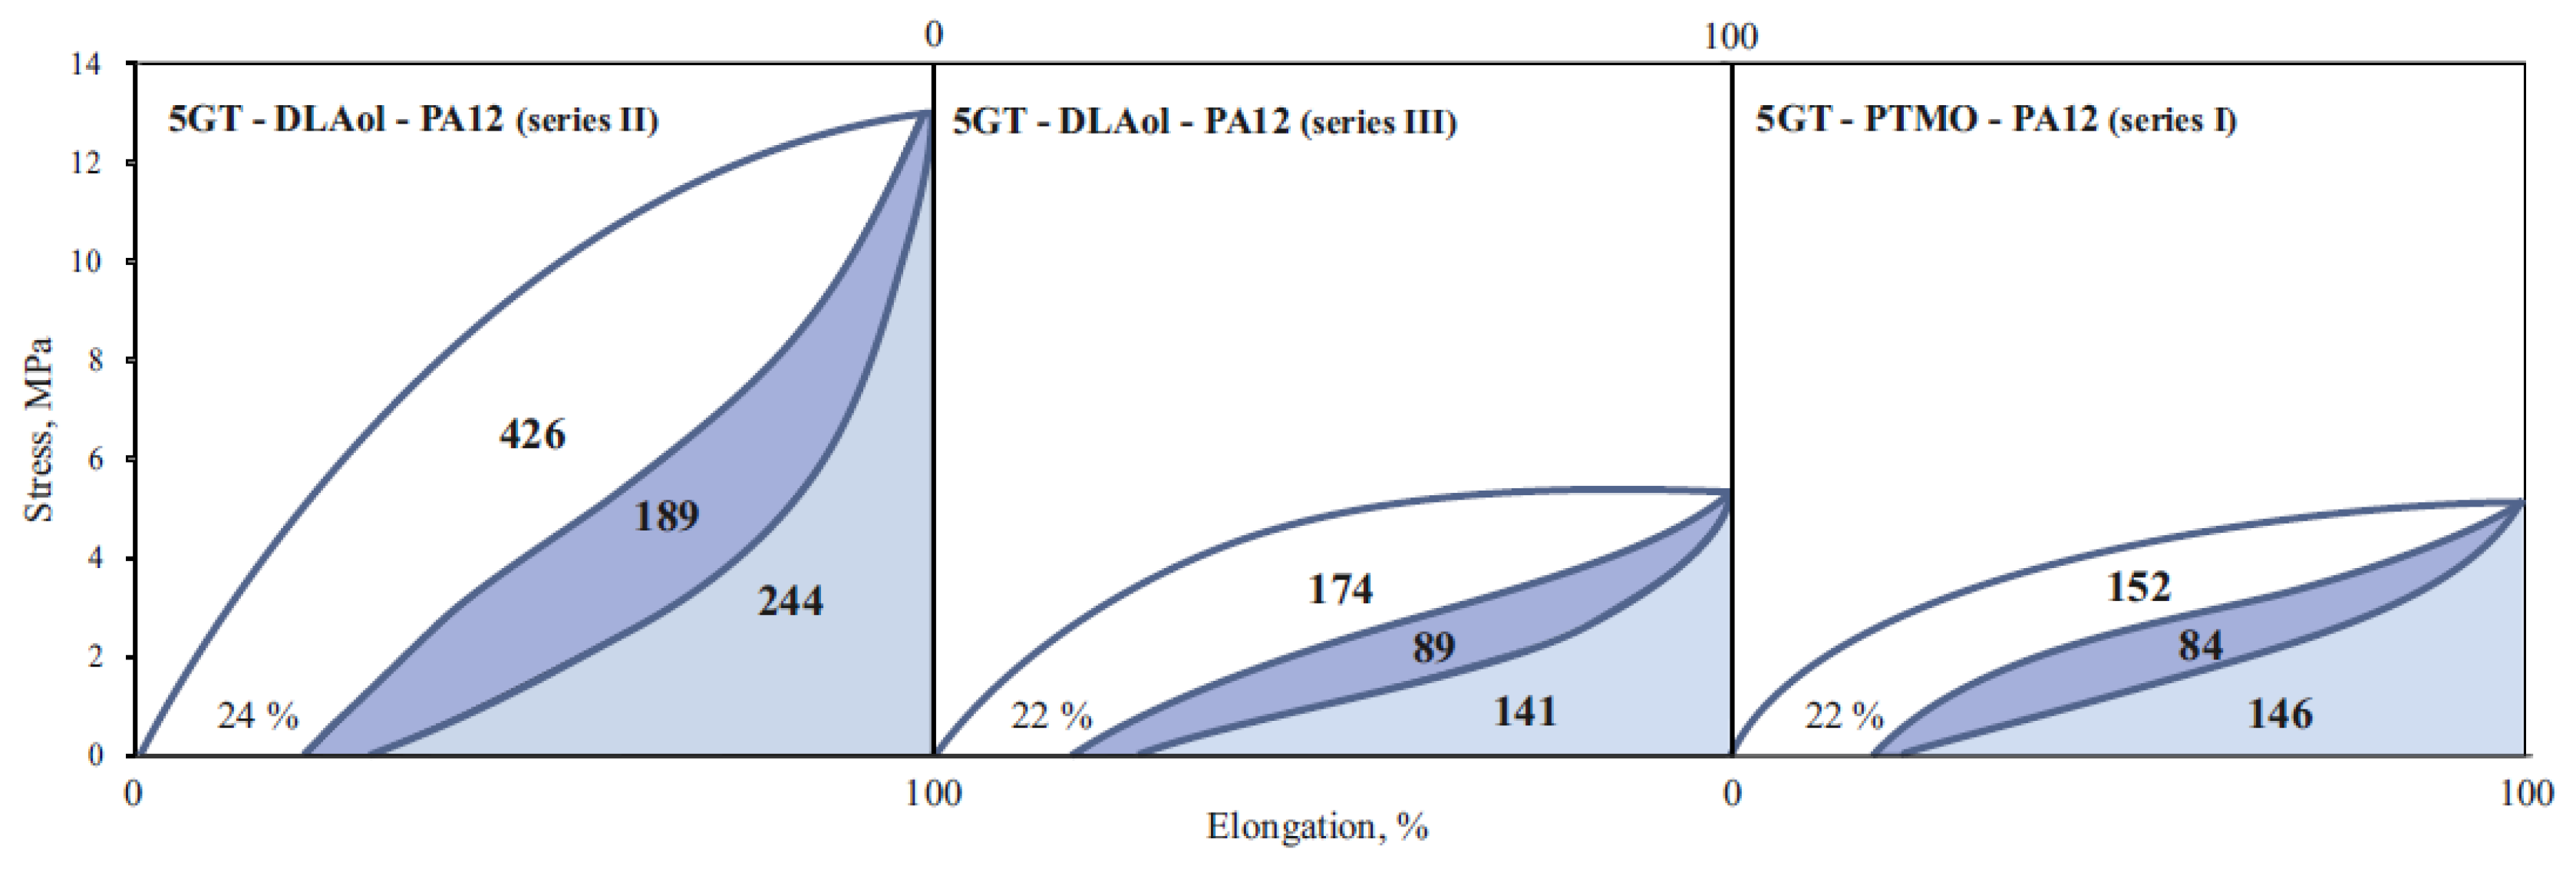
3.4. Mechanical Properties
4. Conclusions
Author Contributions
Funding
Institutional Review Board Statement
Informed Consent Statement
Data Availability Statement
Conflicts of Interest
Appendix A

| No. | Tg1, °C | ∆Cp1, J/g·°C | Tc1, °C | ∆Hc1, J/g | Tm1 °C | ∆Hm1, J/g | Tm2, °C | ∆Hm2, J/g | Tg2, °C | ∆Cp2, J/g·°C | Tc2, °C | ∆Hc2, J/g | Tm3, °C | ∆Hm3, J/g | Tm2-Tg1 |
|---|---|---|---|---|---|---|---|---|---|---|---|---|---|---|---|
| 1 | −72 | 0.18 | - | - | −5 | 8 | 49 | 1.9 | 49 | 0.08 | 55 | 14.15 | 122 | 12.3 | 194 |
| 2 | −73 | 0.28 | - | - | −2 | 0.21 | 53 | 2.14 | 45 | 0.02 | 33 | 14.66 | 108 | 4.32 | 181 |
| 3 | −72 | 0.16 | - | - | −1 | 0.32 | 61 | 3.24 | 54 | 0.02 | 59 | 15.74 | 133 | 14.07 | 205 |
| 4 | −73 | 0.29 | - | - | 4 | 5.15 | 53 | 1.37 | 57 | 0.03 | 60 | 13.23 | 127 | 11.63 | 200 |
| 5 | −79 | 0.26 | - | - | 4 | 7.32 | 59 | 4.49 | 60 | 0.15 | 76 | 25.25 | 133 | 18.59 | 212 |
| No. | Tg1, °C | ∆Cp1, J/g·°C | Tc1, °C | ∆Hc1, J/g | Tm1 °C | ∆Hm1, J/g | Tm2, °C | ∆Hm2, J/g | Tg2, °C | ∆Cp2, J/g·°C | Tc2, °C | ∆Hc2, J/g | Tm3, °C | ∆Hm3, J/g | Tm2-Tg1 |
|---|---|---|---|---|---|---|---|---|---|---|---|---|---|---|---|
| 6 | −21 | 0.12 | - | - | - | - | 57 | 3.67 | - | - | 44 | 14.56 | 122 | 13.93 | 143 |
| 7 | −20 | 0.15 | - | - | - | - | 56 | 4.16 | - | - | 26 | 11.75 | 112 | 7.236 | 132 |
| 8 | −21 | 0.13 | - | - | - | - | 55 | 2.84 | - | - | 53 | 18.40 | 130 | 17.40 | 151 |
| 9 | −21 | 0.12 | - | - | - | - | 56 | 4.23 | - | - | 35 | 13.05 | 115 | 10.29 | 136 |
| 10 | −23 | 0.17 | - | - | - | - | 56 | 3.35 | - | - | 53 | 17.57 | 129 | 15.67 | 152 |
| No. | Tg1, °C | ∆Cp1, J/g·°C | Tc1, °C | ∆Hc1, J/g | Tm1 °C | ∆Hm1, J/g | Tm2, °C | ∆Hm2, J/g | Tg2, °C | ∆Cp2, J/g·°C | Tc2, °C | ∆Hc2, J/g | Tm3, °C | ∆Hm3, J/g | Tm2-Tg1 |
|---|---|---|---|---|---|---|---|---|---|---|---|---|---|---|---|
| 11 | −30 | 0.16 | - | - | - | - | 57 | 2.43 | - | - | 41 | 11.72 | 120 | 13.93 | 150 |
| 12 | −32 | 0.15 | - | - | - | - | 56 | 3.11 | - | - | 31 | 6.52 | 113 | 3.22 | 145 |
| 13 | −32 | 0.17 | - | - | - | - | 60 | 2.73 | - | - | 55 | 12.76 | 132 | 13.21 | 164 |
| 14 | −31 | 0.18 | - | - | - | - | 57 | 3.71 | - | - | 37 | 11.98 | 125 | 11.02 | 156 |
| 15 | −31 | 0.17 | - | - | - | - | 57 | 1.91 | - | - | 58 | 14.22 | 131 | 14.70 | 162 |
References
- Holden, G. Thermoplastic Elastomers. In Rubber Technology; Morton, M., Ed.; Springer: Boston, MA, USA, 1987; pp. 465–481. [Google Scholar]
- Holden, G. Thermoplastic Elastomers. In Encyclopedia of Polymer Science and Technology; Mark, H., Ed.; John Wiley & Sons, Inc.: Hoboken, NJ, USA, 2010; pp. 416–430. [Google Scholar] [CrossRef]
- Naskar, K.; Babu, R.R. Thermoplastic Elastomers (TPEs) and Thermoplastic Vulcanizates (TPVs). In Encyclopedia of Polymeric Nanomaterials; Kobayashi, S., Müllen, K., Eds.; Springer: Berlin, Germany, 2015; pp. 2517–2522. [Google Scholar] [CrossRef]
- Drobny, J.G. Processing Methods Applicable to Thermoplastic Elastomers. In Handbook of Thermoplastic Elastomers; Elsevier: Oxford, UK, 2007; pp. 33–173. [Google Scholar] [CrossRef]
- Grady, B.P.; Cooper, S.L.; Robertson, C.G. Thermoplastic Elastomers. In The Science and Technology of Rubber; Mark, J., Erman, B., Roland, M., Eds.; Elsevier Inc.: Oxford, UK, 2013; pp. 591–652. [Google Scholar] [CrossRef]
- McKeen, L.W. Fatigue and Tribological Properties of Plastics and Elastomers; William Andrew Publishing: Norwich, CT, USA, 2016. [Google Scholar] [CrossRef]
- Morton, M. Introduction to Polymer Science. In Rubber Technology; Morton, M., Ed.; Springer: Boston, MA, USA, 1987; pp. 1–19. [Google Scholar] [CrossRef]
- Shanks, R.; Kong, I. Thermoplastic Elastomers. In Thermoplastic Elastomers; El-Sonbati, A., Ed.; InTech: London, UK, 2012; pp. 137–154. [Google Scholar] [CrossRef] [Green Version]
- Ramon, J.; Saez, V.; Gomes, F.; Pinto, J.; Nele, M. Synthesis and Characterization of PEG-PBS Copolymers to Obtain Microspheres with Different Naproxen Release Profiles. Macromol. Symp. 2018, 380, 1–8. [Google Scholar] [CrossRef]
- Xiao, R.Z.; Zeng, Z.W.; Zhou, G.L.; Wang, J.J.; Li, F.Z.; Wang, A.M. Recent Advances in PEG-PLA Block Copolymer Nanoparticles. Int. J. Nanomed. 2010, 5, 1057–1065. [Google Scholar] [CrossRef] [Green Version]
- Nguyen, T.H.; Petchsuk, A.; Tangboriboonrat, P.; Opaprakasit, M.; Sharp, A.; Opaprakasit, P. Synthesis and Characterizations of PLLA/PEG Block Copolymers. Adv. Mater. Res. 2010, 93–94, 198–201. [Google Scholar] [CrossRef]
- van der Schuur, M.; Feijen, J.; Gaymans, R.J. Synthesis and Characterization of Bisester-Amide Segments of Uniform and Random Length. Polymer 2005, 46, 4584–4595. [Google Scholar] [CrossRef]
- Armstrong, S.; Freeman, B.; Hiltner, A.; Baer, E. Gas Permeability of Melt-Processed Poly(Ether Block Amide) Copolymers and the Effects of Orientation. Polymer 2012, 53, 1383–1392. [Google Scholar] [CrossRef]
- Szymczyk, A.; Nastalczyk, J.; Sablong, R.J.; Roslaniec, Z. The Influence of Soft Segment Length on Structure and Properties of Poly(Trimethylene Terephthalate)-Block-Poly(Tetramethylene Oxide) Segmented Random Copolymers. Polym. Adv. Technol. 2011, 22, 72–83. [Google Scholar] [CrossRef]
- Paszkiewicz, S.; Szymczyk, A.; Pawlikowska, D.; Irska, I.; Taraghi, I.; Pilawka, R.; Gu, J.; Li, X.; Tu, Y.; Piesowicz, E. Synthesis and Characterization of Poly(Ethylene Terephthalate-: Co -1,4-Cyclohexanedimethylene Terephthalate)- Block -Poly(Tetramethylene Oxide) Copolymers. RSC Adv. 2017, 7, 41745–41754. [Google Scholar] [CrossRef] [Green Version]
- Sakurai, S.; Nokuwa, S.; Morimoto, M.; Shibayama, M.; Nomura, S. Changes in Structure and Properties Due to Mechanical Fatigue for Polyurethanes Containing Poly(Dimethyl Siloxane). Polymer 1994, 35, 532–539. [Google Scholar] [CrossRef]
- Jiang, J.; Tang, Q.; Pan, X.; Li, J.; Zhao, L.; Xi, Z.; Yuan, W. Facile Synthesis of Thermoplastic Polyamide Elastomers Based on Amorphous Polyetheramine with Damping Performance. Polymers 2021, 13, 2645. [Google Scholar] [CrossRef]
- van Hutten, P.F.; Walch, E.; Veeken, A.H.M.; Gaymans, R.J. Segmented Block Copolymers Based on Polyamide-4,6 and Poly(Propylene Oxide). Polymer 1990, 31, 524–529. [Google Scholar] [CrossRef] [Green Version]
- Mahallati, P.; Arefazar, A.; Naderi, G. Thermoplastic Elastomer Nanocomposites Based on PA6/NBR. Int. Polym. Process. 2010, 25, 132–138. [Google Scholar] [CrossRef]
- Zolali, A.M.; Heshmati, V.; Favis, B.D. Ultratough Co-Continuous PLA/PA11 by Interfacially Percolated Poly(Ether-b-Amide). Macromolecules 2017, 50, 264–274. [Google Scholar] [CrossRef]
- Kucera, L.R.; Brei, M.R.; Storey, R.F. Synthesis and Characterization of Polyisobutylene-b-Polyamide Multi-Block Copolymer Thermoplastic Elastomers. Polymer 2013, 54, 3796–3805. [Google Scholar] [CrossRef]
- Rault, J.; le Huy, H.M. Polyamide-Polyether Block Copolymers Swollen by Water. I. Properties. J. Macromol. Sci. Part B 1996, 35, 89–114. [Google Scholar] [CrossRef]
- Rached, R.; Hoppe, S.; Jonquieres, A.; Lochon, P.; Pla, F. A New Macroinitiator for the Synthesis of Triblock Copolymers PA12-b-PDMS-b-PA12. J. Appl. Polym. Sci. 2006, 102, 2818–2831. [Google Scholar] [CrossRef]
- Scalfani, V.F.; Turner, C.H.; Rupar, P.A.; Jenkins, A.H.; Bara, J.E. 3D Printed Block Copolymer Nanostructures. J. Chem. Educ. 2015, 92, 1866–1870. [Google Scholar] [CrossRef]
- Tseng, Y.C.; Darling, S.B. Block Copolymer Nanostructures for Technology. Polymers 2010, 2, 470–489. [Google Scholar] [CrossRef] [Green Version]
- Botiz, I.; Darling, S.B. Optoelectronics Using Block Copolymers. Mater. Today 2010, 13, 42–51. [Google Scholar] [CrossRef]
- Ahn, J.H.; Zin, W.C. Structure of Shear-Induced Perforated Layer Phase in Styrene-Isoprene Diblock Copolymer Melts. Macromolecules 2000, 33, 641–644. [Google Scholar] [CrossRef]
- Beardsley, T.M.; Matsen, M.W. Monte Carlo Phase Diagram for Diblock Copolymer Melts. Eur. Phys. J. E 2010, 32, 255–264. [Google Scholar] [CrossRef]
- Bates, M.W.; Lequieu, J.; Barbon, S.M.; Lewis, R.M.; Delaney, K.T.; Anastasaki, A.; Hawker, C.J.; Fredrickson, G.H.; Bates, C.M. Stability of the A15 Phase in Diblock Copolymer Melts. Proc. Natl. Acad. Sci. USA 2019, 116, 13194–13199. [Google Scholar] [CrossRef] [PubMed] [Green Version]
- Shi, A.-C. Self-Consistent Field Theory of Block Copolymers. In Developments in Block Copolymer Science and Technology; Hamley, I.W., Ed.; John Wiley & Sons: Chichester, UK, 2004; pp. 265–293. [Google Scholar] [CrossRef]
- Cho, J. Pressure Effects on Nanostructure Development of ABC Triblock Copolymers. Polymer 2016, 97, 589–597. [Google Scholar] [CrossRef]
- Robbins, S.W.; Beaucage, P.A.; Sai, H.; Tan, K.W.; Werner, J.G.; Sethna, J.P.; DiSalvo, F.J.; Gruner, S.M.; van Dover, R.B.; Wiesner, U. Block Copolymer Self-Assembly-Directed Synthesis of Mesoporous Gyroidal Superconductors. Sci. Adv. 2016, 2, 1–8. [Google Scholar] [CrossRef] [Green Version]
- Xu, Z.; Lin, J.; Zhang, Q.; Wang, L.; Tian, X. Theoretical Simulations of Nanostructures Self-Assembled from Copolymer Systems. Polym. Chem. 2016, 7, 3783–3811. [Google Scholar] [CrossRef]
- Deng, Y.; Wei, J.; Sun, Z.; Zhao, D. Large-Pore Ordered Mesoporous Materials Templated from Non-Pluronic Amphiphilic Block Copolymers. Chem. Soc. Rev. 2013, 42, 4054–4070. [Google Scholar] [CrossRef] [PubMed]
- Li, M.; Liu, Y.; Bansil, R. Kinetics of Hexagonal Cylinders to Face-Centered Cubic Spheres Transition of Triblock Copolymer in Selective Solvent: Brownian Dynamics Simulation. J. Chem. Phys. 2010, 133, 84905–84914. [Google Scholar] [CrossRef] [PubMed] [Green Version]
- Bates, F.S. Network Phases in Block Copolymer Melts. MRS Bull. 2005, 30, 525–532. [Google Scholar] [CrossRef]
- Sakurai, S. Recent Developments in Polymer Applications of Synchrotron Small-Angle X-Ray Scattering. Polym. Int. 2017, 66, 237–249. [Google Scholar] [CrossRef]
- Löbling, T.I.; Hiekkataipale, P.; Hanisch, A.; Bennet, F.; Schmalz, H.; Ikkala, O.; Gröschel, A.H.; Müller, A.H.E. Bulk Morphologies of Polystyrene-Block-Polybutadiene-Block-Poly(Tert-Butyl Methacrylate) Triblock Terpolymers. Polymer 2015, 72, 479–489. [Google Scholar] [CrossRef]
- Ukielski, R. Terpoly(Ester-b-Ether-b-Amide) Thermoplastic Elastomers: Synthesis, Structure, and Properties. In Handbook of Condensation Thermoplastic Elastomers; Fakirov, S., Ed.; Wiley-VCH: Weinheim, Germany, 2006; pp. 117–140. [Google Scholar] [CrossRef]
- Paszkiewicz, S.; Szymczyk, A.; Špitalský, Z.; Mosnáček, J.; Kwiatkowski, K.; Rosłaniec, Z. Structure and Properties of Nanocomposites Based on PTT-Block-PTMO Copolymer and Graphene Oxide Prepared by in Situ Polymerization. Eur. Polym. J. 2014, 50, 69–77. [Google Scholar] [CrossRef] [Green Version]
- van Krevelen, D.W.; te Nijenhuis, K. Properties of Polymers; Elsevier: Oxford, UK, 2009. [Google Scholar] [CrossRef]
- Wang, Y.-Z. Solubility Parameters of Poly(Sulfonyldiphenylene Phenylphosphonate) and Its Miscibility with Poly(Ethylene Terephthalate). Polym Sci Part B Polym Phys 2003, 41, 2296–2301. [Google Scholar] [CrossRef]
- Kallitsis, J.K.; Sotiropoulou, D.D.; Kalfoglou, N.K. Compatibility of Poly(Ether Ester) Block Copolymers with Chlorinated Polyethylene. Polymer 1988, 29, 1233–1239. [Google Scholar] [CrossRef]
- Pukánszky, B.; Tüdõs, F. Miscibility and Mechanical Properties of Polymer Blends. Makromol. Chemie. Macromol. Symp. 1990, 38, 221–231. [Google Scholar] [CrossRef]
- Xie, M.; Camberlin, Y. Etude Morphologique de Bloc-Copoly(Éther-Amide)s. Die Makromol. Chem. 1986, 187, 383–400. [Google Scholar] [CrossRef]
- Wohlfarth, C. Solubility Parameter of Polyamide-12. In Polymer Solutions; Lechner, M.D., Arndt, K.F., Eds.; Springer Materials: Osnabrueck, Germany, 2010; pp. 872–873. [Google Scholar] [CrossRef]
- Hansen, C. Hansen Solubility Parameters: A User’s Handbook, 2nd ed.; CRC Press: Boca Raton, FL, USA, 2007. [Google Scholar]
- Korshak, V.V.; Vinogradova, S.V. Polyesters; Pergamon Press: Oxford, UK, 1965. [Google Scholar]
- Loman, A.J.B.; van der Does, L.; Bantjes, A.; Vulic, I. Effect of Methyl Groups on the Thermal Properties of Polyesters from Methyl Substituted 1,4-butanediols and 4,4′-biphenyldicarboxylic Acid. J. Polym. Sci. Part A Polym. Chem. 1995, 33, 493–504. [Google Scholar] [CrossRef] [Green Version]


| Sample | Glycol | Soft Block | msoft | mPA12 | mDMT | mxG | wsoft | wxGT | wPA12 | Series |
|---|---|---|---|---|---|---|---|---|---|---|
| 1 | 2G | PTMO | 3 | 1 | 5 | 9 | 0.520 | 0.133 | 0.347 | I |
| 2 | 3G | PTMO | 3 | 1 | 5 | 9 | 0.515 | 0.141 | 0.343 | |
| 3 | 4G | PTMO | 3 | 1 | 5 | 9 | 0.510 | 0.150 | 0.340 | |
| 4 | 5G | PTMO | 3 | 1 | 5 | 9 | 0.505 | 0.158 | 0.337 | |
| 5 | 6G | PTMO | 3 | 1 | 5 | 9 | 0.501 | 0.166 | 0.334 | |
| 6 | 2G | DLAol | 3 | 1 | 5 | 9 | 0.369 | 0.175 | 0.456 | II |
| 7 | 3G | DLAol | 3 | 1 | 5 | 9 | 0.365 | 0.185 | 0.450 | |
| 8 | 4G | DLAol | 3 | 1 | 5 | 9 | 0.360 | 0.196 | 0.444 | |
| 9 | 5G | DLAol | 3 | 1 | 5 | 9 | 0.356 | 0.204 | 0.440 | |
| 10 | 6G | DLAol | 3 | 1 | 5 | 9 | 0.352 | 0.214 | 0.434 | |
| 11 | 2G | DLAol | 5.5 | 1 | 5 | 9 | 0.518 | 0.134 | 0.349 | III |
| 12 | 3G | DLAol | 5.5 | 1 | 5 | 9 | 0.513 | 0.142 | 0.345 | |
| 13 | 4G | DLAol | 5.5 | 1 | 5 | 9 | 0.508 | 0.150 | 0.342 | |
| 14 | 5G | DLAol | 5.5 | 1 | 5 | 9 | 0.504 | 0.157 | 0.339 | |
| 15 | 6G | DLAol | 5.5 | 1 | 5 | 9 | 0.499 | 0.165 | 0.336 |
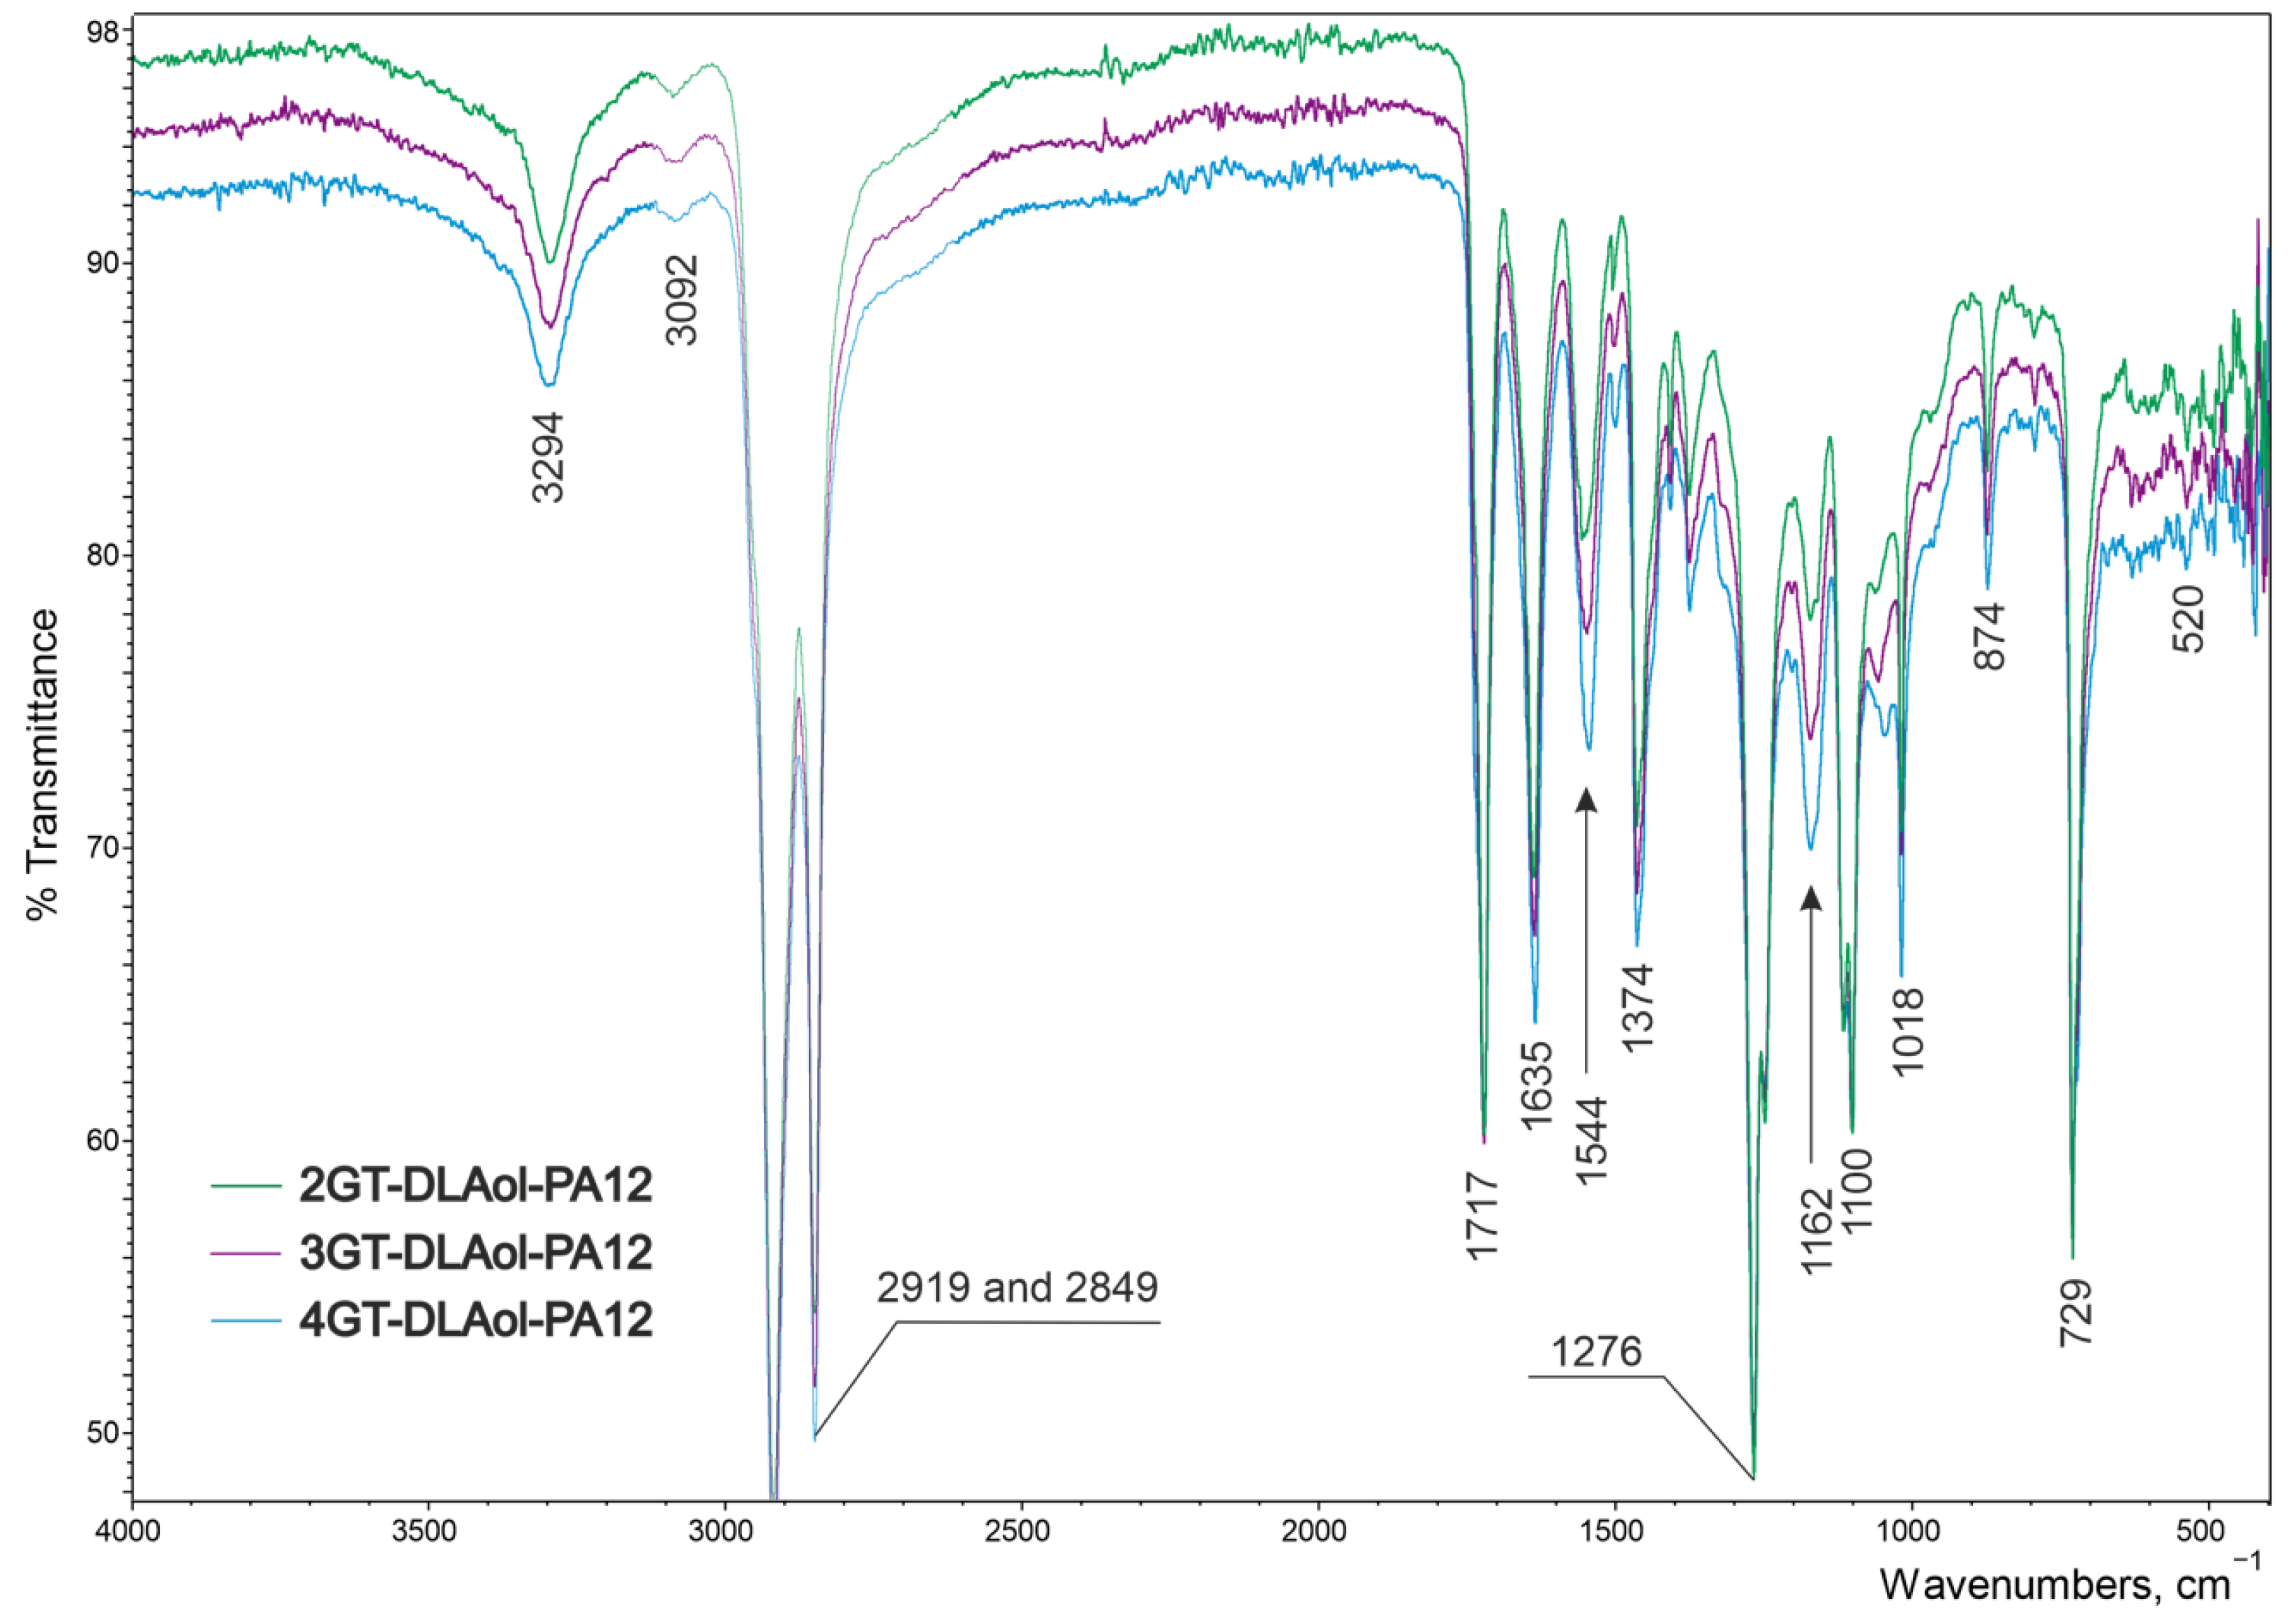
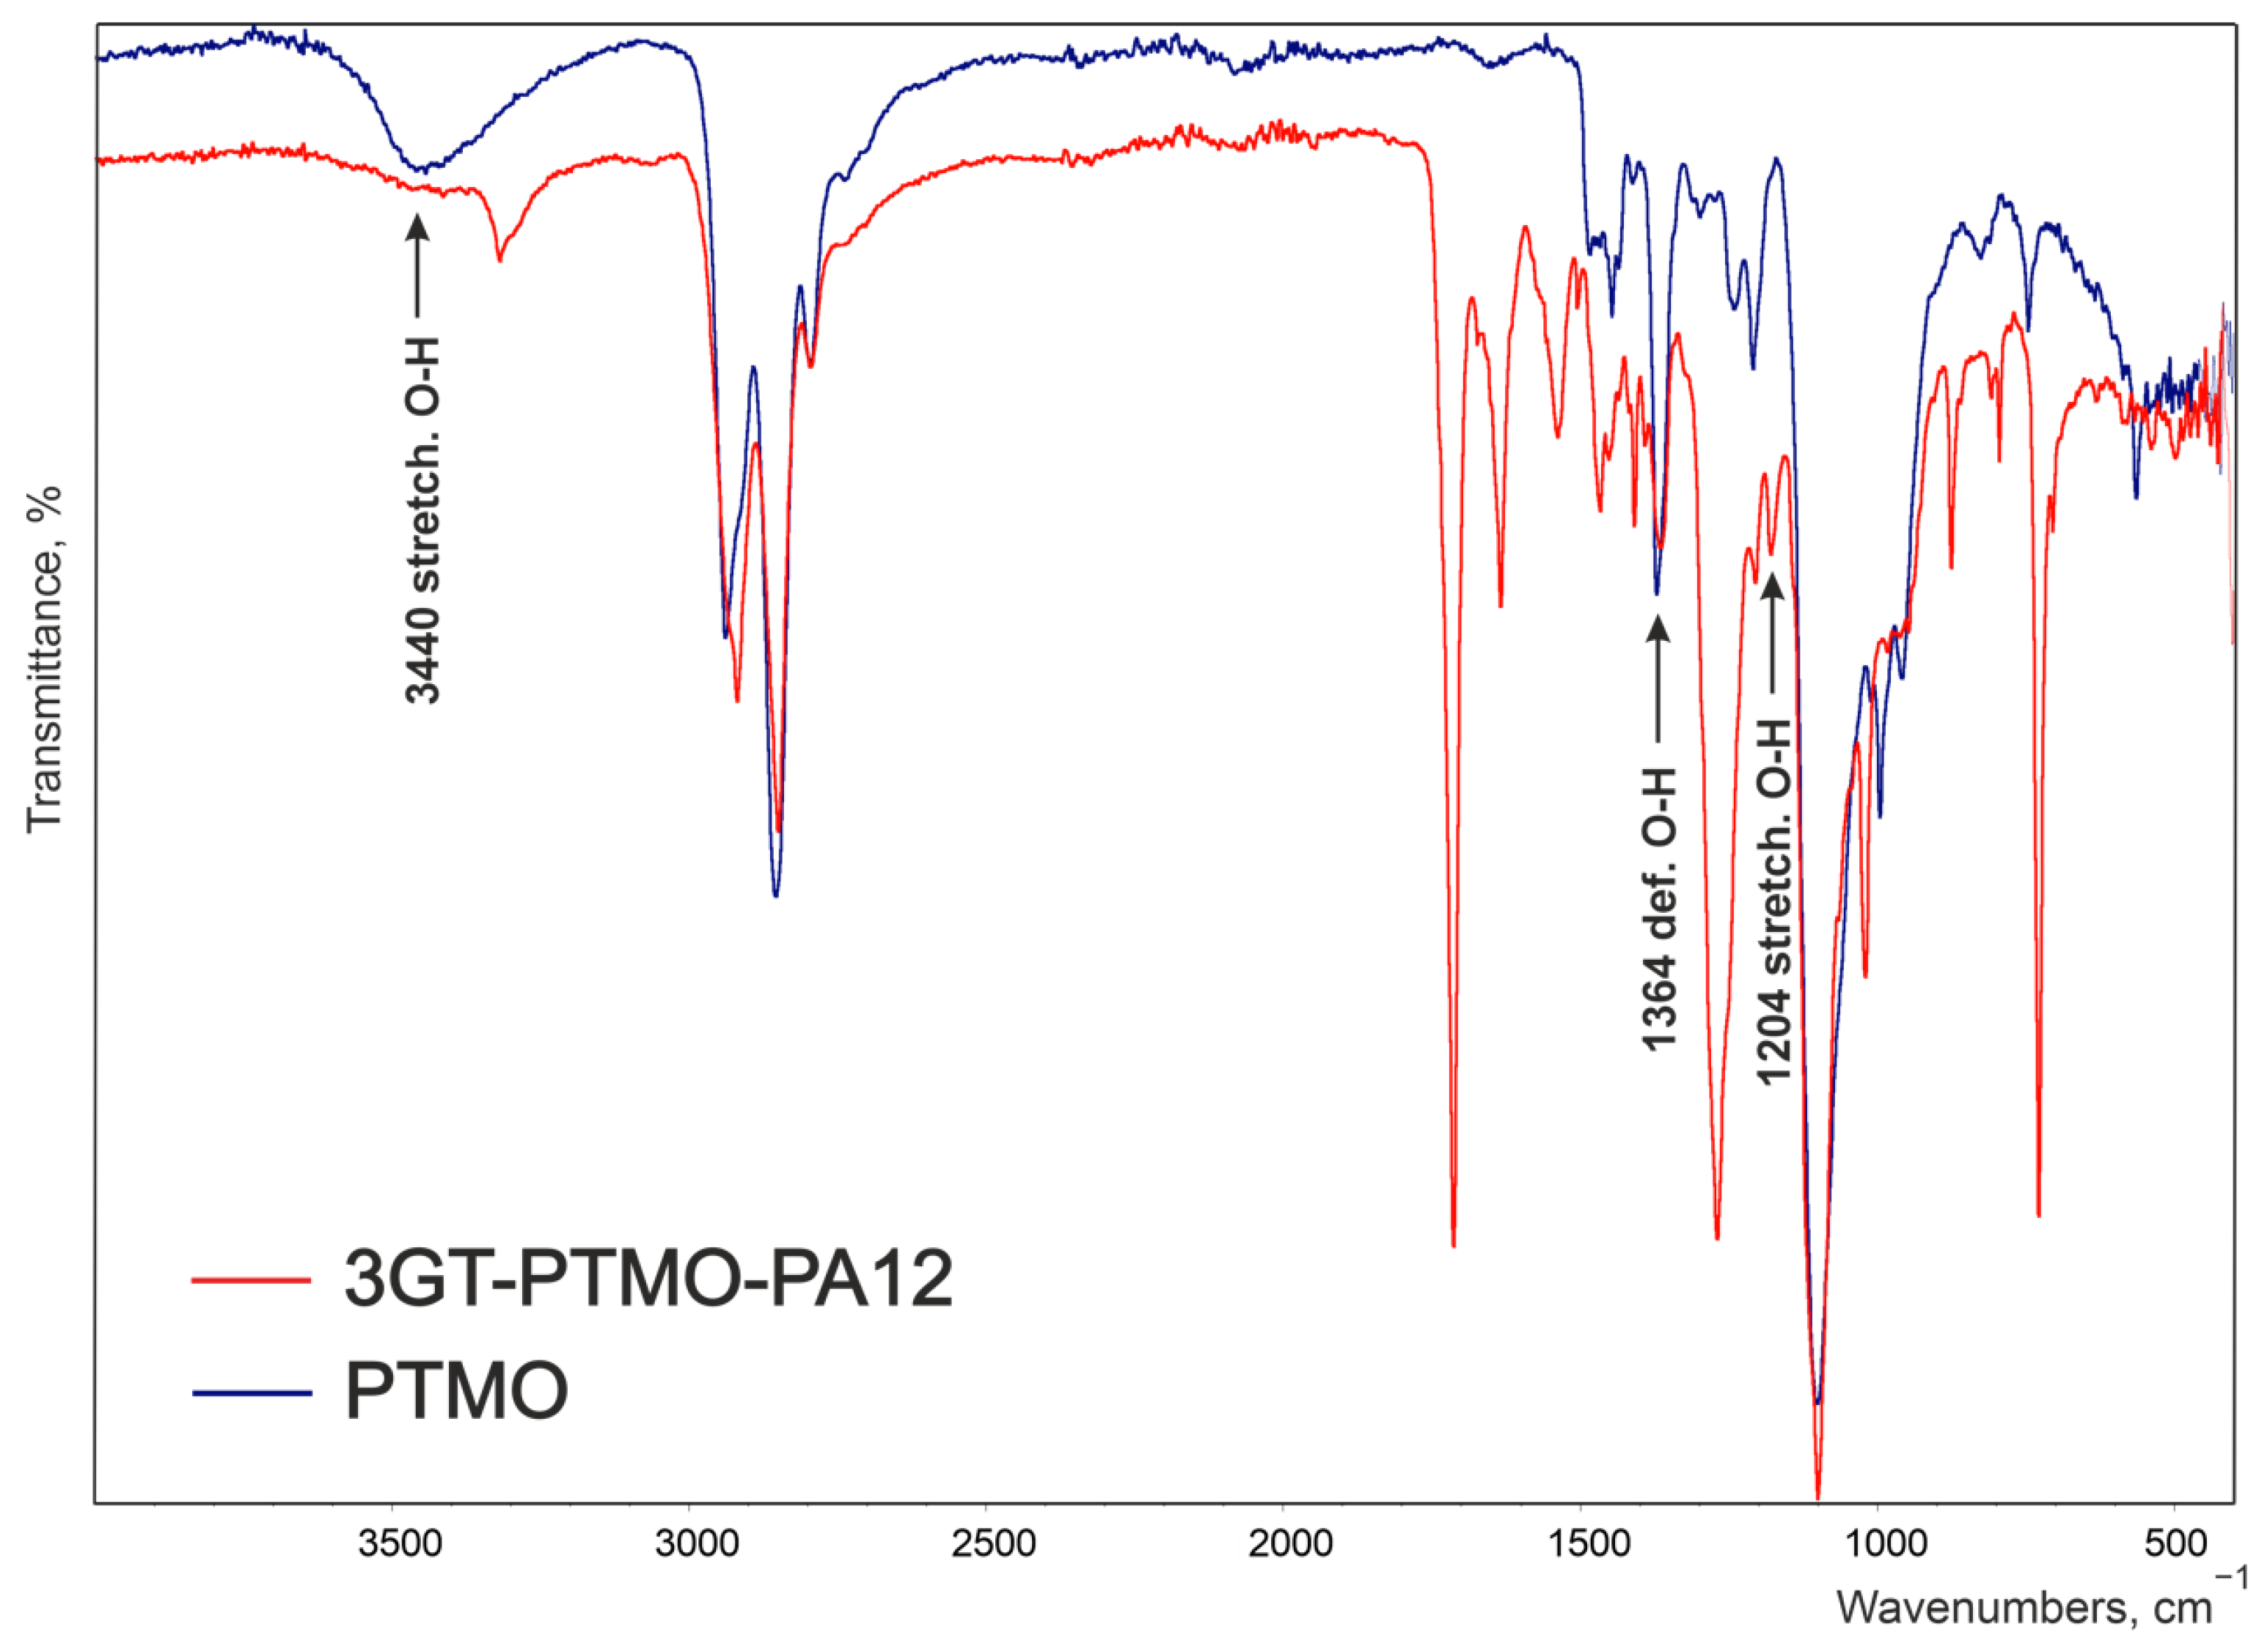
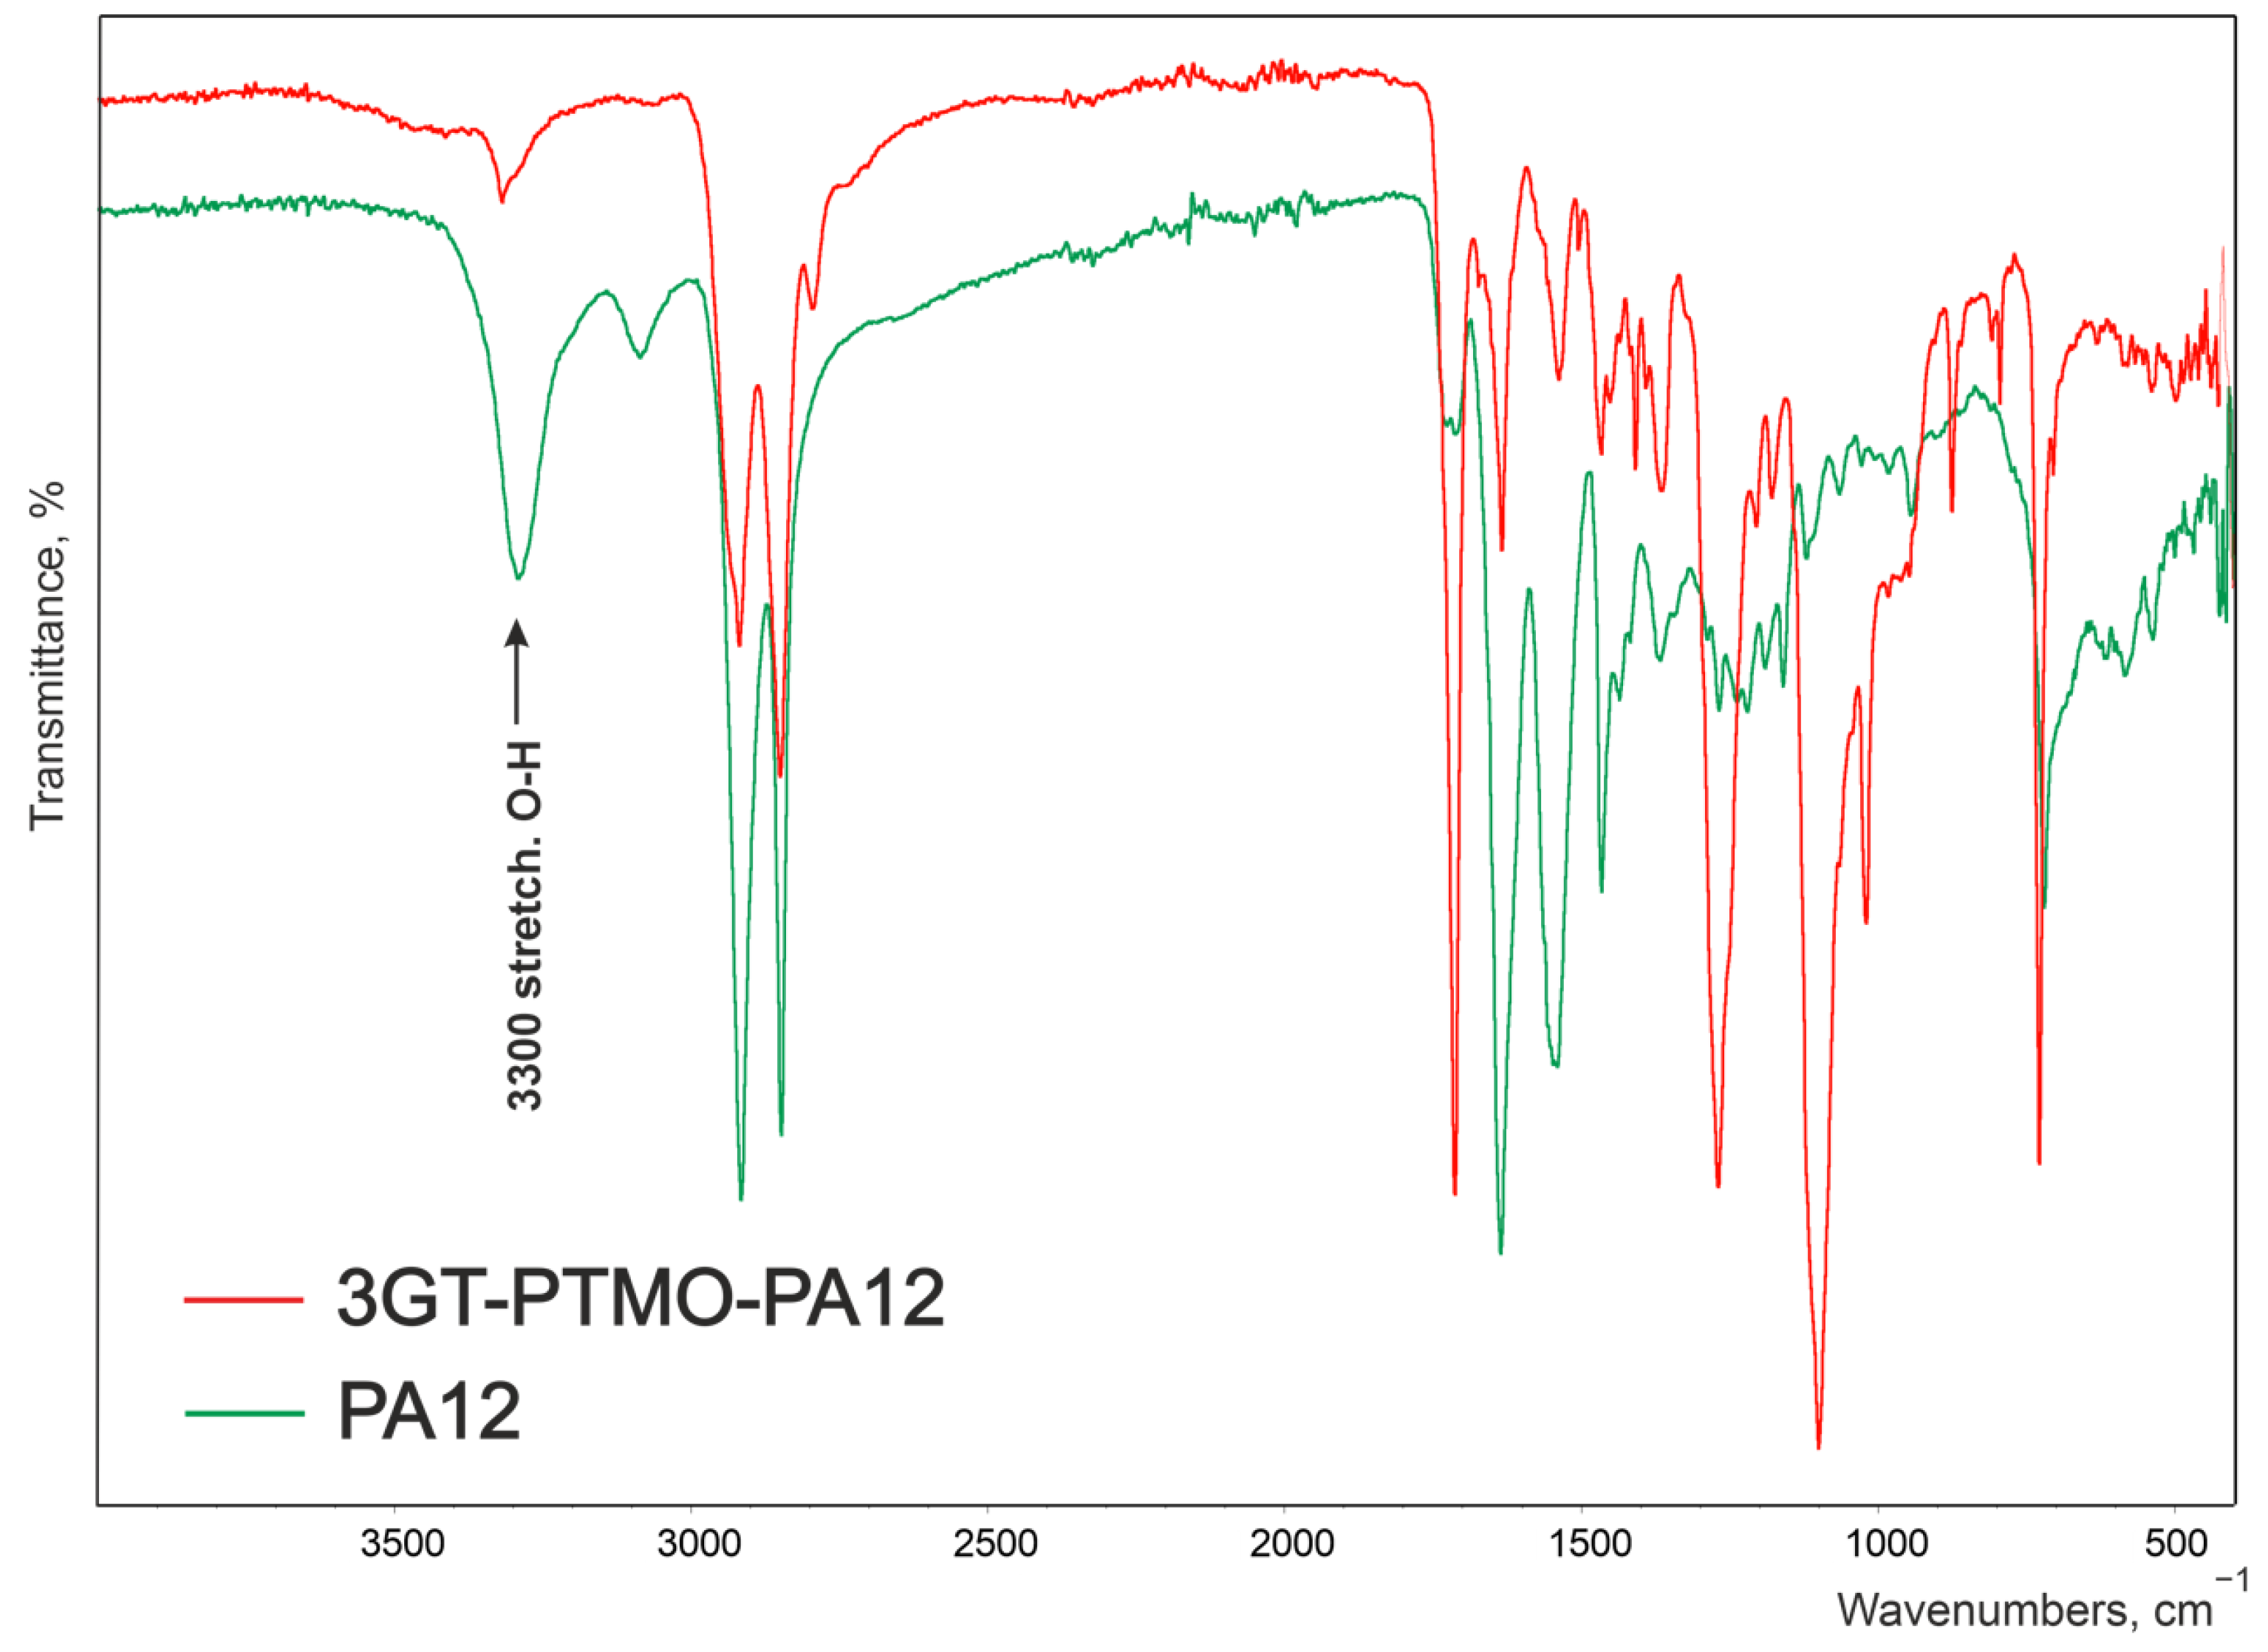
| 3GT-PTMO-PA12 Band Frequency, cm−1 | 3GT-DLAol-PA12 Band Frequency, cm−1 | Chemical Structure |
|---|---|---|
| 3319 | 3294 | Hydrogen-bonded N-H stretching and O-H stretching in the end groups |
| 3081 | 3092 | Fermi resonance of N-H, |
| 2919 and 2850 | 2919 and 2849 | CH2 asymmetric and symmetric stretching |
| 1712 | 1717 | Ester C=O stretching |
| 1633 | 1635 | Amide I, amide C=O stretching |
| 1537 | 1544 | Amide II, C-N stretching + amide C=O in plane bending |
| 1465 | 1464 | CH2 bending next to N-H group, |
| 1408 | 1408 | C=C stretching in the aromatic ring |
| 1364 | 1374 | O-H deformation and CH bending and CH2 twisting |
| 1269 | 1267 | Amide III, C-N stretching + amide C=O in plane bending |
| 1204 | - | O-H stretching |
| - | 1162 | CO-NH stretching |
| 1099 | 1100 | C-O-C asymmetric stretching |
| - | 1061 | C-O stretching in C-OH groups |
| 1019 | 1018 | C-H stretching in the aromatic ring |
| 874 | 874 | CH2 rocking in -O-(CH2)n-O- groups |
| 727 | 729 | Aromatic C-H bending out of plane |
| 517 | 520 | Amide IV |
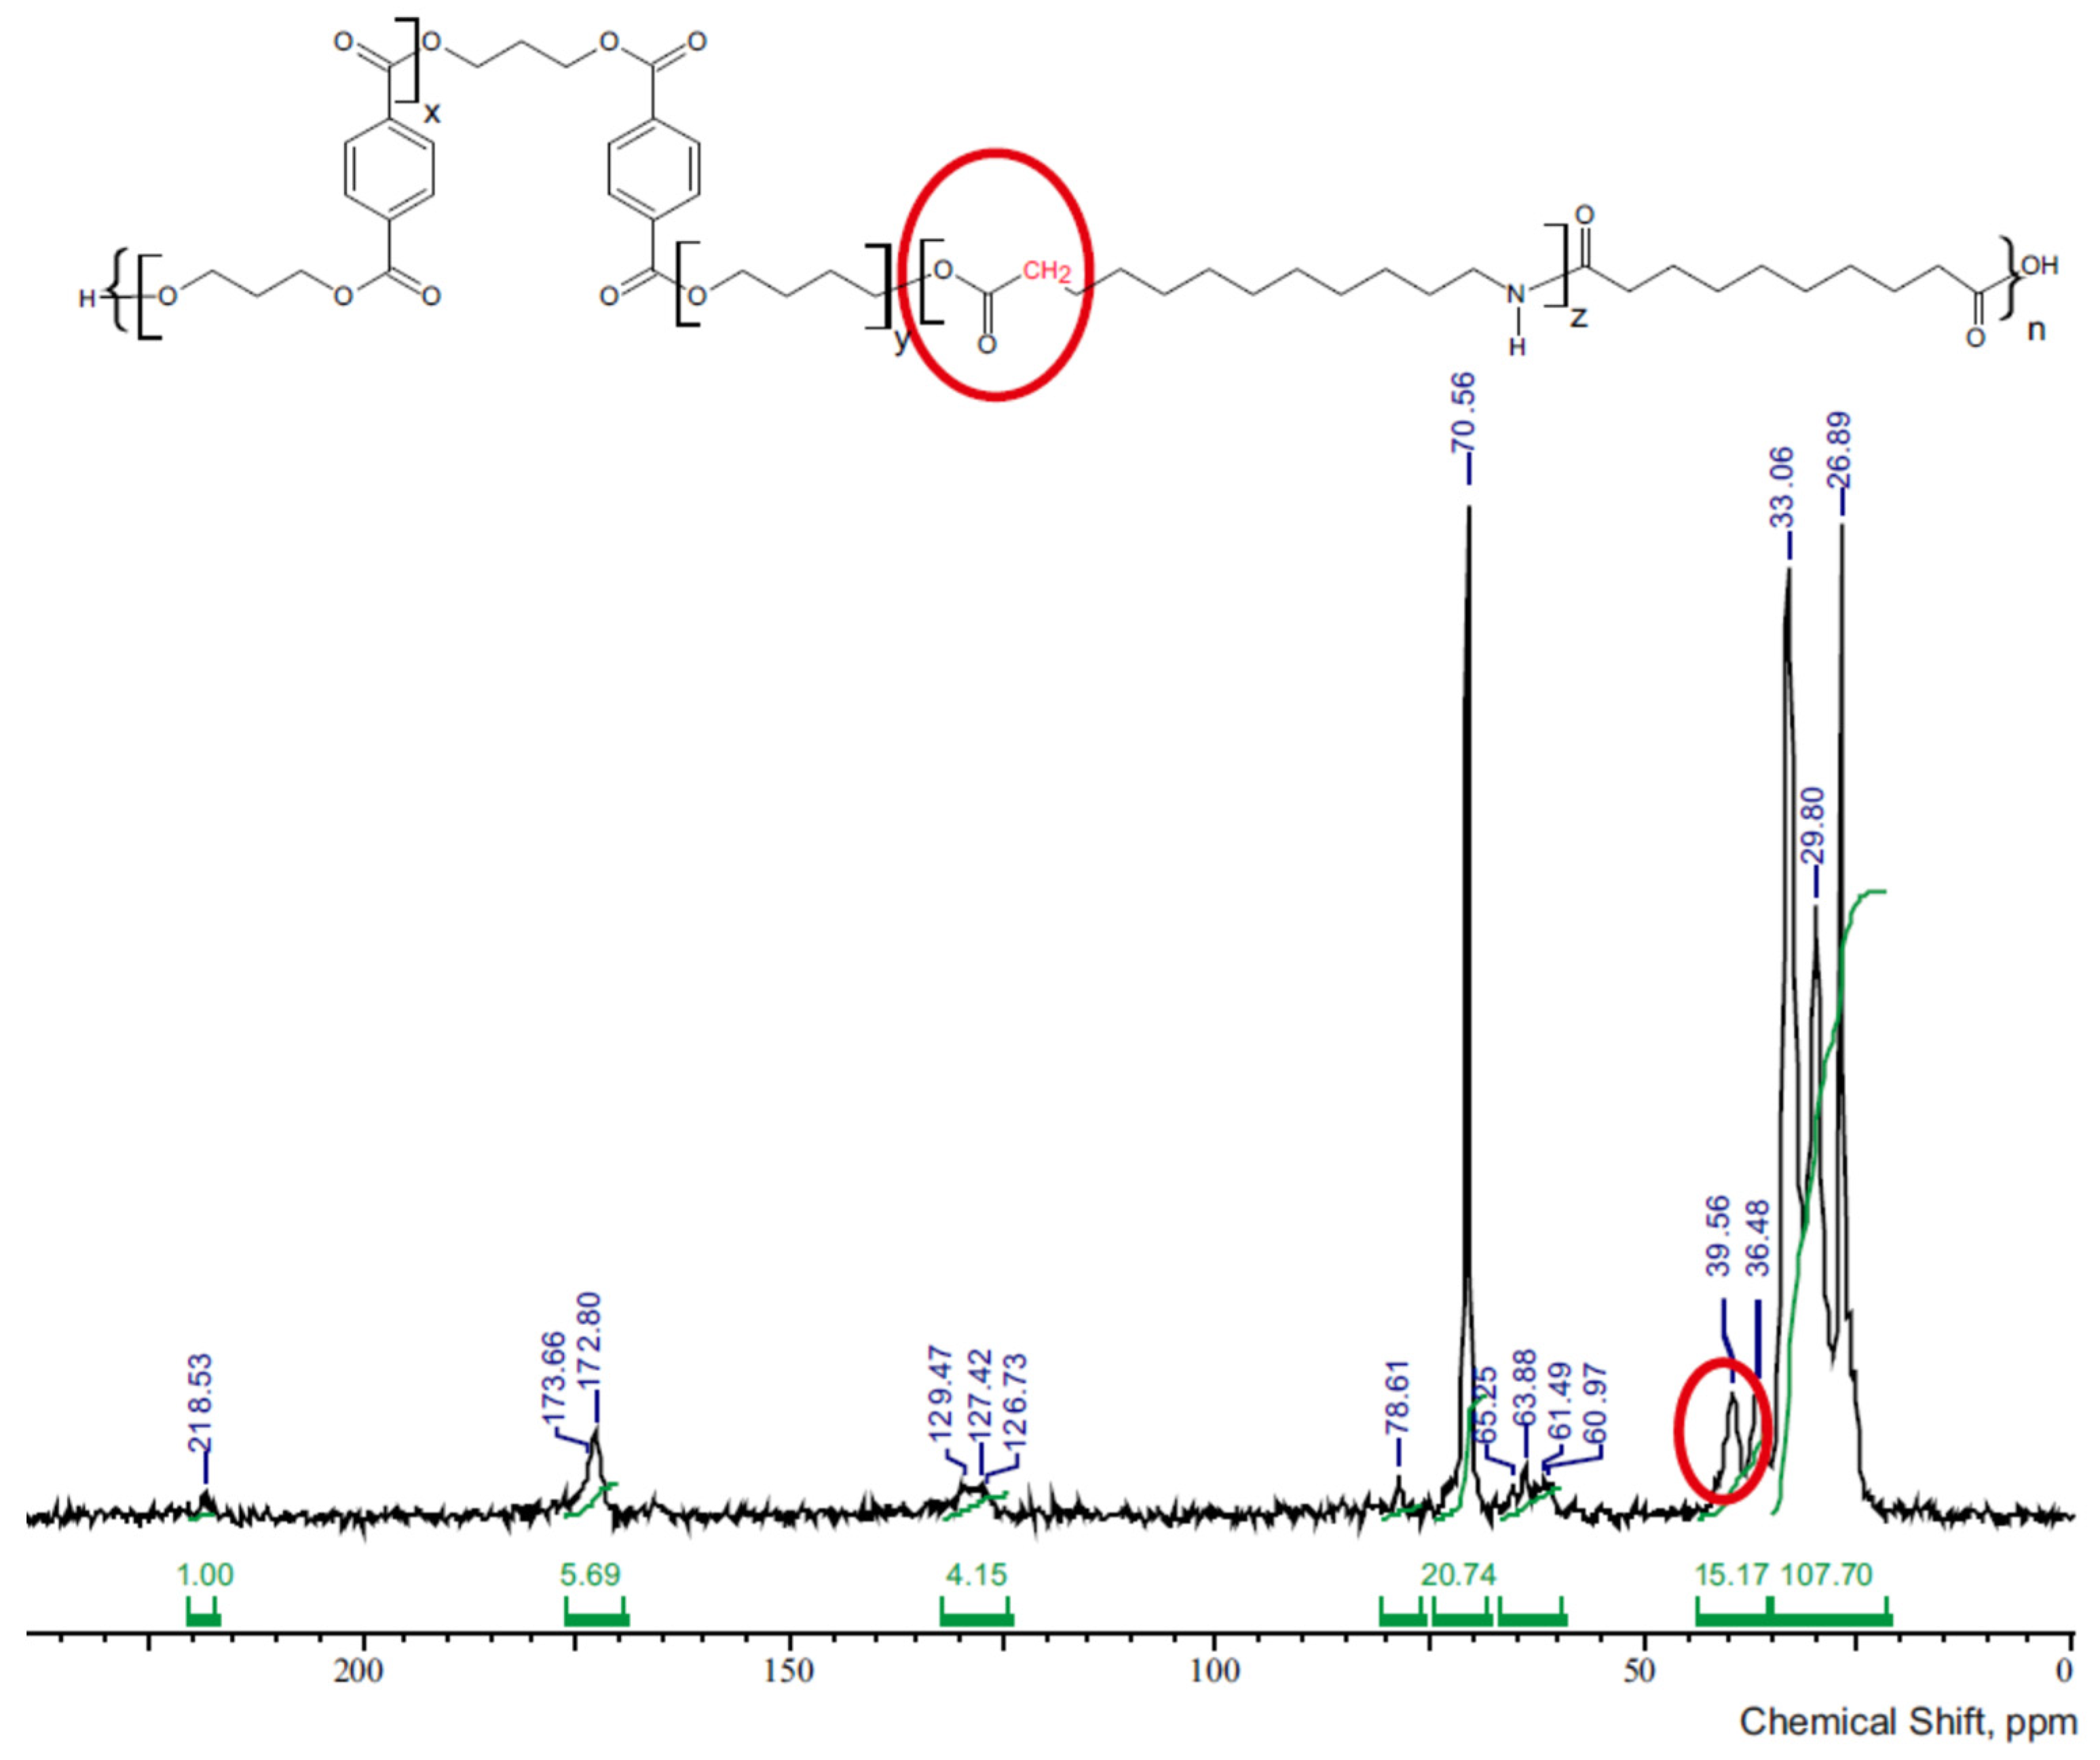
| 3GT-PTMO-PA12 Band Frequency, ppm | 3GT-DLAol-PA12 Band Frequency, ppm | Chemical Structure |
|---|---|---|
| 218.5 | 218 | C atoms of the amide group |
| 172–173 | 172.6 | C atoms of the carbonyl group |
| 127–129 | 127 | C atoms in the aromatic ring |
| 78.6 | - | C atoms in the ether group |
| 61–65 | 62–66 | CH2 groups linked to the carbonyl group through an oxygen atom |
| 39.6 | 39.6 | CH2 groups bonded to a carbonyl group |
| 36.5 | 36.5 | CH2 groups bonded to the C atom of the amide group |
| 33 | 33 | All other CH2 groups in the oligoamide chain |
| 29.8 | 30 | CH2 groups of β fragments bonded to amide or carbonyl groups or CH2 groups of β fragments of glycol |
| 26.9 | - | Polyether CH2 groups bonded to the other CH2 groups |
| - | 20–26 | C atoms in the aliphatic chain |
| - | 14.4 | C18 atoms in the aliphatic chain |
| Polymer | [η], dL/g | H, Shore A | H, Shore D | pH2O, % | pb, % | Tmi, °C | Tme, °C |
|---|---|---|---|---|---|---|---|
| 1 | 1.25 | 84 | 29 | 2 | 134 | 135 | 150 |
| 2 | 1.40 | 76 | 26 | 2 | 174 | 112 | 128 |
| 3 | 1.69 | 76 | 24 | 4 | 182 | 139 | 151 |
| 4 | 1.30 | 78 | 24 | 3 | 174 | 128 | 135 |
| 5 | 1.32 | 75 | 23 | 2 | 204 | 146 | 150 |
| 6 | 1.30 | 84 | 19 | 1 | 84 | 133 | 148 |
| 7 | 1.55 | 87 | 19 | 1 | 82 | 125 | 138 |
| 8 | 1.74 | 87 | 19 | 1 | 75 | 141 | 164 |
| 9 | 1.36 | 69 | 16 | 0 | 96 | 129 | 150 |
| 10 | 1.25 | 69 | 16 | 4 | 117 | 150 | 171 |
| 11 | 1.29 | 81 | 16 | 1 | 140 | 130 | 148 |
| 12 | 1.53 | 73 | 15 | 0 | 171 | 114 | 120 |
| 13 | 1.68 | 75 | 15 | 0 | 179 | 142 | 154 |
| 14 | 1.31 | 71 | 13 | 1 | 180 | 120 | 147 |
| 15 | 1.29 | 71 | 13 | 2 | 199 | 142 | 162 |
| No. | Polymer | Tg1, °C | ∆Cp1, J/g·°C | Tc1, °C | ∆Hc1, J/g | Tm1 °C | ∆Hm1, J/g | Tg2, °C | ∆Cp2, J/g·°C | Tc2, °C | ∆Hc2, J/g | Tm2, °C | ∆Hm2, J/g |
|---|---|---|---|---|---|---|---|---|---|---|---|---|---|
| 1 | PTMO | −90 | 0.34 | 1 | 69.62 | 21 | 85.33 | - | - | - | - | - | - |
| 2 | PTT | - | - | - | - | - | - | 58 | 0.16 | 176 | 48.57 | 232 | 61.16 |
| 3 | DLAol | −36 | 0.27 | - | - | - | - | - | - | - | - | - | - |
| 4 | PA12 | - | - | - | - | - | - | 54 | 0.34 | 134 | 61.19 | 165 | 47.93 |
| 5 | Vestamid L1700 [39] | - | - | - | - | - | - | 37 | 0.17 | 151 | 77.9 | 179 | 81.0 |
| 6 | PA12-PTMO [39] | −77 | 0.09 | −3 | 23.5 | 20 | 21.0 | - | - | 134 | 37.0 | 163 | 39.5 |
| 7 | PTT-PTMO [40] | −67 | - | - | - | - | - | - | - | 123 | 30.6 | 201 | 30.3 |
| 8 | PA12-PTT | - | - | - | - | - | - | 13 | 0.31 | - | - | 113 | 11.93 |
| Polymer | δa, MPa1/2 | δc, MPa1/2 | δ*, MPa1/2 |
|---|---|---|---|
| 2GT | 20.45 | 21.43 | 19.8–21.9 [41] |
| 3GT | 20.04 | 21.02 | 21–21.6 [42] |
| 4GT | 19.71 | 20.68 | 21.6–23.5 [43,44] |
| 5GT | 19.42 | 20.39 | - |
| 6GT | 19.17 | 20.14 | - |
| PTMO | 17.65 | 18.60 | 17–18.6 [41] |
| PA12 | 23.05 | 24.35 | 22.1–23.8 [45,46,47] |
| Sample | σ, MPa | ε, % | E, MPa | εps, % | εhs, % | εs, % | RII, % | RV, % | Series |
|---|---|---|---|---|---|---|---|---|---|
| 1 | 6.9 | 112 | 18.1 | 24.2 | 1.1 | 75.5 | 98.9 | 99.7 | I |
| 2 | 4.7 | 213 | 13.6 | 24.6 | 1.4 | 75.4 | 98.6 | 99.8 | |
| 3 | 13.0 | 155 | 29.0 | 25.3 | 1.3 | 74.8 | 98.7 | 99.9 | |
| 4 | 6.5 | 301 | 21.1 | 22.2 | 1.2 | 77.5 | 98.8 | 100 | |
| 5 | 12.1 | 133 | 27.0 | 27.1 | 0.8 | 72.6 | 99.2 | 99.8 | |
| 6 | 17.1 | 99 | 25.4 | 29.0 | 2.8 | 71.1 | 97.2 | 99.6 | II |
| 7 | 14.5 | 198 | 23.6 | 29.1 | 2.7 | 70.7 | 97.4 | 99.5 | |
| 8 | 17.5 | 133 | 46.6 | 31.5 | 3.0 | 68.5 | 97.0 | 99.4 | |
| 9 | 14.4 | 183 | 29.8 | 28.3 | 2.5 | 71.4 | 97.5 | 99.4 | |
| 10 | 15.0 | 109 | 48.9 | 32.5 | 2.8 | 67.1 | 97.2 | 99.4 | |
| 11 | 6.0 | 98 | 15.2 | 24.4 | 1.9 | 76.1 | 98.3 | 99.5 | III |
| 12 | 2.6 | 202 | 13.1 | 23.1 | 1.5 | 75.1 | 99.5 | 100 | |
| 13 | 5.9 | 123 | 21.5 | 25.7 | 1.8 | 76.7 | 98.4 | 99.6 | |
| 14 | 4.0 | 149 | 9.1 | 22.2 | 1.7 | 77.8 | 98.9 | 100 | |
| 15 | 5.9 | 118 | 19.2 | 25.5 | 1.4 | 74.5 | 98.9 | 100 |
| Sample | A | BII | BV | ΔB, % | C | Series |
|---|---|---|---|---|---|---|
| 1 | 6.9 | 112 | 18.1 | 24.2 | 1.1 | I |
| 2 | 4.7 | 213 | 13.6 | 24.6 | 1.4 | |
| 3 | 13.0 | 155 | 29.0 | 25.3 | 1.3 | |
| 4 | 6.5 | 301 | 21.1 | 22.2 | 1.2 | |
| 5 | 12.1 | 133 | 27.0 | 27.1 | 0.8 | |
| 6 | 17.1 | 99 | 25.4 | 29.0 | 2.8 | II |
| 7 | 14.5 | 198 | 23.6 | 29.1 | 2.7 | |
| 8 | 17.5 | 133 | 46.6 | 31.5 | 3.0 | |
| 9 | 14.4 | 183 | 29.8 | 28.3 | 2.5 | |
| 10 | 15.0 | 109 | 48.9 | 32.5 | 2.8 | |
| 11 | 6.0 | 98 | 15.2 | 24.4 | 1.9 | III |
| 12 | 2.6 | 202 | 13.1 | 23.1 | 1.5 | |
| 13 | 5.9 | 123 | 21.5 | 25.7 | 1.8 | |
| 14 | 4.0 | 149 | 9.1 | 22.2 | 1.7 | |
| 15 | 5.9 | 118 | 19.2 | 25.5 | 1.4 |
Publisher’s Note: MDPI stays neutral with regard to jurisdictional claims in published maps and institutional affiliations. |
© 2021 by the authors. Licensee MDPI, Basel, Switzerland. This article is an open access article distributed under the terms and conditions of the Creative Commons Attribution (CC BY) license (https://creativecommons.org/licenses/by/4.0/).
Share and Cite
Rokicka, J.; Wilpiszewska, K.; Janik, J.; Schmidt, B.; Nikiforov, A.; Volfson, S. Multiblock Elastomers TPEAA and TPEEA: Physical Structure and Properties. Materials 2021, 14, 7720. https://doi.org/10.3390/ma14247720
Rokicka J, Wilpiszewska K, Janik J, Schmidt B, Nikiforov A, Volfson S. Multiblock Elastomers TPEAA and TPEEA: Physical Structure and Properties. Materials. 2021; 14(24):7720. https://doi.org/10.3390/ma14247720
Chicago/Turabian StyleRokicka, Joanna, Katarzyna Wilpiszewska, Jolanta Janik, Beata Schmidt, Anton Nikiforov, and Svetoslav Volfson. 2021. "Multiblock Elastomers TPEAA and TPEEA: Physical Structure and Properties" Materials 14, no. 24: 7720. https://doi.org/10.3390/ma14247720