Article

Pertechnetate/Perrhenate Surface Complexation on Bamboo Engineered Biochar

1
Department of Nuclear Chemistry, Faculty of Nuclear Sciences and Physical Engineering, Czech Technical University in Prague, Břehová 7, 115 19 Prague, Czech Republic
2
Department of Nuclear Chemistry, Faculty of Natural Sciences, Comenius University in Bratislava, Mlynska Dolina, Ilkovičova 6, 842 15 Bratislava, Slovakia
*
Authors to whom correspondence should be addressed.
Materials 2021, 14(3), 486; https://doi.org/10.3390/ma14030486
Submission received: 29 December 2020 / Revised: 13 January 2021 / Accepted: 15 January 2021 / Published: 20 January 2021
(This article belongs to the Special Issue Materials for Waste Water Treatment)

Abstract

:
The work deals with the evaluation of biochar samples prepared from Phyllostachys Viridiglaucescens bamboo. This evaluation consists of the characterization of prepared materials’ structural properties, batch and dynamic sorption experiments, and potentiometric titrations. The batch technique was focused on obtaining basic sorption data of 99mTcO4 on biochar samples including influence of pH, contact time, and Freundlich isotherm. ReO4, which has very similar chemical properties to 99mTcO4, was used as a carrier in the experiments. Theoretical modeling of titration curves of biochar samples was based on the application of surface complexation models, namely, so called Chemical Equilibrium Model (CEM) and Ion Exchange Model (IExM). In this case it is assumed that there are two types of surface groups, namely, the so-called layer and edge sites. The dynamic experimental data of sorption curves were fitted by a model based on complementary error function erfc(x).

Graphical Abstract

1. Introduction

99Tc is a long-lived radionuclide, low β energy emitter, and its metastable isomer 99mTc is the most important medical tracer worldwide. The nuclear fuel cycle is the predominant source of 99Tc in the environment. The nuclear power plants accidents, the nuclear weapons testing fallout, and the institutional waste (mainly 99mTc radiopharmaceutical products) are much less important sources. The natural Tc occurrence, formed in the Earth’s crust by 238U spontaneous fission and neutron-induced 235U fission in uranium ores, are negligible. Taking into account the kind of sources and the aqueous chemistry, Tc is released into the environment as pertechnetate (TcO4). Its behavior, in the environment attracted much attention of researchers all over the world [1,2,3,4], during the last decades due to its properties, such as long physical half-life, the solubility and mobility of TcO4 in aquatic system. Considerable effort has been made to understand the long-term biogeochemical behavior of Tc, its transfer in food chains and the mechanism controlling its mobility in diverse environments [1,5,6]. The pertechnetate ion will not likely be sorbed in significant amounts by soils and suspended bottom sediments of predominantly negative charge but will be highly mobile in soils and waters and thus available for uptake in biota [6].
There are currently several general approaches for TcO4 immobilization from waste such as evaporation [7], extraction-chromatographic methods [8], sorption onto carbon-based materials, and their modified forms, i.e., biochar [9], etc. A sorption is an effective approach to TcO4 sequestration because it is a simple, convenient, and economical in its own process [10].
The outstanding properties of pyrogenic carbonaceous materials ultimately originate from biomass, i.e., biochar, such as porous structure, enhanced specific surface area, and the content of free functional groups predetermine these materials as a promising and efficient tool for various contaminant immobilization [11,12]. This utilization is valuable from the point of feedstock availability (based on input waste biomass) and cost-effectiveness of sorption material preparation. Processing conditions, production methods, and feedstock characteristics have been shown to affect the final sorption properties of biochar-based sorbents that have been produced in pyrolysis reactors [13]. To be used as tool for contaminants, radionuclides or pollutants immobilization, biochar needs to be engineered, in order to prove its physical–chemical properties, to enhance its suitability and mainly because of the final application.
Engineered/designer sorbent is commonly used term to indicate supplication-oriented, outcome-based sorbent modification or synthesis. In the recent years, modifications, involving impregnation of mineral sorbents, steam activation, and magnetic modification, etc., have been widely studied [13,14]. The biochar engineering consequences are mainly related to the changes in surface properties, such as surface area increase, surface charge, etc., functional groups and/or the pores volume. The positively charged surface (depending on pH) is typical advantages of non-engineered biochar, resulting in a relatively low sorption capacity of anionic contaminants [15,16]. Based on above mentioned facts, engineered biochars—produced by application-oriented, outcome-based modification, or synthesis—are developed as innovative sorbents with innovative properties for significant improvement of the environmental quality around contaminated regions, and to reduce and eliminate anionic pollutants eco-toxic effects [17,18,19,20,21,22,23,24,25].
In our previous work was shown the fundamental understanding of the changes in the biochar structure as function of various additives is therefore crucial for the implementation of strategies to design/engineer biochar with superior properties, tailored to enhance performance. For this purpose, the biochar composites detailed analysis of structure was described. Prepared and characterized materials were tested for sorption studies of nitrate from aqueous solutions [23].
The novelty of this work lies in the description of the interactions of pertechnetate and biochar using potentiometric titrations and the application of the surface-complexation model. Using this model, it is possible to clearly show which types of functional groups are involved in sorbent-adsorbate interactions.
The objectives of this study were to:
-
enrich and supplement the characterization of prepared materials’ structural properties;
-
batch sorption investigation influenced by pH, contact time, and equilibrium study;
-
potentiometric titration and dynamic sorption experiments;
-
theoretical models’ applications.
All above mentioned experiments and calculations were performed in order to improve the environmental application of prepared engineered biochar for technetium immobilization.

2. Materials and Methods

2.1. Materials Preparation

Our pyrogenic carbonaceous materials were prepared as follows. As a biomass feedstock for pyrolysis, agricultural bamboo waste from greenway golden bamboo (Phyllostachys viridiglaucescens) was used. First sample consisted of raw bamboo-based biochar labeled as BCS (S means standard). This sample was prepared in the same way as the next two except that no saline solution was used but deionized water (DW) only. Two samples were Mg- and Fe- engineered biochars labelled as BCMg (containing Mg) and BCFe (containing Fe), respectively. The amount of 40 g MgCl2·6H2O or FeCl3·6H2O was dissolved in 60 cm3 of DW and 150 g of biomass was added to each solution. These suspensions (feedstocks) were stirred for 2 h, then oven-dried at 80 °C for 24 h. Thereafter, dried materials were pyrolyzed at 460 °C for 2 h. After pyrolysis, prepared materials were rinsed with DW and oven dried at 80 °C for 24 h. In order to ensure an oxygen-free environment and uniform heating conditions, nitrogen (N2) was used as a flush gas. The samples preparation in detail was well described in our previous work [23]. All chemical solutions were prepared using DW <0.4 μS cm−1, which was also used to rinse and wash the samples. All reagents used during experiments were of analytical purity grade.

2.2. Materials Characterization

2.2.1. X-ray Fluorescence

The following characterization techniques were carried out for all prepared samples. The X-ray fluorescence (XRF) spectrometer NITON XL3t 900Analyzer with GOLDD Technology (Thermo Scientific, Waltham, MA, USA) was used for qualitative elemental characterization. Before performing the analysis, the NITON was allowed to warm up for a minimum of 15 min. Prior to measurements, the spectrometer was calibrated. The 4 μm thin film (3252 ULTRALANE®, Spex SamplePrep, Metuchen, NJ, USA) was stretched at one end of the double-opened ring cup (SC-4331, Premier Lab Supply, Port St. Lucie, FL, USA) and attached with an oversize ring. Samples were sprinkled into these cups. Cups with samples were placed over the detector and measured in “mining” mode.
Except for XRF characterization, all samples were well described in our previous work by field-emission scanning electron microscope (TESCAN MIRA 3, Oxford Instruments, Abingdon, UK) with energy-dispersive X-ray (EDX) detector, FTIR spectroscopy (VERTEX 70, Bruker Optics Inc., Billerica, MA, USA), CHNS elemental analysis (MACRO cube, Elementary Analysensysteme GmbH, Langenselbold, Germany), thermogravimetric analysis (SDTA851e, Mettler Toledo, Columbus, OH, USA), and N2; (−196 °C) physical adsorption (NOVA 1200e Surface Area and Pore Size Analyzer, Quantachrom Instruments, Boynton Beach, FL, USA) [23].

2.2.2. Acid-Base Titrations

For the modelling of the titration curves, it is assumed that there are two types of surface functional groups, namely the so-called edge and layer sites. These have different properties, so three types of surface complexation models (SCM) are used to describe edge sites, namely two electrostatic (CCM—Constant Capacitance Model and DLM—Diffusion Double Layer Model) and one without electrostatic correction (CEM—Chemical Equilibrium Model). Processes running on layer sites are described using the IExM—Ion Exchange Model [26]. With respect to basic parameters of the surface sites, acid-based titrations curves were studied. According to Lutzenkirchen [27] reactions taking place on the surface of a biochar can be described by Equations (1)–(3) if CEM and IExM are taken into account.
≡SO + H+ ↔ ≡SOH0   K1;
≡SOH0 + H+ ↔ ≡SOH2+   K2
≡XNa + H+ ↔ ≡XH + Na+   Kex
where ≡SO, ≡SOH0 and ≡SOH2+ are symbols for edge sites, X is the symbol for layer sites. The equilibrium constants K1, K2 and Kex; are given by Equations (4)–(6):
K 1 = SOH 0 SO H +
K 2 = SOH 2 + SOH 0 H +
K ex = XH Na + XNa H +
Surface charge density reaction balances for edge sides (7) and layer sides (8) are as follows:
SOH 0 = SOH 0 + SO + SOH 2 +
X = XH + X = HX + XNa
Modeling of titration curves was performed so that in the i-th point of the titration curve, the total surface charge density, (Qcal)i is equal to the sum of charge density on the edge-sites, (QES)i, and on the layer-sites, (QLS)i. Therefore (Qcal)i = (QES)i + (QLS)i. Charge density is a function of pH, whereupon the values of (QES)i (Equation (9)) and (QLS)i (Equation (10)) can be calculated.
Q ES i = SOH 0 · K 1 · K 2 · H + 2 + 1 K 1 · K 2 · H + 2 + K 1 · H + 2 + 1
Q LS i = X · Na + Na + + K ex · H +
The experimental value of the surface charge for i-th point of titration curve, (Qex)i, can be then calculated according to Equation (11).
Q exp i = V i · C a , i C b , i + OH i H + i m i
where Vi is the total volume of liquid phase; mi is the mass of solid phase; Ca,i and Cb,i are bulk concentrations of acid (i.e., NO3) and hydroxide (i.e., Na+) in liquid phase, respectively. The values of Ca,i and Cb,i are given by concentrations of acid and base, and by their consumptions in the course of the titration.
If K1, K2, Kex, ∑SOH and ∑X are sought, multi-dimensional non-linear regression procedure can be used. FAMULUS software [28] with Gauss–Newton algorithm was used for calculation. As the criterion of goodness-of-fit WSOS/DF (Weighted Sum of Squares divided by Degrees of Freedom) was chosen (Equation (13)). Its calculation is based on χ2-test given by Equation (12).
χ 2 = SSq i Sq i 2
WSOS DF = χ 2 n i
n i = n p n
where (SSq)i is the square of experimental value deviation from calculated one; (Sq)i is the experimental value uncertainty; ni is the number of degrees of freedom calculated by Equation (14); np is the number of experimental points and n is the number of model parameters sought during the regression procedure.

2.3. Batch and Dynamic Sorption Experiments

2.3.1. Speciation Analysis

Because one of the most significant limitations associated with the batch method is that it is not possible to find the difference between the individual species of chemicals by measuring the number of pulses (radioactive measurement), speciation analysis was performed by theoretical and practical means.
Theoretical speciation analysis was performed using dissociation and stability constants from LLNL and ThermoChemie databases. Then, a practical Eh(V) measurement of experimental solutions was carried out in order to verify the speciation of 99mTcO4 and ReO4 (used as carrier). These values were compared with oxidation-reduction potential Eh(V) of Zobell’s solution [29], that was used to the calibration of measuring equipment. Eh(V) was measured with combine pH electrode E16M343 pHC3359-3 (Radiometer Analytical, A Haach Company, Little Island, Ireland). Two Zobell’s standard solutions consist of 0.003 mol·dm−3 K3Fe(CN)6 (p.a., Penta, s.r.o., Prague, Czech Republic), 0.003 mol·dm−3 K4Fe(CN)6 (p.a., Penta, s.r.o., Prague, Czech Republic), and 0.1 mol·dm−3 KCl. Eh(V) value of these solutions should be equal to +430 mV for standard hydrogen electrode (SHE).
99mTcO4 concentrations (c) were obtained by recalculation according to Equation (15) from the activity of the solutions, by random selection in batch experiments. They were measured on a PTW Curiementor 2 ionization chamber (PTW Freiburg, Germany) at iso-factor 527.
c = A V × N A × λ   mol · dm 3
where A is activity (Bq; s−1), V is the volume (dm3), NA is the Avogadro constant (mol−1), λ is 99mTc decay constant (s−1).

2.3.2. Pertechnetate/Perrhenate Sorption by Batch Technique and Column Porosity Determination

The batch equilibrium study is the one of the most important method of sorption investigation. In this method, 0.02 g of the material was placed into 2 cm3 Eppendorf Safe-Lock Tubes. A solution of 0.2 cm3 containing sorbate with a respective concentration and pH was added. Tubes were placed in sealed bottles and agitated in a laboratory shaker (IKA Labortechnik KS250 basic shaker). Influence of the pH, the contact time and the amount of carrier are described in more detail below.
The most crucial and important factor in sorption study plays the value of the pH. The aqueous phase pH affects the surface charges, i.e., protonation state of adsorbent functional groups, chemical speciation of Tc(VII) and Re(VII), and diffusion rate of the solute, respectively [30]. Experimental conditions were as follows. Carrier-free stock solutions were prepared with the range of pH 1.0–9.0. The setup of pH was done by HCl (p.a., 35%, Lach-Ner s.r.o., Neratovice, Czech Republic) or NH3 (p.a., >24%, Penta, s.r.o, Praha, Czech Republic). Each stock solution was labelled [99mTc]NaTcO4 (DRN 4329 Ultra Technekow FM 2.15–43.00 GBq radionuclide generator, Mallinckrodt Medical B.V., Petten, Netherlands), the final volume activity was approx. 1 MBq·cm−3. The volume 0.5 cm3 of each stock solution was spiked into the 2 cm3 PE scintillation vials as a standard. Solid phases and each liquid phase created a set of samples which was shaken in the laboratory shaker at 250 rpm for 24 h at the temperature of 24 ± 1 °C. Then, suspensions were separated by filtration on a glass microfiber filter Whatman GF/C. 0.5 cm3 of each filtrate was taken for count rate measurement into PE scintillation vials. Impulse counting was carried out for 100 s in a well-type NaI(Tl) scintillation detector NKG-314 with a single-channel analyzer spectrometric assembly NV-3120 (TESLA VUPJT, Zdiby, Czech Republic).
The respective value of pH, where the highest adsorption percentage (R) was reached, served as the environment in equilibrium time determination experiments. Two, carrier-free stock solution (one for BCS, BCMg, one for BCFe) with the specific pH value were prepared (volume activity is approx. equal to 1 MBq·cm−3 of [99mTc]NaTcO4), and 0.5 cm3 of each stock solution was spiked into the 2 cm3 PE scintillation vials as a standard. Aqueous and solid phase were mix for 1, 10, 20, 40, 60, 120, and 240 min. Then, suspensions were separated by filtration on a glass microfiber filter Whatman GF/C. 0.5 cm3 of each filtrate was taken for count rate measurement into PE scintillation vials. Impulse counting was carried out for 100 s in a well-type NaI(Tl) scintillation detector NKG-314 with a single-channel analyzer spectrometric assembly NV-3120 (TESLA VUPJT, Zdiby, Czech Republic).
The values (pH, contact time) from previous experiments were used for the following, isotherm investigation. Non-isotopic tracer solutions of NH4ReO4 (≥99%, Sigma-Aldrich, Inc., St. Louis, MO, USA) with concentration of 1 × 10⁻⁷, 5 × 10⁻⁷, 1 × 10⁻⁶, 5 × 10⁻⁶, 1 × 10⁻⁵, 5 × 10⁻⁵, 1 × 10⁻⁴, 5 × 10⁻⁴, 1 × 10⁻³, 5 × 10⁻³, and 5 × 10⁻² mol·dm−3 prepared and labelled with [99mTc]NaTcO4. The final volume activity was approx. 1 MBq·cm−3. Suspensions were mix for the specific time. Then, suspensions were separated by filtration on a glass microfiber filter Whatman GF/C. 0.5 cm3 of each filtrate was taken for count rate measurement into PE scintillation vials. Impulse counting was carried out for 100 s in a well-type NaI(Tl) scintillation detector NKG-314 with a single-channel analyzer spectrometric assembly NV-3120 (TESLA VUPJT, Zdiby, Czech Republic).
The mathematical processing of radioactivity measurements is as follows. The background count rate (nb) is the number of background counts (Nb) divided by measuring time (tb).
n b = N b t b   s 1
The error of the background count measurement (σ(Nb)) can be calculated according to Equation (17).
σ N b = N b   pulse
Then, using the law of error propagation, it is possible to calculate the error of the background count rate (Equation (18)).
σ n b = n b t b = σ N b t b   s 1
Similarly, other values are obtained, sample + background count rate (ns+b), its error (σ(ns+b)), standard + background count rate (nst+b), and its error ((σ(nst+b)) as follows.
n s + b = N s + b t s + b   s 1
σ n s + b = n s + b t s + b = σ N s + b t s + b   s 1
n st + b = N st + b t st + b   s 1
σ n st + b = n st + b t st + b = σ N st + b t st + b   s 1
The net sample (ns) and net standard (nst) count rates and their errors σ(ns) and σ(nst) are then:
n s = n s + b n b   s 1
n st = n st + b n b   s 1
σ n s = σ n s + b 2 + σ n b 2   s 1
σ n st = σ n st + b 2 + σ n b 2   s 1
The number of pulses of a radionuclide decreases over time. The half-life of 99mTc is quite short, equal to 6.0067 h. Therefore, the sample count rates (ns) (Equation (23)) need to be corrected (ncor) (Equation (27)) by the time (tcor) that elapses between the standard measurement and the measurement of each sample.
n cor = n s e λ t cor   s 1
σ n cor = σ n s × e λ t cor   s 1
where λ is the 99mTc decay constant (3.20543 × 10⁻⁵ s−1).
The portion of adsorbed 99mTcO4 is given by the difference of its concentrations or its count rates in the aqueous phase before and after mixing. This portion described by sorption percentage R.
R = 100 n cor n st × 100   %
σ R = 100 × 1 n st × σ n cor 2 + 100 × n cor n st 2 × σ n st 2   %
The mass distribution ratio (Dg) represents a sorbent relationship to the adsorbate. It is a linear dependency of equilibrium concentration of adsorbed substance to its equilibrium concentration in the solution.
D g = BF × n st n cor n cor   cm 3 · g 1
σ D g = BF × 1 n cor × σ n st 2 + BF × n st n cor 2 × σ n s 2   cm 3   g 1
where BF = V/m, m is the solid phase mass (g), and V is the liquid phase volume of liquid phase (cm3).
The Dg values range normally from 100 to 104 cm3·g−1. Therefore, it is useful to determine whether the values are within this range. That means making an estimating the minimum (Dg,min) and maximum (Dg,max) value. If the time of sample + background and standard + background count measurements is the same (t = ts+b = tst+b), Equation (32) can be modified to the following form.
σ D g = 1 n s + b n b × BF × n st t + n st + b n b n s + b n b 2 × n s + b t + n st + b n b n s + b n b 2 × n b t b   cm 3 · g 1
If we assume the Gaussian distribution of pulses, the number of pulses is high enough, and at the same time the sample count rates are close to standard count rates, then assuming that nst+b ⨠ nb it is possible to write the limit of σ(Dg) as follows:
lim n s + b n st + b σ D g = 1 n st + b n b × BF × 2 n st + b × t BF × 2 n st + b × t
The minimum weight distribution ratio (Dg,min) was expressed by selecting the 99.7% confidence interval in which the mean Dg values lie, i.e., where coverage factor k = 3.
D g , min = 3 × σ D g = 3 × BF × 2 n st + b × t   cm 3 · g 1
If the value of the minimum count rate that we can prove (ns+b) is expressed as follows.
n s + b = n b + 3 × σ D g   s 1
Then, it holds that the maximum distribution ratio value (nst+b ⨠ nb) can be written as follows.
D g , max = BF × n st n b 3 × n b t b 3 × n b t b BF × n st 3 × t b n s + b   cm 3 · g 1
Equilibrium concentration (ceq) indicates what part of carrier analytical concentration (c) remained in the liquid phase after adsorption process.
c eq = c × n cor n st   mol · dm 3
σ c eq = c n st × σ n cor 2 + c × n cor n st 2 2   mol · dm 3
For the isotherms modeling it is necessary to know what amount of the sorbate is sorbed per gram of a sample. This expresses the capacity Q.
Q = D g × c eq   mmol · g 1
σ Q = c eq × σ D g 2 + D g × σ c eq 2   mmol · g 1
In this work, the sorption is described by the Freundlich isotherm (qF) (Equation (42)). A set of carrier solutions of NH4ReO4 (≥99%, Sigma-Alrich, Saint Louis, MO, USA) with the analytical concentrations of (canal) 1 × 10⁻⁷, 5 × 10⁻⁷, 1 × 10⁻⁶, 5 × 10⁻⁶, 1 × 10⁻⁵, 5 × 10⁻⁵, 1 × 10⁻⁴, 5 × 10⁻⁴, 1 × 10⁻³, 5 × 10⁻³, and 5 × 10⁻² mol·dm−3 with the corresponding pH were prepared. Each carrier solution was labelled with [99mTc]NaTcO4 (DRN 4329 Ultra Technekow FM 2.15–43.00 GBq radionuclide generator, Mallinckrodt Medical B.V., Petten, Netherlands), with the final volume activity of ∼1 MBq·cm−3. The volume of generator solution did not exceed 100 μL in either case. The standard volume 0.5 cm3 was taken from each concentration for radioactivity measurement. The amount 20 mg of each sample was contacted with 2 cm3 each prepared concentration in 2 cm3 safe-lock tubes (Eppendorf, Hamburg, Germany). Then, tubes were shaken in a shake at 250 rpm. After filtration on a Whatman GF/C glass microfiber filter (Whatman plc., Maidstone, UK), 0.5 cm3 was taken from each filtrate for impulse counting (100 s) in a well-type NaI(Tl) scintillation detector NKG-314 with a single-channel analyzer spectrometric assembly NV-3120 (TESLA VUPJT, Zdiby, Czech Republic).
q F = k F × c eq n F   mmol · g 1
where kF is the Freundlich constant, nF is the regression constant. If nF = 1, then kF = Dg. In all batch experiments the lower detection limit lied below 1%. Graphs were plotted in Origin 9.5.

2.3.3. Pertechnetate/Perrhenate Sorption by Dynamic Technique

Breakthrough curve is the result of the dynamic experiment under forced flow condition on a fixed bed in a column. The position and shape of this curve is considerably influenced by sorption capacity, selectivity, release, and transfer of heat as well as the sorption rate, inlet concentration, flow rate, and by the limited experimental time due to the short 99mTc half-life. Therefore, suitable conditions have been sought experimentally and are as follows. In this work, the breakthrough curve was measured as a dependence of relative count rate (nrel)theor, on the rate of flow expressed as the number of the sorbent bed volume. Here (nrel)theor is the theoretical, relative count rate which corresponds to the ReO4 concentration ratio at the given point of breakthrough curve (c) to the inlet sorption solution concentration (c0).
The 1 cm3 empty Rezorian™ tube kit with PE first (Supelco Inc, Bellefonte, PA, USA) was used as a column. The column’s internal dimensions are 2.1 cm × 0.45 cm, i.e., one bed volume (BV) is equal to 1.336 cm3. The composition of sorption solutions and bed weights (m) are in Table 1. The sorption solutions consisted of carrier NH4ReO4 (≥99%, Sigma-Aldrich, Saint Louis, MO, USA), pH was adjusted with HCl (p.a., 35%, Lach-Ner Ltd., Neratovice, Czech Republic). Each sorption solution was labelled by [99mTc]NaTcO4 (DRN 4329 Ultra Technekow FM 2.15–43.00 GBq radionuclide generator, Mallinckrodt Medical B.V., Petten, The Netherlands). The resulting volume activity of each sorption solution was approximately 1 MBq·cm−3. 0.5 cm3 of each sorption solution was saved into the 2 cm3 PE scintillation vials as a standard.
Columns were packed and slightly pressed manually. Each column was conditioned in a slow, upward flow direction at the room temperature with approximately 20 BV of DW. All columns rested for at least 8 h. Then, created bubbles in columns were eluted by approximately 10 BV of DW, lower 2-way valve was closed, water above the column was removed, hoses were drained and dried. The column remained water-flooded (1 BV) prior to sorption study. Then, the inlet hoses were rinsed (into the waste bottle) with approximately 10 cm3 of labeled sorption solution. Then, flow was stopped, lower 2-way was turned to the flow-through position with the column, flow was switched on. The fractions collection began with the first drop at the house output. The linear flow rate was set to 0.2 cm·min−1 (4.5 BV·h−1), flow was secured by the peristaltic pump PCD22 (Dávkovací čerpadla—Kouřil, Kyjov, Czech Republic) and the fraction collector 2210 (Bio-Rad spol s.r.o., Prague, Czech Republic) was used to collect the eluates into PE scintillation vials every 6 min. 0.5 cm3 of each fraction was measured for 100 s in a well-type NaI(Tl) scintillation detector NKG-314 with a single-channel analyzer spectrometric assembly NV-3120 (all Tesla, Zdiby, Czechoslovakia). After 99mTc decay, equilibrium pH was measured by pH meter PHM2200 equipped with a combined pH electrode XC161-9 (Radiometer Analytical, Washington, WA, USA). Graphs were plotted in Origin 9.5.
The experimental points were fitted by transport model which is based on complementary error function (erfc(x)). This function was obtained by analytical solution of one-dimensional advective dispersion Equation (43) for steady seepage flow [31].
ε × D l × 2 c x 2 ε × u × c x = ε × c t + ξ × q t ε × λ × C ε × λ × q
where ε is the porosity (cm3·cm−3), Dl is the dispersion coefficient (cm2·s−1), c is the carrier concentration (mmol·cm−3), x is the distance to which sorbate travels in the bed (cm), u is the linear velocity of the liquid phase (cm·s−1), ξ = m/BV is the bulk density of the bed of solid phase (g·cm−3), q is the amount of sorbed carrier (mmol·g−1), t is the time (s), λ is the decay constant of 99mTc (s−1). It is obvious that the retardation coefficient is a function of the first derivative of the relation for the equilibrium isotherm at point c. If the Freundlich Equation (42) is considered, then the first derivative is given by Equation (44):
f = q c = n F × k F × n rel theor × c 0 n F 1
The sorption dynamics process depends on the initial boundary conditions. Therefore, the correct formulation of these conditions is an integral part of the model’s mathematical formulation. Assuming that the sorption process is isothermal, the mobile phase is incompressible, flows in one direction and has a statistical character, the sorbate concentration is so small that local changes in fluid density are negligible. The initial and boundary conditions are then [31]:
t = 0 ,   0   x x 0 ,   c = 0   at   x = 0   and   t = 0 ,   c t   =   c 0   at   x   =   L
Then, the Equation (44) can be written as follows [32]:
c = c 0 2 × erfc x u R × t D l × t R 2 + e u × x D d × erfc x u R × t D l × t R 2
Neglecting the exponential term and modification for count rate [33]:
n rel theor = n o theor n st = 0.5 · erfc R s theor n pv 2 · R s theor × n pv P e
Because it holds that erfc(-x) = 2 − erfc(x), Equation (46) can be written as follows:
n rel theor = n o theor n st = 1 0.5 × erfc R s theor n pv 2 · R s theor × n pv P e
where (n0)theor is the theoretical value of corrected count rate of the liquid phase at the outlet of the column (s−1), nst is the standard’s count rate (s−1), npv (= u × t/L) is the experimental count of bed volumes (BV), L is the bed length, t is the time of the sorption experiment, Pe (= u × L/Dd) is the Peclet number, and Dd is the dispersion coefficient (cm2·min−1).
According to Equation (46), the calculation is possible if (nrel)theor ≤ 0.5, i.e., (Rs)theor − npv ≥ 0. If (nrel)theor > 0.5, i.e., (Rs)theor − npv < 0, Equation (47) must be used.
Porosity ε (cm3·cm−3), sample density ρs (g·cm−3), bulk density of the sample in the column ξ (g·cm−3), and linear flow rate u (cm·min−1) need to be determined experimentally because they enter the computational model. A mass of dry, empty pycnometer (me) and the same one filled with deionized water (mf) was weighed. The pycnometer was then thoroughly dried, and a dry sample (ms) was weighed into it. Subsequently, the sample in the pycnometer was wetted so that the volume of deionized water was approximately half the total volume of the pycnometer. Air from the samples’ pores was evacuated under reduced pressure for 10–15 min. The pycnometer was then filled to the throat, sealed, dried, and weighed (ms+w). From the obtained masses it is possible to calculate the sample volume Vs and the density ρs of the sample then according to the relations:
V s = m f m e m s + w m e + m s   cm 3
ρ s = m s V s   g · cm 3
The quantities written above were used to calculate the net volume (Vn).
V n = m ρ   cm 3
where m (g) is the dry mass of the sample in the column (see Table 1). While the bed volume, BV, is equal to 1.336 cm3, then the porosity ε and the bulk density of the sample in the column ξ can be calculated as follows:
ε = BV V n BV   cm 3 · cm 3
ξ = m BV   g · cm 3
The samples were measured three times, the resulting values of ρs, ε and ξ were averaged. If the porosity ε is known, the average solution volume flowing through the column per minute Vc (cm3·min−1) was determined by weighing the fractions, the linear flow rate of the solution through the column u (cm·min−1) can be calculated by means of Equations (53) and (54):
S c = π · r 2 · ε · cm 2 · cm 3 · cm 3
u = V c S c   cm · min 1
where Sc is the column free cross section.

3. Results and Discussion

3.1. Material Characterization

3.1.1. XRF

XRF spectroscopy provided identifiable elements between Al and W. The results are shown in Table 2. The background represents Fe, Ni, and W. All identified elements are macro- and microbiogenic in nature. This means that they have been ingested from the outside environment and the plant incorporates them into its metabolism. Si is not essential element, but it seems could be beneficial for vegetation according to [34].
Although the magnesium and aluminum peaks have been identified, their intensities are very small due to the low K energy levels. Therefore, as we reported before in [23], EDX was used to identify elements heavier than Be. The measurement was performed on two randomly selected areas within one particle or on two different BC particles of the same sample. The majority component consists of C and O for the BCS sample, for BCMg and BCFe samples the majority corresponds to the compound with which they were impregnated. The weight percentages of the elements obtained by this method vary depending on the place where the measurement took place. This is interpreted by the BCMg sample, which shows a very large difference in the weight percentages of Mg. The difference is up to 39.6%. Identified elements by EDX are shown in Table 3.

3.1.2. Acid-Base Titration

The result of an acid-base titration is shown in Figure 1. This is dependence of the total surface charge on pH for the experimental titration points and for the model. The important result is the pH at which the charge of the surface is equal to zero (pHPZC). pHPZC value for BCS is equal to 6.7. This value of BC prepared from Phyllostachys viridiglaucescens bamboo is comparable to the one prepared by Hu [5]. The sample pyrolyzed at 300 °C reached a pHPZC of 6.82.
The application of nonlinear regression procedure during fitting of experimental data requires that estimates of the sought variables be entered. These were as follows, log(K1) = 15, log(K2) = 10, log(Kex) = 5, [SOH]tot = [S]tot = 0.1 mol·kg−1 The result of the calculation is shown in Table 4.
Currently, there is no analytical technique that can distinguish functional groups on edge sites and layer sites. The model of titration curves is based on the existence of two functional groups. The results of the titrations indicate that there are two groups on which acids and bases act. This means that they are dissociable and have a pH-dependent surface charge. This means that they are considered as edge sites. Based on the WSOS/DF fit criterion, it can be concluded that the model describes the properties of functional groups very well. This supports the assumption of the applicability of edge and layer sites of the given sorbent sample. From the point of view of sorption of anionic species of Tc(VII) and Re(VII), the dependence SOH2+ on pH in Figure 1b is important. It is evident that their sorption has favorable conditions in almost the entire pH range, especially in the acidic one.

3.2. Batch Adsorption Experiments

3.2.1. Speciation Study

What chemical form is present in the solution is very important information, even in connection with batch experiments. Because one of the most significant limitations associated with the batch method is that it is not possible to find the difference between the individual species of chemicals by measuring radioactivity.
The considerations and results of the speciation analysis are as follows. From a radiochemical point of view, the radioactive isotope 99mTc(VII) is present in this system as a tracer (radioindicator) and Re(VII) as a non-isotopic carrier with close chemical properties. Dissociation constants for ionic strength I = 0 mol·dm−3 were found only for HTcO4, KTcO4, and NaTcO4 in the HATCHES database (currently replaced by the ThermoChimie database) and in the LLNL database. There are no database data for compounds of ReO4 yet.
HTcO4 ↔ H+ + TcO4     logk1 = 5.94 (5.96 LLNL)
KTcO4 ↔ K+ + TcO4     logk2 = −2.29 (−2.27 LLNL)
NaTcO4 ↔ Na+ + TcO4     logk3 = 1.56 (1.52 LLNL)
NH4TcO4 ↔ 5e + 4H+ + NO3 + TcO2+     logk4 = −86.56 (ThermoChemie)
From the value of logk4 and from the reactions themselves it is clear that in equilibrium the reaction (54) is significantly shifted to the left, and NO3 is a good oxidizing agent Tc(IV) → Tc(VII), in an acidic environment to form TcO4 and NH4+. Considering the chemical similarity of Tc and Re, it can be assumed that Equations (51)–(54), including the values of equilibrium constants, can be also apply for ReO4. It follows from Equation (51) that HTcO4 and HReO4 are strong acids, as evidenced by the very low value of molar fractions F2 (degree of dissociation) in Table 5.
Since the dissociation constant of NH4TcO4 is not known, the logk2 constant for KTcO4 was used. Therefore, it is possible to assume the analogy of the 99mTcO4 (ReO4) reactivity with the reactivity (sorption) on a strongly acidic cation exchange resin, i.e., with the functional group HSO3, whose reactivities are in the order Na+<NH4+<K+. Therefore, by choosing logk2, the proportion of free 99mTcO4 (ReO4) in the solution was relatively disadvantaged—see F1 in Table 5.
For the calculation of the representation of the forms 99mTcO4, resp. ReO4 it is necessary to derive the following balance equations:
TcO 4 = TcO 4 1 + H + k 1 + K + k 2
HTcO 4 = H + TcO 4 k 1 TcO 4
KTcO 4 = K + TcO 4 k 2 TcO 4
F 1 = TcO 4 TcO 4
F 2 = HTcO 4 TcO 4
F 3 = KTcO 4 TcO 4
ReO 4 = ReO 4 1 + H + k 1 + K + k 2
HReO 4 = H + ReO 4 k 1 ReO 4
KReO 4 = K + ReO 4 k 2 ReO 4
F 1 = ReO 4 ReO 4
F 2 = HReO 4 ReO 4
F 3 = KReO 4 ReO 4
The calculated mole fraction values F1, F2, and F3, given by Equations (64)–(66), for different KReO4 input concentrations and two pH intervals are in Table 5. The results were obtained in FAMULUS software with the programme PTC_2.fm [26]. The pH of 0–10 was chosen in order to verify the effect even in the alkaline range. The effect in the basic range is practically zero, only the values of F2 have a few orders of magnitude lower value at pH 10, which is logical but insignificant. Values of F1, i.e., representation of free [ReO4] and [99mTcO4] are mainly influenced by the concentration of the KReO4 carrier greater than 10−3 mol·dm−3, as evidenced by F3 values. In all the examples considered, the proportion of free acid [HReO4] and [HTcO4] presented by F2 is negligible. However, it should be noted that it is very likely that the reduced concentration of [ReO4] and [TcO4] does not mean a reduction in the sorption efficiency of this anionic form. From the analogy of sorption, e.g., U(VI) from solutions containing SO42−, where both anionic and cationic forms of U(VI) exist, it is known that sorption on both anion exchangers and cation exchangers takes place practically at 99% [35]. This is due to the fact that during sorption, decomplexation or complexation occurs, and thus a species is formed which is sorbed.
It is essential that the redox potential Eh(V) of the system be such that there is practically only one form of Tc and Re, i.e., 99mTcO4 and ReO4, respectively. According to the Takeno’s atlas of Eh(V)-pH diagrams [34] at pH 2, Eh(V) should be greater than 500 mV, and at pH 4 greater then 300 mV so that only TcO4 is present in the system. This should apply to both Tc(VII) and Re(VII). Practical verification of Eh(V) measurements is in Table 6 (Eh(V) was measured with combine pH electrode E16M343 pHC3359-3 (Radiometer Analytical, A Haach Company, Little Island, Ireland—see Section 2.2.1).
Conversion of Eh(V) values in Table 6 to SHE one, it can be estimated using the measured value of Eh(V) of the Zobell solution which is ~99 mV. Evidently, the absolute difference of this Eh(mV) as compared with SHE data, is then ~530 mV. Since the Eh(mV) of the samples was ~270 mV, after adding the difference of 530 mV, the resulting estimate of SHE Eh(mV) of the samples is equal to ~800 mV. This is a sufficiently high value on the base of which can be claimed that only ReO4 and 99mTcO4 are present in the sorption experiments.
Concentrations of 99mTcO4 calculated according to Equation (15) were in the rage of 10−12–10−10 mol·dm−3. It should be noted that the tracer concentrations of ΣTc may be underestimated by several orders of magnitude. The reason is the decay of 99mTc to 99Tc, which behaves in the same way as a metastable isotope but is not detectable by the detector. However, its concentration is small, and it follows from the above that that the presence of 99Tc after the conversion of 99mTc does not and cannot affect the speciation and the experimental results themselves.

3.2.2. Dependence of Sorption Percentage R on pH

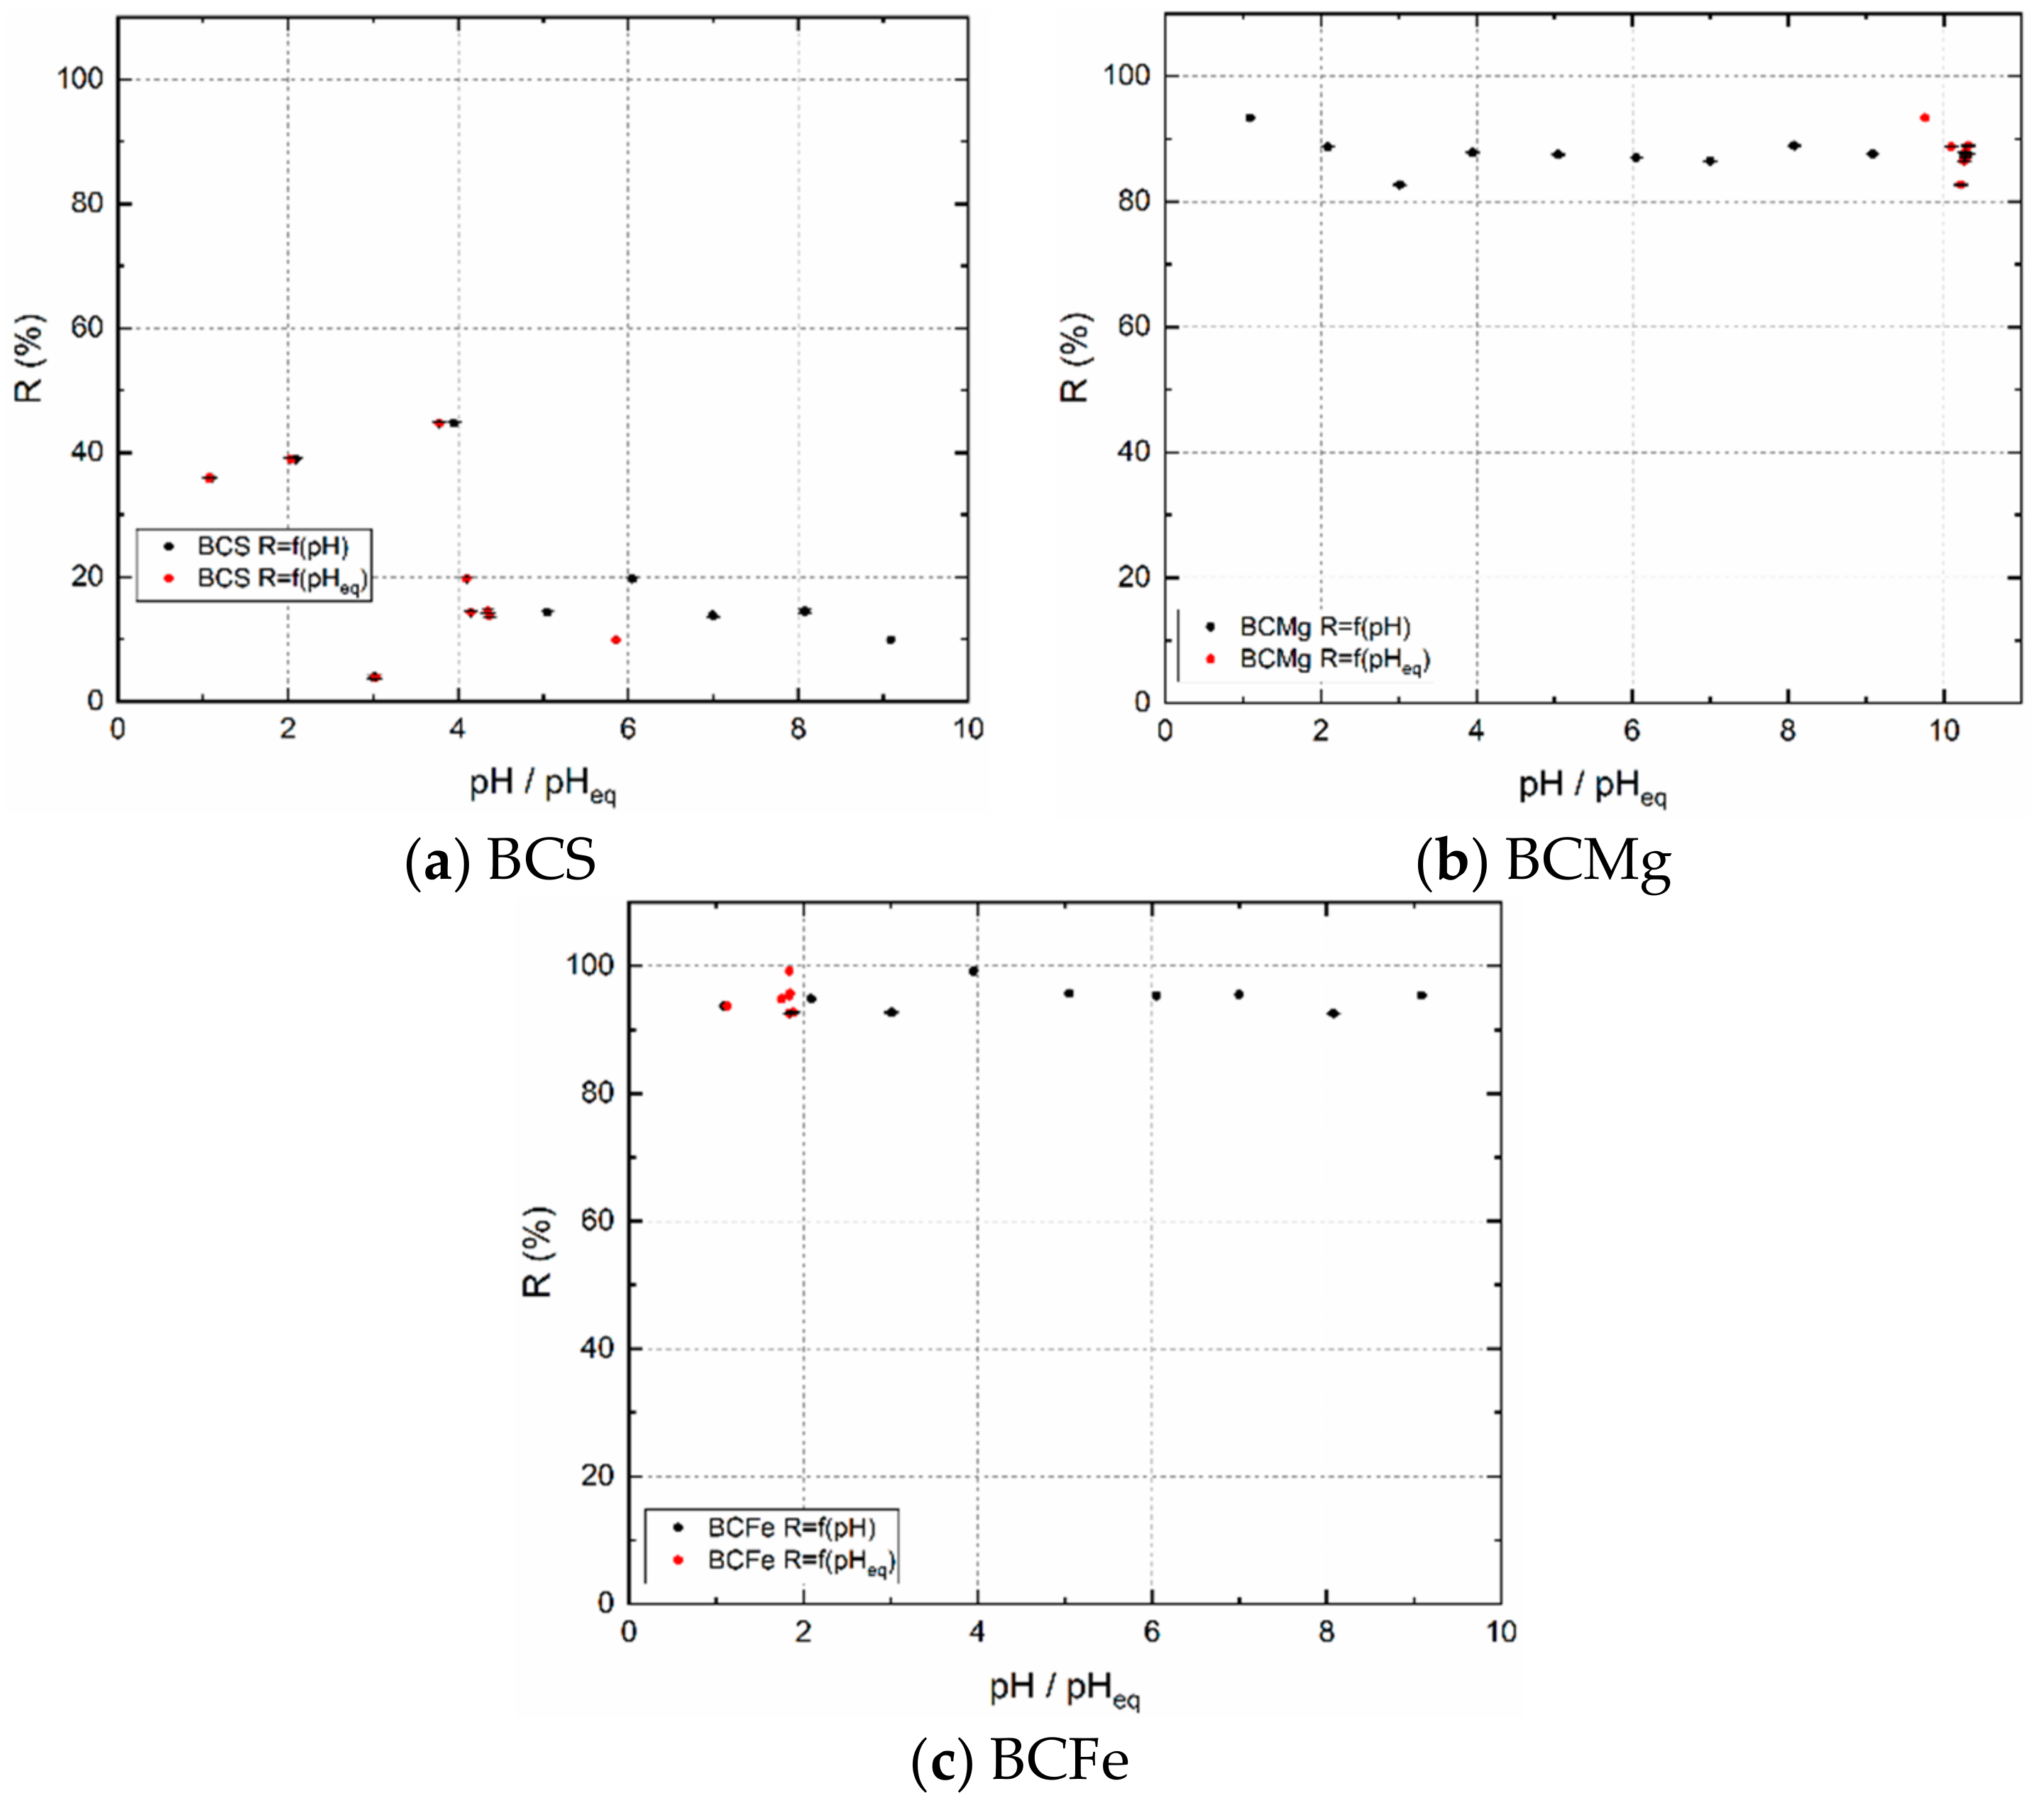
The results of the pH measurement are shown in Figure 2. Black dots correspond to pH values of solutions before sorption, red points to equilibrium pH values after the sorption. These experiments were performed without a carrier. For the BCS sample, the pHeq values are kept below 6 (Figure 2a). From this it can be concluded that the excess of H+ caused a decrease in R, which increases up to pH 4, where it reaches a maximum. Then the number of active sorption sites decreases with increasing pH.
A surprising result of the dependence of R on pH was obtained for sample BCMg, which was non-thermally pretreated with MgCl2 solution. In the case that MgCl2 is released from the surface of BCMg and dissolved in the aqueous phase, it hydrolyzes to various hydrates of MgCl2·nH2O forming slightly acidic solution (pH~6) [36]. Therefore, pHeq was expected to follow a similar trend as the BCS sample. It can be seen (Figure 2b) that all pHeq lie around 10. According to Takeno’s Eh-pH diagrams [36], only the Mg2+ and of Cl are present in the range of pH 0–11.9. Thus, it is not entirely clear what causes such a loss of H+ ions regardless of their concentration in aqueous phase. This may be due to various reactions of the polyatomic and/or hydrated molecules in solution with sample’s functional groups or other interactions. In addition, at pH > 7, the number of active sites, and thus the R values is reduced by only a few %. This means that this sample is usable for sorption of 99mTcO4 in the pH range from 1 to 10, but desorption of 99mTcO4 (and reusability of the BCMg) will not be possible under these conditions.
The dependence of R on pH for sample BCFe is shown in Figure 2c. Regardless of the initial pH, the pHeq values are between 1 and 2. FeCl3, which contains a sample of BCFe, has a strong tendency to hydrolyze and to form various mononuclear and polynuclear complexes of FexOi(OH)vClu [37,38]. The FeCl3 is a salt of a weak base and a strong acid, therefore its solutions have a pH < 7. However, the same was true for the sample BCMg, such acidification of the solution is negligible due to the results. Even with this sample, TcO4 sorption is possible in the entire investigated pH range. Verification of the R accuracy was performed using the maximum and minimum Dg. As can be seen from Table 7, all experimental Dg values lie between the minimum and maximum Dg.

3.2.3. Determination of the Sorption Equilibrium Time

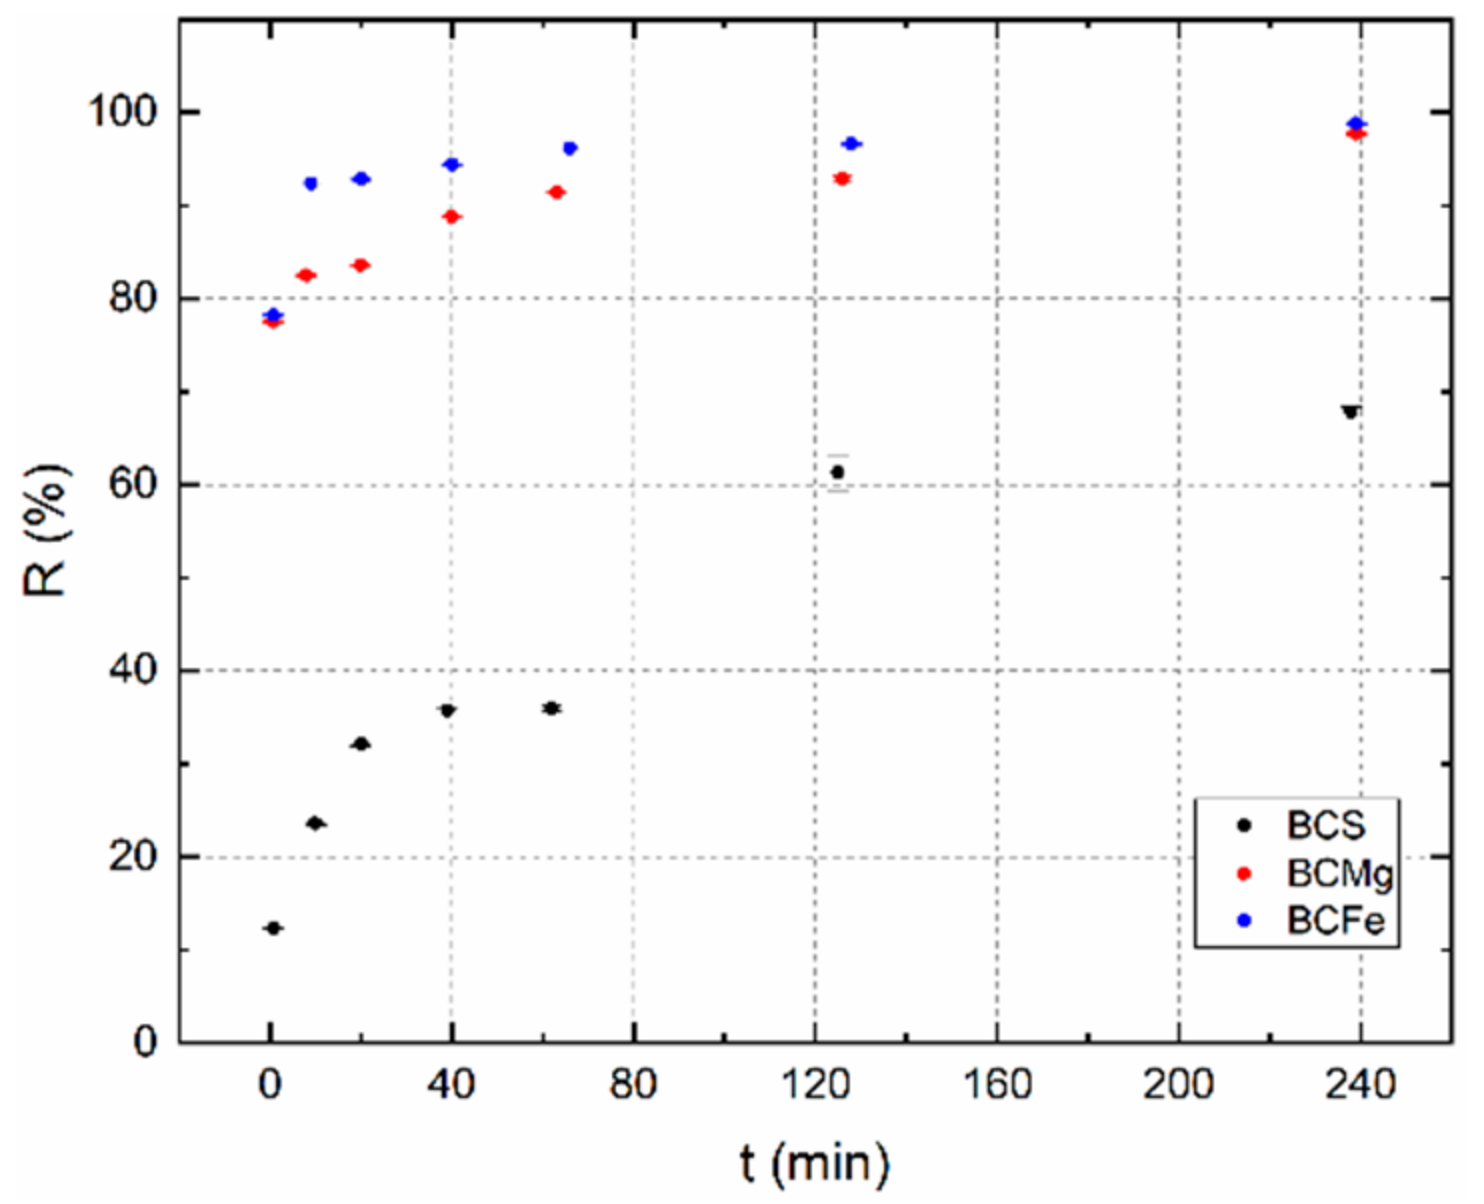
The achievement of sorption equilibrium is relatively slow for all investigated BC samples. In Figure 3 can be seen that BCMg and BCFe reached it almost 100% approximately in 240 min, BCS reached only 78% at the same time. This is the direct cause of sample pretreatment which caused increase in specific surface area, i.e., for BCMg: 75 m2·g−1, for BCFe: 7 m2·g−1, while the value for the BCS was only 3 m2·g−1. This is also a direct consequence of the higher R values of the BCMg and BCF samples. Due to the short half-life of 99mTc, the contact time of 240 min was chosen as the maximum possible for further batch experiment described below.

3.2.4. Freundlich Isotherm

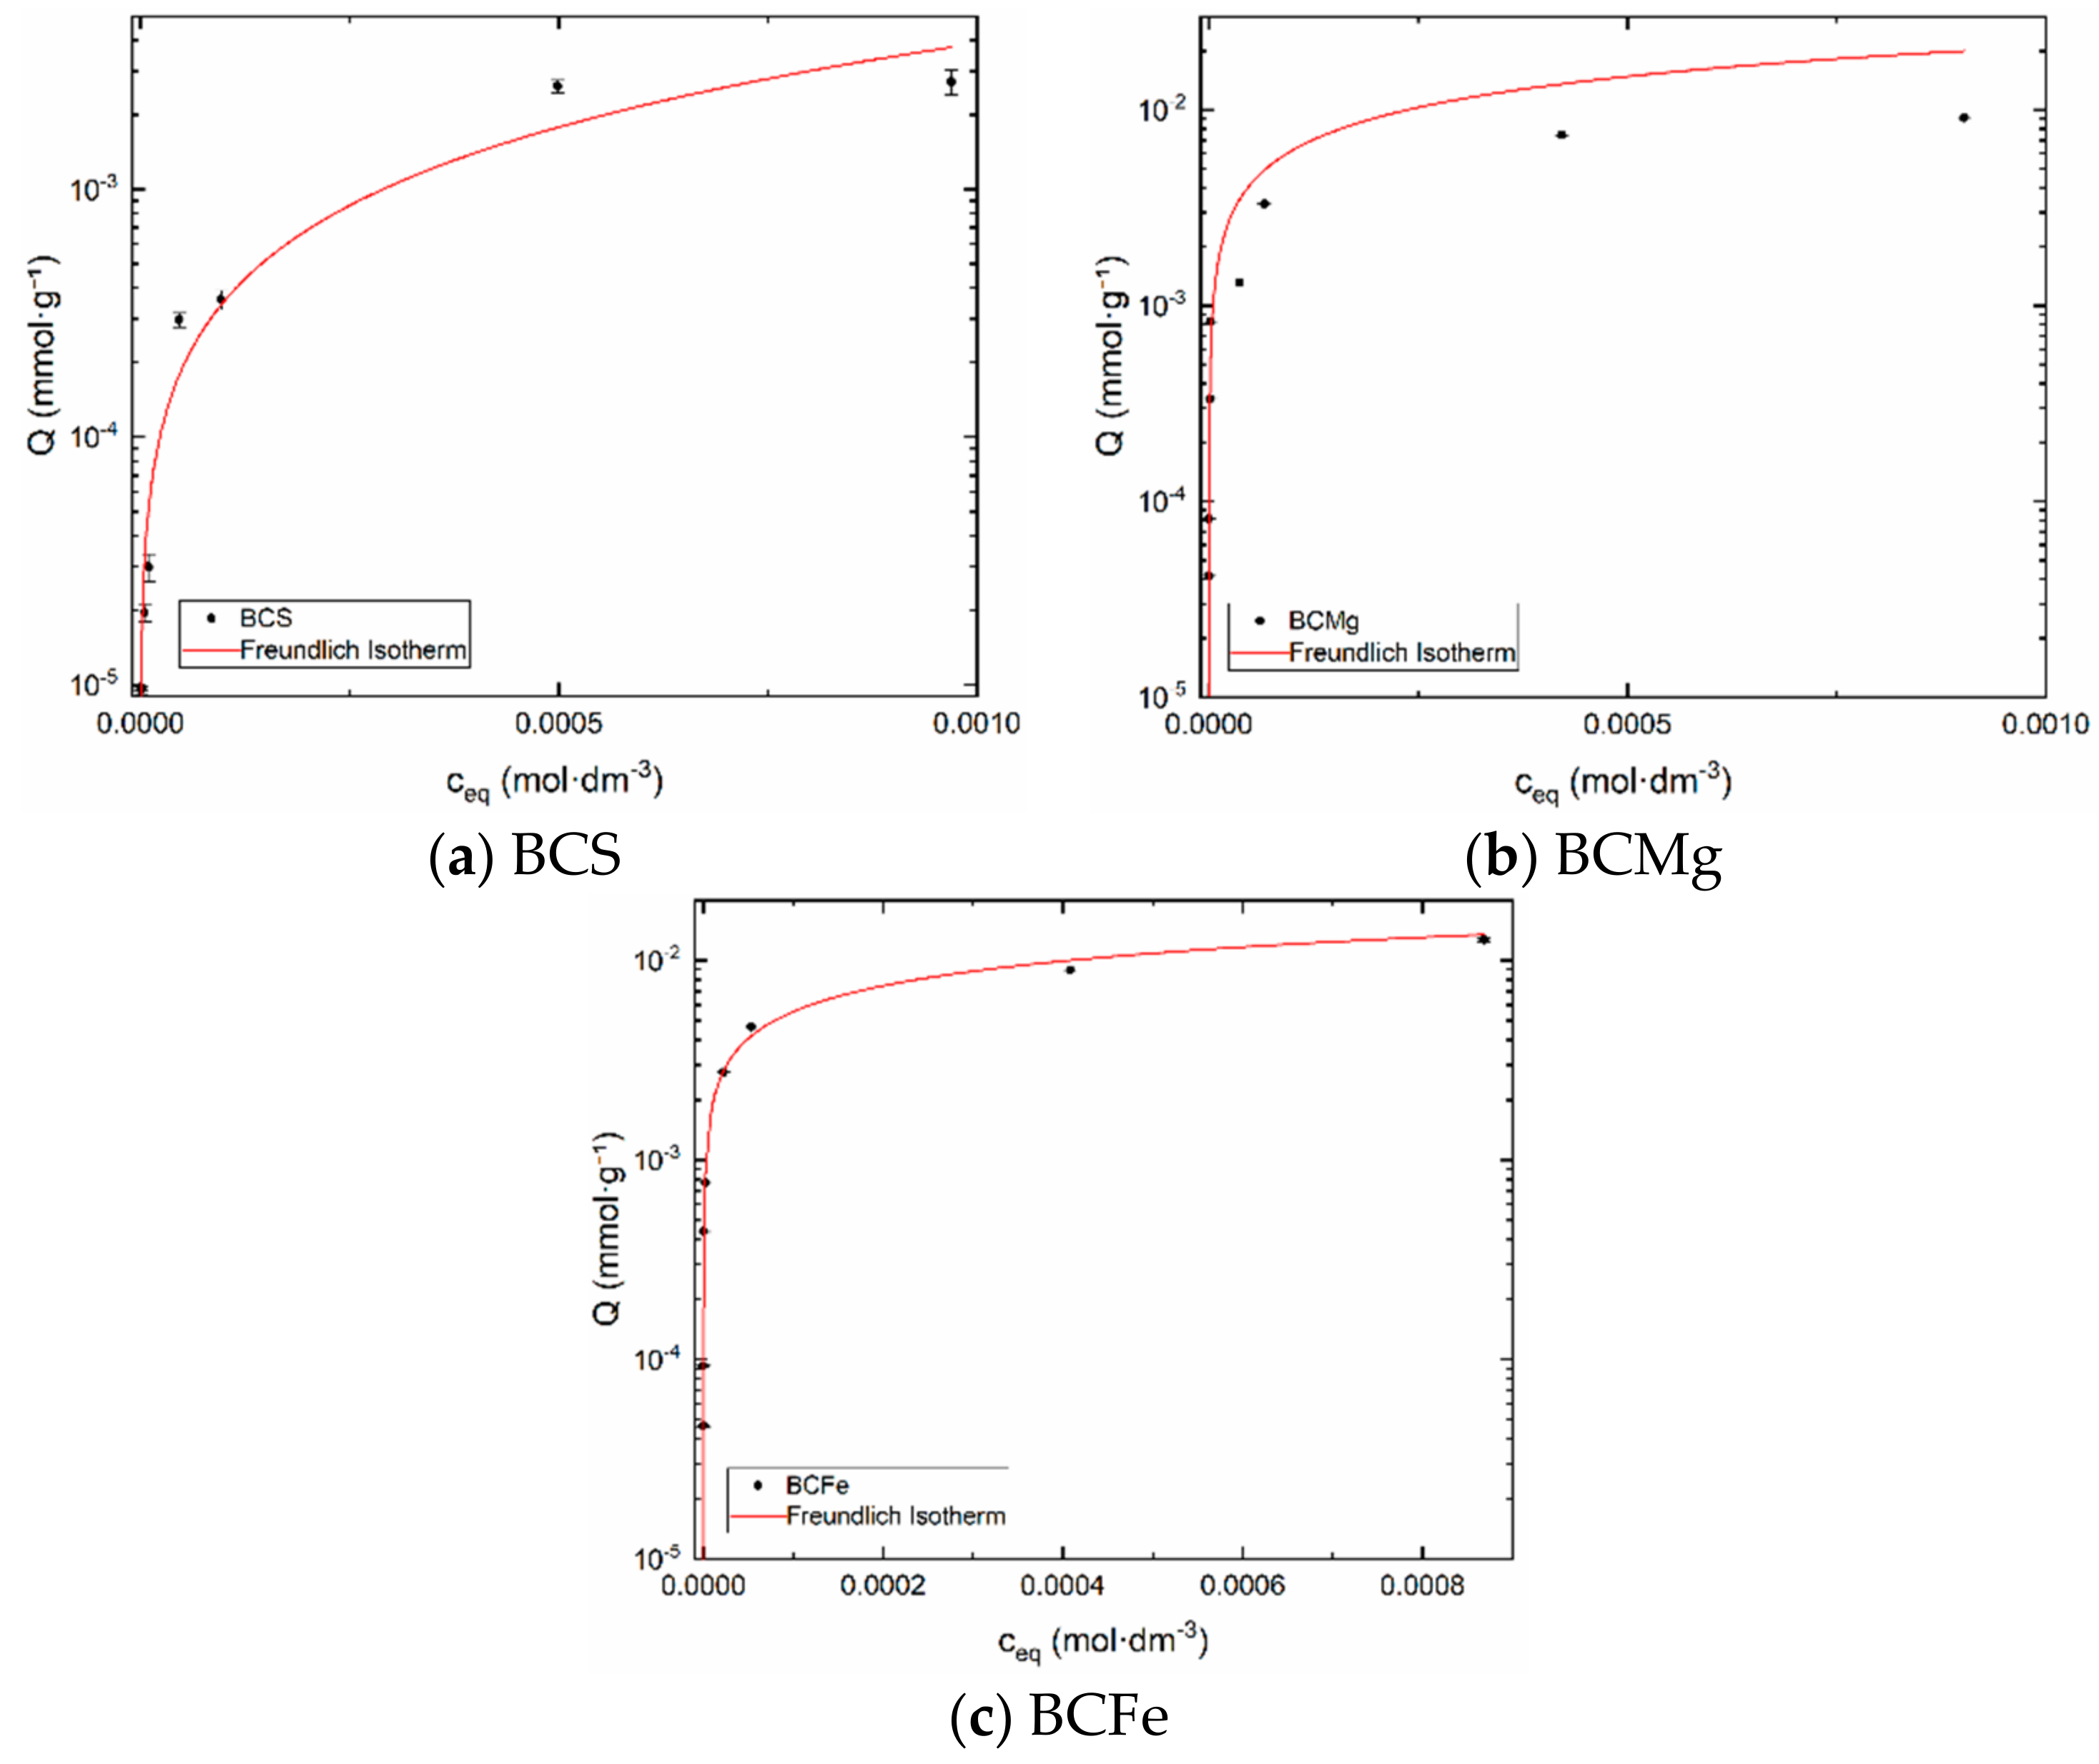
Freundlich adsorption isotherm describes the reversible and non-linear adsorption process. It is not restricted to monolayer; the multilayer formation is possible. Experimental data were obtained by the batch method. Freundlich isotherm was chosen as the most suitable for biochar samples. This is indicated by the values of the coefficients of determination, which are larger for the Freundlich isotherm. Freundlich: R2(BCS) = 0.85487, R2(BCMg) = 0.88979, R2(BCFe) = 0.98994; Langmuir: R2(BCS) = 0.74133, R2(BCMg) = 0.86398, R2(BCFe) = 0.98570. The result as a dependence of sorption capacity qF on ceq is in Figure 4.
Freundlich constants kF, regression constants nF, and coefficients of determination R2 are shown in Table 8. The values of nF are close to one for samples BCS and BCFe, greater than one for BCMg. Therefore, the adsorption is favorable in all cases, which corresponds to the concave shape of isotherms (see Figure 4). However, the best properties for the sorption have the samples BCFe and BCMg. The closest R2 value to 1 can be observed for sample BCFe, which means the most reproducible and credible data for calculation.

3.3. Dynamic Sorption Experiments

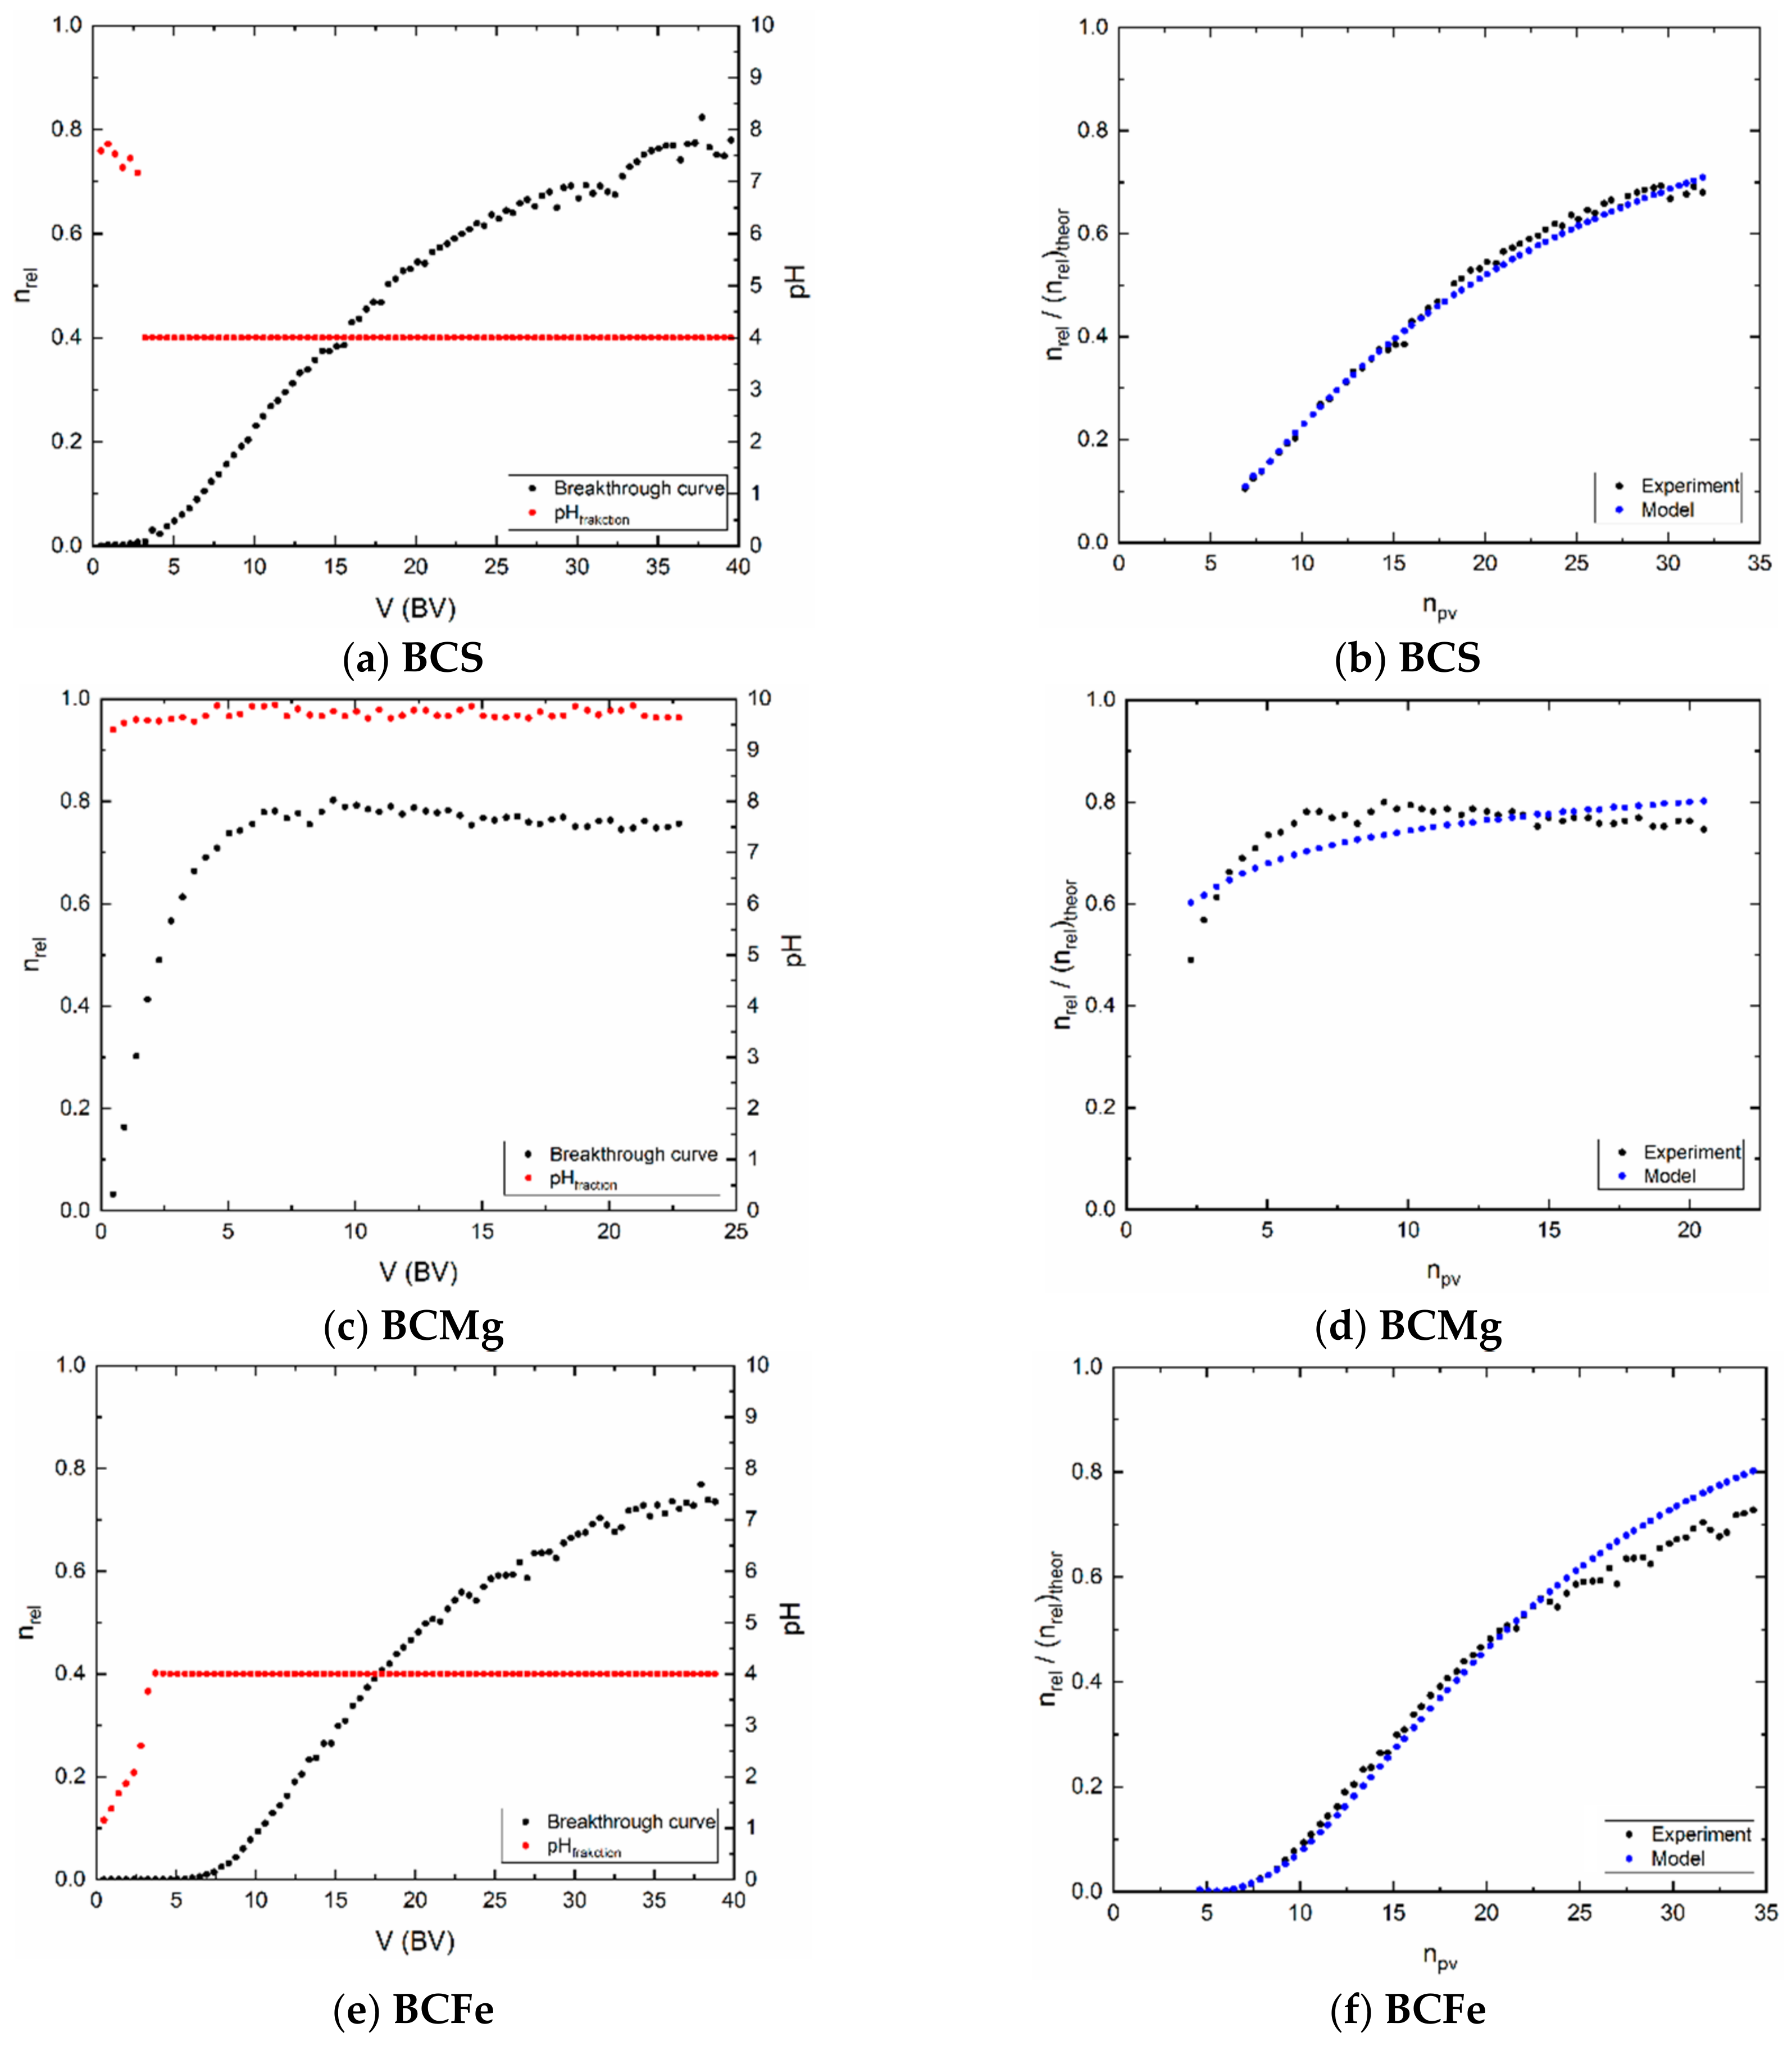
The course of the breakthrough curves in Figure 5a,c,e showed that, that relative count rate did not reach 100%, i.e., the count rate at the column output did not reach the value at the input to the column. There are more possible reasons of these results, namely, slow sorption kinetics, low residence time of the solution in bed, high dispersion into the bed connected with so called wall effect. As for the sorption kinetics, it was followed in Section 3.2.2 and, evidently, sample BCS has the sorption rate most slow (it has to be added, that this sample has the lowest sorption capacity, as well, see Figure 4a). The high dispersion is proved by the low values of Pe, where the small height of the layer in the columns and probably also the uneven deposition of sorbent grains in the layer also contribute to this, including the already mentioned wall effect.
A sample containing MgCl2 was expected to form a slightly acidic solution because MgCl2 hydrolyzed significantly. Therefore, it would be expected that the pH 1 of sorption solution would result in a rapid decrease in the pH of the fractions at the outlet of the column. However, it is just the opposite (Figure 5c). The pH rises very fast and is already above 9.5 in 2 BV. Thus, there must be another mechanism by which H+ ions are consumed from the sorption solution Now it is only possible to estimate the cause of this increase in pH, it is probably due to the capture of H+, or more precisely OH3+, on the surface groups of the layer sites of given sorbent (see determination of titration curves and Equation (3)). This is especially true for the sample BCMg. It is certainly interesting that in the case of BCS and BCFe samples, the pH value is set to four, probably due to the buffering efficiency of sites of these samples.
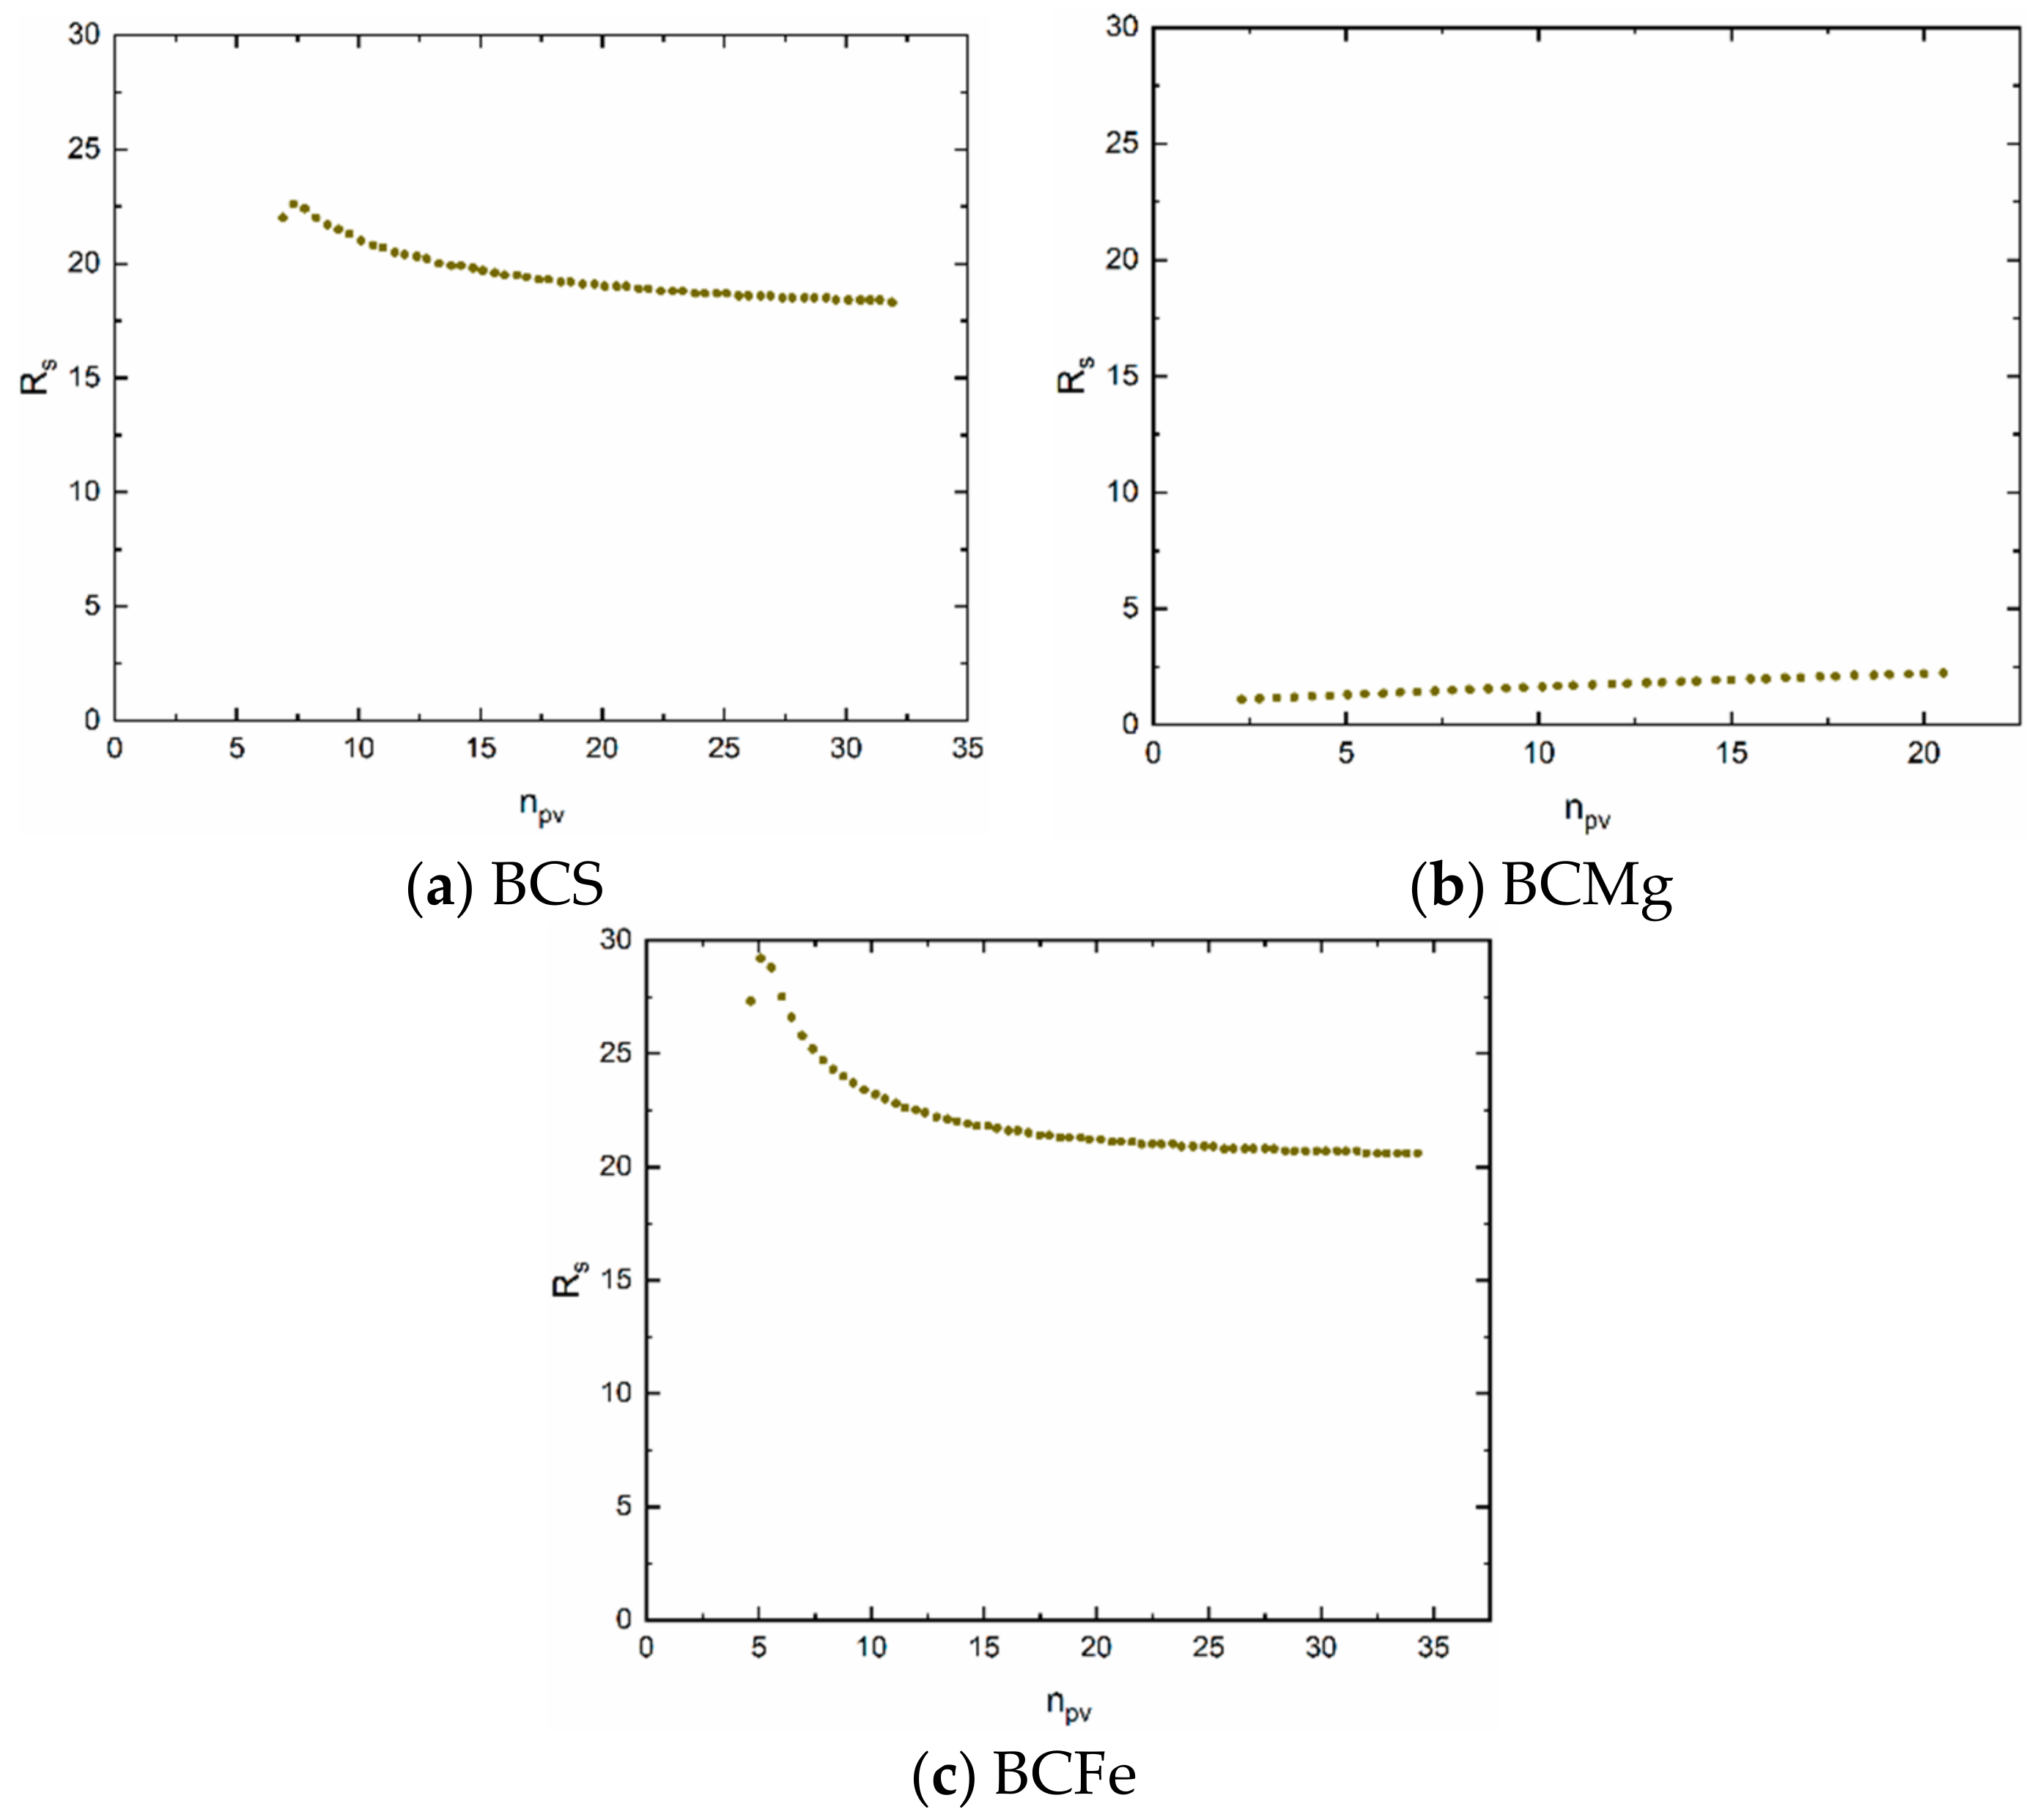
Evidently, a transport model based on a complementary error function, including the effect of dispersion in the layer expressed by the value of Pe, can be applied to the modelling of experimental results. This is indicated by the blue dots (model) versus the black dots (experiment) in Figure 5b,d,f. The suitability of the model is proved by the WSOS/DF criterion (Equations (12)–(14)) which satisfies the condition that its value is ≤20 (Table 9). It follows that the model used corresponds to the experimental conditions. The values of the Peclet number Pe, as was mentioned above, characterize the flow and is one of the parameters influencing the shape of the breakthrough curve. The values of sorption retardation coefficients Rs (Figure 6) are not constant, because the shapes of equilibrium isotherms are nonlinear, or, because its first derivative in point “c” is function of concentration (see Equations (46) and (47)). In other case, if equilibrium isotherm is linear, retardation coefficient is constant.

4. Conclusions

This work evaluates the use of biochar, its Mg and Fe engineered forms in relation to the 99mTcO4/ReO4 separation on these materials. The investigation of liquid phase pH in the Tc(VII) and Re(VII) sorption process has shown that the sorption preferably takes place in the acidic pH range. The sorption equilibrium is reached in two hours, R (sorption capacity) value reaches approximately the maximum for the BCMg and BCFe sample, for the BCS sample it reaches their capacity of 78%. This shows the suitability of the BCS sample treatment.
Breakthrough curves did not reach 100% in all cases. The reason, very probably, is that the sorption is slow due to the slow kinetics and higher dispersion of the liquid phase during the flow in the column, which is evident from the relatively low values of the Pe criterion. In addition, due to the short half-life 99mTc, the low flow rate of the sorption solution and the small volume of the fractions obtained, it was not possible to perform an experiment in these cases up to 100% breakthrough. Furthermore, it was found that increasing the flow of the liquid phase does not contribute to the acceleration of 99mTcO4/ReO4 sorption.
Potentiometric titrations of the biochar samples were performed to find the types of surface sites and to determine the surface charge as a function of pH. At the same time, it was found that chemical (CEM) and ion exchange (IExM) models are best suited for the description of surface groups in a given case. The charge that exists on the surface of the samples during the sorption of 99mTcO4/ReO4 under the given conditions is positive and, as a result, the sorption of anionic forms of Tc(VII) and Re(VII) takes place. Namely, the sorption proceeds by ion exchange on protonated functional groups of the ≡SOH2+ type.

Author Contributions

Conceptualization, M.D. and E.V.; methodology, M.D., E.V. and K.Š.; software, K.Š.; validation, M.G. and K.Š.; formal analysis, E.V.; investigation, E.V., M.D. and D.G.; resources, E.V. and M.D.; data curation, M.G. and K.Š.; writing—original draft preparation, M.D. and E.V.; writing—review and editing, K.Š., M.G. and D.G.; visualization, M.D.; supervision, M.G. and K.Š.; funding acquisition, M.G. All authors have read and agreed to the published version of the manuscript.

Funding

This research was funded by APVV agency, Project No. APVV-18-0534. This work was also performed under the auspices of Ministry of Education Youth and Sports; Project Nr. CZ.02.1.01/0.0/0.0/16_019/0000728: “RAMSES—Ultra-trace isotope research in social and environmental studies using accelerator mass spectrometry” is funded by MEYS and European Union—European Structural and Investment Funds, Operational Programme Research, Development and Education.

Institutional Review Board Statement

This study has not been carried out on humans or animals.

Informed Consent Statement

Not applicable.

Data Availability Statement

The data presented in this study are available on request from the corresponding author.

Acknowledgments

The authors would like to thank to the Jan John and Mojmír Němec for support with manuscript.

Conflicts of Interest

The authors declare no conflict of interest. The funders had no role in the design of the study; in the collection, analyses, or interpretation of data; in the writing of the manuscript, or in the decision to publish the results.

References

  1. Li, D.; Seaman, J.C.; Kaplan, D.I.; Heald, S.M.; Sun, C. Pertechnetate TcO4 sequestration from groundwater by cost-effective organoclays and granular activated carbon under oxic-environmental conditions. Chem. Eng. J. 2019, 360, 1–9. [Google Scholar] [CrossRef]
  2. Chen, L.; Yin, X.; Yu, Q.; Lu, S.; Meng, F.; Ning, S.; Wang, X.; Wei, Y. Rapid and selective capture of perrhenate anion from simulated groundwater by a mesoporous silica-supported anion exchanger. Micropor. Mesopor. Mater. 2019, 274, 155–162. [Google Scholar] [CrossRef]
  3. Isaacs, M.; Lange, S.; Deissmannn, G.; Bosbach, D.; Mildowski, A.E.; Read, D. Retention of Technetium-99 by grout and backfill cements: Implications for the safe disposal of radioactive waste. Appl. Geochem. 2020, 116, 104580. [Google Scholar] [CrossRef]
  4. Emerson, P.H.; Gebru, A.; Boglaienko, D.; Katsenovich, Y.P.; Kandel, S.; Levitskaia, T.G. Impact of zero valent iron aging on reductive removal of technetium-99. J. Environ. Chem. Eng. 2020, 8, 103767. [Google Scholar] [CrossRef]
  5. Hu, H.; Jiang, B.; Wu, H.; Zhang, J.; Chen, X.H. Bamboo (Acidosasa edulis) shoot shell biochar: Its potential isolation and mechanism to perrhenate as a chemical surrogate for pertechnetate. J. Environ. Radioact. 2016, 165, 39–46. [Google Scholar] [CrossRef] [PubMed]
  6. Schwochau, K. Technetium Chemistry and Radiopharmaceutical Applications; Wiley-VCH: Weinheim, Germany, 2000; ISBN 3-527-29496-1. [Google Scholar]
  7. Serne, R.J.; Crum, J.V.; Riley, B.J.; Levitskaia, T.G. Options for the Separation and Immobilization of Technetium; (No. PNNL-25834; EMSP-RPT-029Rev0); Pacific Northwest National Lab. (PNNL): Richland, WA, USA, 2016. [Google Scholar]
  8. TrisKem International. Extraction Chromatography. Technical Documentation. Available online: https://www.triskem-international.com/scripts/files/5addcf96423962.97324869/technical_doc_all-products_web-0.pdf (accessed on 11 November 2020).
  9. Viglašová, E.; Daňo, M.; Galamboš, M.; Rosskopfová, O.; Rajec, P.; Novák, I. Column studies for the separation of 99mTc using activated carbon. J. Radioanal. Nucl. Chem. 2016, 307, 591–597. [Google Scholar] [CrossRef]
  10. Hu, H.; Sun, L.; Gao, Y.; Wang, T.; Huang, Y.; Lv, C.; Zhang, Y.F.; Huang, Q.; Chen, X.; Wu, H. Synthesis of ZnO nanoparticles-anchored biochar composites for selective removal of perrhenate, a surrogate for pertechnetate, from radioactive effluents. J. Hazard. Mat. 2020, 387, 121670. [Google Scholar] [CrossRef]
  11. Pandey, D.; Daverey, A.; Arunachalam, K. Biochar: Production, properties and emerging role as a support for enzyme immobilization. J. Clean. Prod. 2020, 255, 120267. [Google Scholar] [CrossRef]
  12. Khan, M.B.; Cui, X.; Jilan, G.; Lu, L.T.M.; Cao, X.; Sahito, Z.A.; Hamid, Y.; Hussain, B.; Yang, X.; He, Z. New insight into the impact of biochar during vermi-stabilization of divergent biowastes: Literature synthesis and research pursuits. Chemosphere 2020, 238, 124679. [Google Scholar] [CrossRef]
  13. Rajapaksha, A.U.; Chen, S.S.; Tsang, D.C.; Zhang, M.; Vithanage, M.; Mandal, S.; Gao, B.; Bolan, N.S.; Ok, Y.S. Review: Engineered/designer biochar for contaminant removal/immobilization from soil and water: Potential and implication of biochar modification. Chemosphere 2016, 148, 276–291. [Google Scholar] [CrossRef]
  14. O’Toole, A.; Andersson, D.; Gerlach, A.; Glaser, B.; Kammann, C.; Kern, J.; Kuoppamäki, K.; Mumme, J.; Schmidt, H.P.; Schulze, M. Current and future applications for biochar. In Biochar in European Soils and Agriculture—Science and Practice, 1st ed.; Taylor & Francis Group: Abingdon, UK, 2016; pp. 253–280. ISBN 9780367606046. [Google Scholar]
  15. Beesley, L.; Marmiroli, M. The immobilization and retention of soluble arsenic, cadmium and zinc by biochar. Environ. Pollut. 2011, 159, 474–480. [Google Scholar] [CrossRef] [PubMed]
  16. Mukherjee, A.; Zimmerman, A.R.; Harris, W. Surface chemistry variations among a series of laboratory-produced biochars. Geoderma 2011, 163, 247–255. [Google Scholar] [CrossRef]
  17. Chen, B.; Chen, Z.; Lv, S. A novel magnetic biochar efficiently sorbs organic pollutants and phosphates. Bioresour. Technol. 2011, 102, 716–723. [Google Scholar] [CrossRef]
  18. Li, H.; Dong, X.; Da Silva, E.B.; De Oliviera, L.M.; Chen, Y.; Ma, L.Q. Mechanisms of metal sorption by biochars: Biochar characteristics and modifications. Chemosphere 2017, 178, 466–478. [Google Scholar] [CrossRef] [PubMed]
  19. Thinnes, K.R.; Abdullah, E.C.; Mubarak, N.M.; Ruthiraan, M. Synthesis of magnetic biochar from agricultural waste biomass to enhancing route for waste-water polymer application: A review. Renew. Sust. Energ. Rev. 2017, 67, 257–276. [Google Scholar] [CrossRef]
  20. El-Naggar, A.; Lee, S.S.; Rinklebe, J.; Farooq, M.; Song, H.; Sarmah, A.K.; Zimmerman, A.R.; Ahmad, M.; Shaheen, S.M.; Ok, Y.S. Biochar application to low fertility soils: A review of current status, and future prospects. Geoderma 2019, 337, 536–554. [Google Scholar] [CrossRef]
  21. Lu, H.P.; Li, Z.A.; Gascó, G.; Méndez, A.; Shen, Y.; Paz-Ferreiro, J. Use of magnetic biochars for the immobilization of heavy metals in a multi-contaminated soil. Sci. Total. Environ. 2018, 622–623, 892–899. [Google Scholar] [CrossRef]
  22. Mazarji, M.; Aminzadeh, B.; Baghdadi, M.; Bhantnagar, A. Removal of nitrate from aqueous solution using modified granular activated carbon. J. Mol. Liq. 2017, 233, 139–148. [Google Scholar] [CrossRef] [Green Version]
  23. Viglašová, E.; Galamboš, M.; Diviš, D.; Danková, Z.; Daňo, M.; Krivosudský, L.; Lengauer, C.L.; Matik, M.; Briančin, J.; Soja, G. Engineer biochar as a tool for nitrogen pollutants removal: Preparation, characterization and sorption study. Desalin. Wat. Treat. 2020, 191, 318–331. [Google Scholar] [CrossRef]
  24. Daňo, M.; Viglašová, E.; Galamboš, M.; Štamberg, K.; Kujan, J. Surface Complexation Models of Pertechnetate on Biochar/Montmorillonite Composite—Batch and Dynamic Sorption Study. Materials 2020, 13, 3108. [Google Scholar] [CrossRef]
  25. Viglašová, E.; Galamboš, M.; Danková, Z.; Krivosudský, L.; Lengauer, C.L.; Hood-Nowotny, R.; Soja, G.; Rompel, A.; Matík, M.; Briančin, J. Production, characterization and adsorption studies of bamboo-based biochar/montmorillonite composite for nitrate removal. Waste Manag. 2018, 79, 385–394. [Google Scholar] [CrossRef] [PubMed]
  26. Filipská, H.; Štamberg, K. Mathematical modeling of a Cs(I)-Sr(II)-bentonite-magnetite sorption system, simulating the processes taking place in a deep geological repository. Acta Polytech. 2005, 45, 11–18. [Google Scholar] [CrossRef]
  27. Lutzenkirchen, J. Surface Complexation Modelling, 1st ed.; Elsevier: Amsterdam, The Netherlands, 2006; Volume 11, ISBN 9780123725721. [Google Scholar]
  28. Dvořák, L.; Ledvinka, M.; Sobotka, M. Famulus 3.5. Software; Charles University: Prague, Czech Republic, 1993. [Google Scholar]
  29. Steven, J.W. Calibration Method Using a Stable and Safe Redox Standard Solution. U.S. Patent 6,350,367 B1, 26 February 2002. [Google Scholar]
  30. Rahmani, A.; Mousavi, H.Z.; Fazli, M. Effect of nanostructure alumina on adsorption of heavy metals. Desalination 2010, 253, 94–100. [Google Scholar] [CrossRef]
  31. Rachinskii, V.V. The General Theory of Sorption Dynamics and Chromatography; Springer Verlag US: Boston, MA, USA, 1965; ISBN 978-1-4757-0063-3. [Google Scholar] [CrossRef]
  32. Bear, J. Dynamics of Fluids in Porous Media; Dover Publications, Inc.: New York, NY, USA, 1972; ISBN 9780444001146. [Google Scholar]
  33. Štamberg, K.; Palagyi, Š. Effect of grain size on the sorption and desorption of 137Cs in crushed granite columns and ground water system under dynamic conditions. J. Radioanal. Nucl. Chem. 2012, 293, 127–134. [Google Scholar] [CrossRef]
  34. Luyckx, M.; Hausman, J.-F.; Lutts, S.; Guerriero, G. Silicon and Plants: Current Knowledge and Technological Perspectives. Front. Plant. Sci. 2017, 8, 411. [Google Scholar] [CrossRef] [Green Version]
  35. Ang, K.L.; Li, D.; Nikoloski, A.N. The effectiveness of ion exchange resins in separating uranium and thorium from rare earth elements in acidic aqueous sulfate media. Part 1. Anionic and cationic resins. Hydrometallurgy 2017, 174, 147–155. [Google Scholar] [CrossRef] [Green Version]
  36. Takeno, N. Atlas of Eh-pH Diagrams. Intercomparison of Thermodynamic Databases; Open File Report No. 419; Geological Survey of Japan: Tokyo, Japan, 2005. [Google Scholar]
  37. Huinink, H.P.; Zahn, D. Elucidating water dynamics in MgCl2 hydrates from moleculardynamics simulation. Solid State Sci. 2017, 69, 64–70. [Google Scholar] [CrossRef]
  38. Hellman, H.; Laitinen, R.S.; Kaila, L.; Jalonen, J.; Hietapelto, V.; Jokela, J.; Sarpola, J.; Sarpola, A.; Rämö, J. Identification of hydrolysis products of FeCl3·6 H2O by ESI-MS. J. Mass. Spectrom. 2006, 41, 1421–1429. [Google Scholar] [CrossRef]
Figure 1. BCS experimental and calculated titration curves: (a) surface charge, Q = f(pH), (b) mol fractions, F = f(pH), of edge (SOH2+, SOH0, SO) and layer (XNa) sites.
Materials 14 00486 g001
Figure 2. (a) BCS, (b) BCMg, (c) BCFe. The dependence of R on pH and pHeq. Tracer 99mTcO4, m = 0.02 g, V = 2 cm3, t = 24 h.
Materials 14 00486 g002
Figure 3. The dependence of R on contact time t. Tracer 99mTcO4, m = 0.02 g, V = 2 cm3, pH = 1 (BCMg), pH = 4 (BCS & BCFe).
Materials 14 00486 g003
Figure 4. Freundlich isotherms. (a) BCS, (b) BCMg, (c) BCFe.
Materials 14 00486 g004
Figure 5. Left (a,c,e): Experimental breakthrough curves and actual pH of each fraction; Right (b,d,f): experimental breakthrough and the model.
Materials 14 00486 g005
Figure 6. Retardation coefficients. (a) BCS, (b) BCMg, (c) BCFe.
Materials 14 00486 g006
Table 1. Composition of sorption solutions and column bed masses.
ColumnSorption Solution
Samplem (g)pHc(NH4ReO4)
(mol·dm−3)
BCS0.343741 × 10−3
BCMg0.435815 × 10
BCFe0.576941 × 10−3
Table 2. Identified elements by X-ray fluorescence (XRF) (Kα levels).
SampleElement
BCS Si PCl FeNi Ag
BCMgMg SiSPClKCaCrFeNiZnRbRbAg
BCFe Al ClKCaCrFeNiZnRbRbAg
Table 3. Identified elements by energy-dispersive X-ray (EDX).
SampleElements
BCSCOMgAlPClKCa
BCMgCOMgAl Cl
BCFeCOMgAlPClK Fe
Table 4. Calculated model parameters for sample BCS.
K1K2Kex[SOH]tot
(mol·kg−1)
(1.54 ± 24.9) × 1015(1.53 ± 0.16) × 1011(8.71 ± 13.8) × 10−1(6.07 ± 0.03) × 10−2
WSOS/DFχ2σi[S]tot
(mol·kg−1)
10.31.34 × 1020.1(8.94 ± 0.05) × 10−2
Table 5. Mole fractions calculation result. (The values of F2 correspond to the values of pH0 and pHend, respectively. The values of F1 and F3 are function of ΣRe (=KReO4)).
ΣTc
(mol·dm−3)
ΣRe (=KReO4)
(mol·dm−3)
pH0pHendF1
[ReO4]
F2
[HReO4]
F3
[KReO4]
10−1010−203.60.349.80 × 10−11–3.90 × 10−70.66
10−1010−303.60.842.40 × 10−10–0.96 × 10−70.16
10−1010−403.60.982.28 × 10−10–1.13 × 10−60.02
10−1010−503.60.992.88 × 10−10–1.15 × 10−60.002
10−1010−40100.987.11 × 10−17–1.13 × 10−60.02
10−1210−303.60.842.41 × 10−10–9.60 × 10−70.16
10−1210−403.60.982.83 × 10−10–1.43 × 10−60.02
Table 6. Results of Eh(V) and pH measurements in NH4ReO4 solutions labelled with [99mTc]NaTcO4.
c(NH4ReO4) (mol·dm−3)Eh(mV)pH
5 × 10−5270.82
5 × 10−4321.01
5 × 10−4269.52
5 × 10−4265.42
1 × 10−4269.32
1 × 10−4269.92
1 × 10−3270.72
1 × 10−2270.52
Zobell’s solution 1−98.98.4
Zobell’s solution 2−99.78.4
Table 7. Minimum and maximum Dg values at which R reaches maximum.
SamplepHRmax (%)Dg (cm3·g−1)Dg,min (cm3·g−1)Dg,max (cm3·g−1)
BCS444.7 ± 0.280 ± 15851,502
BCMg193.3 ± 0.11383 ± 85776,680
BCFe499.2 ± 0.112,268 ± 2845852,015
Table 8. Parameters of the Freundlich fit.
SchemekFnFR2
BCS(1.95 ± 0.17) × 101(8.71 ± 0.14) × 10−10.85487
BCMg(6.24 ± 2.08) × 1028(965 ± 3.31) × 10−20.86398
BCFe(215 ± 1.16) × 10−1(946 ± 0.67) × 10−30.98994
Table 9. Calculated parameters and fit criterion.
WSOS/DFχ2σiPe
BCS0.301160.1(1.93 ± 0.06) × 100
BCMg0.62723.80.1(19.5 ± 1.72) × 10-2
BCFe1.1672.90.1(544 ± 4.68) × 10-2
Publisher’s Note: MDPI stays neutral with regard to jurisdictional claims in published maps and institutional affiliations.