Influence of Lime and Volcanic Ash on the Properties of Dune Sand as Sustainable Construction Materials

 , , , ,
Abstract
:1. Introduction
2. Materials Used
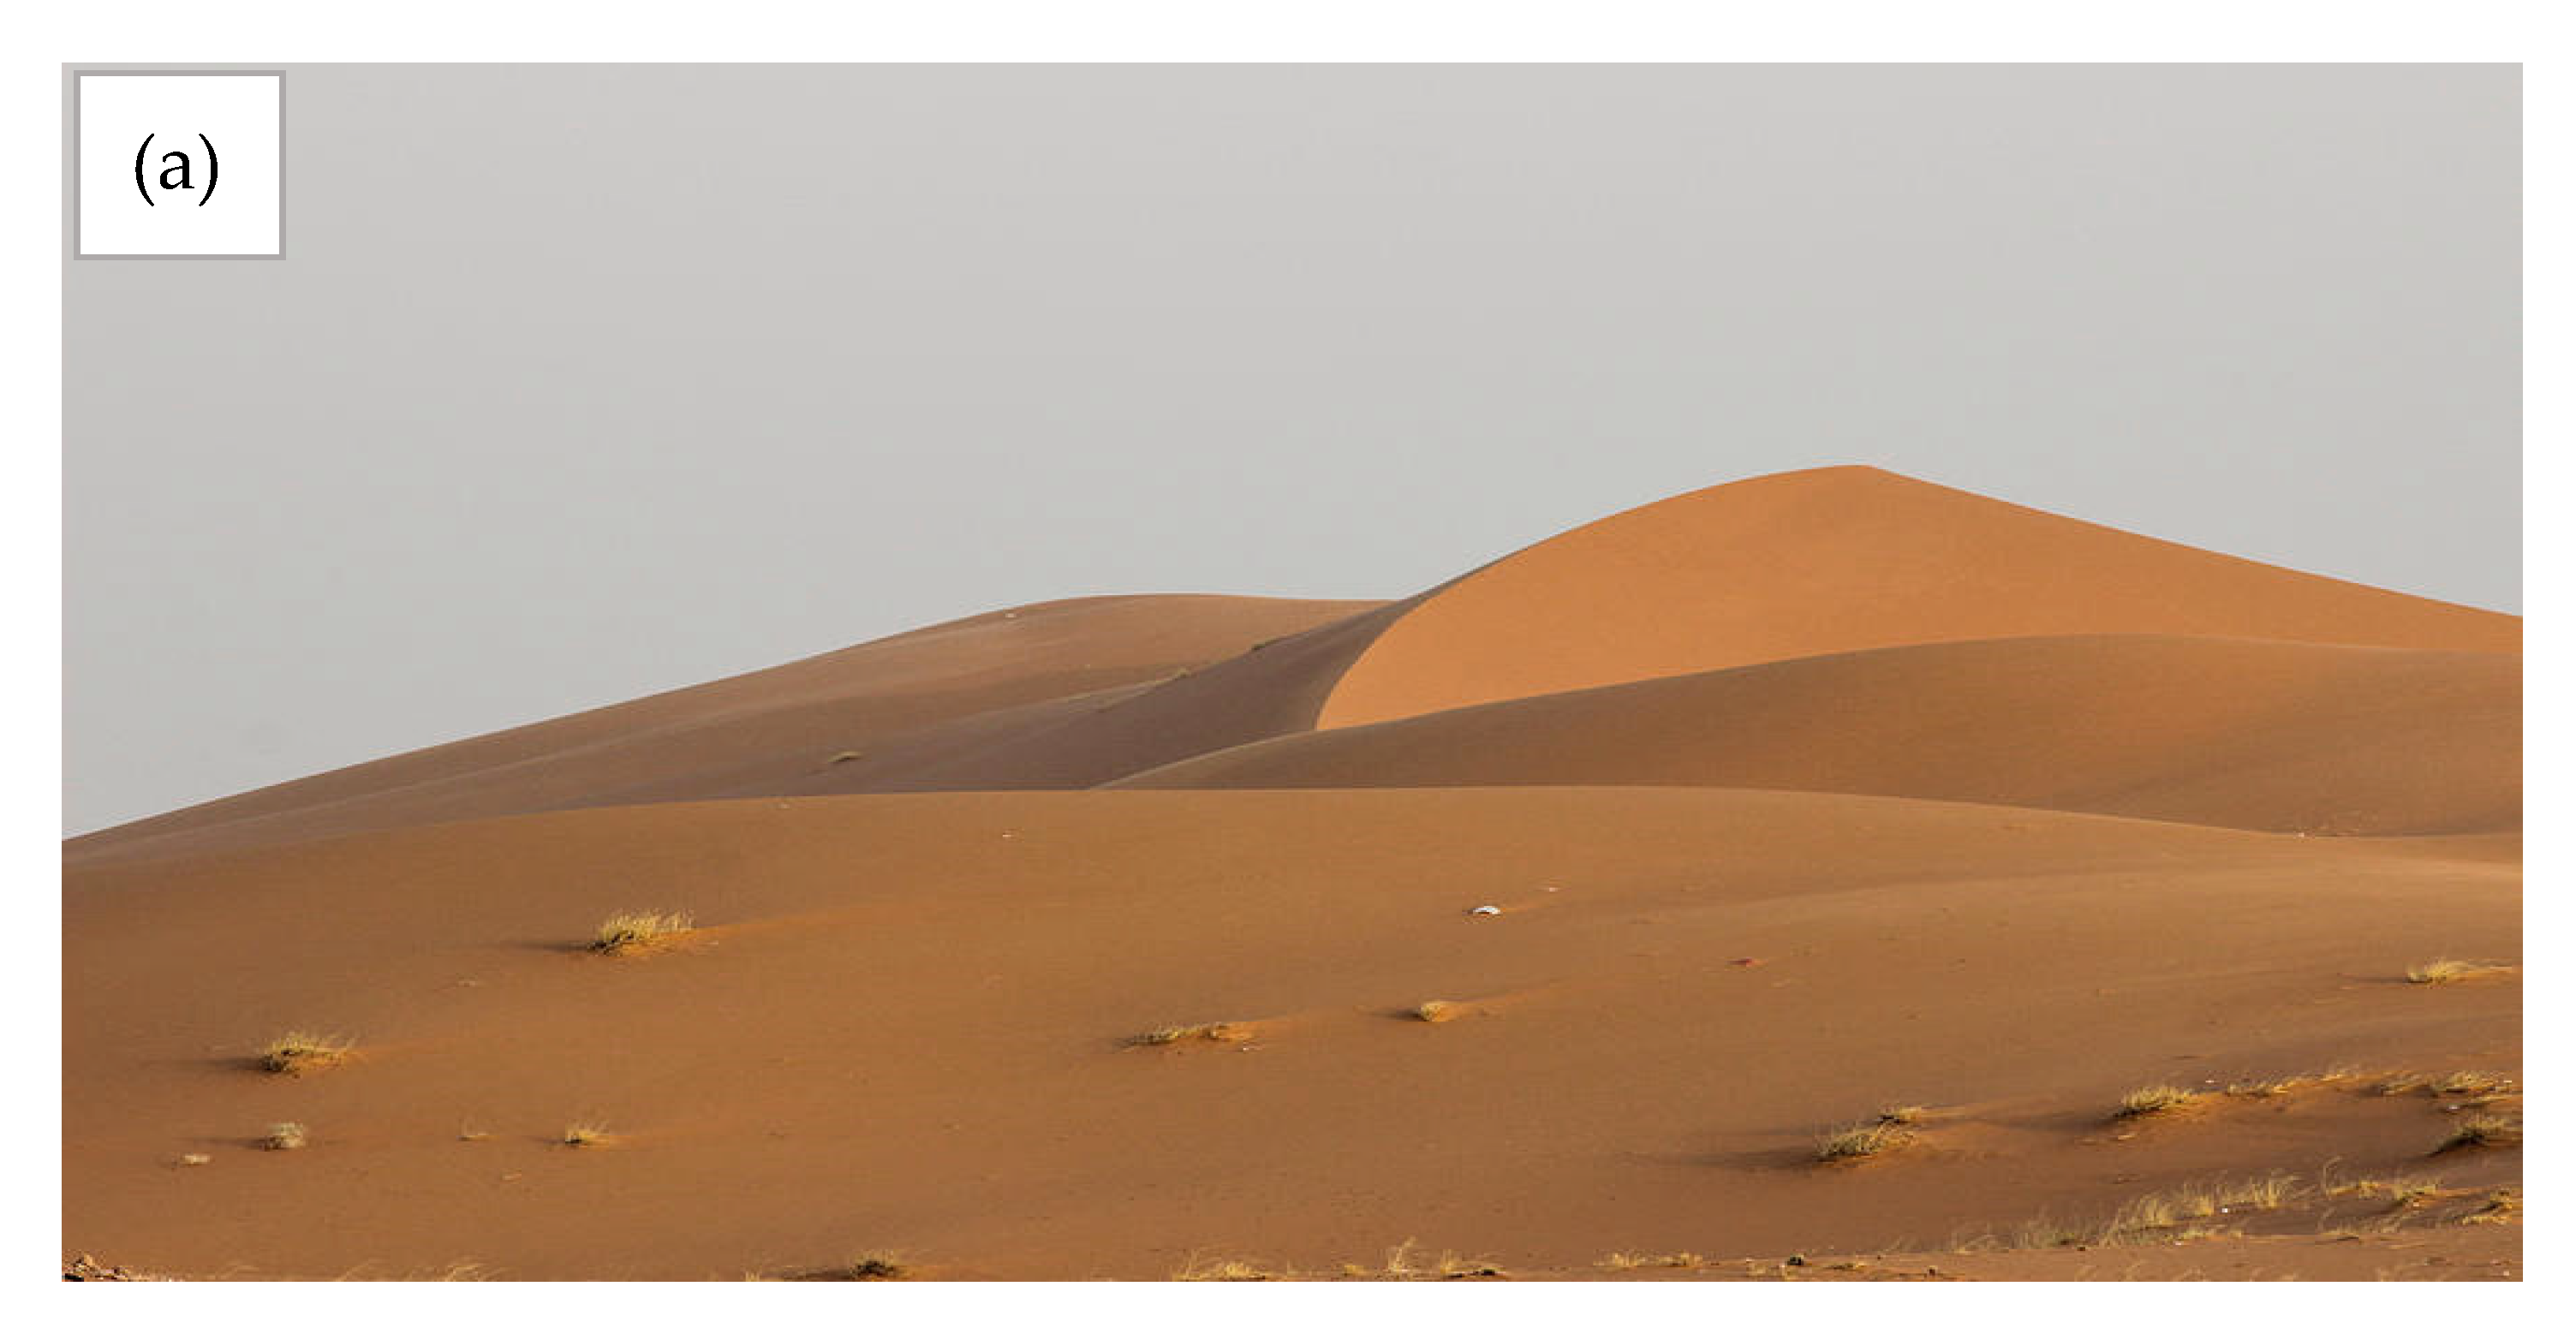
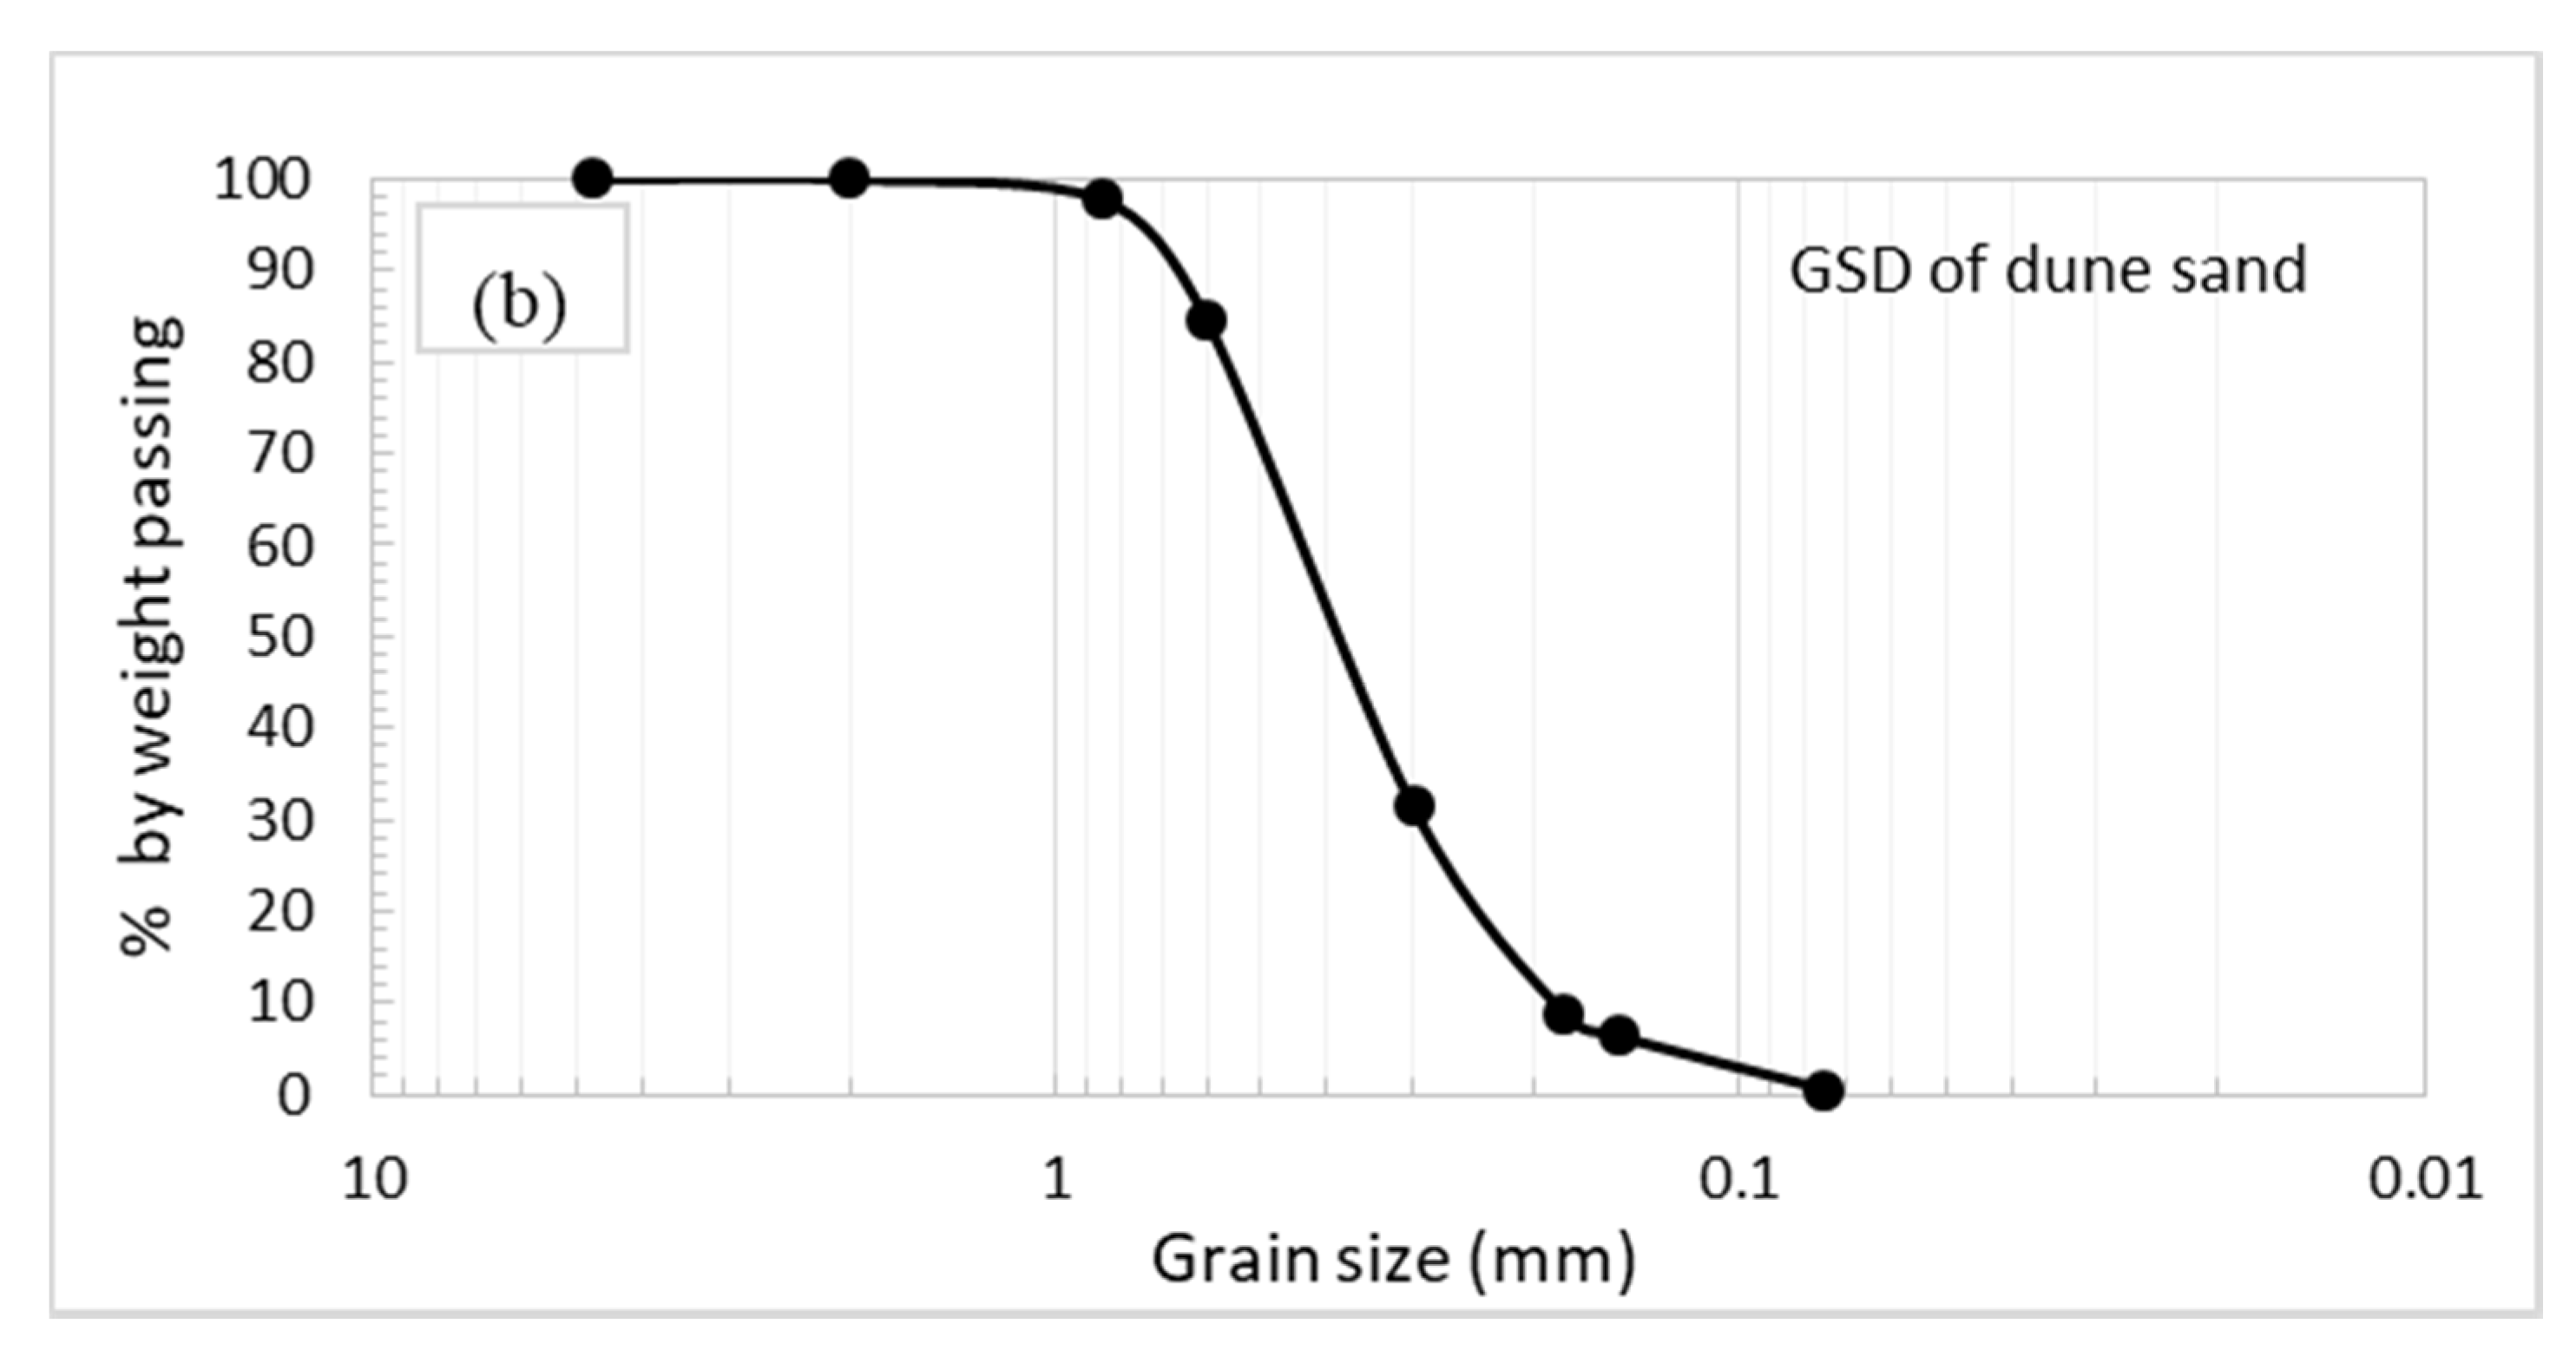
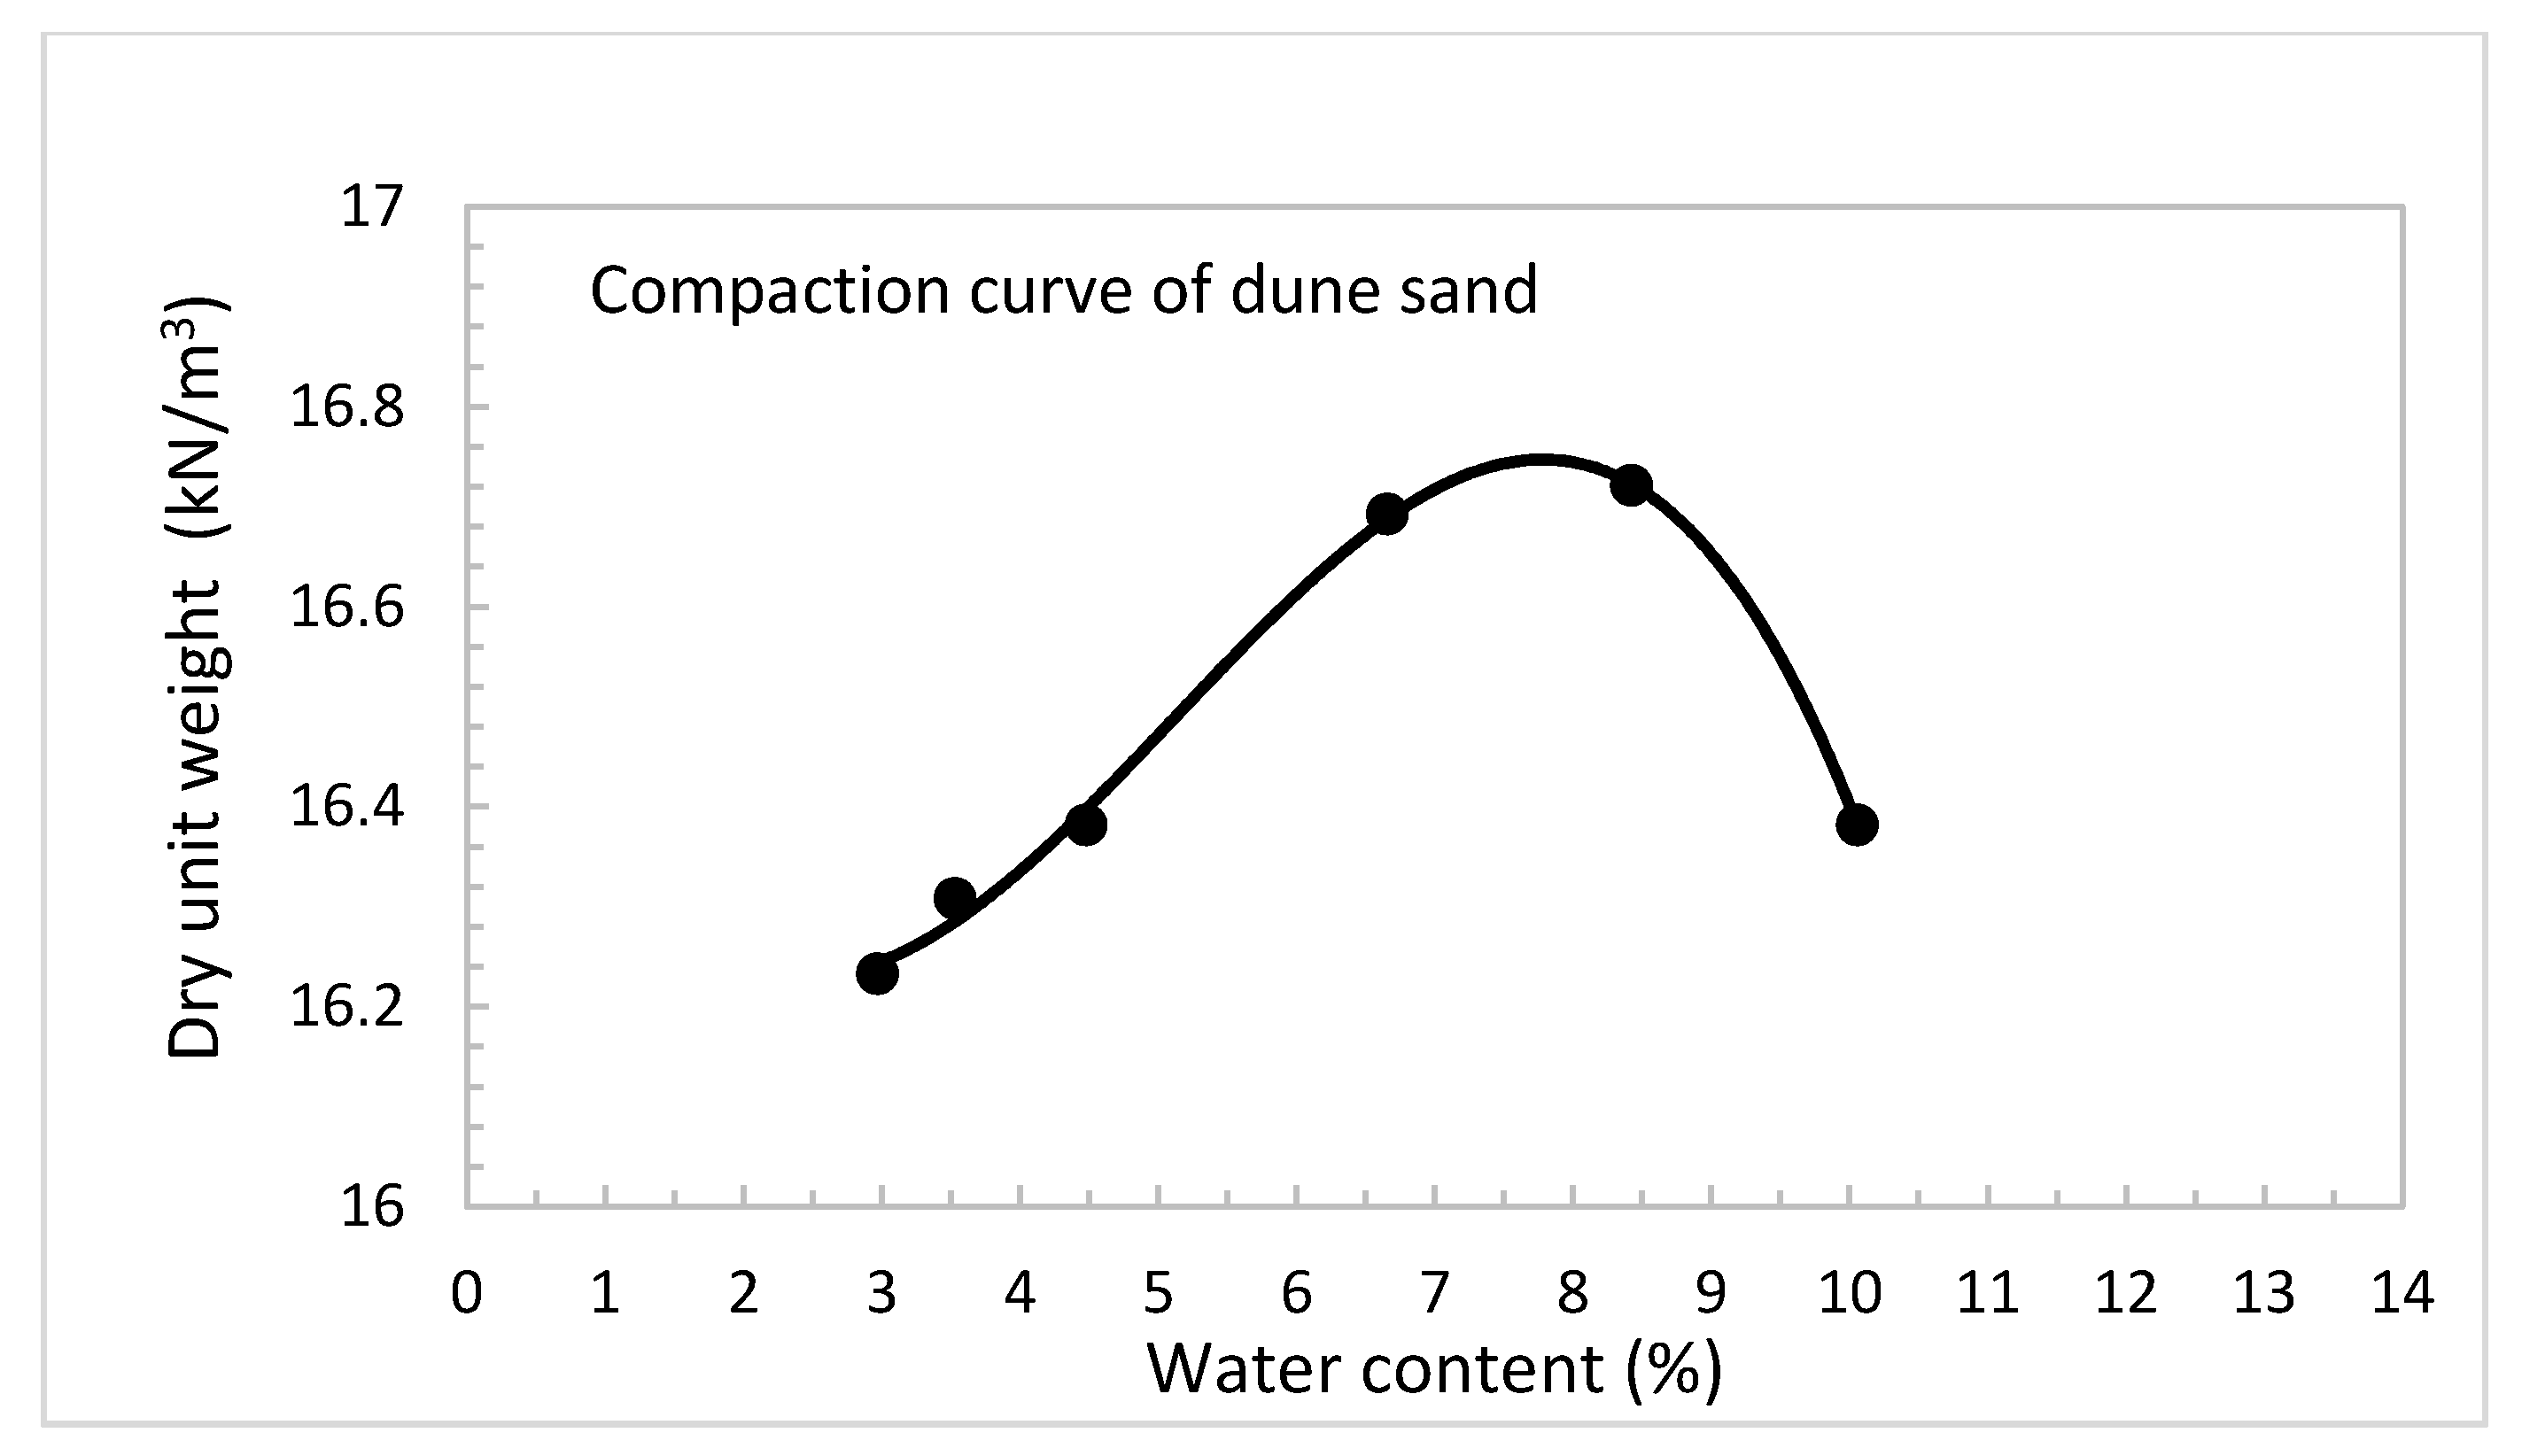
2.1. Dune Sand
2.2. Volcanic Ash (VA)
2.3. Hydrated Lime
2.4. Water
3. Experimental Program and Methodology
3.1. Physical and Engineering Properties Testing Program
3.2. Spectroscopy and Microscopy Testing Program
3.2.1. Raman Spectroscopy
3.2.2. Laser Scanning Microscopy
4. Results and Discussion
4.1. Raman Spectroscopy
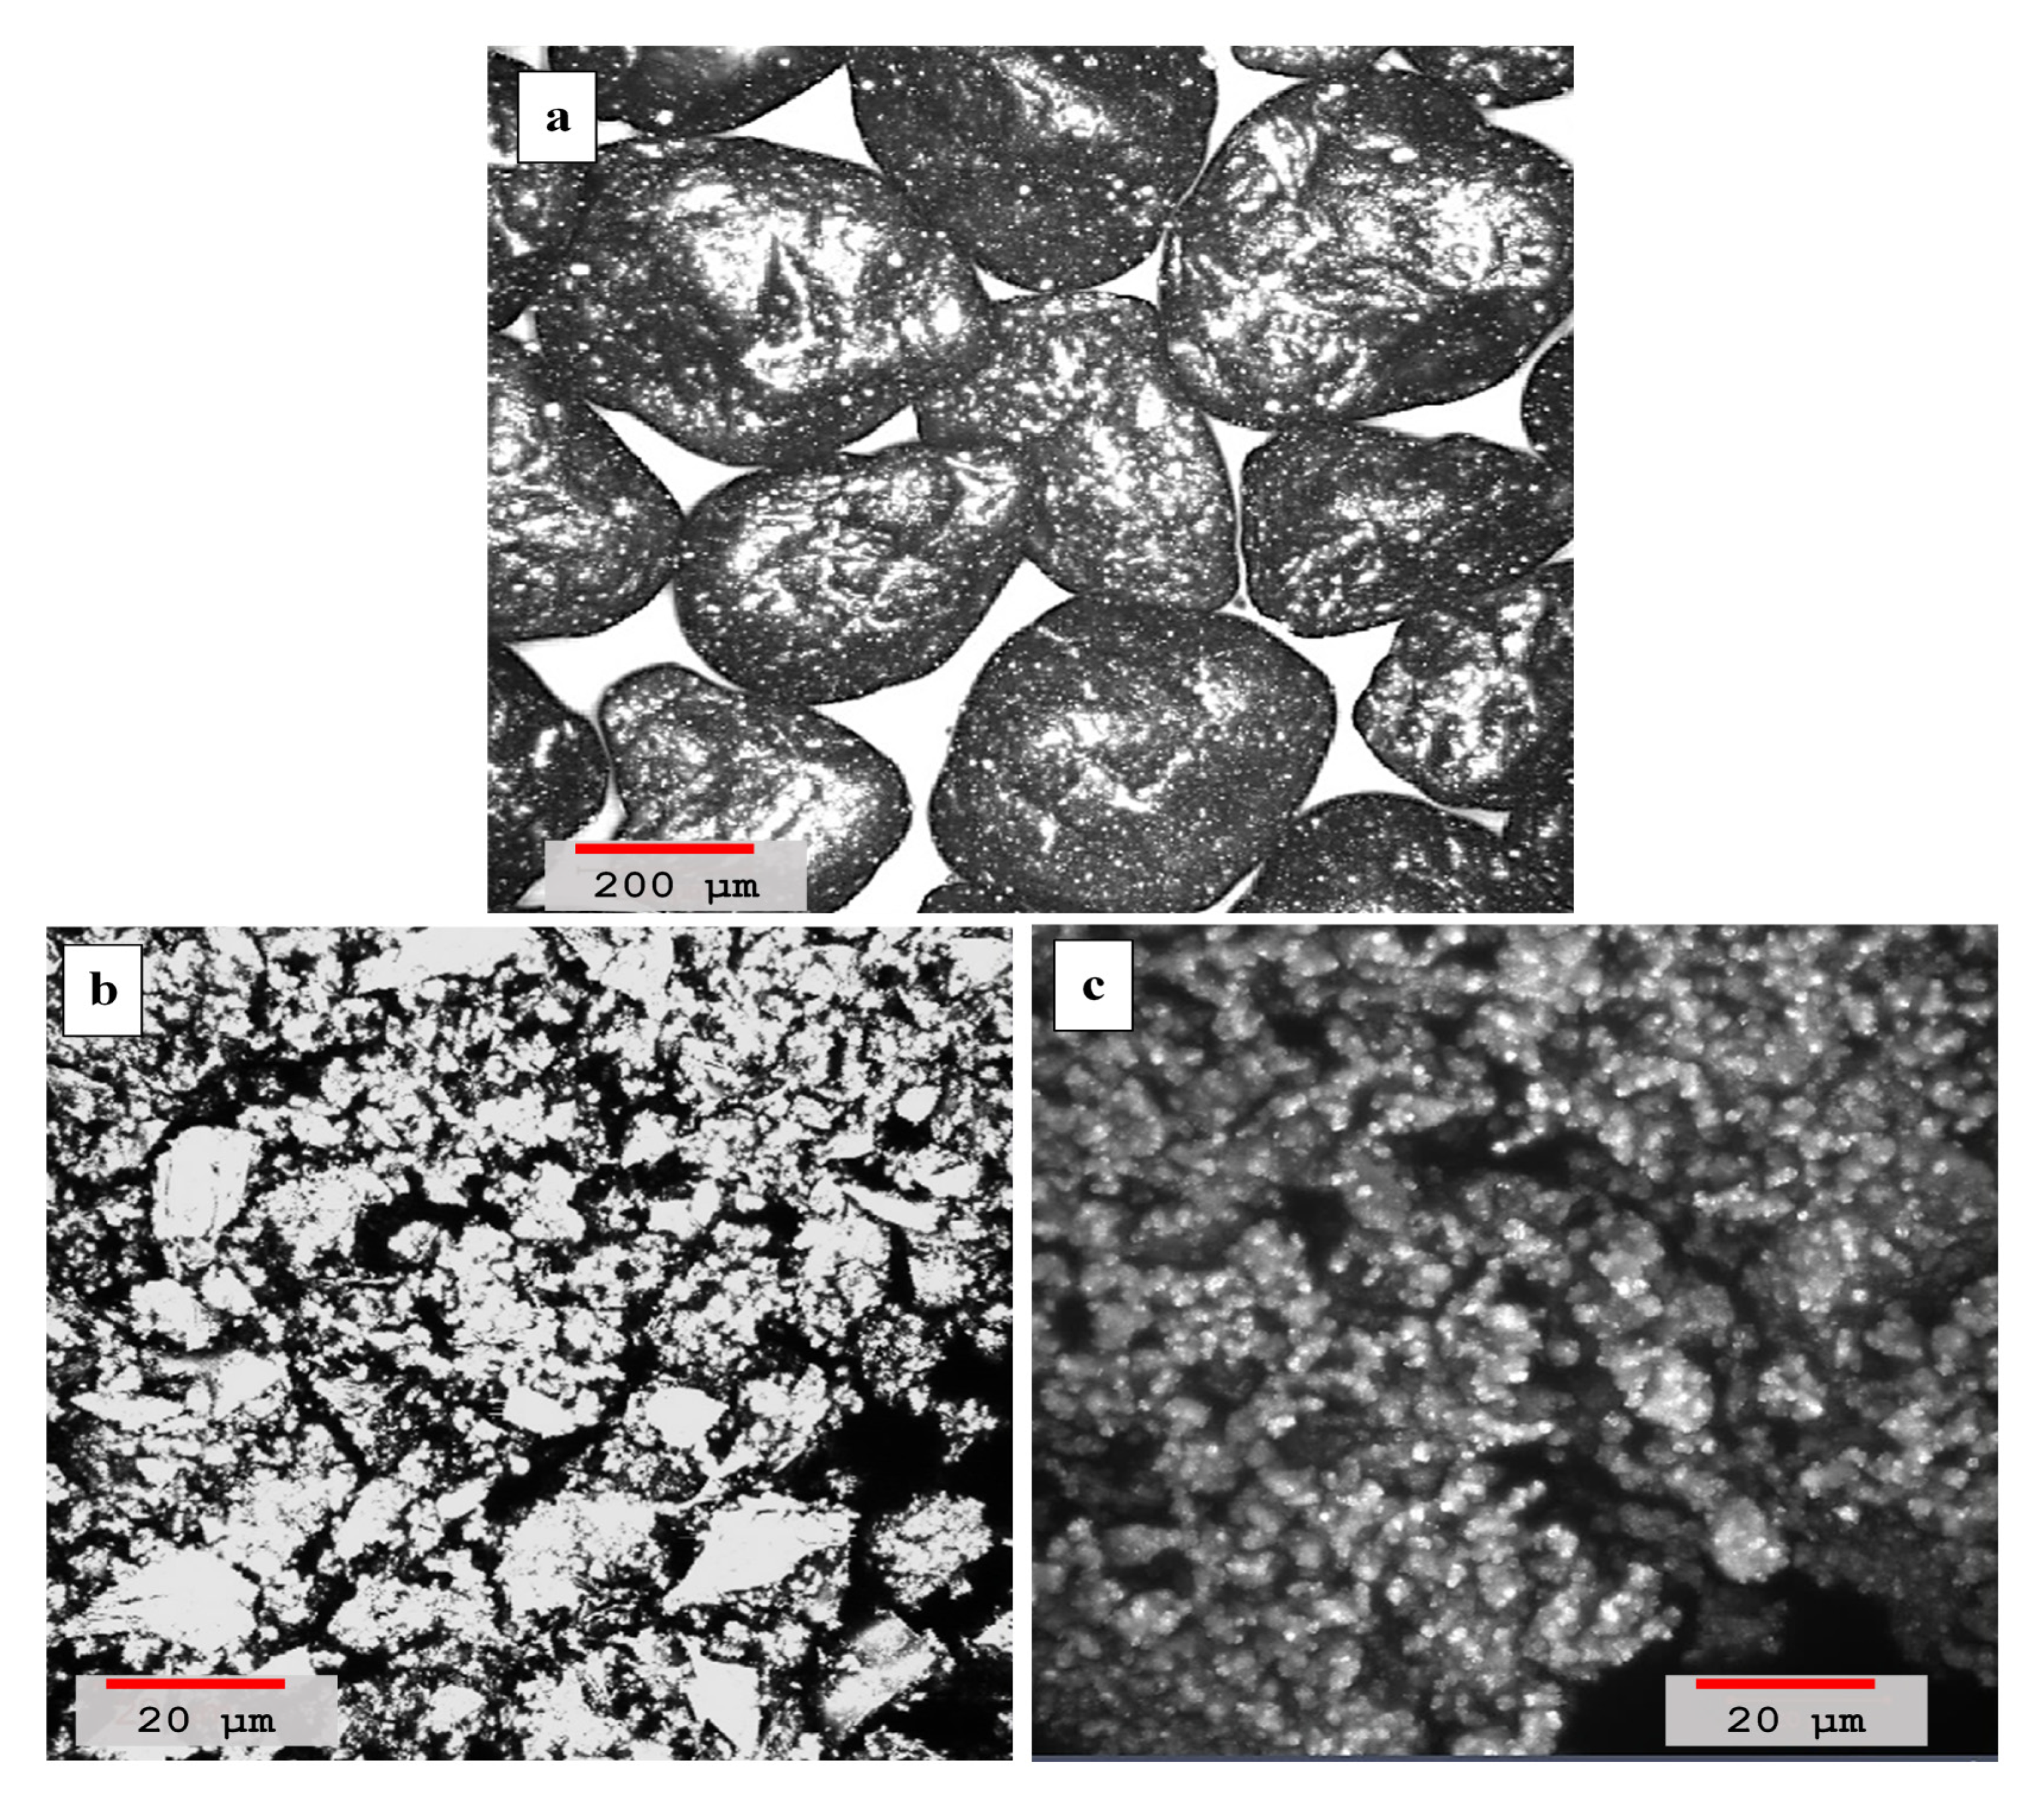
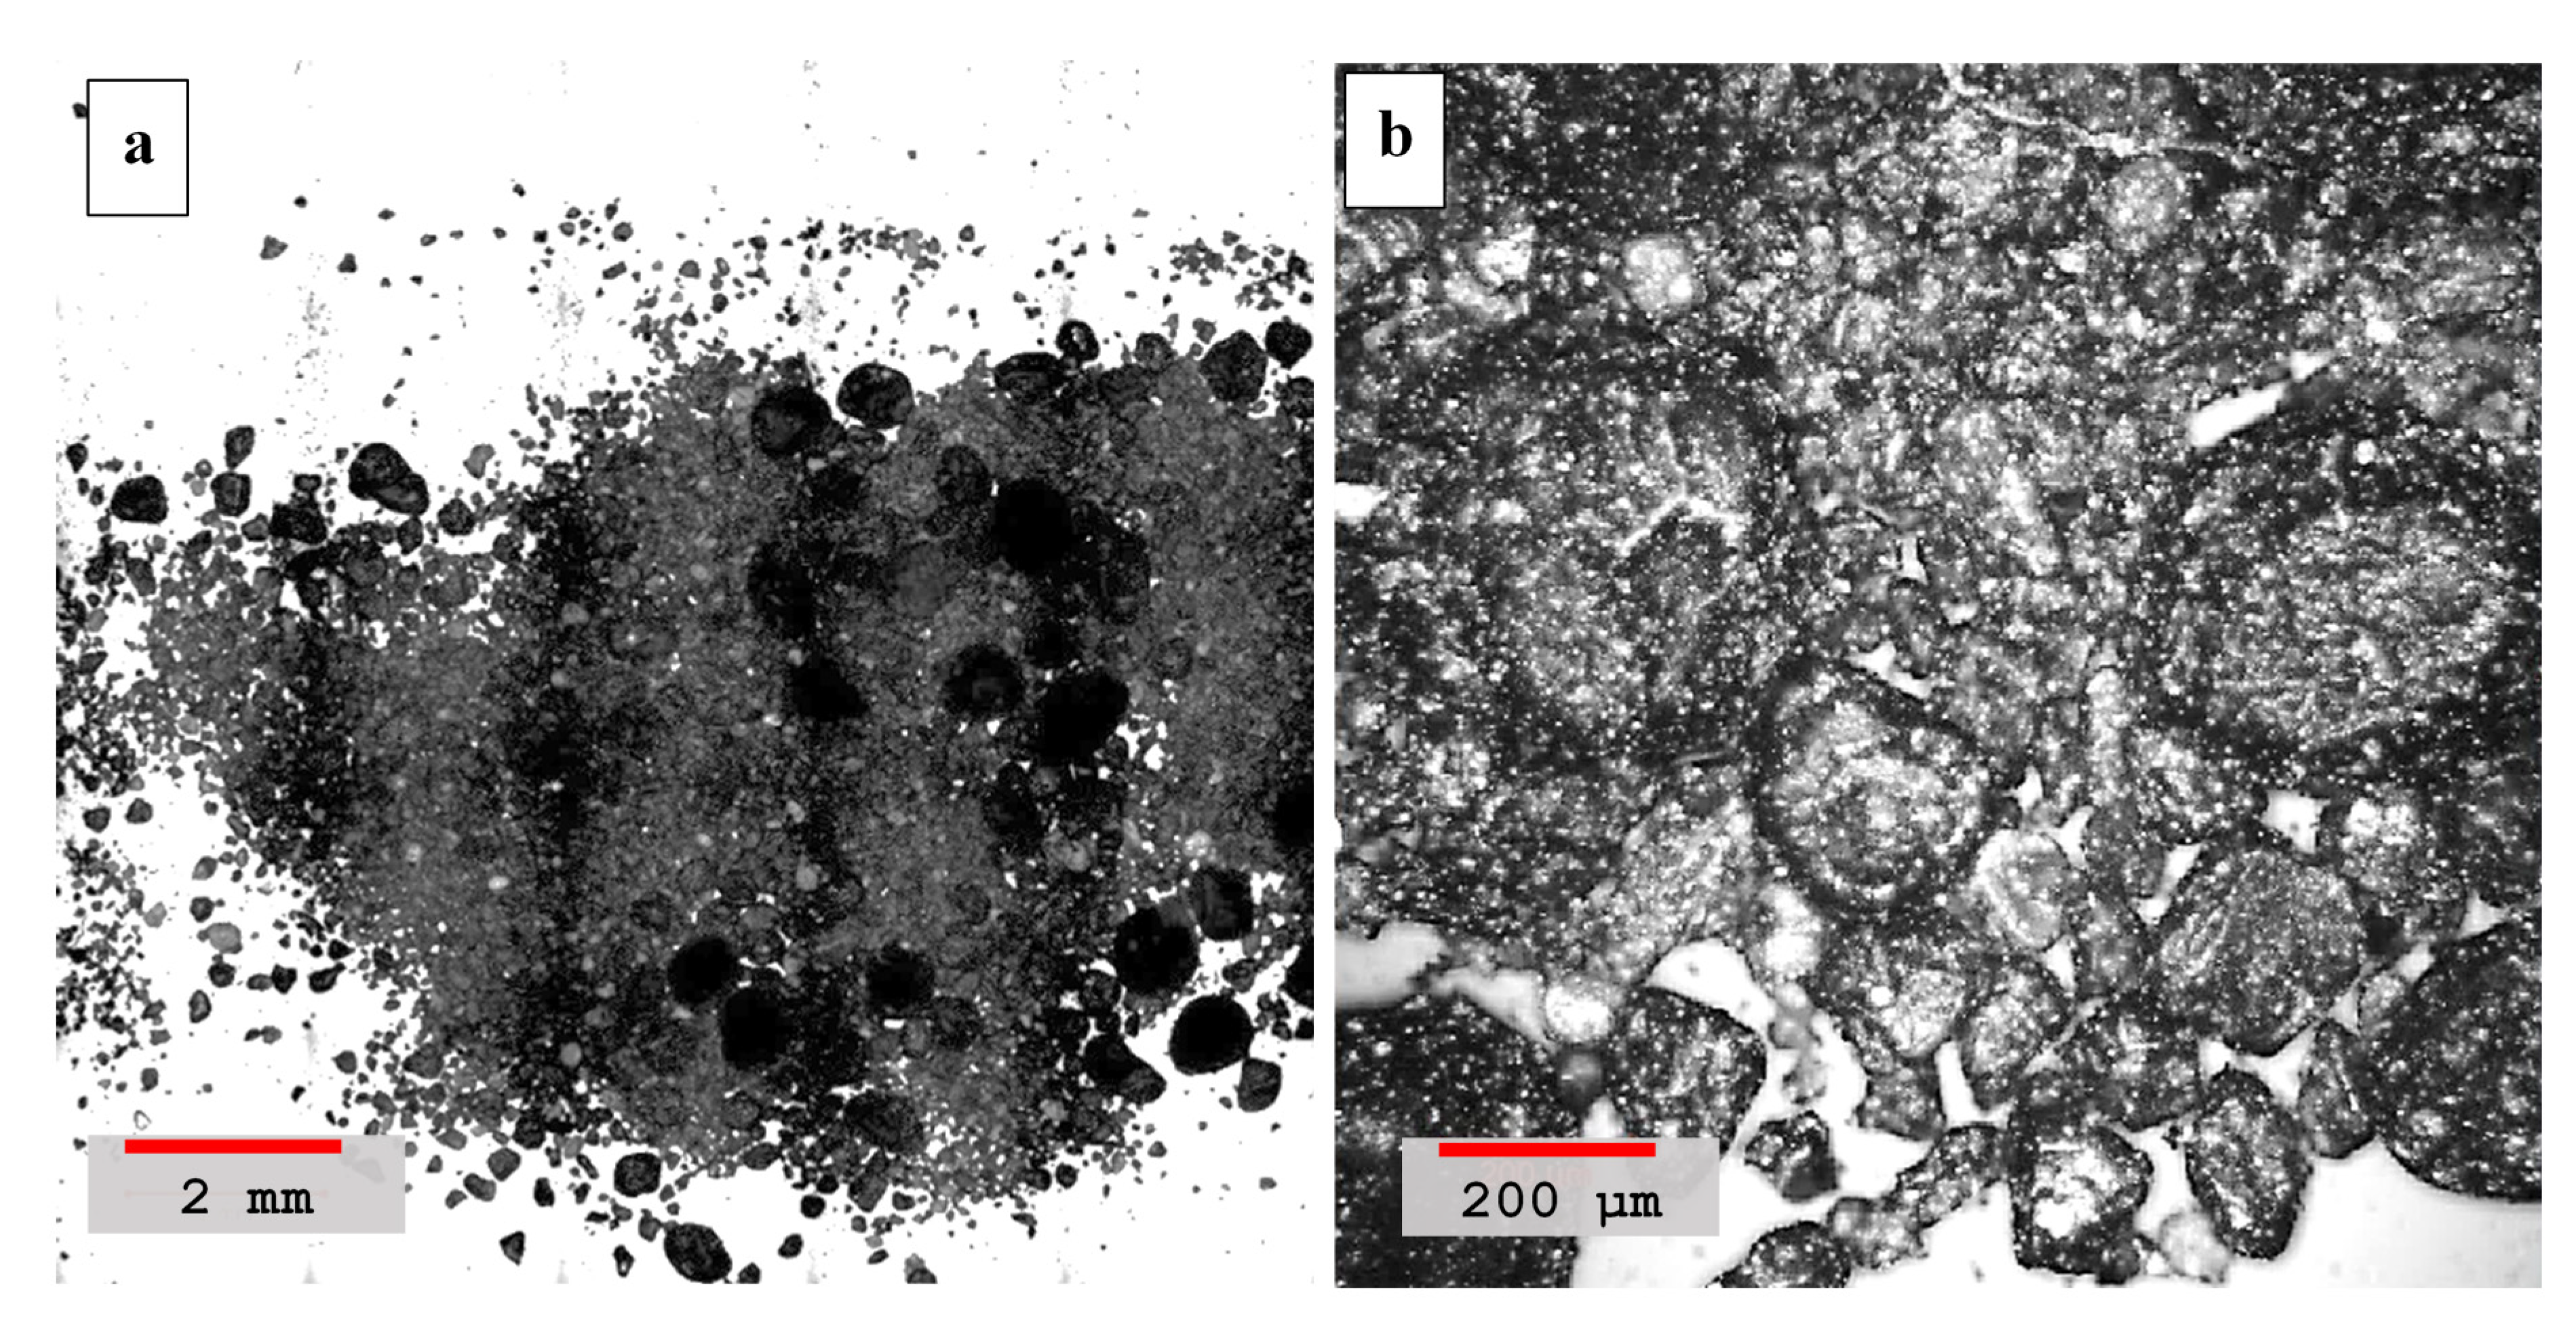
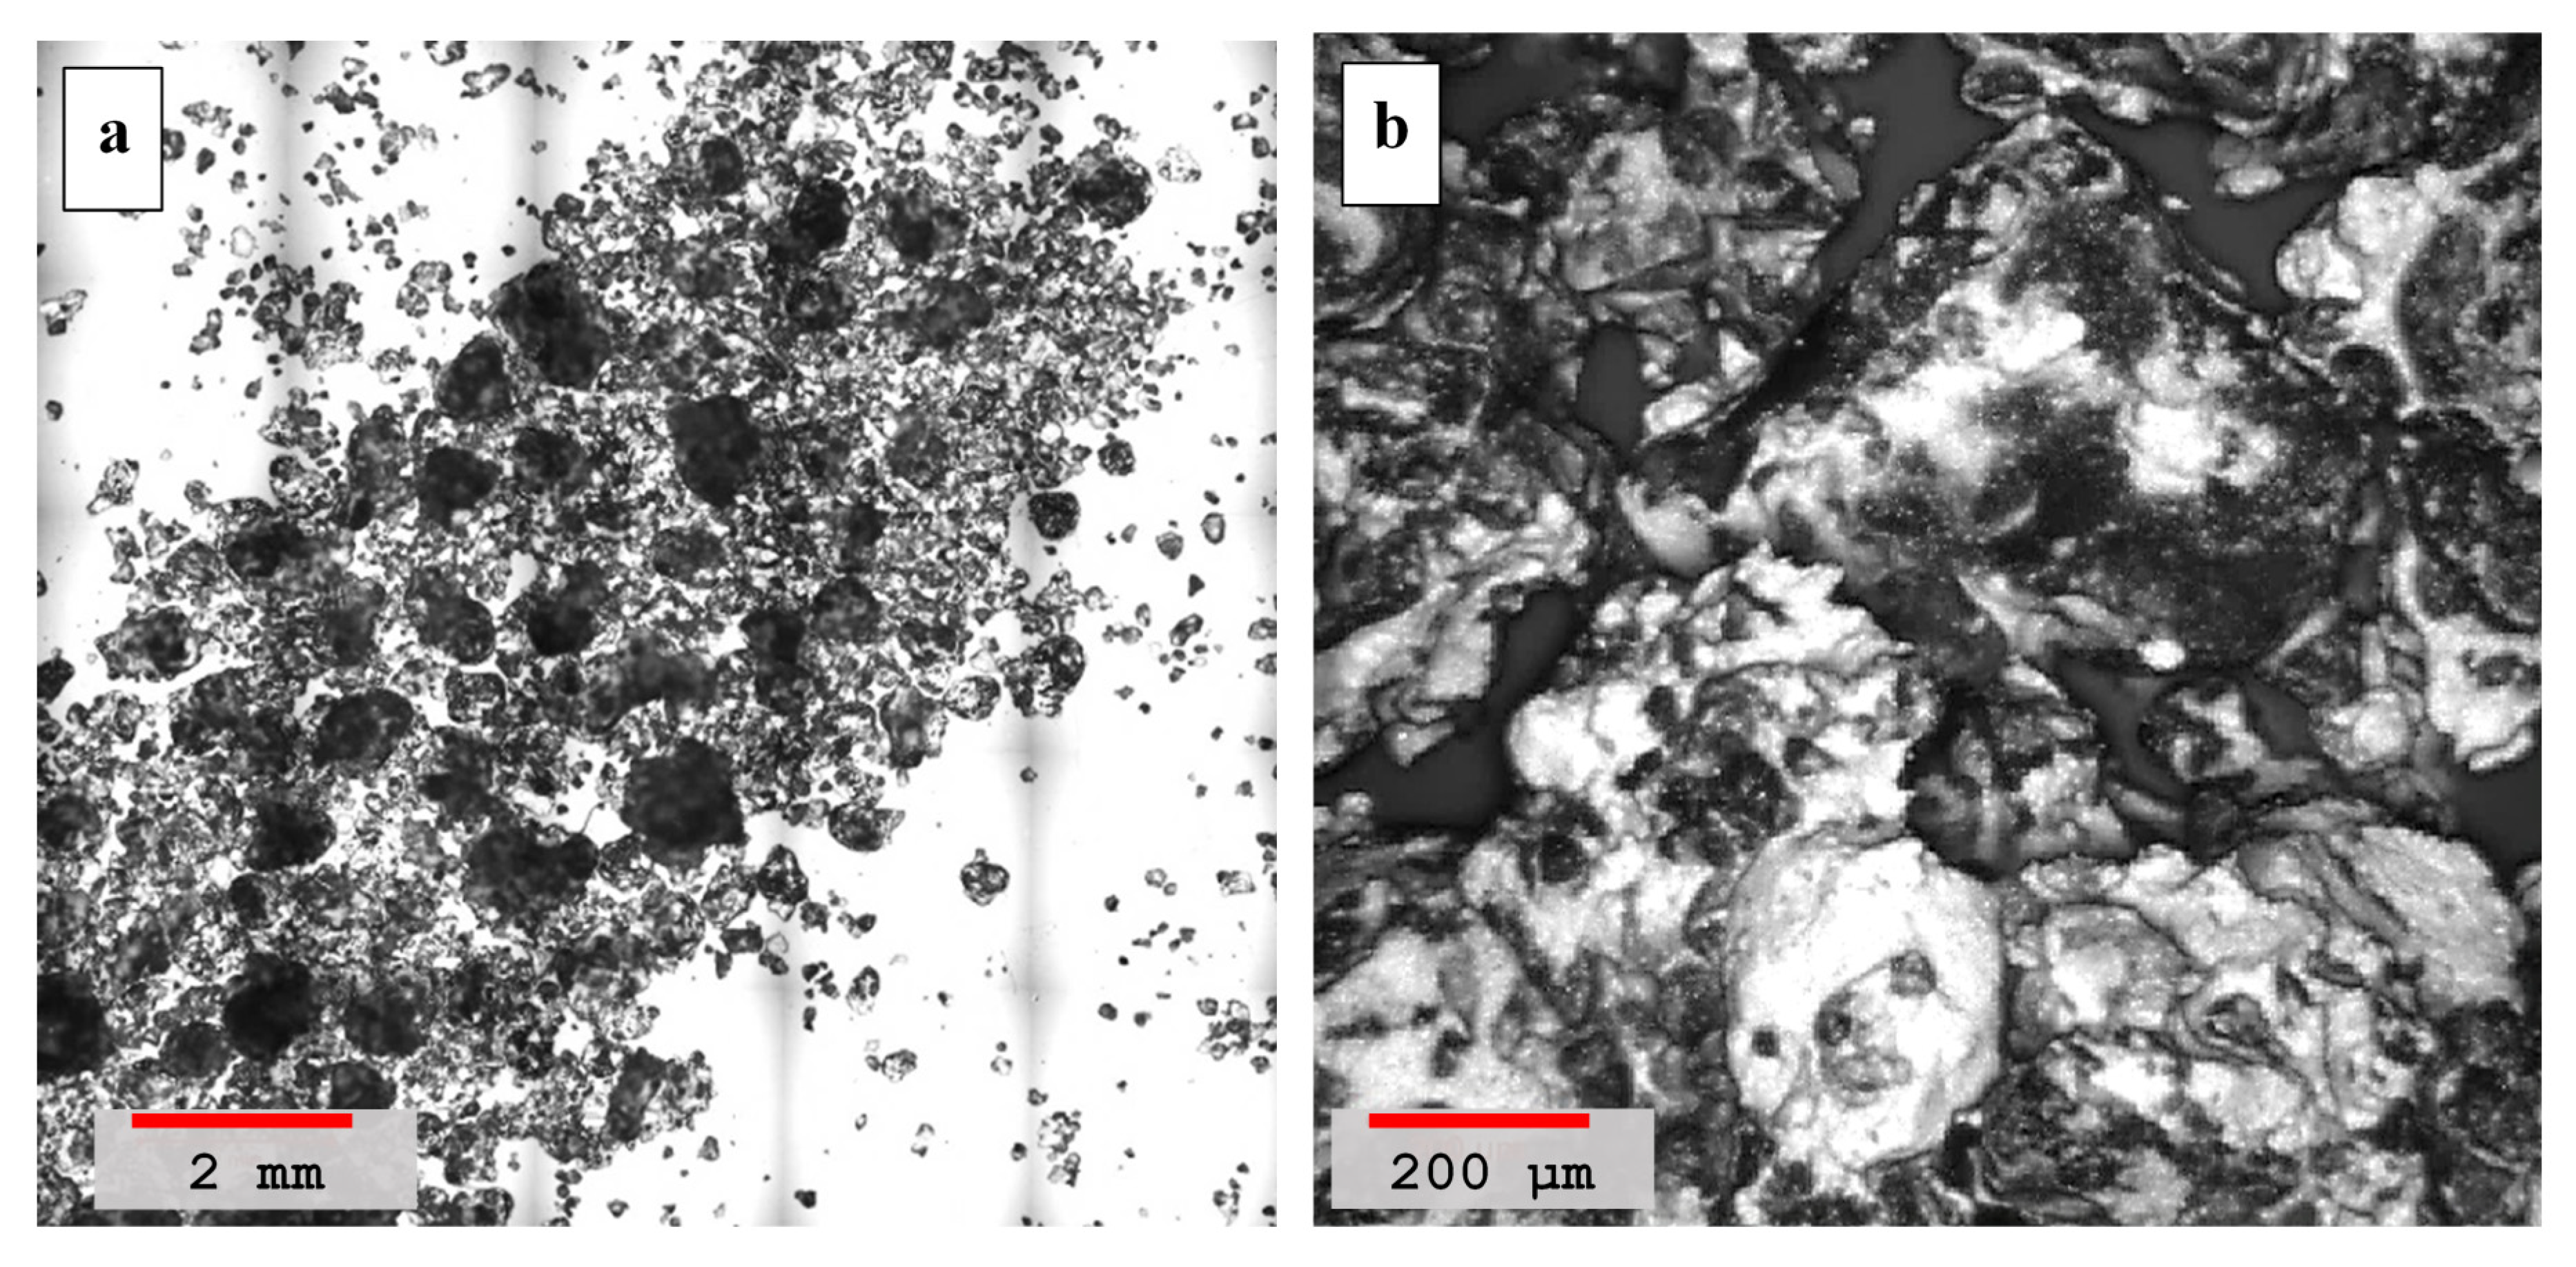
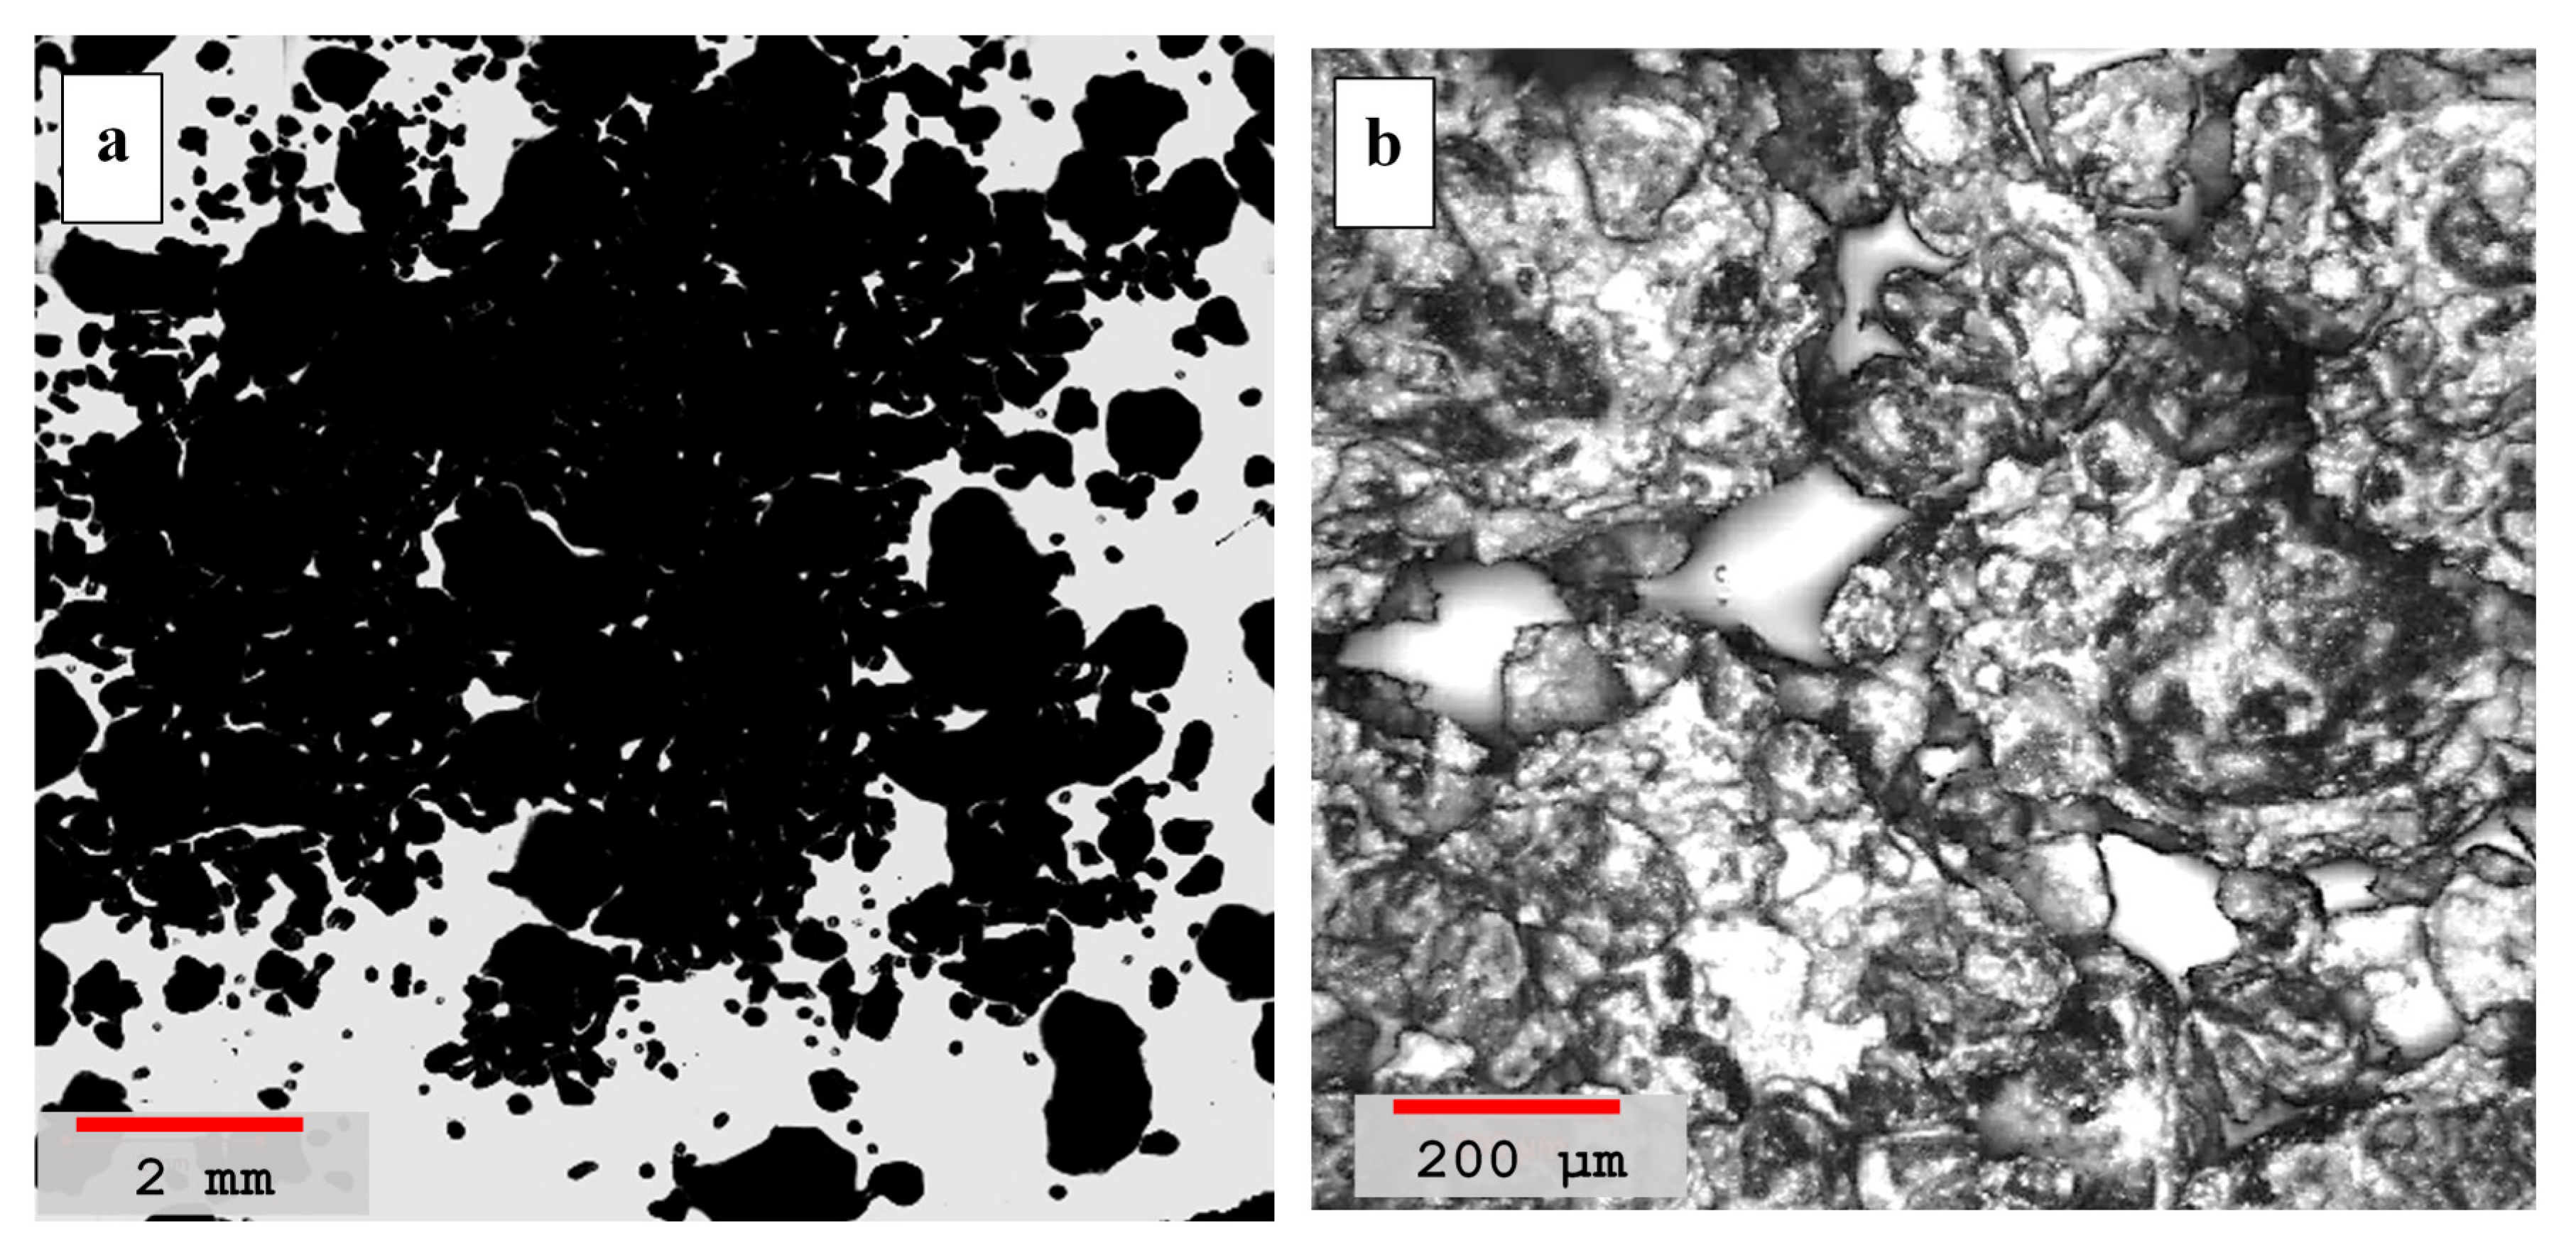
4.2. Laser Scanning Microscopy
4.3. Unconfined Compressive Strength (UCS)
4.4. Young’s Modulus (Es)
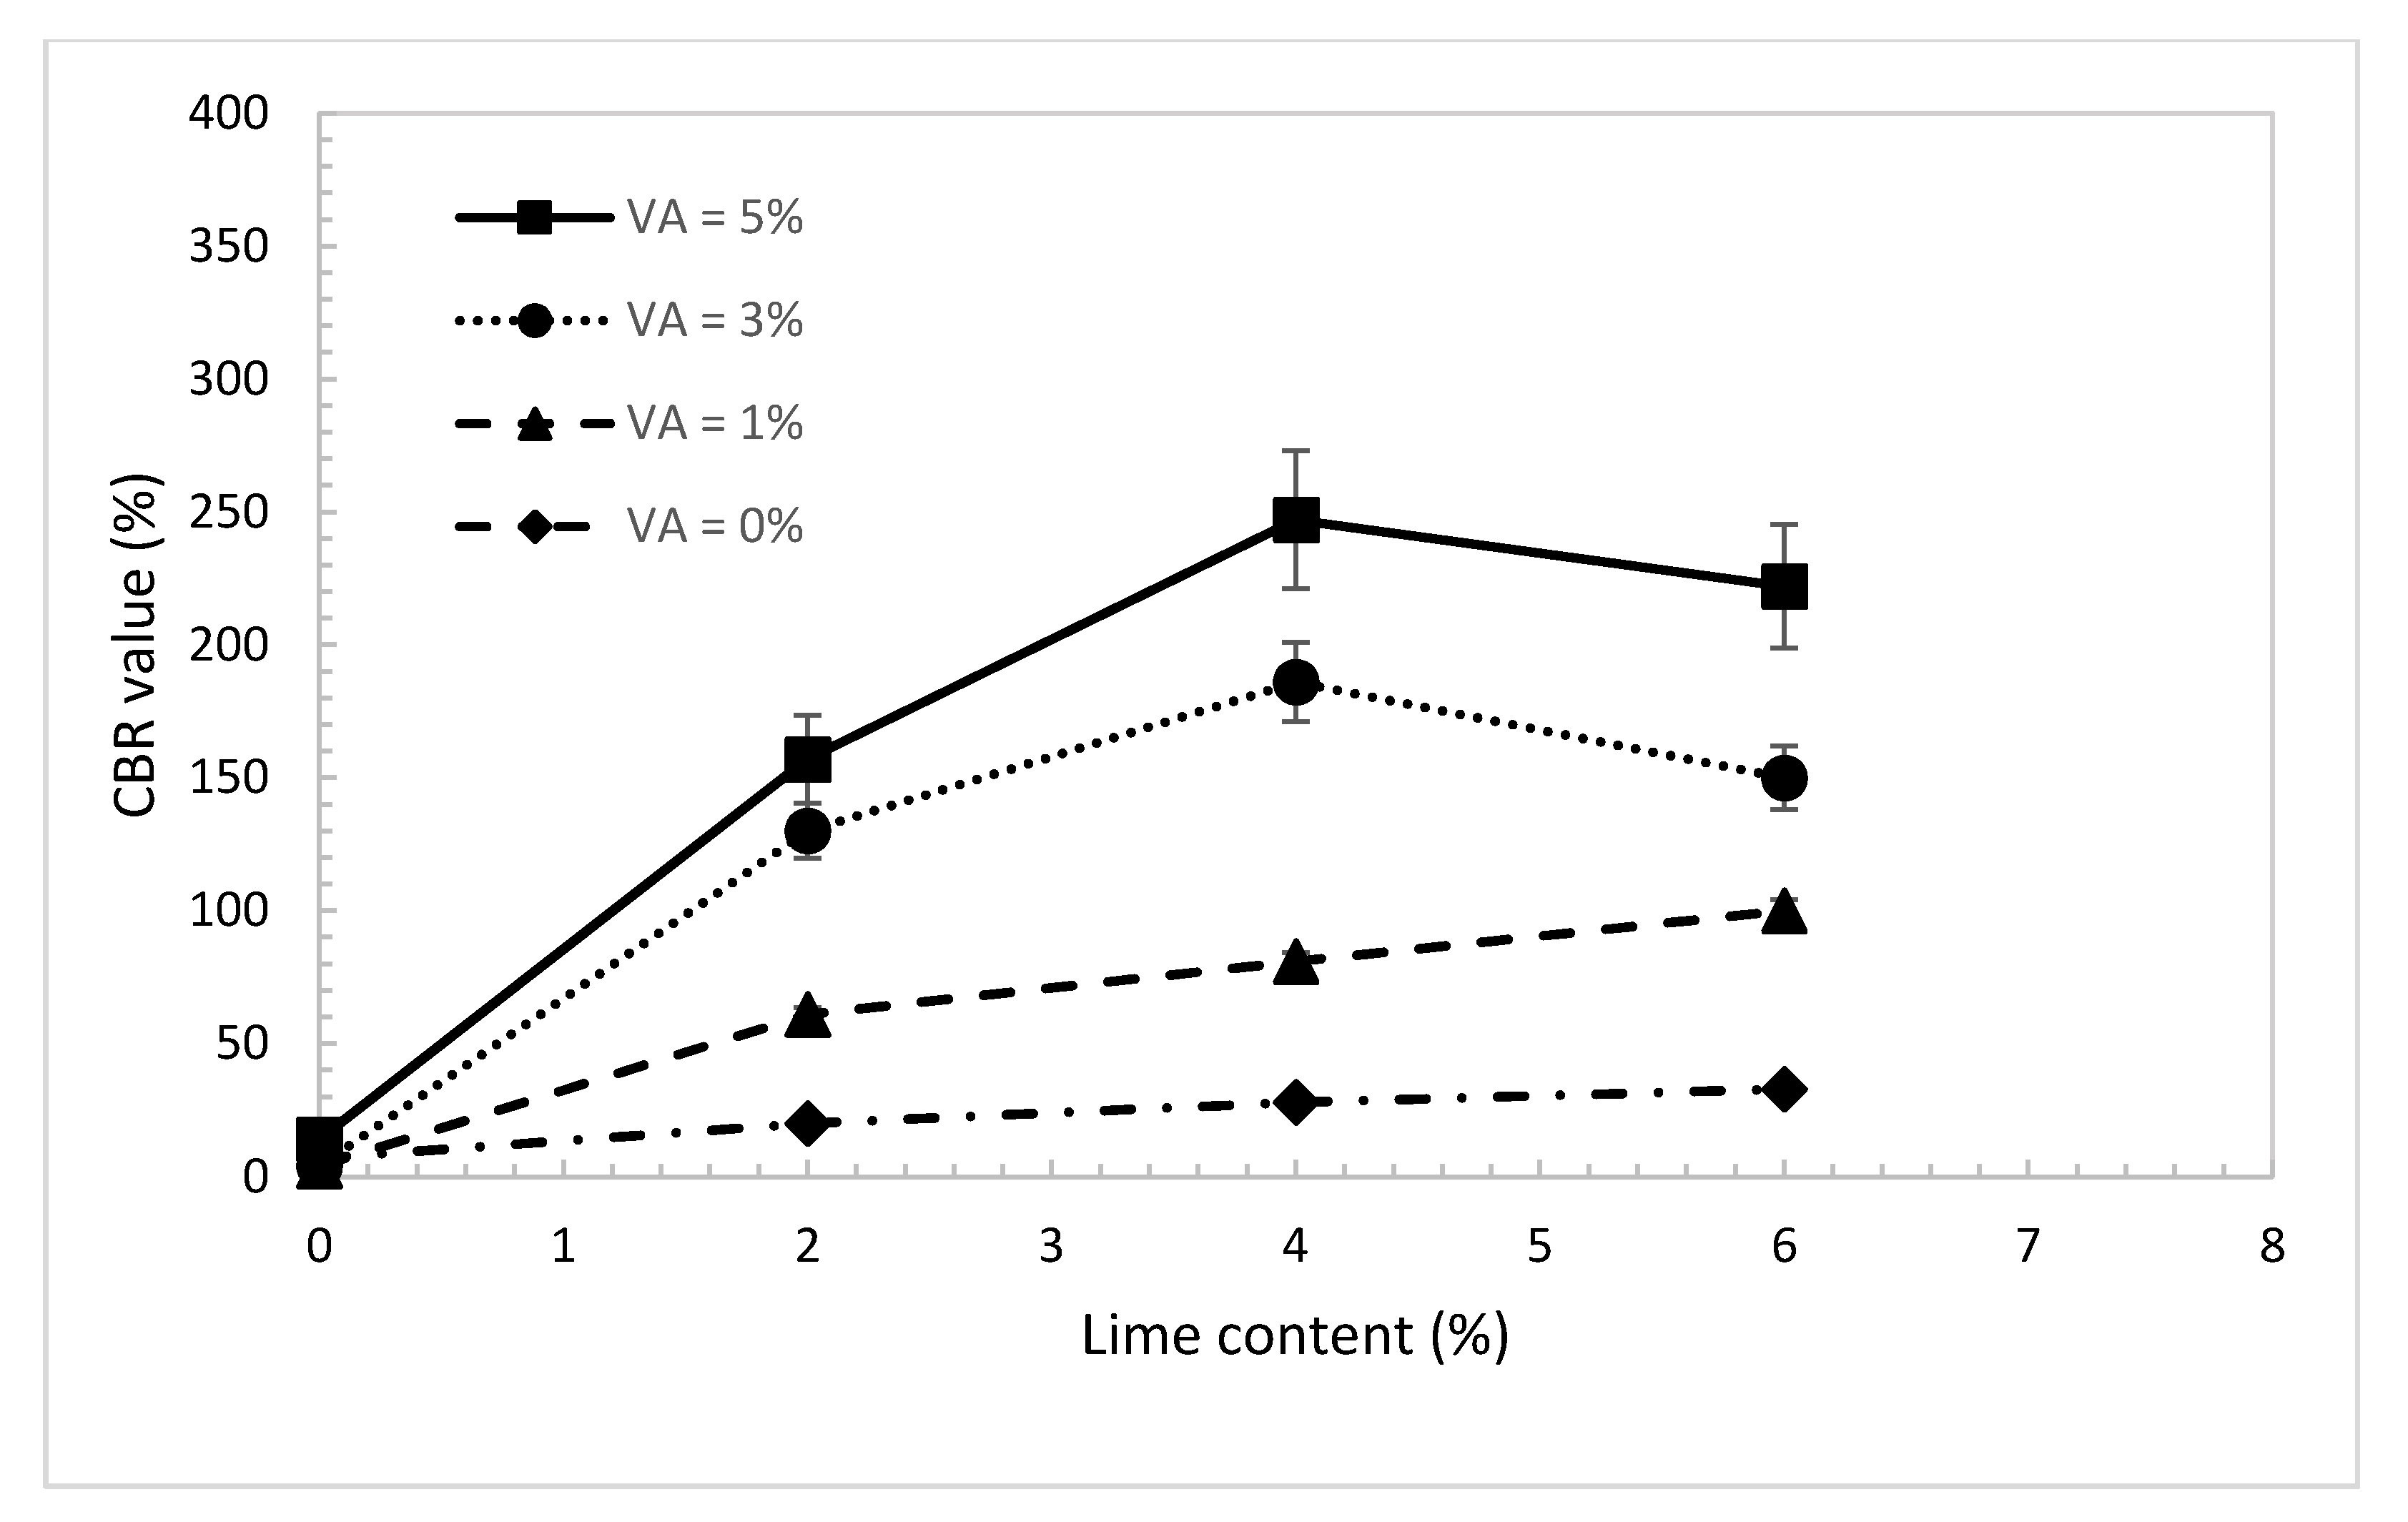
4.5. California Bearing Ratio (CBR)
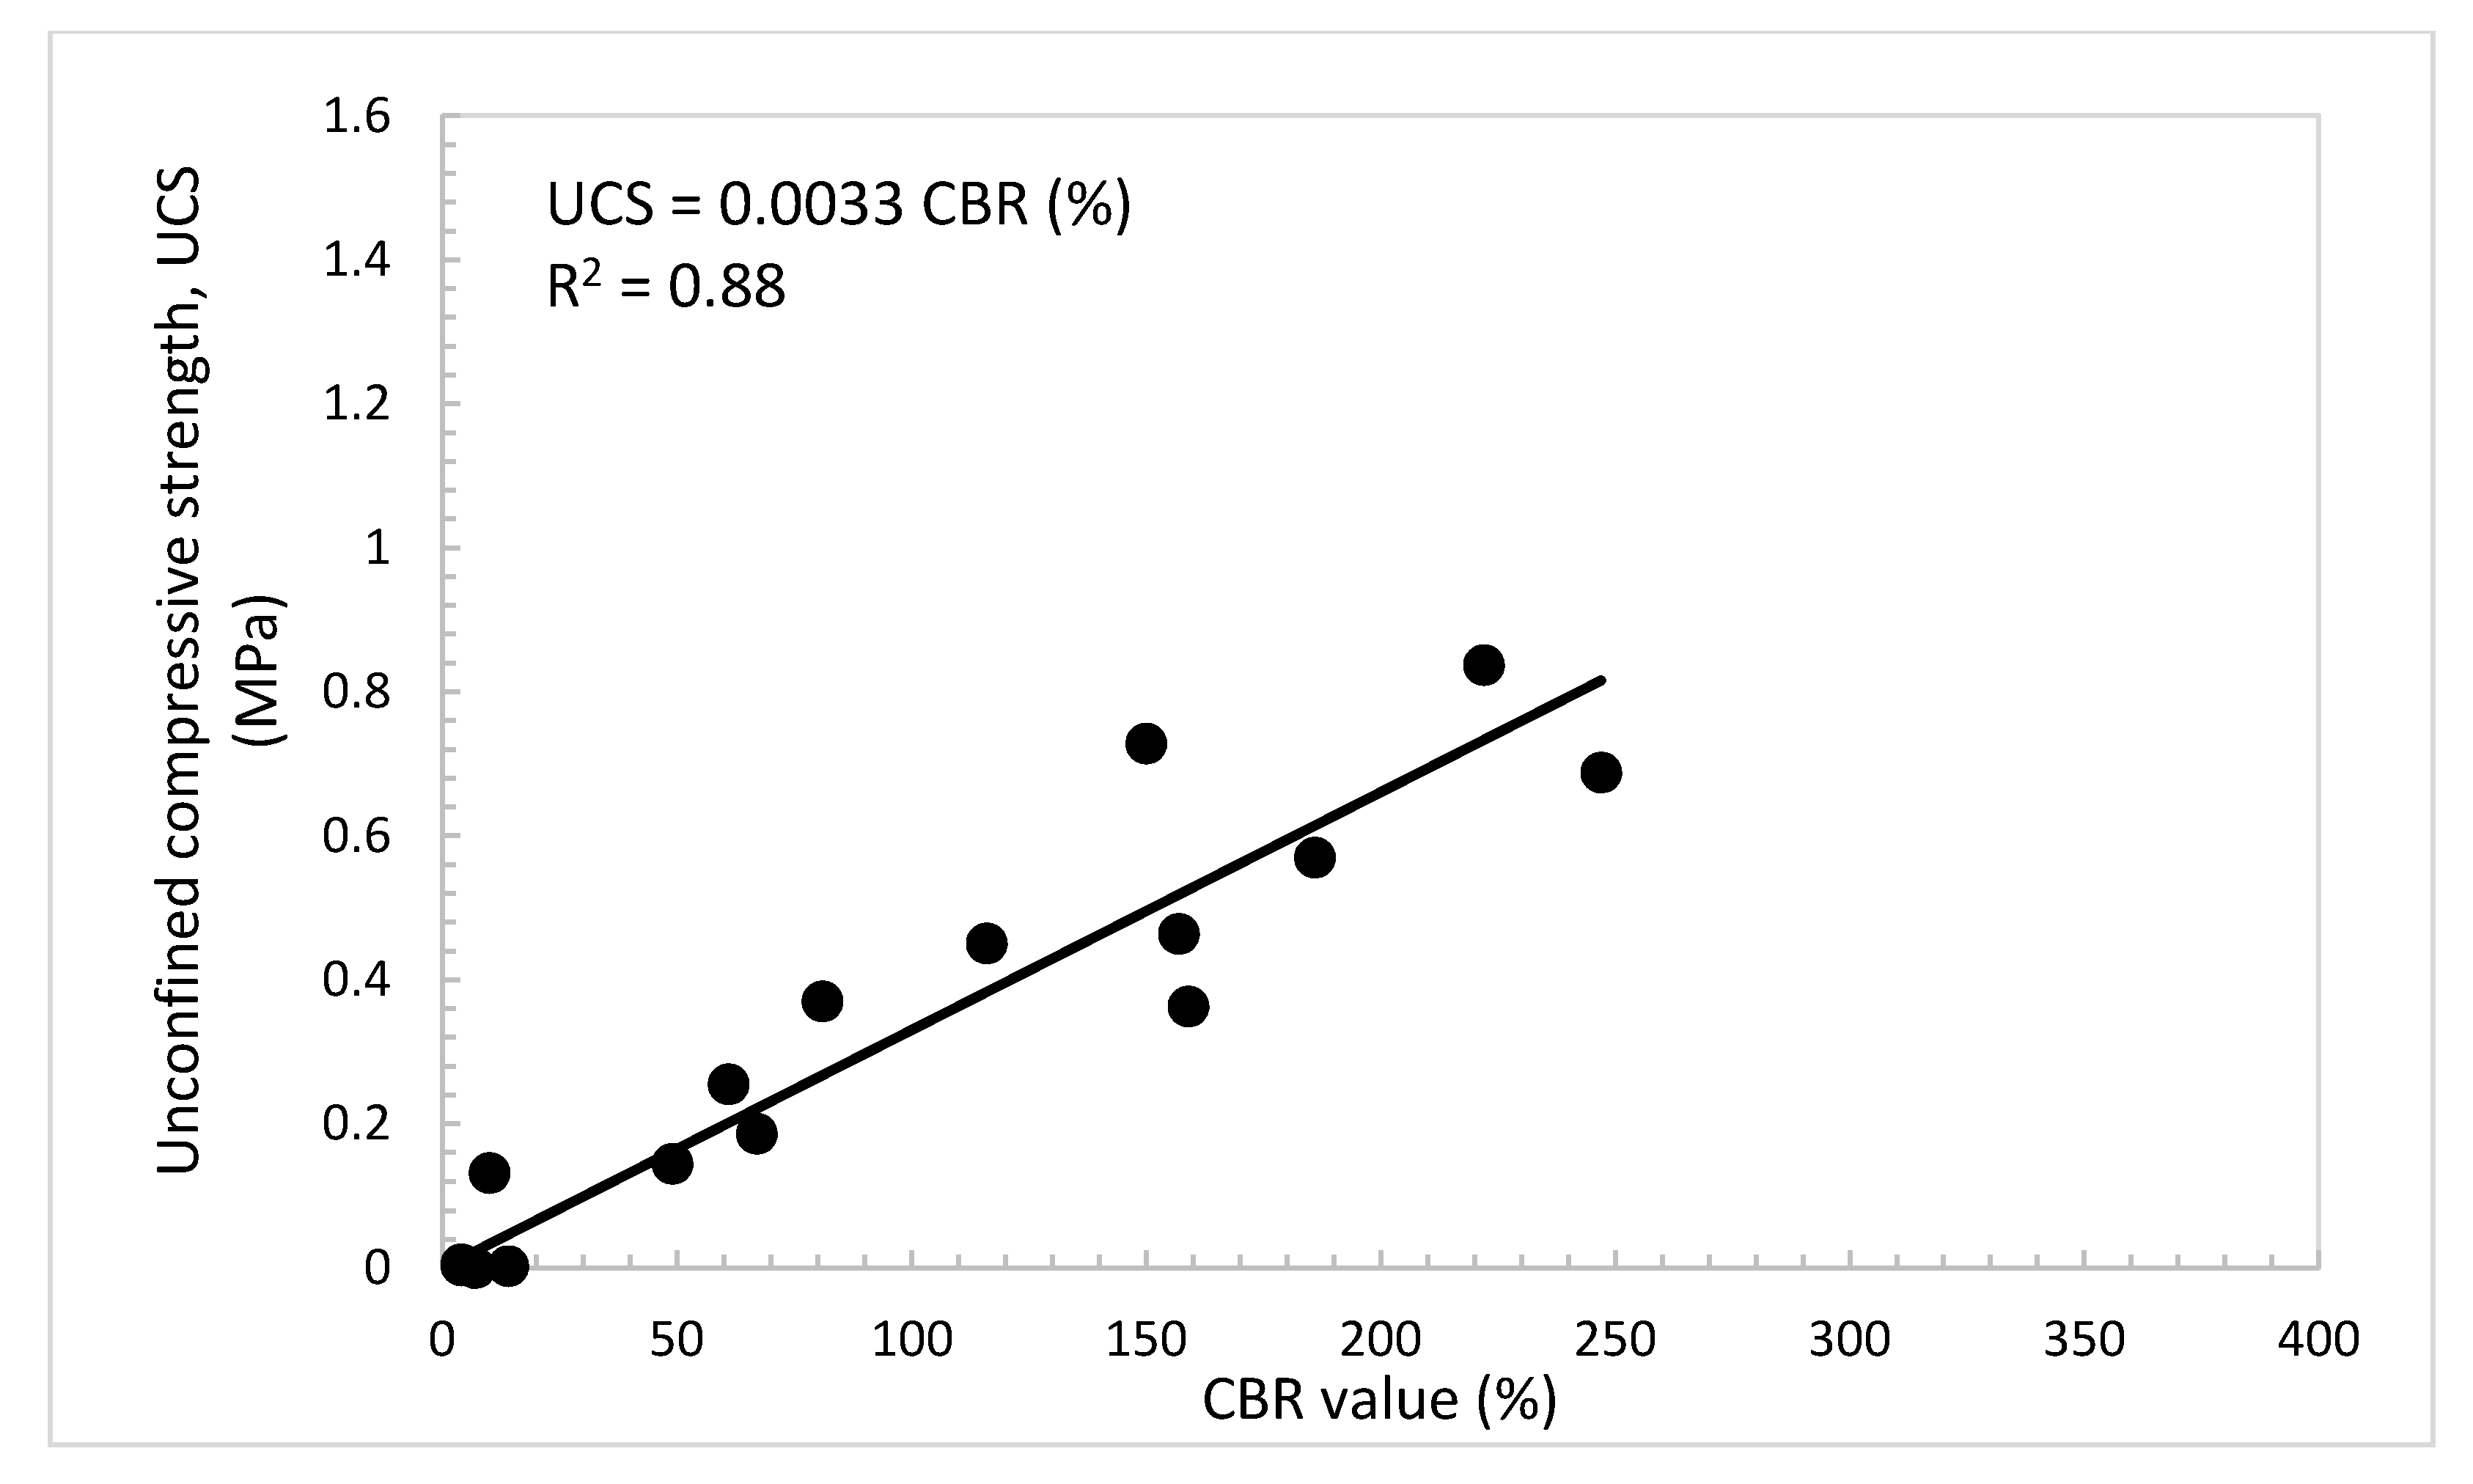
4.6. Practical Relationships among UCS, Es, and CBR Value of the Treated Dune Sand
5. Conclusions
- The Raman spectroscopy analysis of the samples having hydrated lime and volcanic ash with lime to blend ratio of 0.55 (VA = 6% and L = 5%) showed better Raman peaks as compared to all other samples. The high Raman peaks demonstrated high pozzolanic reactivity between lime and volcanic ash and ultimately formed a large number of reaction products for better strength properties;
- Laser scanning microscopy (LSM) results showed that dune sand treated with hydrated lime and volcanic ash with lime to a blend ratio of 0.55 were more compacted and had better binding properties than other mixtures. High pozzolanic reactivity of both lime and volcanic ash resulted in the formation of reactive compounds which improved the adhesion between the sand particles and are ultimately responsible for the compact packing of sand particles;
- The UCS and CBR value of the treated dune sand increased with the increase in the percentages of volcanic ash and lime content. The maximum value of strength was observed at a lime-to-blend ratio of 0.55. The UCS and CBR results are consistent with the results observed from Raman and laser microscopic tests for a lime-to-blend ratio of 0.55;
- As the percentage of the added volcanic ash increased, the Es of the treated dune sand increased with the increase in lime content. Interestingly, using just 2% of lime and 1% of volcanic ash, the Es increased significantly from almost zero to 50 MPa;
- Practical and useful relationships were developed among the CBR value, UCS, and Es of the dune sand treated with lime and volcanic ash. These relations can helpfully be used for the design of foundations of roadways and structures using dune sands stabilized with lime and volcanic ash.
Author Contributions
Funding
Data Availability Statement
Acknowledgments
Conflicts of Interest
Abbreviations
| A3 | Non-plastic fine sand |
| AASHTO | American Association of State Highway and Transportation Officials |
| ASTM | American Society for Testing and Materials |
| A.U. | Airy unit |
| CBR | California Bearing Ratio |
| Cc | Coefficient of curvature |
| Cu | Coefficient of uniformity |
| C-A-H | Calcium aluminate hydrate |
| C-S-H | Calcium silicate hydrate |
| C3A | Tricalcium aluminate |
| C4AF | Tetracalcium alumino ferrite |
| C2S | Tricalcium silicate |
| Es | Young’s modulus |
| D10 | Grain diameter (in mm) corresponding to 10% passing |
| D30 | Grain diameter (in mm) corresponding to 30% passing |
| D50 | Grain diameter (in mm) corresponding to 50% passing |
| D60 | Grain diameter (in mm) corresponding to 60% passing |
| D90 | Grain diameter (in mm) corresponding to 90% passing |
| GGBFS | Ground granulated blast furnace slag |
| GSD | Grain Size Distribution |
| L | Lime |
| LOI | Loss on ignition |
| LSM | Laser-scanning microscopy |
| Plime | Factor of multi-level statistical analysis for lime |
| PVA | Factor of multi-level statistical analysis for volcanic ash |
| ppm | Parts per million |
| SP | Poorly graded sand |
| SP-SM | Poorly graded sand with silt |
| UCS | Unconfined compressive strength |
| USCS | Unified Soil Classification System |
| VA | Volcanic ash |
| XRD | X-ray diffraction |
References
- Elipe, G.M.; Querol, S.L. Aeolian sands: Characterization, options of improvement and possible employment in construction- the state-of-the-art. Const. Build. Mat. 2014, 73, 728–739. [Google Scholar] [CrossRef]
- Al-Khanbashi, A.; El-Gamal, M. Modification of sandy soil using water-borne polymer. J. Appl. Poly. Sci. 2003, 88, 2484–2491. [Google Scholar] [CrossRef]
- Srinivas, G.P.K.; Uday, K.V.; Iyer, K.R.; Pathak, P.; Keshava, S.M.; Singh, D.N. Characterization of aeolian sands from Indian desert. Eng. Geol. 2012, 139–140, 38–49. [Google Scholar]
- Abu Seif, E.S. Assessing the engineering properties of concrete made with fine dune sands: An experimental study. Arab. J. Geosci. 2013, 6, 857–863. [Google Scholar] [CrossRef]
- Abu-Zeid, M.M.; Baghdady, A.R.; El-Etr, H.A. Textural attributes, mineralogy and provenance of sand dune fields in the greater Al ain area. UAE. J. Arid. Environ. 2001, 48, 475–499. [Google Scholar] [CrossRef] [Green Version]
- Al-Sanad, H.A.; Ismaei, N.F.; Nayfeh, A.J. Geotechnical properties of dune sands in Kuwait. Eng. Geol. 1993, 34, 45–52. [Google Scholar] [CrossRef]
- Yuan, Y.; Wang, X.; Zhoau, X. Experimental research on compaction characteristics of aeolian sand. Front. Arch. Tech. Civ. Eng. 2008, 2, 359–365. [Google Scholar] [CrossRef]
- Abu Seif, E.S. Performance of cement mortar made with fine aggregates of dune sand, Kharga Qasis, Western Desert, Egypt: An experimental study. Jordan J. Civ. Eng. 2013, 7, 270–284. [Google Scholar]
- Hongwei, Y.; Béatrice, A.B.; Ting, Y. Characterization of the surface roughness of sand particles using an advanced fractal approach. Proc. Math Phys. Eng. Sci. 2016, 472, 20160524. [Google Scholar]
- Khan, I.H. Soil studies for highway construction in arid zones. Eng. Geol. 1982, 19, 47–62. [Google Scholar] [CrossRef]
- Al-Sanad, H.A.; Bindra, S.P. Soil Mechanics for Road Engineers in Arabian Peninsula; Kuwait University: Jamal Abdul Nasser St, Kuwait, 1984. [Google Scholar]
- Shalabi, F.I.; Mazher, J.; Khan, K.; Alsuliman, M.; Almustafa, I.; Mahmoud, W.; Alomran, N. Cement-stabilized waste sand as sustainable construction materials for foundations and highway roads. Materials 2019, 12, 600. [Google Scholar] [CrossRef] [PubMed] [Green Version]
- Mohammedzein, Y.E.; Al-Aghbari, M.Y. Stabilization of desert sands using municipal solid waste incinerator ash. Geotech. Geol. Eng. 2006, 24, 1767–1780. [Google Scholar] [CrossRef]
- Wayal, A.S.; Ameta, N.K.; Purohit, D.G. Dune sand stabilization using bentonite and lime. J. Eng. Res. Stud. 2012, 3, 58–60. [Google Scholar]
- Rabbani, P.; Daghigh, Y.; Atrechian, M.R.; Karimi, M.; Tolooiyan, A. The potential of lime and grand granulated blast furnace slag (GGBFS) mixture for stabilization of desert silty sands. J. Civ. Eng. Res. 2012, 2, 108–119. [Google Scholar] [CrossRef]
- Tiwari, S.K.; Sharma, J.P.; Yadva, J.S. Geotechnical properties of dune sand-waste tires composite. Mat. Today Proc. 2017, 4, 9851–9855. [Google Scholar] [CrossRef]
- Ghrieb, A.; Kettab, R.M. Stabilization and utilization of dune sand in road engineering. Arab J. Sci. Eng. 2014, 39, 1517–1529. [Google Scholar] [CrossRef]
- Wang, Y.; Yang, K.; Tang, Z. In situ effect of combined utilization of fly ash and polyacrylamide on sand stabilization in North China. Catena 2019, 172, 170–178. [Google Scholar] [CrossRef]
- Rahman, M.A.; Ahmed, A. Use of Silica Fume in Stabilizing Cement-Dune Sand for Highway Materials. Am. J. Civ. Eng. 2017, 51, 41–49. [Google Scholar] [CrossRef] [Green Version]
- Aiban, S.A. A Study of Sand Stabilization in Eastern Saudi Arabia. Eng. Geol. 1994, 38, 65–79. [Google Scholar] [CrossRef]
- Lahalih, S.M.; Ahmed, N. Effect of new soil stabilization on the compressive strength of dune sand. Const. Build. Mat. 1998, 12, 321–328. [Google Scholar] [CrossRef]
- Homauoni, Z.J.; Yasrobi, S.S. Stabilization of dune sand with poly (methyl methacrylate) and polyvinyl acetate using dry and wet processing. Geotech. Geol. Eng. 2011, 29, 571–579. [Google Scholar] [CrossRef]
- Querol, S.L.; Trujillo, J.A.; Elipe, M.G.; Sanchez, A.M.; Cantero, B. Improvement of the bearing capactity of confined and unconfined cement-stabilized Aeolian sand. Const. Build. Mat. 2017, 153, 374–384. [Google Scholar] [CrossRef]
- Smaida, A.; Haddadi, S.; Nechnech, A. Improvement of the mechanical performance of dune sand for using in flexible pavements. Const. Build. Mat. 2019, 208, 464–471. [Google Scholar] [CrossRef]
- Aksoy, H.S.; Gor, M. Stabilization of dune sand by using various materials. In 4th Geotechnical Symposium; Cukurova University: Adana, Turkey, 2011; pp. 622–628. [Google Scholar]
- Fattah, M.Y.; Joni, H.H.; Al-Dulaimy, A.S.A. Compaction and collapse characteristics of dune sand stabilized with lime-silica fume mix. Earth Sci. Res. J. 2016, 20, 11–18. [Google Scholar] [CrossRef]
- ASTM D6913. Standard Test Methods for Particle-Size Distribution (Gradation) of Soils Using Sieve Analysis; ASTM: West Conshohocken, PA, USA, 2017. [Google Scholar]
- ASTM D2487-17. Standard Particle for Classification of Soils for Engineering Purpose (Unified Soil Classification System); ASTM: West Conshohocken, PA, USA, 2017. [Google Scholar]
- AASHTO M145-82. Standard Specification for Classification of Soils-Aggregate Mixtures for Highway Construction Purposes; AASHTO: Washington, DC, USA, 1991. [Google Scholar]
- ASTM D854. Standard Test Methods for Specific Gravity of Soils by Water Pycnometer; ASTM: West Conshohocken, PA, USA, 2014. [Google Scholar]
- Khan, K.; Amin, M.N.; Saleem, U.M.; Qureshi, H.J.; Al-Faiad, M.A.; Qadir, M.G. Effect of finesses of basaltic volcanic ash on pozzolanic reactivity, ASR expansion and drying shrinkage of blended cement mortars. Materials 2019, 12, 2603. [Google Scholar] [CrossRef] [Green Version]
- AASHTO T 26. Standard Method of Test for Quality of Water to Be Used in Concrete; AASHTO: Washington, DC, USA, 2004. [Google Scholar]
- ASTM D698-07. Standard Test Methods for Laboratory Compaction Characteristics of Soils Using Standard Effort; ASTM: West Conshohocken, PA, USA, 2007. [Google Scholar]
- ASTM D2166-85. Standard Test Method for Unconfined Compressive Strength of Cohesive Soil; ASTM: West Conshohocken, PA, USA, 2013. [Google Scholar]
- ASTM D1883-07. Standard Test Method for CBR (California Bearing Ratio) of Laboratory-Compacted Soils; ASTM: West Conshohocken, PA, USA, 2007. [Google Scholar]
- Bensted, J. Uses of Raman spectroscopy in cement chemistry. J. Am. Ceram. Soc. 1976, 59, 140–143. [Google Scholar] [CrossRef]
- Torres-Carrasco, M.; del Campo, A.; Rubia, M.A.; Reyes, E.; Moragues, A.; Fernández, J.F. In situ full view of the Portland cement hydration by confocal Raman microscopy. J. Raman Spectrosc. 2019, 50, 720–730. [Google Scholar] [CrossRef]
- Kupwade-Patil, K.; Palkovic, S.D.; Bumajdad, A.; Soriano, C.; Büyüköztürk, O. Use of silica fume and natural volcanic ash as a replacement to Portland cement: Micro and pore structural investigation using NMR, XRD, FTIR and X-ray microtomography. Constr. Build. Mater. 2018, 158, 574–590. [Google Scholar] [CrossRef]
- Sakir, S.; Raman, S.N.; Safiuddin, M.; Kaish, A. Utilization of by-products and wastes as supplementary cementitious materials in structural mortar for sustainable construction. Sustainability 2020, 12, 3888. [Google Scholar] [CrossRef]
- Cruz-Moreno, D.; Fajardo, G.; Flores-Vivian, I.; Orozco-Cruz, R.; Ramos-Rivera, C. Multifunctional surfaces of portland cement-based materials developed with functionalized silicon-based nanoparticles. Appl. Surf. Sci. 2020, 531, 147355. [Google Scholar] [CrossRef]
- Wang, Z.; Yu, Q.; Gauvin, F.; Feng, P.; Qianping, R.; Brouwers, H. Nanodispersed TiO2 hydrosol modified Portland cement paste: The underlying role of hydration on self-cleaning mechanisms. Cem. Concr. Res. 2020, 136, 106156. [Google Scholar] [CrossRef]
- Lemougna, P.N.; Xue-Min, C. Review on the use of volcanic ashes for engineering applications. Resour. Conserv. Recycl. 2018, 137, 177–190. [Google Scholar] [CrossRef]
- Masmoudi, R.; Kupwade-Patil, K.; Bumajdad, A.; Büyüköztürk, O. In situ Raman studies on cement paste prepared with natural pozzolanic volcanic ash and Ordinary Portland Cement. Constr. Build. Mater. 2017, 148, 444–454. [Google Scholar] [CrossRef]
- Zhou, Z.; Sofi, M.; Lumantarna, E.; San Nicolas, R.; Hadi Kusuma, G.; Mendis, P. Strength development and thermogravimetric Investigation of High-Volume Fly Ash Binders. Materials 2019, 12, 3344. [Google Scholar] [CrossRef] [PubMed] [Green Version]
- Elsen, J.; Mertens, G.; Sellings, R. Snellings. Supplementary cementitious materials. Rev. Mineral. Geochem. 2012, 74, 211–278. [Google Scholar]
- Yue, Y.; Wang, J.J.; Basheer, P.M.; Bai, Y. In-situ monitoring of early hydration of clinker and Portland cement with optical fiber excitation Raman spectroscopy. Cem. Concr. Compos. 2020, 112, 103664. [Google Scholar] [CrossRef]
- Khan, A.S. Vibrational spectroscopy of selective dental restorative materials. Appl. Spectrosc. Rev. 2017, 52, 507–540. [Google Scholar] [CrossRef]
- Deng, C.-S. Ageing of oilfield cement at high humidity: A combined FEG-ESEM and Raman microscopic investigation. J. Mater. Chem. 2012, 12, 3105–3112. [Google Scholar] [CrossRef]
- Rahhal, V.; Cabrera, O.; Delgado, A.; Pedrajas, C.; Talero, R. C4AF ettringite and calorific synergic effect contribution. J. Therm. Anal. Calorim. 2010, 100, 57–63. [Google Scholar] [CrossRef]
- El Mendili, Y.; Vaitkus, A.; Merkys, A.; Grazulis, S.; Chaterigner, D.; Mathevet, F.; Gascoin, S.; Petit, S.; Bardeau, J.; Zanatta, M.; et al. Raman Open Database: First interconnected Raman–X-ray diffraction open-access resource for material identification. J. Appl. Crystallogr. 2019, 52, 618–625. [Google Scholar] [CrossRef] [Green Version]
- Winter, J.K.; Ghose, S. Thermal expansion and high-temperature crystal chemistry of the Al2 SiO5 polymorphs. Am. Mineral. 1979, 64, 573–586. [Google Scholar]
- Shi, L.; Jian, C.; Hai-ning, C.; Sheng-nan, S. Native defect luminescence of zinc oxide films and its potential application as white light sources. Guang Pu Xue Yu Guang Pu Fen Xi 2016, 36, 1604–1614. [Google Scholar]
- Lafuente, B.; Downs, R.; Yang, H.; Stone, N. The Power of Databases: The RRUFF Project. In Highlights in Mineralogical Crystallography; Armbruster, T., Danisi, R.M., Eds.; Walter de Gruyter: Berlin, Germany, 2015; Volume 1, p. 25. [Google Scholar]
- Leonzio, G. ANOVA analysis of an integrated membrane reactor for hydrogen production by methane steam reforming. Int. J. Hydrogen Energy 2019, 44, 11535–11545. [Google Scholar] [CrossRef]


| Soil Property | Value/Description |
|---|---|
| Specific Gravity [30] | 2.68 |
| Color | Yellow |
| D10 (mm) | 0.18 |
| D30 (mm) | 0.3 |
| D60 (mm) | 0.42 |
| CC | 1.2 |
| Cu | 2.3 |
| Shape of Particles | Both, coarse and fine portions are rounded and sub rounded in shape |
| Classification-AASHTO system | Non-plastic fine sand (A3) |
| Classification-USCS system | Poorly graded sand (SP) |
| Oxide | % by Weight |
|---|---|
| SiO2 | 46.4 |
| Al2O3 | 14.4 |
| Fe2O3 | 12.8 |
| CaO | 8.8 |
| MgO | 8.3 |
| Na2O | 3.8 |
| K2O | 1.9 |
| SO3 | 0.8 |
| LOI (Loss on ignition) | 2.8 |
| Test | Percentage of Lime | Percentage of Volcanic Ash | Curing Time (Days) | Used Standard |
|---|---|---|---|---|
| Specific gravity | 0 | 0 | - | ASTM D854 [30] |
| Grain size analysis | 0 | 0 | - | ASTM D6913 [27] |
| Standard proctor compaction | 0 | 0 | - | ASTM D698-07 [33] |
| Material classification (USCS). Material classification (AASHTO) | 0 | 0 | - | ASTM D2487-17 [28] AASHTO M 145-82 [29] |
| Unconfined compressive strength (UCS) | 0, 2, 4, 6 | 0, 1, 3, 5 | 28 | ASTM D2166-85 [34] (Method A) |
| California bearing ratio (CBR) | 0, 2, 4, 6 | 0, 1, 3, 5 | 28 | ASTM D1883-07 [35] (Method C) |
| Sample Number (#) | Sample Type and Percentage Used | Lime/Blend Ratio (L/L + VA) |
|---|---|---|
| a | (L:VA)—(0:5) | 0.0 |
| b | (L:VA)—(6:0) | 1.0 |
| c | (L:VA)—(6:1) | 0.86 |
| d | (L:VA)—(2:1) | 0.67 |
| e | (L:VA)—(6:5) | 0.55 |
| f | (L:VA)—(2:3) | 0.40 |
Publisher’s Note: MDPI stays neutral with regard to jurisdictional claims in published maps and institutional affiliations. |
© 2021 by the authors. Licensee MDPI, Basel, Switzerland. This article is an open access article distributed under the terms and conditions of the Creative Commons Attribution (CC BY) license (http://creativecommons.org/licenses/by/4.0/).
Share and Cite
Shalabi, F.I.; Mazher, J.; Khan, K.; Amin, M.N.; Albaqshi, A.; Alamer, A.; Barsheed, A.; Alshuaibi, O. Influence of Lime and Volcanic Ash on the Properties of Dune Sand as Sustainable Construction Materials. Materials 2021, 14, 645. https://doi.org/10.3390/ma14030645
Shalabi FI, Mazher J, Khan K, Amin MN, Albaqshi A, Alamer A, Barsheed A, Alshuaibi O. Influence of Lime and Volcanic Ash on the Properties of Dune Sand as Sustainable Construction Materials. Materials. 2021; 14(3):645. https://doi.org/10.3390/ma14030645
Chicago/Turabian StyleShalabi, Faisal I., Javed Mazher, Kaffayatullah Khan, Muhammad Nasir Amin, Alaa Albaqshi, Abdullah Alamer, Ali Barsheed, and Othman Alshuaibi. 2021. "Influence of Lime and Volcanic Ash on the Properties of Dune Sand as Sustainable Construction Materials" Materials 14, no. 3: 645. https://doi.org/10.3390/ma14030645