Table 1 shows the roughness values of pristine samples, the surface topography is studied by SEM (
Figure S1) and ICM (
Figure S2) images. Based on all of them, it is concluded that SiOCN
p is the most porous material formed by spherical-shaped interconnected particles with pores in the macropore range around 20 μm. The confocal image and R
a follow the same trend with an average of 20 μm. SiOC
p displays the same porous morphology but the pores are smaller (10–15 μm) [
29], and R
a is therefore somewhat smaller, with a value of 5.4 μm. The dense samples (SiOC
d and SiOC–SiC
d) have homogeneous and fine topographies with some pull-outs and polishing scratches, especially in the case of the SiOC–SiC
d sample. Confocal images and R
a values show the same results, with very low roughness values (SiOC
d = 0.2 μm and SiOC–SiC
d = 0.4 μm).
3.1. SiOCNp
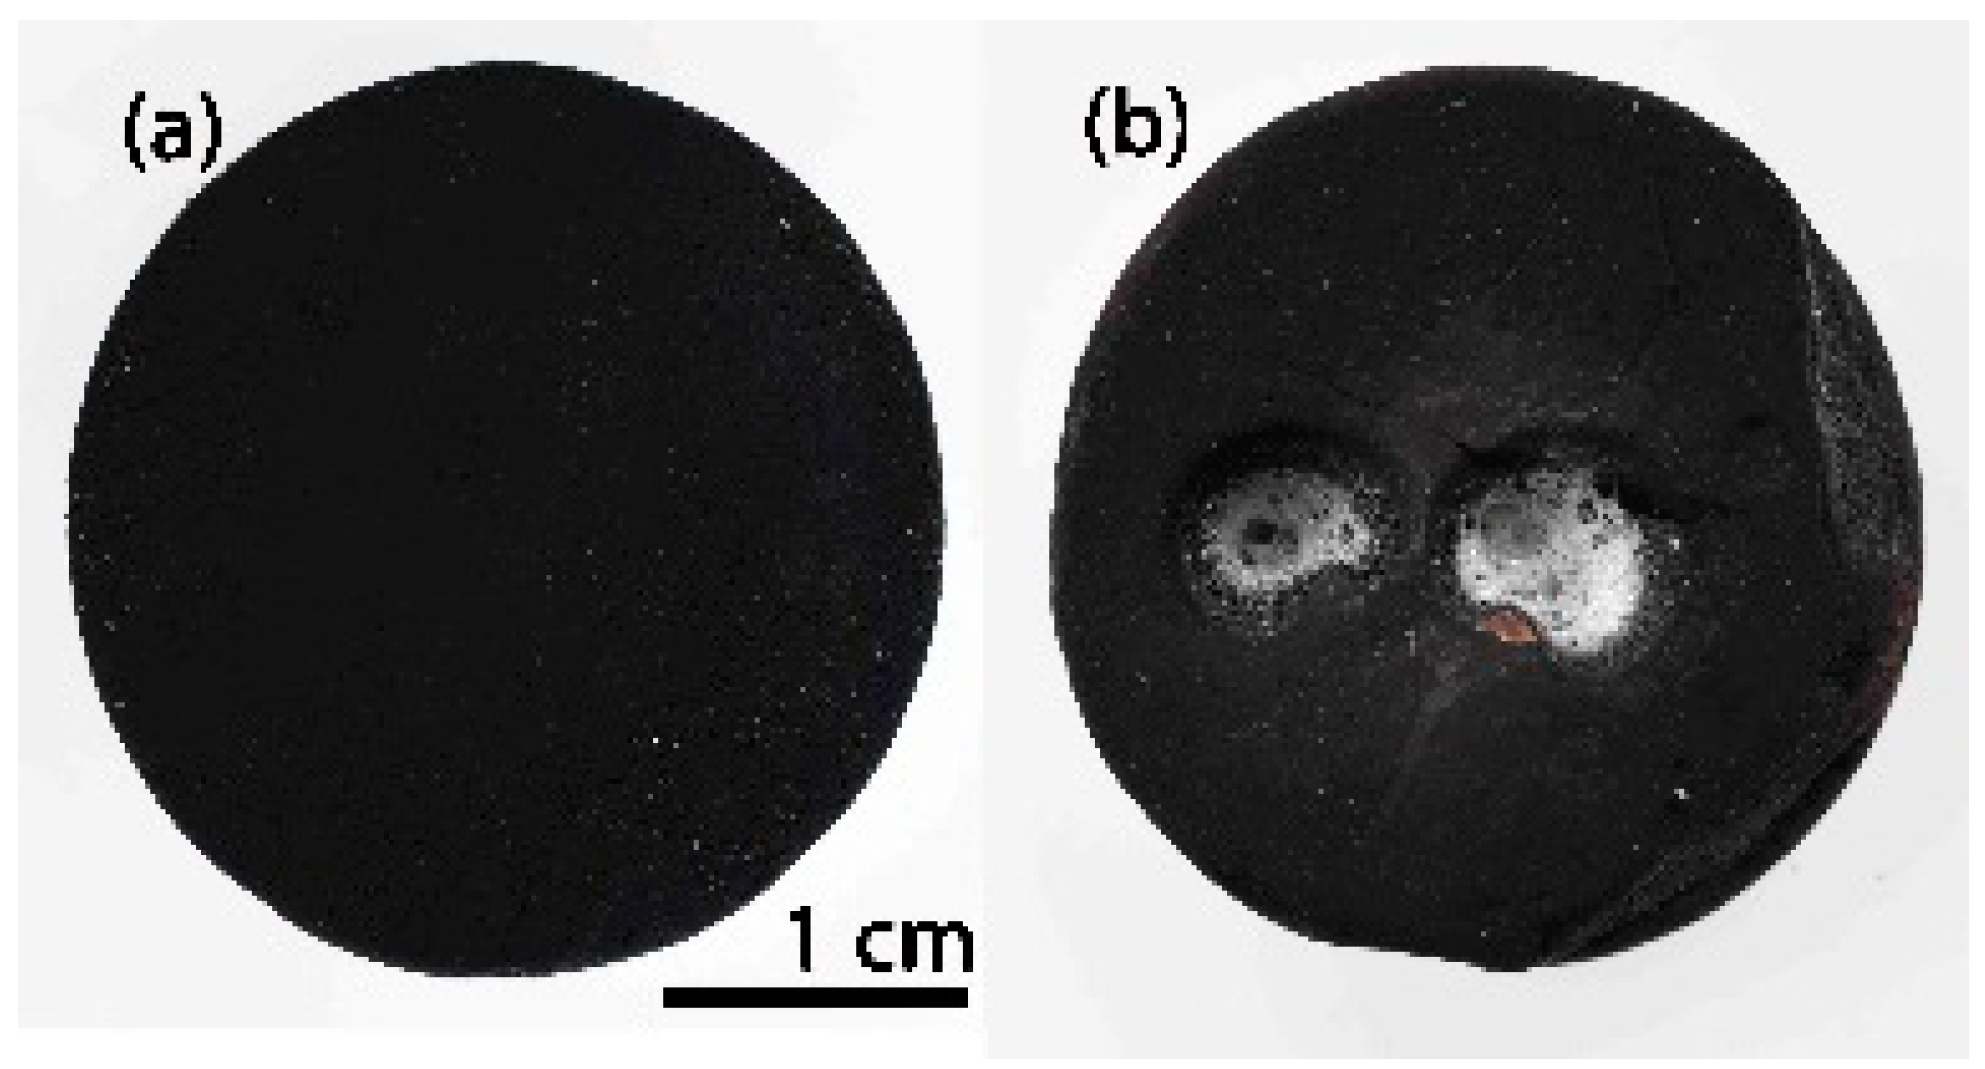
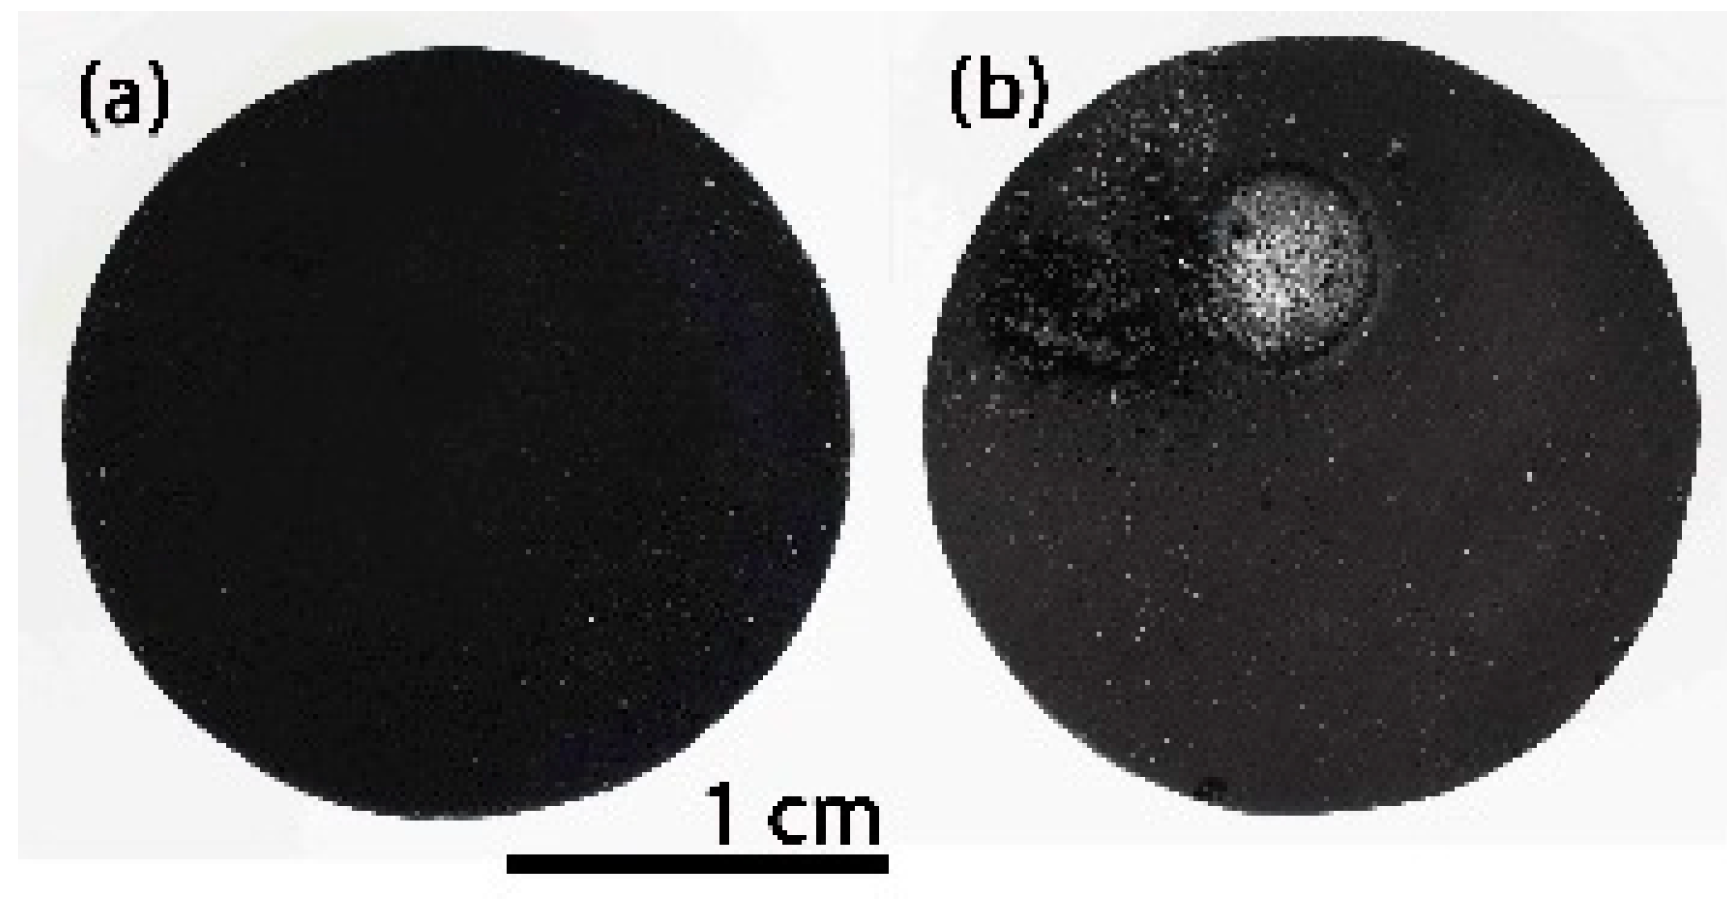
Figure 1a shows the initial appearance of the SiOCN
p sample before the thermal shock experiment. As can be clearly seen in the temperature-time graph for this sample (
Figure S3a), in the first cycle, the temperature increased uncontrolled to 1200 °C after a very few seconds and the application of solar radiation was interrupted by covering the Fresnel lens, as can be observed by the sharp drop in temperature. The direct observation of the sample showed the formation of a large bubble, located precisely in the focus zone, which, when broken, reveals a whitish melted layer covering the resulting valley (
Figure 1b). To confirm this result, a second thermal shock cycle was performed on the other side of the SiOCN
p sample and the same behaviour was found (
Figure 1c). In this second experiment the temperature increased up to 1000 °C (
Figure S3a) and a new bubble was formed, which exploded after 90 s, generating a large crater covered with a whitish melted layer. A weight decrease of 18% was also observed after these thermal shock cycles, and the porosity of the sample varied from 80 to 79%.
The weight loss must be ascribed to the oxidation of the C
free phase (3), although in order to explain all the changes observed the oxidation of other species such as Si
3N
4 (4), Si
2N
2O (5) and SiOC (6), which are also present in SiOCN materials cannot be ruled out [
34,
35]. Reaction (3) usually occurs from 400–800 °C and the other reactions at higher temperatures from 800–1000 °C. [
34,
35] CO
x refers to CO and CO
2.
The oxidation of SiOCN materials obeys a very complex mechanism as it involves the formation of protective layers of SiO
2 and Si
2N
2O ((4), (5) and (6)) that limit the inward diffusion of O
2 and the outward diffusion of N
2 and CO
x, and the decomposition of C
free (3), which produces additional CO
2 [
35]. In any case, due to the highly porous microstructure of the SiOCN
p material and the very severe thermal shock conditions, the inward diffusion of O
2 and the outward diffusion of N
2 and CO
x occur practically without restriction before the protective layer is well formed, so the material is massively degraded during the first thermal shock cycle.
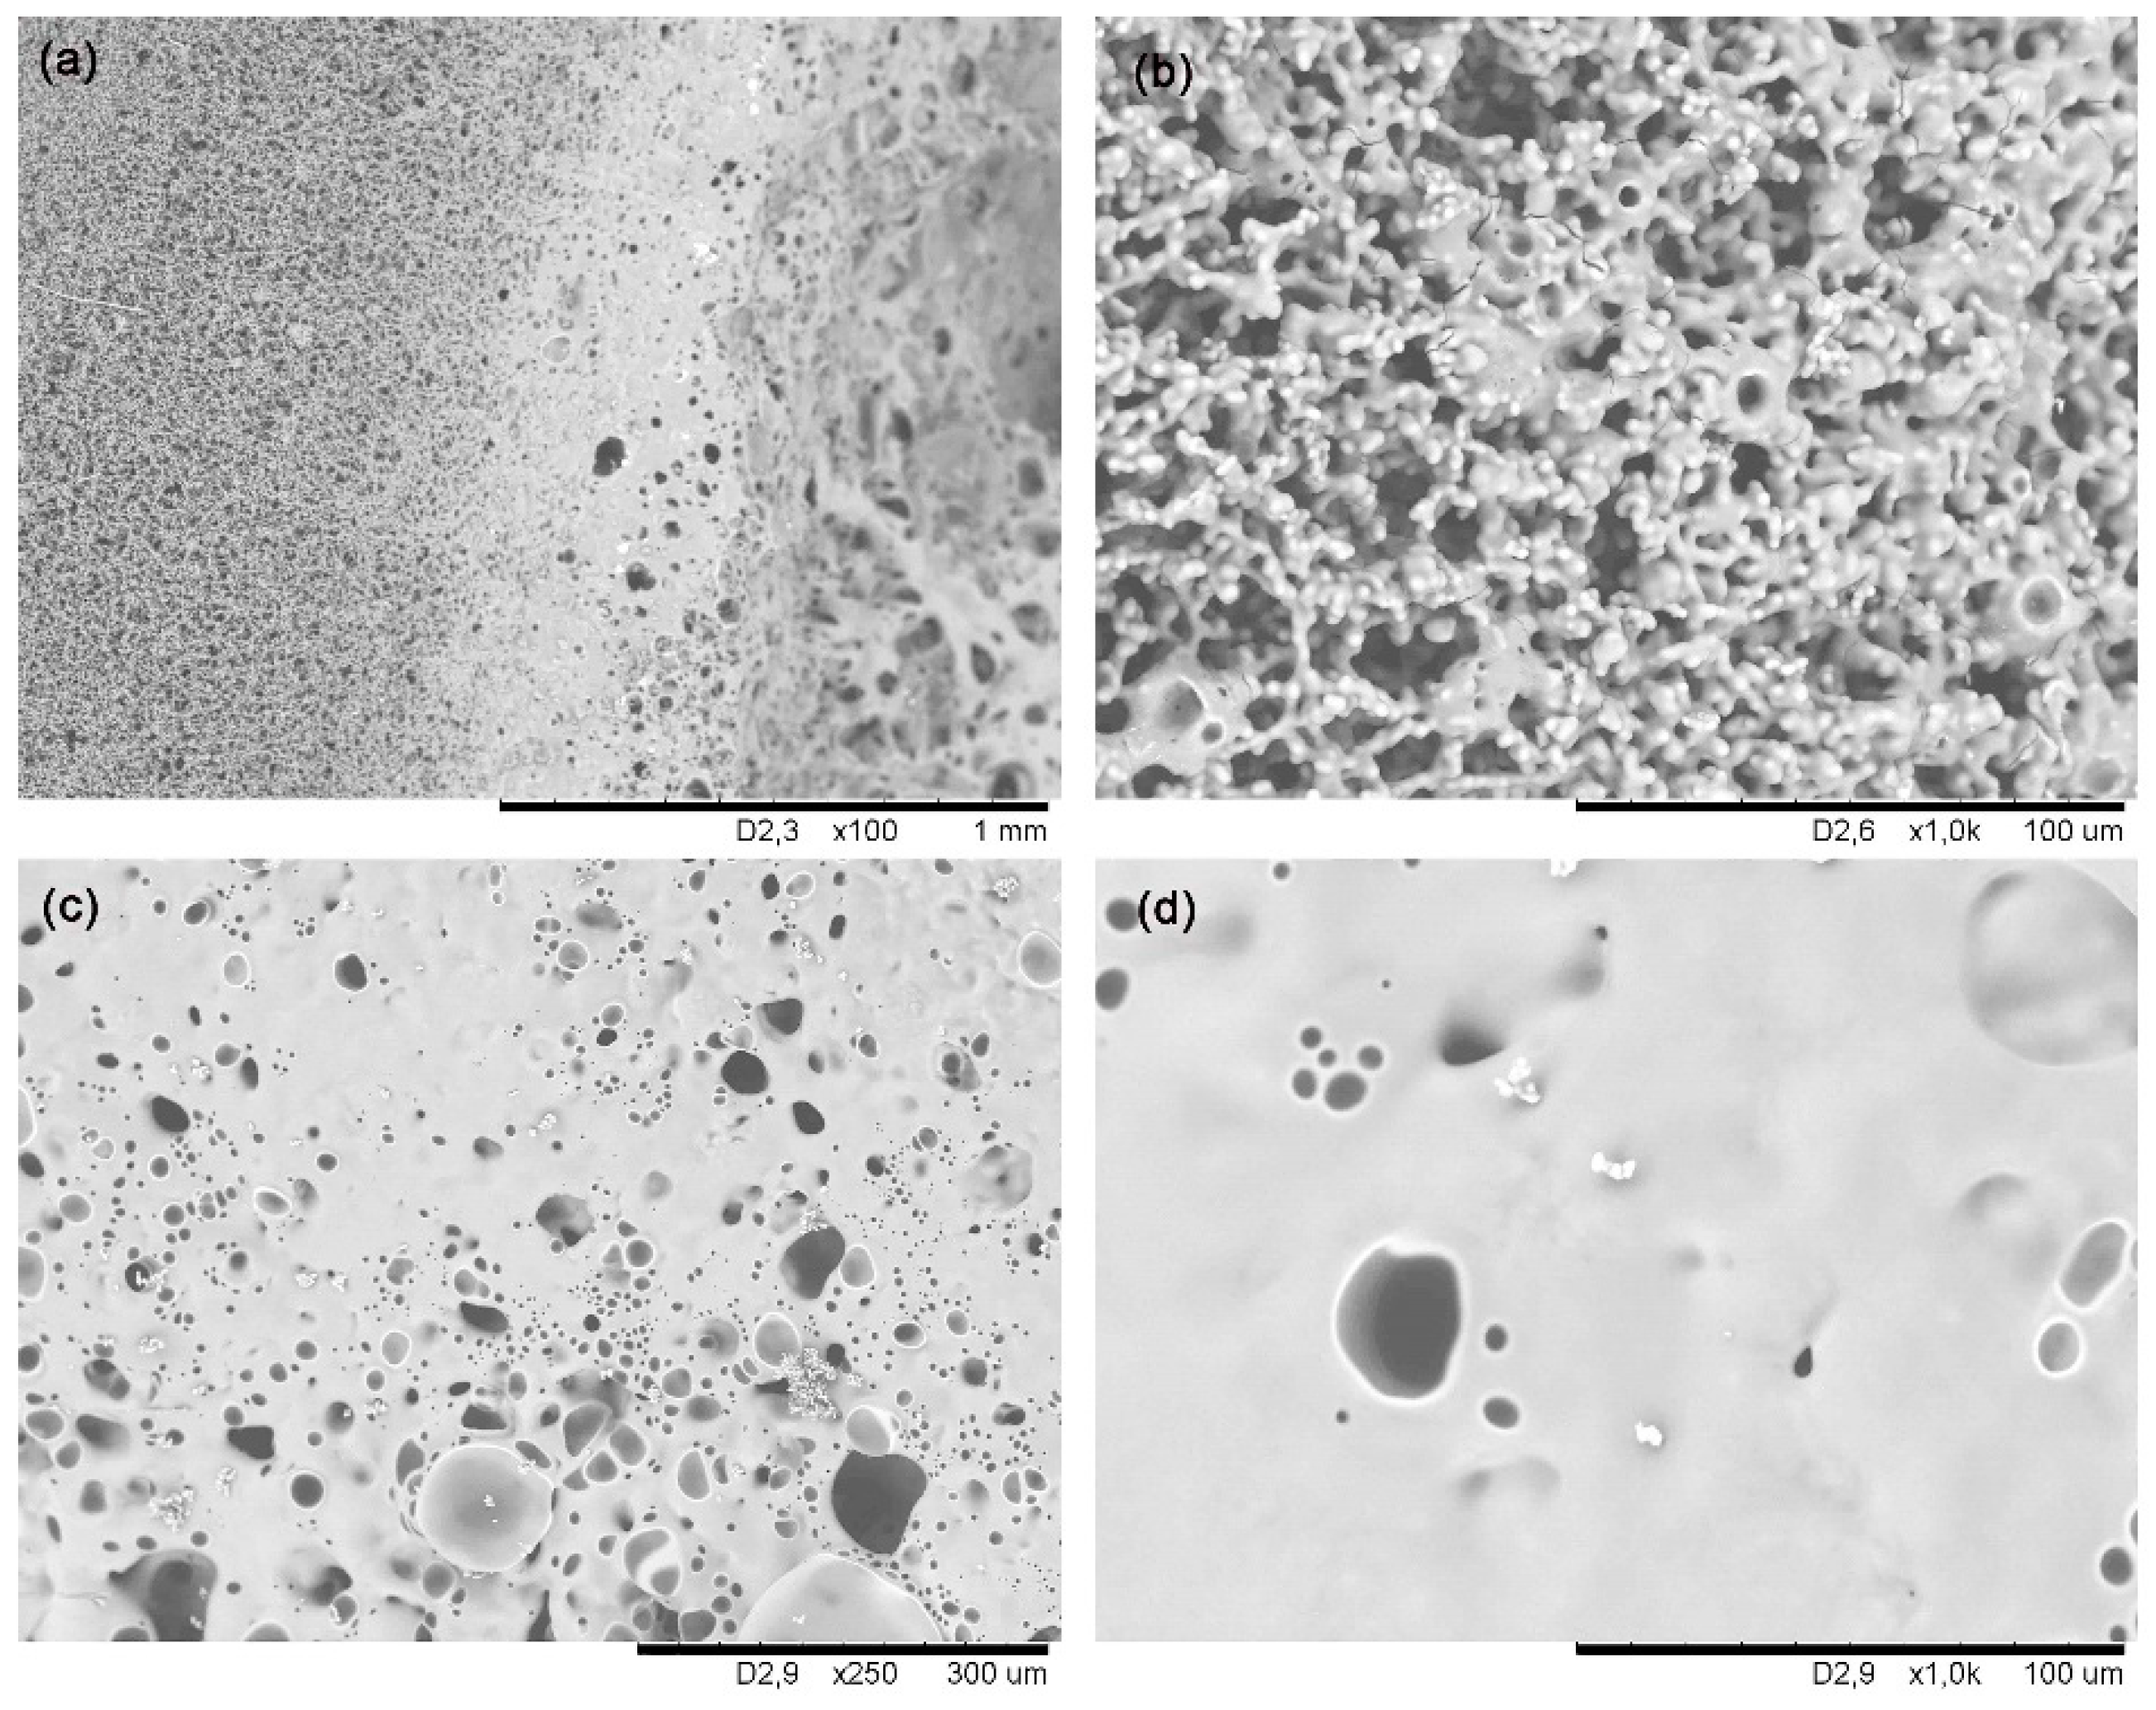
SEM images indicate the SiOCN
p material remains unaltered far from the focus zone (
Figure 2a), and has the same appearance as the initial SiOCN
p (
Figure S1a); however, in the focus zone precisely, the material is deeply degraded and a large hole appears (
Figure 2b). Large bubbles can be observed in this zone (
Figure 2c), probably due to develop of gaseous species formed during testing, and a melted zone is also observed (
Figure 2d); both these effects are partially interrupted by the presence of larger pores and cracks (reactions 3–6). The formation of a dense layer is also observed in another zone (
Figure 2e), along with the presence of crystallizations (
Figure 2f). In this case, it does not act as a protective layer; although it is dense, is not tightly bonded to the material and does not cover the whole surface homogeneously. The gaseous species (i.e., O
2 inward and N
2 and CO
x outward) can freely pass through it without restriction, which can probably be attributed to both the high porosity of the SiOCN
p material and to the very fast and severe conditions of the thermal shock test.
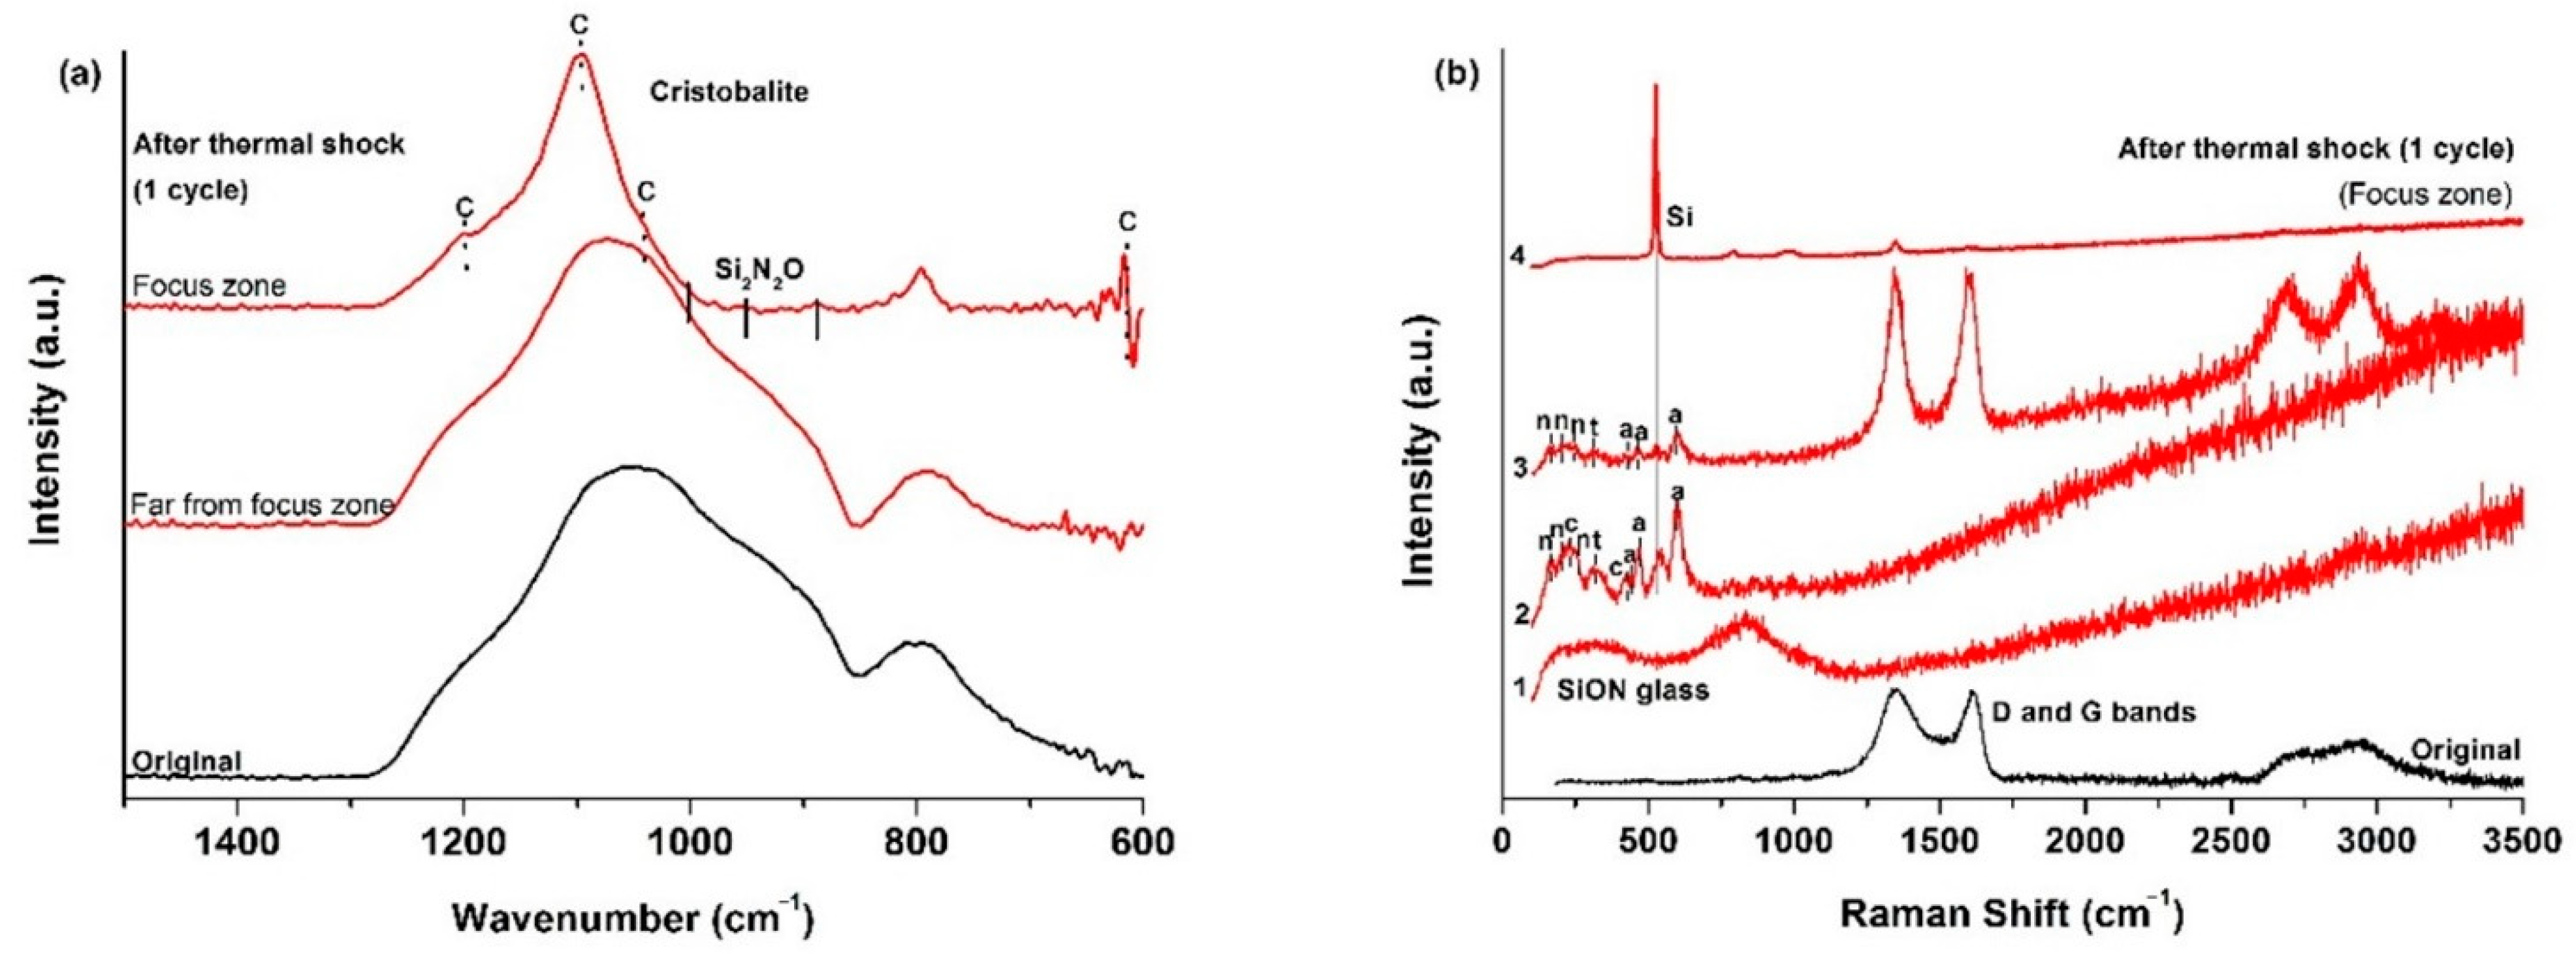
The ATR spectrum (
Figure 3a) of the initial SiOCN
p material displays a very broad signal from 850 to 1275 cm
−1, which includes the absorption bands of both Si–N (850 cm
−1 [
36]) and Si–O bonds (1072 cm
−1 [
19]) and other smaller bands located at 800 cm
−1 associated to the symmetric stretching of Si–O bonds and to the SiOC mixed network [
37]. The broadening of this first signal must be associated to the Si
2N
2O species generated with a different N/O ratio during the nitridation process [
36]. After the first thermal shock test cycle there are zones where no change is detected (far from focus zone), although there is one zone, in the focus zone precisely, where bands related to cristobalite appear (intense sharp bands at 1202, 1095, 1035 and 619 cm
−1 [
38] and to Si
2N
2O
2 with a different N/O ratio (900, 950 and 1000 cm
−1 [
36]).
The Raman spectrum of the initial SiOCN
p (
Figure 3b) material shows the D and G bands related to highly disordered carbon-derived materials associated to the C
free phase [
39]. The L
a value is 4.0 nm. After the thermal shock tests, the sample surface in the focus zone changes radically, revealing the complex nature of the SiOCN transformation (
Figure 3b). Spectrum 1 shows the presence of a SiON glass (broad bands centred at ≈300 and ≈850 cm
−1) [
40]. Spectrum 2 indicates the presence of a mixture of silica-derived compounds such as cristobalite (230 and 415 cm
−1), amorphous silica (429, 487 and 606 cm
−1), tridymite (345 cm
−1) [
38,
41] and crystalline Si
2N
2O (172–184, 230–250 cm
−1) [
40]. The presence of D and G bands related to C
free in Spectrum 3 is also noticeable, and probably indicates that some carbon particles may become trapped inside the melted layer due to the very rapid degradation of the material and the formation of a SiO
2/Si
2N
2O layer. Finally, a very sharp and intense peak centred at ≈520 cm
−1 can also be seen in Spectrum 4, which could be associated to Si produced as a result of the decomposition of the SiOCN
p material and the very severe conditions of the thermal ageing test [
40]. All these findings are in agreement with the melted zone and crystallizations observed by SEM (
Figure 2).
These results confirm the formation of a layer of SiO2 (mainly amorphous silica and cristobalite) and crystalline Si2N2O, and probably the formation of metallic Si due to the decomposition of SiOCN during the severe conditions of the thermal shock tests. In any case, the SiOCNp material does not pass the thermal shock test, but undergoes rapid and severe oxidation and decomposition. These materials are not suitable for high-temperature solar receiver applications. However, the very rapid formation of the SiO2/Si2N2O “protective” layer highlights the potential of this material. To be used for this purpose, the material’s porosity would have to be eliminated in order to minimize the inward/outward fluxes of gases that produce the rapid and massive degradation, and the formation of a dense and tightly-bonded protective layer.
3.2. SiOCp
The initial appearance of the SiOC
p material is shown in
Figure 4a.
Figure S3b shows the temperature recorded throughout the experiment (38 cycles) is constant, although there are some temperature variations caused by fluctuations in the direct solar irradiance and the wind, due to the fact that the thermal shock experiments are performed outdoors. After 25 thermal shock cycles the appearance of the SiOC
p material remains unchanged and no sign of degradation is detected. The study by ICM also confirms that the topography of the SiOC
p remains unaltered, showing the same surface regardless of the area studied (
Figure S4). Only a slight increase in the roughness values is observed compared to the initial values of the SiOC
p sample (
Table 1). In view of the results obtained, another set of thermal shock cycles was conducted, and after cycle 37 a large crater appeared covered with a white melted zone on the black surface precisely in the focus zone. Another cycle was done for confirmation (cycle 38th), and the same result was achieved (i.e., the formation of a new crater) (
Figure 4b. A weight decrease of 5% was observed after the thermal shock cycles, and the porosity of the sample varied from 81 to 82%. The weight decrease is due to C
free degradation (3), although the formation of a white melted zone can be associated to the SiOC decomposition (6) and the subsequent formation of a SiO
2 layer.
SEM images after 38 cycles are shown in
Figure 5. The material surface underwent severe degradation as a result of the thermal shock tests. The zone farthest away from the focus remains unchanged (
Figure 5a). But as the distance from the focus decreases, there first appears a mixture of pristine material and new melted material (
Figure 5b); and then a dense layer can clearly be seen in the focus zone itself (large crater covered with a layer of white melted material; see
Figure 4b), partially interrupted by bubbles due to the gases evolved during the C
free (3) and SiOC (6) degradations (
Figure 5c,d). As the material decomposes (i.e., C
free and SiOC) due to the very harsh experimental conditions and to the highly porous microstructure of the material, O
2 can easily diffuse inside the material and degrade both C
free and SiOC phases, producing gaseous (CO
2 and CO) and solid species (melted SiO
2) at the same time. Most of these gaseous species can also diffuse outwards, but some become trapped inside the recently formed molten layer (
Figure 5c,d).
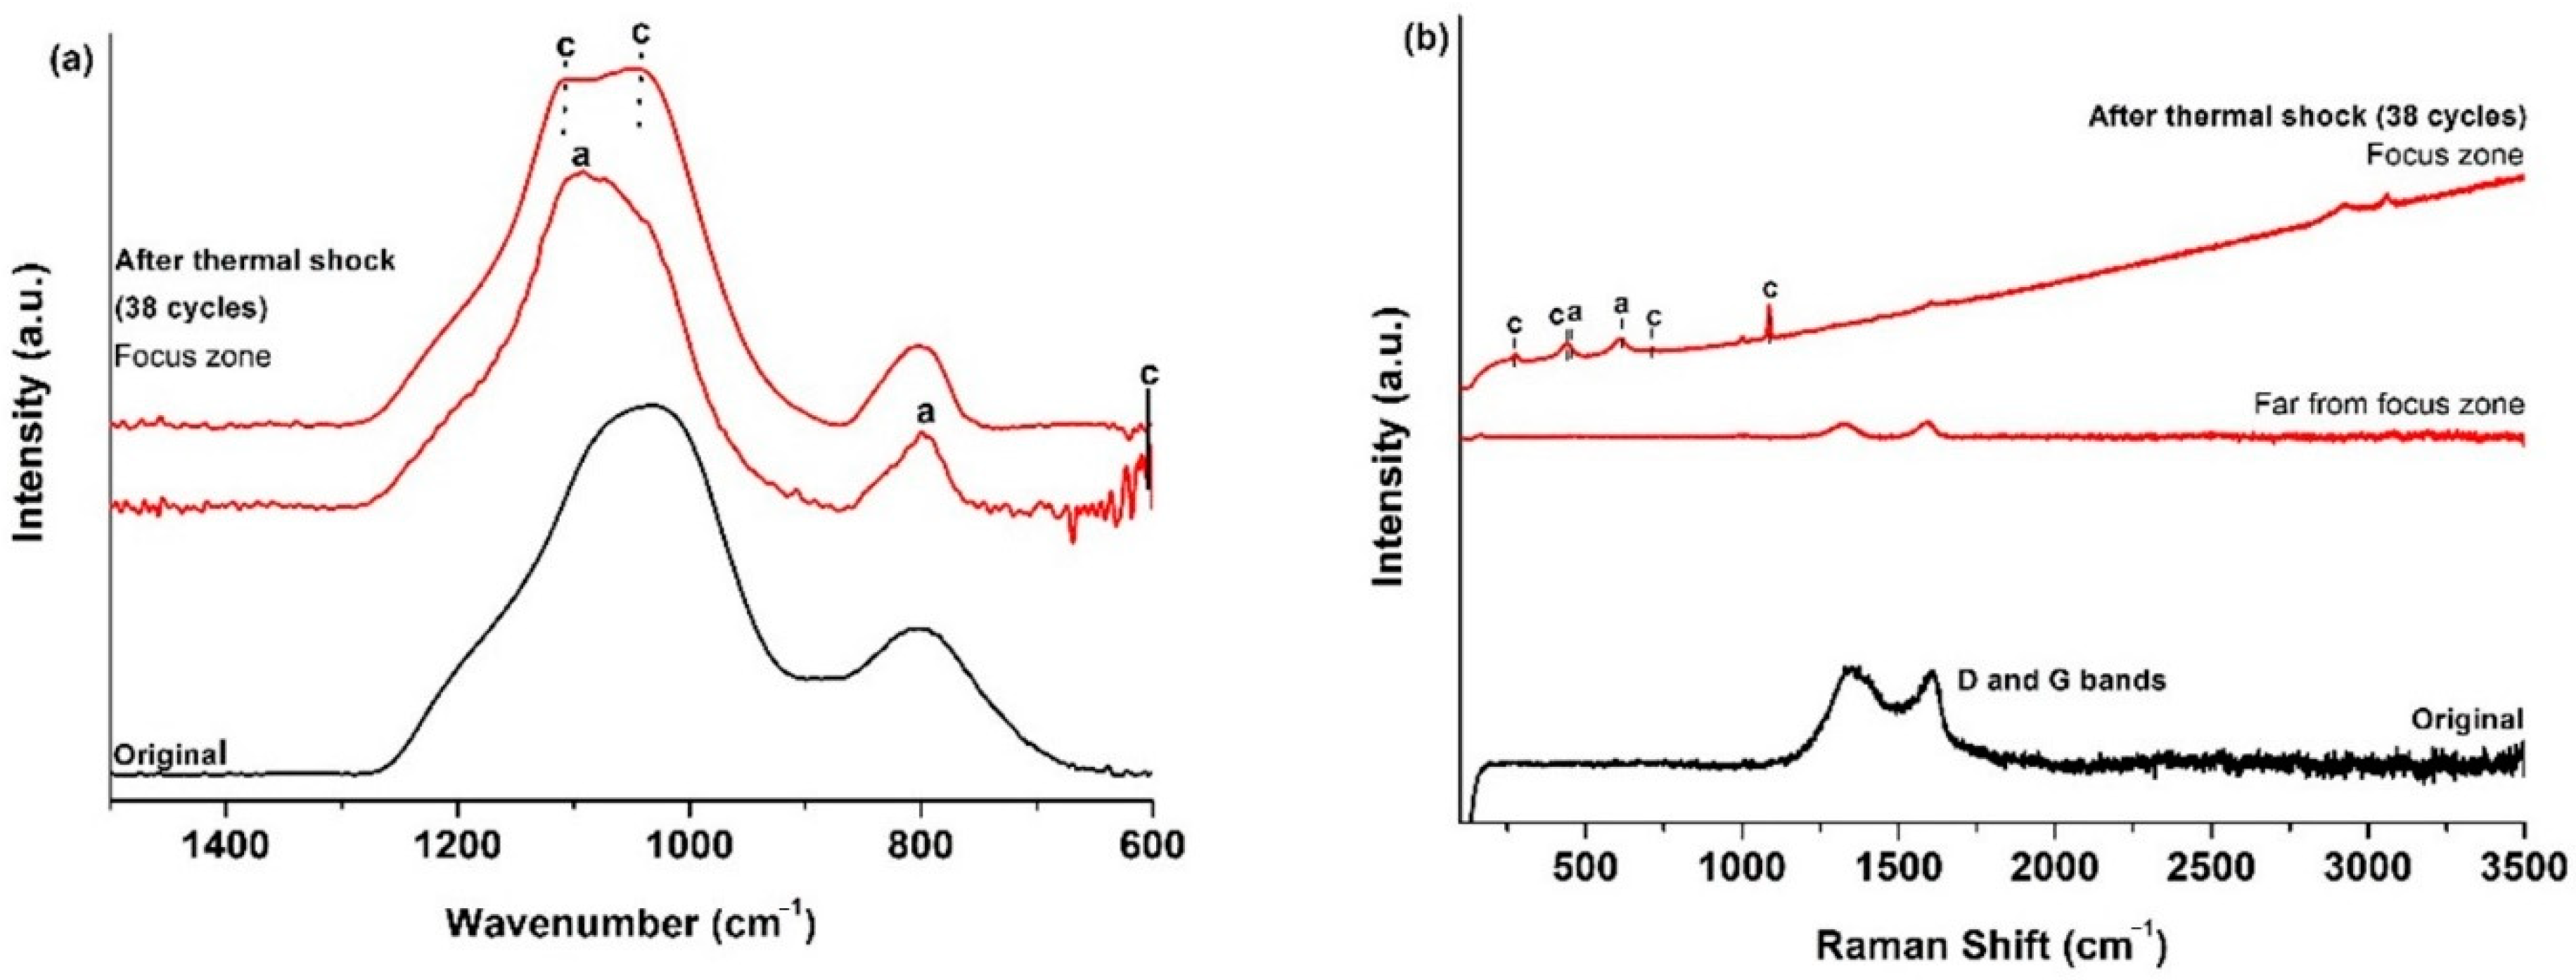
The ATR spectrum of the initial SiOC
p material (
Figure 6a) shows the typical features of these materials (1050 cm
−1, asymmetric stretching of Si–O [
19], 805 cm
−1 symmetric stretching of Si–O [
19] and the SiOC network [
37]). In the focus zone, after 38 cycles of thermal shock tests, the stretching of Si–O bonds, especially asymmetric stretching, shifts to a higher wavenumber denoting the formation of both amorphous silica [
42] and cristobalite [
38] due to the decomposition of the SiOC
p material (6). The Raman results perfectly match the results of the ATR spectroscopy (
Figure 6b). After the thermal shock test, unaltered zones appeared with only the presence of the D and G bands of the C
free phase [
39], related to zones far from the focus zone. Bands related to cristobalite (281, 425, 710 and 1083 cm
−1) and amorphous silica (429, 487 and 606 cm
−1) [
38,
43] are observed in other zones close to the solar focus zone. The L
a value of the C
free phase is 3.5 nm. Similar results were obtained in previous studies on the thermal shock test of SiOC
p at 1200 °C, although several differences can be observed, such as the major contribution of ordered species (i.e., cristobalite) and the absence of amorphous silica. In this experiments the sample experienced a noticeable surface degradation just after the first cycle, and a hole was observed to form after five cycles [
18]. In any case, the SiOC
p material undergoes a massive degradation of its surface, indicating that it is unsuitable for high-temperature solar receivers at least at 1000 °C.
In the case of porous materials, SiOCNp displays the most severe degradation when is compared with SiOCp even if was expected to experience better results due to the formation of a protective layer of SiO2/SiO2N2. This degradation occurs faster in SiOCNp by the presence of bigger pores (SiOCNp ≈ 20 µm, SiOCp ≈ 10–15 µm) which allow gaseous species pass both inward and outward basically without restrictions facilitating the degradation of larger La domains of Cfree (SiOCNp La = 4 nm, SiOCp La = 3.5 nm).
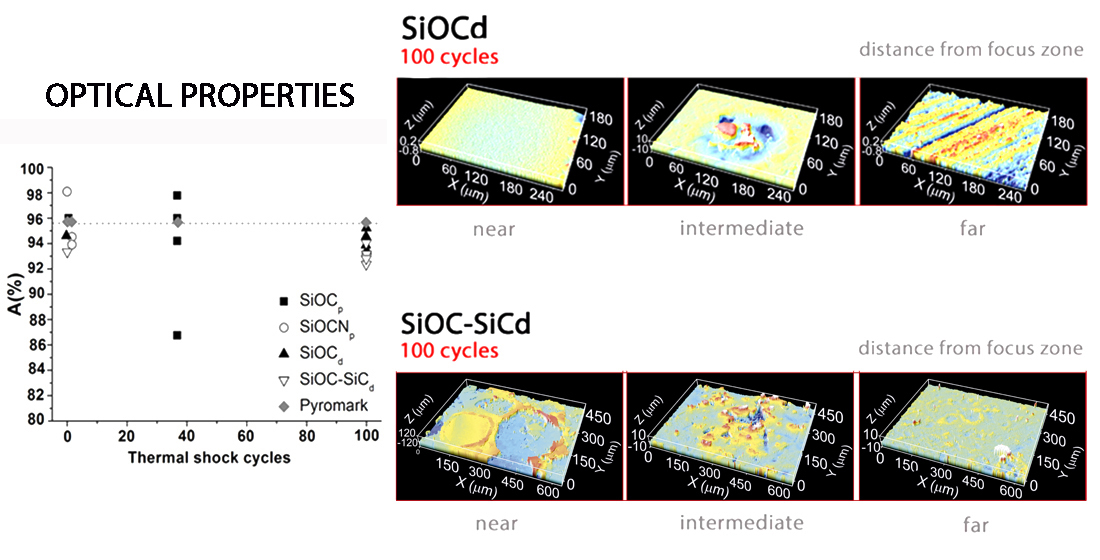
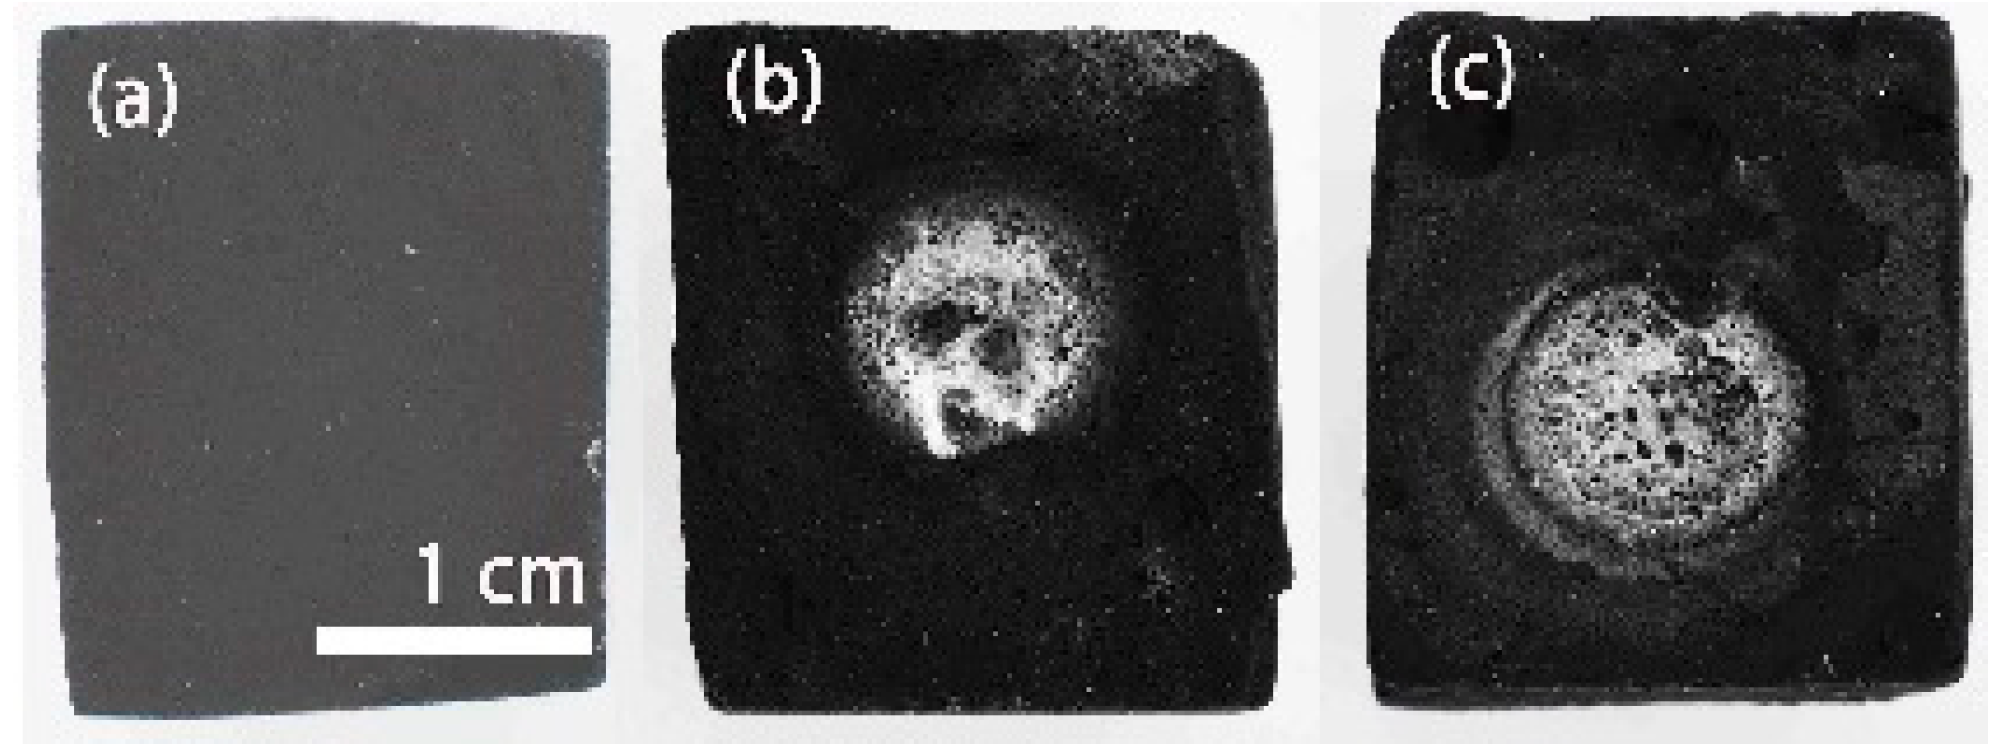
3.3. SiOCd
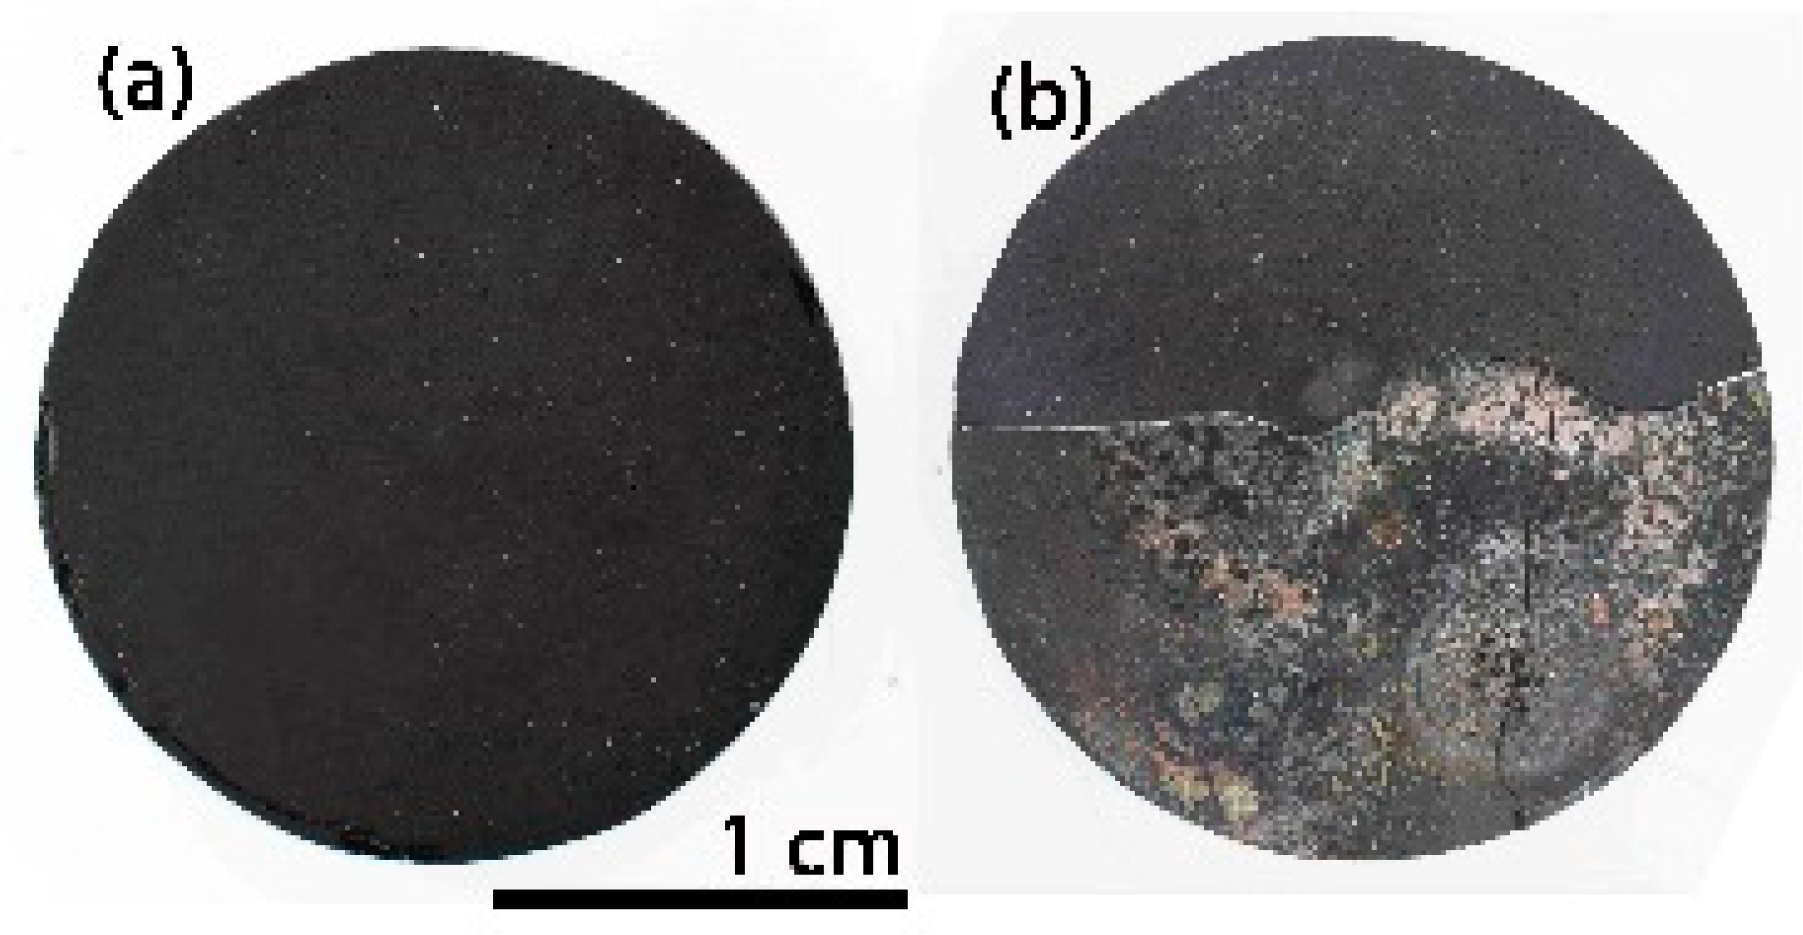
Figure 7a shows the initial appearance of the dense black SiOC
d material. As it can be clearly observed in the temperature vs time graph (
Figure S3c, during the 100 cycles of thermal shock, there are slight fluctuations in temperature that are related to the experimental conditions; that is, variations in direct solar irradiation due to the presence of clouds and wind, because the tests are performed outdoors [
18].
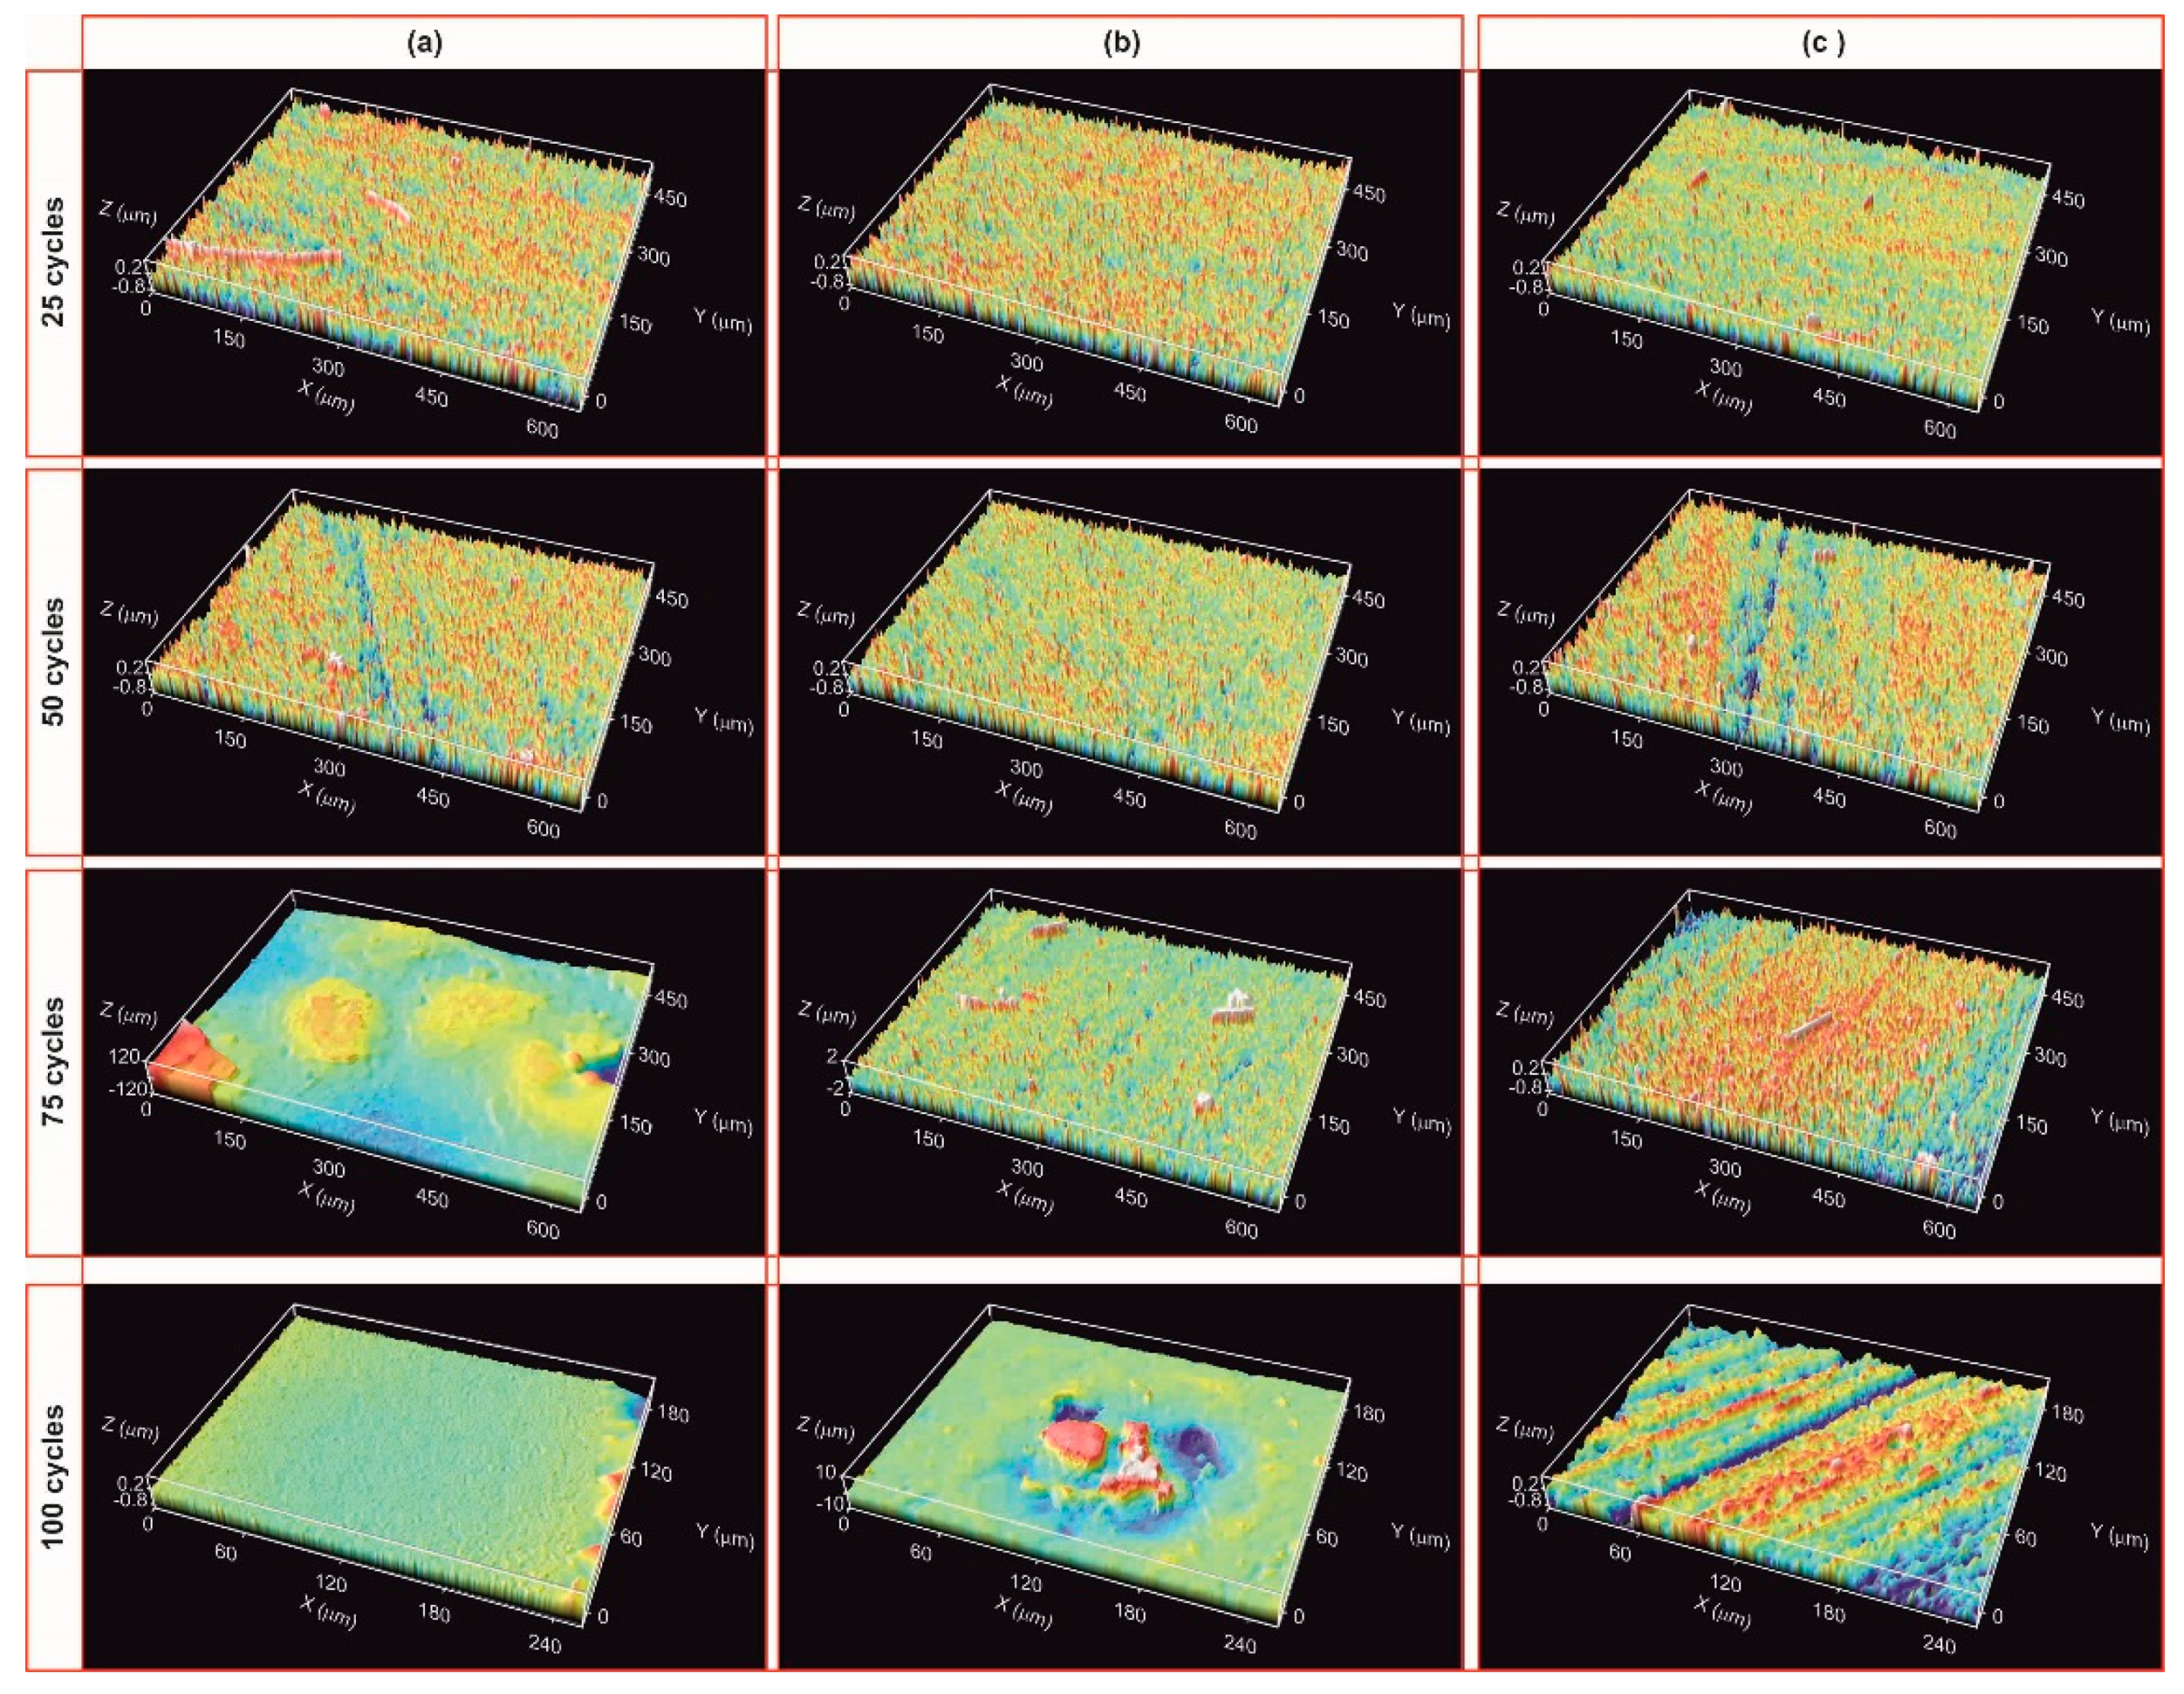
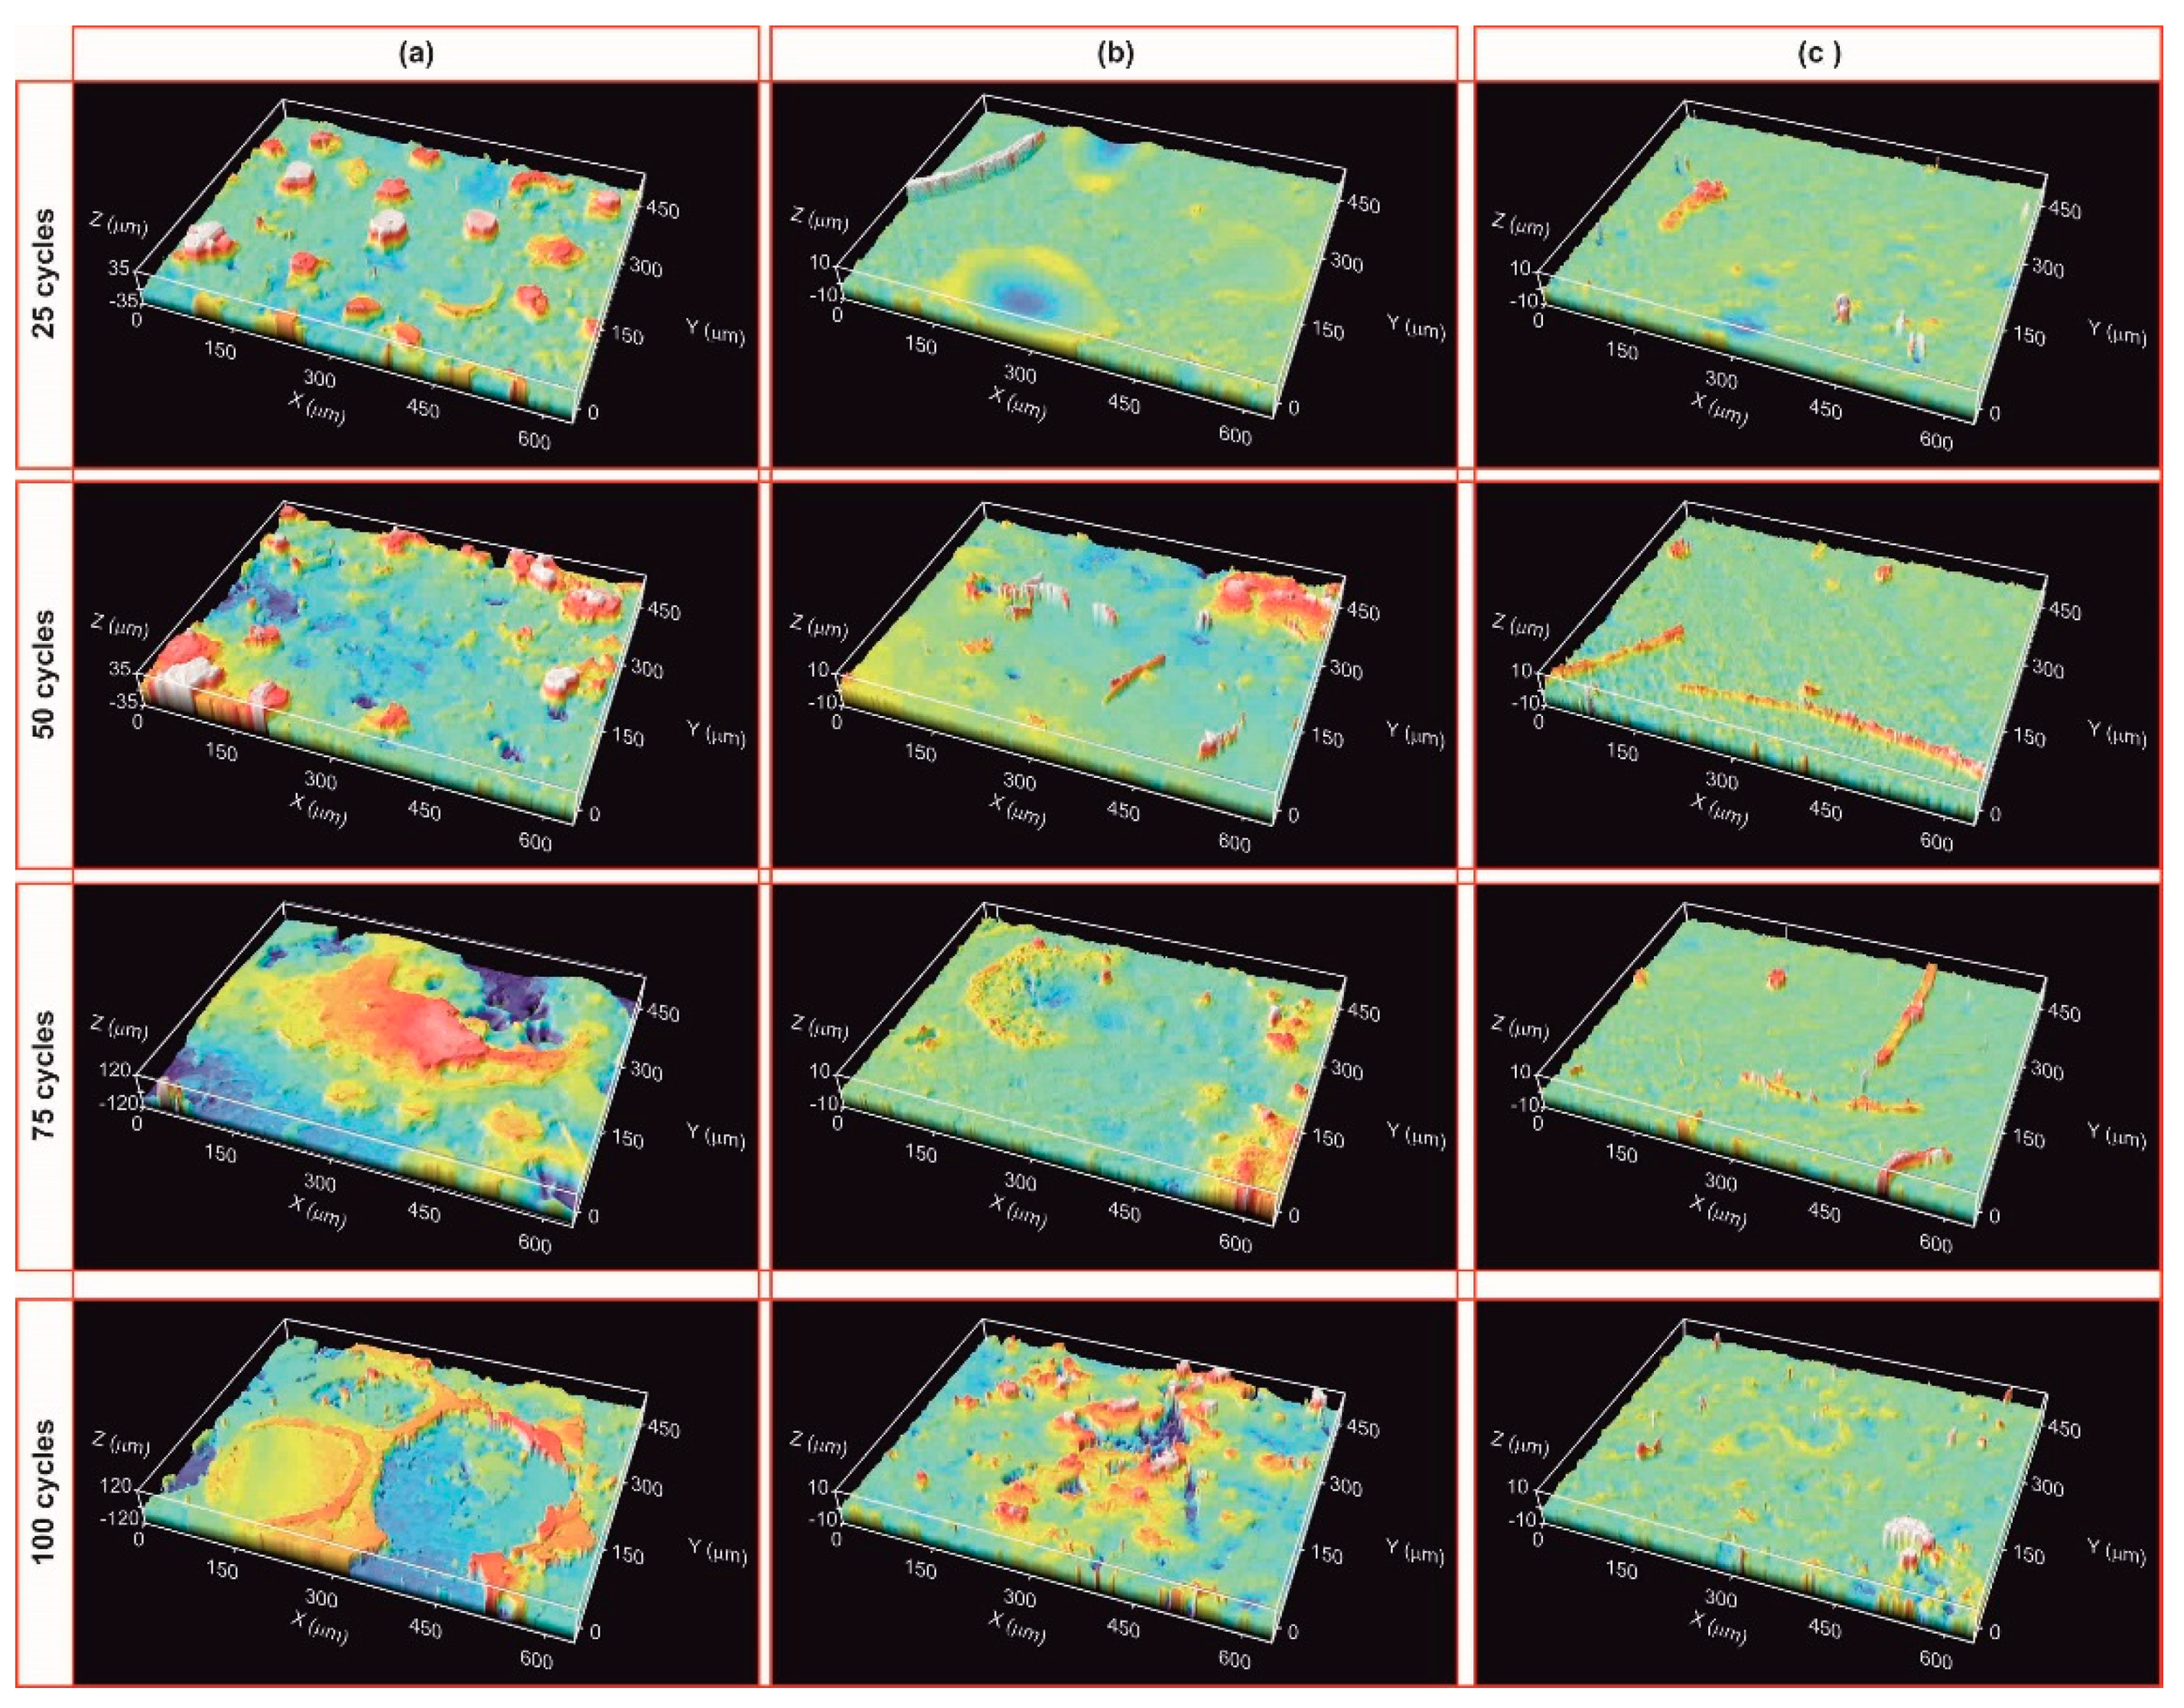
After the first 25 cycles, the visual inspection does not indicate any degradation. The ICM study also confirms this result; the material remains unchanged regardless of the zone analysed (
Figure 8a–c (25 cycles)) and the roughness values are also similar to the initial value (
Table 1). After 50 cycles, the sample surface displays the same results (
Figure 8a–c (50 cycles) and
Table 1). After 75 cycles, the sample undergoes a modification in its surface, especially in the zones near the focus of the solar radiation (
Figure 8a–c (75 cycles)). High peaks and valleys (>200 μm) appear in the focus zone, while small wires are observed in the intermediate zone (between 22–65 μm in length and 11 μm in diameter). The main change in this area is the appearance of a green-cyan coloured coating probably associated to the formation of a protective SiO
2 layer [
18]. The roughness values agree, and only an increase in the R
a value is observed in the focus zone (
Table 1). The roughness remains constant in the intermediate zones and away from the focus (
Table 1). After 100 cycles, the surface of the sample undergoes additional changes, basically observed in the areas near the focus zone. The focus zone appears smoother, while the intermediate zone appears rougher compared to the image for 75 cycles (
Figure 8b). However, the green-cyan coating is still present over the whole surface in this intermediate zone. Again, the zone far from the focus remains almost unchanged. R
a values agree with the confocal images, and a significant decrease is only measured in the focus zone, with very low R
a values in all the zones. (
Table 1). This smoothing was previously attributed to the formation of a melted protective SiO
2 layer in SiOC materials after the thermal shock ageing test [
18]. In previous studies carried out at higher temperature (i.e., 1200 °C), it was observed that the SiO
2 layer covered the whole surface. In this case, the SiO
2 only covers the focus zone indicating the huge resistance of SiOC under concentrated solar radiation at 1000 °C after 100 cycles. After 100 cycles of the accelerated ageing test at 1000 °C, the black bulk SiOC
d sample displays a whitish halo precisely in the focus zone (
Figure 7b) related to the formation of a protective silica layer [
18,
23]. Weight and porosity do not change, so the material does not experience a massive degradation.
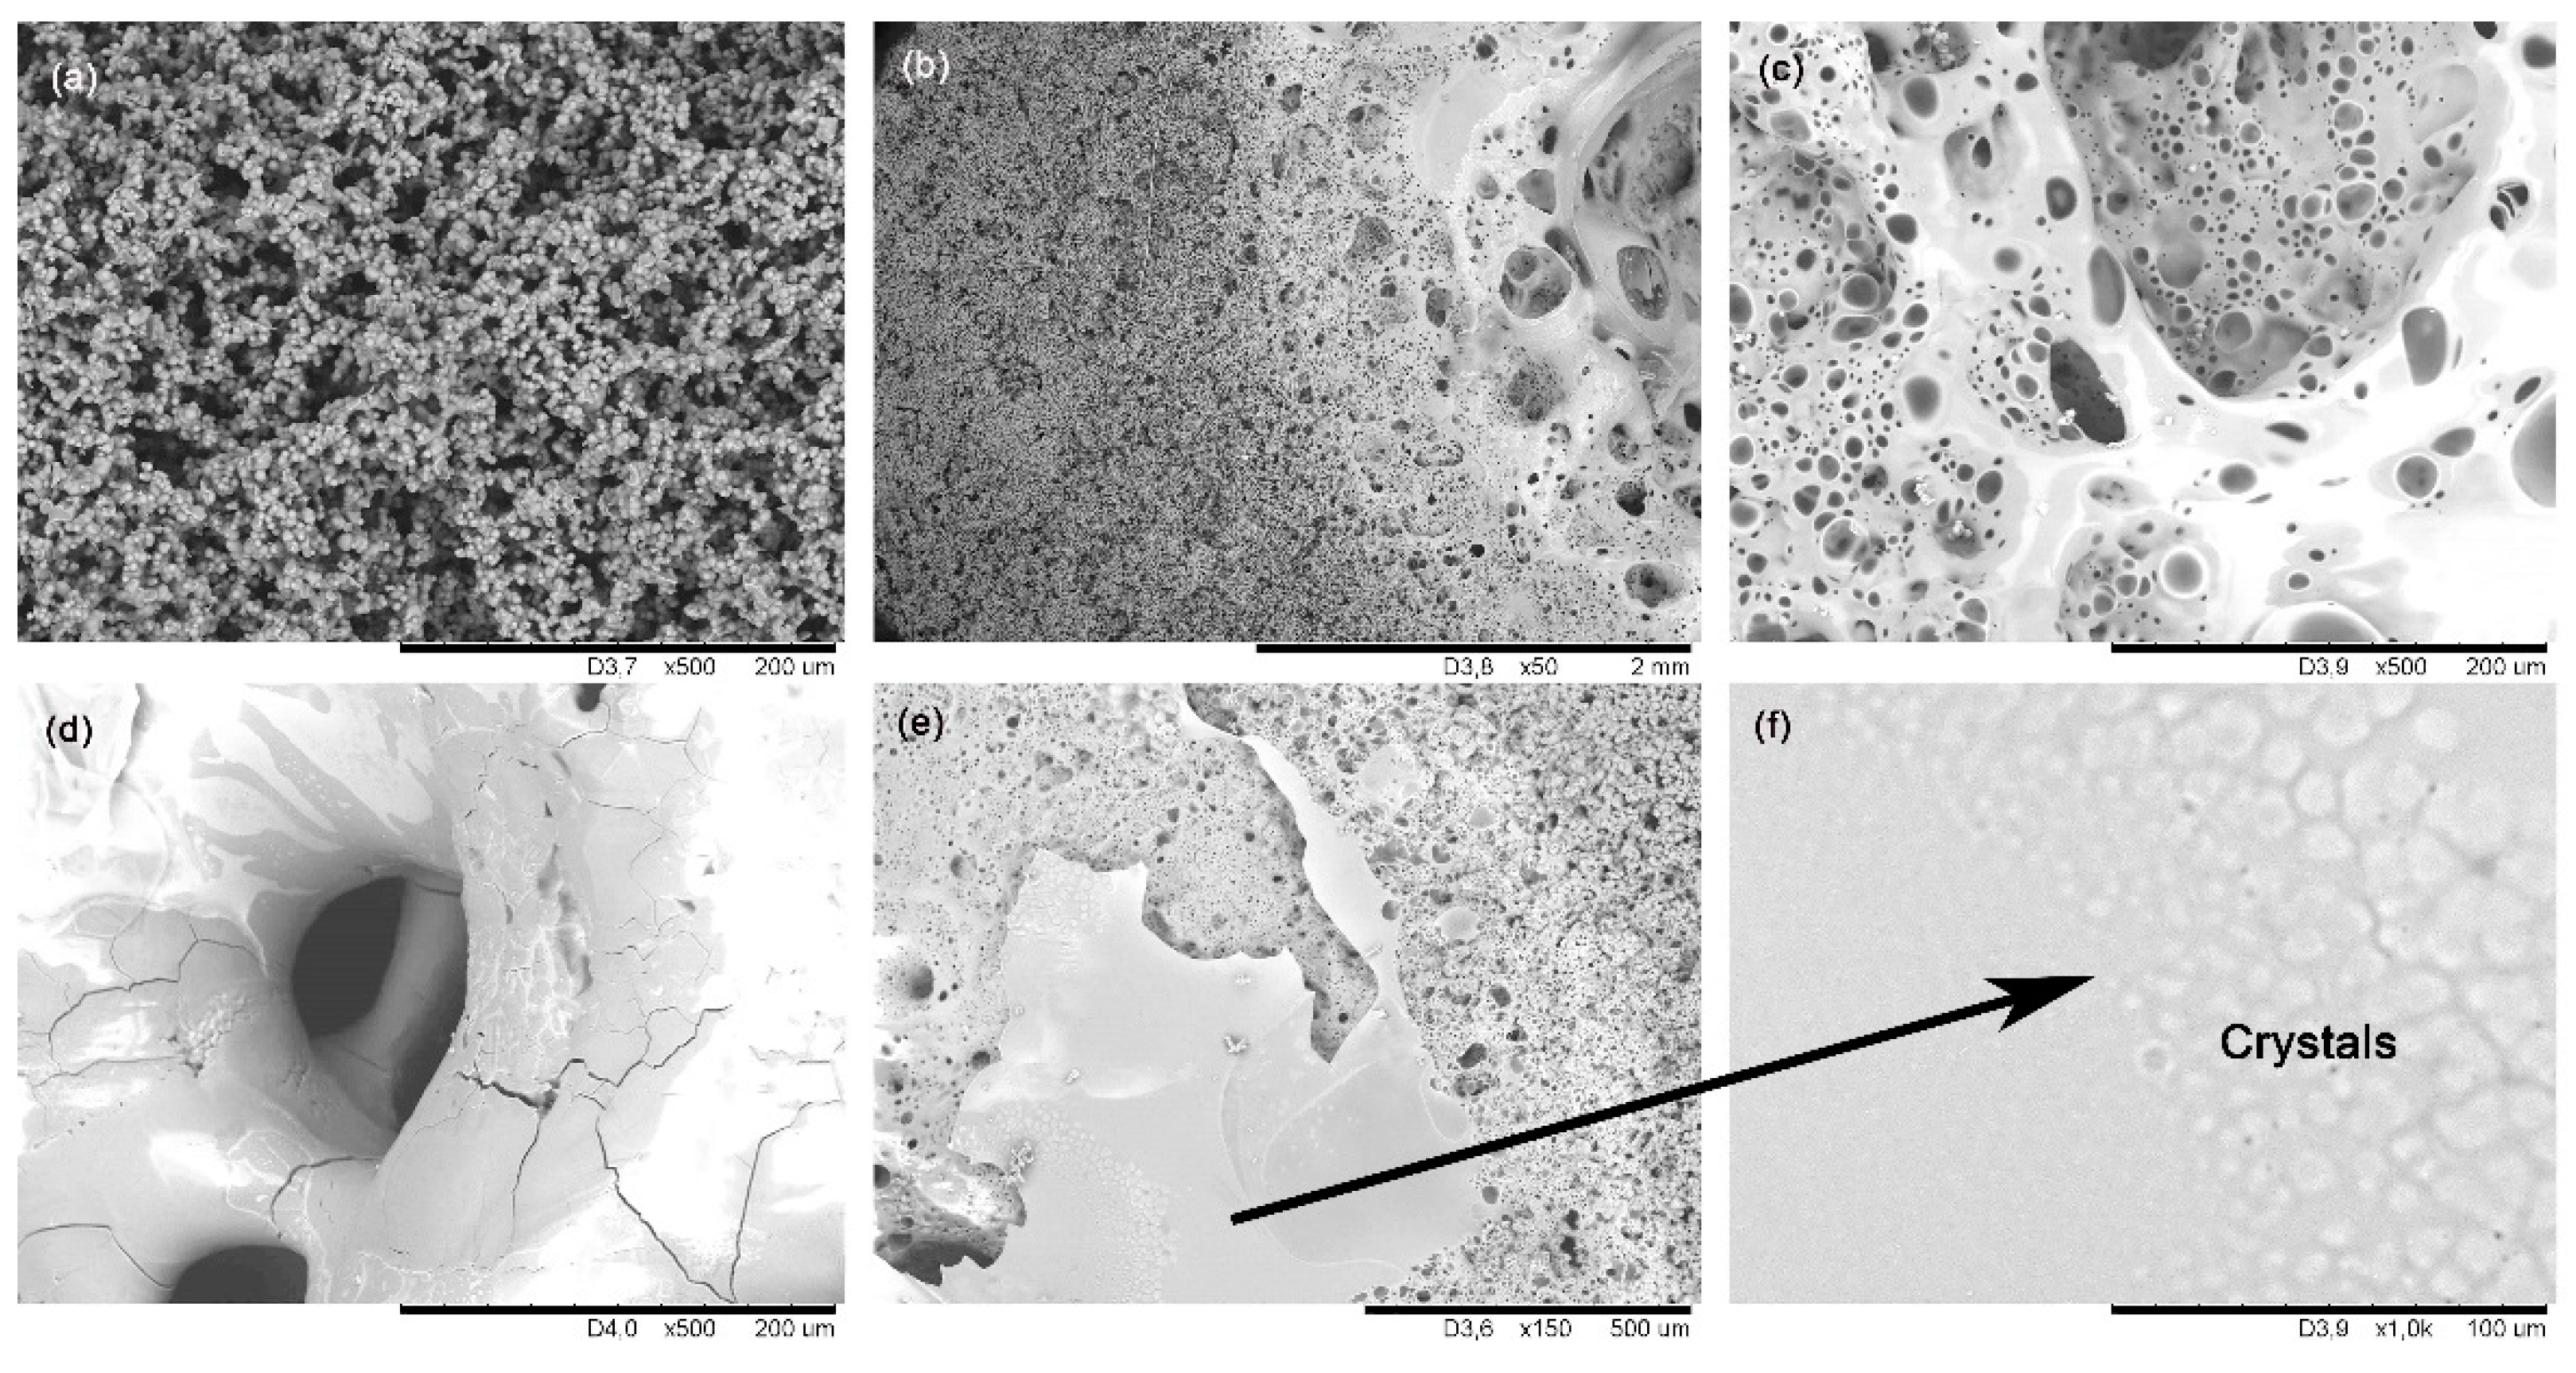
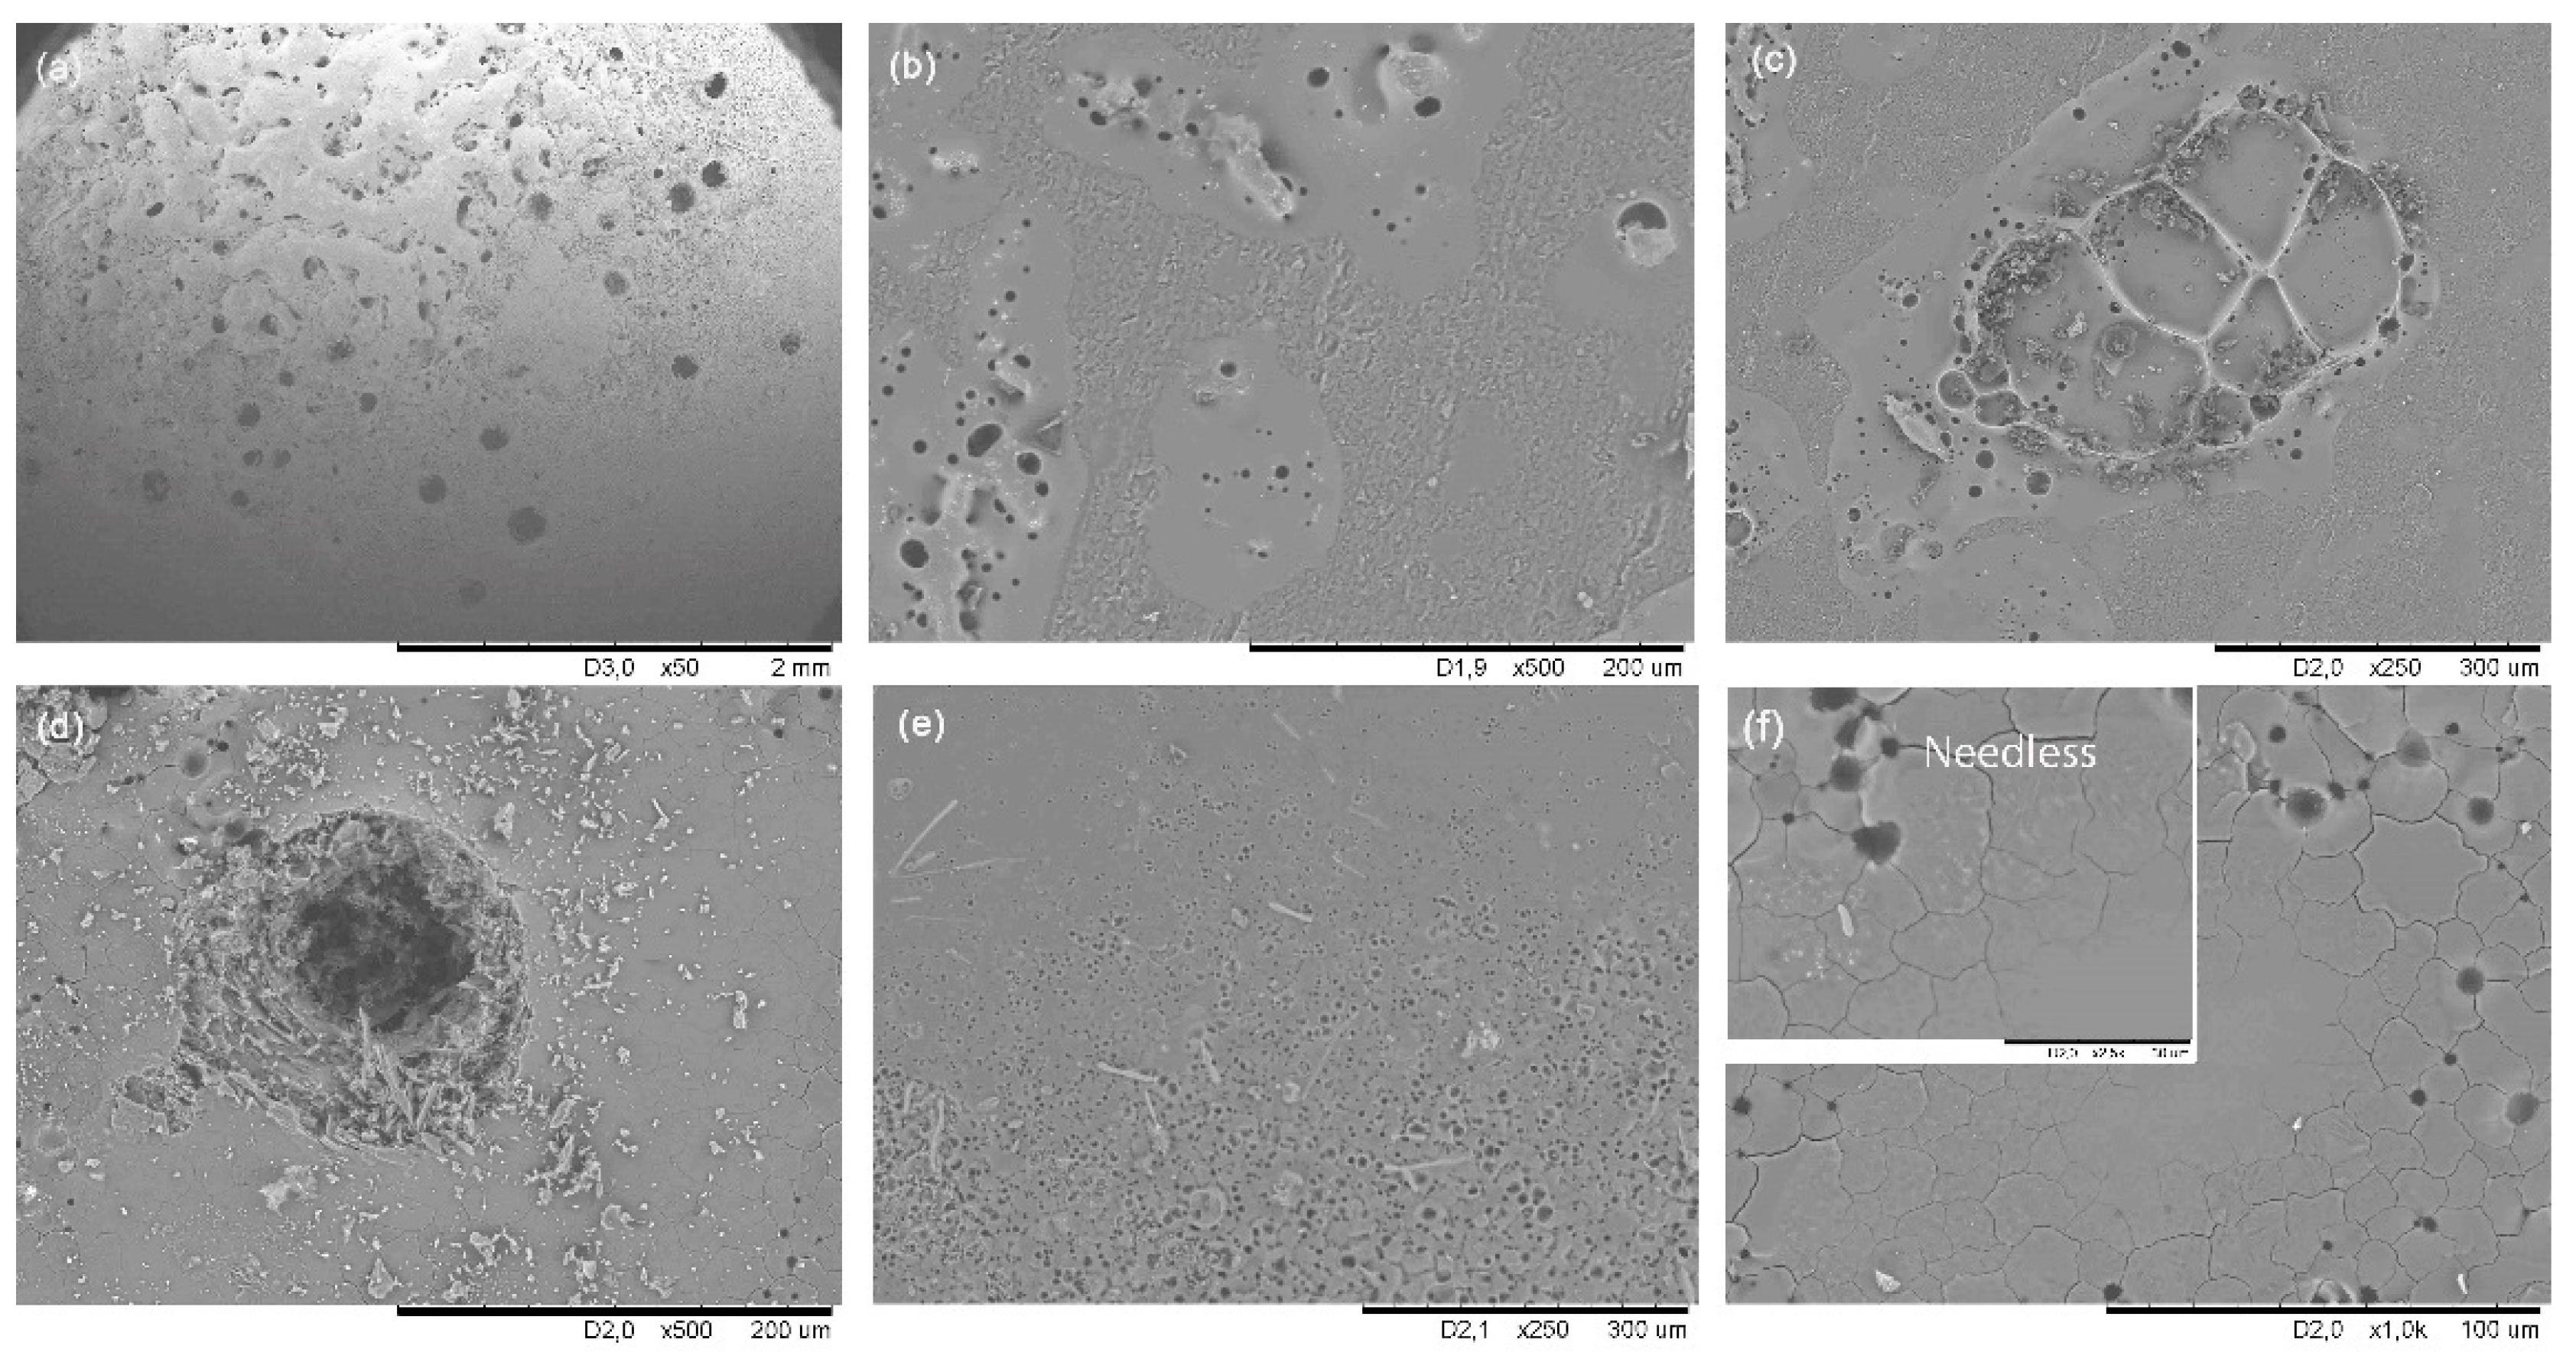
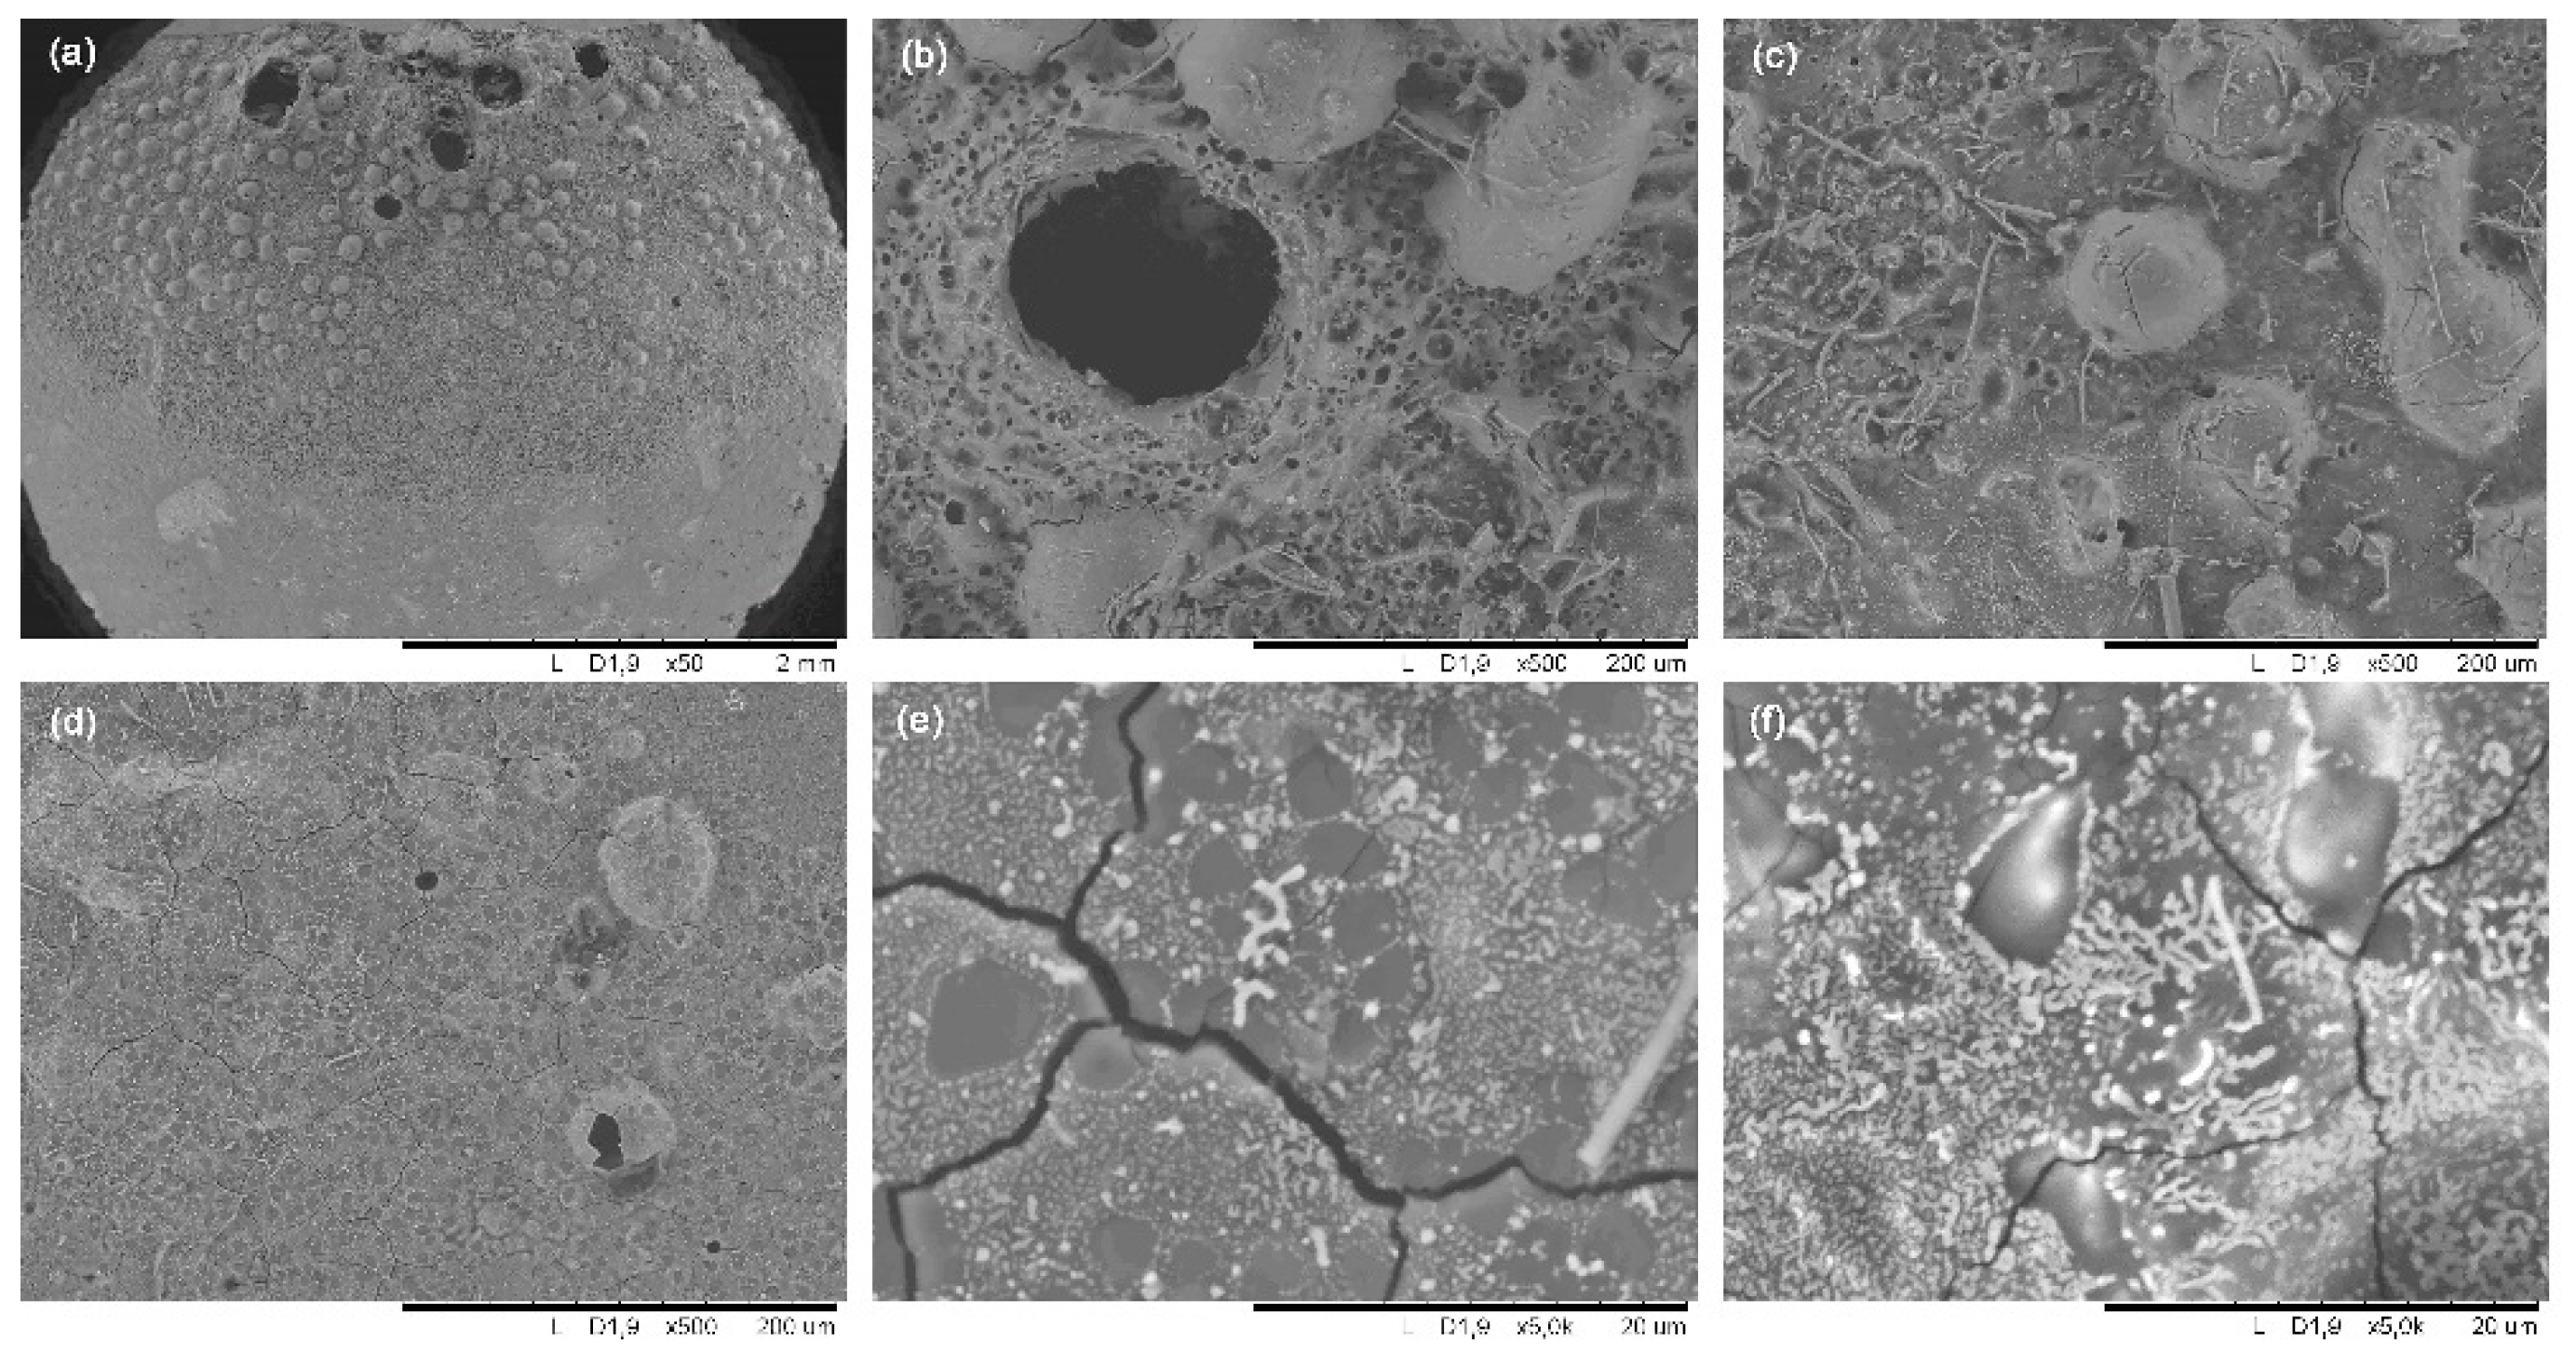
SEM images of the SiOC
d material surface after 100 cycles of thermal shock at 1000 °C are shown in
Figure 9. The focus zone (
Figure 9a) reveals a smoothing which agrees with the confocal images and R
a values (
Figure 8a, 100 cycles and
Table 1). As the distance from focus zone increases (downward direction) valleys, wires and cracks appear (
Figure 9d–f, respectively) related to C
free degradation and the formation of the SiO
2 layer. The inset in
Figure 9f shows the formation of needles inside cracks related to the crystallization of SiO
2 species (i.e., cristobalite). The intermediate zone (
Figure 9b,c) displays patches without surface modification, but isolated degraded zones also appear with the presence of large and small pores surrounded by melted zones. The formation of this inhomogeneous rough surface with melted zones and the remains of exploded bubbles must be associated to the beginning of the surface degradation, (3) and (6) (C
free degradation and SiO
2 formation, respectively). However, it should be noted that both the inward and outward diffusion of gaseous species must be very slow due to the incomplete formation of the silica layer, which is not evident over the whole SiOC
d surface as in the case of the accelerated ageing test at 1200 °C [
18].
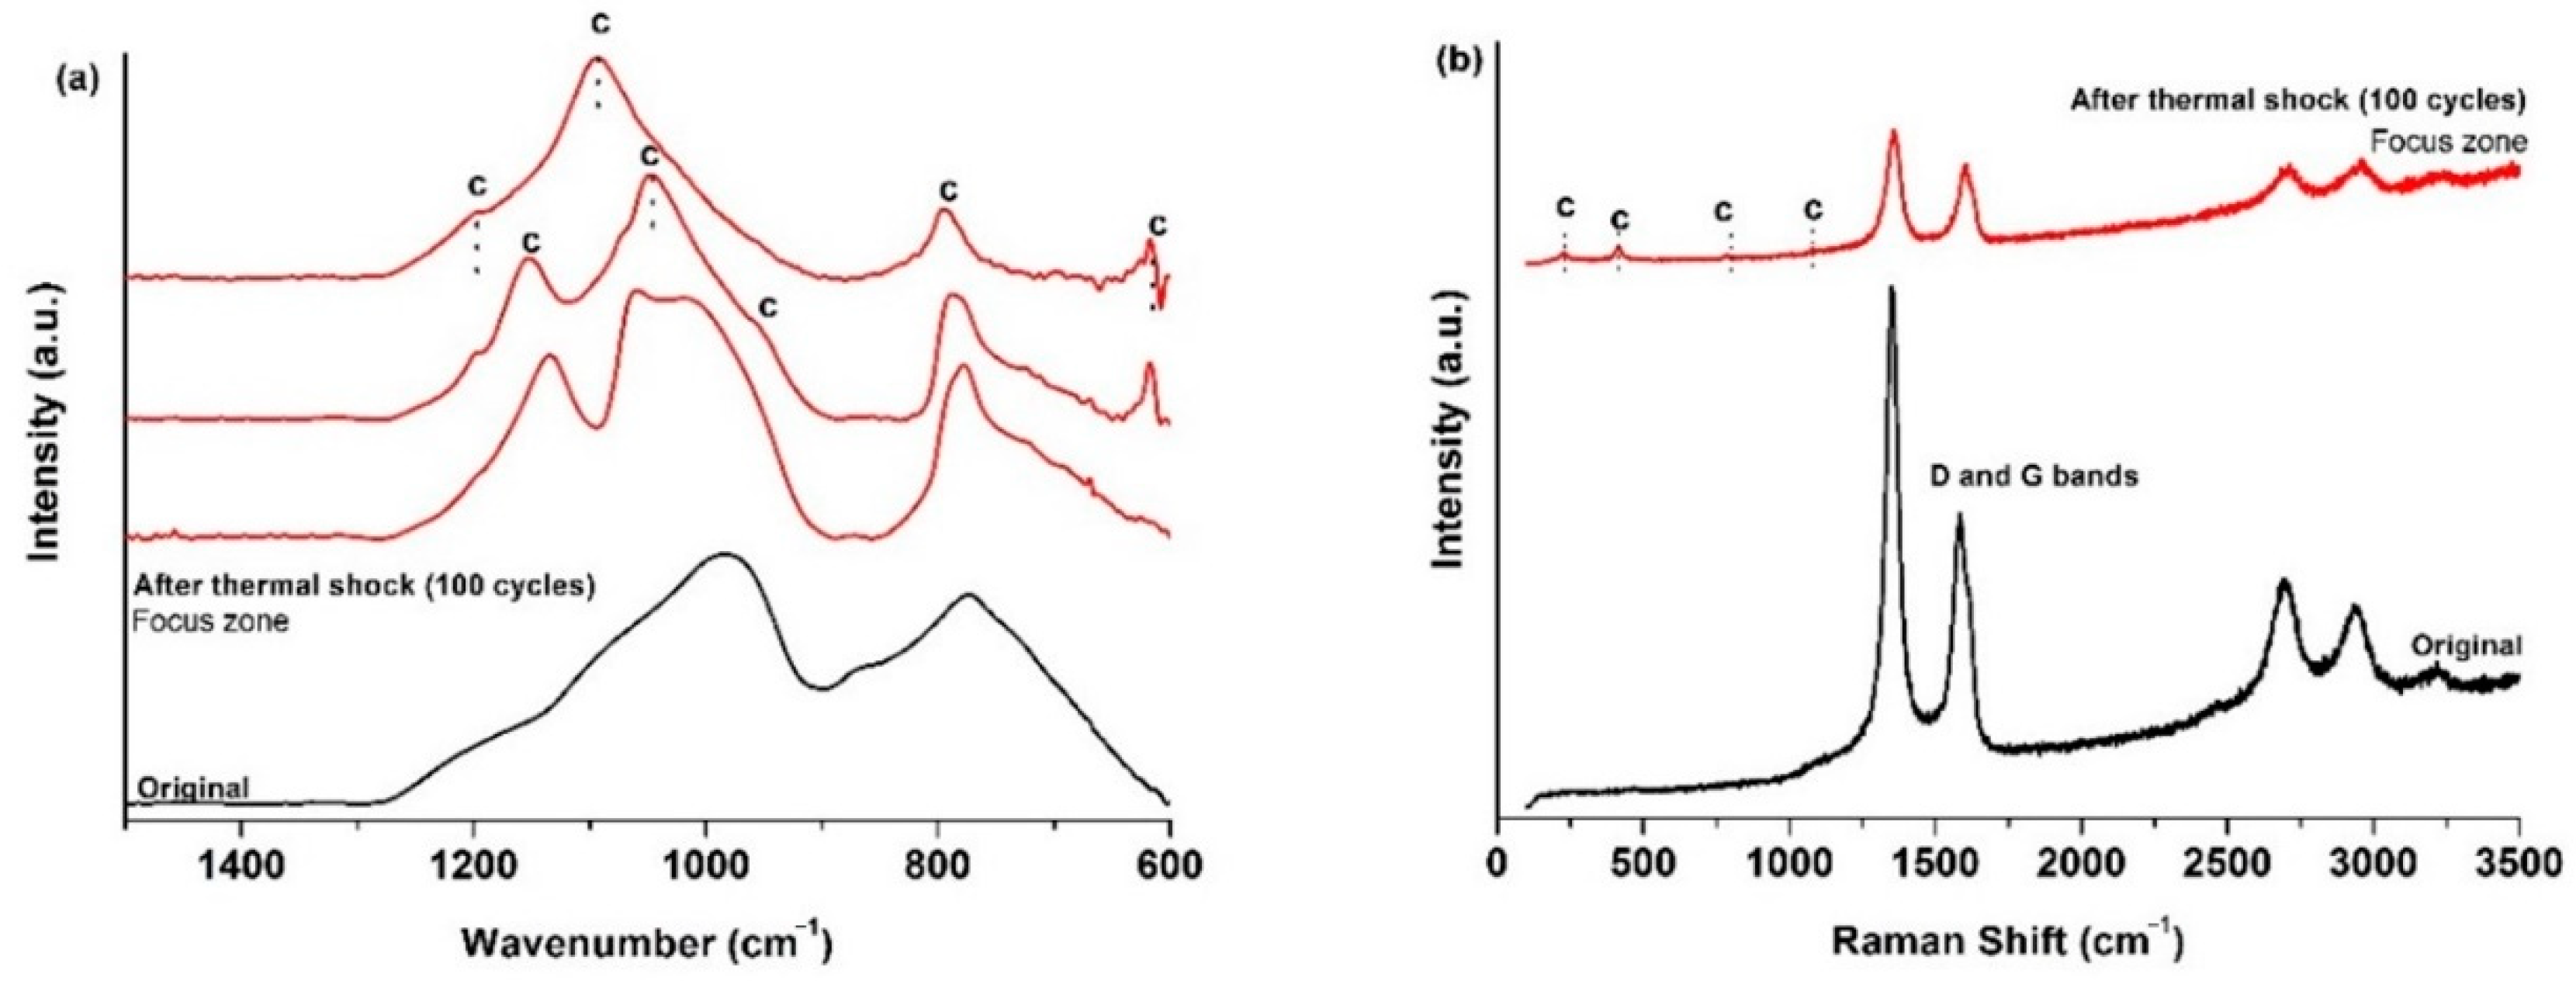
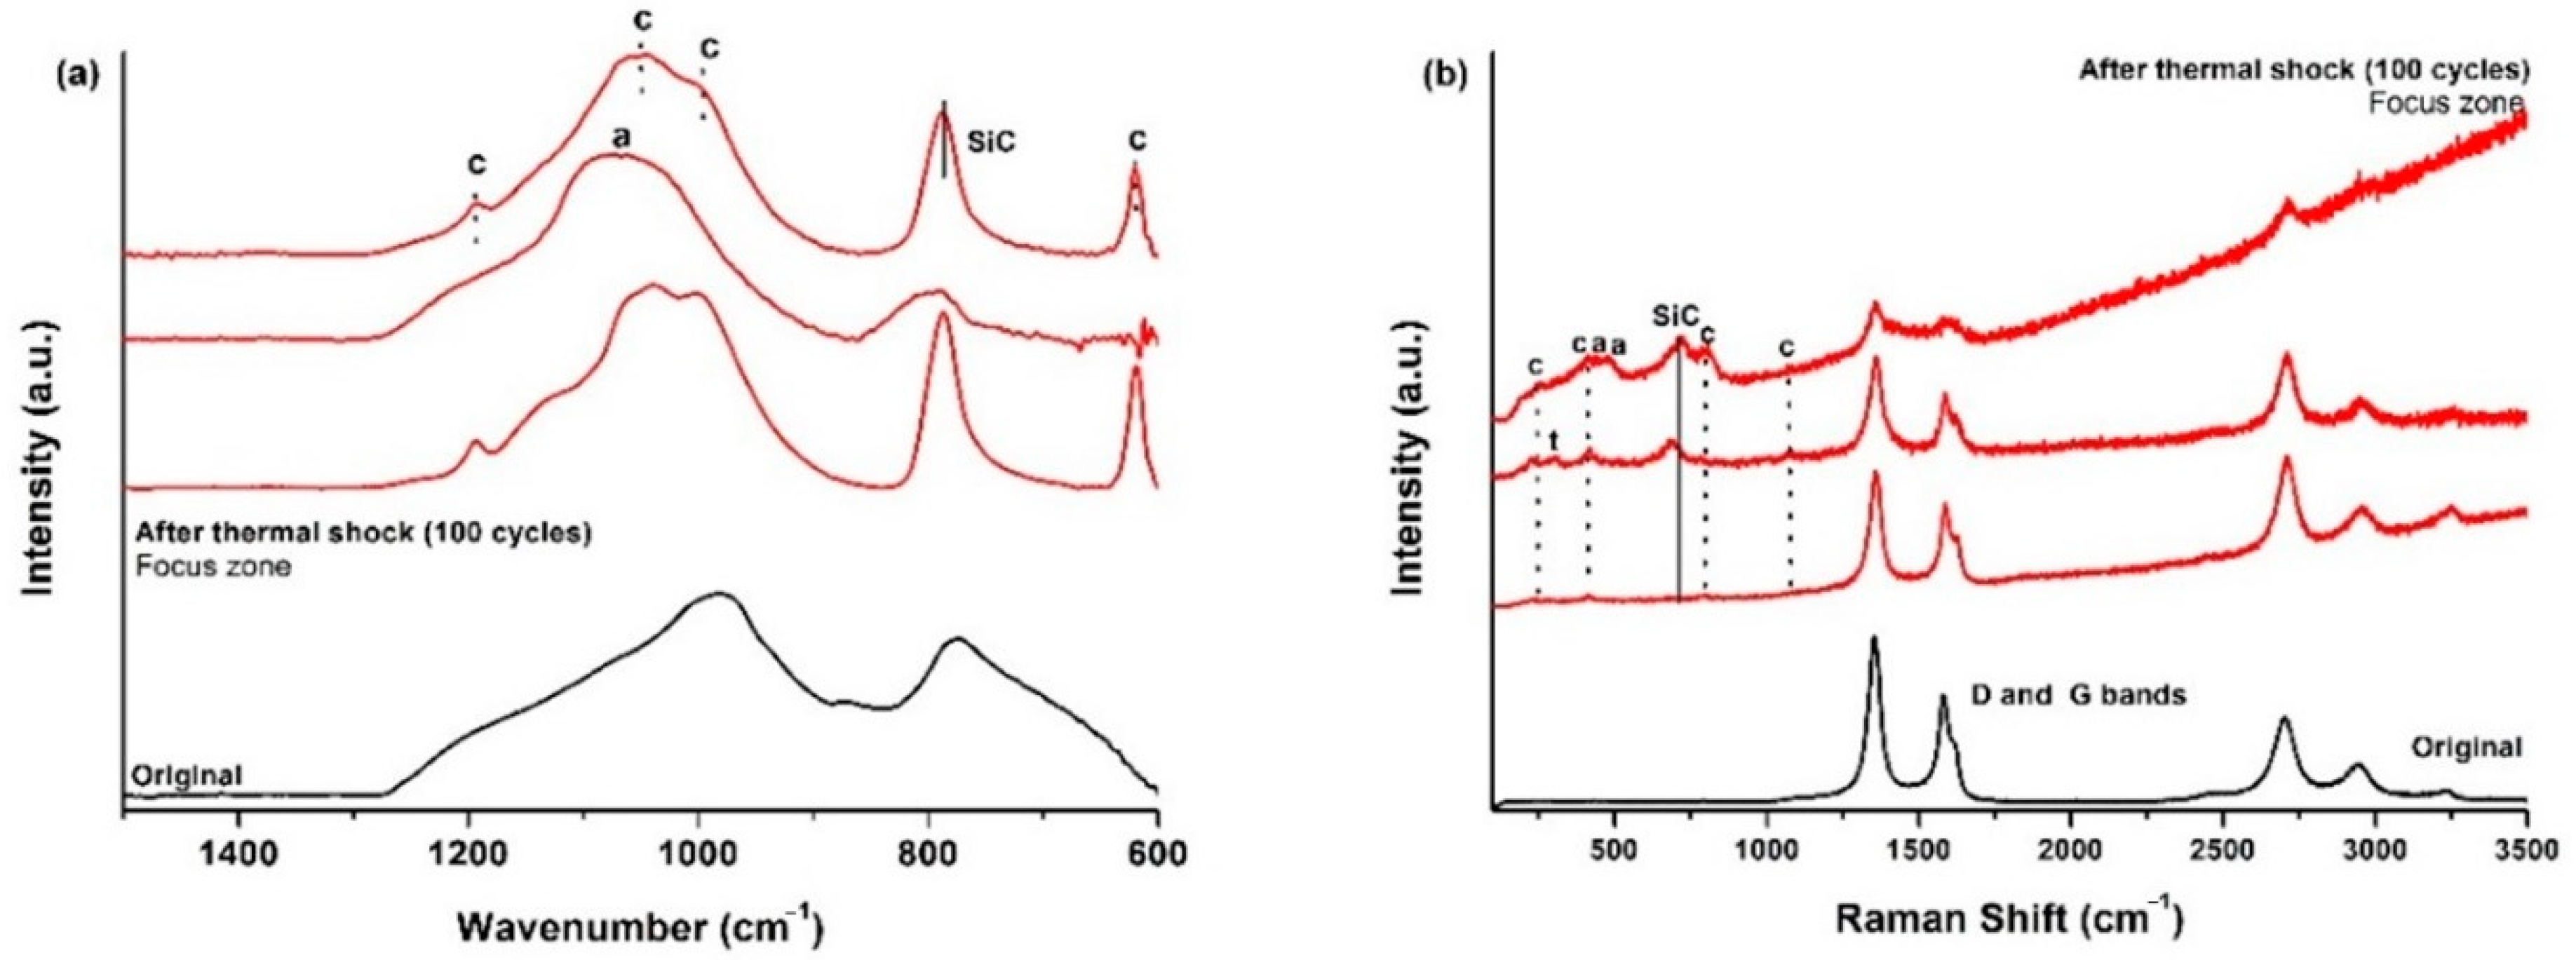
All these changes were also analysed by ATR and Raman spectroscopies. The ATR spectrum of the initial SiOC
d shows the bands related to Si–O and the SiOC mixed network, and a small band also appears at 880 cm
−1 related to Si–C bonds [
30]. After 100 thermal shock test cycles, in the focus zone, the spectrum changes and displays mainly the bands related to cristobalite with the presence of the most intense bands (1202, 1095, 1035, 619 cm
−1), and other less intense bands (1156, 942 and 793 cm
−1) [
38] (
Figure 10a). The Raman spectrum of the initial SiOC
d material shows D, G and second order bands [
30] associated to the C
free phase with a noticeable reorganization with respect to SiOC
p which has a highly disordered C
free phase, basically due to the sintering temperature. The L
a value is 1.7 nm. After 100 cycles of the thermal ageing test, in the focus zone, C
free bands appear together with the cristobalite bands, where again, in addition to the presence of the most intense bands (231 and 415 cm
−1) [
38], the other less intense bands are also noticeable (782 and 1093 cm
−1) [
43] (
Figure 10b).
Compared to the previous studies at 1200 °C [
18], the modification of the surface of the SiOC
d material is much less obvious, as has been demonstrated by the ICM, SEM, ATR and Raman studies, and by the variation in both weight and density. Another point that supports this assumption is that the formation of a SiO
2 layer is not found over all the material surface. In any case, the SiOC
d material supports the severe conditions of the thermal shock ageing test quite well (rapid heating at 32 °C s
−1 and cooling at 27 °C s
−1, from R.T. to 1000 °C, over 100 cycles), and the high temperature test at 1000 °C (100 cycles) [
17], indicating the huge resistance at these experimental conditions and the suitability of SiOC
d material as a candidate for high-temperature solar receivers.
3.4. SiOC–SiCd
The initial appearance of the dense black SiOC–SiC
d material is shown in
Figure 11a. During the handling of the SiOC–SiC
d sample, it broke into two pieces before it was placed inside the stainless steel chamber; nevertheless, it was decided to perform the thermal ageing test on one of the pieces as the break did not occur while it was in service. The variation in temperature during the 100 cycles is shown in
Figure S3d, and it can clearly be seen there is almost no variation during the thermal shock experiment.
After 25 cycles, the visual inspection does not reveal any change; however, the ICM study indicated major superficial changes, (
Figure 12 and
Table 1). The focus zone shows multiple peaks with a size of between 50 to 85 µm, wires greater than 100 µm and valleys over 130 µm (
Figure 12a, 25 cycles). In the intermediate zone there are some valleys of up to 300 μm with a depth of <5.5 μm (
Figure 12b, 25 cycles); and in the zone far from the focus, there are only a few peaks and valleys (
Figure 12c, 25 cycles). It is important to note the presence of a cyan-green cover over the whole surface as was previously observed in the SiOC
d sample after 75 cycles (
Figure 8b, 75 cycles), due to the formation of a SiO
2 layer. R
a values increase particularly in the focus zone (
Table 1). The transformation of the surface of the SiOC–SiC
d material must be related to the oxidation of C
free (3), SiOC (6); and also SiC according to reaction (7) [
34,
35].
The massive degradation (i.e., two-piece fracture) of a SiC sample was observed earlier during the first cycle in a thermal ageing test performed on bulk SiC materials [
18]. In this case, the fracture of the sample was explained in terms of the significant differences between the CTE of the SiC (6.6 × 10
–6 °C) [
10] compared to the protective SiO
2 layer formed over the material (0.4 × 10
–6 °C) [
19] and the very severe conditions of the thermal shock test.
The focus and intermediate zones become more heterogeneous as the number of thermal shock cycles increases, showing the presence of more and larger peaks, valleys and wires (
Figure 12a,b, 50–100 cycles). The focus zone has the highest roughness values after 75 thermal shock cycles (
Table 1), and the size of the peaks and valleys is larger than in the case of 25 cycles
Figure 12a, 75 cycles). This is probably due to the explosion of pristine grains and the melting and recrystallization processes. However, roughness values start to decrease from 75 to 100 cycles, probably indicating that the surface is smoothed by the formation of a denser and more homogeneous SiO
2 layer all over the surface as was previously detected (
Table 1) [
18]. The size of peaks and valleys decreases to values of <250 μm (
Figure 12, 100 cycles). The SiOC–SiC
d sample again broke while being positioned for the final cycles (from 75 to 100 cycles), but as this fracture did not occur in service, it was decided to carry out the last 25 cycles without taking it into consideration.
SEM images of the SiOC–SiC
d sample after 75 and 100 cycles of thermal shock ageing are shown in
Figure 13. The surface near the focus zone is deeply modified (
Figure 13a) with the presence of large valleys, peaks and wires (
Figure 13b,c) formed as consequence of the breakdown of C
free, SiOC and SiC (reactions 3, 6 and 7 respectively). These images agree with those obtained by ICM (
Figure 12). The whole surface of the SiOC–SiC
d material is homogeneously covered by a layer (
Figure 13d), which, under higher magnification, reveals the presence of cracks and fern-type and geometrical crystallites, probably associated with different kinds of crystalline species of SiO
2 and SiC, respectively. It is important to note that this layer becomes thicker and is homogeneously distributed all over the surface from 75 to 100 cycles (
Figure 13e,f, respectively), supporting the assumption that the smoothing observed with ICM studies during these cycles could be directly related to the evolution of the SiO
2 layer (i.e., denser and homogeneously distributed).
The ATR spectrum of the initial SiOC–SiC
d sample shows the bands related to Si–O, SiOC mixed network and Si–C bonds (880 cm
−1) [
30]. After 100 cycles of the thermal shock ageing test, in the focus zone, the spectra display the bands related to cristobalite (1202, 1095, 1035, 619 cm
−1), amorphous silica (1200 and 1100 cm
−1) [
38], and a sharp peak at 780 cm
−1 related to crystalline β-SiC [
44] (
Figure 14a). The Raman spectrum of the initial SiOC–SiC
d material shows D, G and second order bands [
30] in the C
free phase with a similar degree of ordering to SiOC
d. The L
a value is 2.7 nm. After 100 cycles of the thermal ageing test, in the focus zone, C
free bands appear with the cristobalite bands (229, 416, 700 and 1076 cm
−1) [
38,
43], SiC (780 cm
−1) [
44] and small amounts of other SiO
2 compounds are detected such as amorphous silica (441, 478 and 610 cm
−1) [
38] and tridymite (316 cm
−1) [
41] (
Figure 14b). In summary, based on the experimental results, there is clear evidence of the formation of a denser and homogeneously distributed layer of SiO
2 composed of cristobalite and amorphous silica, which coexists with the presence of crystallites of β-SiC and other silica species (i.e., tridymite).
In the case of dense materials, SiOC–SiCd displays a greater modification of its surface when is compared with SiOCd material although it was expected to experience better results due to the presence of SiC as reinforcement. This modification occurs faster in SiOC–SiCd by the presence of larger La domains of Cfree (La SiOCd = 1.7 nm and La SiOC–SiCd = 2.7 nm), which facilitate the evolution of gaseous species formed during the degradations of Cfree (reaction 3) but also by the presence of domains of SiC which also produces both gaseous species and a layer of SiO2 (reaction 7).
After 100 cycles of accelerated ageing at 1000 °C, the visual inspection of the SiOC–SiC
d sample reveals the presence of a cover all over the surface (
Figure 11b), which is caused by the formation of a protective silica layer [
18,
23]. The weight of the SiOC–SiC
d sample does not change, although its porosity varies from 4 to 0%. These data indicate that the evolution of gaseous species (i.e., O
2 inwards and CO and CO
2 outwards) must be very slow, as occurred in the SiOC
d sample, and the subsequent material densification could only be associated to the high temperature value used during the thermal shock ageing test. Accordingly, the very significant differences between the CTE of SiC (6.6 × 10
‒6 °C) [
10] with respect to the SiO
2 layer formed over the material (0.4 × 10
‒6 °C) [
19] and the changes in the porosity of the material due to the very severe conditions of the thermal shock tests, contributes to the surface modification of the material. In any case, the SiOC–SiC
d material does not undergo massive degradation but rather a severe modification of its surface.
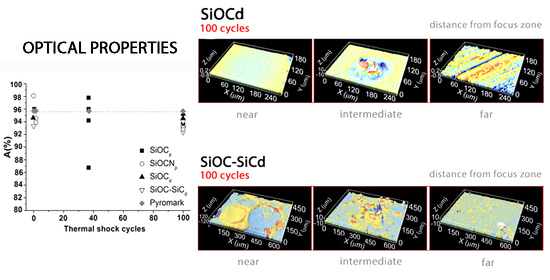
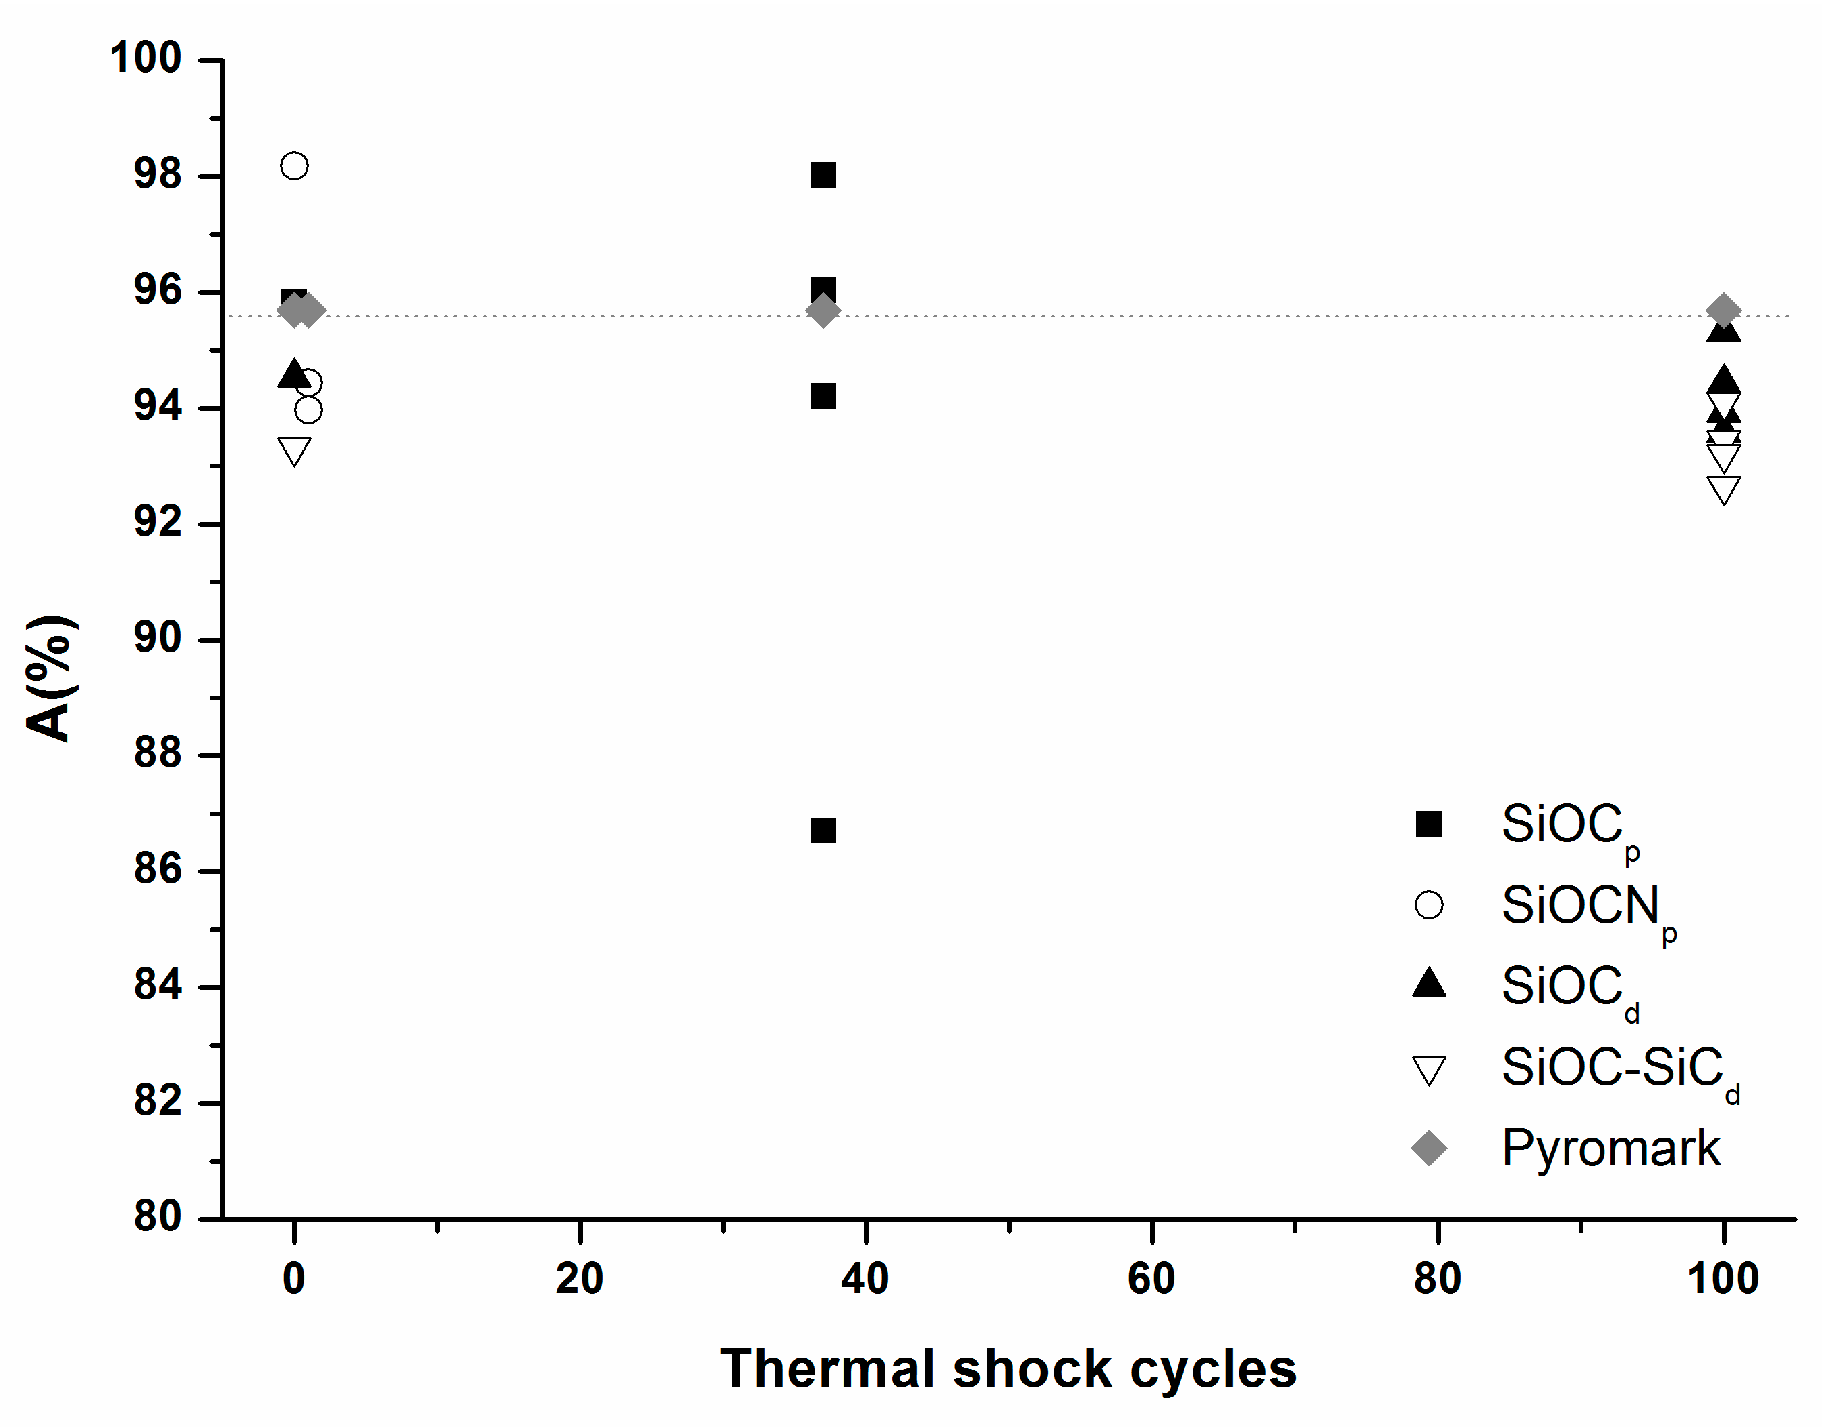
The evolution of absorptance before and after the thermal shock tests was measured for all the samples, and was compared with Pyromark
® commercial paint. All the values are shown in
Figure 15. It is well known that a material’s absorptance should be as high as possible for its application as a solar receiver. Considering only the initial sample A values, the highest value corresponds to the SiOCN
p sample (A = 98.2%) which also has a higher value than Pyromark
® paint (A = 95.7%). The other samples have slightly lower values, especially SiOC–SiC
d (A= 93.3%), but they closely match the values required for solar receivers (SiOC
p, A = 95.8% and SiOC
d, A = 94.5%). The samples were modified in different ways after the thermal shock tests, and the A values are very different depending on both the composition and porosity of samples. Porous samples were massively degraded, and they showed major variations in A values; so after one cycle for the SiOCN
p sample, the A value is 90.8, 94.0, 94.4 and 94.9%, and after 37 cycles for SiOC
p it is A = 86.7, 94.2, 96.0 and 98.0%. In the case of dense materials, and due to the formation of a protective silica layer which prevents the massive degradation of the material, the A values remain constant (SiOC–SiC
d, A average (n = 4) of 93.3%) or decrease very slightly compared to the initial values (SiOC
d, A average (n = 4) of 94.3%).
In view of all the results, the SiOCd material is the most adequate to be used in the manufacture of solar receivers, due to: (a) its reasonable resistance to very harsh ageing tests at 1000 °C; (b) its surface durability, thanks to the formation of a protective silica layer (i.e., cristobalite and amorphous silica); and (c) its optical properties which remain quite constant (the absorptance value varied from 94.5 to 94.3%).

 ,
, 


