
Permanent Deformation and Rutting Resistance of Demolition Waste Triple Blends in Unbound Pavement Applications


Abstract
:1. Introduction
2. Materials and Methods
3. Results and Discussion
4. Conclusions
Author Contributions
Funding
Institutional Review Board Statement
Informed Consent Statement
Data Availability Statement
Acknowledgments
Conflicts of Interest
References
- Ardalan, N.; Wilson, D.J.; Larkin, T.J. Analyzing the Application of Different Sources of Recycled Concrete Aggregate for Road Construction. Transp. Res. Rec. J. Transp. Res. Board 2020, 2674, 300–308. [Google Scholar] [CrossRef]
- Maghoolpilehrood, F.; Disfani, M.M.; Arulrajah, A. Geotechnical Characteristics of Aged Biosolids Stabilized with Cement and Lime. Aust. Geomech. J. 2013, 48, 113–120. [Google Scholar]
- Senate, T. Environment and Communications References Committee: Never Waste a Crisis: The Waste and Recycling Industry in Australia; Parliament House Canberra ACT: Canberra, Australia, 2018. [Google Scholar]
- Arulrajah, A.; Arulrajah, A.; Mohammadinia, A.; Mirzababaei, M.; Horpibulsuk, S. Wheel tracker testing of recycled concrete and tyre aggregates in Australia. Geotech. Res. 2020, 7, 49–57. [Google Scholar] [CrossRef] [Green Version]
- Brown, S.F.; Chan, F.W.K. Reduced rutting in unbound granular pavement layers through improved grading design. In Institution of Civil Engineers—Transport; Thomas Telford Ltd.: London, UK, 1996; Volume 117, pp. 40–49. [Google Scholar]
- Disfani, M.M.; Arulrajah, A.; Ali, M.M.Y.; Bo, M.W. Fine recycled glass: A sustainable alternative to natural aggregates. Int. J. Geotech. Eng. 2011, 5, 255–266. [Google Scholar] [CrossRef]
- Ali, M.M.Y.; Arulrajah, A.; Disfani, M.M.; Piratheepan, J. Suitability of Using Recycled Glass-Crushed Rock Blends for Pavement Subbase Applications. Geo-Frontiers 2011, 2011, 1325–1334. [Google Scholar]
- Debieb, F.; Kenai, S. The use of coarse and fine crushed bricks as aggregate in concrete. Constr. Build. Mater. 2008, 22, 886–893. [Google Scholar] [CrossRef]
- Suddeepong, A.; Sari, N.; Horpibulsuk, S.; Chinkulkijniwat, C.; Arulrajah, A. Interface shear behaviors between recycled concrete aggregate and geogrid for pavement applications. Int. J. Pavement Eng. 2018, 21, 228–235. [Google Scholar] [CrossRef]
- Demir, I.; Orhan, M. Reuse of waste bricks in the production line. Build. Environ. 2003, 38, 1451–1455. [Google Scholar] [CrossRef]
- Aatheesan, T.; Arulrajah, A.; Bo, M.W.; Vuong, B.; Wilson, J.L. Crushed brick blends with crushed rock for pavement systems. In Institution of Civil Engineers—Waste and Resource Management; Thomas Telford Ltd.: London, UK, 2010; Volume 163, pp. 29–35. [Google Scholar]
- Sivakugan, N.; Arulrajah, A.; Bo, M.W. Laboratory Testing of Soils, Rocks and Aggregates, 1st ed.; J. Ross Publishing: Fort Lauderdale, FL, USA, 2011. [Google Scholar]
- Arulrajah, A.; Ali, M.M.Y.; Piratheepan, J.; Bo, M.W. Geotechnical Properties of Waste Excavation Rock in Pavement Subbase Applications. J. Mater. Civ. Eng. 2012, 24, 924–932. [Google Scholar] [CrossRef]
- Sobhan, K. Innovative fracture-resistant construction material from C&D waste aggregate, fly ash and recycled plastics. Int. J. Environ. Pollut. 2007, 31, 304. [Google Scholar] [CrossRef]
- Consoli, N.C.; Montardo, J.P.; Prietto, P.D.M.; Pasa, G.S. Engineering Behavior of a Sand Reinforced with Plastic Waste. J. Geotech. Geoenvironmental Eng. 2002, 128, 462–472. [Google Scholar] [CrossRef]
- Hoy, M.; Rachan, R.; Horpibulsuk, S.; Arulrajah, A.; Mirzababaei, M. Effect of wetting–drying cycles on compressive strength and microstructure of recycled asphalt pavement—Fly ash geopolymer. Constr. Build. Mater. 2017, 144, 624–634. [Google Scholar] [CrossRef]
- Puppala, A.J.; Hoyos, L.R.; Potturi, A.K. Resilient Moduli Response of Moderately Cement-Treated Reclaimed Asphalt Pavement Aggregates. J. Mater. Civ. Eng. 2011, 23, 990–998. [Google Scholar] [CrossRef]
- Suthagaran, V.; Arulrajah, A.; Bo, M.W. Geotechnical laboratory testing of biosolids. Int. J. Geotech. Eng. 2010, 4, 407–415. [Google Scholar] [CrossRef]
- Arulrajah, A.; Maghoolpilehrood, F.; Disfani, M.M.; Horpibulsuk, S. Spent coffee grounds as a non-structural embankment fill material: Engineering and environmental considerations. J. Clean. Prod. 2014, 72, 181–186. [Google Scholar] [CrossRef]
- Saberian, M.; Li, J.; Setunge, S. Evaluation of permanent deformation of a new pavement base and subbase containing unbound granular materials, crumb rubber and crushed glass. J. Clean. Prod. 2019, 230, 38–45. [Google Scholar] [CrossRef]
- Arulrajah, A.; Mohammadinia, A.; Maghool, F.; Horpibulsuk, S. Tire derived aggregates as a supplementary material with recycled demolition concrete for pavement applications. J. Clean. Prod. 2019, 230, 129–136. [Google Scholar] [CrossRef]
- Arulrajah, A.; Horpibulsuk, S.; Maghoolpilehrood, F.; Samingthong, W.; Du, Y.-J.; Shen, S.-L. Evaluation of Interface Shear Strength Properties of Geogrid Reinforced Foamed Recycled Glass Using a Large-Scale Direct Shear Testing Apparatus. Adv. Mater. Sci. Eng. 2015, 2015, 1–8. [Google Scholar] [CrossRef] [Green Version]
- Maghool, F.; Arulrajah, A.; Horpibulsuk, S.; Du, Y.-J. Laboratory Evaluation of Ladle Furnace Slag in Unbound Pavement-Base/Subbase Applications. J. Mater. Civ. Eng. 2017, 29, 04016197. [Google Scholar] [CrossRef]
- Maghool, F.; Arulrajah, A.; Horpibulsuk, S.; Mohajerani, A. Engineering and Leachate Characteristics of Granulated Blast-Furnace Slag as a Construction Material. J. Mater. Civ. Eng. 2020, 32, 04020153. [Google Scholar] [CrossRef]
- Maghool, F.; Arulrajah, A.; Du, Y.; Horpibulsuk, S.; Chinkulkijniwat, A. Environmental impacts of utilizing waste steel slag aggregatesas recycled road construction materials. Clean Technol. Environ. Policy 2016, 19, 949–958. [Google Scholar] [CrossRef]
- Amlashi, S.M.H.; Vaillancourt, M.; Carter, A.; Bilodeau, J.-P. Resilient modulus of pavement unbound granular materials containing recycled glass aggregate. Mater. Struct. 2018, 51, 89. [Google Scholar] [CrossRef]
- Arulrajah, A.; Piratheepan, J.; Aatheesan, T.; Bo, M.W. Geotechnical Properties of Recycled Crushed Brick in Pavement Applications. J. Mater. Civ. Eng. 2011, 23, 1444–1452. [Google Scholar] [CrossRef]
- Disfani, M.M.; Arulrajah, A.; Haghighi, H.; Mohammadinia, A.; Horpibulsuk, S. Flexural beam fatigue strength evaluation of crushed brick as a supplementary material in cement stabilized recycled concrete aggregates. Constr. Build. Mater. 2014, 68, 667–676. [Google Scholar] [CrossRef]
- Disfani, M.; Arulrajah, A.; Bo, M.W.; Sivakugan, N. Environmental risks of using recycled crushed glass in road applications. J. Clean. Prod. 2012, 20, 170–179. [Google Scholar] [CrossRef]
- Arulrajah, A.; Piratheepan, J.; Ali, M.M.Y.; Bo, M.W. Geotechnical Properties of Recycled Concrete Aggregate in Pavement Sub-Base Applications. Geotech. Test. J. 2012, 35, 103402. [Google Scholar] [CrossRef]
- AS. Method for Sampling and Testing Aggregates—Particle Size Distribution by Sieving; Australian Standard: Sydney, Australia, 1996; Australian Standard 1141.11. [Google Scholar]
- AS. Particle Density and Water Absorption of Fine Aggregate; Australian Standard: Sydney, Australia, 2000; Australian Standard 1141.5. [Google Scholar]
- AS. Particle Density and Water Absorption of Coarse Aggregate—Weighing-in-Water Method; Australian Standard: Sydney, Australia, 2000; Australian Standard 1141.6.1. [Google Scholar]
- ASTM. Standard Test Methods for Moisture, Ash, and Organic Matter of Peat and Other Organic Soils; ASTM International: West Conshohocken, PA, USA, 2007; ASTM Standard D2974. [Google Scholar]
- AS. Methods for Sampling and Testing Aggregates-Method 15: Flakiness Index; Australian Standard: Sydney, Australia, 1999; Australian standard AS 1141.15. [Google Scholar]
- ASTM. Standard Test Method for Resistance to Degradation of Small-Size Coarse Aggregate by Abrasion and Impact in the Los Angeles Machine; ASTM International: West Conshohocken, PA, USA, 2006; ASTM Standard C131. [Google Scholar]
- AS. Soil Compaction and Density Tests—Determination of the Dry Density/Moisture Content Relation of a Soil Using Modified Compactive Effort; Australian Standard: Sydney, Australia, 2003; Australian Standard 1289.5.2.1. [Google Scholar]
- AS. Determination of the California Bearing Ratio of a Soil—Standard Laboratory Method for a Remoulded Specimen; Australian Standard: Sydney, Australia, 1998; Australian Standard 1289.6.1.1. [Google Scholar]
- Austroads. Commentary to AG:PT/T053, Determination of Permanent Deformation and Resilient Modulus Characteristics of Unbound Granular Materials Under Drained Conditions; Austroads: Sydney, Australia, 2007; p. 29. [Google Scholar]
- Saberian, M.; Li, J.; Boroujeni, M.; Law, D.W.; Li, C. Application of demolition wastes mixed with crushed glass and crumb rubber in pavement base/subbase. Resour. Conserv. Recycl. 2020, 156, 104722. [Google Scholar] [CrossRef]
- Bodin, D.; Grenfell, J.R.; Collop, A.C. Comparison of Small and Large Scale Wheel Tracking Devices. Road Materials and Pavement Design. ICAM 2009, 10, 295–325. [Google Scholar] [CrossRef]
- Austroads. AGTP-T054: Determination of Permanent Deformation Characteristics of Unbound Granular Materials by the Wheel-Tracking Test; Austroads: Sydney, Australia, 2015. [Google Scholar]
- VicRoads. Guide to General Requirements for Unbound Pavement Materials; VicRoads: Melbourne, Australia, 1998; Volume 39. [Google Scholar]
- Terzaghi, K.; Peck, R.; Mesri, G. Soil Mechanics in Engineering Practice; John Wiley & Sons: New York, NY, USA, 1996. [Google Scholar]
- Arulrajah, A.; Maghool, F.; Newman, G.; Haghighi, H.; Horpibulsuk, S. Cement-treated recycled glass and crushed rock blends: Modulus of rupture and stiffness properties. Int. J. Pavement Eng. 2020, 10, 1–11. [Google Scholar] [CrossRef]


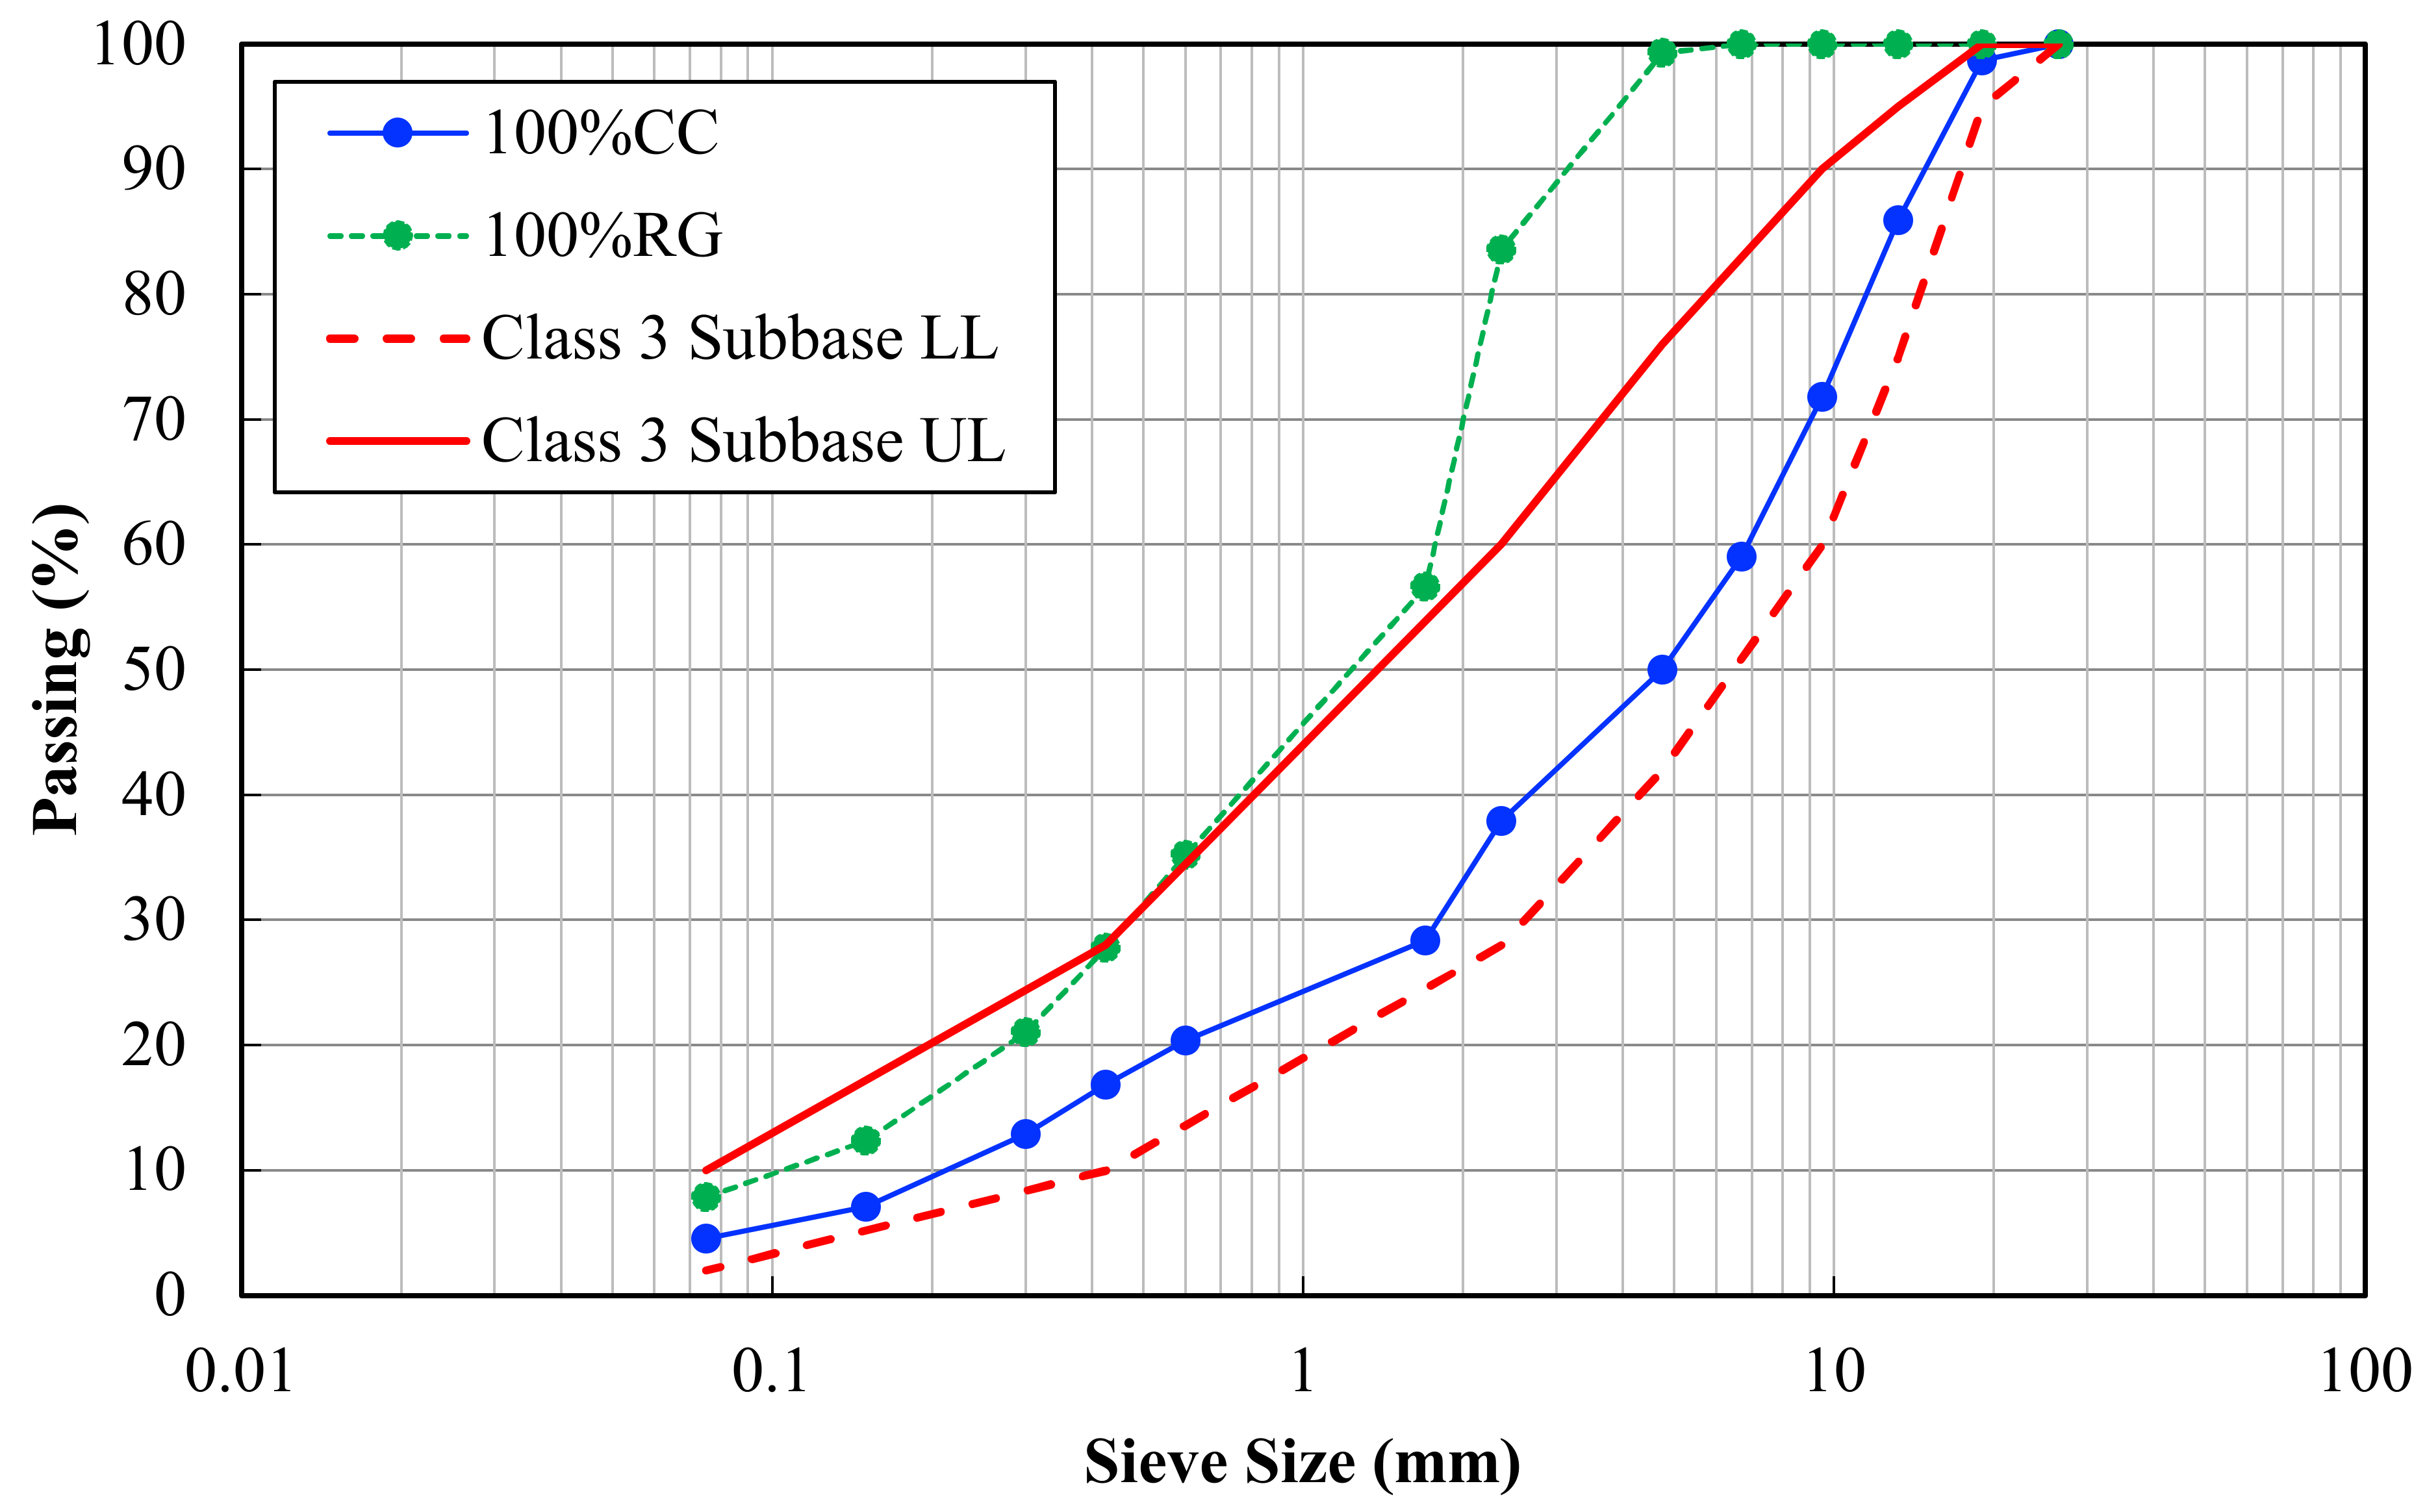
| Engineering Properties | 100% CC | 100% RG | Typical Quarry a Materials | |
|---|---|---|---|---|
| Fine content | (%) | 4.5 | 7.8 | <10 |
| Sand content | (%) | 45.5 | 92 | 30–60 |
| Gravel content | (%) | 50 | 0.2 | 30–60 |
| Apparent particle density | (kN/m3) | 2.64 | 2.48 | >2 |
| Water absorption | (%) | 9.8 | <1 | 6–12 |
| Organic content | (%) | <1 | 1.2 | <5 |
| Flakiness index | 19.14 | - | <35 | |
| LA abrasion loss | (%) | 28 | - | <40 |
| California Bearing Ratio (CBR) | (%) | 239 | 20 | >80 |
| Resilient modulus (MR) | (MPa) | 205–292 | - | 125–300 |
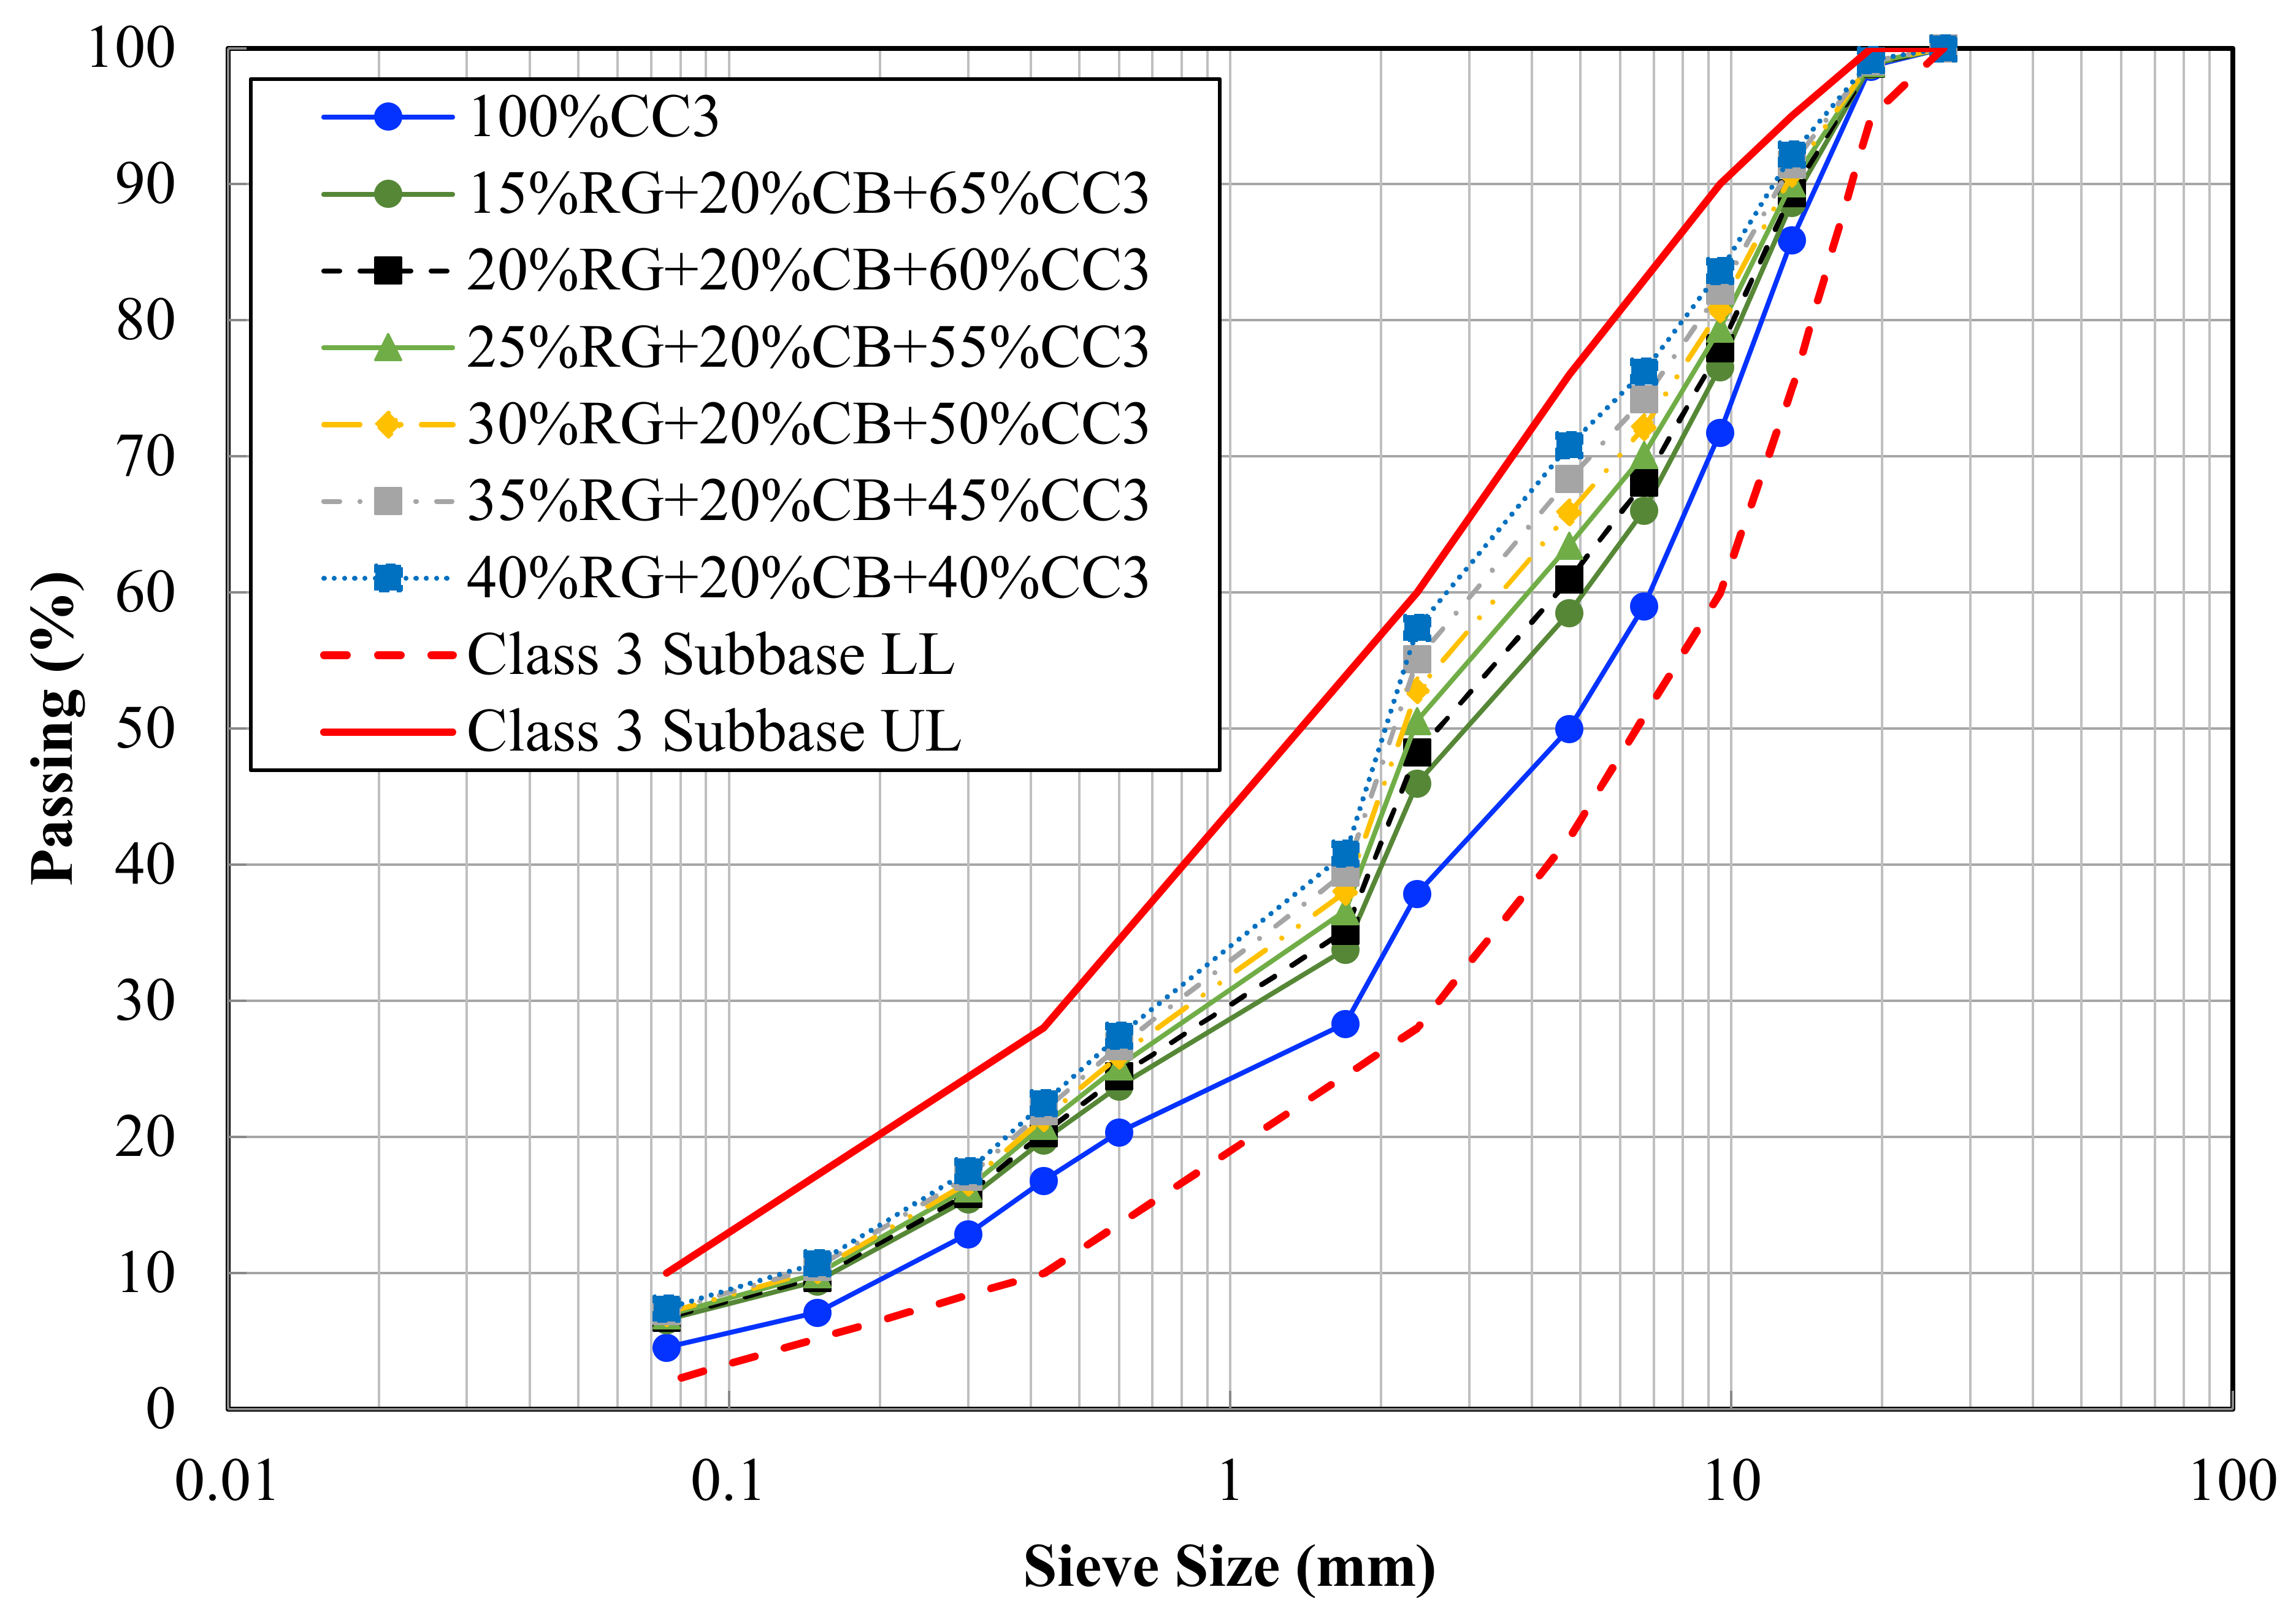
| Blends | pH | OMC (%) | MDD (kN/m3) | CBR (%) | Permeability (m/s) |
|---|---|---|---|---|---|
| 100% CC | 12.4 | 11.5 | 1.96 | 230–248 | 1.05 × 10⁻⁷ |
| 15% RG + 20% CB + 65% CC | 11.87 | 10.6 | 1.98 | 220–257 | 4.57 × 10⁻⁷ |
| 20% RG + 20% CB + 60% CC | 11.78 | 10.7 | 1.97 | 192–228 | 1.39 × 10⁻⁷ |
| 25% RG + 20% CB + 55% CC | 11.64 | 10.7 | 1.97 | 167–182 | 2.15 × 10⁻⁷ |
| 30% RG + 20% CB + 50% CC | 11.51 | 10.5 | 1.96 | 165–202 | 9.76 × 10⁻⁷ |
| 35% RG + 20% CB + 45% CC | 11.37 | 10.4 | 1.96 | 131–157 | 1.78 × 10⁻⁶ |
| 40% RG + 20% CB + 40% CC | 11.23 | 10.0 | 1.96 | 116–147 | 4.34 × 10⁻⁶ |
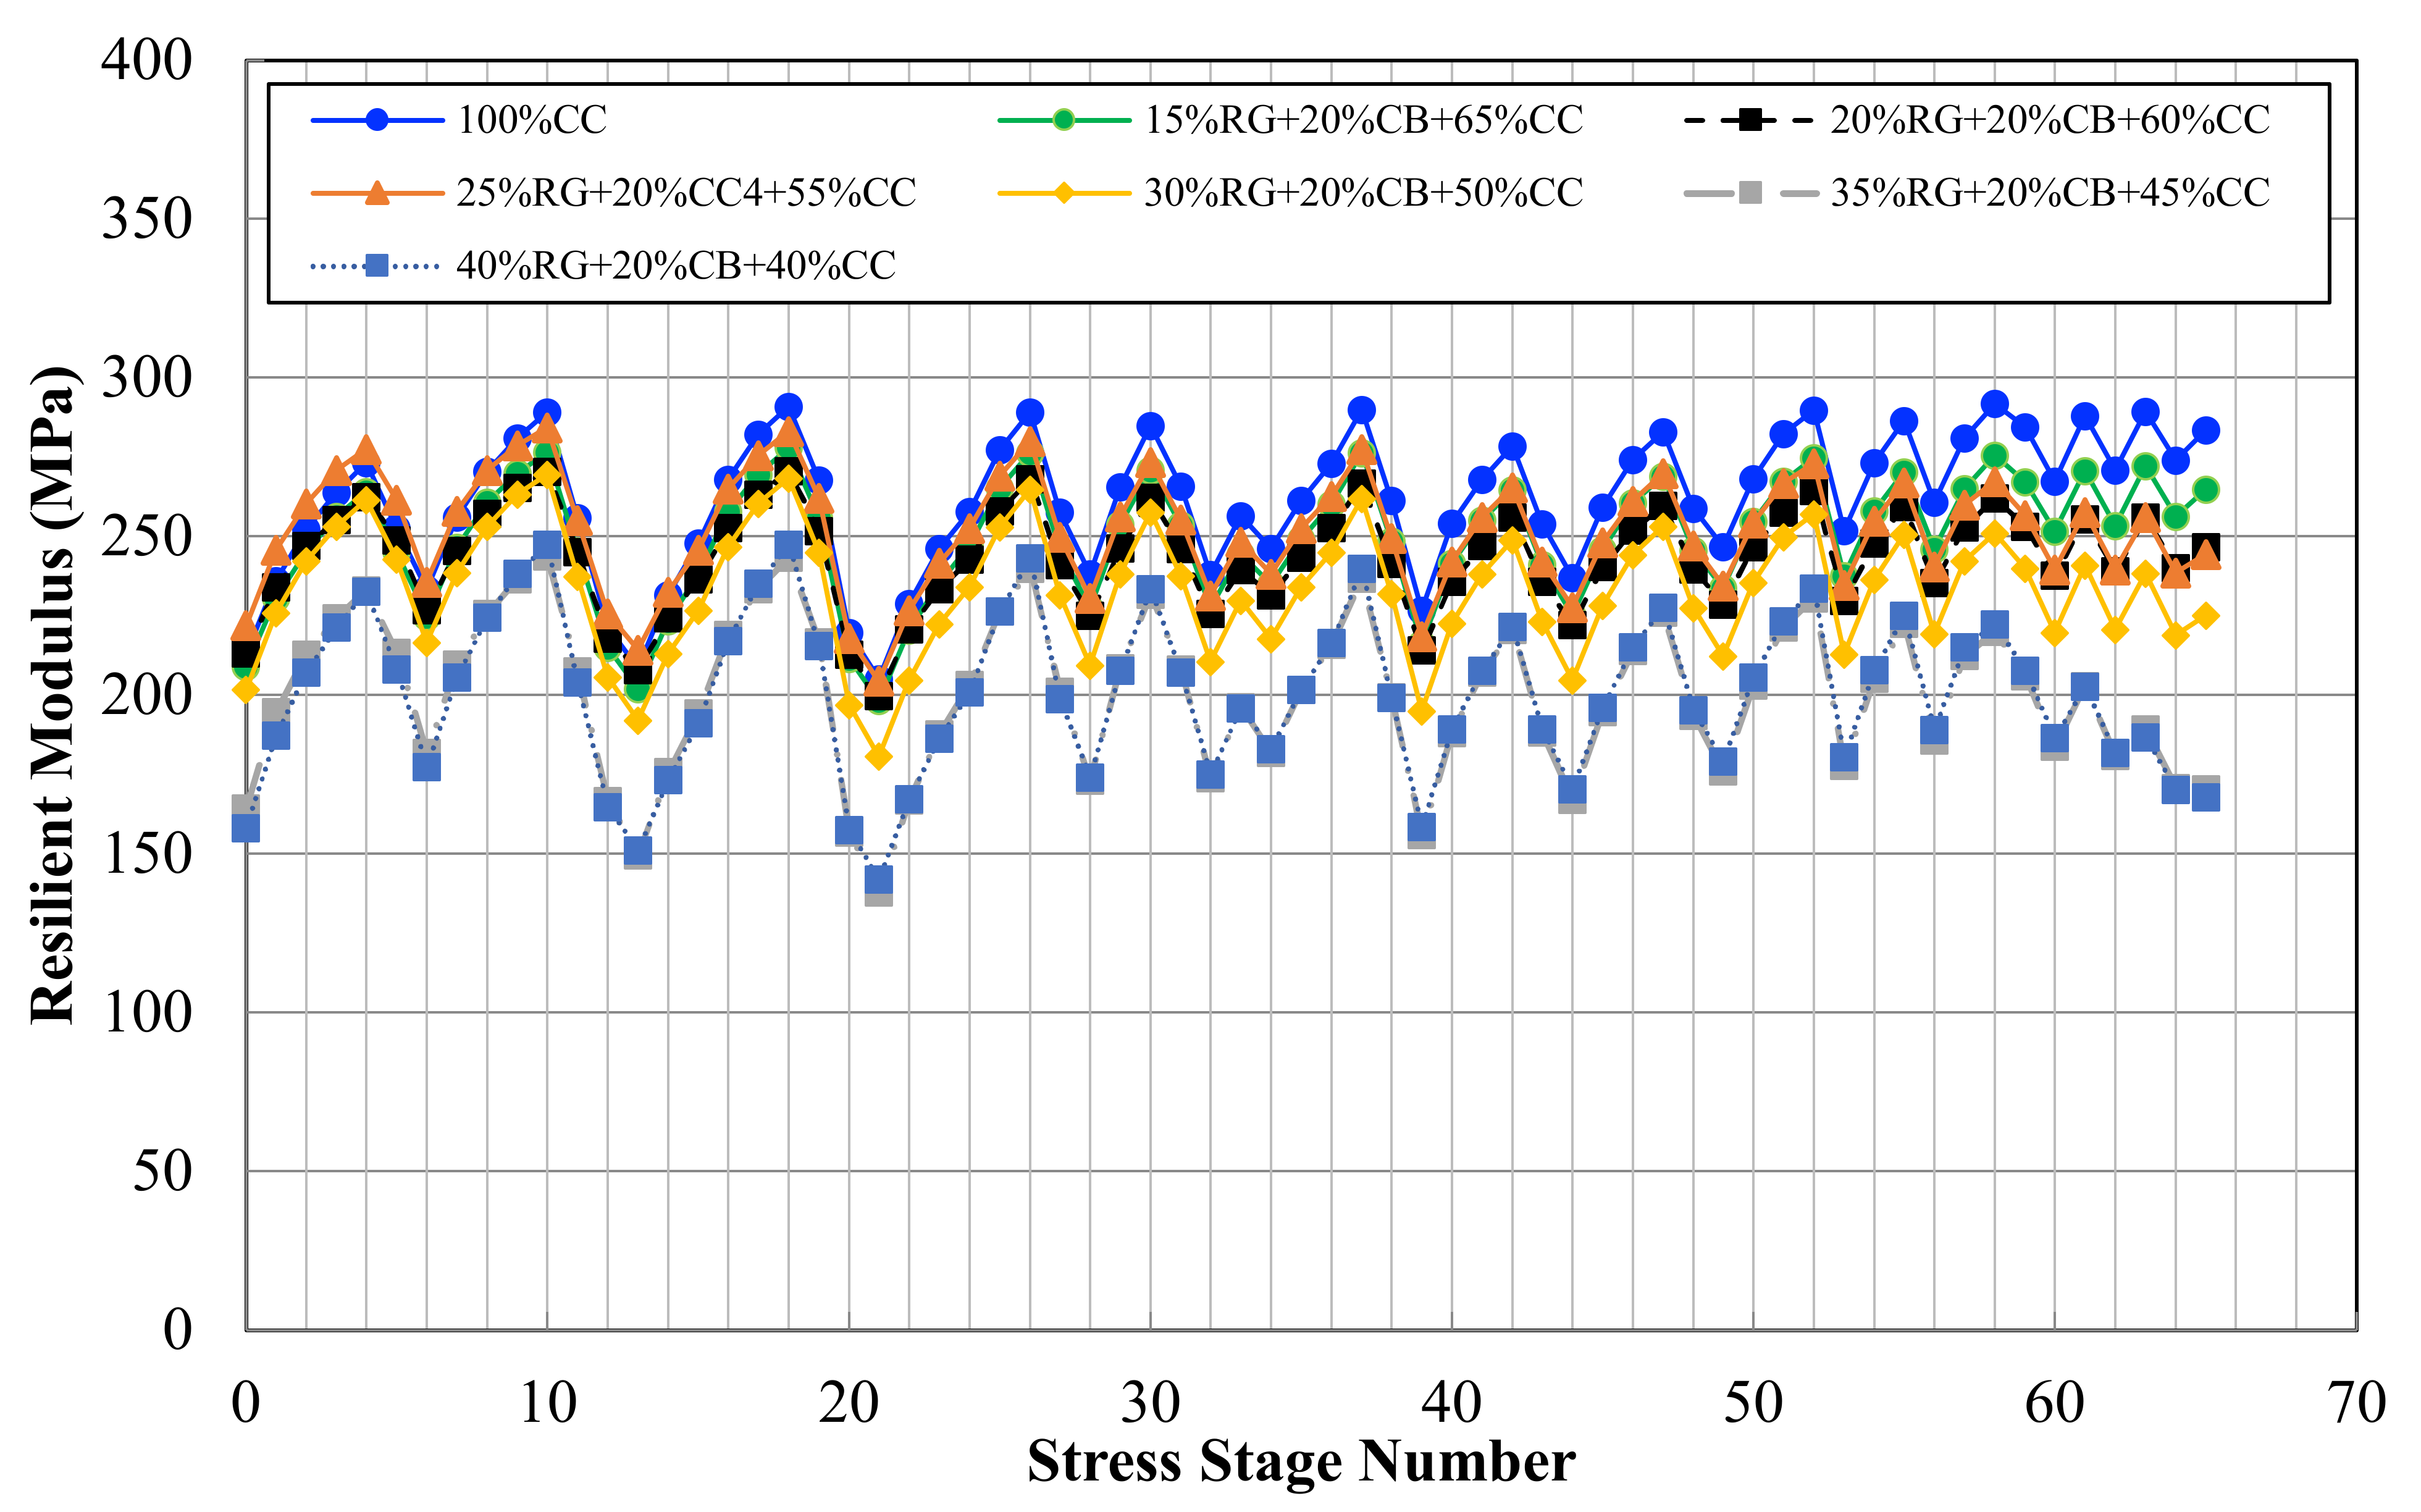
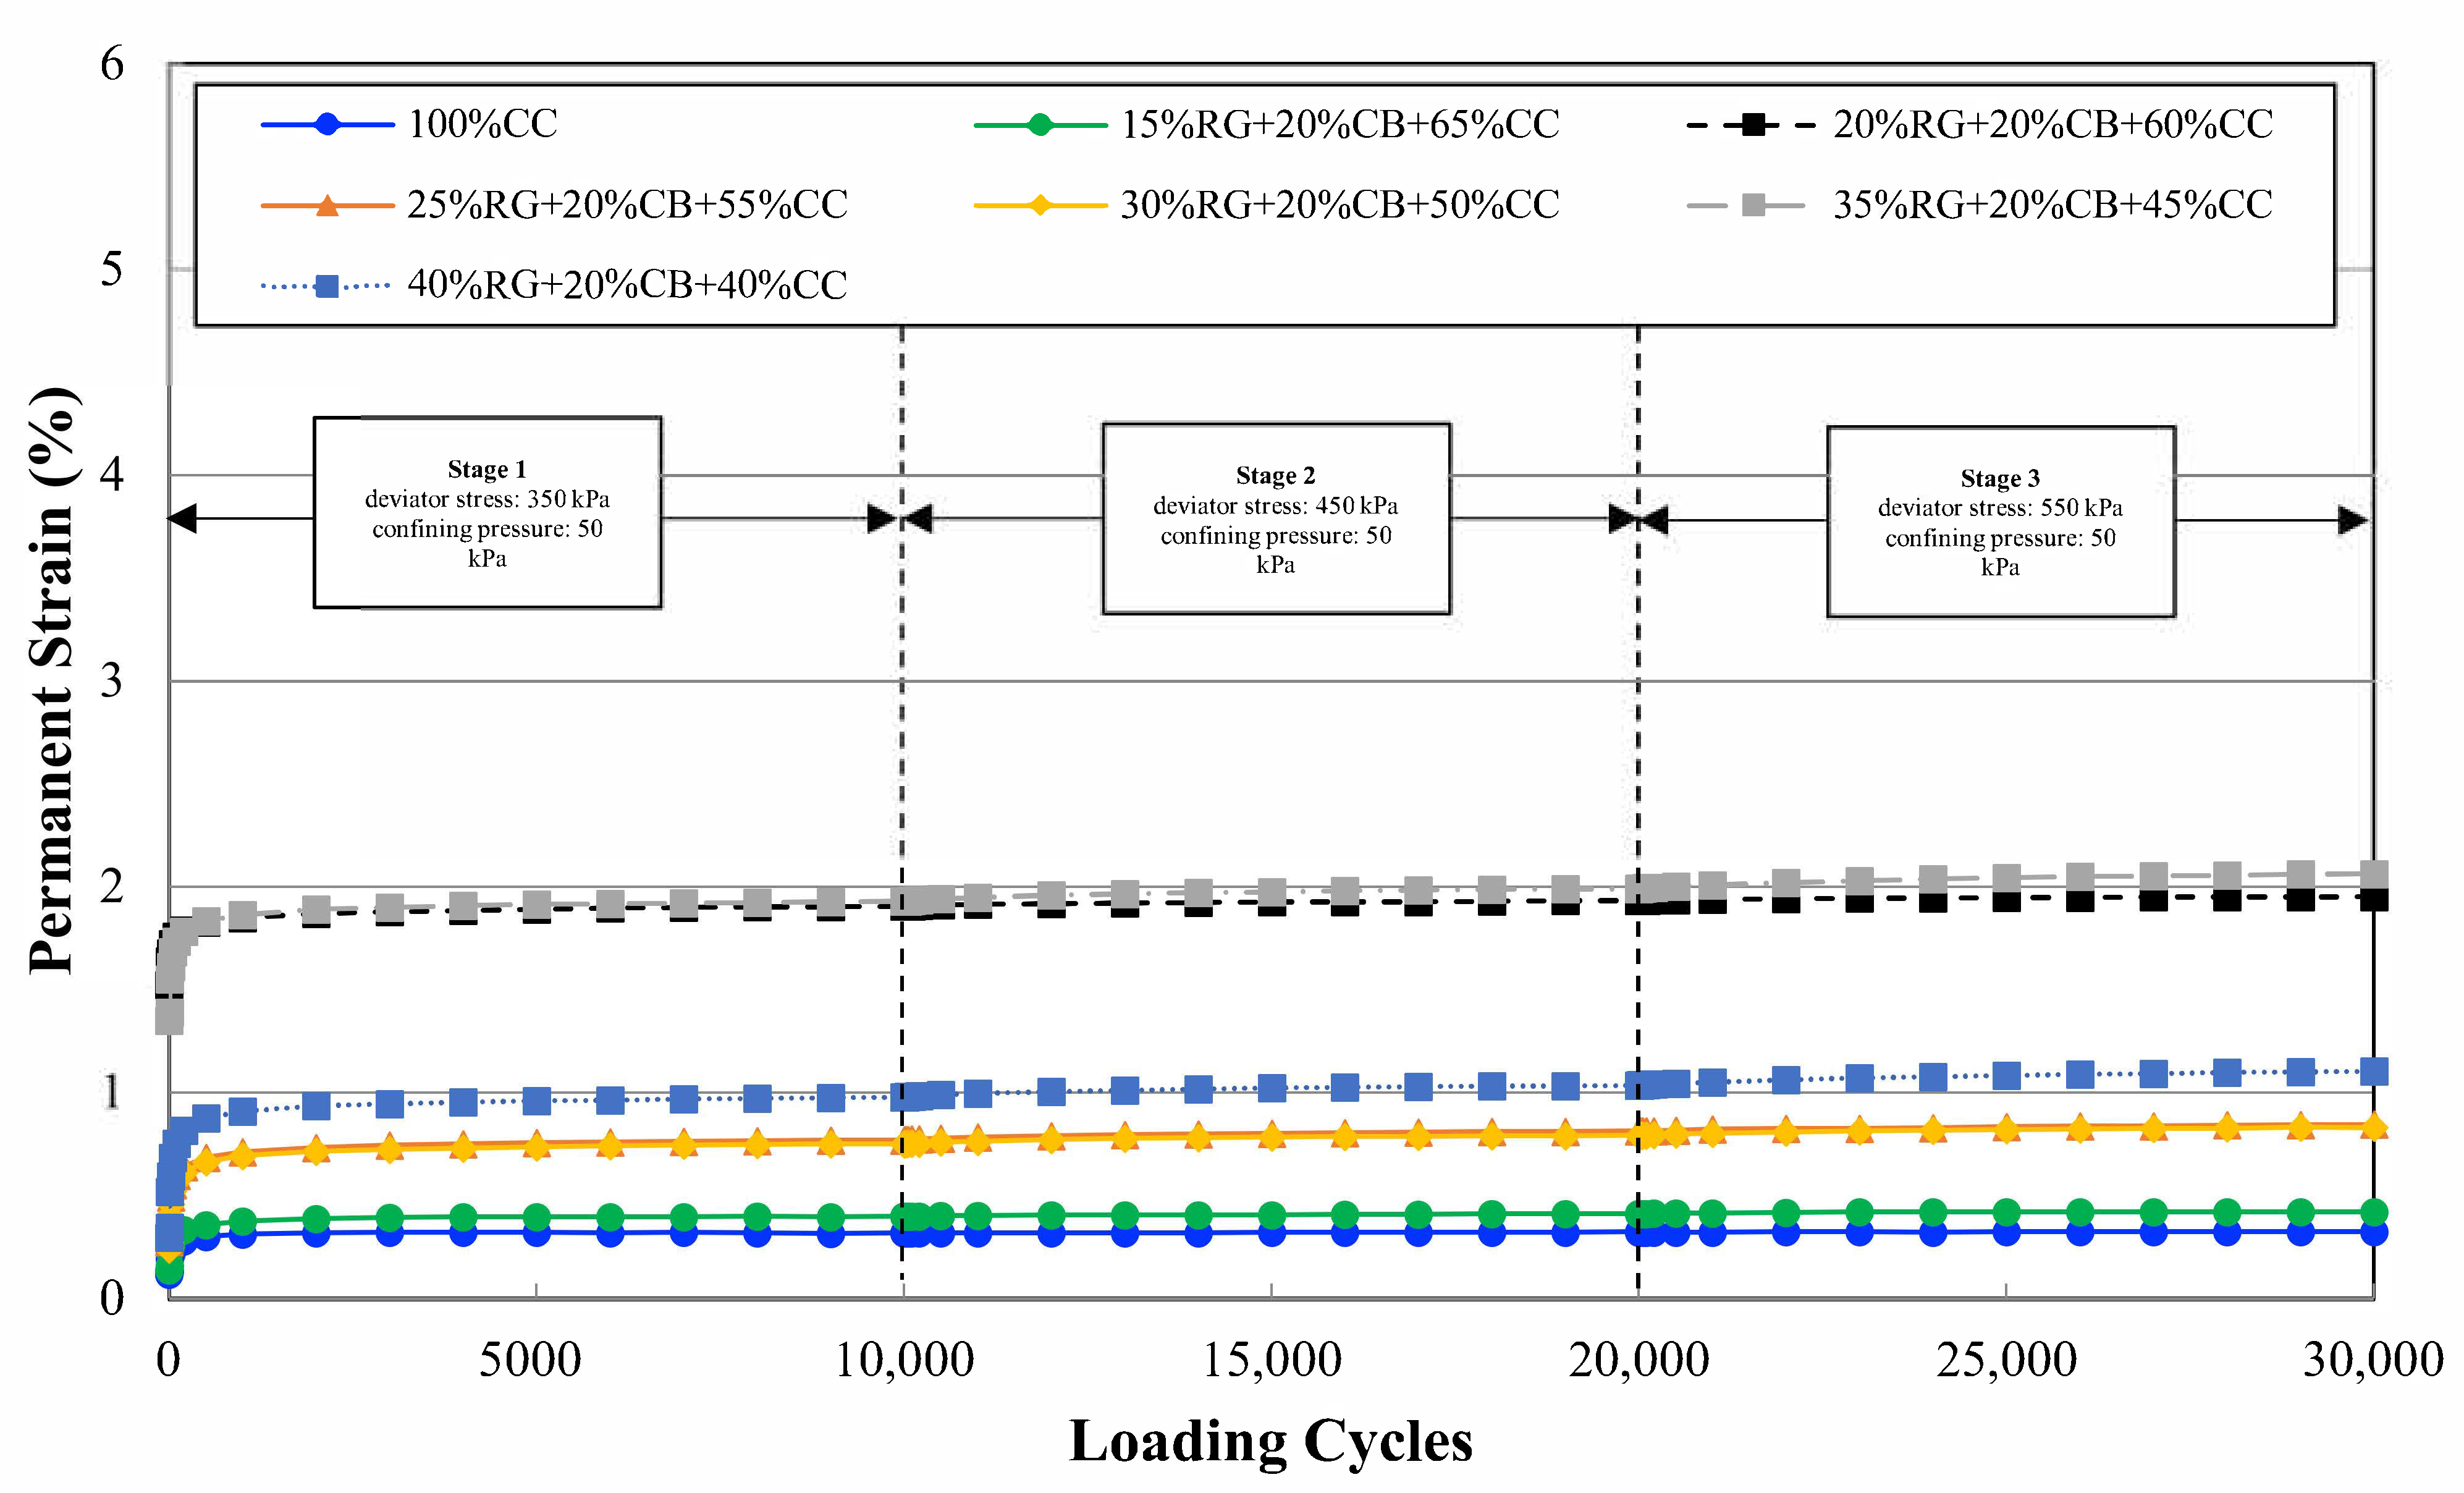
| Blends | MR (MPa) | Permanent Strain at the End of Each Stage, Microstrain | ||
|---|---|---|---|---|
| Stage 1 | Stage 2 | Stage 3 | ||
| 100% CC | 205–292 | 995 | 1282 | 1596 |
| 15% RG + 20% CB + 35% CC | 198–278 | 1082 | 1392 | 1703 |
| 20% RG + 20% CB + 40% CC | 200–271 | 1194 | 1492 | 1804 |
| 25% RG + 20% CB + 35% CC | 204–284 | 1154 | 1443 | 1755 |
| 30% RG + 20% CB + 30% CC | 181–270 | 1220 | 1534 | 1867 |
| 35% RG + 20% CB + 25 %CC | 138–244 | 1406 | 1746 | 2110 |
| 40% RG + 20% CB + 20% CC | 142–247 | 1383 | 1723 | 2086 |
| Number of Cycles (N) | Mean Surface Deformation | Mean overall | Maximum Rut Depth | Mean overall | ||||||||
|---|---|---|---|---|---|---|---|---|---|---|---|---|
| Cross Section | Cross Section | |||||||||||
| 1 | 2 | 3 | 4 | 5 | 1 | 2 | 3 | 4 | 5 | |||
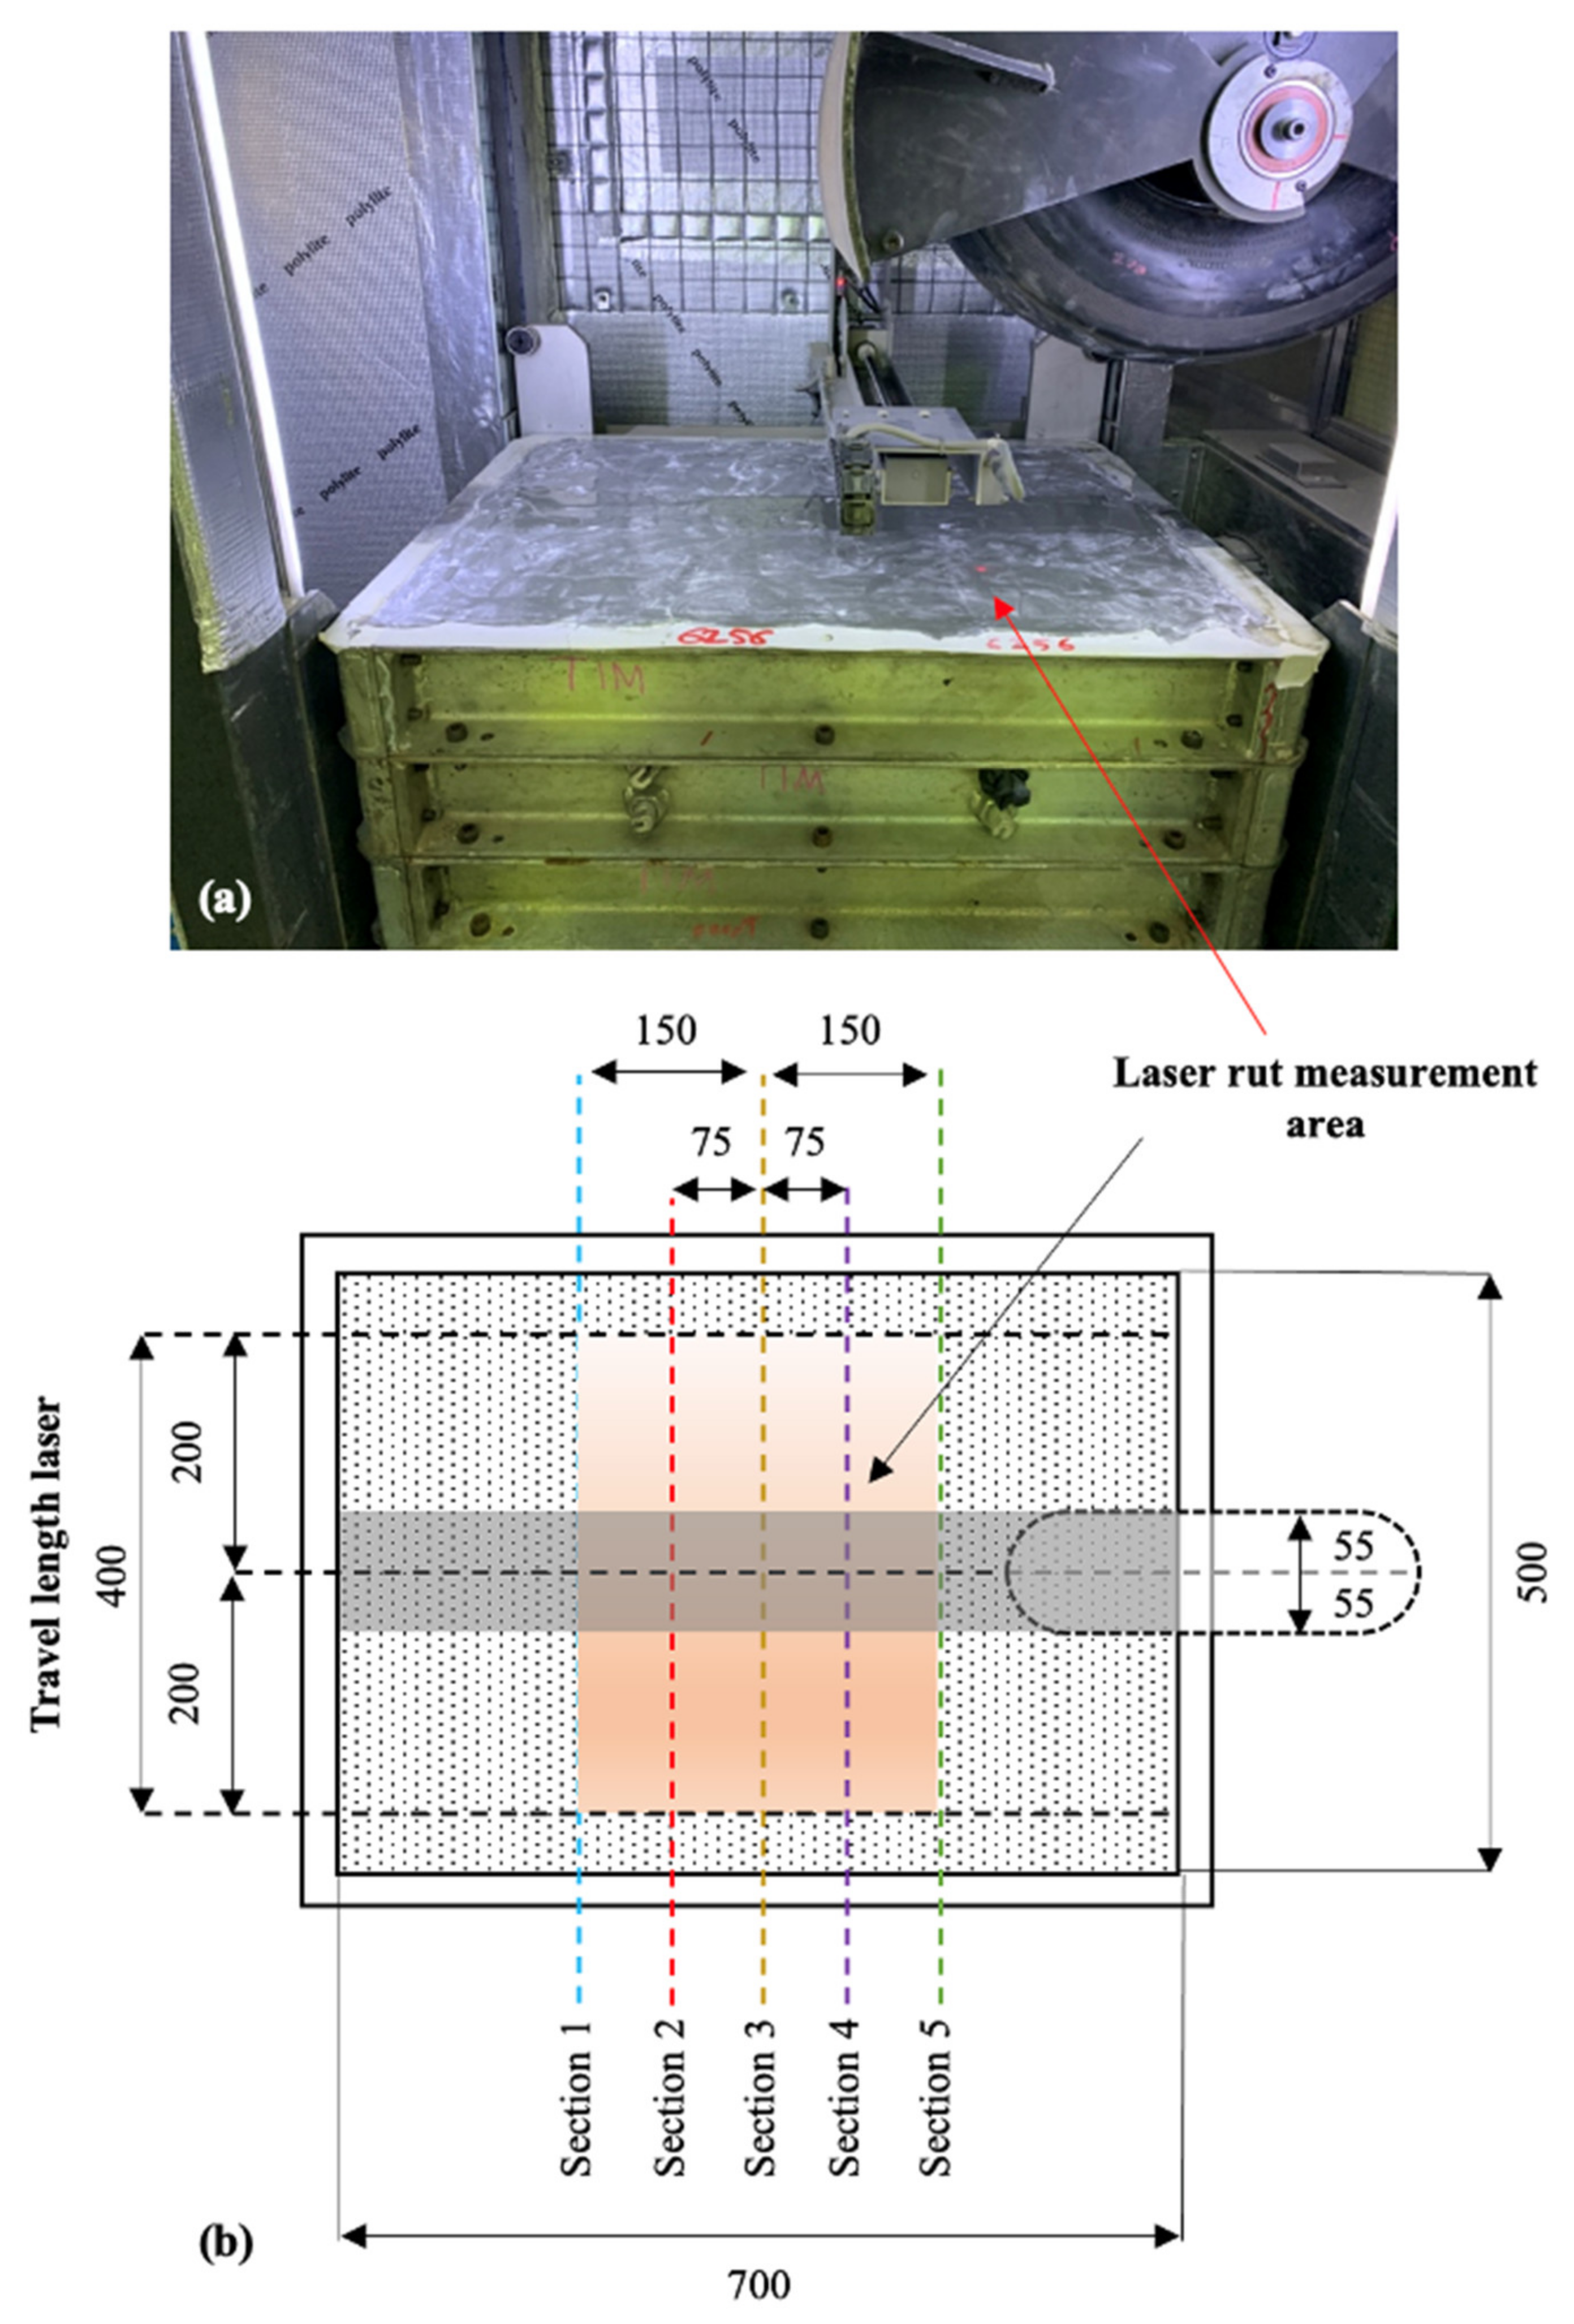
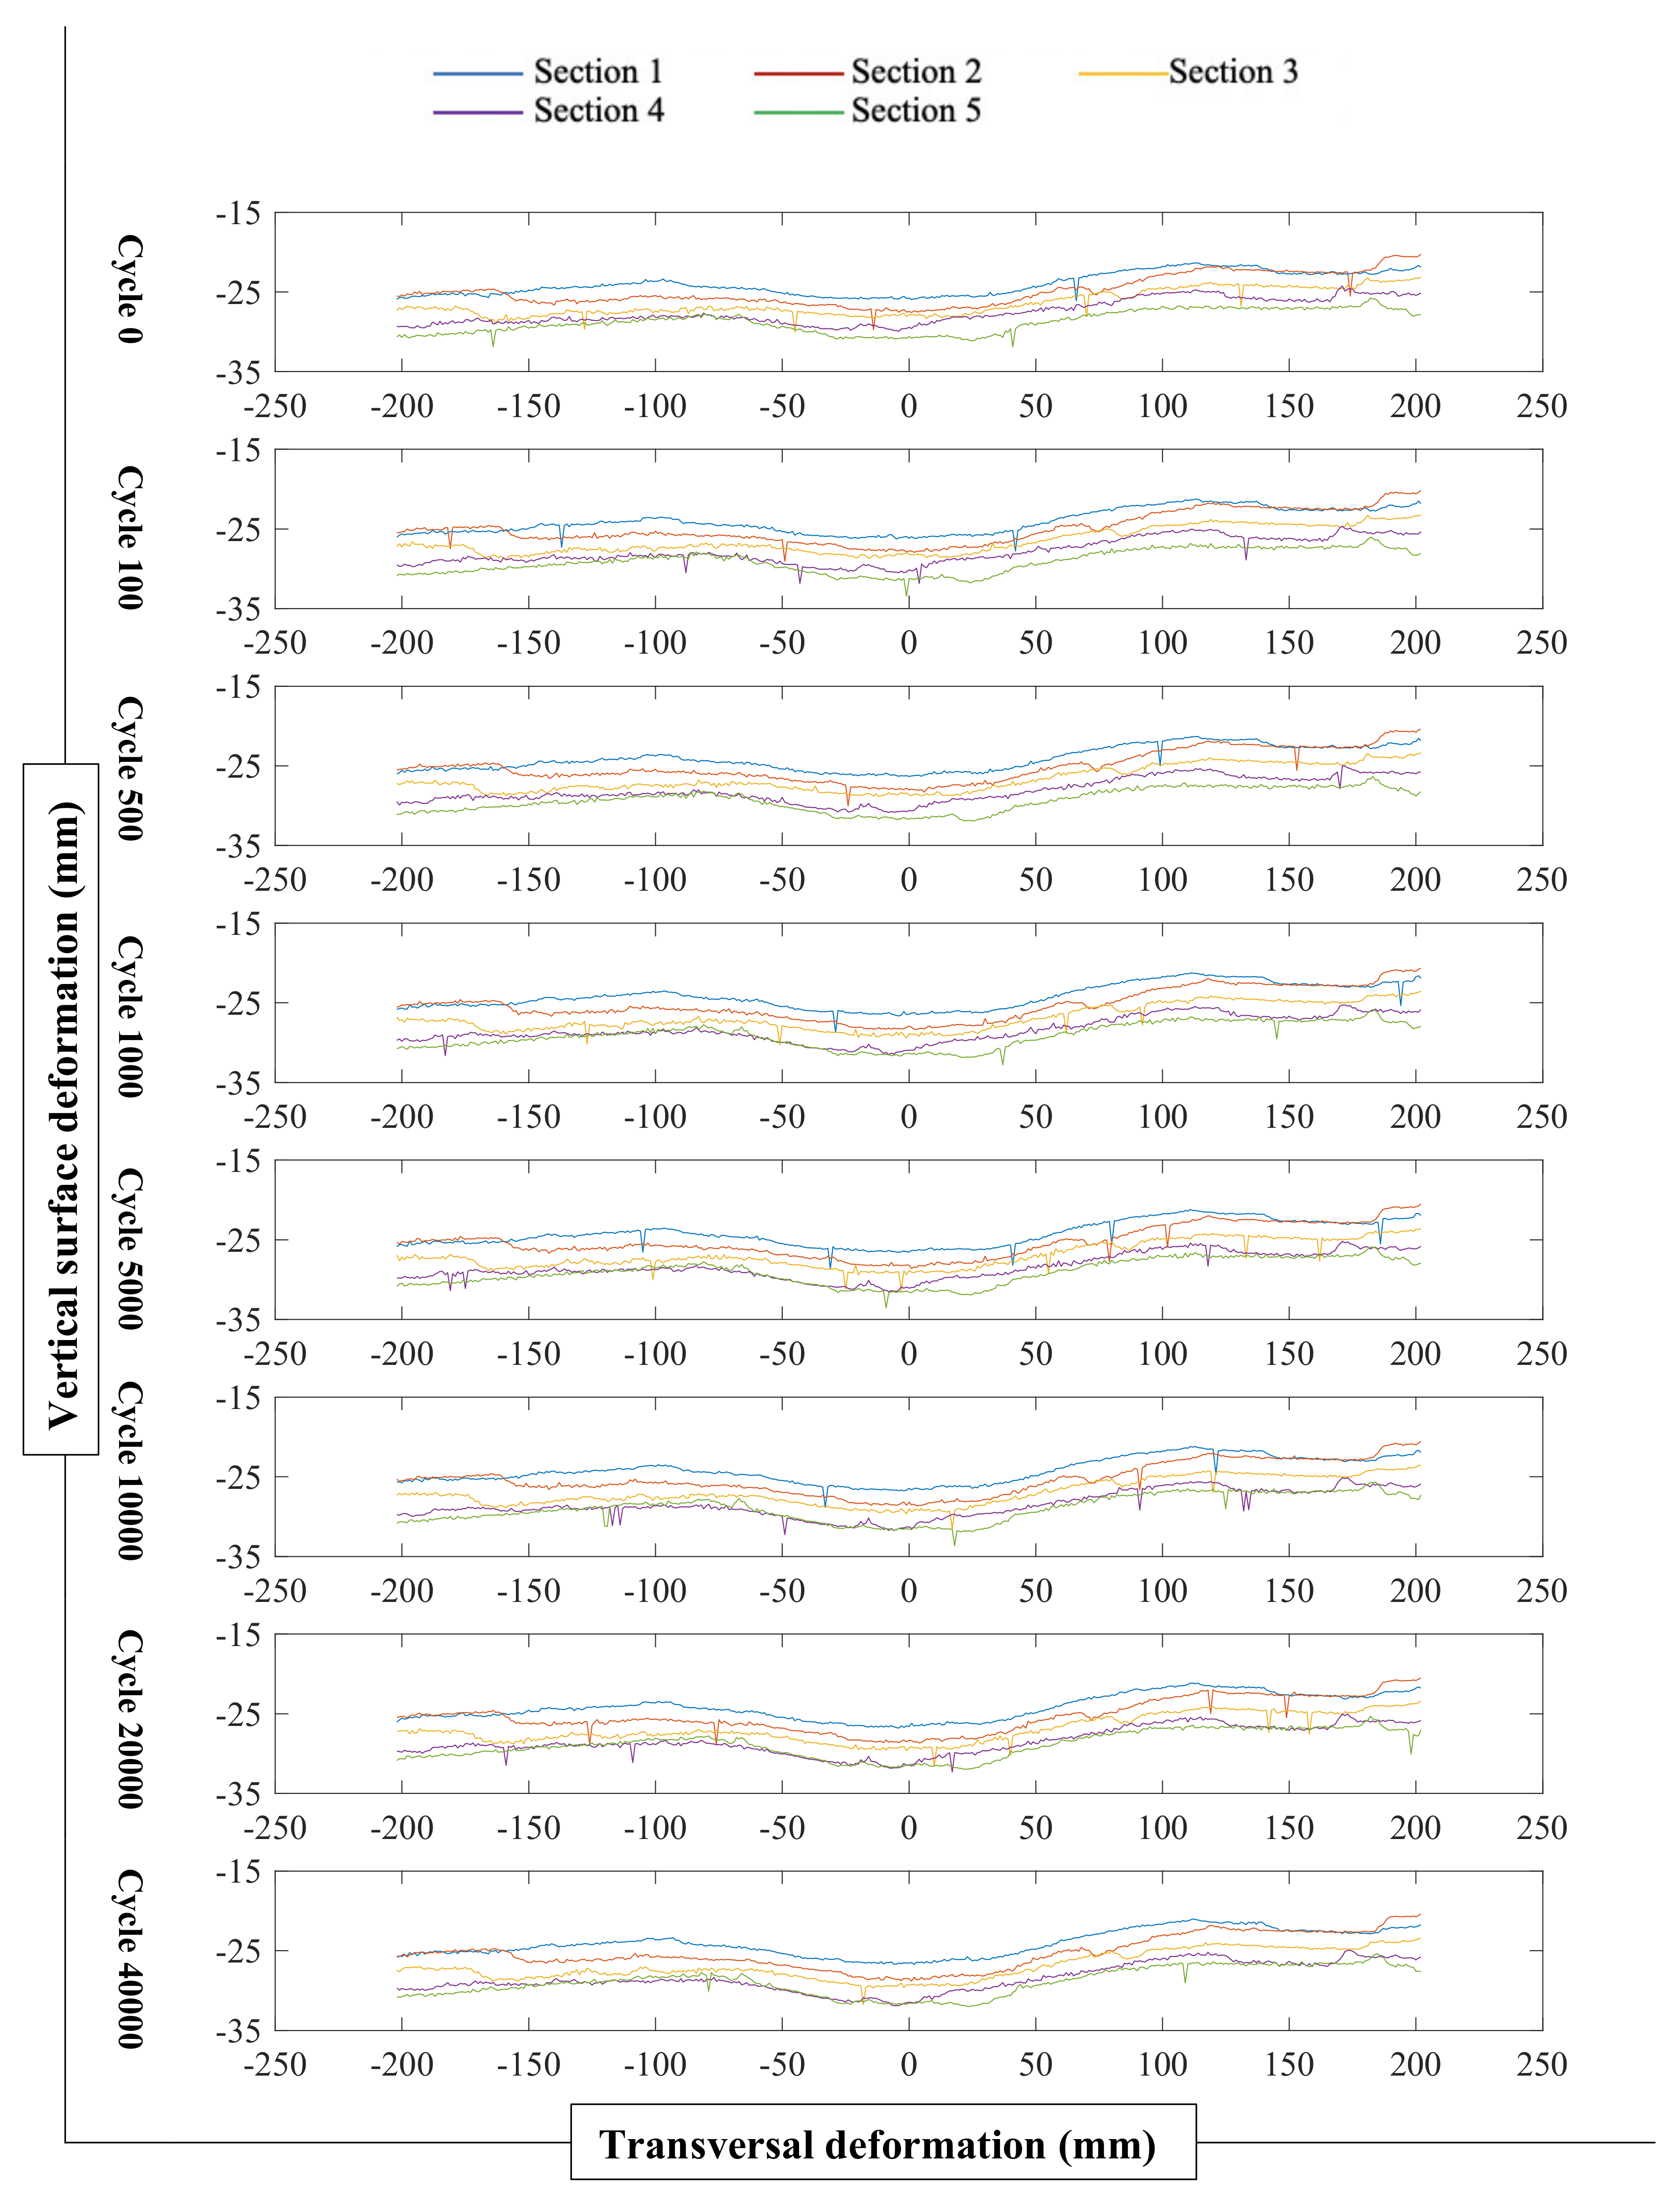
| −150 mm | −75 mm | 0 mm | +75 mm | +150 mm | −150 mm | −75 mm | 0 mm | +75 mm | +150 mm | |||
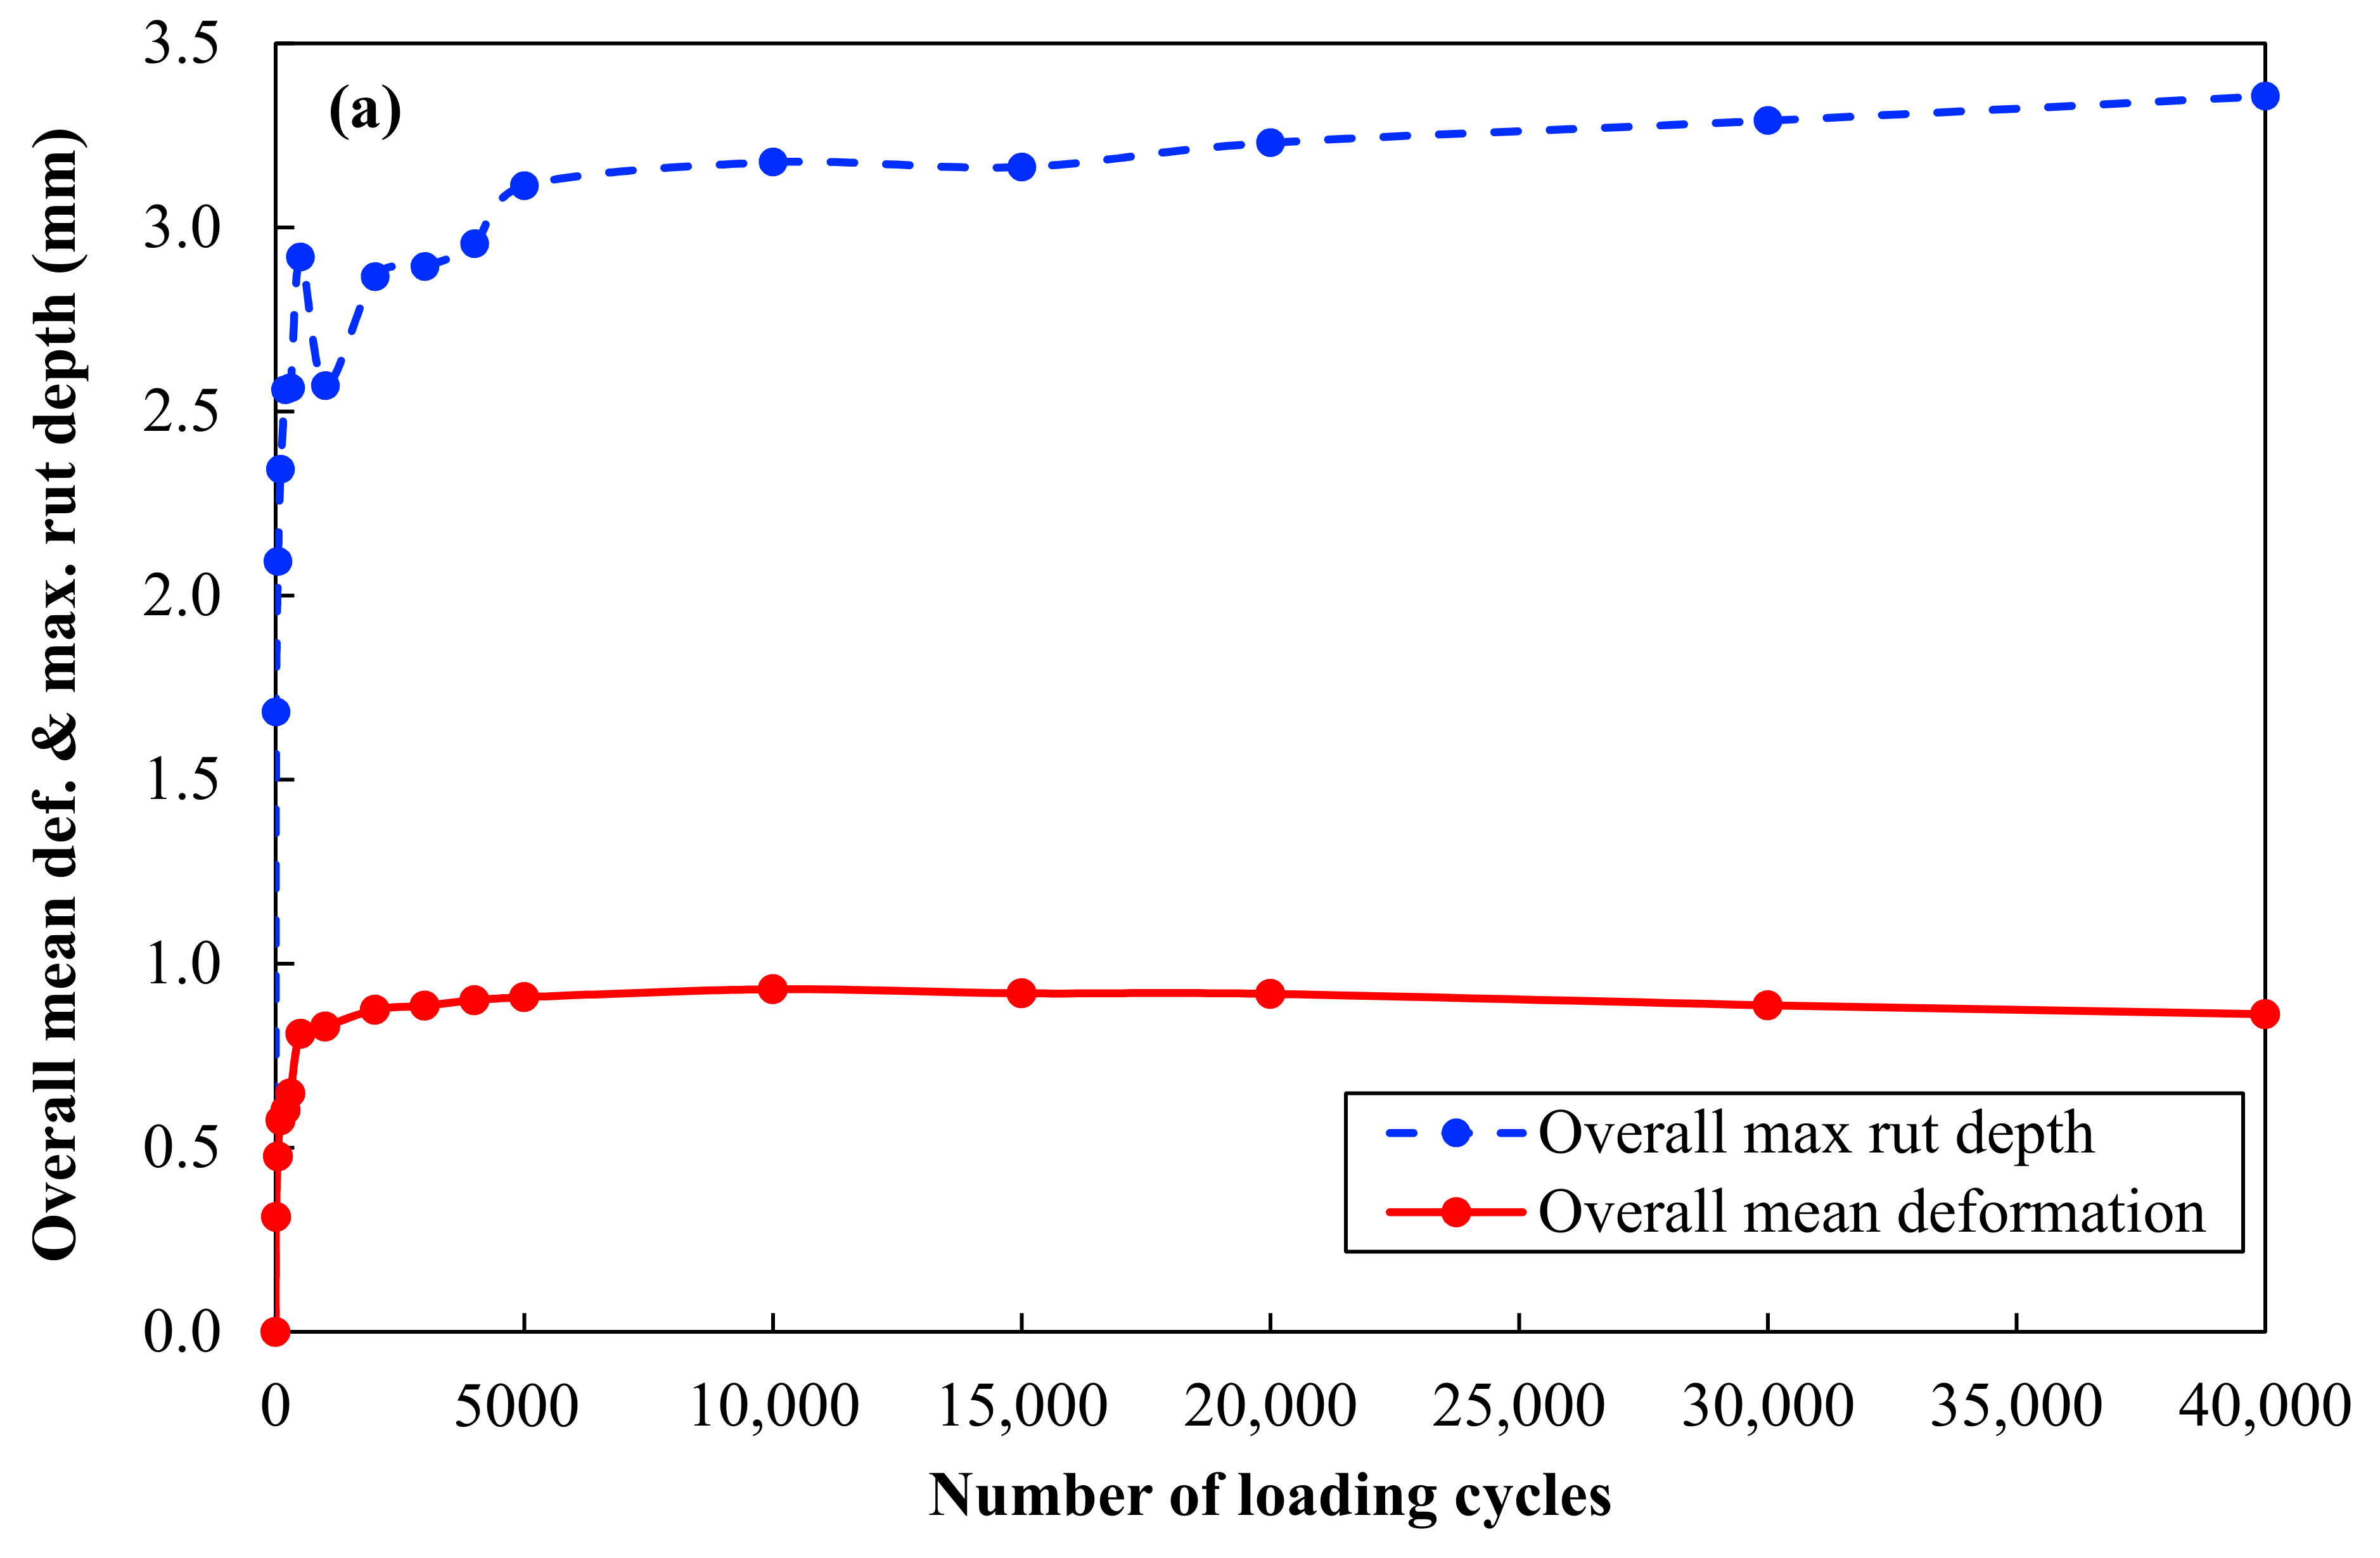
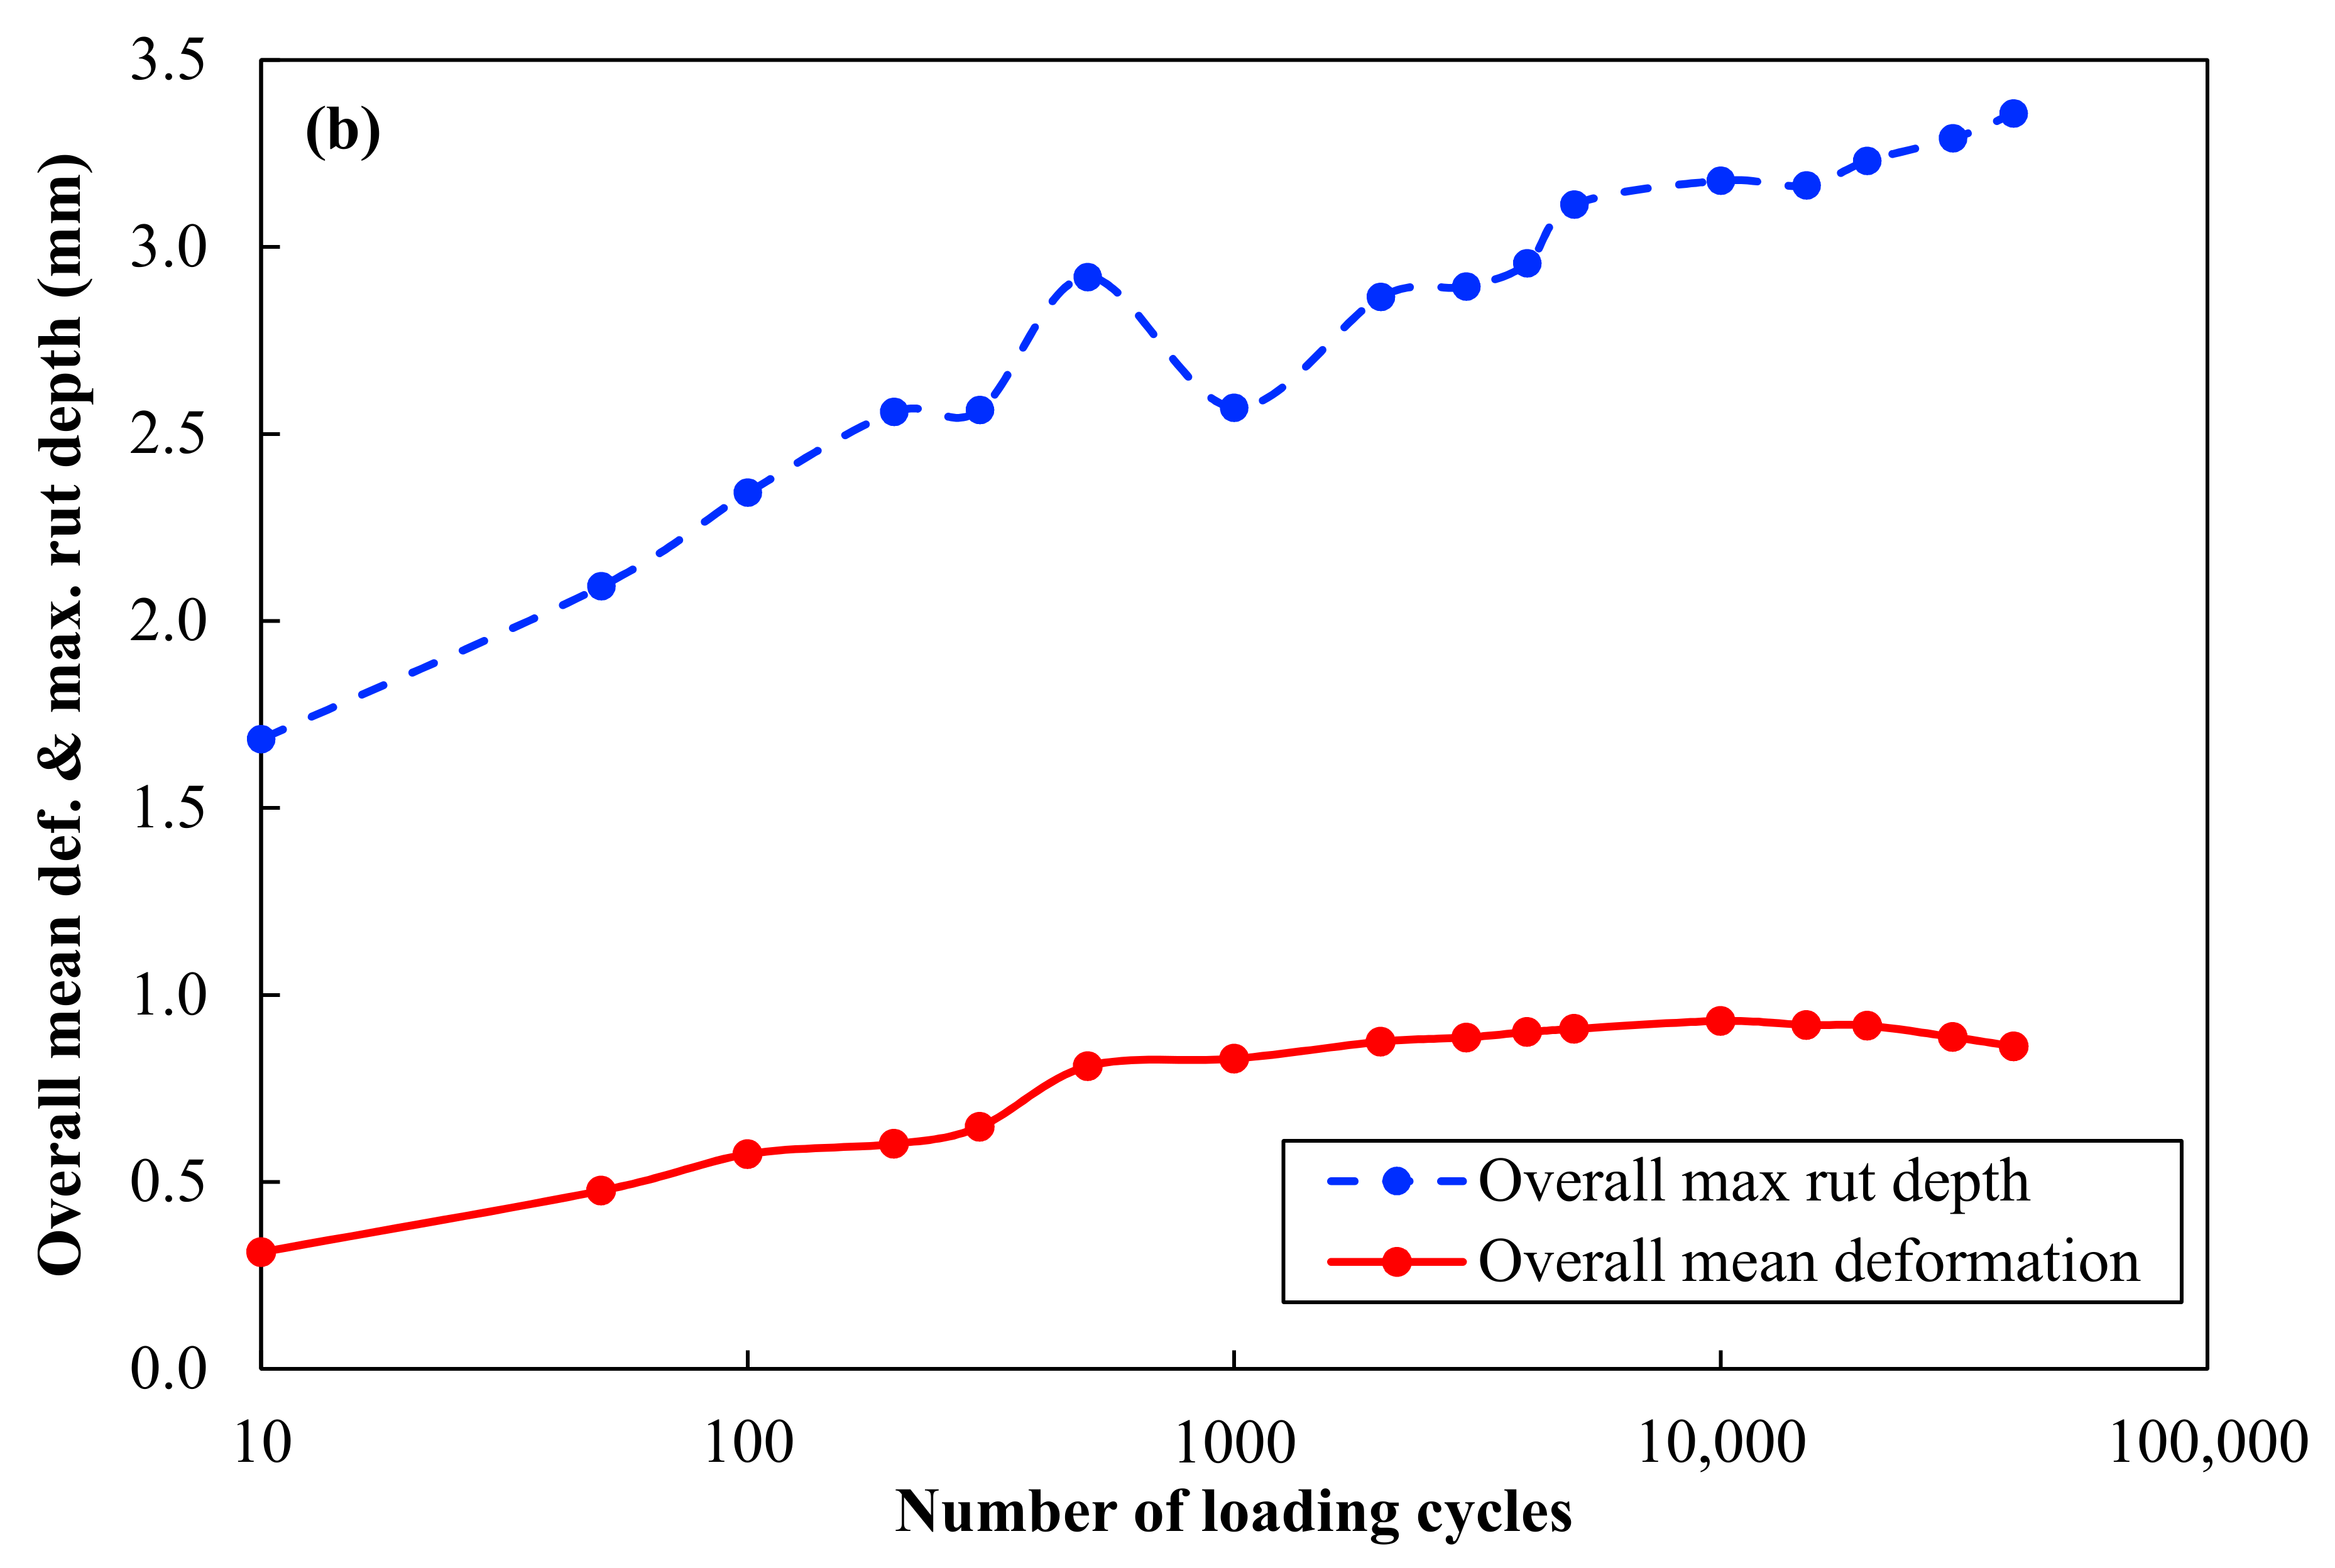
| 0 | 0.0 | 0.0 | 0.0 | 0.0 | 0.0 | 0.0 | 0.0 | 0.0 | 0.0 | 0.0 | 0.0 | 0.0 |
| 10 | 0.8 | 0.8 | −0.2 | 0.0 | 0.2 | 0.3 | 2.7 | 2.9 | 0.8 | 1.0 | 1.0 | 1.7 |
| 50 | 1.0 | 1.0 | 0.0 | 0.1 | 0.3 | 0.5 | 3.0 | 3.4 | 1.4 | 1.2 | 1.4 | 2.1 |
| 100 | 1.1 | 1.1 | 0.0 | 0.3 | 0.5 | 0.6 | 3.3 | 3.5 | 1.6 | 1.6 | 1.8 | 2.3 |
| 200 | 1.0 | 1.1 | 0.0 | 0.3 | 0.5 | 0.6 | 3.6 | 3.8 | 1.5 | 2.0 | 1.9 | 2.6 |
| 300 | 1.0 | 1.1 | 0.1 | 0.4 | 0.6 | 0.6 | 3.5 | 3.7 | 1.7 | 1.9 | 2.1 | 2.6 |
| 500 | 1.1 | 1.2 | 0.2 | 0.7 | 0.9 | 0.8 | 3.6 | 4.0 | 2.1 | 2.4 | 2.5 | 2.9 |
| 1000 | 1.1 | 1.3 | 0.3 | 0.8 | 0.7 | 0.8 | 3.5 | 4.1 | 1.6 | 2.3 | 1.4 | 2.6 |
| 2000 | 1.1 | 1.3 | 0.3 | 0.9 | 0.7 | 0.9 | 3.5 | 3.7 | 2.2 | 2.6 | 2.3 | 2.9 |
| 3000 | 1.1 | 1.4 | 0.4 | 1.0 | 0.6 | 0.9 | 3.6 | 3.8 | 2.3 | 2.6 | 2.2 | 2.9 |
| 4000 | 1.1 | 1.4 | 0.4 | 1.0 | 0.6 | 0.9 | 3.7 | 3.9 | 2.4 | 2.7 | 2.1 | 3.0 |
| 5000 | 1.2 | 1.4 | 0.4 | 1.0 | 0.6 | 0.9 | 3.8 | 4.2 | 2.4 | 2.8 | 2.4 | 3.1 |
| 10,000 | 1.2 | 1.4 | 0.5 | 1.0 | 0.6 | 0.9 | 3.7 | 4.2 | 2.7 | 3.1 | 2.3 | 3.2 |
| 15,000 | 1.2 | 1.4 | 0.5 | 1.1 | 0.5 | 0.9 | 3.7 | 4.1 | 2.5 | 3.1 | 2.4 | 3.2 |
| 20,000 | 1.2 | 1.4 | 0.5 | 1.1 | 0.4 | 0.9 | 3.9 | 4.1 | 3.0 | 3.0 | 2.1 | 3.2 |
| 30,000 | 1.1 | 1.4 | 0.5 | 1.0 | 0.4 | 0.9 | 3.9 | 4.3 | 2.8 | 3.2 | 2.3 | 3.3 |
| 40,000 | 1.0 | 1.4 | 0.4 | 1.0 | 0.4 | 0.9 | 3.8 | 4.5 | 2.9 | 3.2 | 2.4 | 3.4 |
Publisher’s Note: MDPI stays neutral with regard to jurisdictional claims in published maps and institutional affiliations. |
© 2021 by the authors. Licensee MDPI, Basel, Switzerland. This article is an open access article distributed under the terms and conditions of the Creative Commons Attribution (CC BY) license (http://creativecommons.org/licenses/by/4.0/).
Share and Cite
Maghool, F.; Senanayake, M.; Arulrajah, A.; Horpibulsuk, S. Permanent Deformation and Rutting Resistance of Demolition Waste Triple Blends in Unbound Pavement Applications. Materials 2021, 14, 798. https://doi.org/10.3390/ma14040798
Maghool F, Senanayake M, Arulrajah A, Horpibulsuk S. Permanent Deformation and Rutting Resistance of Demolition Waste Triple Blends in Unbound Pavement Applications. Materials. 2021; 14(4):798. https://doi.org/10.3390/ma14040798
Chicago/Turabian StyleMaghool, Farshid, Muditha Senanayake, Arul Arulrajah, and Suksun Horpibulsuk. 2021. "Permanent Deformation and Rutting Resistance of Demolition Waste Triple Blends in Unbound Pavement Applications" Materials 14, no. 4: 798. https://doi.org/10.3390/ma14040798