
Mg2+ Doping Effects on the Structural and Dielectric Properties of CaCu3Ti4O12 Ceramics Obtained by Mechanochemical Synthesis

 ,
,  , and
, and 
Abstract
:1. Introduction
2. Materials and Methods
2.1. Mechanochemical Synthesis
2.2. Characteristics of the Materials
3. Results and Discussion
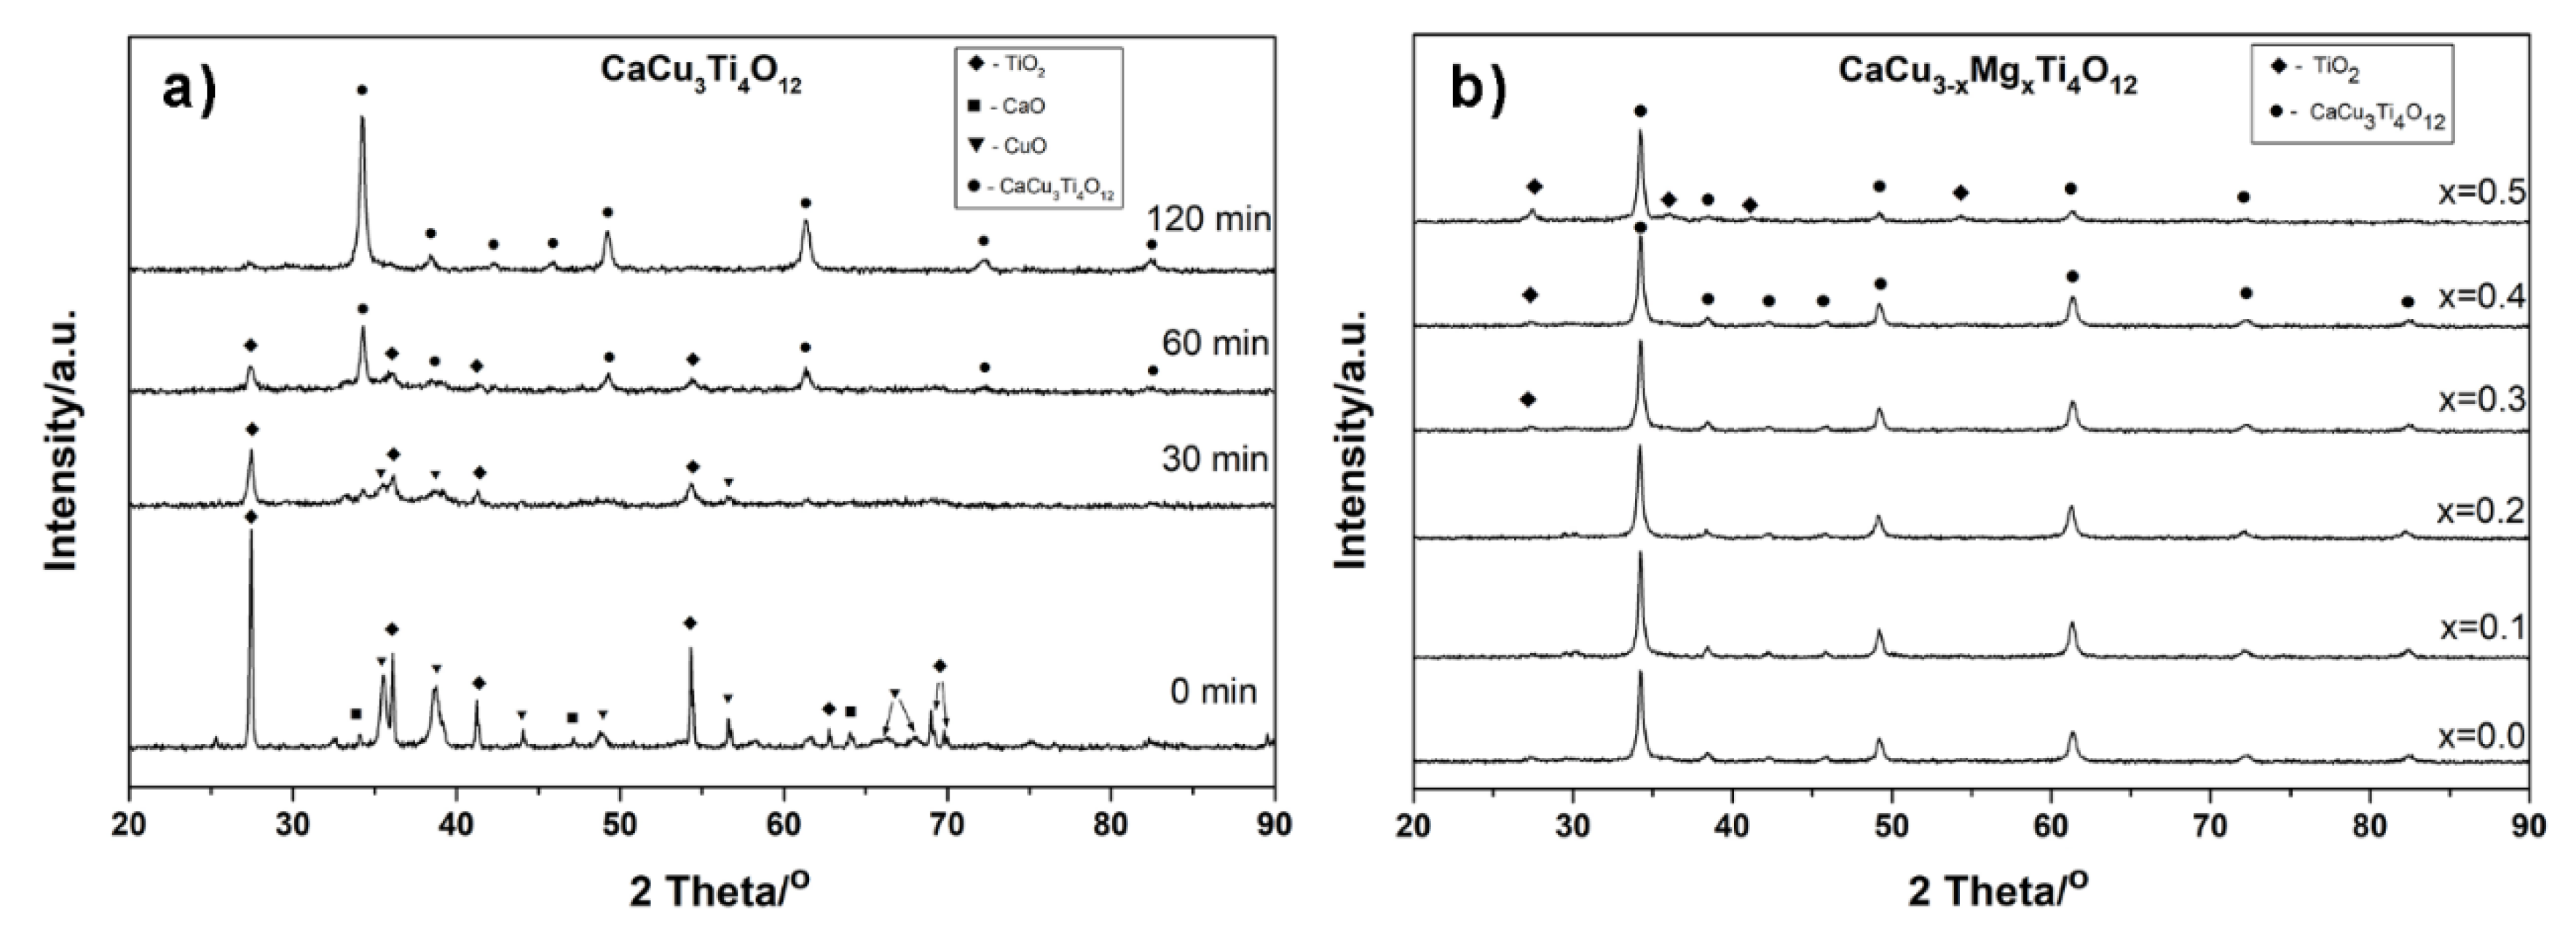
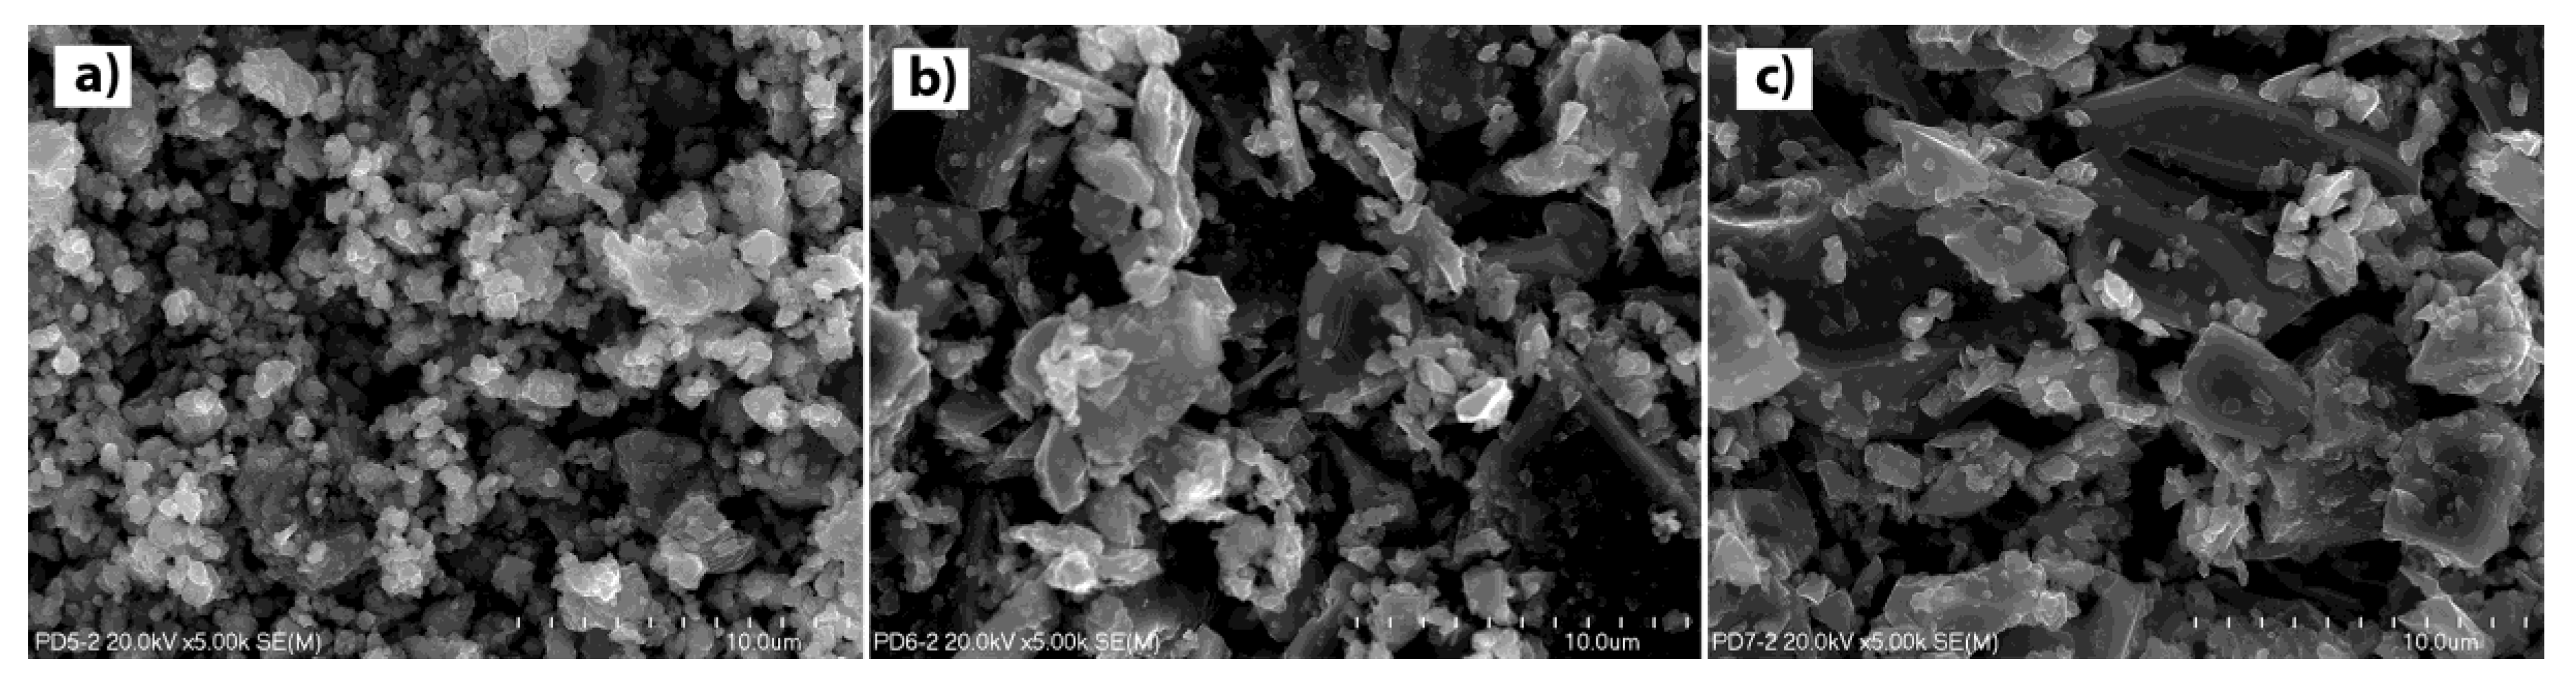
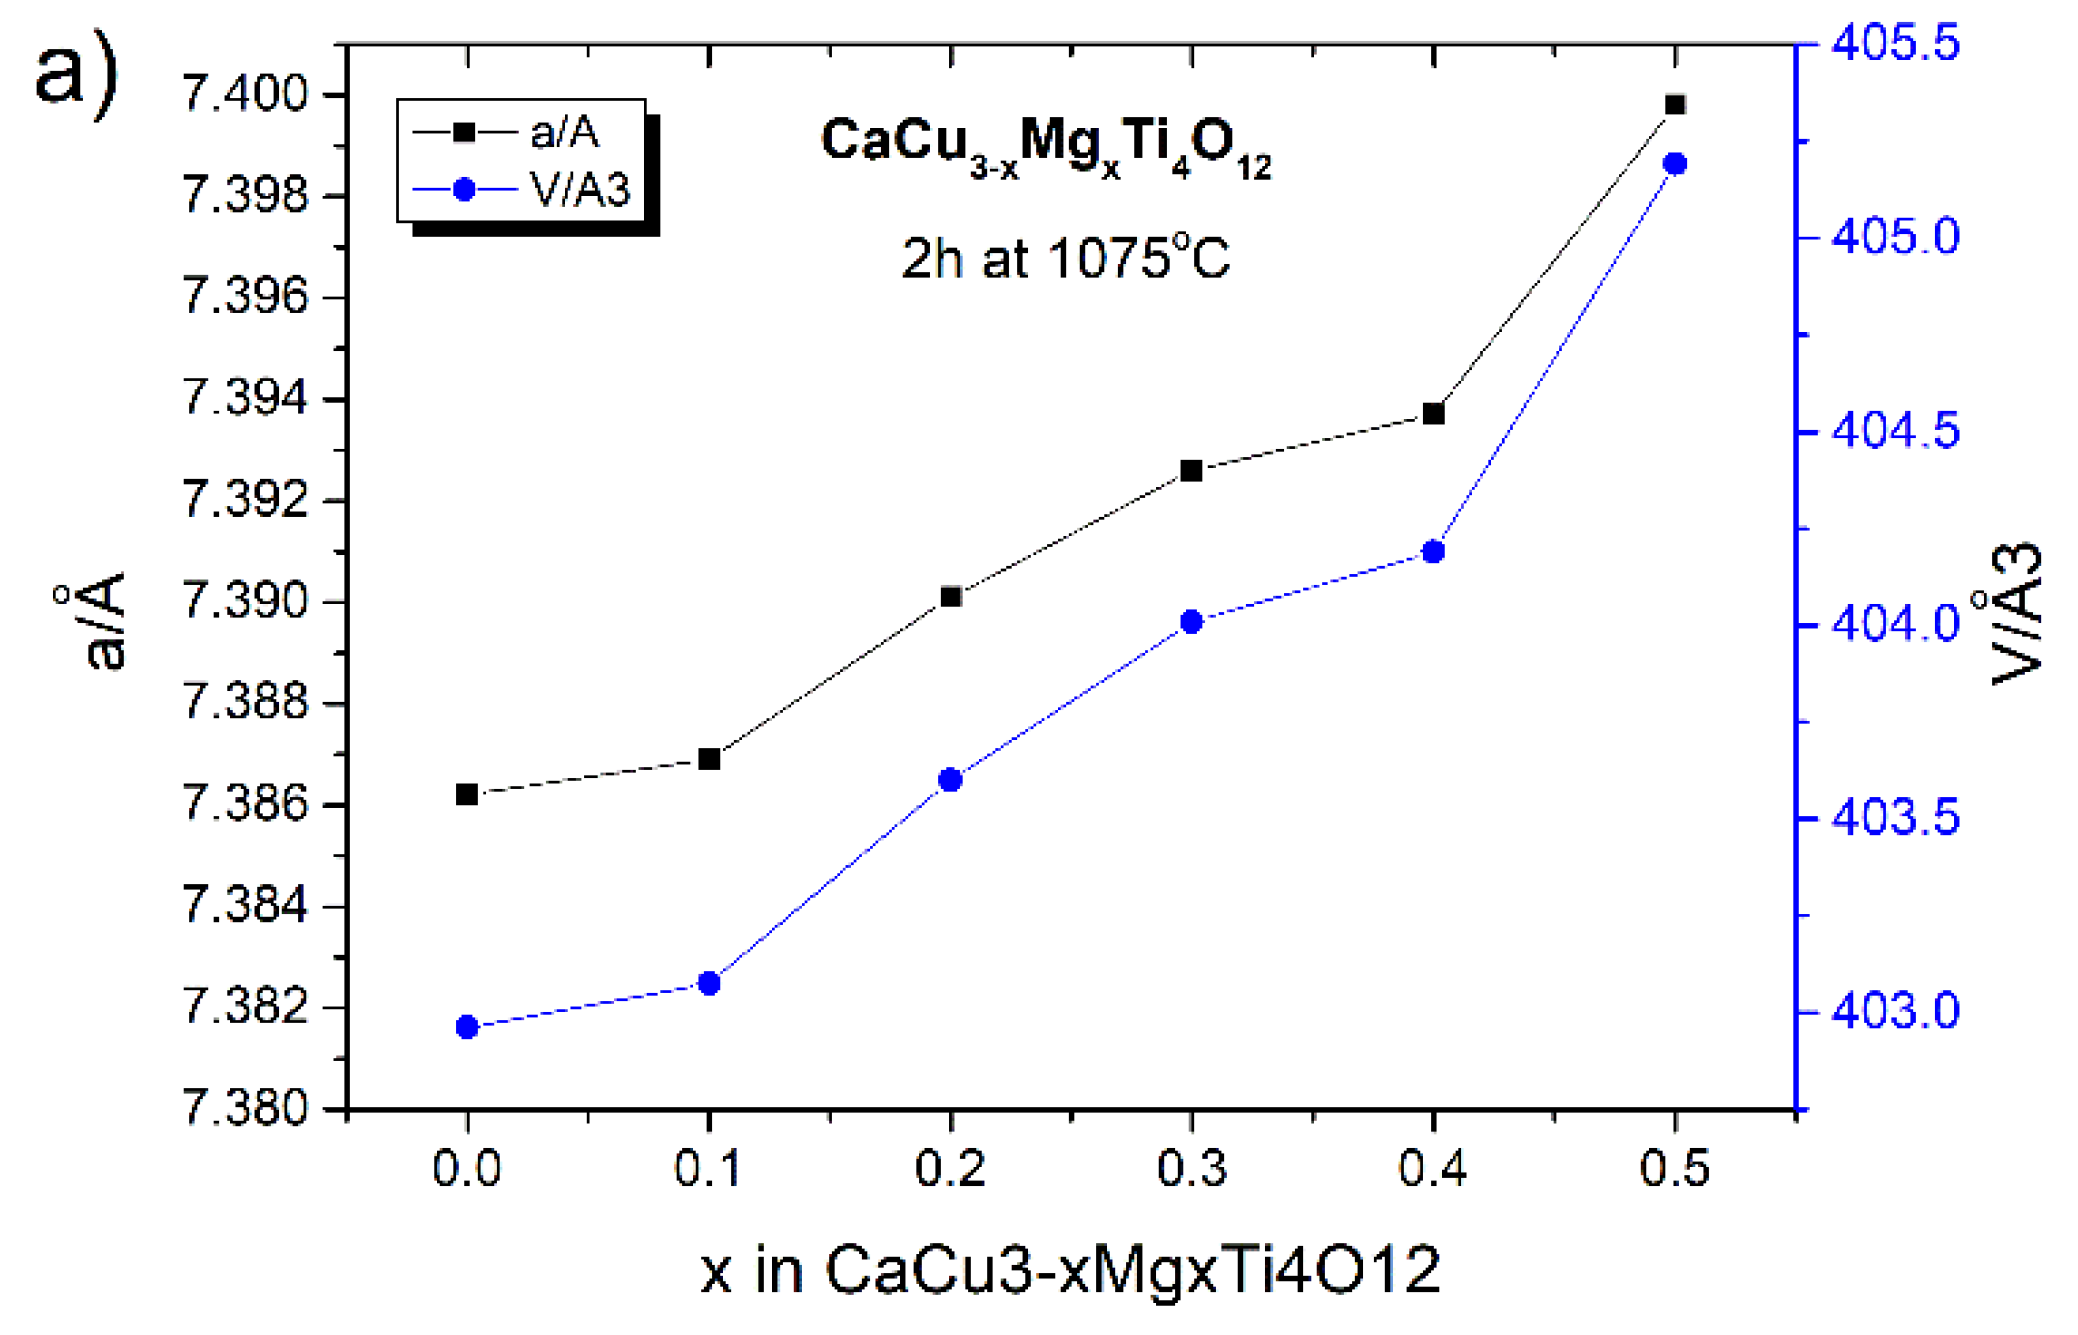
3.1. Mechanochemical Synthesis of Ceramics Powders
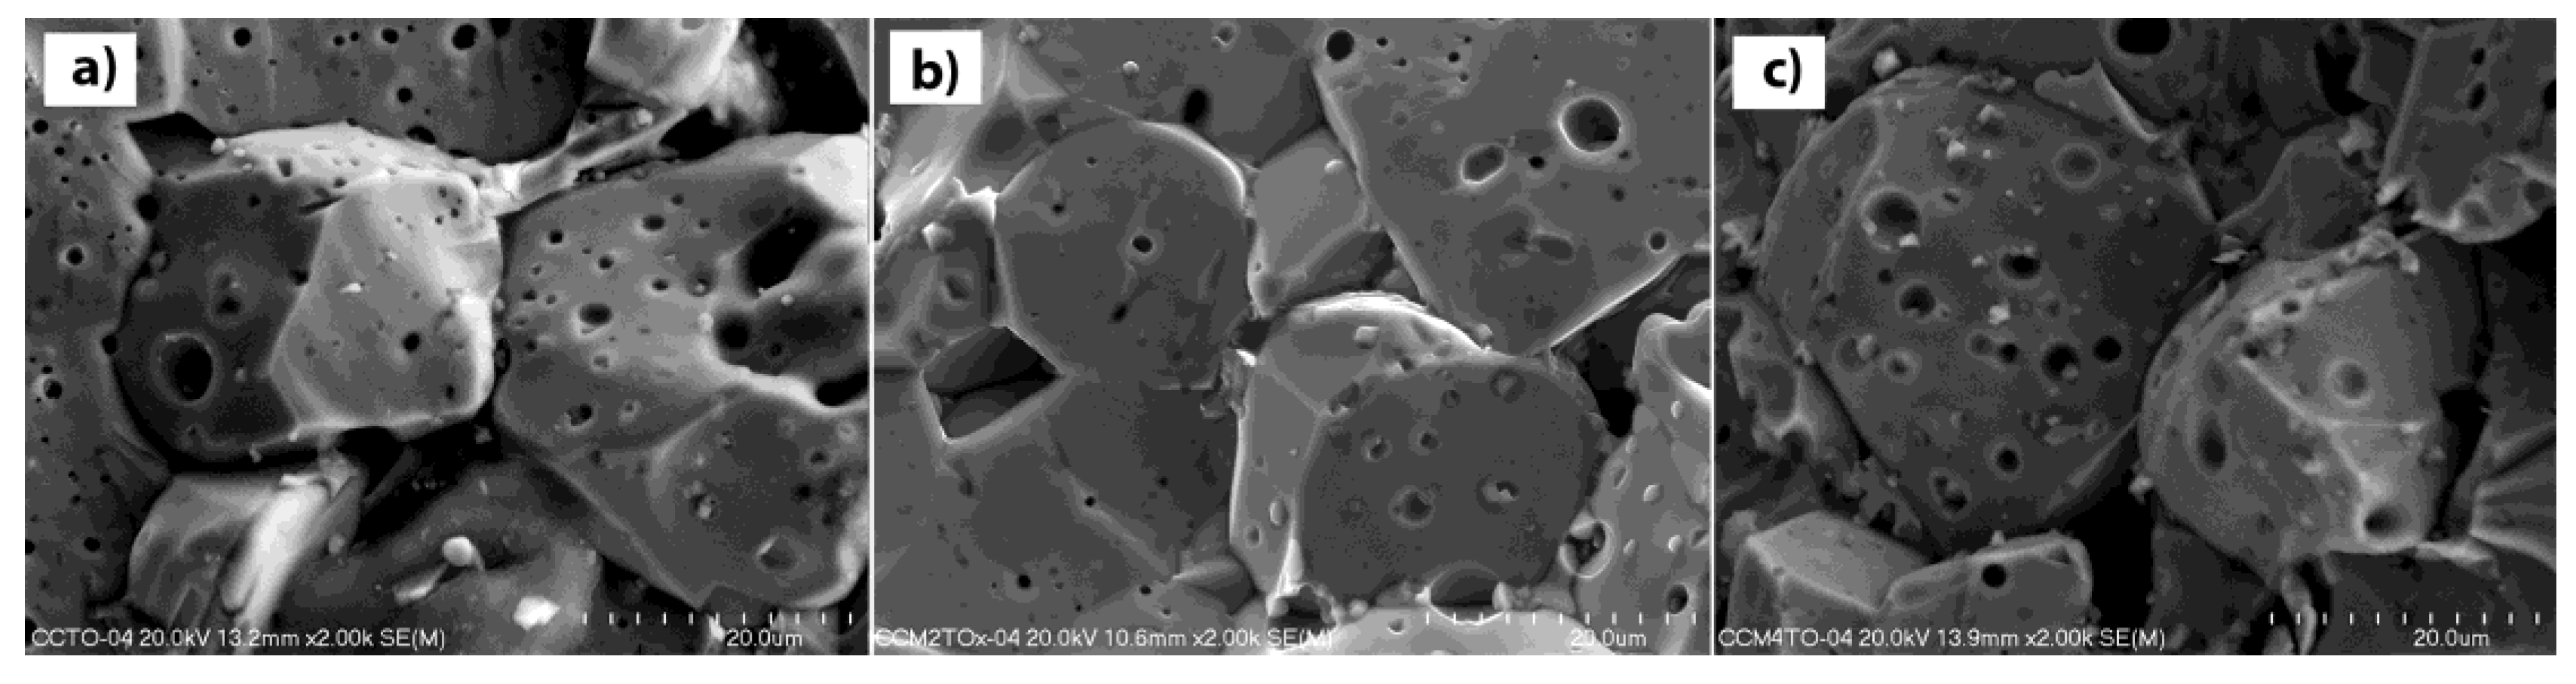
3.2. Dielectric Properties
4. Conclusions
Author Contributions
Funding
Institutional Review Board Statement
Informed Consent Statement
Data Availability Statement
Conflicts of Interest
References
- Hong, K.; Lee, T.H.; Suh, J.M.; Yoon, S.H.; Jang, H.W. Perspectives and Challenges in Multilayer Ceramic Capacitors for next Generation Electronics. J. Mater. Chem. C 2019, 7, 9782–9802. [Google Scholar] [CrossRef]
- Acosta, M.; Novak, N.; Rojas, V.; Patel, S.; Vaish, R.; Koruza, J.; Rossetti, G.A.; Rödel, J. BaTiO3 -Based Piezoelectrics: Fundamentals, Current Status, and Perspectives. Appl. Phys. Rev. 2017, 4, 041305. [Google Scholar] [CrossRef] [Green Version]
- Ramirez, A.P.; Subramanian, M.A.; Gardel, M.; Blumberg, G.; Li, D.; Vogt, T.; Shapiro, S.M. Giant Dielectric Constant Response in a Copper-Titanate. Solid State Commun. 2000, 115, 217–220. [Google Scholar] [CrossRef]
- Subramanian, M.A.; Li, D.; Duan, N.; Reisner, B.A.; Sleight, A.W. High Dielectric Constant in ACu3Ti4O12 and ACu3Ti3FeO12 Phases. J. Solid State Chem. 2000, 151, 323–325. [Google Scholar] [CrossRef]
- Luo, X.J.; Liu, Y.S.; Yang, C.P.; Chen, S.S.; Tang, S.L.; Bärner, K. Oxygen Vacancy Related Defect Dipoles in CaCu3Ti4O12: Detected by Electron Paramagnetic Resonance Spectroscopy. J. Eur. Ceram. Soc. 2015, 35, 2073–2081. [Google Scholar] [CrossRef]
- Cohen, M.H.; Neaton, J.B.; He, L.; Vanderbilt, D. Extrinsic Models for the Dielectric Response of CaCu3Ti4O12. J. Appl. Phys. 2003, 94, 3299–3306. [Google Scholar] [CrossRef] [Green Version]
- Yuan, W.-X.; Hark, S.K. Investigation on the Origin of the Giant Dielectric Constant in CaCu3Ti4O12 Ceramics through Analyzing CaCu3Ti4O12–HfO2 Composites. J. Eur. Ceram. Soc. 2012, 32, 465–470. [Google Scholar] [CrossRef]
- Adams, T.B.; Sinclair, D.C.; West, A.R. Giant Barrier Layer Capacitance Effects in CaCu3Ti4O12 Ceramics. Adv. Mater. 2002, 14, 1321–1323. [Google Scholar] [CrossRef]
- Leret, P.; de La Rubia, M.A.; Rubio-Marcos, F.; Romero, J.J.; Fernández, J.F. Effect of Processing on the Sintering of High Dielectric Constant CaCu3Ti4O12 Ceramics. Int. J. Appl. Ceram. Technol. 2011, 8, 1201–1207. [Google Scholar] [CrossRef]
- Leret, P.; Fernandez, J.F.; de Frutos, J.; Fernández-Hevia, D. Nonlinear I-V Electrical Behaviour of Doped CaCu3Ti4O12 Ceramics. J. Eur. Ceram. Soc. 2007, 27, 3901–3905. [Google Scholar] [CrossRef]
- Brizé, V.; Autret-Lambert, C.; Wolfman, J.; Gervais, M.; Simon, P.; Gervais, F. Temperature Dependence of Electron Spin Resonance in CaCu3Ti4O12 Substituted with Transition Metal Elements. Solid State Sci. 2009, 11, 875–880. [Google Scholar] [CrossRef]
- Espinoza-González, R.; Mosquera, E. Influence of Micro- and Nanoparticles of Zirconium Oxides on the Dielectric Properties of CaCu3Ti4O12. Ceram. Int. 2017, 43, 14659–14665. [Google Scholar] [CrossRef]
- Fang, L.; Shen, M.; Yang, J.; Li, Z. The Effect of SiO2 Barrier Layer on the Dielectric Properties of CaCu3Ti4O12 Films. J. Phys. D: Appl. Phys. 2005, 38, 4236–4240. [Google Scholar] [CrossRef]
- Vivas, L.; Delgado, G.E.; Leret, P.; Fernández, J.F.; Costa-Krämer, J.L.; Silva, P. Electron Paramagnetic Resonance Study of Hopping in CCTO Mixed with TiO2. J. Alloy. Compd. 2017, 692, 212–218. [Google Scholar] [CrossRef]
- de La Rubia, M.A.; Leret, P.; de Frutos, J.; Fernández, J.F. Effect of the Synthesis Route on the Microstructure and the Dielectric Behavior of CaCu3Ti4O12 Ceramics. J. Am. Ceram. Soc. 2012, 95, 1866–1870. [Google Scholar] [CrossRef] [Green Version]
- Yang, Y.; Wang, X.; Liu, B. CaCu3Ti4O12 Ceramics from Different Methods: Microstructure and Dielectric. J. Mater. Sci. Mater. Electron. 2014, 25, 146–151. [Google Scholar] [CrossRef]
- Shao, S.F.; Zhang, J.L.; Zheng, P.; Zhong, W.L.; Wang, C.L. Microstructure and Electrical Properties of CaCu3Ti4O12 Ceramics. J. Appl. Phys. 2006, 99, 084106. [Google Scholar] [CrossRef]
- Li, M.; Cai, G.; Zhang, D.F.; Wang, W.Y.; Wang, W.J.; Chen, X.L. Enhanced Dielectric Responses in Mg-Doped CaCu3Ti4O12. J. Appl. Phys. 2008, 104. [Google Scholar] [CrossRef]
- Rahman, M.F.A.; Hutagalung, S.D.; Mohamed, J.J.; Ain, M.F. Dielectric Properties of Mg-Doped CaCu3Ti4O12 Measured at High Frequencies. In Proceedings of the Advanced Materials Research, Pulau Pinang, Malaysia, 28 March 2012; Volume 895, pp. 190–193. [Google Scholar]
- Rahman, M.F.A.; Mohamed, J.J.; Ain, M.F.; Hutagalung, S.D. The Effect of MgO Dopant on the Dielectric Properties of CaCu3Ti4O12 Ceramics. In Proceedings of the Advanced Materials Research International Conference on X-Ray and related Technique in Research and Industry, Pulau Pinang, Malaysia, 3–5 July 2012; Volume 620, pp. 219–223. [Google Scholar]
- Ab Rahman, M.F.; Hutagalung, S.D.; Ahmad, Z.A.; Ain, M.F.; Mohamed, J.J. The Effect of Different Dopant Site (Cu and Ca) by Magnesium on CaCu3Ti4O12 Dielectric Properties. J. Mater. Sci. Mater. Electron. 2015, 26, 3947–3956. [Google Scholar] [CrossRef]
- Li, W.; Qiu, S.; Chen, N.; Du, G. Enhanced Dielectric Response in Mg-Doped CaCu3Ti4O12 Ceramics. J. Mater. Sci. Technol. 2010, 26, 682–686. [Google Scholar] [CrossRef]
- Jumpatam, J.; Putasaeng, B.; Yamwong, T.; Thongbai, P.; Maensiri, S. A Novel Strategy to Enhance Dielectric Performance and Non-Ohmic Properties in Ca2Cu2-XMgxTi4O12. J. Eur. Ceram. Soc. 2014, 34, 2941–2950. [Google Scholar] [CrossRef]
- Hu, Y.; Jeng, T.S.; Liu, J.S. Effect of the MgO Substitution for CuO on the Properties of CaCu3Ti4O12 Ceramics. Ceram. Int. 2012, 38, 3459–3464. [Google Scholar] [CrossRef]
- Thongbai, P.; Yamwong, T.; Maensiri, S. Non-Ohmic and Dielectric Properties of CaCu3Ti4O12-MgO Nanocomposites. Microelectron. Eng. 2013, 108, 177–181. [Google Scholar] [CrossRef]
- Nautiyal, A.; Autret, C.; Honstettre, C.; de Almeida-Didry, S.; el Amrani, M.; Roger, S.; Negulescu, B.; Ruyter, A. Local Analysis of the Grain and Grain Boundary Contributions to the Bulk Dielectric Properties of Ca(Cu3-YMgy)Ti4O12 Ceramics: Importance of the Potential Barrier at the Grain Boundary. J. Eur. Ceram. Soc. 2016, 36, 1391–1398. [Google Scholar] [CrossRef]
- Sun, L.; Zhang, R.; Wang, Z.; Cao, E.; Zhang, Y.; Ju, L. Microstructure and Enhanced Dielectric Response in Mg Doped CaCu3Ti4O12 Ceramics. J. Alloy. Compd. 2016, 663, 345–350. [Google Scholar] [CrossRef]
- Baláž, P.; Achimovicová, M.; Baláž, M.; Billik, P.; Zara, C.Z.; Criado, J.M.; Delogu, F.; Dutková, E.; Gaffet, E.; Gotor, F.J.; et al. Hallmarks of Mechanochemistry: From Nanoparticles to Technology. Chem. Soc. Rev. 2013, 42, 7571–7637. [Google Scholar] [CrossRef] [PubMed] [Green Version]
- Dulian, P.; Bąk, W.; Kajtoch, C.; Wieczorek-Ciurowa, K. A High-Energy Ball Milling as a Useful Technique for the Synthesis of CaCu3Ti4O12 Electroceramics. Acta Phys. Pol. A 2014, 126. [Google Scholar] [CrossRef]
- Singh, L.; Rai, U.S.; Mandal, K.D.; Rai, A.K. Effect of Processing Routes on Microstructure, Electrical and Dielectric Behavior of Mg-Doped CaCu3Ti4O12 Electro-Ceramic. Appl. Phys. A Mater. Sci. Process. 2013, 112, 891–900. [Google Scholar] [CrossRef]
- Sinclair, D.C.; Adams, T.B.; Morrison, F.D.; West, A.R. CaCu3Ti4O12: One-Step Internal Barrier Layer Capacitor. Appl. Phys. Lett. 2002, 80, 2153–2155. [Google Scholar] [CrossRef]
- Adams, T.B.; Sinclair, D.C.; West, A.R. Influence of Processing Conditions on the Electrical Properties of CaCu3Ti4O12 Ceramics. J. Am. Ceram. Soc. 2006, 89, 3129–3135. [Google Scholar] [CrossRef]
- East, J.; Sinclair, D.C. Characterization of (Bi1/2Na1/2)TiO3 Using Electric Modulus Spectroscopy. J. Mater. Sci. Lett. 1997, 16, 422–425. [Google Scholar] [CrossRef]
- Macedo, P.B.; Moynihan, C.T.; Bose, R. Role of Ionic Diffusion in Polarization in Vitreous Ionic Conductors. Phys. Chem. Glasses 1972, 13, 171–179. [Google Scholar]
- Dasari, M.P.; Sambasiva Rao, K.; Murali Krishna, P.; Gopala Krishna, G. Barium Strontium Bismuth Niobate Layered Perovskites: Dielectric, Impedance and Electrical Modulus Characteristics. Acta Phys. Pol. A 2011, 119, 387–394. [Google Scholar] [CrossRef]
- Liu, J.; Duan, C.-G.; Yin, W.-G.; Mei, W.N.; Smith, R.W.; Hardy, J.R. Large Dielectric Constant and Maxwell-Wagner Relaxation in Bi2/3Cu3Ti4O12. Phys. Rev. B Condens. Matter Mater. Phys. 2004, 70, 144106-1–144106-7. [Google Scholar] [CrossRef]


Publisher’s Note: MDPI stays neutral with regard to jurisdictional claims in published maps and institutional affiliations. |
© 2021 by the authors. Licensee MDPI, Basel, Switzerland. This article is an open access article distributed under the terms and conditions of the Creative Commons Attribution (CC BY) license (http://creativecommons.org/licenses/by/4.0/).
Share and Cite
Dulian, P.; Bąk, W.; Piz, M.; Garbarz-Glos, B.; Sachuk, O.V.; Wieczorek-Ciurowa, K.; Lisińska-Czekaj, A.; Czekaj, D. Mg2+ Doping Effects on the Structural and Dielectric Properties of CaCu3Ti4O12 Ceramics Obtained by Mechanochemical Synthesis. Materials 2021, 14, 1187. https://doi.org/10.3390/ma14051187
Dulian P, Bąk W, Piz M, Garbarz-Glos B, Sachuk OV, Wieczorek-Ciurowa K, Lisińska-Czekaj A, Czekaj D. Mg2+ Doping Effects on the Structural and Dielectric Properties of CaCu3Ti4O12 Ceramics Obtained by Mechanochemical Synthesis. Materials. 2021; 14(5):1187. https://doi.org/10.3390/ma14051187
Chicago/Turabian StyleDulian, Piotr, Wojciech Bąk, Mateusz Piz, Barbara Garbarz-Glos, Olena V. Sachuk, Krystyna Wieczorek-Ciurowa, Agata Lisińska-Czekaj, and Dionizy Czekaj. 2021. "Mg2+ Doping Effects on the Structural and Dielectric Properties of CaCu3Ti4O12 Ceramics Obtained by Mechanochemical Synthesis" Materials 14, no. 5: 1187. https://doi.org/10.3390/ma14051187