Article

Elaboration and Characterization of Vitreous Fertilizers and Study of Their Impact on the Growth, Photosynthesis, and Yield of Wheat (Triticum durum L.)

by
Tariq Labbilta
1,*,
Mohamed Ait-El-Mokhtar
2,3,
Younes Abouliatim
4,
Mehdi Khouloud
5,
Abdelilah Meddich
2 and
Mohamed Mesnaoui
1,6
1
Laboratory of Materials Sciences and Processes Optimization, Chemistry of Condensed Matter and Environment Team, Chemistry Department, Faculty of Sciences Semlalia, Cadi Ayyad University, Marrakech 40000, Morocco
2
Laboratory of Agro-Foods, Biotechnologies and Valorisation of Bioressources Vegetales, Faculty of Science Semlalia, Cadi Ayyad University, Marrakech 40000, Morocco
3
Department of Biology, Faculty of Sciences and Techniques Mohammedia, Hassan II University, Casablanca, Mohammedia 20000, Morocco
4
Laboratory of Materials, Processes, Environment, and Quality, National School of Applied Sciences of Safi, Cadi Ayyad University, Safi 46000, Morocco
5
Fertilizers Unit, OCP Group, Mohammed VI Polytechnic University, Jorf Lasfar 24025, Morocco
6
Center of Excellence in Soil and Fertilizer Research in Africa (CESFRA), AgroBioSciences, Mohammed VI Polytechnic University, Ben Guerir 43150, Morocco
*
Author to whom correspondence should be addressed.
Materials 2021, 14(5), 1295; https://doi.org/10.3390/ma14051295
Submission received: 18 January 2021 / Revised: 17 February 2021 / Accepted: 23 February 2021 / Published: 8 March 2021

Abstract

:
Four different phosphate glass formulations (F0, F1, F2, and F3) were developed according o wheat nutrient requirements to be used as controlled-release fertilizers. These glasses contain macro-elements (P2O5-K2O-CaO-MgO), with the addition of microelements (Fe-Mn-Zn-B-Cu-Mo) in each formulation. The effects of these elements’ addition on thermal properties, glass structure, and dissolution behaviors were investigated. Results showed that these glasses are composed essentially of metaphosphate chains and that the addition of micronutrients could change the chemical durability of phosphate glasses. A greenhouse experiment was performed using wheat (Triticum durum L.) to evaluate the efficiency of the four glasses, with or without application of chemical nitrogen (N) (N + VF and VF, respectively). The different formulas were tested using two rates of 0.3 and 1 g per plant. In addition to the vitreous fertilizer formulations, two other treatments were applied: control treatment with no amendment and Nitrogen-Phosphorus-Potassium treatment with the application of the conventional fertilizers on the base of optimal rates. After four months of cultivation, vitreous fertilizers application significantly improved growth (7% to 88%), photosynthetic (8% to 49%) parameters, and yield (29% to 33%) compared to NPK treatment and to the control. It has been found that formulas F1, F2, and F3 may constitute a potential alternative to conventional fertilization due to their positive impact on wheat production and can be used in practice as an environmentally controlled-release fertilizer.

1. Introduction

The world population continues to increase, and at the existing rate of growth, it is expected to increase by over a third, or 2.3 billion people, between 2009 and 2050 [1]. This rate of growth is much slower than the one noticed in the past four decades, during which it grew by around 90% or 3.3 billion people [2]. Almost all of this growth is predicted to occur in developing countries [3]. These statistics mean that it is necessary to raise overall food production by around 70% to nourish a world population of 9.1 billion people in 2050 [4]. The market demand for food would require almost double in developing countries [5]. As a result, the production of several key basic commodities has significantly increased. To ensure nutritional security, cereals’ annual production, especially wheat, should increase by nearly one billion tons [6].
Wheat is considered a multipurpose crop due to its important utilization as human and animal food [7]. In this regard, wheat production is currently considered a great challenge for countries worldwide to maintain food security [8]. In Morocco and the other countries located in North Africa, wheat productivity is affected by various abiotic and biotic constraints, such as drought, high temperatures, leaf rust, severe imbalances in soil fertility (absence of essential nutrients and/or micro-organisms), and unfavorable soil physical characteristics especially degradation of agricultural soil resources which is already seriously limiting the production of crops in these countries [9,10,11]. Morocco’s wheat production in 2018 has been estimated to be 7,320,620 t with an area of cultivation of 2,842,748 ha [12]. To meet its needs for the same year, Morocco has imported 3,946,570 t of wheat to become the world’s 14th largest importer of this cereal [12].
For this, agriculture faces multiple challenges in the 21st century: to nourish a growing population with less arable lands, it has to produce more food force, and also it has to participate in the overall development in the many agriculture-dependent developing countries [13]. Furthermore, agriculture must adopt more efficient and eco-friendly production techniques because the use of chemical products, such as herbicides, insecticides, and fungicides, to increase agricultural production has become more harmful to plants’ health and the physicochemical quality of soils [14]. Moreover, the overuse of conventional fertilizers implies a large amount of nutrients in soils, leading to a high release velocity in such a way that plants cannot absorb and consume them [15]. The unconsumed released nutrients may also be adsorbed and retained either on the outer surface or within the pores of soil particles. Most of the nutrients pass to rivers or lakes, contaminating drinking water, and causing eutrophication [16].
Vitreous controlled-release fertilizers are considered one of the most promising solutions to increase crop yields without any environmental problems [17]. These fertilizers ensure the presence and availability of nutrient elements over time [15]. Consequently, the soil nutrients will be in adequate quantities but contained within exact and controllable limits, depending on crops requirement and development stage [15]. Generally, these nutrient elements are classified into three categories: primary elements, i.e., Nitrogen (N), Phosphorus (P) and Potassium (K); secondary elements, i.e., Calcium (Ca) and Magnesium (Mg); and microelements, i.e., Boron (B), Zinc (Zn), Manganese (Mn), Iron (Fe), Copper (Cu) and Molybdenum (Mo). This classification depends on the amount of elements absorbed by the crops, not on their function since they are all indispensable for the plants’ balanced growth. Glasses (especially phosphate glasses) have the ability to incorporate the majority of these nutrients, making it possible to develop fertilizers that provide plants with all that is needed to produce crops with high nutritional value [18].
For vitreous fertilizers, the controlled release rate of nutrients, which is the most distinguished property with conventional fertilizers, is principally linked to the chemical composition of glass [19]. It can be adjusted to have fertilizers that can dissolve quickly or maintain their activity for a long period, depending on plants’ requirements. Several microelements, such as Mn, Fe, Zn, Mo, and CuO, have been proposed to improve phosphate glasses’ chemical resistance [20,21,22,23,24].
In this study, four phosphate glass formulations (F0-F1-F2-F3) were established according to wheat nutrient requirements: F0 contains only major nutrients (P2O5-K2O-CaO-MgO), iron was added in F1 and manganese in F2, while F3 incorporates all microelements (Fe-Mn-Zn-B-Cu-Mo) necessary for wheat growth. This work focused on the effect of these elements on glass thermal properties, structure, and dissolution behaviors in order to assess their appropriateness of being applied as controlled-release fertilizers. In addition, an agronomic valorization was carried out to assess the effectiveness of the elaborated vitreous fertilizers on wheat growth, photosynthesis, and yield in comparison to non-amended and conventional fertilizers treatments under greenhouse conditions.

2. Materials and Methods

2.1. Glass Synthesis

The vitreous fertilizers were elaborated by the melt quench technique, using CaCO3, K2CO3, NH4H2PO4, MgO, Fe2O3, MnO, ZnO, H3BO3, CuO, and MoO3 as raw materials. The appropriate amounts of batch constituents were accurately weighed, drily milled to a fine powder and thoroughly mixed using an agate mortar, and then placed in an alumina crucible. The batches were thermally treated at 200 °C for 2 h and 450 °C for 4 h to eliminate CO2, H2O, and NH, and form the starting materials’ decomposition and prevent NH4H2PO4 foam. The melting stage lasted 2 h at 800 °C, as shown in Figure 1 [19].
The melted samples were taken out of the furnace and quenched in the air by pouring on a carbon mold. All the glasses were directly annealed at 10 °C below their transition temperature (Tg) for about 4 h and then cooled slowly to ambient temperature. X-ray diffraction analysis was used to confirm the amorphous character of the glasses (PANAnalytical XPERT diffractometer working at 40 kV/200 mA, the angular range 10–70° (2θ) was scanned with a step size of 0.07° (2θ) and counting time of 5 s/step). The resulting glass compositions were examined using Inductively Coupled Plasma Optical Emission spectroscopy (ICP-OES Ultima Expert, Horiba Inc., Burlington, ON, Canada).

2.2. Thermal Analysis

Differential Thermal Analyzer was used to study the thermal properties of the vitreous fertilizers (DTA, Labsys Evo 1600, SETARAM). The process consists of heating ~30 mg of glass sample powder in a platinum crucible from ambient temperature to 800 °C at a heating rate of 10 °C min−1. The glass transition temperature (Tg), the onset crystallization temperature (Tc,on), peak crystallization temperatures (Tc), the melting temperatures (Tf) and the liquidus temperature (Tliq) were recorded for all the samples.
Glass stability is described in terms of resistance to the crystallization of glass during heating and processes involving the reforming of existing glass. Hruby suggested that a parameter, KH, indicates glass stability against crystallization [25]. This parameter is defined by KH = (Tc,on − Tg)/(Tliq − Tc,on). According to Hruby, glasses with higher values of KH indicate higher stability against crystallization on heating and, apparently, higher vitrifiability on cooling.

2.3. Density Measurements

The glass’s density was measured at ambient temperature applying the Archimedes method using diethyl-ortho-phthalate as the buoyant liquid. The measurements were managed in accordance with the standard test method for the density of glass by buoyancy (ASTM C693). The samples mass was measured both in air and after immersion in diethyl-ortho-phthalate. The density was calculated from the following equation [26]:
ρglass = mglass/(mglass + (mortho − m(ortho + glass)) × ρortho
with:
  • ρ = Density
  • mglass = mass of glass measured in air
  • mortho = mass of diethyl-ortho-phthalate only
  • m(ortho + glass) = mass of glass immersed in diethyl-ortho-phthalate
  • ρortho = 1.11422 g/cm3
In order to obtain an average density value, the measurements were carried out three times.
The molar volume (VM) was determined from the density value and molecular glass weight of the batch composition using the equation: VM = ρglass/Mglass with Mglass as the glass’s molar mass [27].

2.4. Characterization of Glass Structure

Raman spectroscopy, and Fourier Transform infrared spectroscopy were used to study glass structure.
The Raman spectrum was obtained by analyzing a fine powder of glass using the Confotec MR520 Raman Confocal Microscope, with an Argon-ion laser emitting 514 nm as an excitation source. The spectra were obtained in the range 400–4000 cm−1 over an average of 128 scans and 1 s exposure time in the micro Raman compartment with a 10× objective.
FTIR spectra were obtained applying the KBr technique, using a spectrometer Bruker VERTEX 70, in the 400–4000 cm−1 domain, with a resolution of 4 cm−1, and 32 scans for each determination. Finely round glasses were mixed with pulverized KBr with a ratio (0.01/0.99 g), respectively. The weighted mixtures were subjected to a pressure of 6 t/cm2 to produce homogeneous discs. To avoid moisture attack, The FTIR spectra were measured immediately after preparing the mixture discs.

2.5. Glass Dissolution

Each glass sample’s chemical durability was defined from its dissolution rate (DR) in distilled water. The glass samples were pulverized and sieved to particle sizes between 1 and 2 mm. One gram of glass grains was placed in a vial containing 20 mL of distilled water with an initial pH of 6.5 [19].
To study the release rate of the glasses versus time, several samples were prepared and then suspended in a thermostatic bath maintained at temperature = 25 ± 1 °C for 1 to 35 days. The specimens were taken out at various time points, residual glass samples were filtered from leachate solutions, dried at 90 °C for 10 h, and then weighted using an analytic balance sensitive (±0.1 mg) (Shimadzu AW220).
Their dissolution rates were calculated using the following formula [19]:
D R = W i W t W i × 100 ,
where Wi is the sample’s initial weight, and Wt is the sample’s weight after t days.
pH and ion measurements were carried out at the same time as the weight loss measurement took place, using a pH meter (Adwa-AD8000), and ICP-OES, respectively.

2.6. Agronomic Valorization of Vitreous Fertilizers

2.6.1. Plant Material and Experimental Design

A greenhouse experiment was performed to evaluate the effect of the prepared vitreous fertilizers on wheat growth in the greenhouse with a day/night cycle of 16/8 h, 25.5 °C temperature average, 68.5% relative humidity average, and 410 μm−2 s−1 photon flux density average. The experiment was performed using two rates of the prepared vitreous fertilizers (VF R1 = 0.3 and VF R2 = 1 g/plant) compared with traditional mineral fertilizer (NPK). NPK fertilizer was added based on the recommendations of the Ministry of Agriculture and Fisheries [28].
The soil sample used in this experiment was taken from Saada district (10 Km Southwest of Marrakesh, Morocco) and was characterized by a pH value of 7.92; electrical conductivity (EC), 1.72 mS cm−1; available phosphorus, 31 mg kg−1; organic matter, 1.3%; and total organic carbon, 0.80%. The texture of this soil was sandy clay loam.
Seeds of Triticum durum L. cv. Carioca underwent a 10 min sterilization using a 10% sodium hypochlorite solution and were rinsed several times with sterile distilled water. The germination test was performed in plastic dishes containing a sterile filter paper disk with incubation for seven days at 28 °C in the dark. One-week wheat seedlings were later transplanted into plastic pots (8 cm × 8 cm × 25 cm) (1 seedling/pot) containing 1.9 kg of soil.
The recommended doses of chemical fertilizer (NPK) were 140 kg N/ha as ammonium nitrate + 80 kg P2O5/ha as superphosphate + 50 kg K2O/ha as potassium sulphate.
The experiment was designed in 18 treatments crossing four vitreous fertilizer levels (F0, F1, F2, and F3) with two rates (0.3 and 1 g/plant) and two nitrogen fertilizer applications (0 and 1.4 g N/pot) besides NPK and control treatments. Pots of the different treatments were randomly disposed with ten replicates for each treatment (180 pots in total). Watering was done with the same amount of distilled water twice a week.

2.6.2. Growth Parameters

At harvest (four months from germination), the following measurements were recorded: ears, shoot and root dry and fresh weights (g/plant), plant height (cm), root length (cm), leaf area (cm2), number of leaves, the weight of 1000 grain, and weight and number of grains (g/plant). The plants’ fresh weights were determined directly after the harvest, while dry weights were measured after the samples were kept at 105 °C for 24 h.

2.6.3. Photosynthetic Efficiency and Stomatal Conductance

Measurements of these two parameters were carried out on fully expanded leaves from the third rank from five plants per treatment. Four measurements were taken from different parts of each leaf and their average was considered as one replicate.
Chlorophyll fluorescence traits were assessed using a portable fluorometer (Opti-sciences OSI 30p). Leaf clips were used to keep the leaves in the dark for 30 min and then the measurements were recorded. Chlorophyll fluorescence was assessed as Fv/Fm ratio where Fv = Fm − F0 and F0 and Fm are initial and maximum fluorescence respectively [29]. Stomatal conductance (gs) measurements were taken on a sunny day before harvest using a porometer system (Leaf Porometer LP1989, Decagon Device, Inc., Washington, DC, USA).

2.7. Statistical Analysis

The presented data are mean values based on three to five replicates ± standard error (SE) per treatment. SPSS software (IBM Corp. Released 2013. IBM SPSS Statistics for Windows, Version 22.0. Armonk, NY, USA: IBM Corp.) package for Windows was used to perform statistical analysis. All data were subjected to one-way analysis of variance (ANOVA) and the differences among means were assessed using Duncan’s test calculated at p < 0.05.

3. Results and Discussion

3.1. Glass Formation

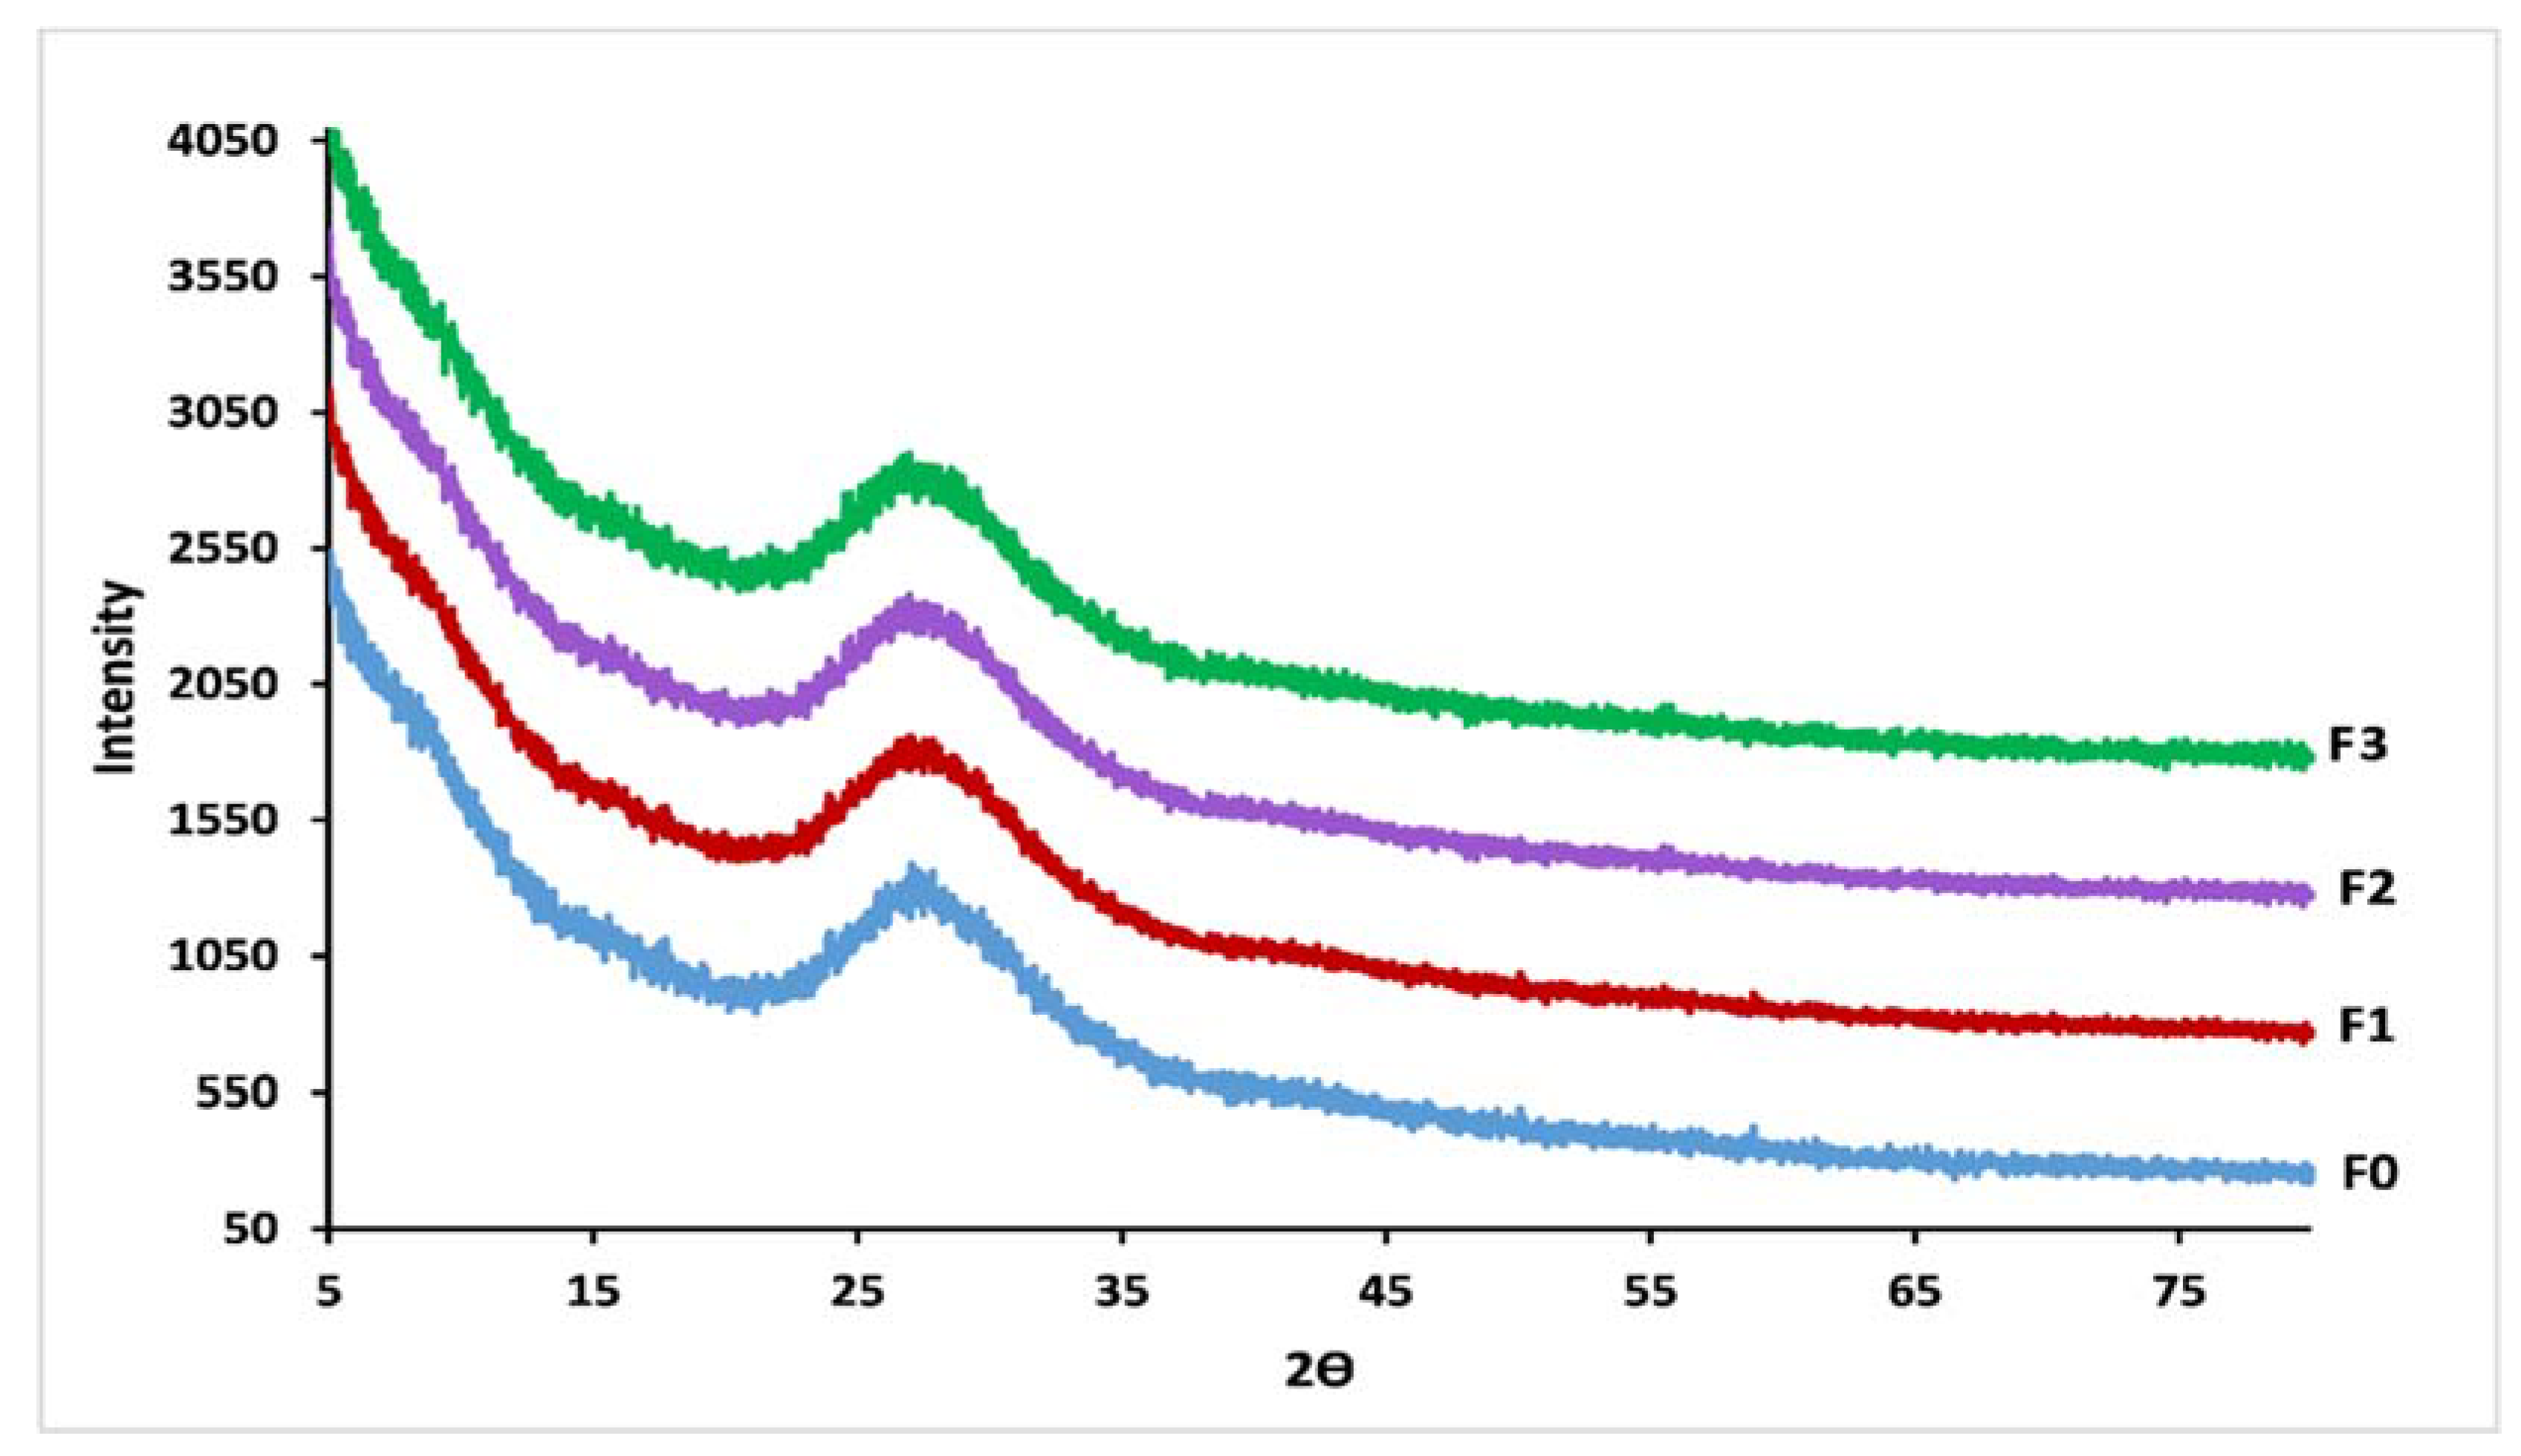
As shown in Figure 2, no sharp peak was observed in the XRD patterns which confirms the amorphous nature of the vitreous fertilizers [30]. The entire glasses showed a regular and homogeneous surface.
Few bubbles were observed, and all the obtained glasses were transparent. The formula F0 was colorless, while F1, F2, and F3 were brown, purple, and green, respectively. The brown color of phosphate glasses suggested the presence of Fe2+ and Fe3+ ions [31,32], while the purple color indicated the presence of Mn2+ and Mn3+ ions [32,33]. The green color of the formula F3 results from the presence of several elements like copper, iron, manganese, and molybdenum.
The analyzed compositions of the vitreous fertilizers are shown in Table 1. Differences between nominal and the analyzed compositions were minor for all samples and are attributed to measurement errors and melting volatilization.

3.2. Thermal Behaviour

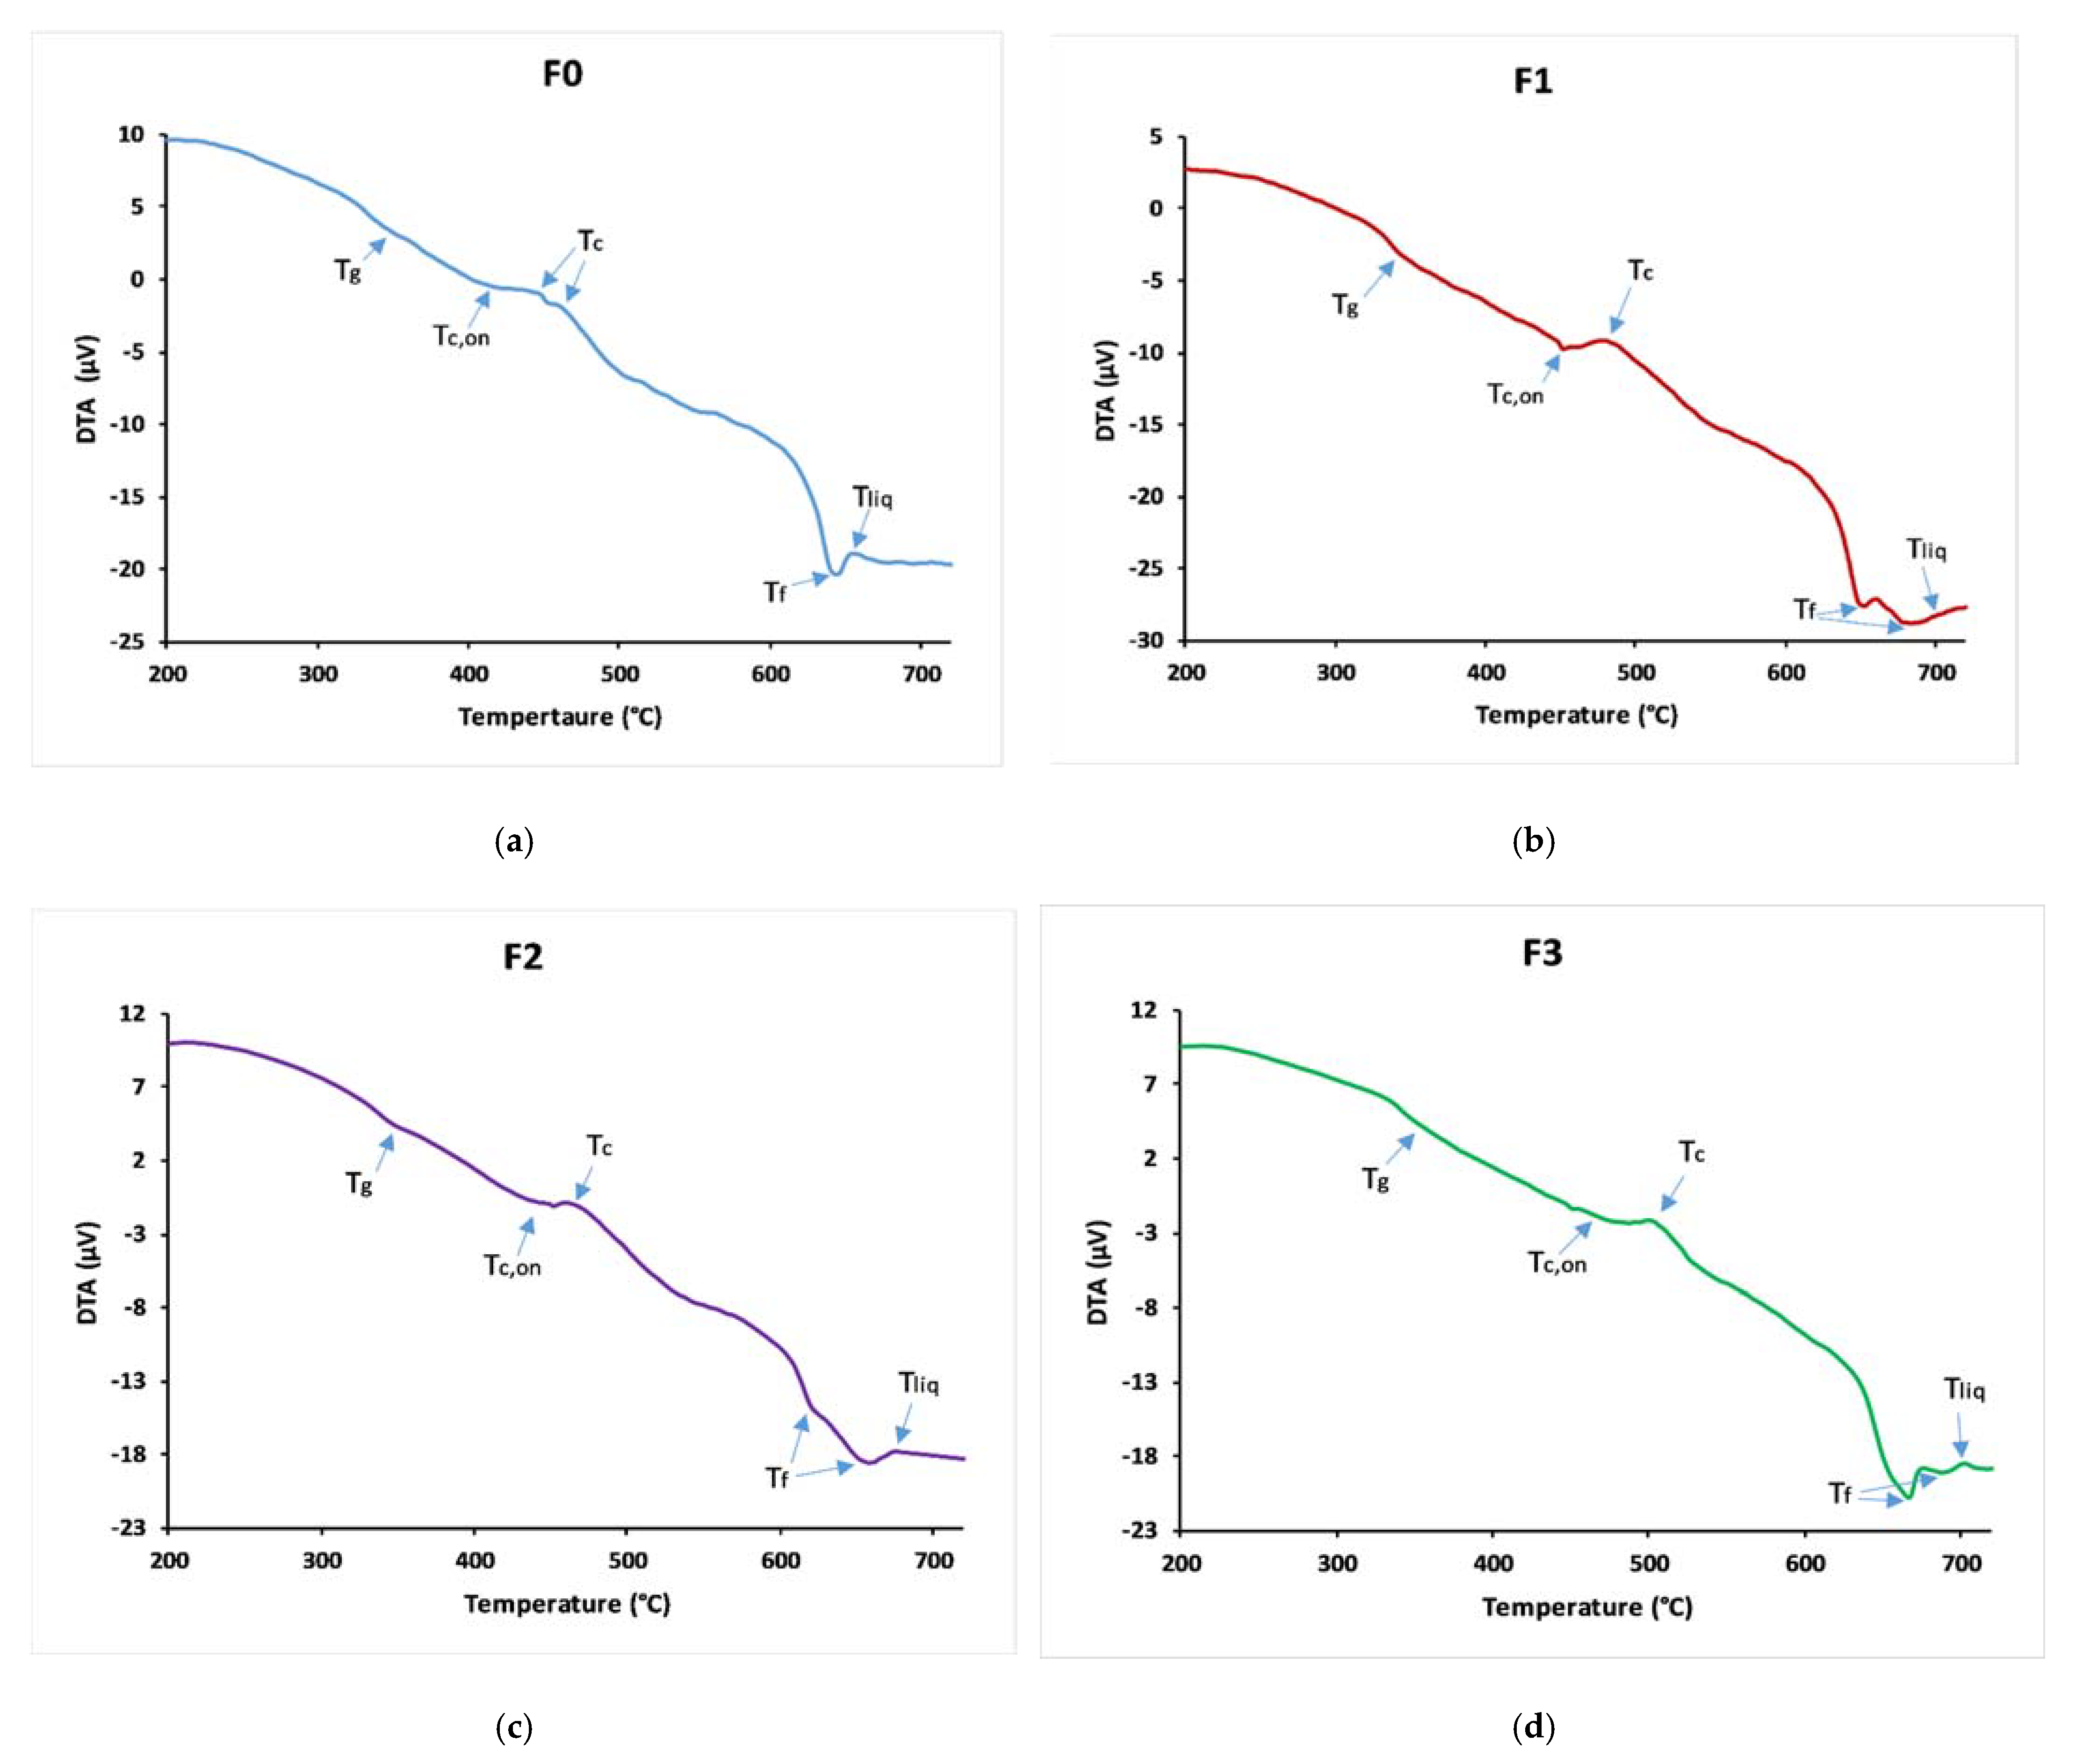
Figure 3 shows the thermal curves obtained from the differential thermal analysis, and Table 2 gives a summary of Tg, Tc,on, Tliq, and KH values of the samples. The three formulas containing microelements had higher glass transition, crystallization, and liquidus temperatures than F0. Glass F3 had higher values of Tg and Tliq. For the two glasses F1 and F2, it can be seen that they had close values of Tg, which is due to the Ionic Field Strength (IFS) of Fe and Mn (IFS = z/r2, where r is the ionic radius, and z is the valence cation), being IFS equal to 0.16 and 0.15 for Fe and Mn, respectively, according to Dietzel [34]. The increase in the glass transition temperature, which depends on the number and strength of the cross-links between oxygen atoms and the cation, and the density of covalent cross-linking, plays an important role in understanding the physical properties of glasses. This increase in Tg reflects a strengthening of the structure and increased network stability [35].
The DTA curves show multiple or broad crystallization and melting peaks. There is some evidence for the presence of multiple phases inside the glass matrix, or the network is constituted from different phosphate species [36]. The introduction of microelements in the phosphate glass matrix increased KH from 0.1395 for F0 to 0.4391, 0.4839, and 0.5279 for F1, F2, and F3 glasses, respectively, which reveals that the thermal stability of these glasses is greater than that of microelements-free glass samples, because the addition of these oxides creates cross-links between phosphate chains which reinforces the network [35].

3.3. Glass Density

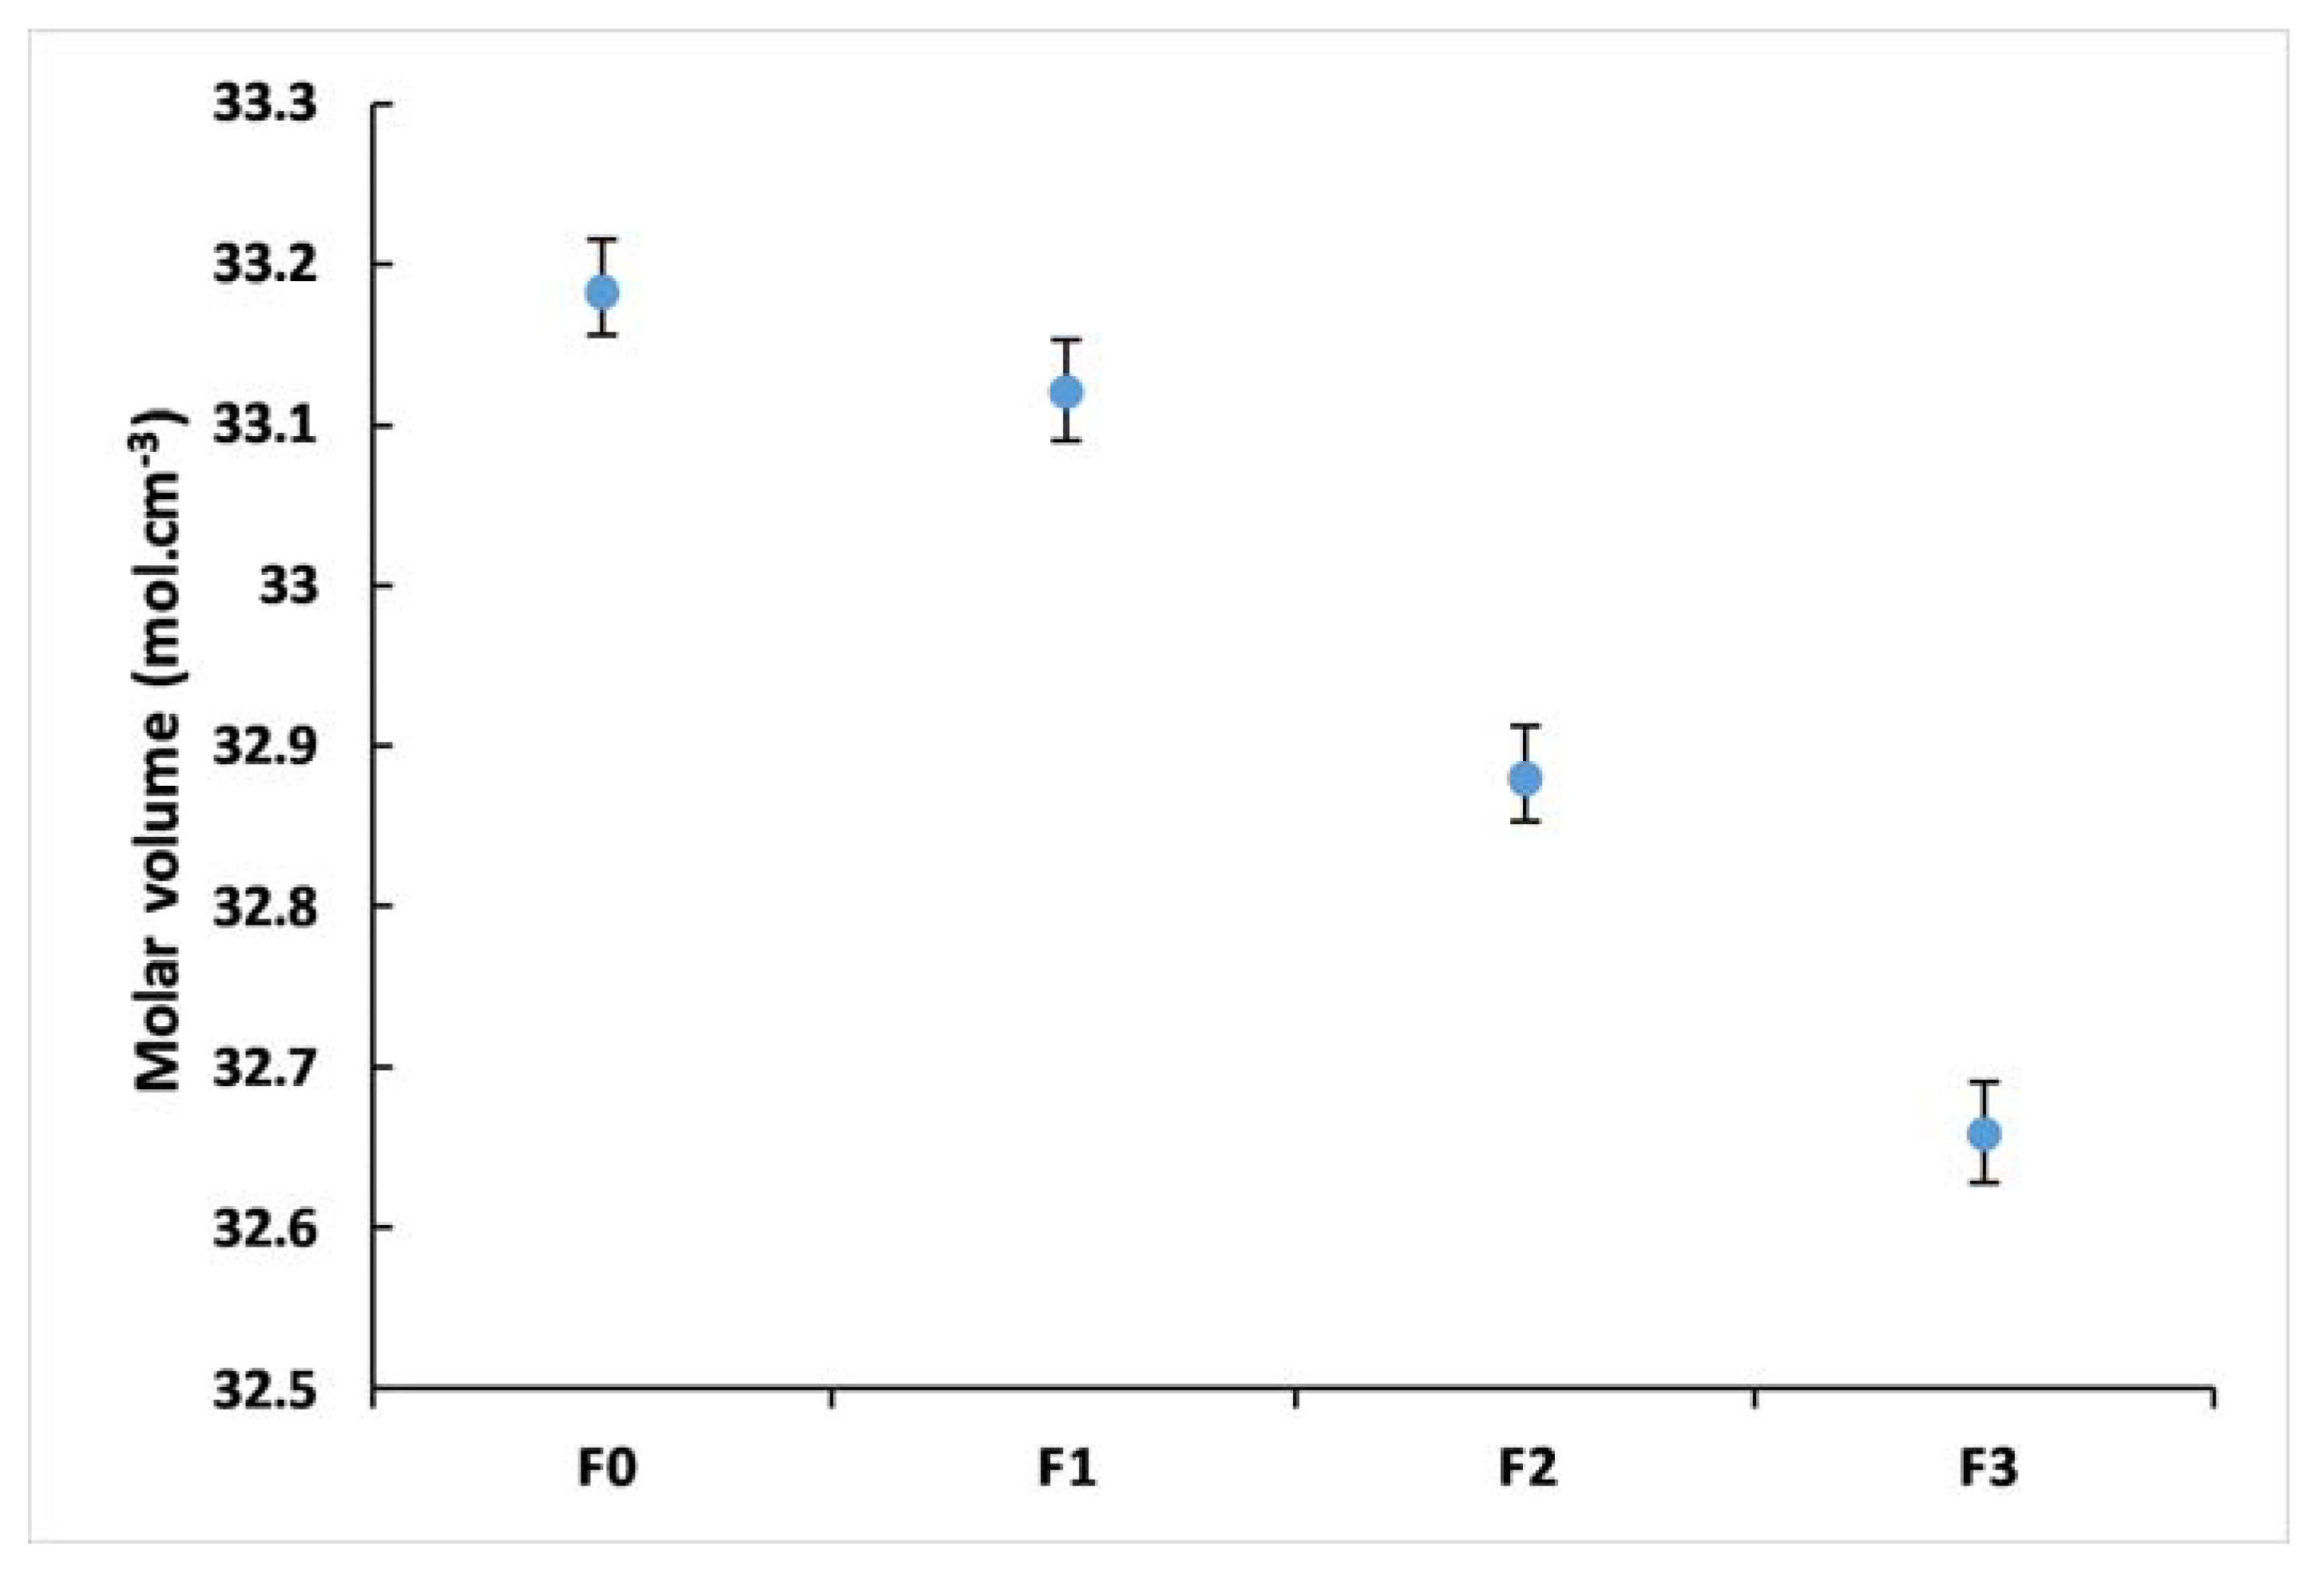
Table 3 summarizes the measured densities of the studied glasses. The densities changed from 3.341 for F0 to 3.426 for F3, whereas the molar volumes varied from 33.18 to 32.66 cm3 mol−1. Density is sensitive to spatial arrangement and the nature of atoms [36,37]. Variations in glass density could illustrate the degree of structural compactness of the glass network. However, in this work, these changes were small and not likely to be significant because most of the microelements incorporated are glass modifiers (expect B2O3), principally placed in the holes in the vitreous network [38].
The calculated molar volumes are shown in Figure 4. Molar volume, which compares volumes occupied by one mole of glass, is more sensitive to glass structure changes than density as it normalizes for atomic masses of glass components [27].
The decrease in molar volume by incorporating microelements reflects that the glass structure becomes more compact [35]. Furthermore, the increase in glass transition temperature (Tg) accompanied by a decrease in the molar volume may reflect an overall increase in the glass network cross-linking [39].

3.4. Glass Structure

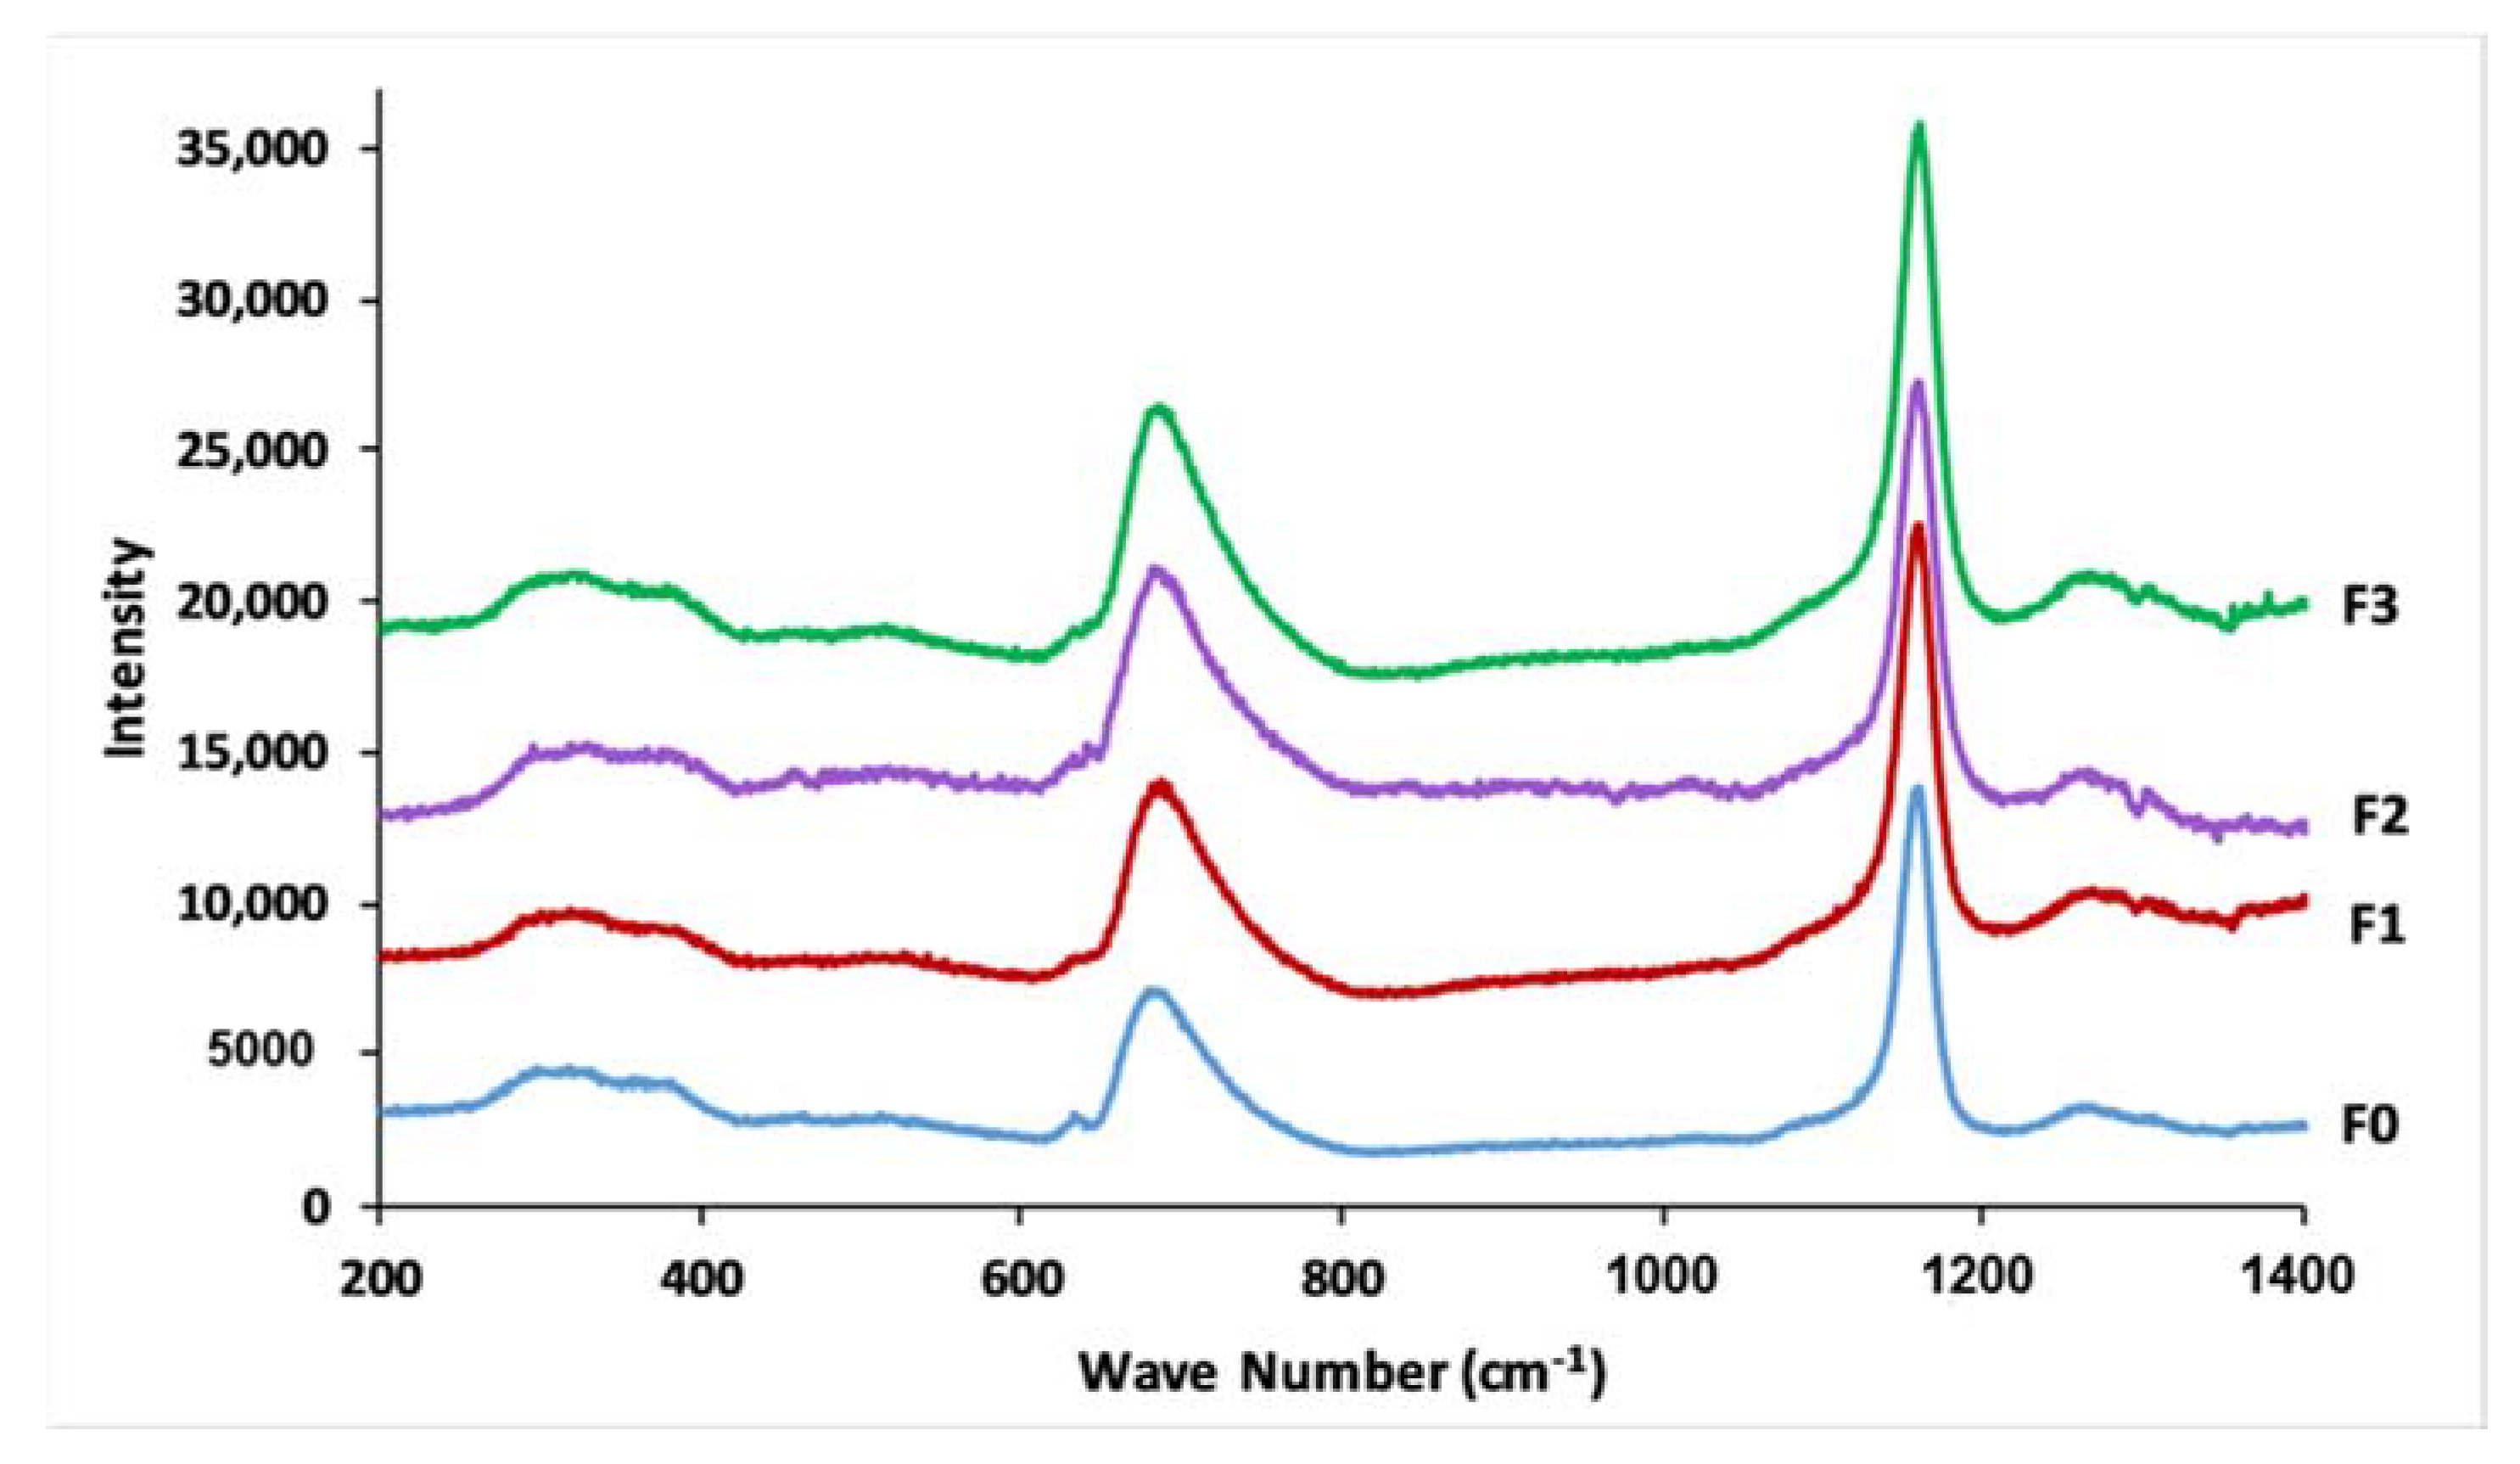
The Raman spectra of the four phosphate glasses, in the range between 200 and 1400 cm−1, are presented in Figure 5. It is common knowledge that the phosphate network is built around PO4 tetrahedral units, which are classified depending on the number of bridging oxygens, using the Qn designation, where “n” signifies the number of bridging oxygen atoms per tetrahedral unit (n = 0, 1, 2, 3) [40]. All Raman spectra are characterized by the existence of strong bands at around 1170 and 690 cm−1. Further weaker bands can be distinguished around 1270, 1100, 760, and 290–390 cm−1. The strong and broad band at 1170 cm−1 is assigned to the symmetric stretching mode of the PO2 non-bridging bond in Q2 groups. The feature at 1270 cm−1 is related to the asymmetric stretch mode of PO2, Vas(PO2) in Q2 groups. Q1 units appeared through two weak shoulders at 1100 cm−1 and 760 cm−1, which are attributed to the symmetric stretching vibration of terminal PO32− units, and to the symmetric stretching vibration of P–O–P, respectively. The band at 690 cm−1 is attributed to the symmetric stretching mode of the P–O–P in Q2 groups. Bands between 290 and 390 cm−1 could be related, respectively, to bending vibrations of PO2 and PO32− [38,39,41,42,43].
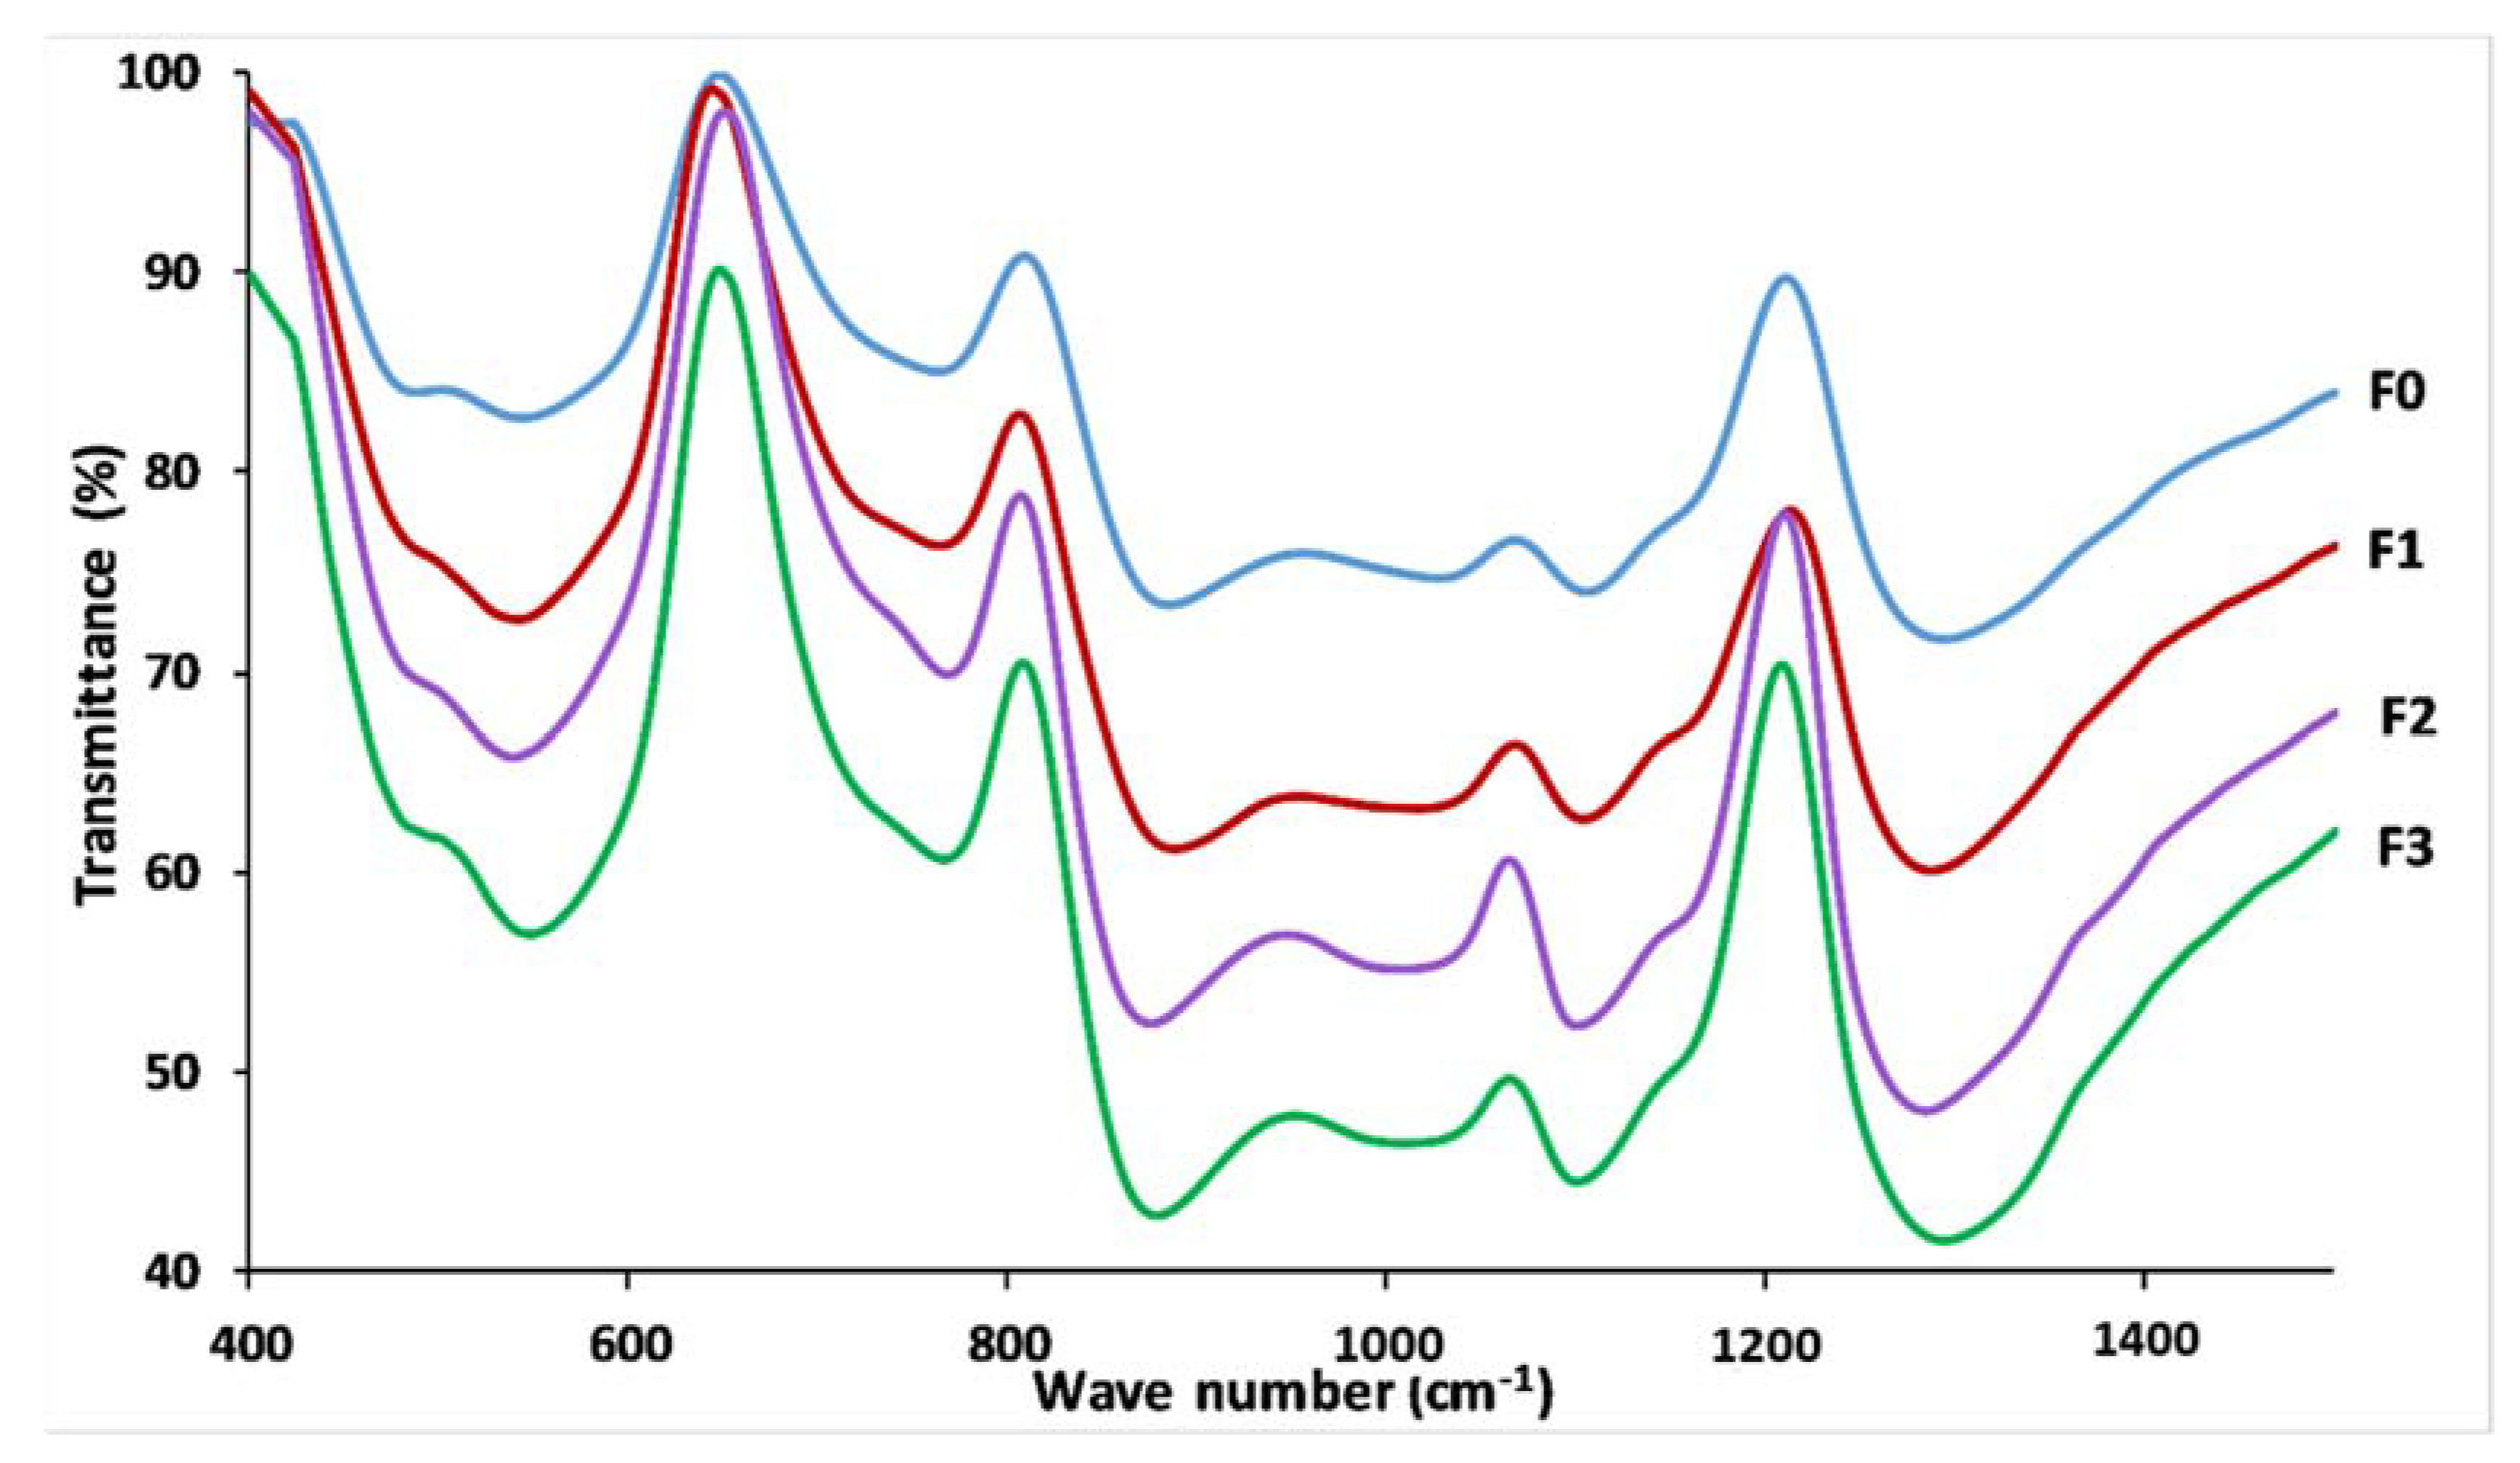
Figure 6 represents the FTIR spectra for the studied glasses in the range between 400 and 1400 cm−1, which shows no significant difference between the four formulas; this indicated that the prepared glasses have similar chemical functional groups and similar chemical bonding. The feature at around 1290 cm−1 is assigned to the asymmetric stretching of (PO2) in the phosphate tetrahedron Q2, υas (PO2). The FTIR bands observed at 1155–1160 cm−1 are characteristic of the symmetric stretching of (PO2) in Q2 groups. The vibration of the band about 1100 cm−1 is attributed to the υs PO32− stretching vibrations, while the feature at 955–1080 cm−1 is attributed to the stretching vibration υas O–P–O band in the phosphate tetrahedron Q1. The two absorption peaks at 880 and 715 cm−1 are attributed to asymmetric and symmetric stretching of the P–O–P in Q2 groups, respectively. While the band at around 765 cm−1 is assigned to the P–O–P stretching vibrations Q1 species, bands between 550 and 480 cm−1 are assigned to bending vibration of O–P–O and PO32− bonds, respectively [26,38,44].
Raman and FTIR spectra suggest that the structure of these vitreous fertilizers resembles metaphosphates, and the network is composed essentially of Q2 units. However, the spectra also show the existence of Q1 units, generally result in the presence of shorter phosphate chains, which can explain the appearance of several Tc and Tf during thermal analyzes. Table 4 summarizes frequency ranges and assignments of the Raman and FTIR bands of the four glasses.

3.5. Dissolution Behavior

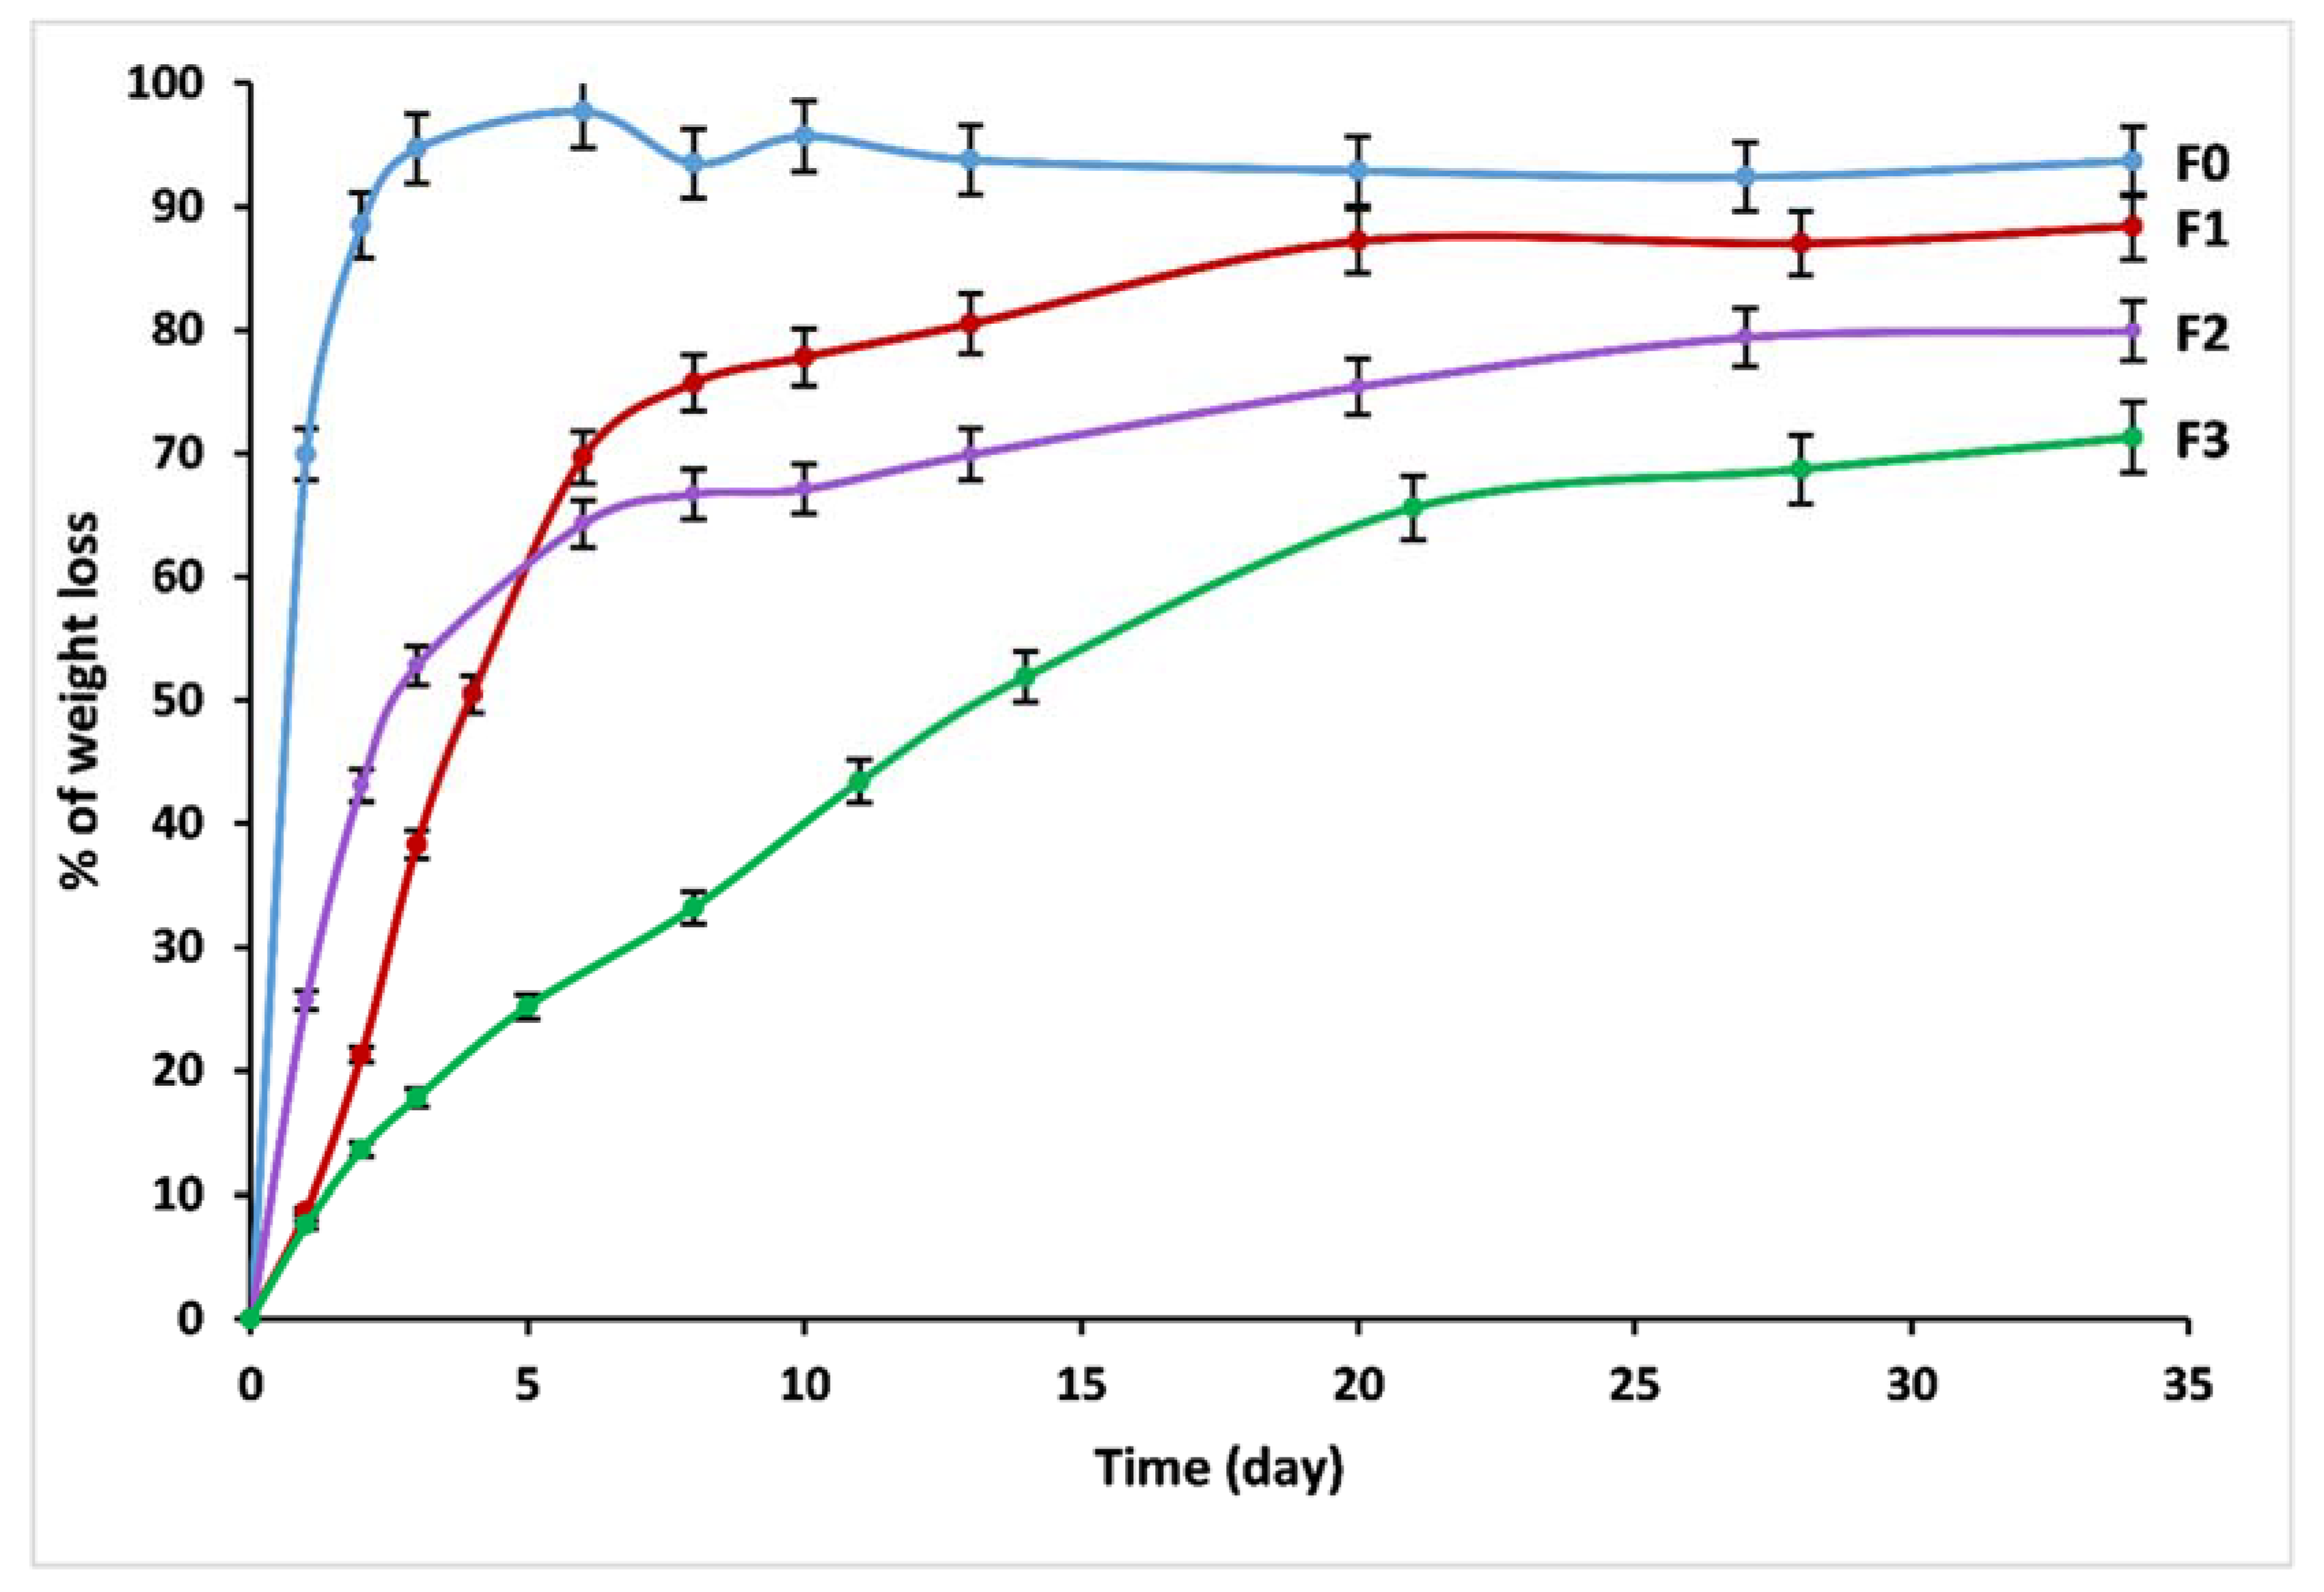
With increasing dissolution time in distilled water, the vitreous fertilizers exhibit an increased DR, as revealed in Figure 7. Chemical bonds between glass modifiers and glass formers are created due to the vitrification process. Consequently, if the glass stays undissolved, those modifiers cannot be liberated.
The dissolution of phosphate glass is the result of a set of complex mechanisms that depends not only on its physicochemical properties but also on the leaching conditions [45]. When glass particles are in contact with water, processes of inter-diffusion, ion-exchange, reaction–diffusion, and hydrolysis take place. These processes involve three dissolution rate regimes: (i) Initial diffusion, which reflects the exchange between protons in leachate solution and glass network-modifier cations. At the beginning of dissolution, water particles permeate into the glass, mobile alkali modifier ions undergo diffusional ion exchange with protons in the solution; (ii) Hydrolysis process which involves the hydrolysis of P-O-M bonds (with M = P, Mg, Ca, Zn, Fe, etc.), constituting the network structure of a glass [46]. Hydrolysis changes the phosphate network by attacking bridging bonds in the interphase formed by mobile elements’ release; and (iii) Rate drop, which is a transition between the initial rate and residual dissolution rate, as a result of the gradual saturation of the solution. This saturation induces a gradual rate decrease until a residual dissolution rate where the glass dissolution rate attains a relatively constant value, and thermodynamic equilibrium is approached—i.e., the chemical affinity for dissolution decreases [45,46].
The initial dissolution rates V0 (V0 = d m d t of the linear part of the dissolution curves) are given in Table 5. The chemical resistance of the glass is mainly dependent on its chemical composition. Formula F0 showed the highest dissolution rate, while F3 showed the lowest dissolution rate, followed by F2 and F1. The initial diffusion and hydrolysis process for F0 lasted only two days, with an initial dissolution rate V0 = 0.69 g/day. Almost the entirety was dissolved in water within less than four days. The degradation rate was found to decrease for F1 and F2 by incorporating iron and manganese into the glass matrix. The initial dissolution rates for these glasses were 0.14 and 0.17 g/day, respectively. The initial diffusion and hydrolysis process lasted between four and six days.
Hasan et al. [47] have studied the chemical durability of P2O5-Fe2O3-Na2O-CaO-MgO glasses and reported that Fe2O3 addition leads to the creation of more hydration resistant Fe-O-P bonds instead of P-O-P bonds, which increased cross-linking between the phosphate chains and improved the chemical durability of the glass.
Ahmina et al. [48] suggested that by adding MnO to phosphate glasses, the chemical resistance was enhanced due to the increase in the cross-link between the phosphate chains by the formation of P–O–Mn bonds. These changes can be explained by the effect of cation substitution on the glass network structure. The addition of MnO causes the phosphate network to shrink and produce more entangled and networked metaphosphate chains.
In all the investigations above, MnO and Fe2O3 can both improve the durability of phosphate glasses; however, this study showed that Fe2O3 was much more effective in decreasing the initial degradation rate, while MnO had a greater effect on decreasing the residual rate. The admixture of Fe and Mn, in addition to other elements such as Zn, B, Cu, and Mo, in a phosphate glass network (F3) induces a rapid improvement in the chemical durability, which may be related to the strengthening of the bonds between non-bonding oxygen atoms and cations, leading to an overall network reticulation effect. The hydration process based on ion exchange between the cations in phosphate chains and water becomes thermodynamically less favorable with the increase of the cross-linking between the chains. Glass F3 has a V0 = 0.03 g/day; after 34 days, it had not yet reached the saturation stage, with a weight loss of only 71%.
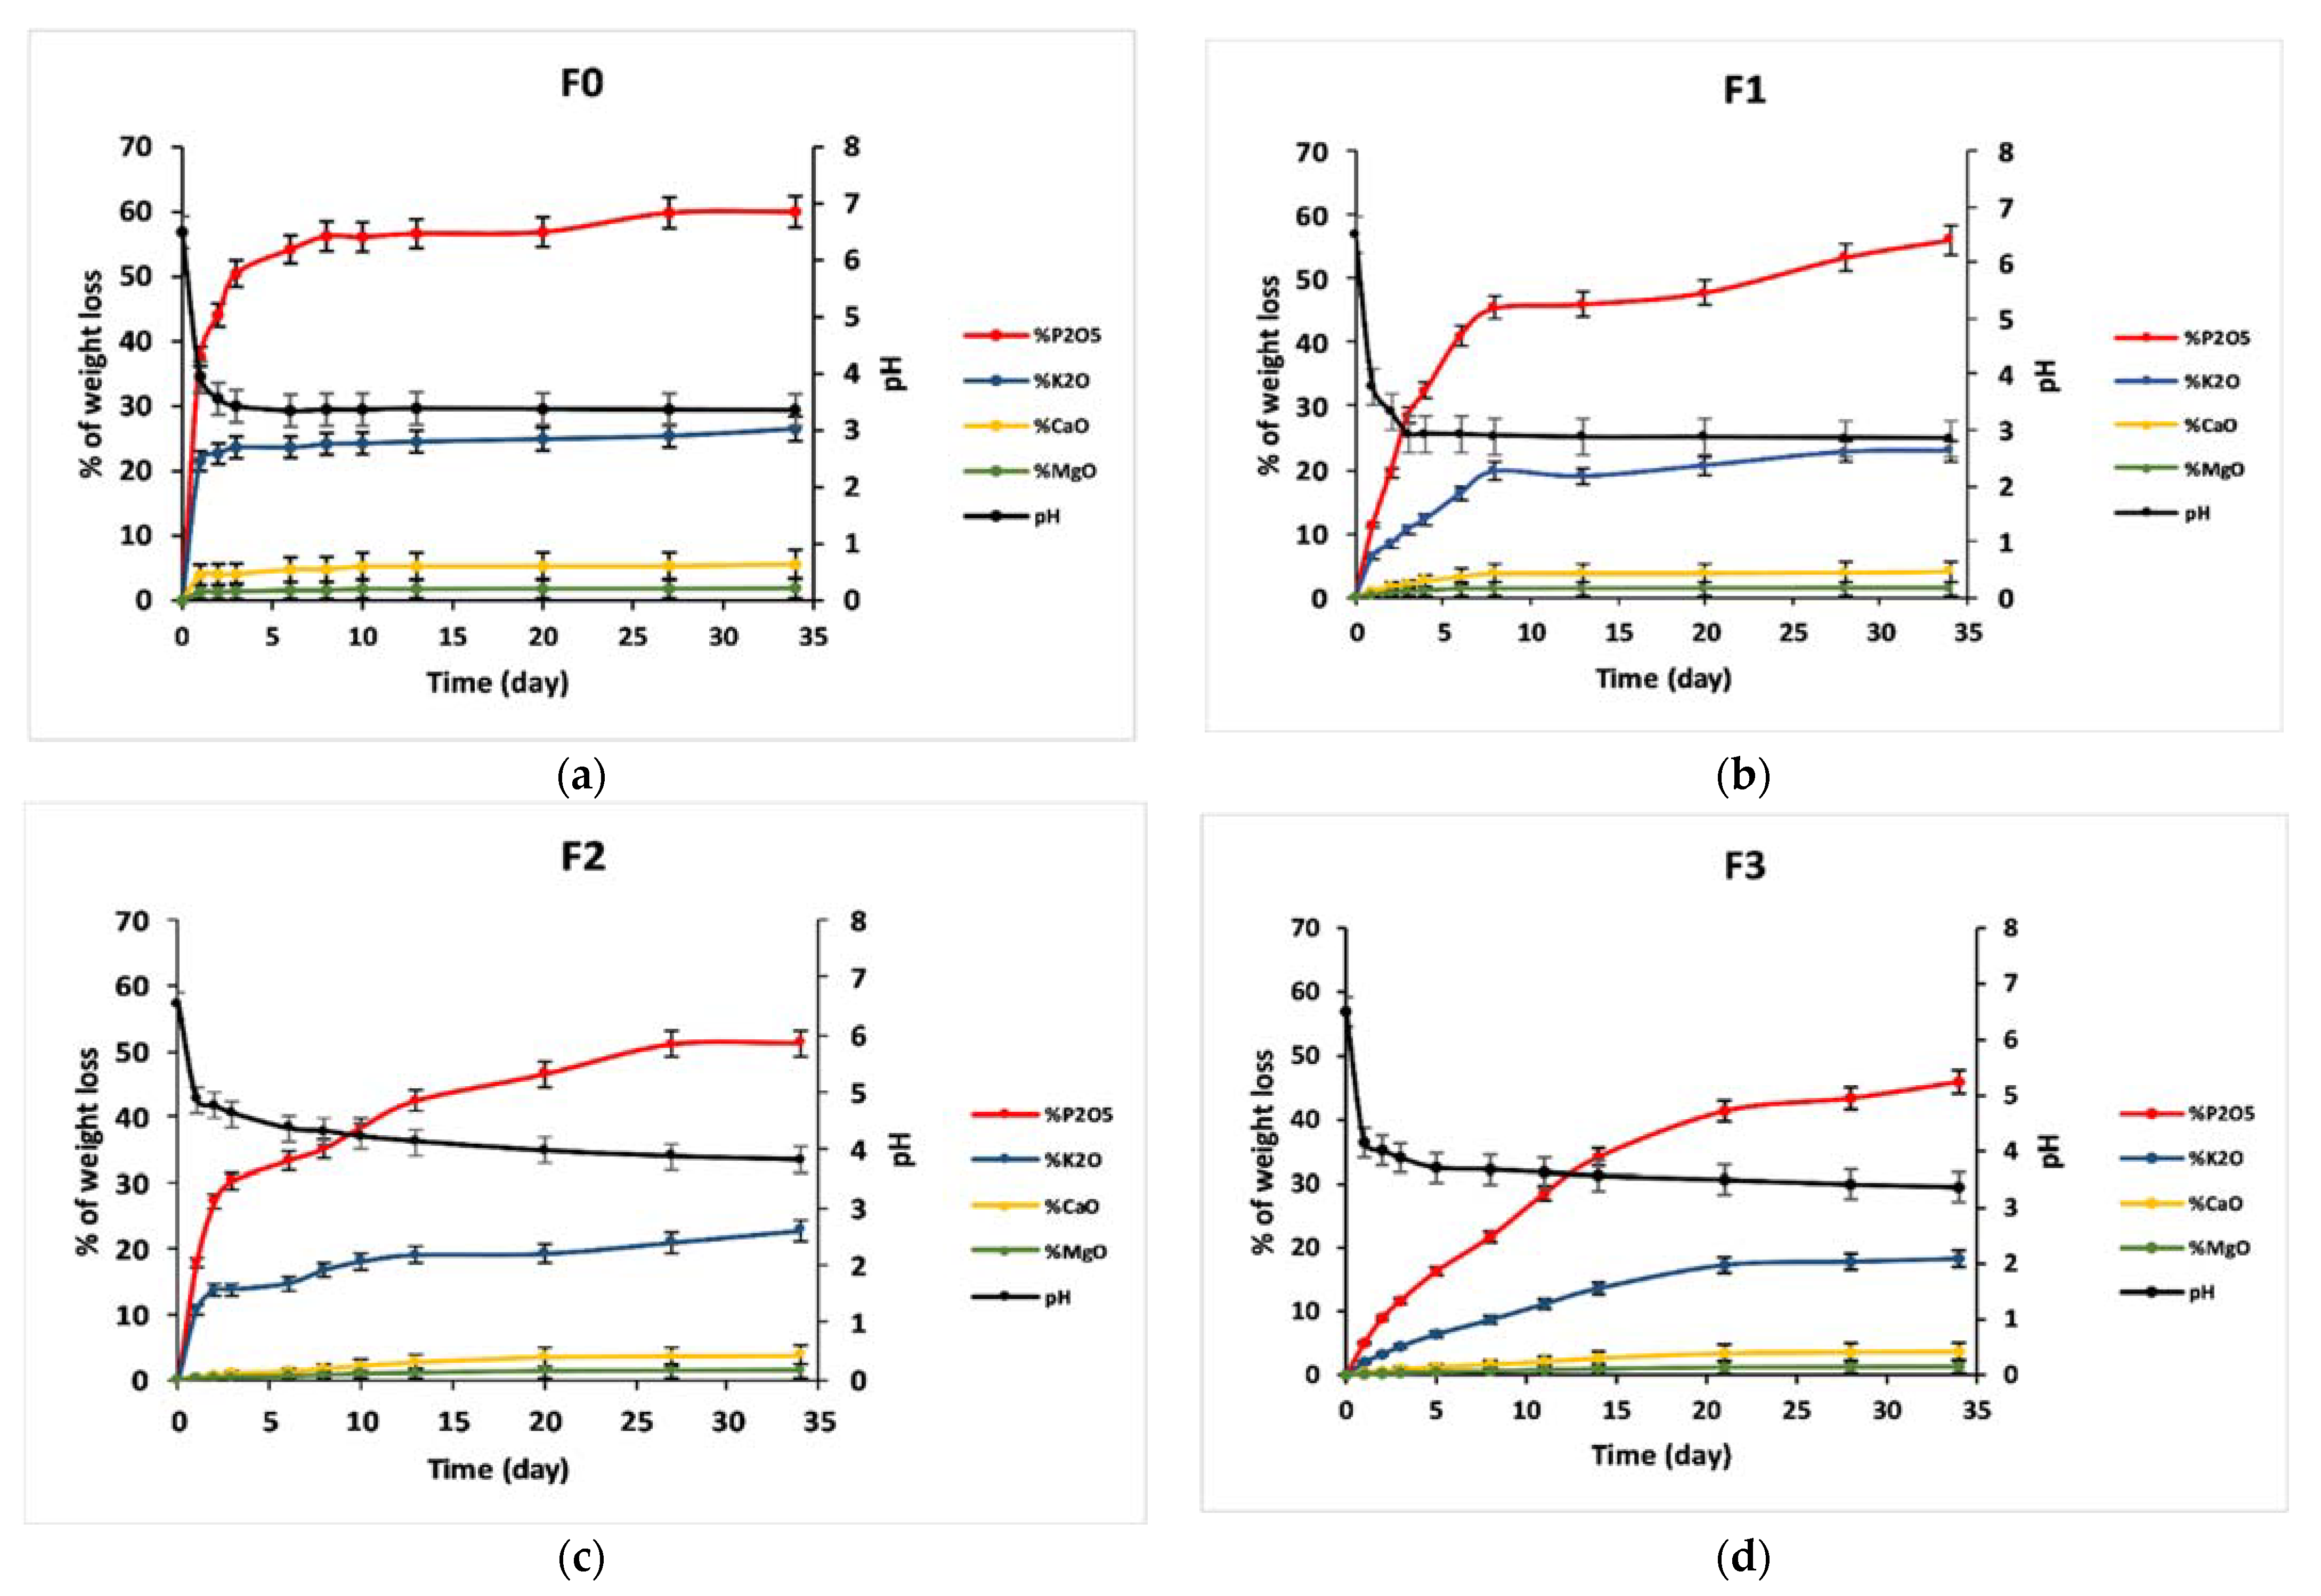
Amounts of released elements from vitreous fertilizers to the leachate solution were determined using the ICP-OES, in the form of oxides normalized to the initial glass weight, and the pH measurements are presented in Figure 8 and Figure 9. The percentage of released ions increased over time. For F0, amounts of P, K, Ca, and Mg in distilled water were significantly enhanced during the first two days of immersion. While for glasses F1, F2, and F3, the effect of the addition of microelements, which resulted in a slower release of ions in water, has been noted. For the four glass formulations, the presence of entire elements in the analyzed solutions, with a percentage comparable to the glass composition, suggests that the glasses dissolved congruently, and no selective leaching occurred [49]. The pH of the leachate solutions changed after immersion of glasses in distilled water. pH diminished linearly with dissolution time from 6.5 to attain the acidic range for all the studied fertilizers, then remained almost unchanged during periods of immersion. Previous studies showed the leachate solution’s pH varied with phosphate content of the immersed glass, with higher phosphorus contents in the solution resulting in lower pH values [50]. However, even though formula F0 releases more phosphorus, formula F1 achieves a lower pH value. This can be explained by the fact that with the addition of iron, the metaphosphate chains are broken into smaller groups of short-chain phosphates such as P4O136−, P3O105− and P2O74−, which are linked to iron through P–O–Fe bonds [51]. This phenomenon was not noted during the structural characterization by FTIR and Raman, which means that these short chains are in small quantities but have a remarkable effect on the pH.

3.6. Growth Parameters

The application of F1 treatments mainly improved plant height, fresh and dry shoot weight, fresh ear weight, and the number of grains per plant, and the F2 treatments mainly improved leaf area, fresh and dry root weight, and 1000 grain weight compared to the control and NPK treatments (Table 6). On the other hand, the F0 and F3 treatments increased the root length and dry ear weight, respectively, compared to the control and NPK treatments. Ouis et al. [52] reported an improvement of ears, straw, grains, and maize yield under field conditions after applying vitreous fertilizers (SiO2, P2O5, K2O, Fe2O3, CuO). In addition, Abou-Baker et al. [53] reported the same results using vitreous fertilizers containing the same elements in addition to ZnO and CuO.
Considering the maximum values of improvement, fresh and dry shoot weight, fresh ear weight, and the number of grains per plant showed a maximum improvement with the application of F1 (F1 R1 (30% to 58%) and F1 R2 (18% to 61%)) (Table 6). On the other hand, plant height and root length, fresh root weight, and weight of 1000 gain showed a maximum increase after the application of F2 (F2 R1 (23% to 64%) and F2 R2 (23% to 159%)). In addition, root and ear dry weights and grain weight per plant showed a maximum improvement after the application of F3 (F3 R1 + N (63 to 188%) and F3 R2 (85 to 140%)). The leaf area exhibited a maximum improvement after the application of F0 R2 (28%). The positive effect of the vitreous fertilizers on growth traits (especially F1 and F2) could be explained by the high rates of release of different mineral elements contained in the vitreous fertilizers [54].

3.7. Photosynthetic Parameters

The stomatal conductance (gs) and photosystem II efficiency (Fv/Fm) were increased by 32% and 13%, respectively, with the application of NPK fertilizer compared to the control. The gs was increased by 70% in plants treated with vitreous fertilizers (34% for F0, 45% for F1, 47% for F2, and 107% for F3) (Table 6), while Fv/Fm was increased by 14% with the application of these fertilizers (11% for F0, 13% for F1, 16% for F2, and 18% for F3). The F2 provided the highest percentages of improvement of these two parameters (151% (F2 R1) and 116% (F2 R2 + N) for gs and 24% (F2 R2) for Fv/Fm). The improvements in these photosynthetic attributes by the application of vitreous fertilizers could be explained by the key role of these amendments in providing essential elements such as potassium, magnesium, copper, iron, and manganese, which are involved in many photosynthetic related processes and biomolecules, including stomata movements and photosynthetic pigments and enzymes. Ion et al. [55] demonstrate that the application of vitreous fertilizers improved grapevine nutrition, in particular K and Mg uptake, which can stimulate many metabolism pathways, such as the regulation of stomatal exchanges as well as the balance of hormones such as ABA and thereby the photosynthesis functioning [56]. The absorption of the essential nutrients included in the vitreous fertilizers boosts wheat growth and yield performances.
Based on the number of the improved parameters and the maximum values of this improvement, F1, F2, and F3 were distinguished in comparison to the control, NPK and F0 treatments especially with R2 application (1 g/plant). It seems that these three effective formulations could be suitable for a large-scale application in the open field to further investigate the performance of the applied vitreous fertilizers.

4. Conclusions

Physico-chemical properties, structure, and dissolution behaviors of four phosphate glasses, elaborated according to wheat nutrient requirements, have been investigated in this study. It was confirmed that the prepared vitreous fertilizers are amorphous, Raman and FTIR spectra showed that their structure approaches metaphosphates, and the network is formed essentially of Q2 units. This study showed an increase in glass transition temperature (Tg), the onset crystallization temperature (Tc), liquidus temperature (Tf), and glass stability accompanied by a decrease in the molar volume (VM) and glass dissolution with incorporating trace elements such as Fe2O3 and MnO. It was suggested that these behaviors are due to stronger cross-linking of the phosphate chains and the replacement of the easily hydrated P-O-P bond by a more chemically resistant M-O-P bond (M = Fe, Mn, Zn, Mo, etc.). Moreover, for all glasses, no selective ion leaching was observed, and the dissolution was congruent. The prepared vitreous fertilizers, in particular F1, F2, and F3, showed a boosting effect on wheat growth, photosynthetic, and yield traits compared to non-amended and NPK treatments, suggesting the importance of considering the use of these fertilizers in large-scale application to improve crop production with no harm to the environment.

Author Contributions

Conceptualization, M.M.; Data curation, T.L., M.A.-E.-M.; Formal analysis, T.L. and M.K.; Investigation, T.L., M.A.-E.-M.; Methodology, T.L., M.M., A.M. and M.A.-E.-M.; Project administration, M.M.; Resources, M.K.; Software, T.L. and M.A.-E.-M.; Supervision, M.M., A.M. and Y.A.; Validation, M.M., A.M., Y.A. and M.K.; Writing—original draft, T.L., M.A.-E.-M.; Writing—review and editing, T.L., M.A.-E.-M., M.M., Y.A., A.M. and M.K. All authors have read and agreed to the published version of the manuscript.

Funding

This work was supported by the OCP Foundation [grant number: VAL-MES-01/2017].

Institutional Review Board Statement

Not applicable.

Informed Consent Statement

Not applicable.

Data Availability Statement

Data is contained within the article.

Acknowledgments

The authors would like to acknowledge the support through the R and D Initiative—Appel à projets autour des phosphates APPHOS—sponsored by OCP (OCP Foundation, R and D OCP, Mohammed VI Polytechnic University, National Center of Scientific and Technical Research CNRST, Ministry of Higher Education, Scientific Research and Professional Training of Morocco MESRSFC) under the project entitled “Elaboration et caractérisation de nouveaux engrais vitrifiés à base des phosphates”, project ID VAL-MES- 01/2017.We thank our sponsors who provided insight, expertise, and follow-up that greatly assisted this research.

Conflicts of Interest

The authors declare no conflict of interest.

References

  1. ONU. World Population Prospects; No. 141; United Nations, Department of economics and Social Affairs: New York, NY, USA, 2019. [Google Scholar]
  2. Doering, O.; Sorensen, A. The Land that Shapes and Sustains us. In How to Feed World; Food and Agriculture Organization of the United Nations: Rome, Italy, 2018; pp. 46–58. [Google Scholar]
  3. Schmidhuber, J.; Bruinsma, J.; Boedeker, G. Capital requirements for agriculture in developing countries to 2050, FAO Expert Meet. In How to Feed World 2050; Food and Agriculture Organization of the United Nations, Economic and Social Development Department: Rome, Italy, 2009; p. 21. [Google Scholar]
  4. McKenzie, F.C.; Williams, J. Sustainable food production: Constraints, challenges and choices by 2050. Food Secur. 2015, 7, 221–233. [Google Scholar] [CrossRef]
  5. Fróna, D.; Szenderák, J.; Rákos, M.H. The challenge of feeding the poor. Sustainability 2019, 11, 5816. [Google Scholar] [CrossRef] [Green Version]
  6. Shiferaw, B.; Prasanna, B.M.; Hellin, J.; Bänziger, M. Crops that feed the world 6. Past successes and future challenges to the role played by maize in global food security. Food Secur. 2011, 3, 307–327. [Google Scholar] [CrossRef] [Green Version]
  7. Snapp, V.; Morrone, S. Perennial Wheat. Michigan State Univ. Ext. Bull. 2014, E3208, 1–3. [Google Scholar]
  8. Curtis, T.; Halford, N.G. Food security: The challenge of increasing wheat yield and the importance of not compromising food safety. Ann. Appl. Biol. 2014, 164, 354–372. [Google Scholar] [CrossRef] [PubMed] [Green Version]
  9. Scherr, S.J.; Yadav, S.N. Land Degradation in the Developing World: Implications for Food, Agriculture, and the Environment to 2020; International Food Policy Research Institute (IFPRI): Washington, DC, USA, 1996; p. 14. [Google Scholar]
  10. Belaid, A.; Morris, M.L. Wheat and Barley Production in Rainfed Marginal Environments of West Asia and North Africa: Problems and Prospects; CIMMYT Economics Working Paper; CIMMYT: Mexico City, Mexico, 1991; pp. 1–28. [Google Scholar]
  11. Ait-El-Mokhtar, M.; Boutasknit, A.; Ben-Laouane, R.; Anli, M.; El Amerany, F.; Toubali, S.; Lahbouki, S.; Wahbi, S.; Meddich, A. Vulnerability of Oasis Agriculture to Climate Change in Morocco. In Impacts of Climate Change on Agriculture and Aquaculture; IGI Global: Hershey, PA, USA, 2019; pp. 76–106. [Google Scholar]
  12. FAOSTAT. 2020. Available online: http://www.fao.org/faostat/en/#home (accessed on 8 November 2020).
  13. Prashar, P.; Shah, S. Impact of Fertilizers and Pesticides on Soil Microflora in Agriculture. Sustain. Agric. Rev. 2016, 331–361. [Google Scholar] [CrossRef]
  14. Government Canada. Effects of Manure and Fertilizer on Soil Fertility and Soil Quality; Agriculture and Resource Development Departement: Big Lakes County, AB, Canada, 2013; p. 74.
  15. Hazra, G.; Das, T. A Review on Controlled Release Advanced Glassy Fertilizer. Glob. J. Sci. Front. Res. B Chem. 2014, 14, 4. [Google Scholar]
  16. Rubio, J.; Rodríguez, R.; Ciruelos, A.; Ruiz, O.; Lozano, P.A.; De La Torre, R. New glass fertilizer for tomato crops to reduce environmental impact. Acta Hortic. 2017, 1159, 65–72. [Google Scholar] [CrossRef]
  17. Karapetyan, G.; Karapetyan, K.; Maksimov, L. Glassy Environmentally Friendly Action Fertilizers of Prolonged. Phosphorus Res. Bull. 2004, 15, 60–67. [Google Scholar] [CrossRef]
  18. Mandal, B.; Hazra, G.; Ghosh, G.K.; Das, T. Leaching pattern of phosphate glass fertilizers with different compositions under Soxhlet distillation conditions. Ceramica 2020, 66, 250–255. [Google Scholar] [CrossRef]
  19. Labbilta, T.; Mesnaoui, M.; Aouad, H.; Abouliatim, Y.; Khouloud, M.; Abielaala, L. Study of the Effect of Calcium Substitution by Magnesium in the Vitreous System 3P2O5-2K2O-(1 − x) CaO-x MgO. Materials 2020, 13, 2637. [Google Scholar] [CrossRef]
  20. Ahmina, W.; El Moudane, M.; Zriouil, M.; Taibi, M. Role of manganese in 20K2O-xMnO-(80-x)P2O5 phosphate glasses and model of structural units. J. Mater. Environ. Sci. 2016, 7, 694–699. [Google Scholar]
  21. Wacławska, I.; Szumera, M.; Stoch, P.; Sitarz, M. Structural role of Fe in the soil active glasses. Spectrochim. Acta Part A Mol. Biomol. Spectrosc. 2011, 79, 728–732. [Google Scholar] [CrossRef] [PubMed]
  22. Ouis, M.A.; Ghoneim, N.A.; ElBatal, H.A.; Shedeed, S.I. Evaluation of the Suitability of Agriglasses Containing ZnO for Plant Fertilization. Silicon 2012, 4, 61–71. [Google Scholar] [CrossRef]
  23. Szumera, M.; Wačawska, I. Effect of molybdenum addition on the thermal properties of silicate-phosphate glasses. J. Therm. Anal. Calorim. 2012, 109, 649–655. [Google Scholar] [CrossRef]
  24. Sułowska, J.; Wacławska, I.; Olejniczak, Z. Effect of glass composition on the interactions between structural elements in Cu-containing silicate-phosphate glasses. J. Therm. Anal. Calorim. 2014, 116, 51–59. [Google Scholar] [CrossRef] [Green Version]
  25. Tan, C.; Ifty, A.; Andrew, J.P.; Nusrat, S.; Chenkai, Z.; Jinsong, L.; Chris, D.R.; Xiaoling, L. Structural, thermal and dissolution properties of MgO- and CaO-containing borophosphate glasses: Effect of Fe2O3 addition. J. Mater. Sci. 2017, 52, 7489–7502. [Google Scholar] [CrossRef]
  26. Makhlouk, R.; Beloued, N.; Aqdim, S. Study of Chromium-Lead-Phosphate Glasses by XRD, IR, Density and Chemical Durability. Adv. Mater. Phys. Chem. 2018, 08, 269–280. [Google Scholar] [CrossRef] [Green Version]
  27. Ahmed, A.A.; Ali, A.A.; El-Fiqi, A. Glass-forming compositions and physicochemical properties of degradable phosphate and silver-doped phosphate glasses in the P2O5 -CaO-Na2O-Ag2O system. J. Mater. Res. Technol. 2019, 8, 1003–1013. [Google Scholar] [CrossRef]
  28. Elalaoui, A.C. Fertilisation Minérale des Cultures: Les élèments fertilisants majeurs (N, P, K). Transf. Technol. Agric. 2007, 155, 4. [Google Scholar]
  29. Baker, N.R. Chlorophyll fluorescence: A probe of photosynthesis in vivo. Annu. Rev. Plant Biol. 2008, 59, 89–113. [Google Scholar] [CrossRef] [PubMed] [Green Version]
  30. Bellucci, D.; Sola, A.; Salvatori, R.; Anesi, A.; Chiarini, L.; Cannillo, V. Role of magnesium oxide and strontium oxide as modifiers in silicate-based bioactive glasses: Effects on thermal behaviour, mechanical properties and in-vitro bioactivity. Mater. Sci. Eng. C 2017, 72, 566–575. [Google Scholar] [CrossRef] [PubMed]
  31. Akamatsu, H.; Fujita, K.; Murai, S.; Tanaka, K. Magneto-optical properties of transparent divalent iron phosphate glasses. Appl. Phys. Lett. 2008, 92, 90–93. [Google Scholar] [CrossRef] [Green Version]
  32. Elisa, M.; Grigorescu, C.; Vasiliu, I.; Bulinski, M.; Kuncser, V.; Dana, P.; Filoti, G.; Meghea, A.; Iftimie, N.; Giurginca, M.; et al. Optical characterization of the phosphate glasses containing pair transition ions. Opt. Quantum Electron. 2007, 39, 523–531. [Google Scholar] [CrossRef]
  33. Machado, I.E.C.; Prado, L.; Gomes, L.; Prison, J.M.; Martinelli, J.R. Optical properties of manganese in barium phosphate glasses. J. Non-Cryst. Solids 2004, 348, 113–117. [Google Scholar] [CrossRef]
  34. Dietzel, A.Z. Die Kationenfeldstärken und ihre Beziehungen zu Entglasungsvorgängen, zur Verbindungsbildung und zu den Schmelzpunkten von Silicaten. Phys. Chem. Chem. Phys. 2010, 48, 9–23. [Google Scholar]
  35. Schwarz, J.; Tichá, H.; Tichý, L.; Mertens, R. Physical properties of PbO-ZnO-P2O5 glasses I. Infrared and Raman spectra. J. Optoelectron. Adv. Mater. 2004, 6, 737–746. [Google Scholar]
  36. Franks, K.; Abrahams, I.; Georgiou, G.; Knowles, J.C. Investigation of thermal parameters and crytallisation in a ternary CaO-Na2O-P2O5 based glass system. Biomaterials 2000, 22, 497–501. [Google Scholar] [CrossRef]
  37. Omrani, R.O.; Krimi, S.; Videau, J.J.; Khattech, I.; El Jazouli, A.; Jemal, M. Structural investigations and calorimetric dissolution of manganese phosphate glasses. J. Non-Cryst. Solids 2014, 389, 66–71. [Google Scholar] [CrossRef]
  38. Nian, S.; Zhang, Y.; Li, J.; Zhou, N.; Zou, W. Glass formation and properties of sodium zinc phosphate glasses doped with ferric oxide. Adv. Appl. Ceram. 2018, 117, 319–327. [Google Scholar] [CrossRef]
  39. Chaudhry, M.A.; Altaf, M. Electrical properties of Na2O-CdO-P2O5 glasses. Mod. Phys. Lett. B 2000, 14, 319–326. [Google Scholar] [CrossRef]
  40. Kiani, A.; Hanna, J.V.; King, S.P.; Rees, G.J.; Smith, M.E.; Roohpour, N.; Salih, V.; Knowles, J.C. Structural characterization and physical properties of P2O5-CaO-Na2O-TiO2 glasses by Fourier transform infrared, Raman and solid-state magic angle spinning nuclear magnetic resonance spectroscopies. Acta Biomater. 2012, 8, 333–340. [Google Scholar] [CrossRef] [PubMed]
  41. Videau, J.J.; El Hadrami, A.; Labrugère, C.; Couzi, M.; Montagne, L.; Mesnaoui, M.; Maazaz, M. Structural influence of alumina in Zn-Cd-Pb phosphate glasses. Phys. Chem. Glas. Eur. J. Glas. Sci. Technol. Part B 2007, 48, 363–372. [Google Scholar]
  42. Velli, L.L.; Varsamis, C.P.E.; Kamitsos, E.I.; Möncke, D.; Ehrt, D. Structural investigation of metaphosphate glasses. Phys. Chem. Glas. 2005, 46, 178–181. [Google Scholar]
  43. Karakassides, M.A.; Saranti, A.; Koutselas, I. Preparation and structural study of binary phosphate glasses with high calcium and/or magnesium content. J. Non-Cryst. Solids 2004, 347, 69–79. [Google Scholar] [CrossRef]
  44. Griebenow, K.; Bragatto, C.B.; Kamitsos, E.I.; Wondraczek, L. Mixed-modifier effect in alkaline earth metaphosphate glasses. J. Non-Cryst. Solids 2018, 481, 447–456. [Google Scholar] [CrossRef]
  45. Ma, T.; Jivkov, A.P.; Li, W.; Liang, W.; Wang, Y.; Xu, H.; Han, X. A mechanistic model for long-term nuclear waste glass dissolution integrating chemical affinity and interfacial diffusion barrier. J. Nucl. Mater. 2017, 486, 70–85. [Google Scholar] [CrossRef] [Green Version]
  46. Utton, C.A.; Hand, R.J.; Bingham, P.A.; Hyatt, N.C.; Swanton, S.W.; Williams, S.J. Dissolution of vitrified wastes in a high-pH calcium-rich solution. J. Nucl. Mater. 2013, 435, 112–122. [Google Scholar] [CrossRef]
  47. Hasan, M.S.; Ahmed, I.; Parsons, A.J.; Walker, G.S.; Scotchford, C.A. Material characterisation and cytocompatibility assessment of quinternary phosphate glasses. J. Mater. Sci. Mater. Med. 2012, 23, 2531–2541. [Google Scholar] [CrossRef]
  48. Ahmina, W.; El Moudane, M.; Shaim, A.; Zriouil, M.; Taibi, M. Chemical durability, electrical and dielectric properties of the ternary system (50-x)K2O-xMnO-50P2O5 phosphate glasses. Mater. Today Proc. 2019, 13, 466–473. [Google Scholar] [CrossRef]
  49. Papadopoulos, N.; Drosou, C.A. Influence of weather conditions on glass properties. J. Univ. Chem. Technol. Metall. 2012, 47, 429–438. [Google Scholar]
  50. Döhler, F.; Mandlule, A.; Van Wüllen, L.; Friedrich, M.; Brauer, D.S. 31P NMR characterisation of phosphate fragments during dissolution of calcium sodium phosphate glasses. J. Mater. Chem. B 2015, 3, 1125–1134. [Google Scholar] [CrossRef] [PubMed] [Green Version]
  51. Reis, S.T.; Karabulut, M.; Day, D.E. Chemical durability and structure of zinc-iron phosphate glasses. J. Non-Cryst. Solids 2001, 292, 150–157. [Google Scholar] [CrossRef]
  52. Abou-Baker, N.H.; Ouis, M.; Abd-Eladl, M. Appraisal of Agriglass in Promoting Maize Production Under Abiotic Stress Conditions. Silicon 2018, 10, 1841–1849. [Google Scholar] [CrossRef]
  53. Ouis, M.A.; Abd-Eladl, M.; Abou-Baker, N.H. Evaluation of Agriglass as an Environment Friendly Slow Release Fertilizer. Silicon 2016, 10, 293–299. [Google Scholar] [CrossRef]
  54. Bindraban, P.S.; Dimkpa, C.O.; Pandey, R. Exploring phosphorus fertilizers and fertilization strategies for improved human and environmental health. Biol. Fertil. Soils 2020, 56, 299–317. [Google Scholar] [CrossRef] [Green Version]
  55. Ion, M.; Şerdinescu, A.; Pîrcălabu, L.; Sava, M. Use of vitreous fertilizers with slow release of nutrients in viticulture. Curr. Trends Nat. Sci. 2012, 1, 101–106. [Google Scholar]
  56. Liu, H.; Shi, C.Y.; Zhang, H.; Wang, Z.Z.; Chai, S. Effects of potassium on yield, photosynthate distribution, enzymes’ activity and ABA content in storage roots of sweet potato (Ipomoea batatas Lam.). Aust. J. Crop Sci. 2013, 7, 735–743. [Google Scholar]
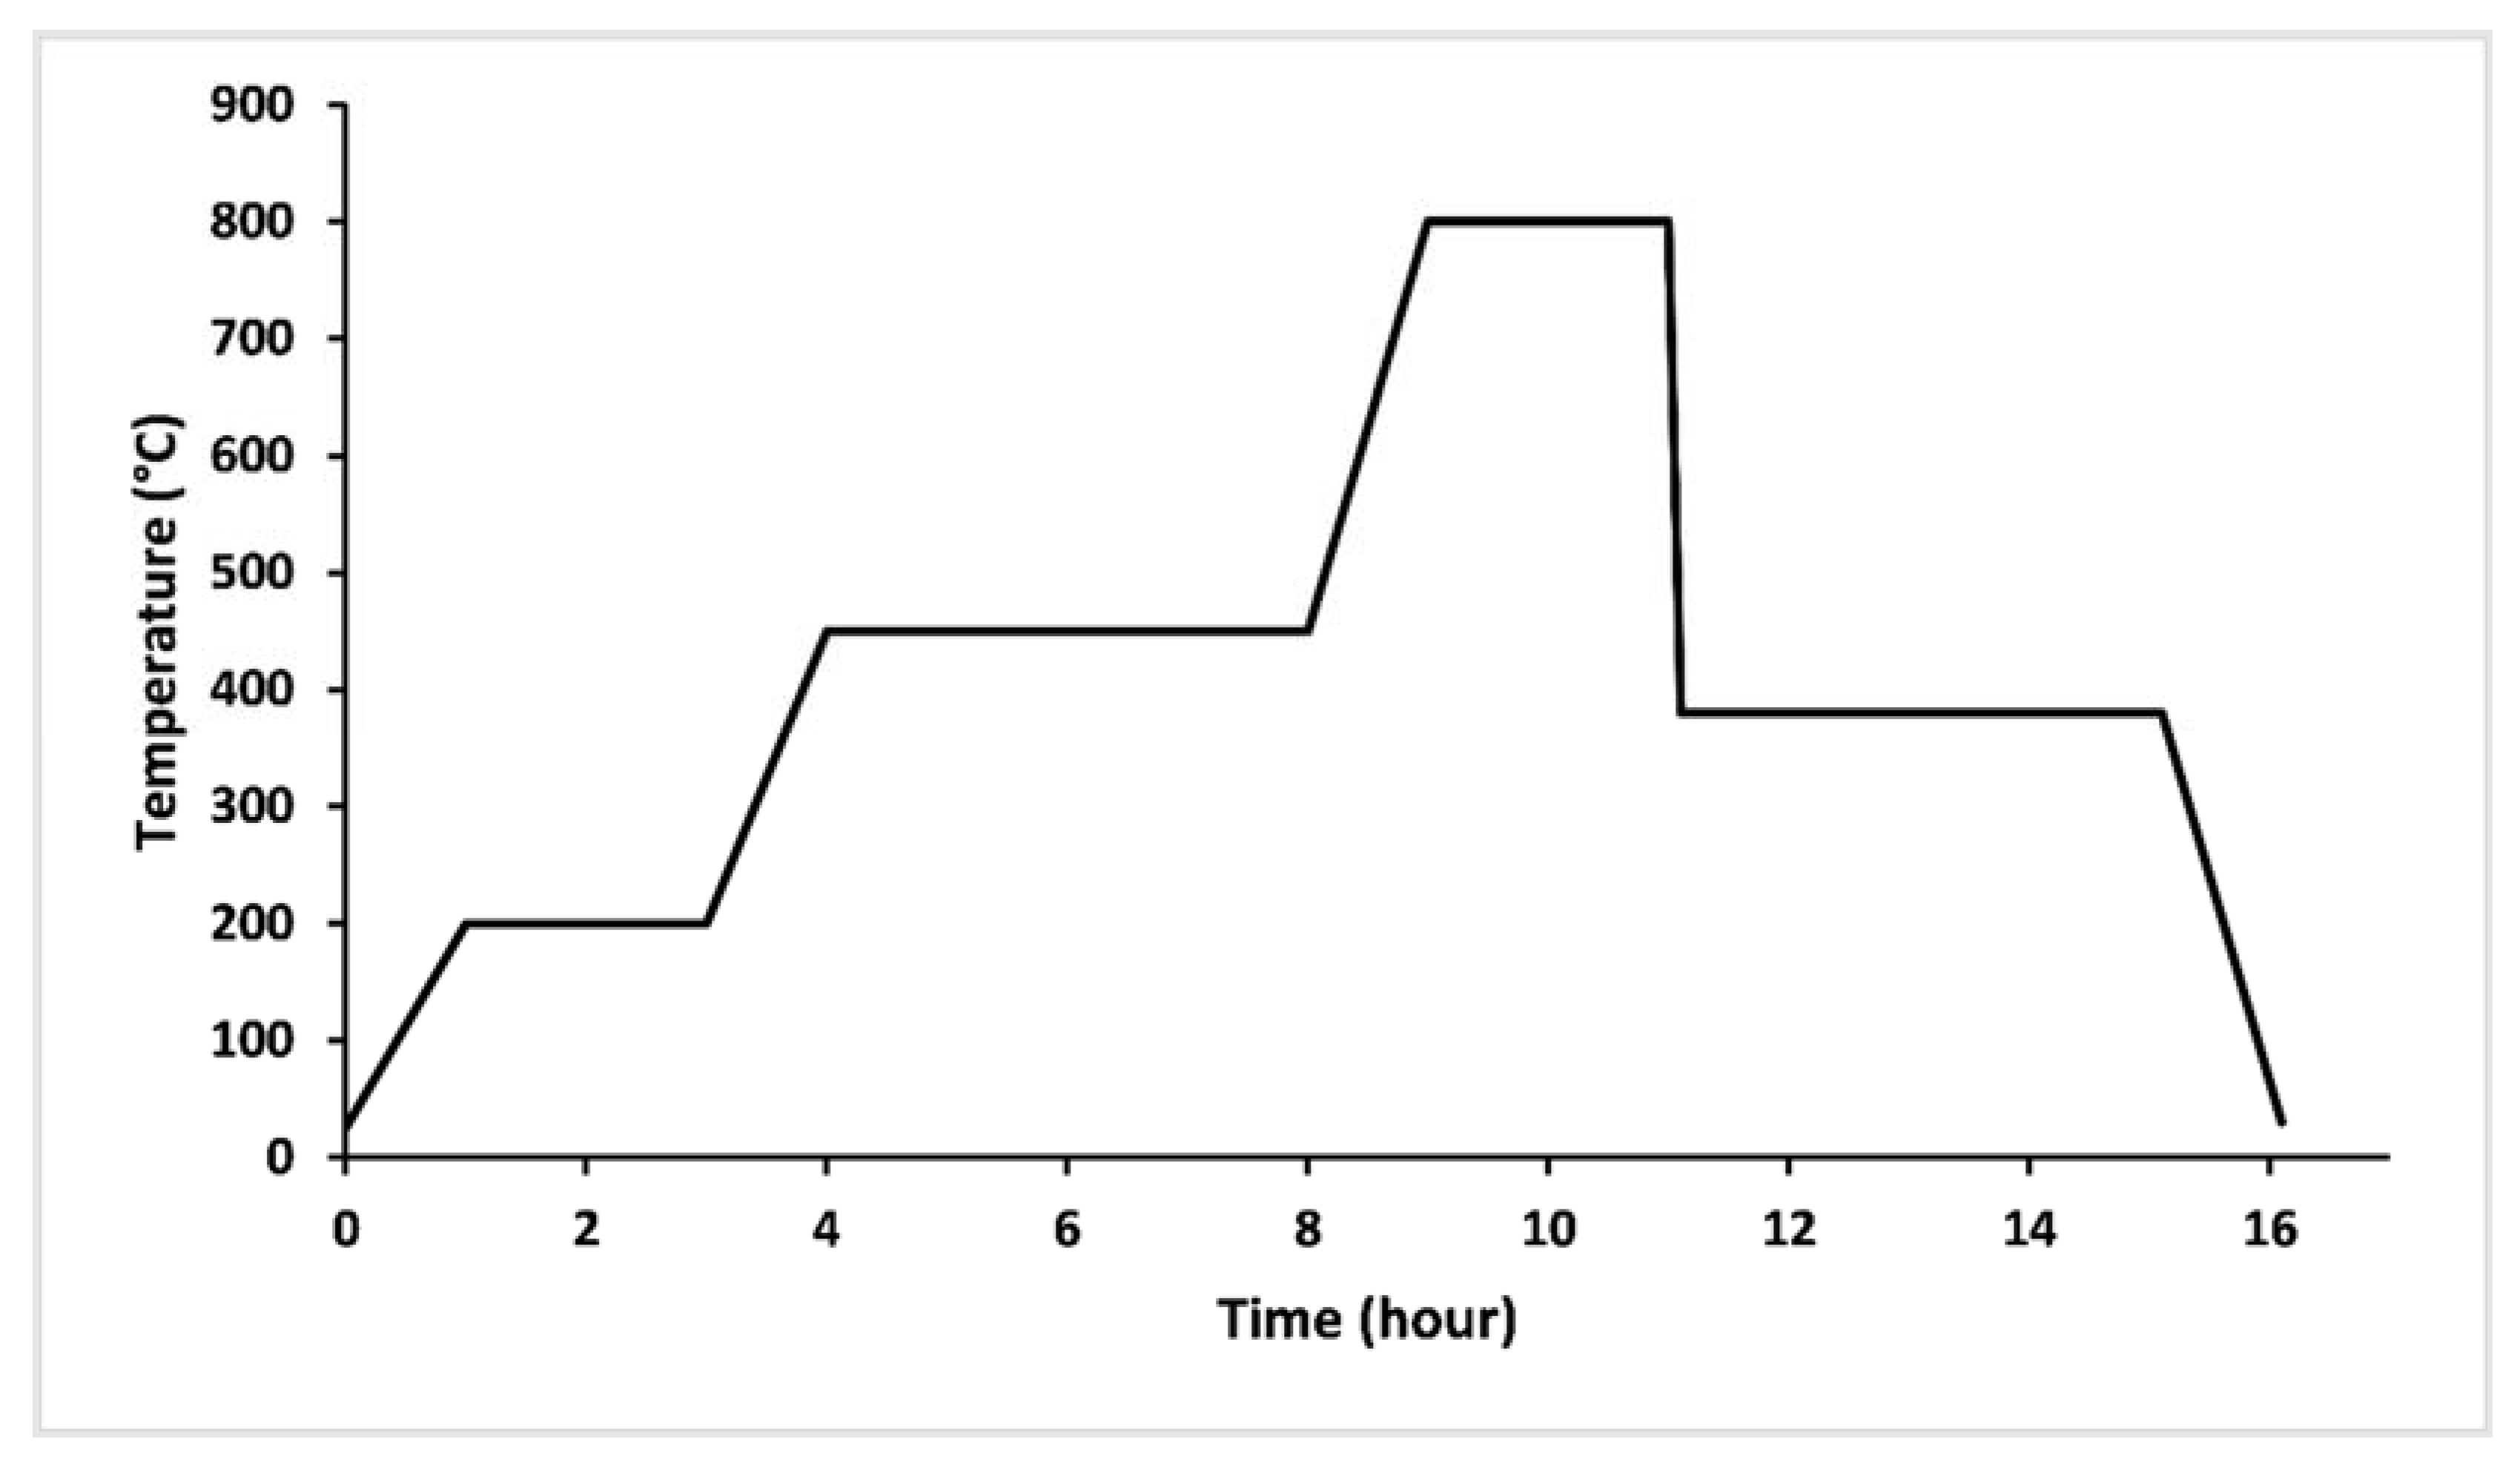
Figure 1. Thermal profile used to elaborate glasses.
Materials 14 01295 g001
Figure 2. XRD patterns for F0, F1, F2 and F3 glasses.
Materials 14 01295 g002
Figure 3. Differential scanning calorimetry curves of (a) F0, (b) F1, (c) F2, and (d) F3.
Materials 14 01295 g003
Figure 4. Molar Volume of F0, F1, F2, and F3 glasses.
Materials 14 01295 g004
Figure 5. Raman spectra of prepared glasses.
Materials 14 01295 g005
Figure 6. FTIR spectra of prepared glasses.
Materials 14 01295 g006
Figure 7. Trend of weight loss of F0, F1, F2 and F3 glasses.
Materials 14 01295 g007
Figure 8. Percentage of glass constituents (macro-elements) analyzed in the leachate solutions (elements in the form of oxides) normalized to the initial glass weight and pH measurements versus time for (a) F0, (b) F1, (c) F2, and (d) F3.
Materials 14 01295 g008
Figure 9. Percentage of glass constituents (micro-elements) analyzed in the leachate solutions (elements in the form of oxides) normalized to the initial glass weight for (a) F1, (b) F2, and (c) F3.
Materials 14 01295 g009
Table 1. Nominal and analyzed compositions of the vitreous fertilizers.
GlassNominal Compositions
% P2O5% K2O% CaO% MgO% Fe2O3% MnO% ZnO% B2O3% CuO% MoO3
F050.0033.3311.115.560.000.000.000.000.000.00
F150.8132.2610.755.380.810.000.000.000.000.00
F250.0032.8910.965.480.000.660.000.000.000.00
F350.7231.5110.505.250.790.630.320.160.110.02
Analyzed Compositions
% P2O5% K2O% CaO% MgO% Fe2O3% MnO% ZnO% B2O3% CuO% MoO3
F050.17 ± 1.0133.26 ± 0.8311.07 ± 0.245.50 ± 0.170.000.000.000.000.000.00
F150.64 ± 1.0032.43 ± 0.9010.52 ± 0.335.57 ± 0.170.84 ± 0.020.000.000.000.000.00
F249.94 ± 1.2233.07 ± 0.8210.78 ± 0.235.50 ± 0.210.000.71 ± 0.010.000.000.000.00
F350.99 ± 1.1931.45 ± 0.7810.37 ± 0.285.23 ± 0.150.77 ± 0.020.64 ± 0.010.26 ± 0.010.15 ± 0.020.13 ± 0.020.01 ± 0.01
Table 2. Glass transition (Tg) crystallization (Tc,on) melting (Tliq) temperatures and KH of prepared glasses.
GlassF0F1F2F3
Tg (°C)340 ± 2345 ± 2348 ± 1353 ± 1
Tc,on (°C)417 ± 5453 ± 2453 ± 3573 ± 2
Tliq (°C)658 ± 3699 ± 4670 ± 2709 ± 3
KH0.319 ± 0.0020.4391 ± 0.0010.484 ± 0.0020.528 ± 0.002
Table 3. Density of F0, F1, F2, and F3 glasses.
GlassF0F1F2F3
Density3.341 ± 0.0023.382 ± 0.0033.371 ± 0.0033.426 ± 0.005
Table 4. Assignments and frequency ranges (cm−1) of the FTIR and Raman bands of the prepared glasses.
Wave Number (cm−1)Assignment
F0F1F2F3-
FTIRRamanFTIRRamanFTIRRamanFTIRRaman
12961270128812691286127212961269Vas (PO2), Q2
11591174115511711151117411591172Vs (PO2), Q2
11071103110911011105110311051101Vs (PO32−), Q1
962–1074-956–1074-958–1072-956–1072-Vas (PO2), Q1
885-889-877-879-Vas (P-O-P), Q2
761758767758767759771760Vs (P-O-P), Q1
717691715691719690719689Vs (P-O-P), Q2
557382547385543383549386δ(PO2)
487296–332491294–336486301–340491290–335δ(PO32−)
* Abbreviations: as, asymmetric; s, symmetric; V, stretching; δ, bending.
Table 5. Initial dissolution rate of F0, F1, F2, and F3 glasses.
GlassF0F1F2F3
V0 (g/day)0.690.140.170.03
Table 6. Effects of vitreous fertilizers on the growth, physiology, and yield of wheat after four months of culture.
Fertilizer TreatmentPlant Height (cm)Root Length (cm)Number of Leaves Leaf Area (cm2)Shoot Fresh Weight (g)Shout Dry Weight (g)Root Fresh Weight (g)Root Dry Weight (g)Ear Fresh Weight (g)Ear Dry Weight (g)Total Grain Weight/Plant (g) Number of Grain/Plant1000 Grain Weight (g)Stomatal Conductance (mmol m−2 s−1)Fv/Fm
Control60.43 ± 1.34 j17.33 ± 0.58 i5.33 ± 0.58 d17.85 ± 0.26 h2.27 ± 0.61 f0.5 ± 0.13 g0.95 ± 0.20 h0.23 ± 0.05 h1.18 ± 0.27 f0.68 ± 0.12 h0.46 ± 0.05 ef18.67 ± 3.21 f16.78 ± 0.87 i17.63 ± 1.66 j0.65 ± 0.03 g
NPK fertilizer67.27 ± 0.25 i18.67 ± 0.58 ghi7.00 ± 0.00 a28.60 ± 2.20 d–g3.44 ± 0.32 e0.88 ± 0.05 ef1.83 ± 0.10 de0.26 ± 0.11 gh1.99 ± 0.28 e0.74 ± 0.15 gh0.44 ± 0.10 f25.67 ± 4.04 b–f27.79 ± 4.22 cde23.37 ± 2.69 i0.74 ± 0.03 a–f
F0 R175.17 ± 2.75 d–g26.33 ± 1.15 a6.00 ± 0.00 bcd25.39 ± 2.94 fg3.75 ± 0.21 de1.20 ± 0.08 bc1.65 ± 0.15 ef0.43 ± 0.02 c–f1.99 ± 0.30 e0.87 ± 0.15 e–h0.47 ± 0.03 def25.67 ± 2.08 b–f22.18 ± 3.18 e–i22.33 ± 0.38 i0.68 ± 0.05 efg
F0 R1 + N82.13 ± 2.73 d–g23.00 ± 1.00 b–e6.33 ± 0.58 abc26.90 ± 2.71 efg4.52 ± 0.21 a–d1.23 ± 0.10 bc1.51 ± 0.18 efg0.33 ± 0.06 fgh2.42 ± 0.09 b–e1.06 ± 0.08 c–f0.71 ± 0.04 bcd28.33 ± 3.79 a–d24.02 ± 3.27 d–h25.33 ± 3.12 ghi0.80 ± 0.01 ab
F0 R282.10 ± 1.13 ab20.00 ± 0.00 f–i6.00 ± 0.00 abc39.42 ± 2.48 a4.49 ± 0.28 a–d1.37 ± 0.09 ab1.55 ± 0.35 efg0.49 ± 0.07 bcd2.88 ± 0.11 abc1.12 ± 0.13 b–e0.78 ± 0.15 abc30.67 ± 1.15 abc26.08 ± 2.94 c–g24.60 ± 1.22 ghi0.72 ± 0.05 efg
F0 R2 + N74.00 ± 2.21 d–h24.67 ± 1.53 abc6.33 ± 0.58 abc27.15 ± 1.93 efg5.01 ± 0.80 ab1.34 ± 0.01 ab1.58 ± 0.11 efg0.34 ± 0.07 e–h2.39 ± 0.19 b–e0.82 ± 0.11 fgh0.49 ± 0.13 def24.33 ± 5.13 c–f20.10 ± 1.83 ghi22.60 ± 2.21 i0.71 ± 0.03 d–g
F1 R180.23 ± 4.20 abc24.67 ± 2.89 abc5.67 ± 0.58 cd34.89 ± 2.52 a–d5.10 ± 0.85 a1.33 ± 0.19 ab1.87 ± 0.55 de0.32 ± 0.03 fgh3.15 ± 0.32 a1.33 ± 0.12 bc0.88 ± 0.12 abc33.33 ± 2.52 a26.43 ± 1.66 c–f27.27 ± 0.59 efg0.78 ± 0.06 a–d
F1 R1 + N77.00 ± 2.78 c–f23.33 ± 0.76 bcd6.33 ± 0.58 abc32.79 ± 4.45 a–e4.94 ± 0.24 abc1.32 ± 0.05 ab1.54 ± 0.17 efg0.44 ± 0.10 c–f3.09 ± 0.38 a1.25 ± 0.21 bcd0.81 ± 0.09 abc30.33 ± 3.21 abc24.06 ± 2.44 d–h28.37 ± 1.27 ef0.71 ± 0.01 c–g
F1 R282.77 ± 2.68 ab23.33 ± 0.58 bcd7.00 ± 0.00 a38.13 ± 3.95 ab5.26 ± 0.69 a1.43 ± 0.13 a2.29 ± 0.32 c0.54 ± 0.05 abc3.08 ± 0.34 abc1.34 ± 0.14 bc0.91 ± 0.15 ab30.33 ± 0.57 abc30.41 ± 4.75 c22.93 ± 1.56 i0.79 ± 0.04 abc
F1 R2 + N74.23 ± 1.07 d–h22.00 ± 2.65 c–f6.00 ± 0.00 bcd24.96 ± 1.28 fg4.91 ± 0.37 abc1.30 ± 0.07 ab1.55 ± 0.16 efg0.28 ± 0.01 gh2.93 ± 0.22 abc1.12 ± 0.15 b–e0.76 ± 0.10 abc30.00 ± 2.65 abc19.97 ± 0.53 hi23.83 ± 1.60 hi0.68 ± 0.03 fg
F2 R182.87 ± 2.73 a25.00 ± 2.00 ab6.33 ± 0.58 abc34.11 ± 6.20 abc4.54 ± 0.57 a–d1.35 ± 0.12 ab2.80 ± 0.20 b0.61 ± 0.09 ab2.77 ± 0.11 abc1.23 ± 0.09 bcd0.86 ± 0.11 abc22.33 ± 5.69 def45.54 ± 4.08 a44.33 ± 0.59 a0.77 ± 0.06 a–e
F2 R1 + N69.77 ± 0.97 hi17.33 ± 0.58 i7.00 ± 0.00 a32.22 ± 5.57 b–f3.41 ± 0.69 e0.92 ± 0.04 ef1.23 ± 0.09 fgh0.31 ± 0.06 fgh2.15 ± 0.39 de0.96 ± 0.19 d–h0.64 ± 0.14 c–f27.67 ± 1.53 a–d20.78 ± 0.67 fgh28.70 ± 0.87 ef0.76 ± 0.02 a–f
F2 R282.90 ± 4.37 a27.00 ± 2.00 a7.00 ± 0.00 a36.07 ± 2.19 abc4.75 ± 0.38 abc1.29 ± 0.12 ab4.75 ± 0.38 a0.51 ± 0.03 abc2.99 ± 0.27 ab1.17 ± 0.36 bcd0.80 ± 0.14 abc26.00 ± 3.60 a–e39.04 ± 8.53 b26.50 ± 1.70 fgh0.82 ± 0.04 a
F2 R2 + N78.47 ± 2.47 a–d21.33 ± 2.31 d–g7.00 ± 1.00 a31.69 ± 3.32 b–f4.63 ± 0.58 a–d1.25 ± 0.06 abc2.10 ± 0.09 cd0.46 ± 0.08 cde2.93 ± 0.36 abc1.31 ± 0.19 bc0.91 ± 0.14 ab32.67 ± 4.51 ab28.89 ± 1.23 cd38.03 ± 0.91 bc0.70 ± 0.07 efg
F3 R176.87 ± 2.32 c–f18.20 ± 1.56 hi6.67 ± 0.58 ab25.45 ± 1.50 fg3.56 ± 0.16 e0.98 ± 0.12 def1.63 ± 0.11 ef0.38 ± 0.05 d–g2.35 ± 0.04 cde1.05 ± 0.04 c–f0.71 ± 0.02 bcd27.33 ± 2.08 a–e27.30 ± 1.76 cde37.17 ± 1.22 bcd0.74 ± 0.05 a–f
F3 R1 + N73.57 ± 2.06 e–h20.33 ± 0.57 e–h6.67 ± 0.57 ab30.30 ± 3.54 c–f3.33 ± 0.13 e0.96 ± 0.08 def1.14 ± 0.16 gh0.25 ± 0.04 gh2.63 ± 0.21 a–d2.13 ± 0.15 a0.71 ± 0.14 bcd31.00 ± 5.20 abc23.80 ± 1.97 d–h35.33 ± 0.78 cd0.78 ± 0.03 a–d
F3 R278.03 ± 3.10 b–e20.67 ± 1.53 d–h7.00 ± 0.00 a35.60 ± 1.05 a–d4.15 ± 0.07 b–e1.10 ± 0.04 cd2.20 ± 0.19 cd0.62 ± 0.07 a2.96 ± 0.22 abc1.37 ± 0.04 b0.98 ± 0.05 a32.67 ± 1.15 ab30.14 ± 2.13 c39.00 ± 1.47 b0.81 ± 0.02 a
F3 R2 + N72.87 ± 3.07 fgh18.00 ± 1.00 hi7.00 ± 0.00 a22.84 ± 0.0.28 gh3.45 ± 0.37 e0.85 ± 0.05 f1.17 ± 0.05 gh0.37 ± 0.09 d–g2.43 ± 0.13 b–e0.99 ± 0.06 d–g0.70 ± 0.06 b–e28.00 ± 1.73 a–d24.86 ± 0.69 c–h34.50 ± 2.11 d0.76 ± 0.04 a–f
* Control: treatment with no fertilizer addition, NPK fertilizer: treatment with traditional chemical fertilizers, F0 R1: treatment with formula 0 of vitreous fertilizers at 0.3 g/pot, F0 R1 + N: treatment with formula 0 of vitreous fertilizers at 0.3 g/pot combined with traditional chemical fertilizers, F0 R2: treatment with formula 0 of vitreous fertilizers at 1 g/pot, F0 R2 + N: treatment with formula 0 of vitreous fertilizers at 1 g/pot combined with traditional chemical fertilizers, F1 R1: treatment with formula 1 of vitreous fertilizers at 0.3 g/pot, F1 R1 + N: treatment with formula 1 of vitreous fertilizers at 0.3 g/pot combined with traditional chemical fertilizers, F1 R2: treatment with formula 1 of vitreous fertilizers at 1 g/pot, F1 R2 + N: treatment with formula 1 of vitreous fertilizers at 1 g/pot combined with traditional chemical fertilizers, F2 R1: treatment with formula 2 of vitreous fertilizers at 0.3 g/pot, F2 R1 + N: treatment with formula 2 of vitreous fertilizers at 0.3 g/pot combined with traditional chemical fertilizers, F2 R2: treatment with formula 2 of vitreous fertilizers at 1 g/pot, F2 R2 + N: treatment with formula 2 of vitreous fertilizers at 1 g/pot combined with traditional chemical fertilizers, F3 R1: treatment with formula 3 of vitreous fertilizers at 0.3 g/pot, F3 R1 + N: treatment with formula 3 of vitreous fertilizers at 0.3 g/pot combined with traditional chemical fertilizers, F3 R2: treatment with formula 3 of vitreous fertilizers at 1 g/pot, F3 R2 + N: treatment with formula 3 of vitreous fertilizers at 1 g/pot combined with traditional chemical fertilizers. Mean values in each column followed by the same letter did not differ significantly at p < 0.05 by Duncan’s test.
Publisher’s Note: MDPI stays neutral with regard to jurisdictional claims in published maps and institutional affiliations.