
The Impact of Water and Road Salt with Anti-Caking Agent on the Stiffness of Select Mixes Used for the Road Surface


Abstract
:1. Introduction
- Through surface damage, e.g., fatigue cracks resulting from operation (mainly top-down)—the mix moves by gravity and is pressed under pressure from vehicle wheels to the inside of the crack.
- During reconstruction of the pavement in winter, when vehicle traffic is allowed on a milled surface course. The solution penetrates directly into the upper part of the bonding layers or the substructure as a result of pressure and friction from vehicle wheels.
- As a result of the inter-layer leakage and poor shape conditions of the ground shoulder.
- As a result of aerosol dispersion of saline water droplets in the air by passing vehicles at high speed and settling on other areas of the road, including those that were not covered with salt.
2. State of Knowledge Review
3. Materials and Methods
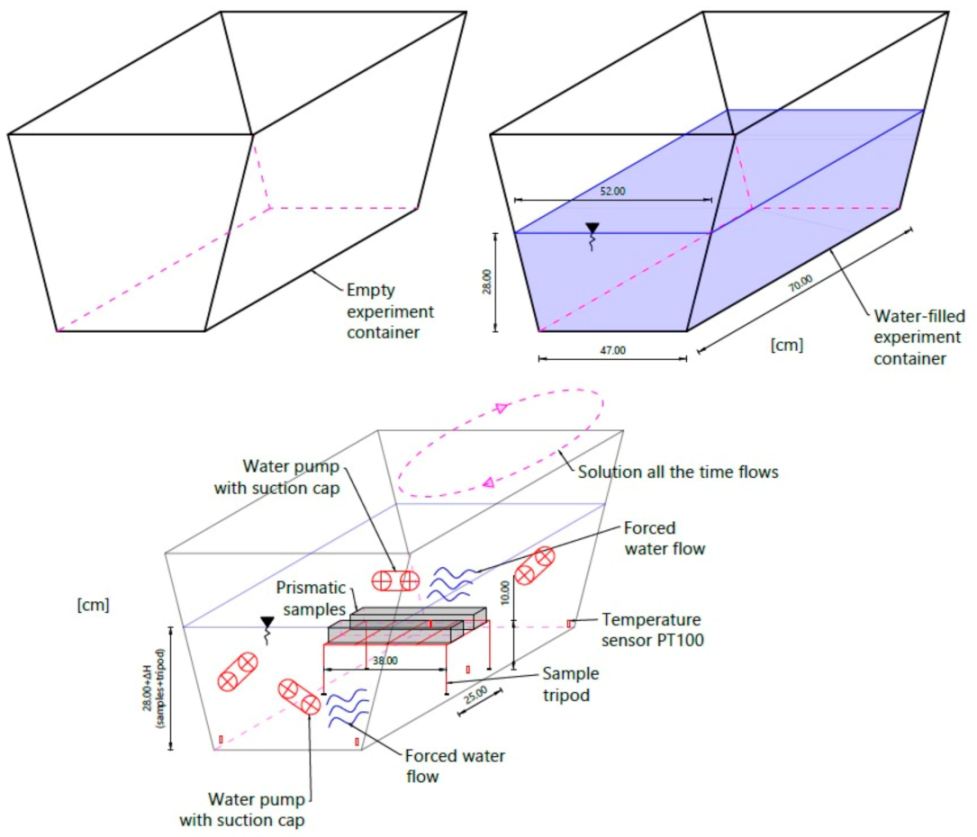
- The brine concentration must be constant and well-distributed everywhere in the container (no local concentration points).
- Forced circulation causes cyclical pressure of the solution on the material—an approximation of in situ conditions, in which the vehicle wheel “forces” the mixture under pressure into the road material.
4. Results
4.1. Preliminary Research
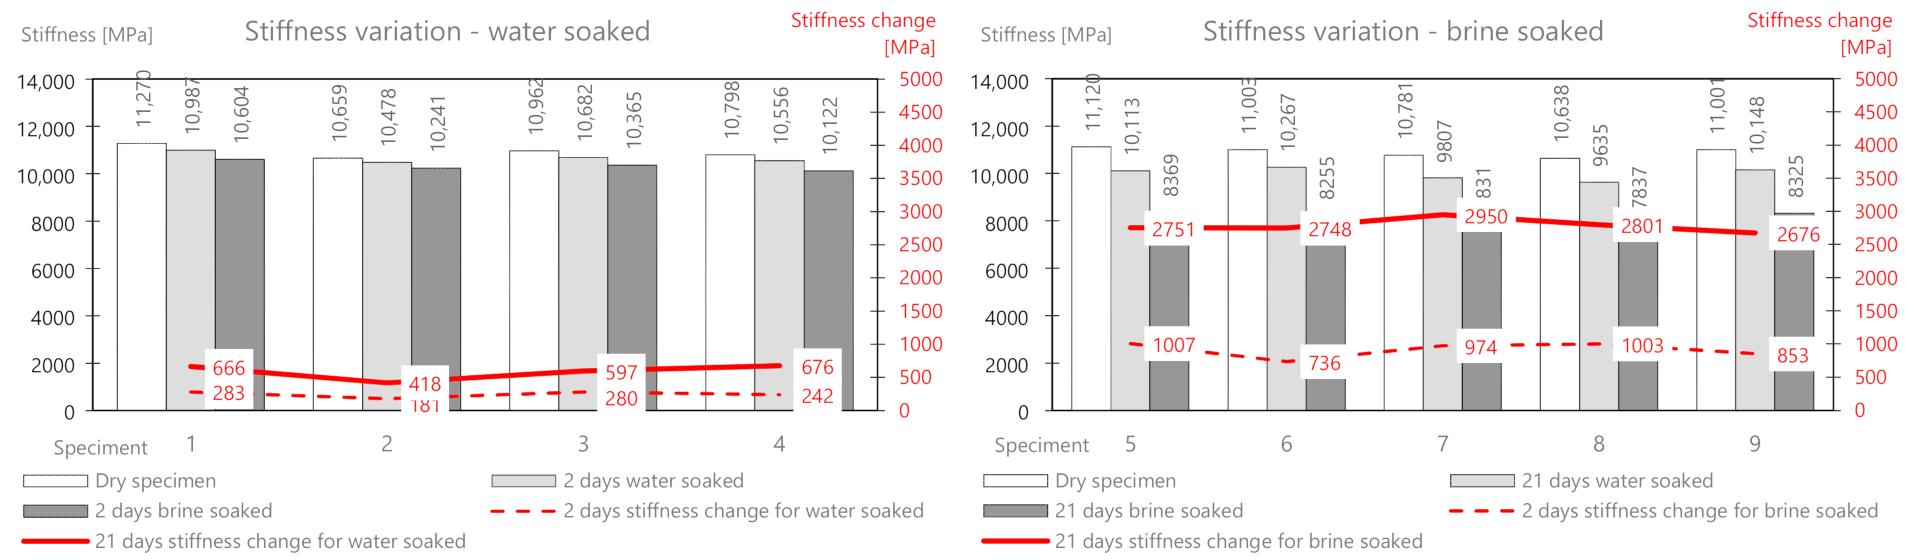
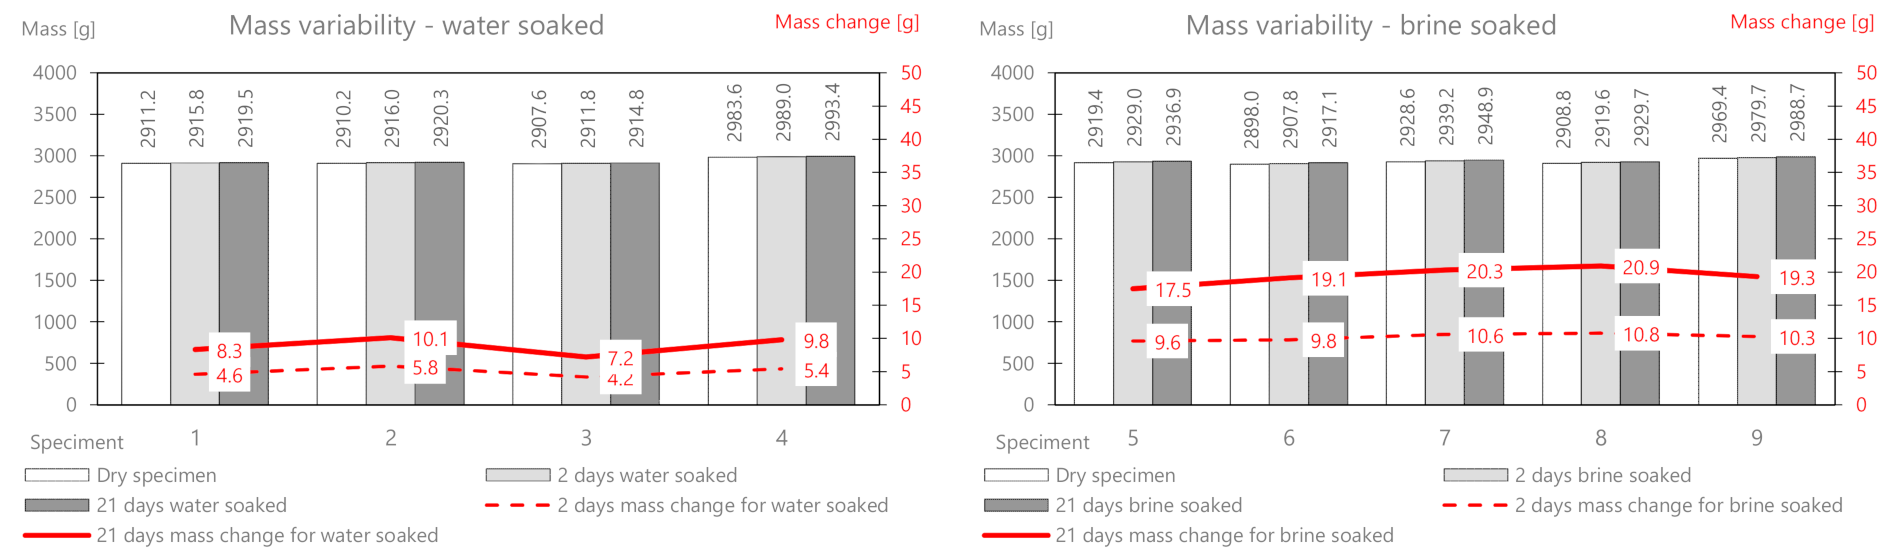
4.2. Results for AC11S
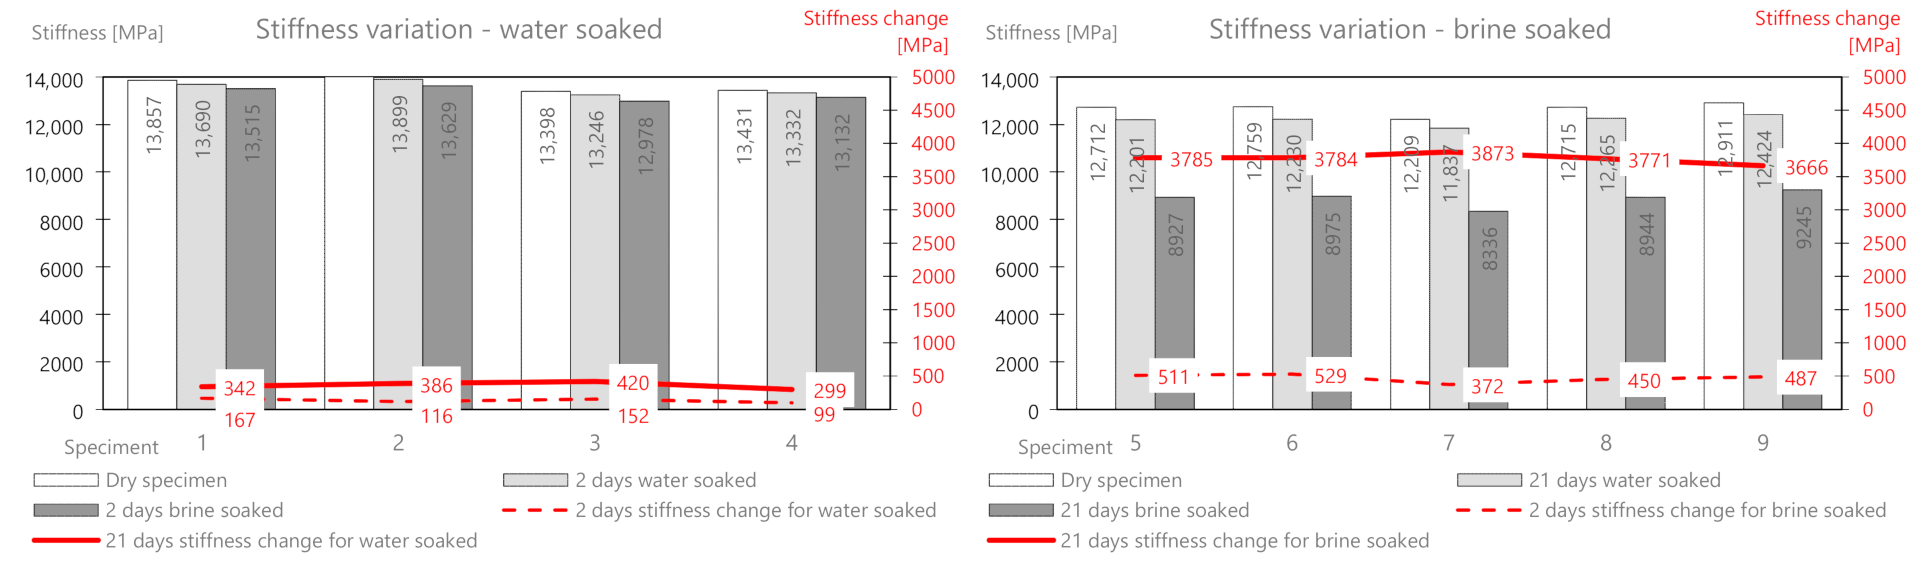
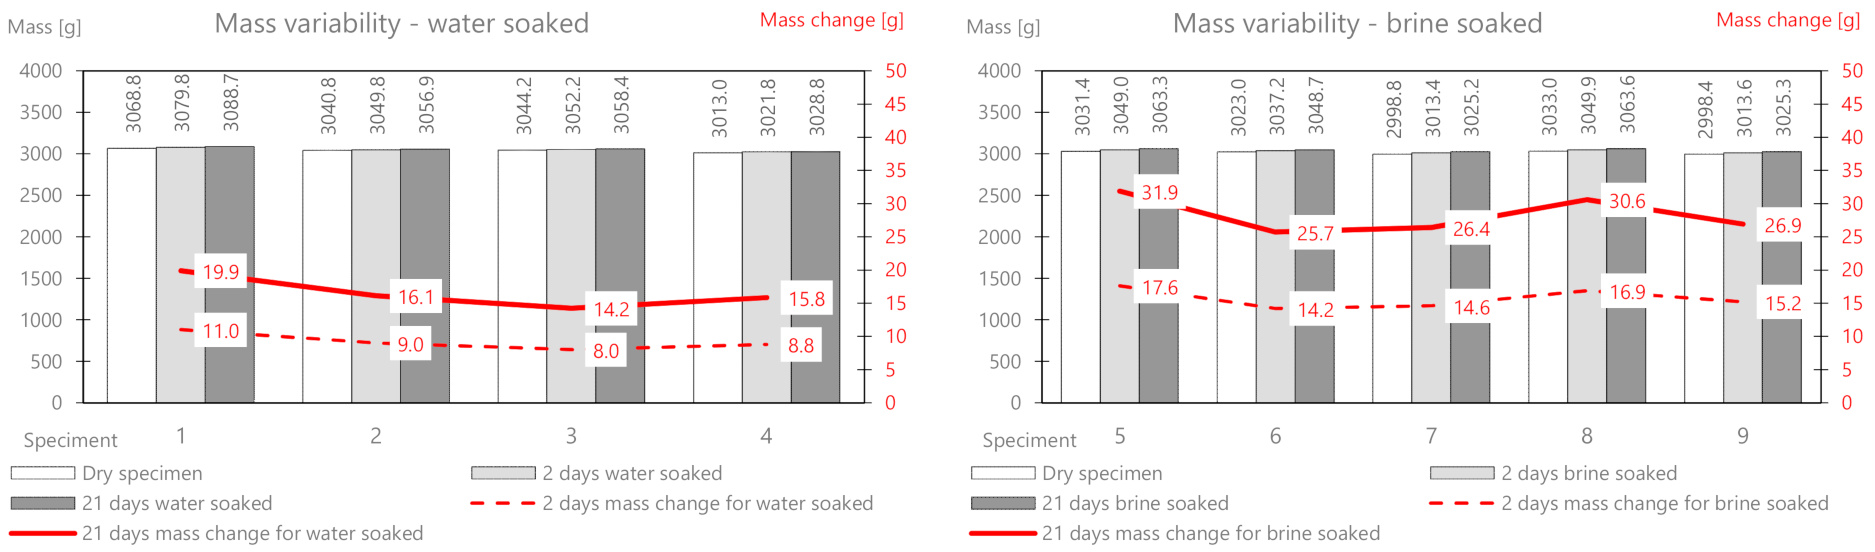
4.3. Results for AC WMS 22 (Pmb 25/55-60)
4.4. Results for ACWMS 22 (Pmb 25/55-80 HIMA)
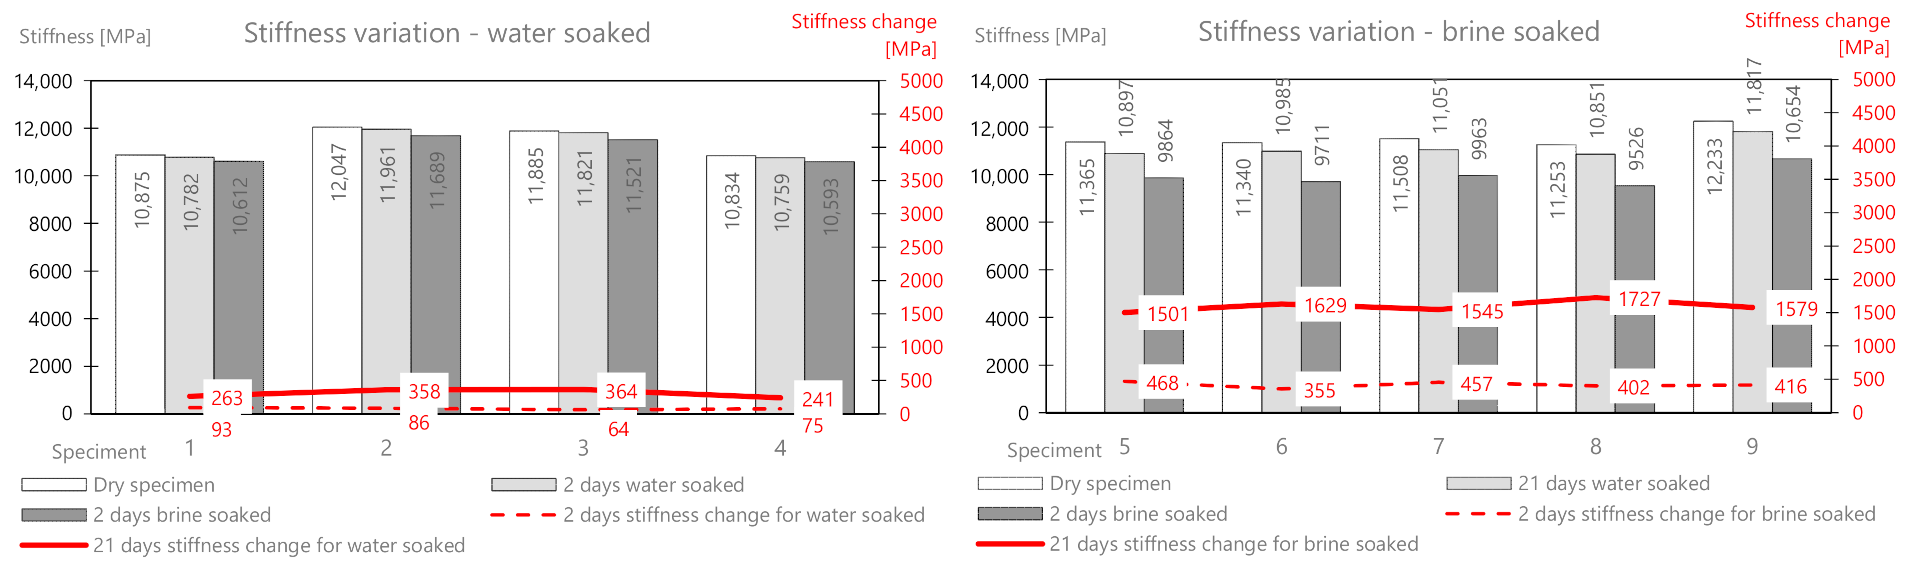
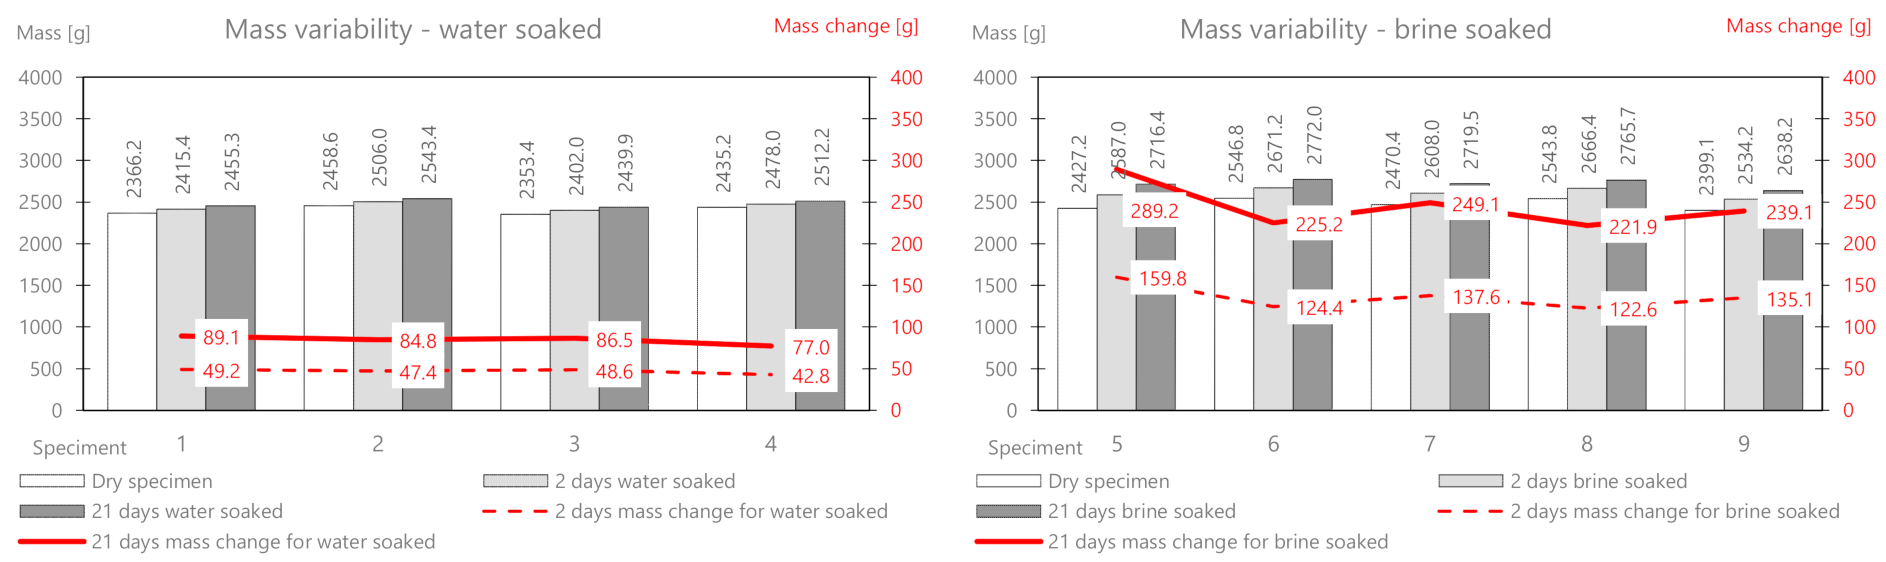
4.5. Results for MCAS
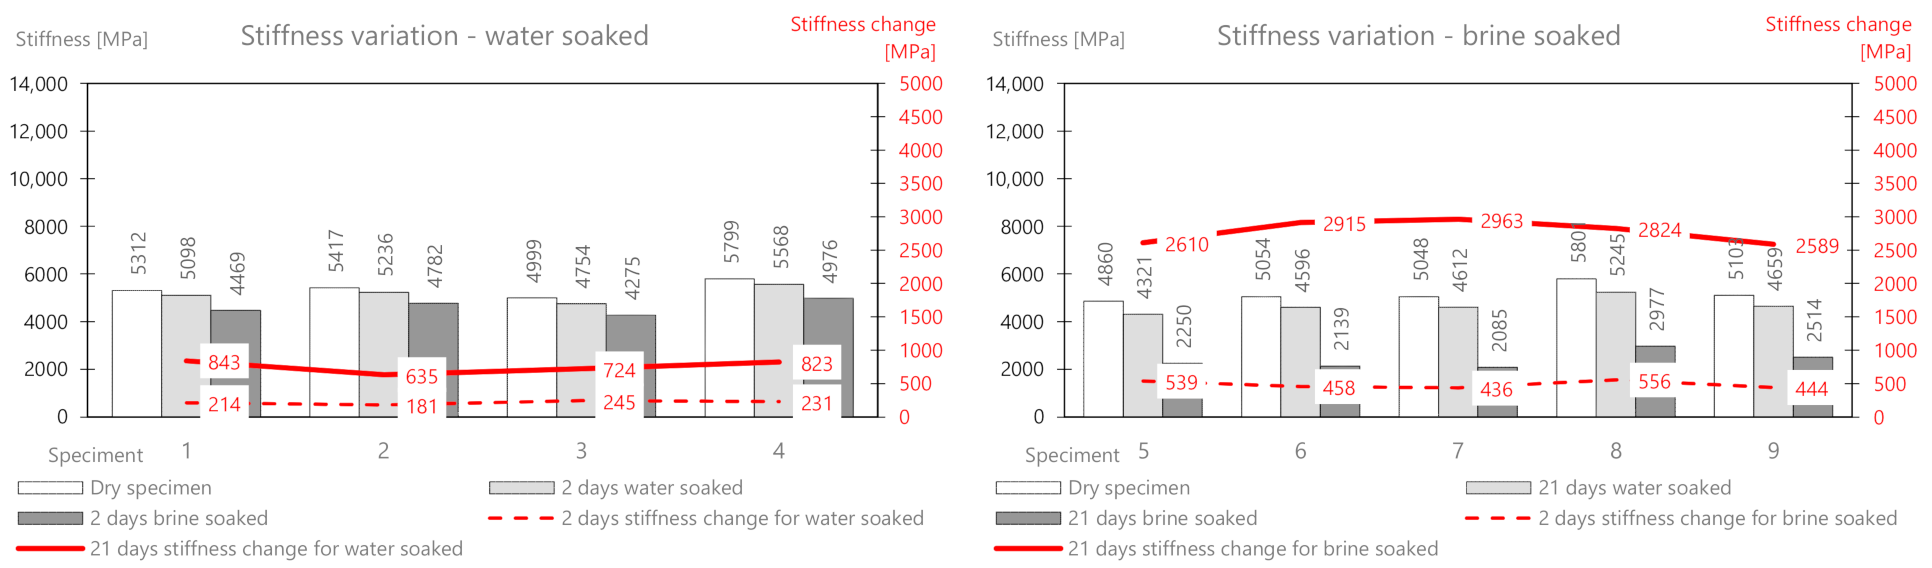
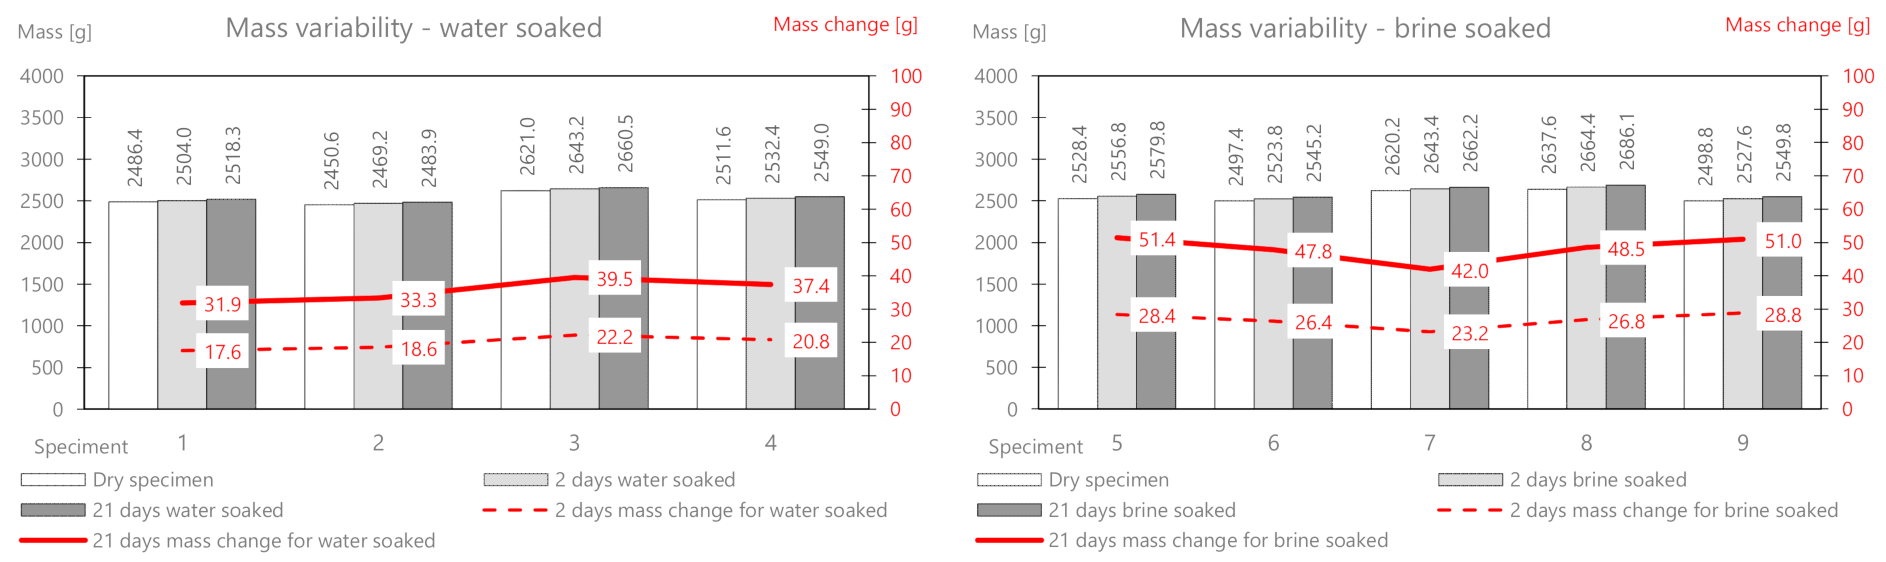
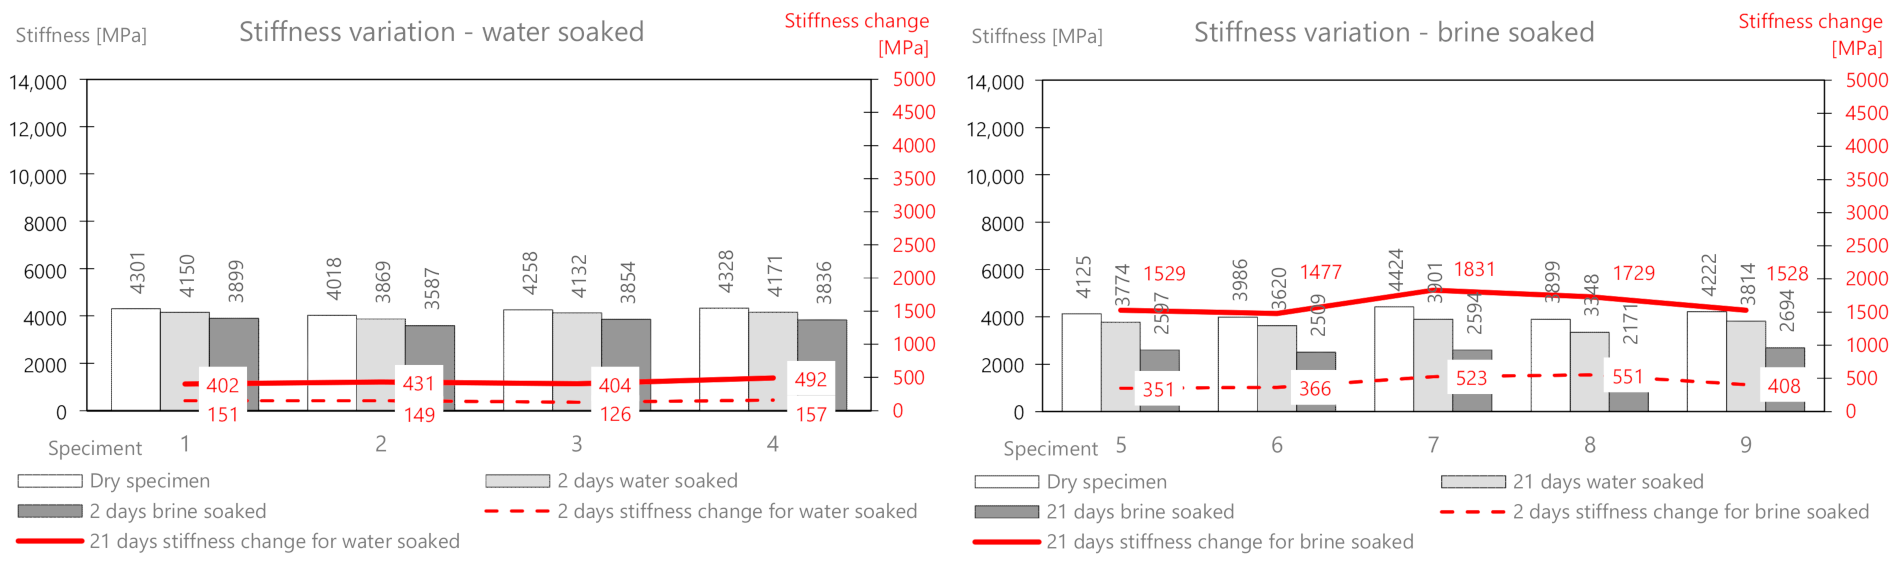
4.6. Results for MCE
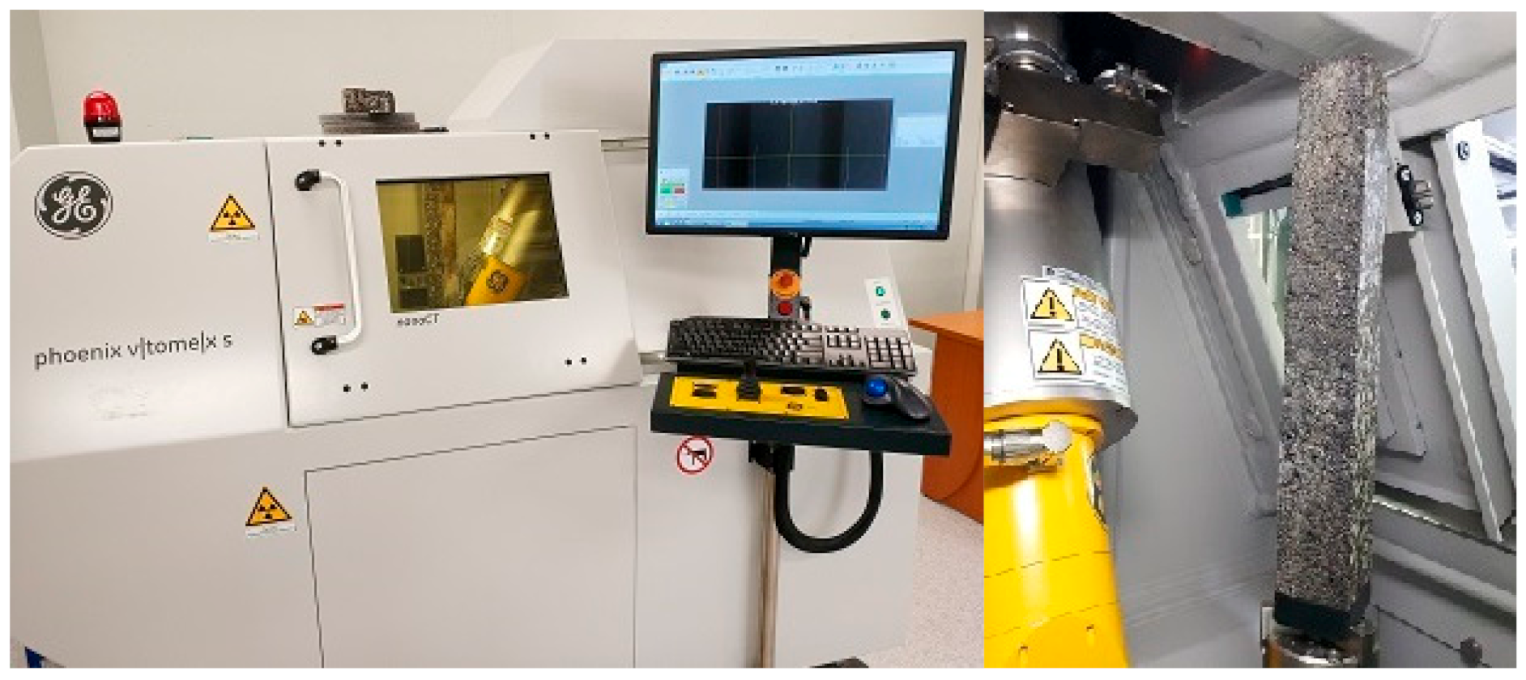
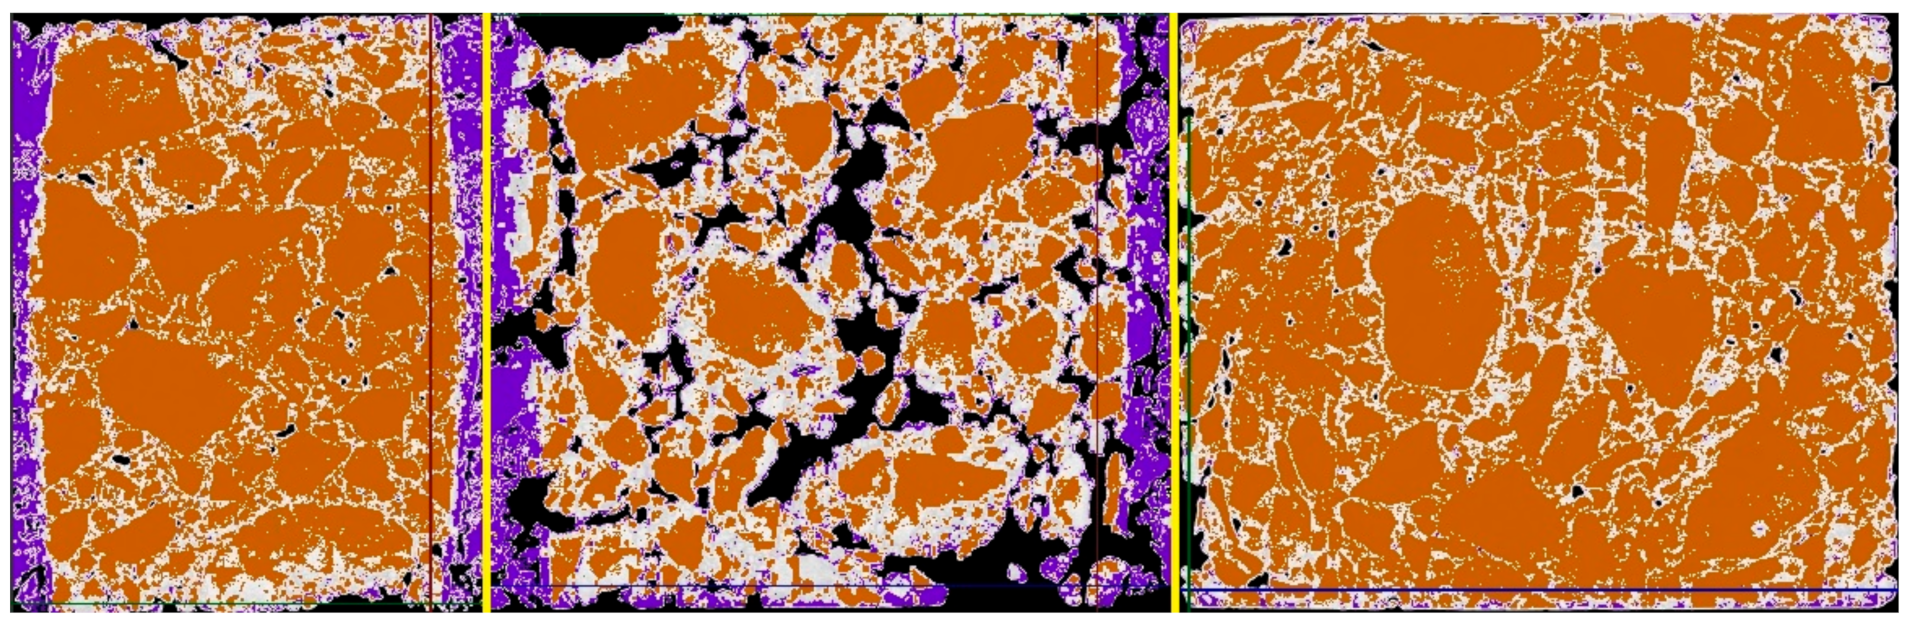
4.7. Tomography Imaging Salt in a Selected Mix
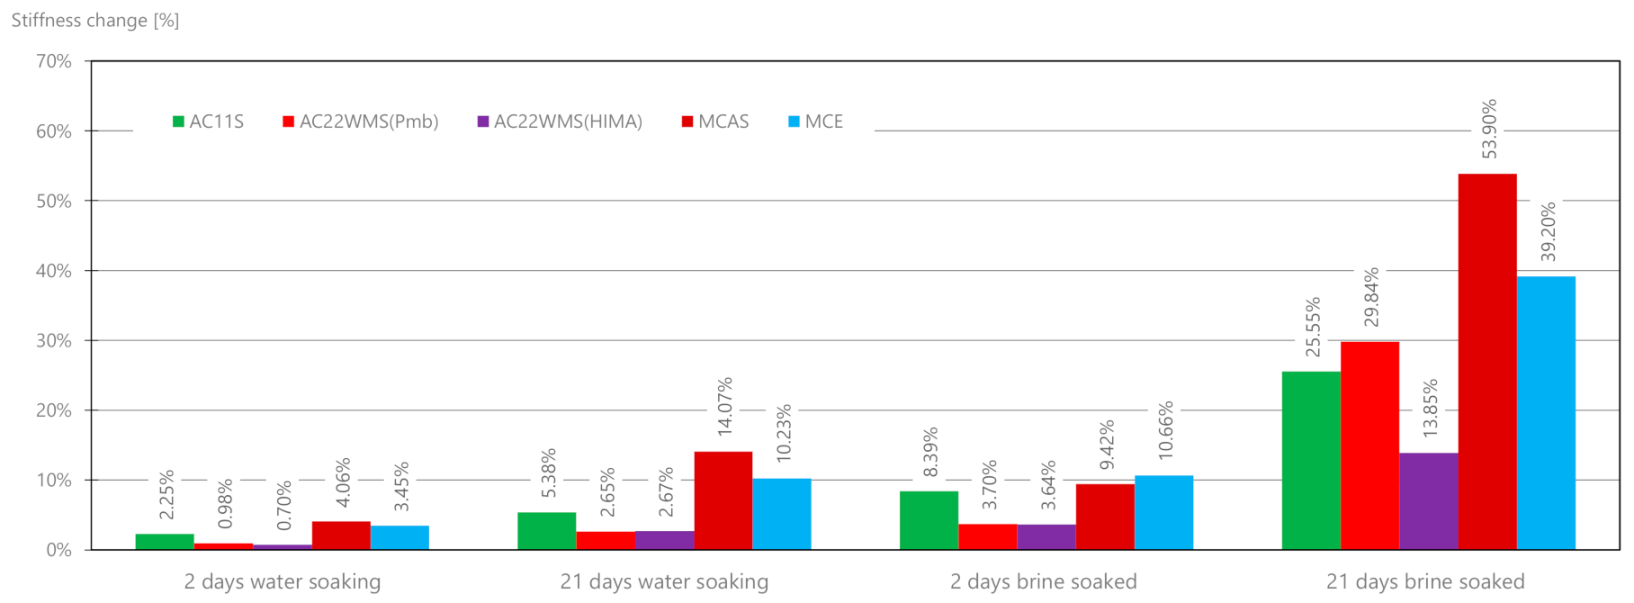
5. Discussion
6. Conclusions
Author Contributions
Funding
Institutional Review Board Statement
Informed Consent Statement
Data Availability Statement
Conflicts of Interest
References
- Godwin, K.S.; Hafner, S.D.; Buff, M.F. Long-term trends in sodium and chloride in the Mohawk River, New York: The effect of fifty years of road-salt application. Environ. Pollut. 2003, 124, 273–281. [Google Scholar] [CrossRef]
- Kelly, V.R.; Lovett, G.M.; Weathers, K.C.; Findlay, S.E.G.; Strayer, D.L.; Burns, D.I.; Likens, G.E. Long-term sodium chloride retention in a rural watershed: Legacy effects of road salt on streamwater concentration. Environ. Sci. Technol. 2008, 42, 410–415. [Google Scholar] [CrossRef] [PubMed]
- Government of Canada. Priority Substances List Assessment Report—Road Salts; Environment Canada: Ottawa, AN, Canada, 2001; ISBN 9780662310181. [Google Scholar]
- Guidelines for the Selection of Snow and Ice Control Materials to Mitigate Environmental Impacts; Transportation Research Board: Washington, DC, USA, 2007; ISBN 978-0-309-42233-8.
- Kelly, V.R.; Findaly, S.E.G.; Schlesinger, W.H.; Menking, K.; Morrill Chatrchyan, A. Road Salt—Moving Toward the Solution. 2010. Available online: https://www.caryinstitute.org/sites/default/files/public/reprints/report_road_salt_2010.pdf (accessed on 14 January 2021).
- Industrial experimental department of road and bridge engineering Sp. z o.o. General Technical Specification D—10.10.01c Combating Winter Slippy on the Road (Polish), Warsaw. 2004. Available online: https://www.bip.powiattorunski.pl/plik,43153,ost-pdf.pdf (accessed on 28 January 2021).
- Rodrigues, P.M.; Rodrigues, R.M.; Costa, B.H.; Martins, A.A.T.; Da Esteves Silva, J.C. Multivariate analysis of the water quality variation in the Serra da Estrela (Portugal) Natural Park as a consequence of road deicing with salt. Chemom. Intell. Lab. Syst. 2010, 102, 130–135. [Google Scholar] [CrossRef]
- Trost, S.E.; Heng, F.J.; Cussler, E.L. Chemistry of Deicing Roads: Breaking the Bond between Ice and Road. J. Transp. Eng. 1987, 113, 15–26. [Google Scholar] [CrossRef]
- Hassan, Y.; Abd El Halim, A.O.; Razaqpur, A.G.; Bekheet, W.; Farha, M.H. Effects of Runway Deicers on Pavement Materials and Mixes: Comparison with Road Salt. J. Transp. Eng. 2002, 128, 385–391. [Google Scholar] [CrossRef]
- Kosior-Kazberuk, M.; Jezierski, W. Surface scaling resistance of concrete modified with bituminous addition. J. Civ. Eng. Manag. 2004, 10, 25–30. [Google Scholar] [CrossRef] [Green Version]
- Hugenschmidt, J.; Loser, R. Detection of chlorides and moisture in concrete structures with ground penetrating radar. Mater. Struct. 2008, 41, 785–792. [Google Scholar] [CrossRef] [Green Version]
- Özgan, E.; Serin, S. Investigation of certain engineering characteristics of asphalt concrete exposed to freeze–thaw cycles. Cold Reg. Sci. Technol. 2013, 85, 131–136. [Google Scholar] [CrossRef]
- Amini, B.; Tehrani, S.S. Simultaneous effects of salted water and water flow on asphalt concrete pavement deterioration under freeze–thaw cycles. Int. J. Pavement Eng. 2014, 15, 383–391. [Google Scholar] [CrossRef]
- Liu, Y.H.; Zhang, H.; Wang, X.L.; Li, L. The Weakening Effect of the Snow-Melting Agent on the Performance of Municipal Asphalt Pavement in the Severe Cold Region. AMR 2014, 953–954, 1604–1608. [Google Scholar] [CrossRef]
- Pavuluri, S. Kinetic Approach for Modeling Salt Precipitation in Porous-Media; Independent Study; Universitat Stuttgart: Stuttgart, Germany, 2014. [Google Scholar]
- Hossain, S.K.; Fu, L.; Hosseini, F.; Muresan, M.; Donnelly, T.; Kabir, S. Optimum winter road maintenance: Effect of pavement types on snow melting performance of road salts. Can. J. Civ. Eng. 2016, 43, 802–811. [Google Scholar] [CrossRef]
- Tsang, C.; Shehata, M.H.; Lotfy, A. Optimizing a Test Method to Evaluate Resistance of Pervious Concrete to Cycles of Freezing and Thawing in the Presence of Different Deicing Salts. Materials 2016, 9, 878. [Google Scholar] [CrossRef] [PubMed] [Green Version]
- Almasi, S.A.; Khabir, M.M. Experimental evaluation of calcium chloride powder effect on the reduction of the pavement surface layer performance. CEJ 2019, 28, 61–72. [Google Scholar] [CrossRef]
- Saltanovs, R.; Rubenis, A.; Krainyukov, A. Influence of Constructive Materials of Road Cover on Magnetic Field Dispersion of Wireless Power Transmission Systems. In Reliability and Statistics in Transportation and Communication; Kabashkin, I., Yatskiv, I., Prentkovskis, O., Eds.; Springer International Publishing: Cham, Switzerland, 2019; pp. 214–223. ISBN 978-3-030-12449-6. [Google Scholar]
- Juli-Gándara, L.; Vega-Zamanillo, Á.; Calzada-Pérez, M.Á.; Teijón-López-Zuazo, E. Effect of Sodium Chloride on the Modulus and Fatigue Life of Bituminous Mixtures. Materials 2020, 13, 2126. [Google Scholar] [CrossRef] [PubMed]
- Vega-Zamanillo, Á.; Juli-Gándara, L.; Calzada-Pérez, M.Á.; Teijón-López-Zuazo, E. Impact of Temperature Changes and Freeze—Thaw Cycles on the Behaviour of Asphalt Concrete Submerged in Water with Sodium Chloride. Appl. Sci. 2020, 10, 1241. [Google Scholar] [CrossRef] [Green Version]
- Skotnicki, L.; Kuzniewski, J.; Szydlo, A. Stiffness Identification of Foamed Asphalt Mixtures with Cement, Evaluated in Laboratory and In Situ in Road Pavements. Materials 2020, 13, 1128. [Google Scholar] [CrossRef] [PubMed] [Green Version]
- OWSIAK, Z.; CZAPIK, P.; Zapała-Sławeta, J. Testing the cement, hydrated lime and cement by-pass dust mixtures hydration. Roads Bridges—Drog. Mosty 2020, 135–147. [Google Scholar] [CrossRef]
- OWSIAK, Z.; CZAPIK, P.; Zapała-Sławeta, J. Properties of a Three-Component Mineral Road Binder for Deep-Cold Recycling Technology. Materials 2020, 13, 3585. [Google Scholar] [CrossRef]
- Skotnicki, Ł.; Kuźniewski, J.; Szydło, A. Research on the Properties of Mineral–Cement Emulsion Mixtures Using Recycled Road Pavement Materials. Materials 2021, 14, 563. [Google Scholar] [CrossRef] [PubMed]
- PKN/KT 212. Bituminous Mixtures—Test Methods—Part 26: Stiffness: PN-EN 12697-26:2018-08; PKN: Warsaw, Poland, 2018.
- PKN/KT 212. Bituminous Mixtures—Test Methods—Part 6: Determination of Bulk Density of Bituminous Specimens: PN-EN 12697-6:2020-07; PKN: Warsaw, Poland, 2020.
- Judycki, J.; Jaskula, P.; Alenowicz, J.; Dołżycki, B.; Jaczewski, M.; Ryś, D.; Stienss, M. Catalog of Typical Pavement Constructions for Flexible and Semi-Rigid Pavement; GDDKiA: Warsaw, Poland, 2014. (In Polish) [Google Scholar]
- Szydło, A.; Mackiewicz, P.; Wardęga, R.; Krawczyk, B. Catalog of Typical Rigid Pavement Structures; GDDKiA: Warsaw, Poland, 2014. (In Polish) [Google Scholar]
- Błażejowski, K.; Ostrowski, P.; Wójcik-Wiśniewska, M.; Baranowska, W. Mixes and Pavements with Orbiton HIMA Asphalts (Polish), Płock, 2020. Available online: https://www.orlen-asfalt.pl/PL/InformacjeTechniczne/Strony/Nasze-Publikacje.aspx (accessed on 1 May 2020).


| Mix | Bond Material |
|---|---|
| AC11S | Asphalt D50/70: 5.90% Amfibolit 8/11: 32.40% Amfibolit 5/8: 10.50% Sjenit 2/5: 13.80% Sjenit 0/2: 31.20% 0/1 milled stone extender: 6.20% Porosity: 3.70% |
| AC22WMS (Pmb) | Asphalt 25/55-60: 4.98% 16/22 gabbro grit: 28.50% 11/16 gabbro grit: 9.50% 8/11 gabbro grit: 8.55% 4/8 gabbro grit: 8.55% 2/5 gabbro grit: 15.20% 0/2 gabbro crushed sand: 17.10% 0/1 milled stone extender: 7.60% Porosity: 2.38% |
| AC22WMS (HIMA) | Asphalt 25/55-80 HIMA: 4.98% 16/22 gabbro grit: 28.50% 11/16 gabbro grit: 9.50% 8/11 gabbro grit: 8.55% 4/8 gabbro grit: 8.55% 2/5 gabbro grit: 15.20% 0/2 gabbro crushed sand: 17.10% 0/1 milled stone extender: 7.60% Porosity: 2.97% |
| MCAS | Asphalt destruct 0/10: 37.6% Natural ginning aggregate 0/2: 9.4% Crushed ginning aggregate 0/31.5: 47% Foamed asphalt 70/100: 3% Hydraulic binder: 3% (40% CEM cement I 32,5R, 20% hydrated lime (Ca(OH)2, 40% dusty cement byproducts) Porosity: 13.21% |
| MCE | Asphalt destruct 0/10: 34.4% Natural ginning aggregate 0/2: 8.6% Crushed ginning aggregate 0/31.5: 43% Asphalt emulsion 60/40: 5% Hydraulic binder: 3% (40% CEM cement I 32,5R, 20% hydrated lime (Ca(OH)2, 40% dusty cement byproducts) Water: 6% Porosity: 14.02% |
| Brine | Temperature Shock | |||||
|---|---|---|---|---|---|---|
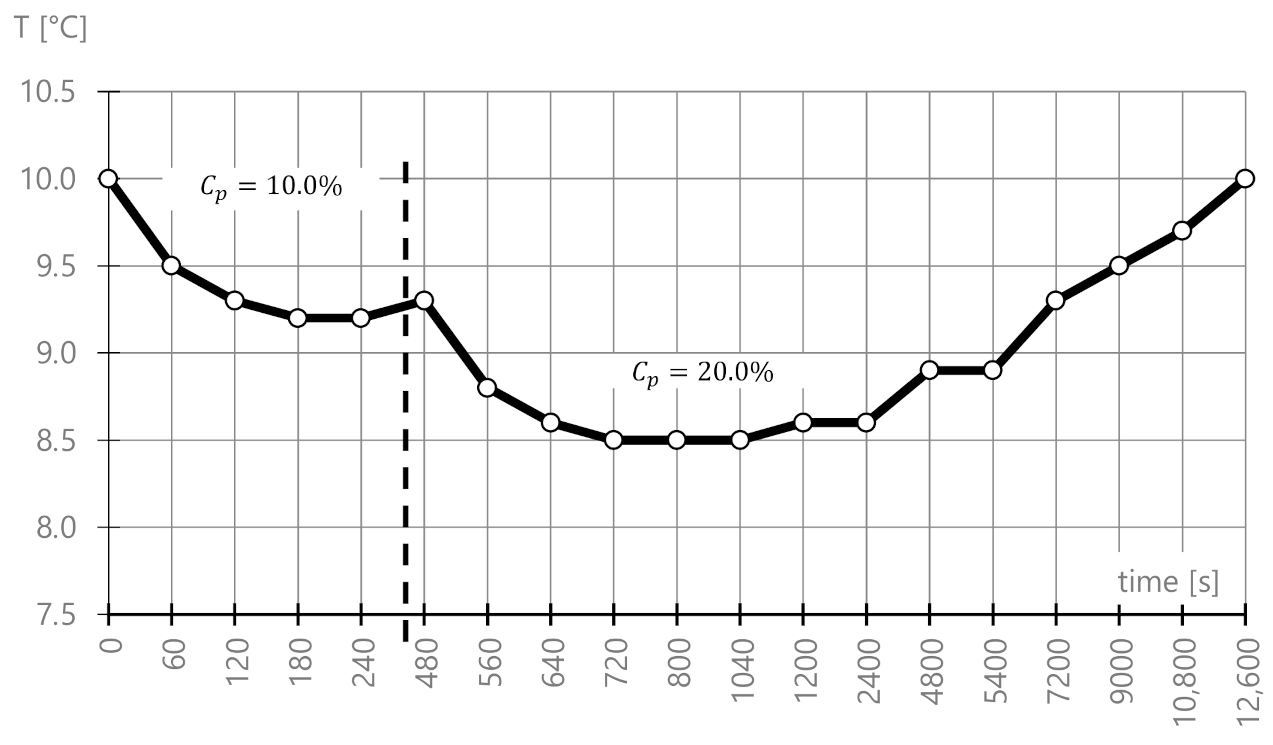
| Step | Temperature (°C) | Total Water Mass, mw (g) | Percentage Concentration (Target Value), Cp (%) | Total Mass of Gritting Salt with Anti-caking Agent, ms (g) | Time (s) | Temperature Noticed (°C) |
| 1 | 10.0 | 96,534.9 | 10.0% | 10,726.1 | 0 | 10.0 |
| 60 | 9.5 | |||||
| 120 | 9.3 | |||||
| 180 | 9.2 | |||||
| 240 | 9.2 | |||||
| 2 | 10.0 | 96,534.9 | 20.0% | 24,133.7 | 480 | 9.3 |
| 560 | 8.8 | |||||
| 640 | 8.6 | |||||
| 720 | 8.5 | |||||
| 800 | 8.5 | |||||
| 1040 | 8.5 | |||||
| 1200 | 8.6 | |||||
| 2400 | 8.6 | |||||
| 4800 | 8.9 | |||||
| 5400 | 8.9 | |||||
| 7200 | 9.3 | |||||
| 9000 | 9.5 | |||||
| 10,800 | 9.7 | |||||
| 12,600 | 10.0 | |||||
| Specimen Index | Mass | Mass Change | |||||||
|---|---|---|---|---|---|---|---|---|---|
| Dry Specimen | Water Soaked | Brine Soaked | Water Soaked | Brine Soaked | |||||
| Initial State | 2 Days | 21 Days | 2 Days | 21 Days | 2 Days | 21 Days | 2 Days | 21 Days | |
| (g) | (g) | (g) | (g) | (g) | (g) | (g) | (g) | (g) | |
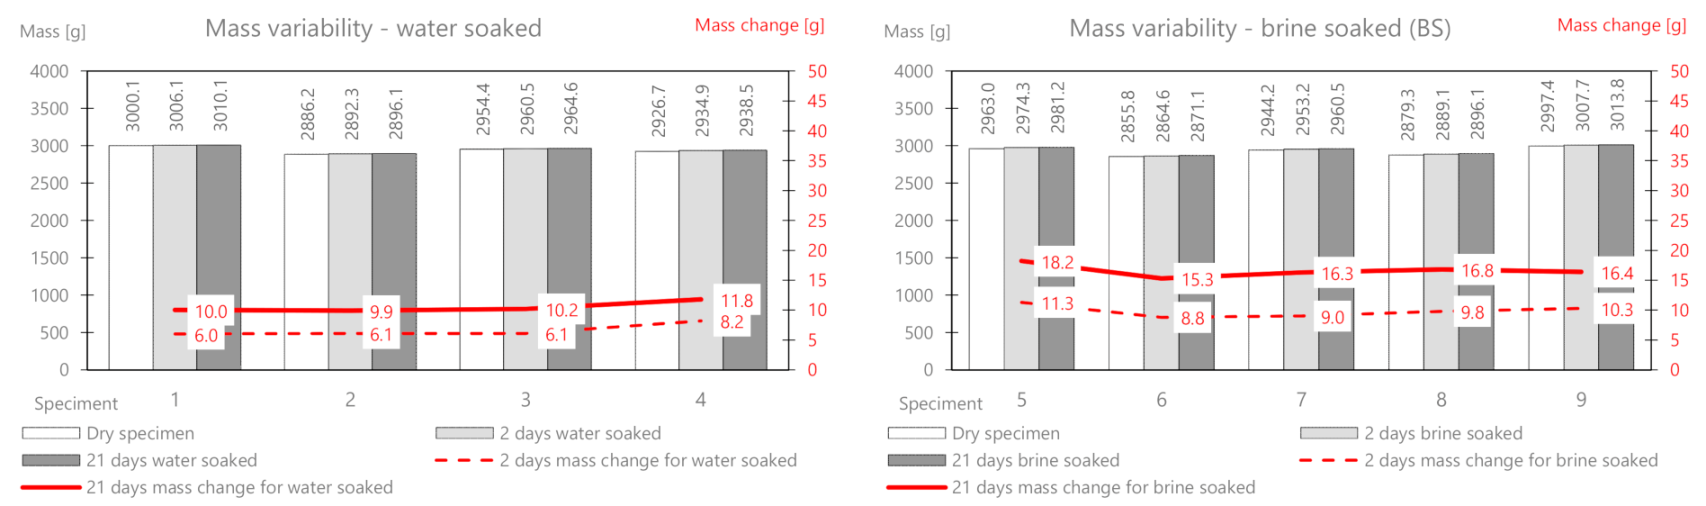
| 1 | 3000.1 | 3006.1 | 3010.1 | 6.0 | 10.0 | ||||
| 2 | 2886.2 | 2892.3 | 2896.1 | 6.1 | 9.9 | ||||
| 3 | 2954.4 | 2960.5 | 2964.6 | 6.1 | 10.2 | ||||
| 4 | 2926.7 | 2934.9 | 2938.5 | 8.2 | 11.8 | ||||
| 5 | 2963.0 | 2974.3 | 2981.2 | 11.3 | 18.2 | ||||
| 6 | 2855.8 | 2864.6 | 2871.1 | 8.8 | 15.3 | ||||
| 7 | 2944.2 | 2953.2 | 2960.5 | 9.0 | 16.3 | ||||
| 8 | 2879.3 | 2889.1 | 2896.1 | 9.8 | 16.8 | ||||
| 9 | 2997.4 | 3007.7 | 3013.8 | 10.3 | 16.4 | ||||
| Average | 2934.1 | 2948.5 | 2952.3 | 2937.8 | 2944.5 | 6.60 | 10.48 | 9.84 | 16.60 |
| Standard deviation | 48.5 | 41.2 | 41.4 | 53.3 | 53.2 | 0.9 | 0.8 | 0.9 | 0.9 |
| The coefficient of variation (%) | 1.65% | 1.40% | 1.40% | 1.81% | 1.81% | 14.01% | 7.38% | 9.24% | 5.66% |
| Specimen Index | Stiffness | Stiffness Change | |||||||
|---|---|---|---|---|---|---|---|---|---|
| Dry Specimen | Water Soaked | Brine Soaked | Water Soaked | Brine Soaked | |||||
| Initial State | 2 Days | 21 Days | 2 Days | 21 Days | 2 Days | 21 Days | 2 Days | 21 Days | |
| (MPa) | (MPa) | (MPa) | (MPa) | (MPa) | (MPa) | (MPa) | (MPa) | (MPa) | |
| 1 | 11,270 | 10,987 | 10,604 | 283 | 666 | ||||
| 2 | 10,659 | 10,478 | 10,241 | 181 | 418 | ||||
| 3 | 10,962 | 10,682 | 10,365 | 280 | 597 | ||||
| 4 | 10,798 | 10,556 | 10,122 | 242 | 676 | ||||
| 5 | 11,120 | 10,113 | 8369 | 1007 | 2751 | ||||
| 6 | 11,003 | 10,267 | 8255 | 736 | 2748 | ||||
| 7 | 10,781 | 9807 | 7831 | 974 | 2950 | ||||
| 8 | 10,638 | 9635 | 7837 | 1003 | 2801 | ||||
| 9 | 11,001 | 10,148 | 8325 | 853 | 2676 | ||||
| Average | 10,914.7 | 10,675.8 | 9994.0 | 10,333.0 | 8123.4 | 246.5 | 589.3 | 914.6 | 2785.2 |
| Standard deviation | 199.8 | 193.9 | 235.1 | 178.5 | 239.1 | 41.1 | 103.4 | 105.4 | 91.5 |
| The coefficient of variation (%) | 1.83% | 1.82% | 2.35% | 1.73% | 2.94% | 16.68% | 17.56% | 11.53% | 3.29% |
| Specimen Index | Mass | Mass Change | |||||||
|---|---|---|---|---|---|---|---|---|---|
| Dry Specimen | Water Soaked | Brine Soaked | Water Soaked | Brine Soaked | |||||
| Initial State | 2 Days | 21 Days | 2 Days | 21 Days | 2 Days | 21 Days | 2 Days | 21 Days | |
| (g) | (g) | (g) | (g) | (g) | (g) | (g) | (g) | (g) | |
| 1 | 2911.2 | 2915.8 | 2919.5 | 4.6 | 8.3 | ||||
| 2 | 2910.2 | 2916.0 | 2920.3 | 5.8 | 10.1 | ||||
| 3 | 2907.6 | 2911.8 | 2914.8 | 4.2 | 7.2 | ||||
| 4 | 2983.6 | 2989.0 | 2993.4 | 5.4 | 9.8 | ||||
| 5 | 2919.4 | 2929.0 | 2936.9 | 9.6 | 17.5 | ||||
| 6 | 2898.0 | 2907.8 | 2917.1 | 9.8 | 19.1 | ||||
| 7 | 2928.6 | 2939.2 | 2948.9 | 10.6 | 20.3 | ||||
| 8 | 2908.8 | 2919.6 | 2929.7 | 10.8 | 20.9 | ||||
| 9 | 2969.4 | 2979.7 | 2988.7 | 10.3 | 19.3 | ||||
| Average | 2926.3 | 2933.2 | 2937.0 | 2935.1 | 2944.3 | 5.00 | 8.85 | 10.22 | 19.42 |
| Standard deviation | 28.2 | 32.3 | 32.6 | 24.6 | 24.5 | 0.6 | 1.2 | 0.5 | 1.2 |
| The coefficient of variation (%) | 0.96% | 1.10% | 1.11% | 0.84% | 0.83% | 12.65% | 13.24% | 4.48% | 5.99% |
| Specimen Index | Stiffness | Stiffness Change | |||||||
|---|---|---|---|---|---|---|---|---|---|
| Dry Specimen | Water Soaked | Brine Soaked | Water Soaked | Brine Soaked | |||||
| Initial State | 2 Days | 21 Days | 2 Days | 21 Days | 2 Days | 21 Days | 2 Days | 21 Days | |
| (MPa) | (MPa) | (MPa) | (MPa) | (MPa) | (MPa) | (MPa) | (MPa) | (MPa) | |
| 1 | 13,857 | 13,690 | 13,515 | 167 | 342 | ||||
| 2 | 14,015 | 13,899 | 13,629 | 116 | 386 | ||||
| 3 | 13,398 | 13,246 | 12,978 | 152 | 420 | ||||
| 4 | 13,431 | 13,332 | 13,132 | 99 | 299 | ||||
| 5 | 12,712 | 12,201 | 8927 | 511 | 3785 | ||||
| 6 | 12,759 | 12,230 | 8975 | 529 | 3784 | ||||
| 7 | 12,209 | 11,837 | 8336 | 372 | 3873 | ||||
| 8 | 12,715 | 12,265 | 8944 | 450 | 3771 | ||||
| 9 | 12,911 | 12,424 | 9245 | 487 | 3666 | ||||
| Average | 13,111.9 | 13,541.8 | 12,191.4 | 13,313.5 | 8885.4 | 133.5 | 361.8 | 469.8 | 3775.8 |
| Standard deviation | 562.9 | 265.1 | 193.2 | 267.2 | 298.1 | 27.2 | 45.6 | 55.6 | 65.8 |
| The coefficient of variation (%) | 4.29% | 1.96% | 1.59% | 2.01% | 3.36% | 20.38% | 12.60% | 11.83% | 1.74% |
| Specimen Index | Mass | Mass Change | |||||||
|---|---|---|---|---|---|---|---|---|---|
| Dry Specimen | Water Soaked | Brine Soaked | Water Soaked | Brine Soaked | |||||
| Initial State | 2 Days | 21 Days | 2 Days | 21 Days | 2 Days | 21 Days | 2 Days | 21 Days | |
| (g) | (g) | (g) | (g) | (g) | (g) | (g) | (g) | (g) | |
| 1 | 3068.8 | 3079.8 | 3088.7 | 11.0 | 19.9 | ||||
| 2 | 3040.8 | 3049.8 | 3056.9 | 9.0 | 16.1 | ||||
| 3 | 3044.2 | 3052.2 | 3058.4 | 8.0 | 14.2 | ||||
| 4 | 3013.0 | 3021.8 | 3028.8 | 8.8 | 15.8 | ||||
| 5 | 3031.4 | 3049.0 | 3063.3 | 17.6 | 31.9 | ||||
| 6 | 3023.0 | 3037.2 | 3048.7 | 14.2 | 25.7 | ||||
| 7 | 2998.8 | 3013.4 | 3025.2 | 14.6 | 26.4 | ||||
| 8 | 3033.0 | 3049.9 | 3063.6 | 16.9 | 30.6 | ||||
| 9 | 2998.4 | 3013.6 | 3025.3 | 15.2 | 26.9 | ||||
| Average | 3027.9 | 3050.9 | 3058.2 | 3032.6 | 3045.2 | 9.20 | 16.53 | 15.70 | 28.30 |
| Standard deviation | 21.4 | 20.5 | 21.2 | 16.2 | 17.2 | 1.1 | 2.1 | 1.3 | 2.5 |
| The coefficient of variation (%) | 0.71% | 0.67% | 0.69% | 0.54% | 0.56% | 12.01% | 12.59% | 8.43% | 8.67% |
| Specimen Index | Stiffness | Stiffness Change | |||||||
|---|---|---|---|---|---|---|---|---|---|
| Dry Specimen | Water Soaked | Brine Soaked | Water Soaked | Brine Soaked | |||||
| Initial State | 2 Days | 21 Days | 2 Days | 21 Days | 2 Days | 21 Days | 2 Days | 21 Days | |
| (MPa) | (MPa) | (MPa) | (MPa) | (MPa) | (MPa) | (MPa) | (MPa) | (MPa) | |
| 1 | 10,875 | 10,782 | 10,612 | 93 | 263 | ||||
| 2 | 12,047 | 11,961 | 11,689 | 86 | 358 | ||||
| 3 | 11,885 | 11,821 | 11,521 | 64 | 364 | ||||
| 4 | 10,834 | 10,759 | 10,593 | 75 | 241 | ||||
| 5 | 11,365 | 10,897 | 9864 | 468 | 1501 | ||||
| 6 | 11,340 | 10,985 | 9711 | 355 | 1629 | ||||
| 7 | 11,508 | 11,051 | 9963 | 457 | 1545 | ||||
| 8 | 11,253 | 10,851 | 9526 | 402 | 1727 | ||||
| 9 | 12,233 | 11,817 | 10,654 | 416 | 1579 | ||||
| Average | 11,482.2 | 11,330.8 | 11,120.2 | 11,103.8 | 9943.6 | 79.5 | 306.5 | 419.6 | 1596.2 |
| Standard deviation | 462.0 | 562.5 | 355.2 | 504.8 | 384.7 | 11.0 | 55.1 | 40.6 | 77.7 |
| The coefficient of variation (%) | 4.02% | 4.96% | 3.19% | 4.55% | 3.87% | 13.85% | 17.97% | 9.67% | 4.87% |
| Specimen Index | Mass | Mass Change | |||||||
|---|---|---|---|---|---|---|---|---|---|
| Dry Specimen | Water Soaked | Brine Soaked | Water Soaked | Brine Soaked | |||||
| Initial State | 2 Days | 21 Days | 2 Days | 21 Days | 2 Days | 21 Days | 2 Days | 21 Days | |
| (g) | (g) | (g) | (g) | (g) | (g) | (g) | (g) | (g) | |
| 1 | 2366.2 | 2415.4 | 2455.3 | 49.2 | 89.1 | ||||
| 2 | 2458.6 | 2506.0 | 2543.4 | 47.4 | 84.8 | ||||
| 3 | 2353.4 | 2402.0 | 2439.9 | 48.6 | 86.5 | ||||
| 4 | 2435.2 | 2478.0 | 2512.2 | 42.8 | 77.0 | ||||
| 5 | 2427.2 | 2587.0 | 2716.4 | 159.8 | 289.2 | ||||
| 6 | 2546.8 | 2671.2 | 2772.0 | 124.4 | 225.2 | ||||
| 7 | 2470.4 | 2608.0 | 2719.5 | 137.6 | 249.1 | ||||
| 8 | 2543.8 | 2666.4 | 2765.7 | 122.6 | 221.9 | ||||
| 9 | 2399.1 | 2534.2 | 2638.2 | 135.1 | 239.1 | ||||
| Average | 2444.5 | 2450.4 | 2487.7 | 2613.4 | 2722.4 | 47.00 | 84.36 | 135.90 | 244.90 |
| Standard deviation | 65.0 | 43.1 | 42.0 | 51.3 | 47.9 | 2.5 | 4.5 | 13.3 | 24.2 |
| The coefficient of variation (%) | 2.66% | 1.76% | 1.69% | 1.96% | 1.76% | 5.34% | 5.32% | 9.78% | 9.89% |
| Specimen Index | Stiffness | Stiffness Change | |||||||
|---|---|---|---|---|---|---|---|---|---|
| Dry Specimen | Water Soaked | Brine Soaked | Water Soaked | Brine Soaked | |||||
| Initial State | 2 Days | 21 Days | 2 Days | 21 Days | 2 Days | 21 Days | 2 Days | 21 Days | |
| (MPa) | (MPa) | (MPa) | (MPa) | (MPa) | (MPa) | (MPa) | (MPa) | (MPa) | |
| 1 | 5312 | 5098 | 4469 | 214 | 843 | ||||
| 2 | 5417 | 5236 | 4782 | 181 | 635 | ||||
| 3 | 4999 | 4754 | 4275 | 245 | 724 | ||||
| 4 | 5799 | 5568 | 4976 | 231 | 823 | ||||
| 5 | 4860 | 4321 | 2250 | 539 | 2610 | ||||
| 6 | 5054 | 4596 | 2139 | 458 | 2915 | ||||
| 7 | 5048 | 4612 | 2085 | 436 | 2963 | ||||
| 8 | 5801 | 5245 | 2977 | 556 | 2824 | ||||
| 9 | 5103 | 4659 | 2514 | 444 | 2589 | ||||
| Average | 5265.9 | 5164.0 | 4686.6 | 4625.5 | 2393.0 | 217.8 | 756.3 | 486.6 | 2780.2 |
| Standard deviation | 325.0 | 291.9 | 303.3 | 271.4 | 327.3 | 23.9 | 83.3 | 50.5 | 154.3 |
| The coefficient of variation (%) | 6.17% | 5.65% | 6.47% | 5.87% | 13.68% | 10.97% | 11.01% | 10.38% | 5.55% |
| Specimen Index | Mass | Mass Change | |||||||
|---|---|---|---|---|---|---|---|---|---|
| Dry Specimen | Water Soaked | Brine Soaked | Water Soaked | Brine Soaked | |||||
| Initial State | 2 Days | 21 Days | 2 Days | 21 Days | 2 Days | 21 Days | 2 Days | 21 Days | |
| (g) | (g) | (g) | (g) | (g) | (g) | (g) | (g) | (g) | |
| 1 | 2486.4 | 2504.0 | 2518.3 | 17.6 | 31.9 | ||||
| 2 | 2450.6 | 2469.2 | 2483.9 | 18.6 | 33.3 | ||||
| 3 | 2621.0 | 2643.2 | 2660.5 | 22.2 | 39.5 | ||||
| 4 | 2511.6 | 2532.4 | 2549.0 | 20.8 | 37.4 | ||||
| 5 | 2528.4 | 2556.8 | 2579.8 | 28.4 | 51.4 | ||||
| 6 | 2497.4 | 2523.8 | 2545.2 | 26.4 | 47.8 | ||||
| 7 | 2620.2 | 2643.4 | 2662.2 | 23.2 | 42.0 | ||||
| 8 | 2637.6 | 2664.4 | 2686.1 | 26.8 | 48.5 | ||||
| 9 | 2498.8 | 2527.6 | 2549.8 | 28.8 | 51.0 | ||||
| Average | 2539.1 | 2537.2 | 2552.9 | 2583.2 | 2604.6 | 19.80 | 35.53 | 26.72 | 48.13 |
| Standard deviation | 64.8 | 65.2 | 66.3 | 59.2 | 58.5 | 1.8 | 3.1 | 2.0 | 3.4 |
| The coefficient of variation (%) | 2.55% | 2.57% | 2.60% | 2.29% | 2.25% | 9.12% | 8.68% | 7.42% | 7.00% |
| Specimen Index | Stiffness | Stiffness Change | |||||||
|---|---|---|---|---|---|---|---|---|---|
| Dry Specimen | Water Soaked | Brine Soaked | Water Soaked | Brine Soaked | |||||
| Initial State | 2 Days | 21 Days | 2 Days | 21 Days | 2 Days | 21 Days | 2 Days | 21 Days | |
| (MPa) | (MPa) | (MPa) | (MPa) | (MPa) | (MPa) | (MPa) | (MPa) | (MPa) | |
| 1 | 4301 | 4150 | 3899 | 151 | 402 | ||||
| 2 | 4018 | 3869 | 3587 | 149 | 431 | ||||
| 3 | 4258 | 4132 | 3854 | 126 | 404 | ||||
| 4 | 4328 | 4171 | 3836 | 157 | 492 | ||||
| 5 | 4125 | 3774 | 2597 | 351 | 1529 | ||||
| 6 | 3986 | 3620 | 2509 | 366 | 1477 | ||||
| 7 | 4424 | 3901 | 2594 | 523 | 1831 | ||||
| 8 | 3899 | 3348 | 2171 | 551 | 1729 | ||||
| 9 | 4222 | 3814 | 2694 | 408 | 1528 | ||||
| Average | 4173.4 | 4080.5 | 3691.4 | 3794.0 | 2512.7 | 145.8 | 432.3 | 439.8 | 1618.5 |
| Standard deviation | 166.5 | 122.9 | 194.3 | 121.7 | 180.9 | 11.8 | 36.3 | 82.0 | 136.6 |
| The coefficient of variation (%) | 3.99% | 3.01% | 5.26% | 3.21% | 7.20% | 8.08% | 8.41% | 18.65% | 8.44% |
Publisher’s Note: MDPI stays neutral with regard to jurisdictional claims in published maps and institutional affiliations. |
© 2021 by the authors. Licensee MDPI, Basel, Switzerland. This article is an open access article distributed under the terms and conditions of the Creative Commons Attribution (CC BY) license (http://creativecommons.org/licenses/by/4.0/).
Share and Cite
Mackiewicz, P.; Mączka, E. The Impact of Water and Road Salt with Anti-Caking Agent on the Stiffness of Select Mixes Used for the Road Surface. Materials 2021, 14, 1345. https://doi.org/10.3390/ma14061345
Mackiewicz P, Mączka E. The Impact of Water and Road Salt with Anti-Caking Agent on the Stiffness of Select Mixes Used for the Road Surface. Materials. 2021; 14(6):1345. https://doi.org/10.3390/ma14061345
Chicago/Turabian StyleMackiewicz, Piotr, and Eryk Mączka. 2021. "The Impact of Water and Road Salt with Anti-Caking Agent on the Stiffness of Select Mixes Used for the Road Surface" Materials 14, no. 6: 1345. https://doi.org/10.3390/ma14061345