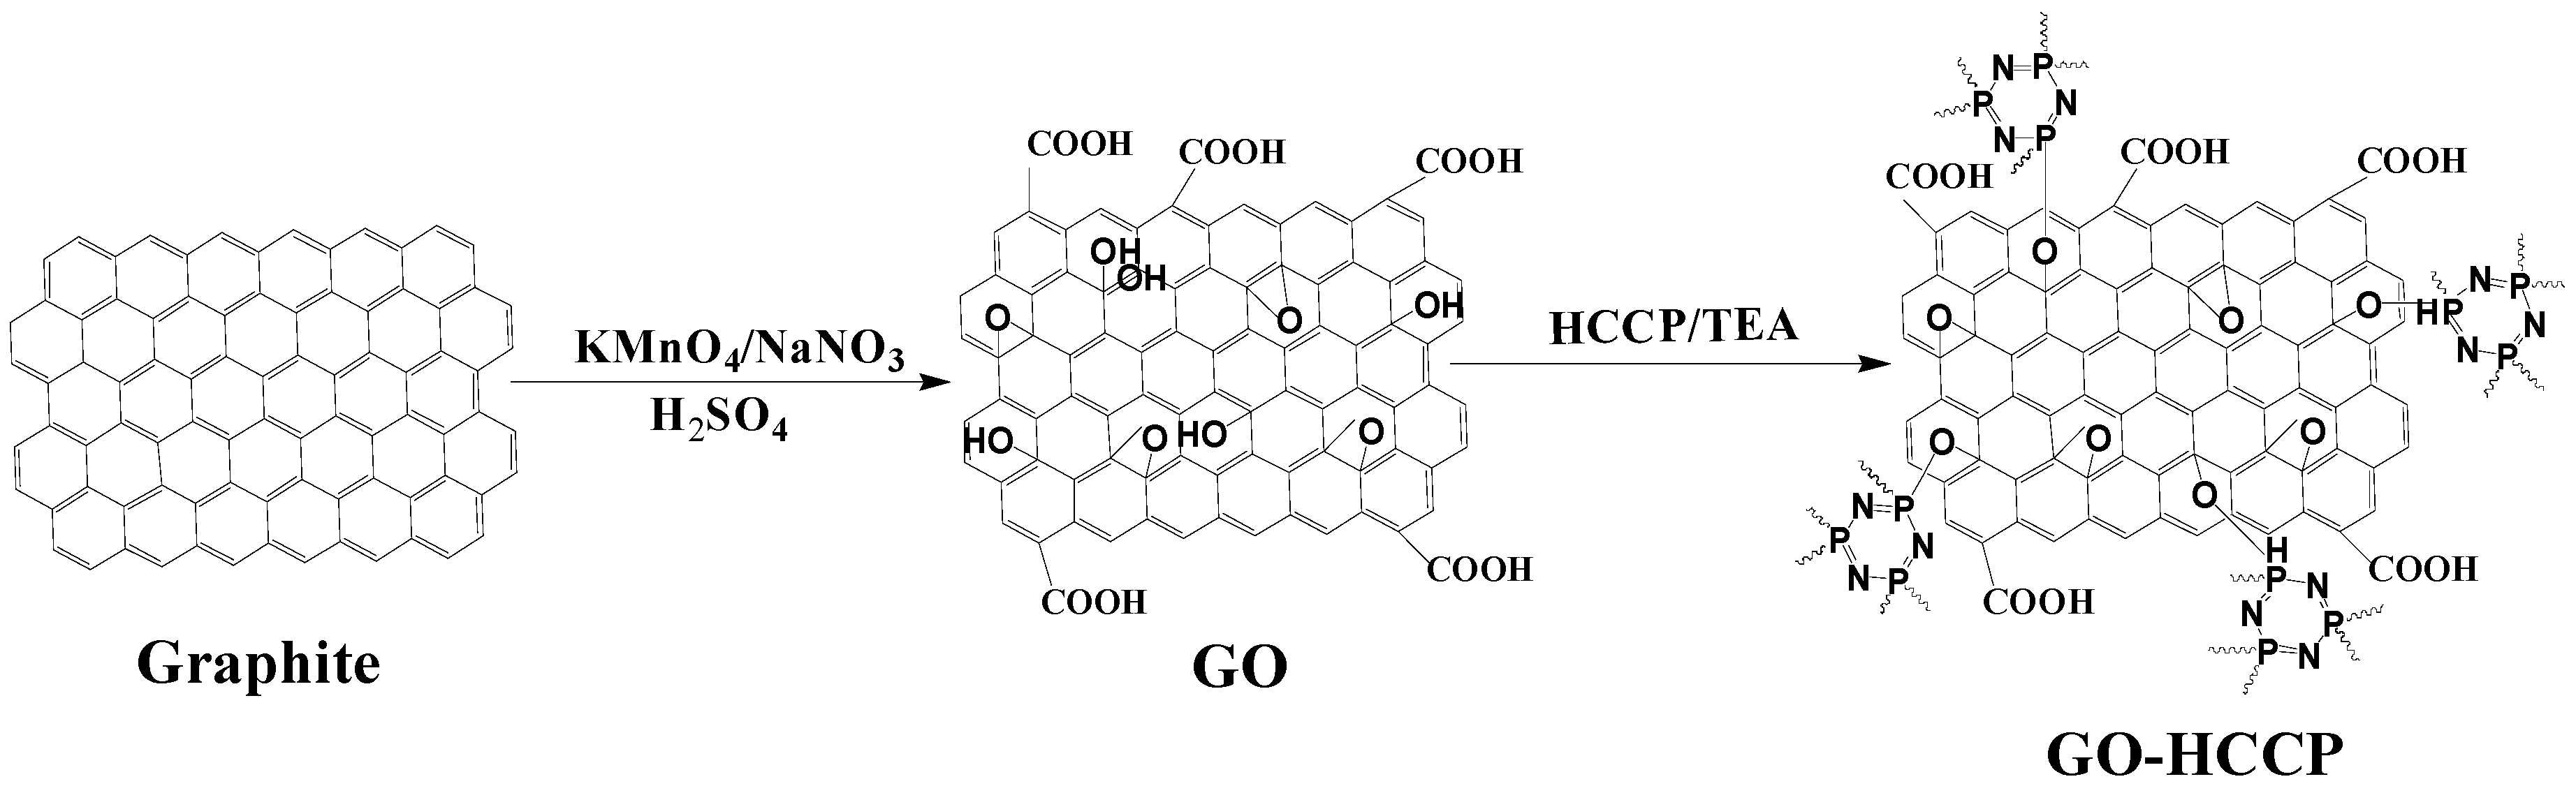
3.1. The Molecular Structure of GO-HCCP
The flame-retardant GO-HCCP was synthesized, followed by the identification of the grafting between GO and HCCP.
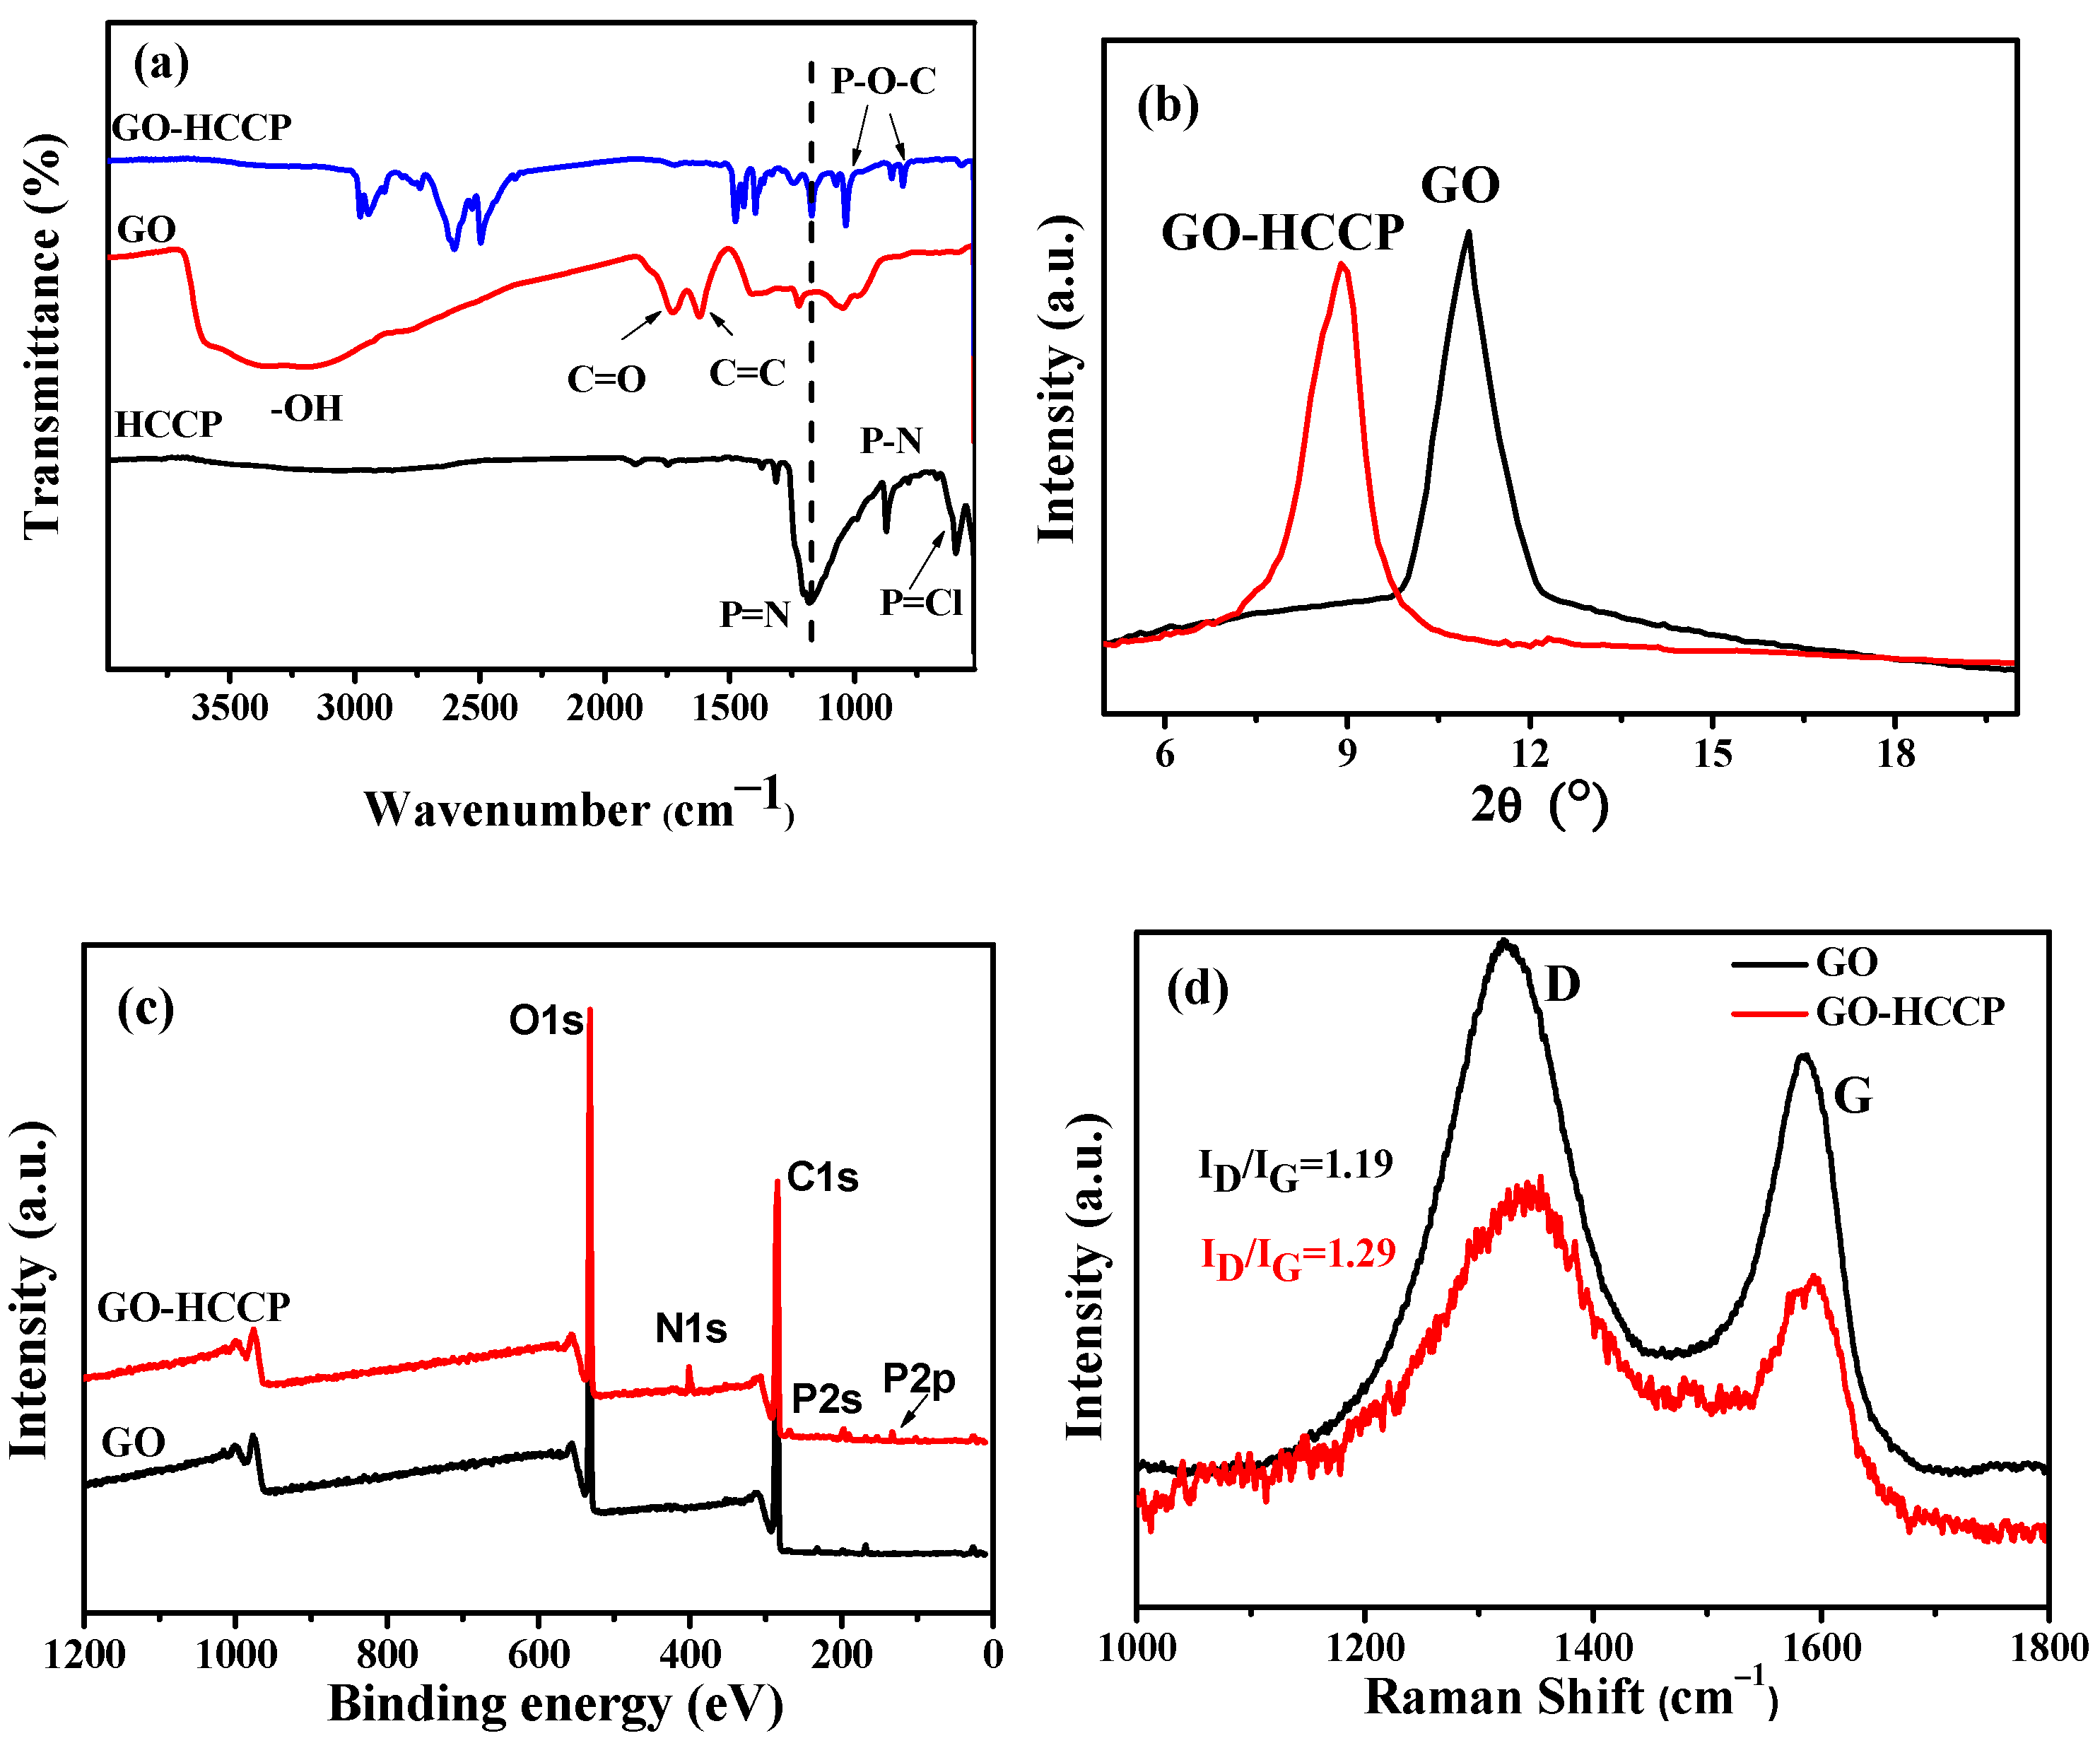
Figure 3a shows the peaks at 1707, 1224, 1045 and 1363 cm
−1 are ascribed to the C=O, epoxide group and the C-C skeleton of GO. For the FTIR absorption peaks of GO, HCCP and GO-HCCP, the broadband at 1628 and 3357 cm
−1 correspond to the bending vibrations and stretching of O-H on the GO surface. The bands in the range 2500–2800 cm
−1 corresponded to triethyamine hydrochloride, which indicates that the products should be further purified. For HCCP, the band at 593, 1180 and 873 cm
−1 correspond to P-Cl, P-N and P=N bonds, respectively. Compared to GO and HCCP, the new absorptions band at 1032 and 835 cm
−1 appeared due to stretch vibration of P-O-C in GO-HCCP, which indicated that GO had been successfully grafted by HCCP. The interaction between GO and HCCP was also confirmed by XRD (
Figure 3b). A sharp diffraction peak was observed at 11° of GO, which corresponded to the (002) reflection of GO. Nevertheless, the (002) peak intensity decreased after the chemical modification of GO (GO-HCCP), and the (002) diffraction peak of GO shifted to 9.9°. According to
, the layer spacing of GO increased to 0.99 nm from 0.8 nm. This indicates that the organic molecules were grafted onto the surface of GO by nucleophilic substitution reaction, which led to the breaking of the stacking structure of GO sheets, leading to the enlarged interlayer spacing of GO via nucleophilic substitution reaction of HCCP onto GO. XPS characterization results of GO and GO-HCCP are displayed in
Figure 3c. It is obvious that GO-HCCP exhibited a new adsorption peak at 400, 190.9 and 134.7 eV, which were attributed to the N1s, P2s and P2p derived from HCCP. The nanostructure was also confirmed by Raman analysis.
Figure 3d presents the Raman spectra of GO and GO-HCCP. They all exhibited a typical broad D-band and G-band, with the D-band at 1335 cm
−1 and G bands at 1593 cm
−1 attributable to the defect/disorder-induced mode and graphene in-plane vibration, respectively [
36]. The relative intensity ratio of D-band to G-band (I
D/I
G) is an important value to monitor the purity and functionalization of GO. In this study, the values of I
D/I
G were 1.19 and 1.29 for GO and GO-HCCP, respectively. The increased I
D/I
G value indicated that the introduction of sp
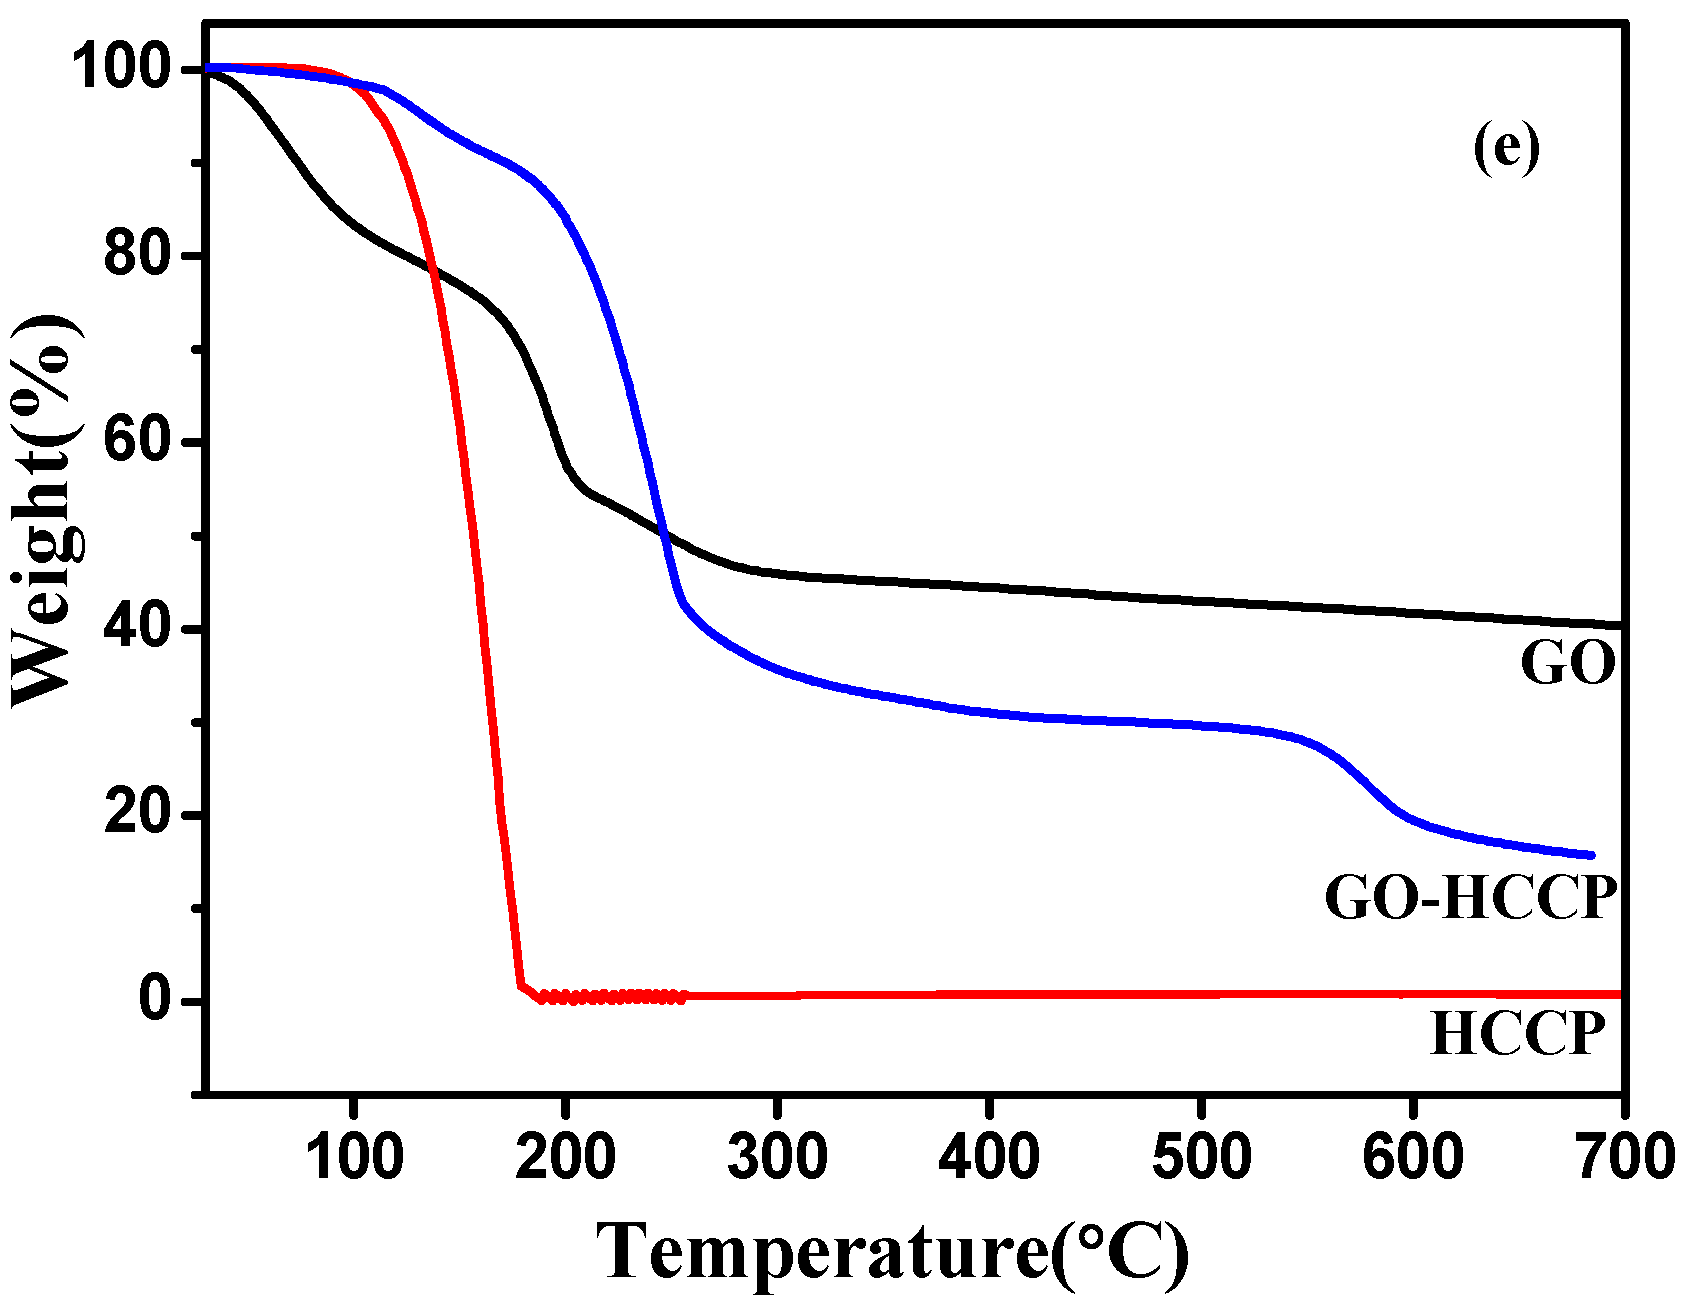
3 defects disordered the graphene structure. Based on the aforementioned discussion, it is reasonable to state that functionalization of flame-retard GO-HCCP has been successfully synthesized with strong GO-HCCP chemical bonds. According to the decreasing mass in TGA, the grafted mass was approximately 26.62% compared with the mass of GO.
The SEM and energy-dispersive X-ray spectroscopy (EDS) image were showed in
Figure 4. As we can see from the image, the surface of GO-HCCP contains a lot of C, O and P. At the same time, P element is homogeneously dispersed on the surface of lamellae, indicating the evenly grafting of HCCP.
3.3. Mechanism of Flame Retardation
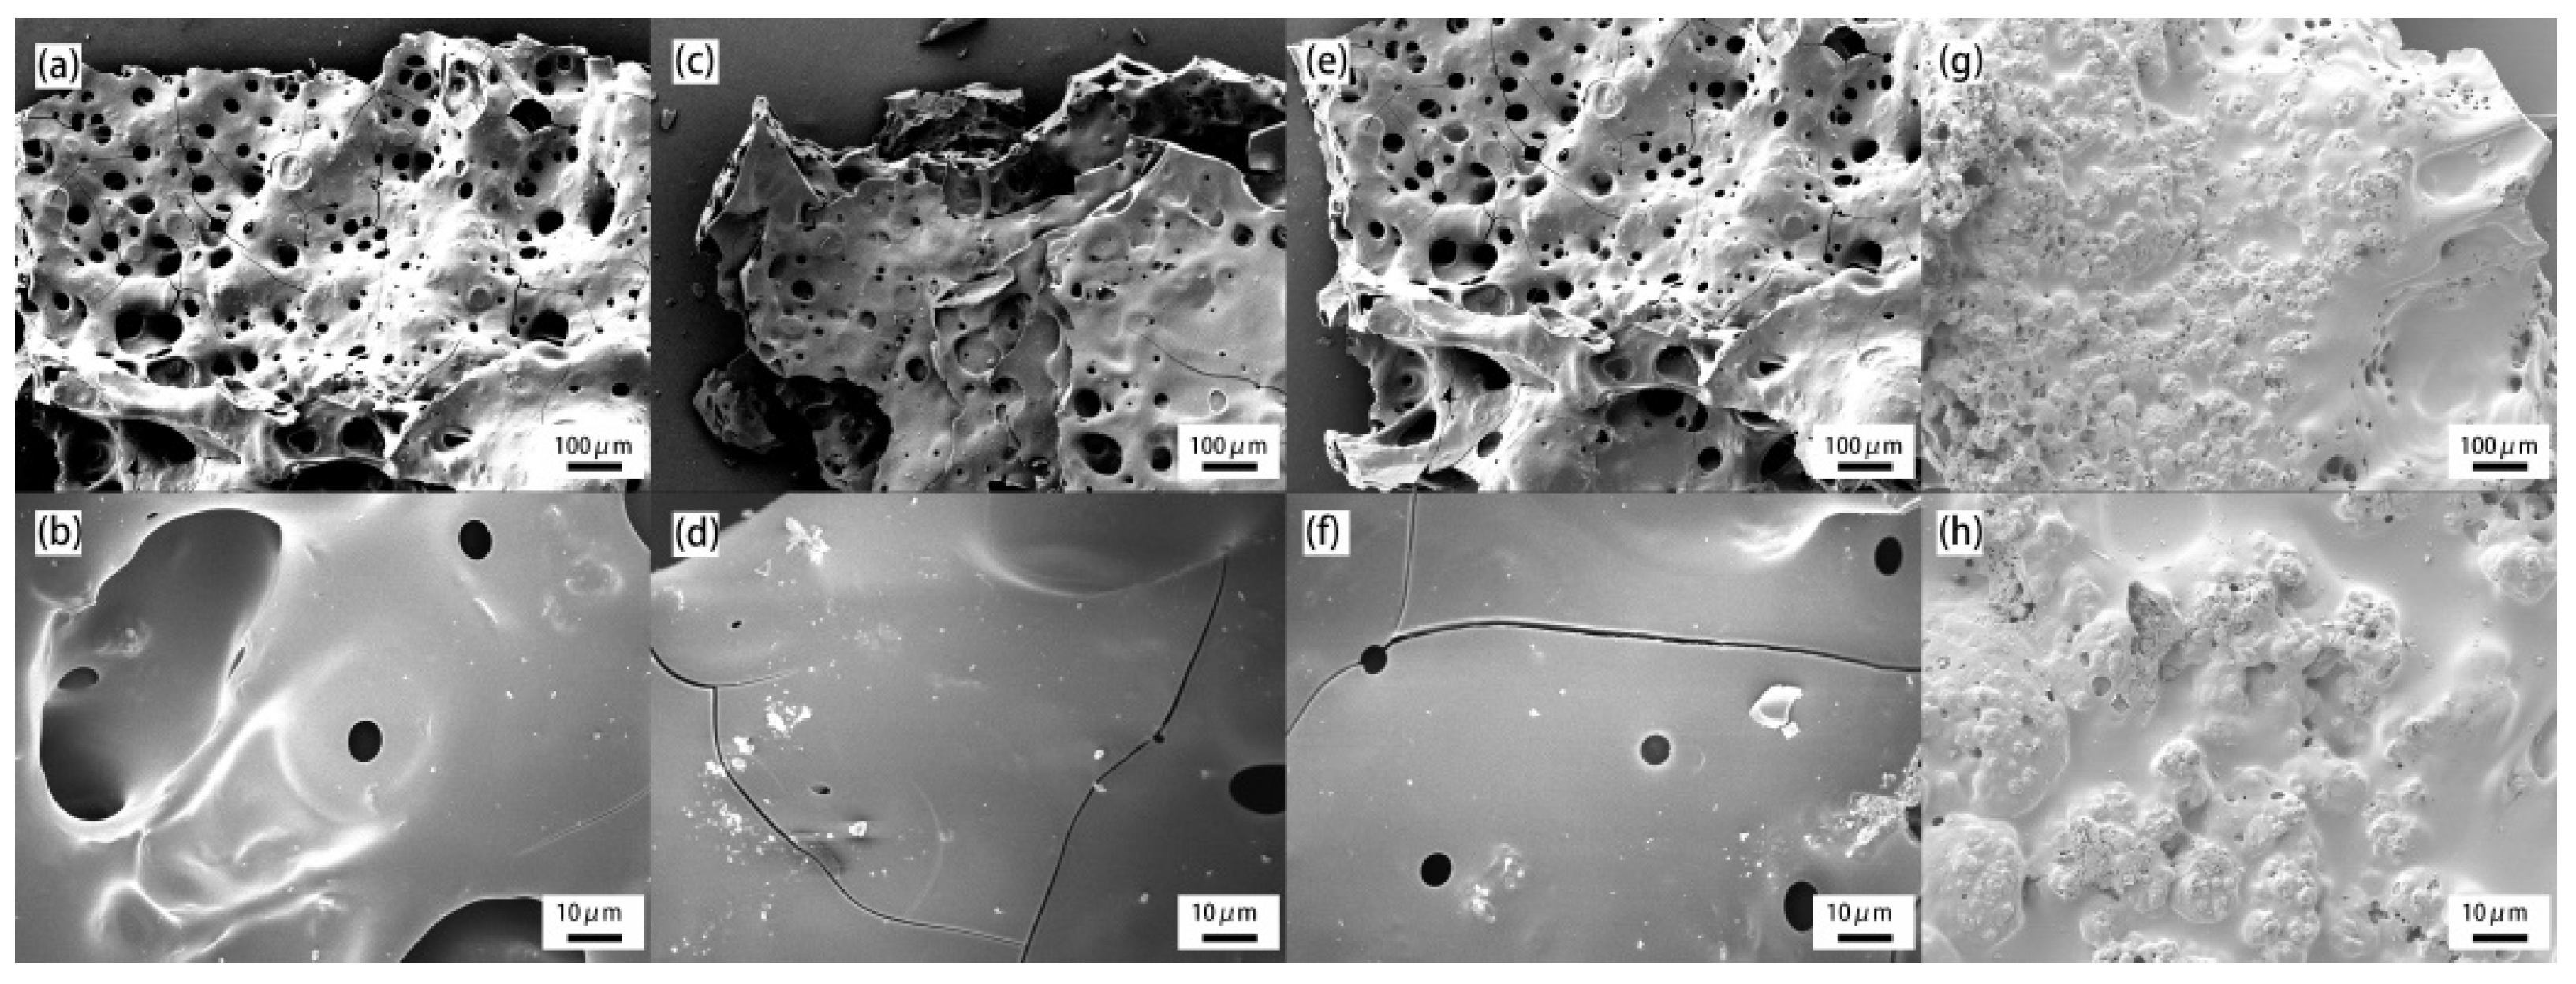
To further investigate the flame retardation mechanism, the microstructures of the residual char were observed by SEM.
Figure 7 shows the SEM image for char residue of PET and its composites at amplification power of 100 × (100 μm) and 500 × (10 μm), respectively. It is clearly seen that pure PET formed a char residue structure with cracks and many large holes, indicating a low effective barrier layer. When GO or HCCP are separately added to PET, the densities of the hole are slightly lower compared to that of pure PET. However, there are still big cracks in the char layer due to the release of gas, which make it hard to isolate the heat and mass transfer during combustion. In the case of PET-0.4G-0.2H, a swelling and continuous char was obtained on the surface of PET-0.4G-0.2H, and there was a higher char density with smaller holes. This is due to the combined effect of the graphene barrier and the P-O-C structure in the char layer.
Real-time Fourier transforms infrared spectroscopy (RTFTIR) was employed to reveal the evolution of chemical structures during thermally oxidative degradation of materials.
Figure 8 depicts the spectra of PET and its composites at different temperatures. There are two peaks at 1451 and 2963 cm
−1 corresponding to bending vibrations and stretching vibrations of -CH
2- in the aliphatic chain for pure PET. The peaks at 1239 and 1712 cm
−1 were assigned to the stretching vibrations of C-O-C and C=O, respectively. Moreover, the peak located at 1408, 871 and 721 cm
−1 belongs to the skeleton, otho-position H and bending vibrations of benzene. When the pyrolysis temperature exceeds 400 ℃, the intensity of the peak drops sharply due to the decomposition of unstable aliphatic chain and C-O-C bonds. However, it is worth noting that there is still obvious absorption such as 1597, 818 and 698 cm
−1 at 600 °C, implying the presence of many benzene and double bonds in the char layer. Compared with pure PET, the peak at 1174 cm
−1 assigned to the P-O-C vibration in PET-0.4G-0.2H indicates the reaction of EG and GO-HCCP with high thermal stability. Therefore, the char layer composed of phosphorous-carbon complexes can be used as an effective barrier to the decomposition of the protective matrix at high temperatures [
39].
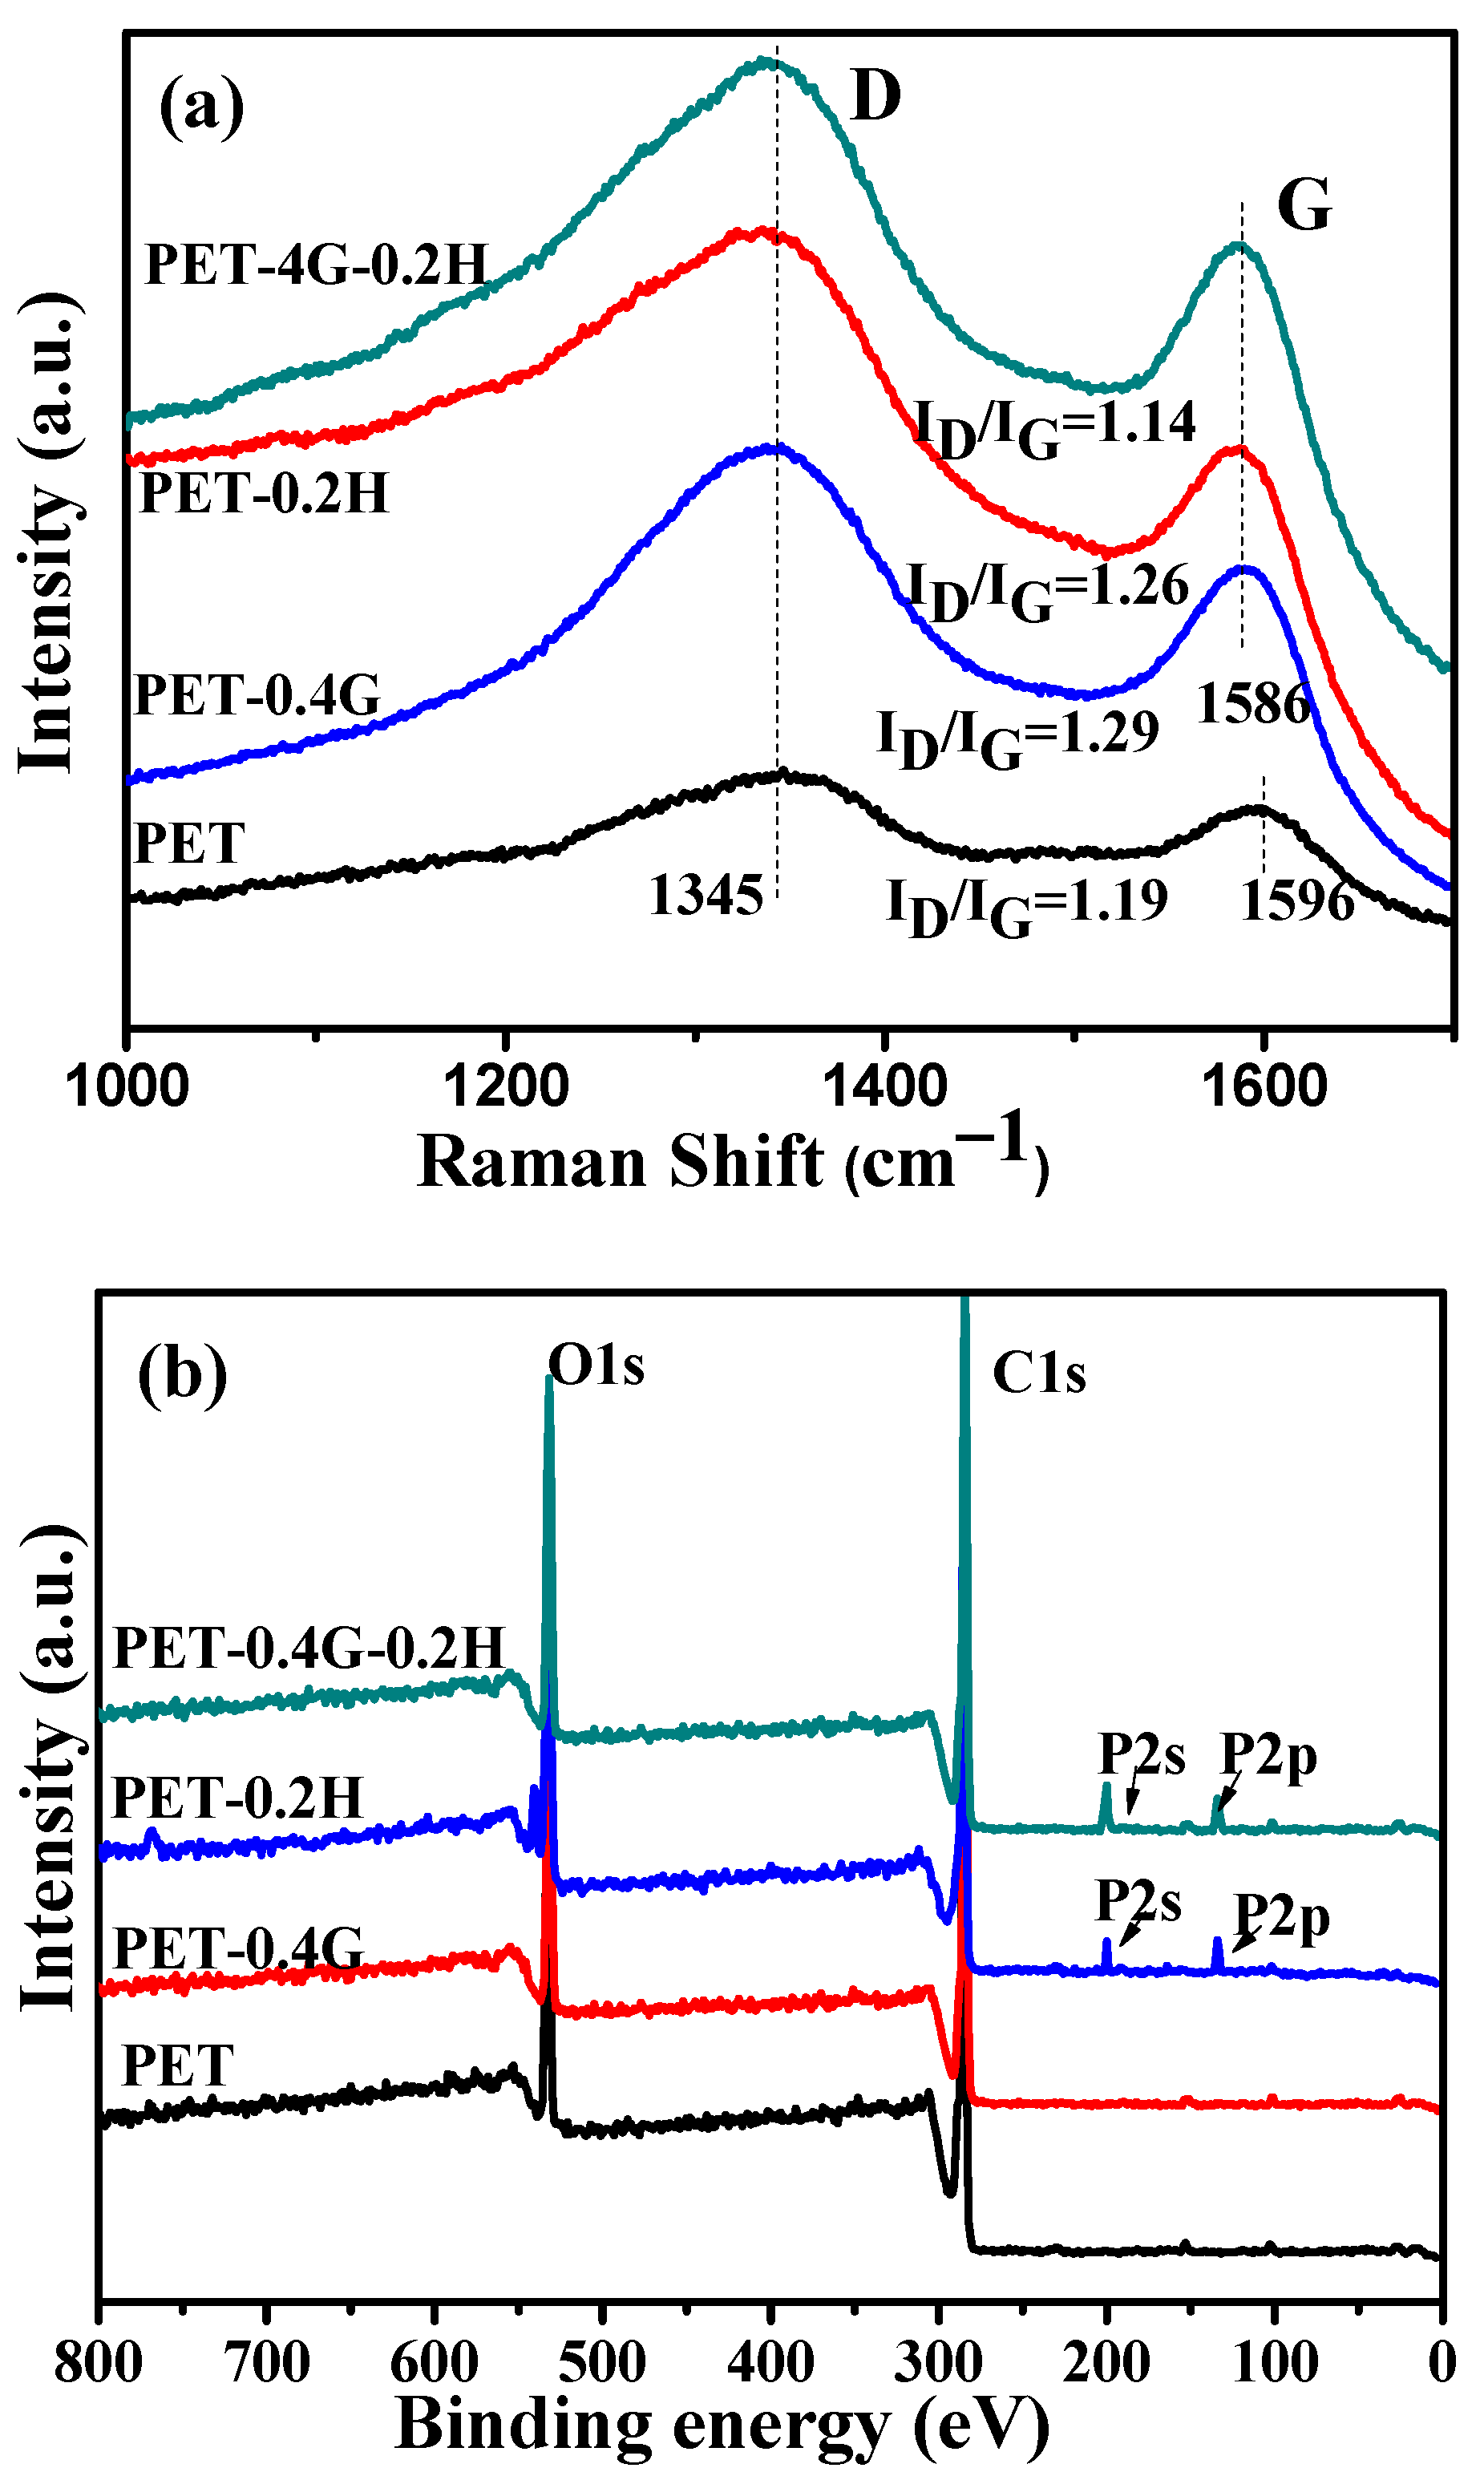
As we can see in
Figure 9a, for neat PET, the intensity ratio I
D/I
G of the residue char was about 1.19. The incorporation of GO increases the value of I
D/I
G to 1.29, which is due to the good thermal conductivity of GO. However, the presence of GO-HCCP reduces the I
D/I
G values of the char to 1.14, which indicates the increases in graphitized carbon in the residue char. Hence, GO-HCCP enhances the char layers density and strength and shields the mass and heat transfer during the combustion process.
To further explore the structure of char residue, XPS was performed to investigate the composition of char residue of samples.
Figure 9b shows the XPS spectra of the char residue of neat PET and its composites. In the wide spectra, four spectra show sharp peaks at 285.8 and 533.5 eV, corresponding to C and O elements, respectively. However, PET-0.2H and PET-0.4G-0.2H had the additional P2s peak at 134.7 and P2p peak at 190.9, suggesting the existence of phosphorus-based derivatives on the surface of residue char. The existence of phosphorus-based derivatives not only significantly increases the heat resistance of the materials, but also enhances the char-forming ability, so the PET-0.4G-0.2H is highly flame-retardant.
To study the thermal degradation process, Py-GC-MS tests were carried out to monitor the pyrolysis behaviors of PET and PET-0.4G-0.2H. The resulting data are shown in
Table 6 and
Figure 10 and
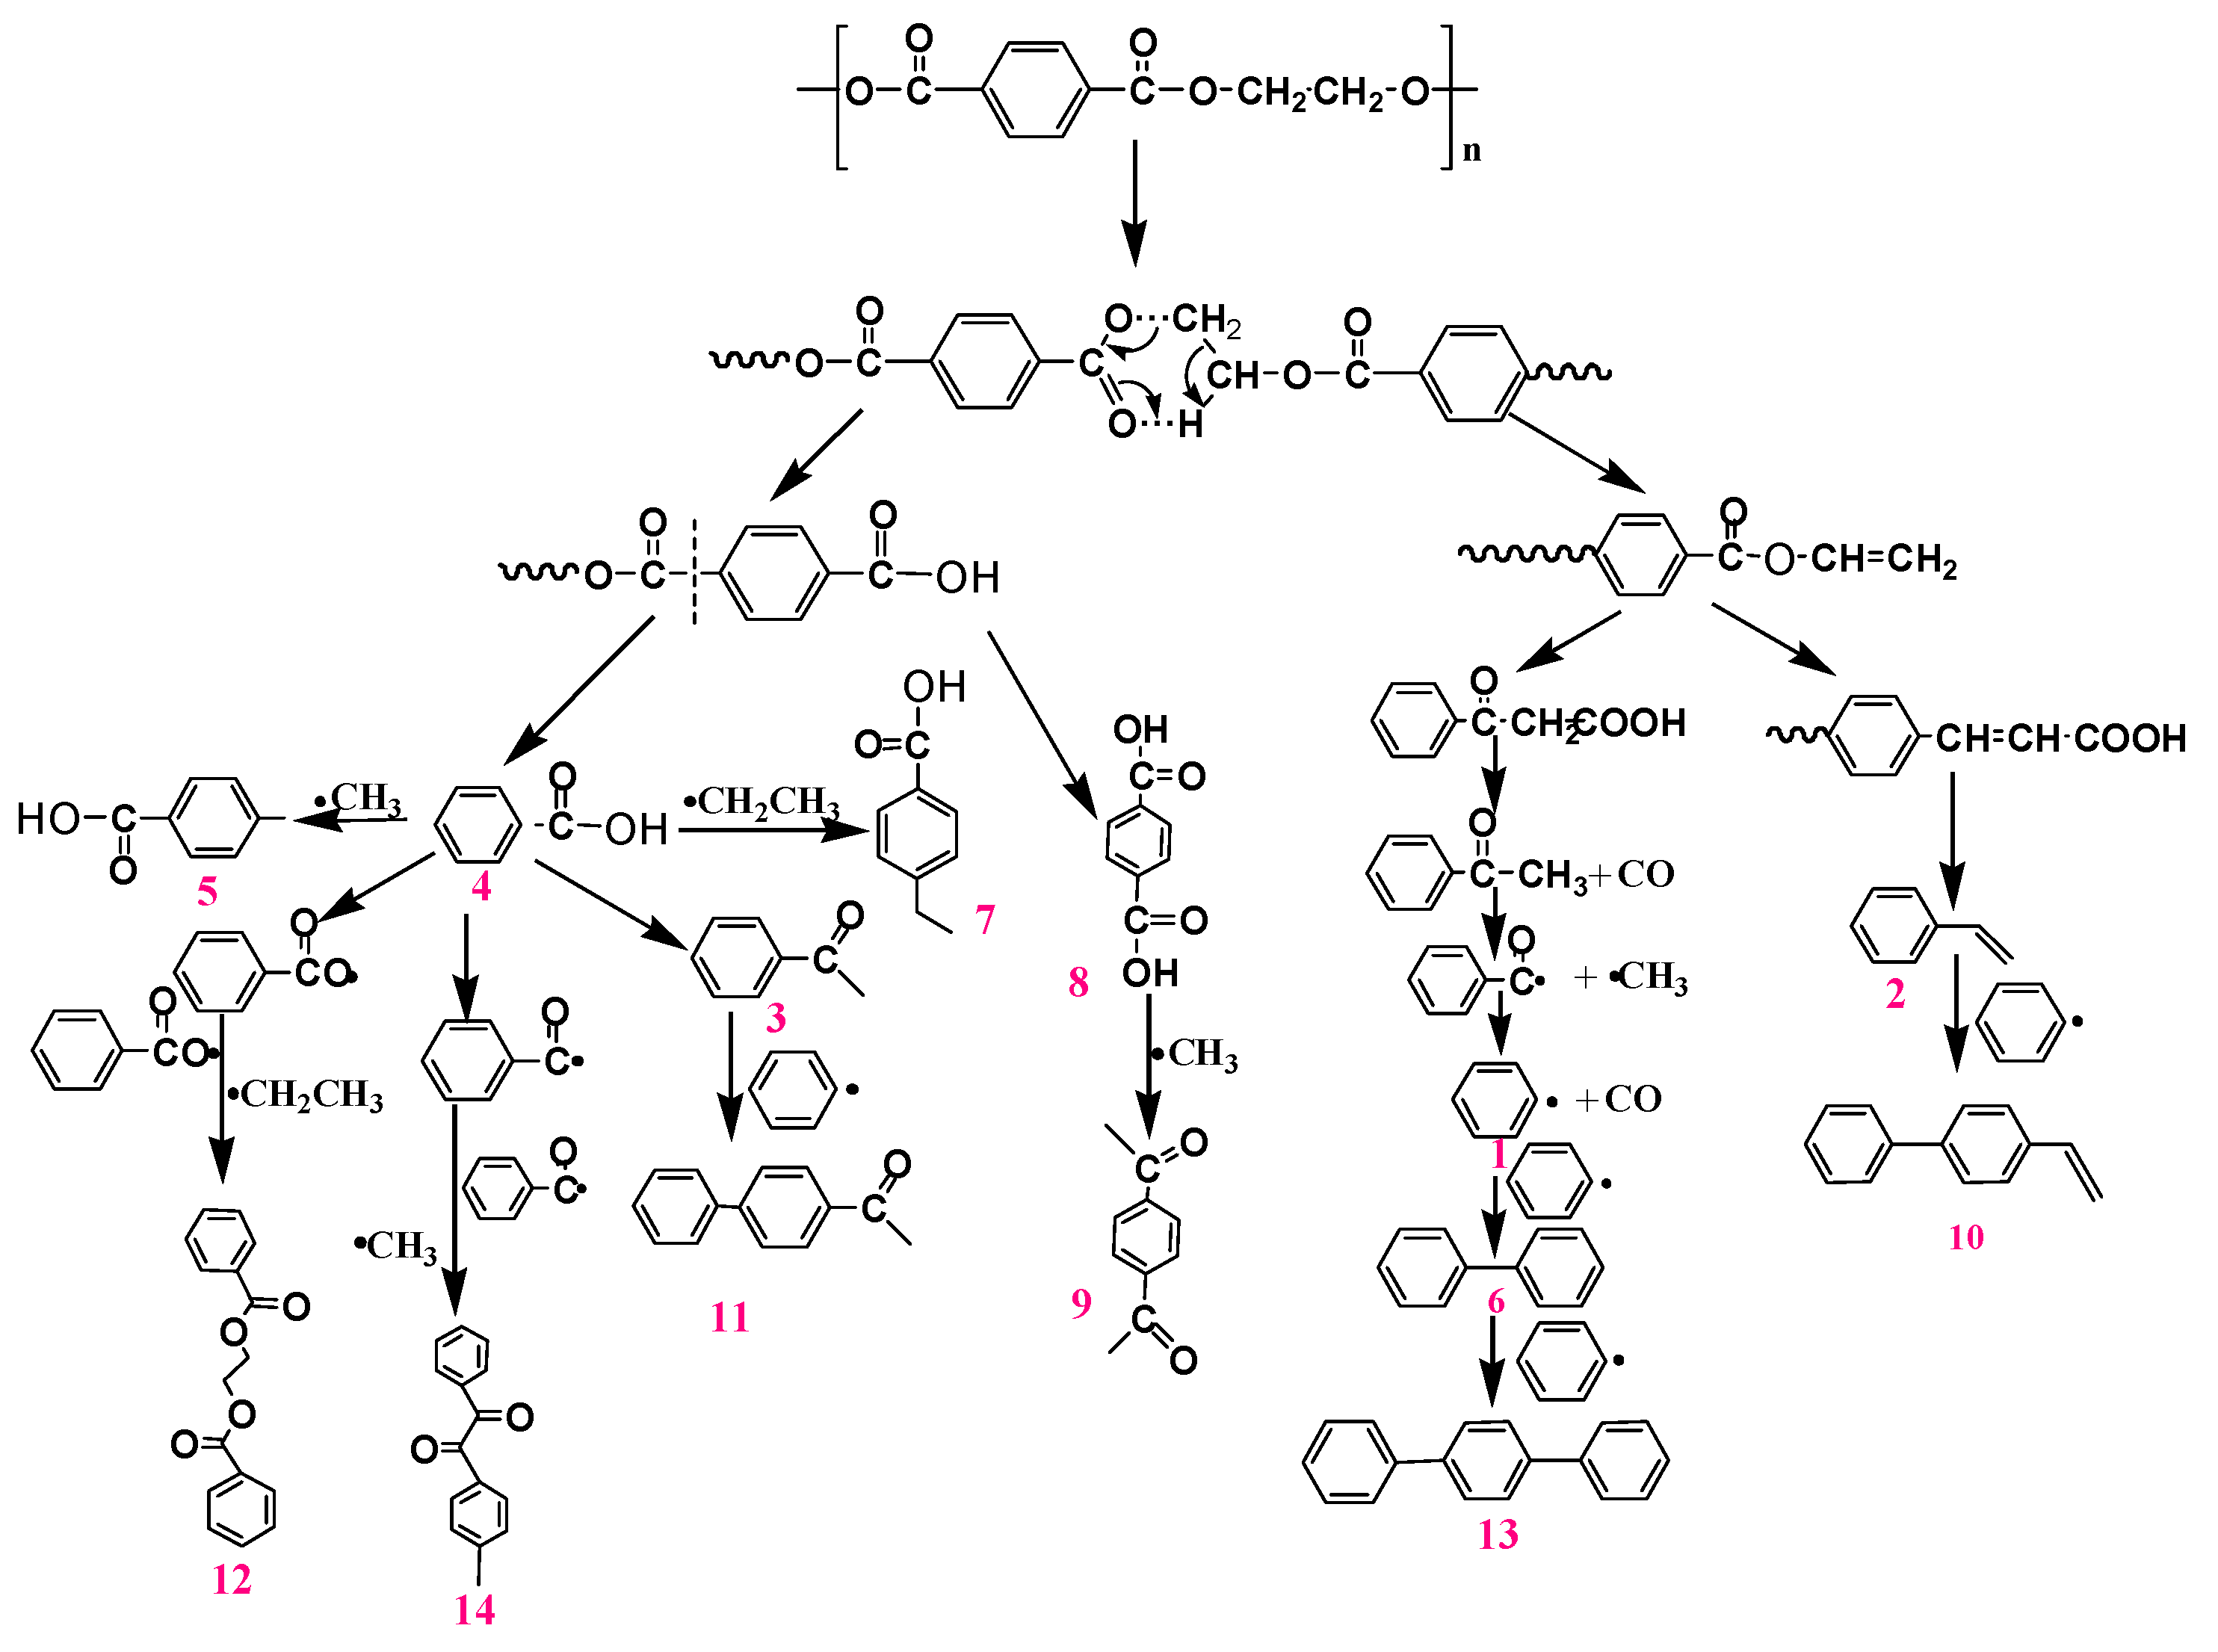
Figure 11. The main pyrolysis products of neat PET are 34.1% Benzoic acid, 8.7% Terephthalic acid, 8.5% Methyl benzoate, 7.6% benzene, 7.2% Bibenzene, 6.3%p-ethylbenzoic acid, 5.1% Styrene, 5.0% p-Acetylacetophenone and 3.9% Acetophenone [
40]. Based on the results, the proposed pyrolysis process of PET is shown in
Figure 10. The PET generates carboxylic acid and olefinic end groups through a classical ester scission reaction were further transformed by ester scission, rearrangement and radical reactions.
Compared with neat PET, the pyrolysis products after the addition of the 0.4G-0.2H represents some differences in the relative concentrations and composition. The proposed pyrolysis process for PET-0.4G-0.2H is shown in
Figure 11. The main pyrolysis products were 39.6% Benzoic acid, 11.3% Terephthalic acid 7.2% p-Acetylacetophenone, 5.2% benzene, 4.8% Methyl benzoate, 4.6% Terephthalic acid, 4.3% Bibenzene, 3.7% Styrene, 3.1% Acetophenone. The contents of benzene acid increased obviously, which indicates that the degradation of PET was inhibited, while the contents of benzene showed a significant decrease, which demonstrated the GO-HCCP could restrain the further degradation of benzene acid. The decline of styrene and methyl benzoate indicated that the deep degradation of olefinic end group was restrained, which can explain the improvement in thermal stability of the PET-0.4G-0.2H. Moreover, the decrease in biphenyl and terphenyl indicates that the presence of GO-HCCP could slow down the degradation process of PET.
Besides the pyrolysis product mentioned above, about 5.6% of newly formed pyrolysis products were formed at the retention time from 17 to 21 min, including 1, 2, 4-benzenetricarboxylic acid, 3, 5-dinitro-, trimethyl ester, Phthalazine-1,4(2H,3H)-dione, 2-(2-methyl-5-nitrophenyl), 5-Ethyl-5-phenylhydantoin, 8, 10, 18, 20, 21, 23-hexaene-2, 7, 12, 17-tetrone and o-(4, 6-Diphenyl-1, 3, 5-triazin-2-yl)phenol. These products were mainly amino group and triazine radicals generated by the decomposition of GO-HCCP generated, which reacted with phenyl and carboxylic acid generated by the pyrolysis reaction of PET to generate an orthophenanthroline ring, ammonia acid, nitriles, and nitrogen heterocyclic ring [
41]. These products played an important part in suppressing deacidification and free radical reactions and thus catalyzing the formation of the char layer.
Combining the results of flammability measurements, the morphology of the char and TGA, the possible flame-retardant mechanism shown in
Figure 12 is proposed as follows: (i) the tortuous path effect and barrier effect of GO can insulate the permeation of oxygen and volatile flammable gases, thereby decreasing the release of heat and smoke; (ii) the diluting and quenching effect of HCCP can reduce the concentration of oxygen and flammable gases, which can restrain combustion in gas phase effectively; (iii) phosphorus-based derivatives formed in condensed phase can significantly promote the formation of protective layer, preventing composites from the radiant heat and direct contact with flame. In addition, the grafted GO can homogenize the dispersion, which is of great value and significance for the further reduction of pHRR, pSPR and COP of PET.


