Article

Kinetics of Dehydroxylation and Decarburization of Coal Series Kaolinite during Calcination: A Novel Kinetic Method Based on Gaseous Products

1
College of Materials Science and Engineering, Xi’an University of Architecture and Technology, Xi’an 710055, China
2
Shaanxi Ecological Cement Concrete Engineering Technology Center, Xi’an 710055, China
*
Author to whom correspondence should be addressed.
Materials 2021, 14(6), 1493; https://doi.org/10.3390/ma14061493
Submission received: 18 February 2021 / Revised: 13 March 2021 / Accepted: 15 March 2021 / Published: 18 March 2021

Abstract

:
The analysis of gaseous products reveals the characteristics, mechanisms, and kinetic equations describing the dehydroxylation and decarburization in coal series kaolinite. The results show that the dehydroxylation of coal series kaolinite arises from the calcination of kaolinite and boehmite within the temperature range of 350–850 °C. The activation energy for dehydroxylation is 182.71 kJ·mol−1, and the mechanism conforms to the A2/3 model. Decarburization is a two-step reaction, occurring as a result of the combustion of carbon and the decomposition of a small amount of calcite. The temperature range in the first step is 350–550 °C, and in the second is 580–830 °C. The first step decarburization reaction conforms to the A2/3 mechanism function, and the activation energy is 160.94 kJ·mol−1. The second step decarburization reaction follows the B3 mechanism function, wherein the activation energy is 215.47 kJ·mol−1. A comparison with the traditional methods proves that the kinetics method utilizing TG-FTIR-MS is feasible.

1. Introduction

Coal plays a vital role in the current energy supply worldwide, especially in China [1]. Coal series kaolinite (CSK) is one of the foremost types of coal gangue, with confirmed reserves of 1.673 billion tons and prospective reserves of 5.529 billion tons in China alone [2]. Worldwide, CSK is also distributed in major kaolin producing countries such as the United States, Australia, the United Kingdom, Russia, the Czech Republic, Germany, and Brazil, among others. CSK is typically abandoned as coal mine waste, resulting in serious ecological and environmental pollution [3,4]. However, CSK is an ideal resource for replacing high-quality natural kaolin. Calcination is a typical method to achieve high chemical reactivity of CSK prior to further applications, such as preparation of calcined kaolin products and metakaolin cementitious materials [5,6]. Dehydroxylation and decarburization are the main reactions during the calcination of CSK [7,8,9]. The activity of metakaolin prepared from CSK depends essentially on the dehydroxylation reaction. However, the whiteness of addition agents from CSK (used in paints, plastics, coatings, and ceramics) is significantly affected by the decarburization reaction. Therefore, it is essential to characterize the dehydroxylation and decarburization reactions in CSK and to study their reaction characteristics, mechanism, and kinetics.
The traditional thermal analysis method, based on the data of mass or heat by Thermogravimetric analysis-Differential Scanning Calorimetry (TG-DSC), is commonly used for reaction kinetics [10,11,12,13,14,15]. The decarburization and dehydroxylation reactions in CSK are synchronous, and the mass loss and exothermic heat generation are almost simultaneous. Therefore, the decarburization and the dehydroxylation in CSK cannot be characterized by either the mass or heat, which is a major challenge for CSK calcination. The kinetics calculated from TG/DSC data present the apparent characteristics of the whole calcination reaction of CSK, but not the real characteristics of dehydroxylation and decarburization [5,16,17]. Nonetheless, the gaseous products released by the reactions in CSK are different, which can be distinguished by detecting product release. With the development of thermal analysis technology, Thermogravimetric analysis-Fourier Transform Infrared Spectrometer-Mass Spectrometer (TG-FTIR-MS) technology has been widely used to detect gaseous products [18,19,20]. In TG-FTIR-MS, the gaseous products can be detected and identified by the FTIR detector. The release flows of gaseous products can be recorded by MS, providing an effective means for analyzing complex reactions [21]. There are several applications of TG-FTIR and TG-MS, combined for the analysis of reaction mechanisms and kinetics, but there has been no report till date on the kinetics of CSK [22,23,24]. Hence, it is necessary to study the mechanisms and kinetics involved in the dehydroxylation and decarburization of CSK based on the analysis of gaseous products by TG-FTIR-MS.
In the present work, the TG-FTIR-MS method was used to identify and quantify the gaseous products of CSK under calcination. Three kinetic methods were used by gas product flow data instead of TG/DSC to calculate the kinetic equations. The mechanisms and kinetics of dehydroxylation and decarburization during the calcination of CSK were obtained, respectively. A comparison with the traditional methods revealed the advantages of the kinetic method by TG-FTIR-MS. The work in this paper provided a theoretical basis for the fine control of dehydroxylation and decarburization in CSK calcination. In addition, it provided guidance for the process design, energy saving, and pollutant control of green building materials and high-quality calcined kaolin products prepared by CSK.

2. Experiment and Methods

2.1. Raw Materials

The CSK samples were taken from interbedded coal gangue of Junggar coalfield in Inner Mongolia, Ordos, China. A total of 30 tons of samples collected in the same batch were broken into small pieces of about 3–5 cm by a crusher. Approximately 50 kg of CSK was taken out by multi-point sampling method and broken into particles with a particle size of less than 3 mm. A ceramic ball mill was used to grind the sample into powder with a particle size of less than 80 μm. Before grinding, the powder sample was dried in an electric oven at 105 °C for 4 h. The raw materials were characterized by X-ray diffractometer (XRD), X-ray fluorescence (XRF), and flammability analysis.

2.1.1. XRD Analysis

An X-ray diffractometer (XRD, D/MAX-2200, Japan Rigaku Corporation, Akishima City, Tokyo, Japan) was used to analyze the mineral composition of the raw material. The conditions of the instrument were Cu target Kα ray, tube voltage of 45 kV, and tube current of 40 mA. Figure 1 shows the XRD patterns of the CSK.
The CSK sample largely contained kaolinite, boehmite (AlO(OH)), and calcite (CaCO3), as well as a small amount of oxidized minerals of Pb, Zr, and Ti.

2.1.2. XRF Analysis

An X-ray fluorescence spectrometer (XRF, S4PIONEER, German Bruker Company, Karlsruhe, Germany) was used for elemental analysis of the raw material. The X-ray tube parameters were 4.2 kW, 60 kV (Max), and 140 mA (Max). Table 1 provides the results of the XRF analysis of CSK.
The primary chemical elements present in the CSK were silicon, aluminum, calcium, and titanium, along with some trace elements, such as iron, potassium, magnesium, sulfur, and phosphorus. According to the semi-quantitative calculation from Figure 1 and Table 1, the contents of kaolinite and boehmite in CSK are 72.82 wt.% and 19.17 wt.%, respectively.

2.1.3. Flammability Analysis

The flammability of CSK was analyzed by the method specified in the Chinese Coal Industry Analysis Standard (GB/T212-2008). The analysis results are shown in Table 2. The carbon content of CSK is 2.62 wt.%.

2.2. TG-FTIR-MS Analysis

A thermal analyzer (NETZSCH 409PC STA, German), infrared spectrometer (Bruker FTIR-7600, Karlsruhe, Germany), and mass spectrometer (Perkin Elemer SQ8T, Norwalk, CT, USA) were used to study the calcination of CSK. The ion source of MS was an electron bombardment source, and its working temperature was 250 °C. The temperature of the transmission pipeline was 280 °C, the electron bombardment energy was 780 eV, and the scanning mode was the full scanning mode. The test parameters were 90% N2 + 10%O2 atmosphere (similar to the composition of industrial waste gas); flow rate of 75 mL/min; heating rates of 5 °C/min, 10 °C/min, 15 °C/min, and 20 °C/min; sample mass of 6.0 ± 0.5 mg; and temperature range from ambient to 1000 °C. By analyzing the TG, FTIR, and MS data, the gaseous products released in the process of CSK calcination were identified and quantified. The characteristics for dehydroxylation and decarburization of CSK were analyzed by analyzing the mass spectrum data of gas products.

2.3. Theory and Mathematical Methods

A typical kinetics equation for the solid-state reduction process can be expressed as follows [25,26,27]:
dα/dt = k(T)f(α)
where α is the degree of decomposition, dα/dt is the decomposition rate, and f(α) is the function of α. k(T) pertains to the temperature-dependent decomposition rate constant, expressed by the Arrhenius equation as follows:
k(T) = A·exp(−Ea/RT)
where A is the pre-exponential factor (s−1), R denotes the gas constant (8.314 J·K−1mol−1), and T is the absolute temperature (K). Ea represents the apparent activation energy (kJ·mol−1), typically termed as the minimum energy required to overcome the energy barrier for the reaction and to form products [28].
For the linear heating rate test method, the heating rate is constant. The relationship between β, T, and t is as follows:
β = dT/dt
Substituting Equations (2) and (3) into Equation (1), the expression of reaction rate is obtained as follows:
dα/dT = A/β·exp(−Ea/RT)f(α)
Equation (5) can be obtained by separating the variables and rearranging and integrating Equation (4).
G(α) = ∫0αdα/f(α) = A/β·∫T0Texp(−Ea/RT)dT
where G(α) is the integral form of the reaction mechanism function and T0 is the initial temperature of the non-isothermal experiment. Equation (5) is the kinetic equation in the integral calculus form.
The degree of decomposition (conversion) α characterized by TG-FTIR-MS is as follows:
α = St/S
where St and S are the partial and total areas of the peak in the mass spectrum curve of gaseous products, respectively.
The general integral method, the Mac Callum–Tanner method, and the Satava–Sestak method were used to calculate the mechanism function G(α) and pre-exponential factor A [29].
The equation for the general integration method is as follows:
ln[G(α)/T2] = ln{(AR/βEa)[1 − 2(RT/Ea)]} − Ea/RT
The equation of the Mac Callum–Tanner method is as follows:
ln[G(α)] = ln{(AEa/βR) − 0.4828Ea0.4357 − (449 + 217Ea)/T
The Satava–Sestak equation is presented as follows:
lgG(α) = lg(AEa/Rβ) − 2.315 − 0.4567Ea/RT
In accordance with the linear relationship, the optimal mechanism function can be obtained by the least square method. Apparent activation energy Ea and pre-exponential factor A were calculated from the slope and intercept of the fitted line, respectively. Table 3 lists quite a few of the common mechanism functions of G(α) for solid-state reactions [29].
The self-developed kinetics program based on these theories was used to calculate the kinetics of dehydroxylation and decarburization of CSK.

3. Results and Discussion

3.1. Thermal Analysis

The TG–DTG curves of CSK are shown in Figure 2.
The weight loss of CSK during heating largely occurred within the range of 330–850 °C. A small and hardly visible mass loss observed in the temperature range of 50–150 °C (DTG, shown in Figure 2) is associated with the loss of adsorbed water [30]. There were two stages of CSK calcination distinctly visible from DTG. The first stage started at 330 °C and ended at 590 °C–640 °C. The second stage lasted until about 850 °C. At the end of the second stage, the weight of the sample hardly underwent any change. The characteristic temperatures are listed in Table 4. The mass loss at different heating rates is shown in Figure 3.
The mass losses in the first stage were 13.71 wt.%, 13.63 wt.%, 11.95 wt.%, and 11.89 wt.%, corresponding to the heating rates of 5 °C/min, 10 °C/min, 15 °C/min, and 20 °C/min, respectively. The average value of the first stage at these four heating rates is 12.80 wt. %. The second stage mass losses were 5.33 wt.%, 4.53 wt.%, 4.22 wt.%, and 3.58 wt.%, with an average value of 4.42 wt.%. The first stage mass loss is about three times that of the second stage, indicating that the first stage reaction is the dominant one. As the heating rate increases, the mass loss decreases, which is similar to the phenomenon reported in the literature [30]. This phenomenon can be explained from the perspective of heat transfer. With the increase in heating rate, the time needed to reach a specific temperature is shortened. Thus, the material with larger particles is not evenly heated, resulting in the reduction of the degree of reaction [31,32].

3.2. Infrared Analysis

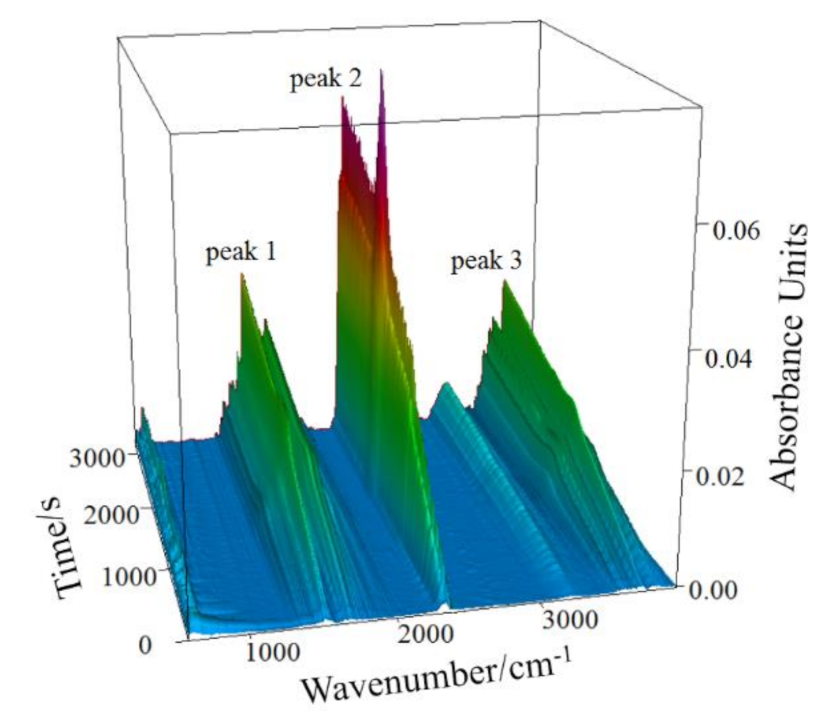
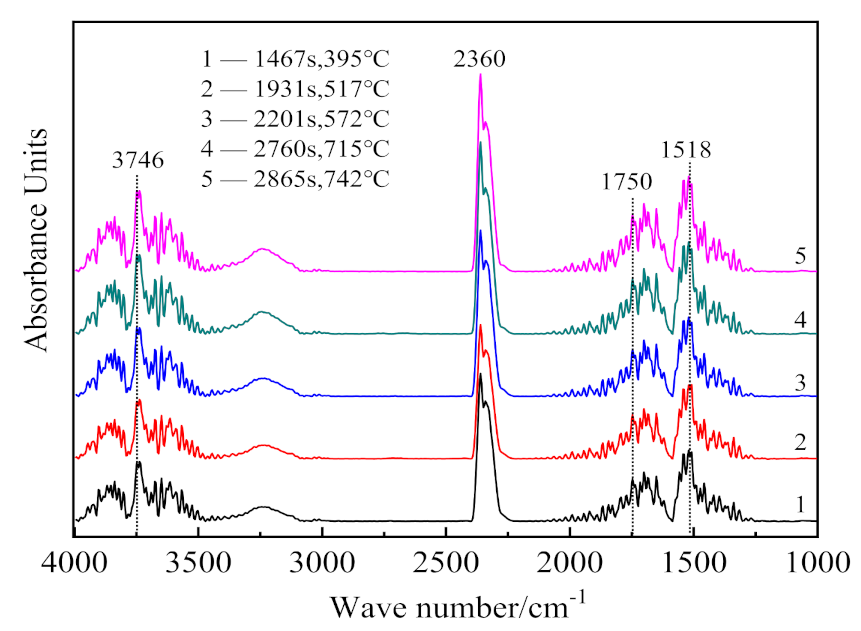
Figure 4 presents the infrared absorption spectrum (3D) of gaseous products released in the thermal analysis at the 10 °C/min heating rate. The results of infrared spectrum analysis of gaseous products at different times are shown in Figure 5.
In Figure 5, the infrared absorption at 3700 cm−1 is associated with the inner-surface O-H stretching, and that at position 3660 cm−1 is attributed to the inner-cage O-H stretching of kaolinite [33]. The hydroxyl groups bending vibrations exist at 1518 cm−1 and 1750 cm−1 [34]. Asymmetrical stretching and bending vibrations of CO2 occur at 2360 cm−1 [35]. Thus, the infrared absorption of gaseous products released during the CSK calcination is mainly due to O-H and C-O groups. As the major mineral phases in the sample are kaolinite, boehmite, and calcite, it can be concluded that the gaseous products of CSK calcination are H2O(g) and CO2. Comparing Figure 4 with Figure 5, peak 1 and peak 3 in Figure 4 correspond to the absorption of H2O(g), and peak 2 corresponds to the absorption of CO2.

3.3. Mass Spectrometry Analysis

In a mass spectrometer, H2O(g) and CO2 in gaseous products produce various fragments with different charge-to-mass ratios. The charge-to-mass ratios of M18 and M44 were selected to represent H2O(g) and CO2, respectively. The release intensities (abundance) at different temperatures of M18 and M44 by MS are shown in Figure 6 and Figure 7, respectively.
As shown in Figure 6, the release of H2O(g) is largely from 350 and 750 °C, which indicates that the dehydroxylation of CSK occurs in that temperature range. There is a single peak in the release curves of H2O(g) at different heating rates, indicating that the dehydroxylation of CSK is a continuous reaction. The temperatures for the maximum dehydroxylation rate were 518.3 °C, 536.7 °C, 554.3 °C, and 564.5 °C at the heating rates of 5 °C/min, 10 °C/min, 15 °C/min, and 20 °C/min, respectively. The peak of the release curve moves to the high-temperature region with the increase in heating rate, consistent with the trend in Figure 2.
There are two peaks in the release intensity curve of M44 at different heating rates (as shown in Figure 7), indicating that the decarburization of CSK was a two-step reaction. The temperature range of the first step decarburization was roughly 350–620 °C, and that of the second was 580–840 °C. The carbon found in CSK samples mainly comes from coal and a small amount of calcite. As the decomposition temperature of calcite is higher than 800 °C, the two-step reaction displayed the actual characteristics of CSK decarburization [36]. The peak area on the right side of the curves in Figure 7 was much larger than that on the left side, indicating that the second step reaction was the major CSK decarburization stage.
Figure 8 shows the temperature ranges of the CSK calcination stage by TG/DTG and that by MS at four heating rates.
As shown in Figure 8a–d, there is a significant overlap between the temperature ranges for the dehydroxylation and decarburization during CSK calcination. The temperature range for decarburization covered the whole temperature range of dehydroxylation. Nonetheless, the two reaction stages divided by TG/DSC did not conform to either dehydroxylation or decarburization, thus the physical meaning was not clear. Hence, the kinetics calculated according to the temperature range by TG/DSC did not provide an actual physical meaning.

3.4. Kinetics Analysis

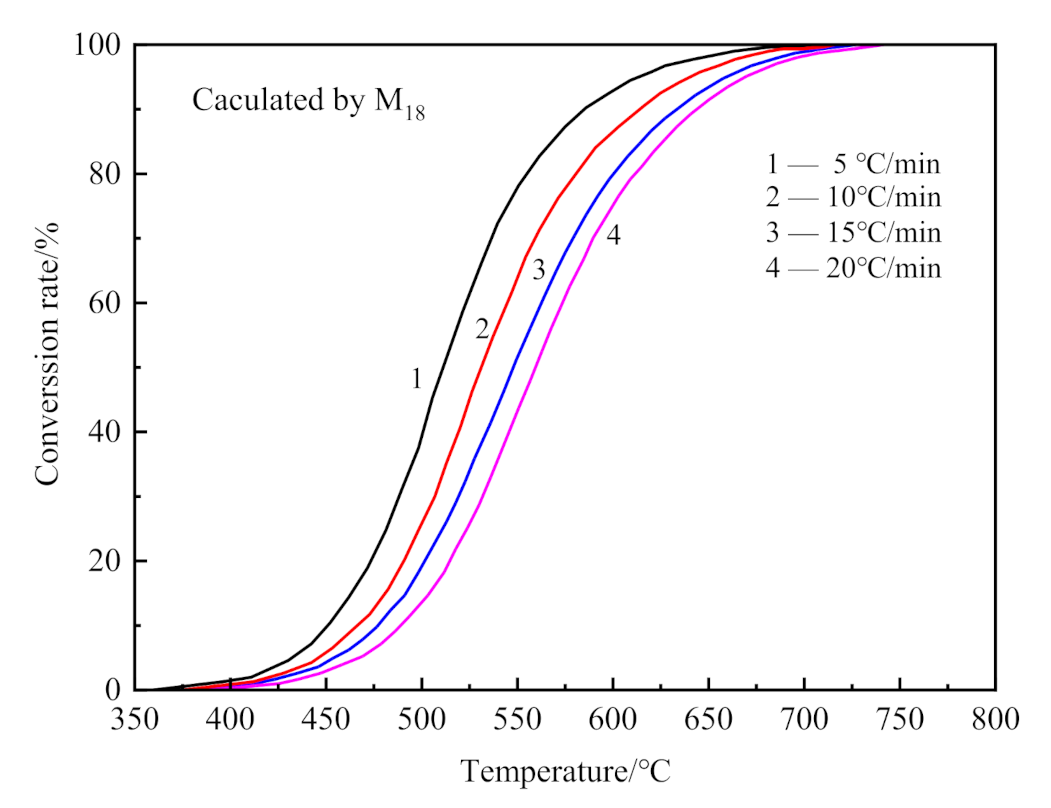
The kinetics of dehydroxylation and decarburization in CSK calcination were analyzed from MS data. The conversion curve for dehydroxylation of CSK is shown in Figure 9, calculated from MS curves in Figure 6 by Equation (6).
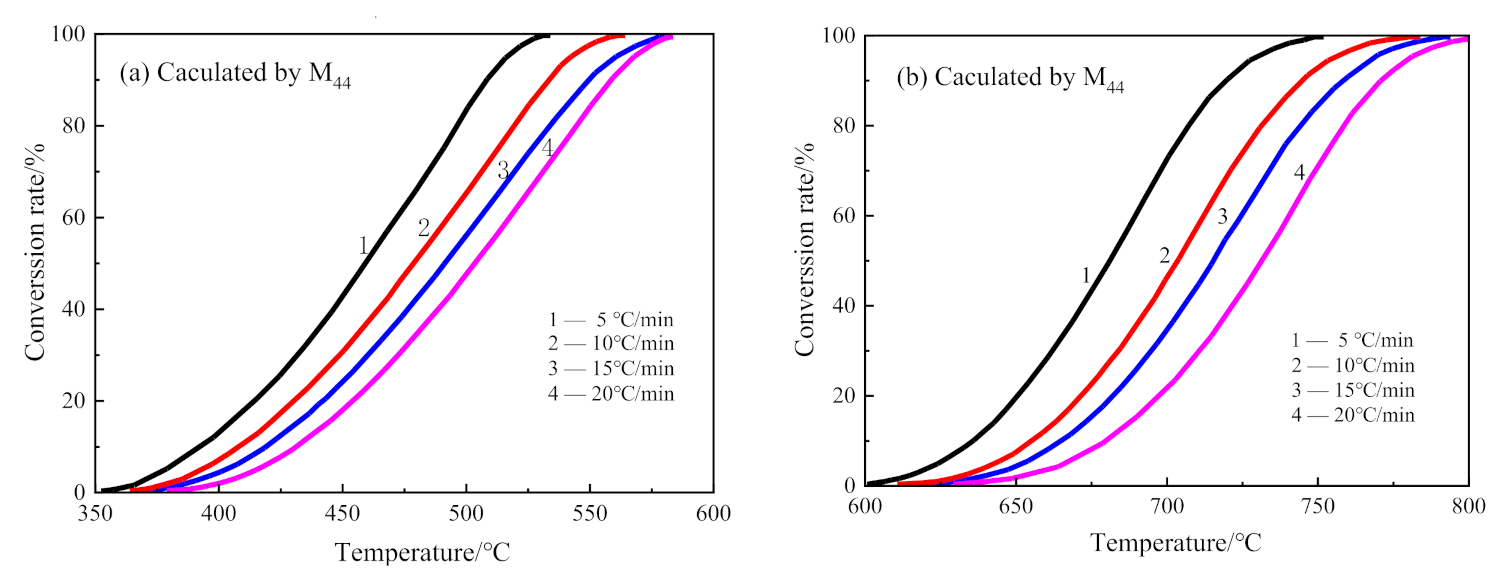
The decarburization of CSK was a two-step reaction. Hence, the conversion curves for each step reaction were calculated separately. The conversion rate curves of the first step decarburization and the second decarburization are shown in Figure 10a,b, calculated from the integration of the left and the right peaks in Figure 7, respectively.
The results for the dehydroxylation as well as the first step and second step in the decarburization of CSK are listed in Table 5, Table 6 and Table 7, respectively.
The absolute values of the maximum deviation of activation energy listed in Table 5, Table 6 and Table 7 are 6.37%, 4.45%, and 5.40%. The linear correlation coefficients are greater than 0.989, which indicates the kinetics results are reliable. The physical significance and mechanism equations of No. 17 (in Table 5 and Table 6), No. 29 (in Table 7), and No. 37 are listed in Table 8.
The dehydroxylation reaction in CSK calcination conforms to the A2/3 mechanism model, wherein the activation energy is 182.71 kJ·mol−1. Nonetheless, the mechanism function and activation energy in the two-stage decarburization reaction in CSK are different. The first step decarburization reaction also fits the A2/3 mechanism model, wherein the activation energy is 160.94 kJ·mol−1. The second step decarburization reaction fits into the B3 mechanism model, with the activation energy being 215.47 kJ·mol−1. The activation energy of the second decarburization step is greater than that of the dehydroxylation reaction, indicating that the decarburization is more difficult than dehydroxylation in CSK calcination. Therefore, the kinetics equations of the dehydroxylation and decarburization reactions in CSK calcination are as follows:
[−ln(1−α)]3/2 = 109.44exp(−182.71/RT)t (dehydroxylation reaction)
[−ln(1−α)]3/2 = 109.02exp(−160.94/RT)t (the first step of decarburization)
1−(1−α)1/3 = 109.37exp(−215.47/RT)t (the second step of decarburization)

3.5. Comparative Analysis of New Methods and Traditional Methods

The kinetics results obtained from TG are shown in Table 9 and Table 10, and the comparison with the new kinetic method (TG-FTIR-MS) is shown in Table 11.
The activation energy is 154.11 kJ·mol−1 and the mechanism function is No. 17 of CSK calcination at the first stage of mass loss, as obtained from TG method, similar to the literature [12,14]. The first stage mass loss is mostly caused by the dehydroxylation reaction, thus the reaction mechanism obtained by TG is the same as that obtained from TG-FTIR-MS. The second stage mass loss of TG is mainly the superposition in the later period of the dehydroxylation and the second step of decarburization (shown in Figure 8). The activation energy and the mechanism in the second stage mass loss of TG are different from that of the dehydroxylation reaction and the second step of the decarburization reaction. Therefore, it can be inferred that the kinetics obtained by the TG method may not have physical meaning when the mass loss between the reactions is not much different. The TG-FTIR-MS method can be used to characterize the dehydroxylation and decarburization characteristics and kinetics of CSK in more detail, which is more reasonable than the traditional TG method. The new kinetic method revealed the real kinetic characteristics of the dehydroxylation and decarburization in CSK, which provided a theoretical basis for the calcination control of CSK. In practical applications, the new method can easily reveal the differences in the reaction characteristics of different types of CSK. The obtained kinetic equations can be used to predict the reaction curves of dehydroxylation and decarburization in CSK under various calcination conditions. All these have guiding significance for process design, product quality control, energy saving, and pollutant control of CSK calcination.

4. Conclusions

(1)
The dehydroxylation reaction in CSK calcination conforms to the A2/3 mechanism model, the temperature range is 350–850 °C, and the activation energy is 182.71 kJ·mol−1. The decarburization in CSK calcination is a two-step reaction; the temperature range in the first step is 350–550 °C, and in the second is 580–830 °C. The first step decarburization reaction conforms to the A2/3 mechanism function, and the activation energy is 160.94 kJ·mol−1. The second step decarburization reaction follows the B3 mechanism function, wherein the activation energy is 215.47 kJ·mol−1.
(2)
The TG-FTIR-MS method is suitable for analyzing the characteristics and kinetics of dehydroxylation and decarburization in CSK calcination. It is also a theoretical tool for the kinetic analysis of other types of complex reactions.

Author Contributions

Conceptualization, S.C. and S.J.; methodology, S.J.; formal analysis, S.C.; data curation, S.C.; writing—original draft preparation, S.C.; writing—review and editing, S.J.; project administration, H.L.; funding acquisition, H.L. All authors have read and agreed to the published version of the manuscript.

Funding

This research was funded by NATIONAL NATURAL SCIENCE FOUNDATION OF CHINA, grant number 51672207, and SHAANXI NATURAL SCIENCE FOUNDATION OF CHINA, grant number 2012JM6001.

Institutional Review Board Statement

Not applicable.

Informed Consent Statement

Not applicable.

Data Availability Statement

All data, models, and code generated or used during the study appear in the submitted article.

Conflicts of Interest

The authors declare no conflict of interest.

References

  1. Qin, Z. New advances in coal structure model. Int. J. Min. Sci. Technol. 2018, 28, 541–559. [Google Scholar] [CrossRef]
  2. He, J.F.; Yao, Y.K.; Lu, W.; Long, G.H.; Bai, Q.; Wang, H.F. Cleaning and upgrading of coal-series kaolin fines via decarburization using triboelectric separation. J. Clean. Pro. 2019, 228, 956–964. [Google Scholar] [CrossRef]
  3. Bu, X.N.; Evans, G.; Xie, G.Y.; Peng, Y.L.; Zhang, Z.G.; Ni, C.; Ge, L.H. Removal of fine quartz from coal-series kaolin by flotation. Appl. Clay Sci. 2017, 143, 437–444. [Google Scholar] [CrossRef]
  4. Liu, Y.Y.; Lei, S.M.; Huang, T.; Ji, M.J.; Li, Y.; Fan, Y.M. Research on mineralogy and flotation for coal-series kaolin. Appl. Clay Sci. 2017, 136, 37–42. [Google Scholar] [CrossRef]
  5. Yuan, S.; Li, Y.J.; Han, Y.X.; Gao, P. Effects of carbonaceous matter additives on kinetics, phase and structure evolution of coal-series kaolin during calcination. Appl. Clay Sci. 2018, 165, 124–134. [Google Scholar] [CrossRef]
  6. Xu, X.H.; Lao, X.B.; Wu, J.F.; Zhang, Y.X.; Xu, X.Y.; Li, K. Microstructural evolution, phase transformation, and variations in physical properties of coal series kaolin powder compact during firing. Appl. Clay Sci. 2015, 115, 76–86. [Google Scholar] [CrossRef]
  7. Sun, T.; Ge, K.Y.; Wang, G.M.; Geng, H.N.; Shui, Z.H.; Cheng, S.K.; Chen, M. Comparing pozzolanic activity from thermal-activated water-washed and coal-series kaolin in Portland cement mortar. Constr. Build. Mater. 2019, 227, 117092. [Google Scholar] [CrossRef]
  8. Cao, Z.; Cao, Y.D.; Dong, H.J.; Zhang, J.S.; Sun, C.B. Effect of calcination condition on the microstructure and pozzolanic activity of calcined coal gangue. Int. J. Miner. Process. 2016, 146, 23–28. [Google Scholar] [CrossRef]
  9. Li, L.X.; Zhang, Y.M.; Zhang, Y.F.; Sun, J.M.; Hao, Z.F. The thermal activation process of coal gangue selected from Zhungeer in China. J. Therm. Anal. Calorim. 2016, 126, 1559–1566. [Google Scholar] [CrossRef]
  10. Ptáček, P.; Frajkorova, F.; Šoukal, F.; Opravil, T. Kinetics and mechanism of three stages of thermal transformation of kaolinite to metakaolinite. Powder Technol. 2014, 264, 439–445. [Google Scholar] [CrossRef]
  11. Kuang, J.Z.; Yuan, W.Q.; Li, L.; Hu, J.; Xu, L.Y. Effects of Er(NO3)3, Nd(NO3)3 and Y(NO3)3 on kinetics of dehydroxylation of kaolinite. Powder Technol. 2016, 301, 581–589. [Google Scholar] [CrossRef]
  12. Gasparini, E.; Tarantino, S.C.; Ghigna, P.; Riccardi, M.P.; Cedillo-González, E.I.; Siligardi, C.; Zema, M. Thermal dehydroxylation of kaolinite under isothermal conditions. Appl. Clay Sci. 2013, 80–81, 417–425. [Google Scholar] [CrossRef]
  13. Horváth, I. Kinetics and compensation effect in kaolinite dihydroxylation. Ther. Acta 1985, 85, 193–198. [Google Scholar] [CrossRef]
  14. Levy, J.H.; Hurst, H.J. Kinetics of dehydroxylation, in nitrogen and water vapour, of kaolinite and smectite from Australian Tertiary oil shales. Fuel 1993, 72, 873–877. [Google Scholar] [CrossRef]
  15. Mustafa, V.; Betul, Y. Gasification kinetics of Thrace region coal by thermogravimetry analysis. J. Pet. Sci. Eng. 2020, 188, 106869. [Google Scholar] [CrossRef]
  16. Bei, L.; Gang, L.; Wei, G.; Hai, Y.C.; Ming, S.B.; Li, M.; Jun, D.; Chi, M.S. Study of combustion behaviour and kinetics modelling of Chinese Gongwusu coal gangue: Model-fitting and model-free approaches. Fuel 2020, 268, 117284. [Google Scholar] [CrossRef]
  17. Zhang, Y.Y.; Guo, Y.X.; Cheng, F.Q.; Yan, K.Z.; Cao, Y. Investigation of combustion characteristics and kinetics of coal gangue with different feedstock properties by thermogravimetric analysis. Ther. Acta 2015, 614, 137–148. [Google Scholar] [CrossRef]
  18. Mehmooda, M.A.; Ahmad, M.S.; Liu, Q.; Liu, C.G.; Tahir, M.H.; Aloqbi, A.A.; Tarbiah, N.I.; Alsufiani, H.M.; Gull, M. Helianthus tuberosus as a promising feedstock for bioenergy and chemicals appraised through pyrolysis, kinetics, and TG-FTIR-MS based study. Energy Convers. Manag. 2019, 194, 37–45. [Google Scholar] [CrossRef]
  19. Liang, B.; Wang, J.B.; Hu, J.H.; Li, C.F.; Li, R.K.; Liu, Y.; Zeng, K.; Yang, G. TG-MS-FTIR study on pyrolysis behavior of phthalonitrile resin. Polym. Degrad. Stab. 2019, 169, 108954. [Google Scholar] [CrossRef]
  20. Zangaro, G.; Carvalho, A.; Ekawa, B.; Nascimento, A.; Nunes, W.; Fernandes, R.; Parkes, G.; Ashton, G.; Ionashiro, M.; Caires, F. Study of the thermal behavior in oxidative and pyrolysis conditions of some transition metals complexes with Lornoxicam as ligand using the techniques: TG-DSC, DSC, HSM and EGA (TG-FTIR and HSM-MS). Ther. Acta 2019, 681, 178399. [Google Scholar] [CrossRef]
  21. Qiao, Y.Y.; Wang, B.; Zong, P.J.; Tian, Y.L.; Xu, F.F.; Li, D.W.; Li, F.L.; Tian, Y.Y. Thermal behavior, kinetics and fast pyrolysis characteristics of palm oil: Analytical TG-FTIR and Py-GC/MS study. Energy Convers. Manag. 2019, 199, 111964. [Google Scholar] [CrossRef]
  22. Bi, H.B.; Wang, C.X.; Lin, Q.Z.; Jiang, X.D.; Jiang, C.L.; Bao, L. Combustion behavior, kinetics, gas emission characteristics and artificial neural network modeling of coal gangue and biomass via TG-FTIR. Energy 2020, 213, 118790. [Google Scholar] [CrossRef]
  23. Song, H.J.; Liu, G.R.; Zhang, J.Z.; Wu, J.H. Pyrolysis characteristics and kinetics of low rank coals by TG-FTIR method. Fuel Process. Technol. 2017, 156, 54–460. [Google Scholar] [CrossRef]
  24. Ding, L.; Zhou, Z.J.; Guo, Q.H.; Lin, S.J.; Yu, G.S. Gas evolution characteristics during pyrolysis and catalytic pyrolysis of coals by TG-MS and in a high-frequency furnace. Fuel 2015, 154, 222–232. [Google Scholar] [CrossRef]
  25. Cai, J.M.; Chen, Y.; Liu, R.R. Isothermal kinetic predictions from nonisothermal data by using the iterative linear integral isoconversional method. J. Energy Inst. 2014, 87, 183–187. [Google Scholar] [CrossRef]
  26. Hu, R.Z.; Wu, S. A numerical method of computing the kinetic parameters Exothermic decomposition of energetic materials via the exothermic rate equation. J. Therm. Anal. Calorim. 1995, 1, 885–902. [Google Scholar] [CrossRef]
  27. Xie, H.Q.; Yu, Q.B.; Duan, W.J.; Wang, K.; Li, X.H.; Shi, X.B. Pyrolysis characteristics and kinetics of lignin derived from three agricultural wastes. J. Renew. Sustain. Energy 2013, 5, 063119. [Google Scholar] [CrossRef]
  28. Cepeliogullar, O.; Haykiri-Acma, H.; Yaman, S. Kinetic modelling of RDF pyrolysis: Model-fitting and model-free approaches. Waste Manag. 2016, 48, 275–284. [Google Scholar] [CrossRef]
  29. Hu, R.Z.; Shi, Q.Z. Thermal Analysis Kinetics; Science Press: Beijing, China, 2001; pp. 86–125. [Google Scholar]
  30. Khan, M.I.; Khan, H.U.; Azizli, K.; Sufian, S. The pyrolysis kinetics of the conversion of Malaysian kaolin to metakaolin. Appl. Clay Sci. 2017, 146, 152–161. [Google Scholar] [CrossRef]
  31. Irfan, K.; Azizli, K.; Sufian, S.; Man, Z.; Khan, A.S. Simultaneous preparation of nano silica and iron oxide from palm oil fuel ash and thermokinetics of template removal. RSC Adv. 2015, 5, 20788–20799. [Google Scholar] [CrossRef]
  32. Vyazovkin, S. Isoconversional Kinetics of Thermally Stimulated Processes; Springer: Berlin/Heidelberg, Germany, 2015; pp. 125–210. [Google Scholar]
  33. Davarcioglu, B.; Ciftci, E. The clay minerals observed in the building stones of Aksaray-Guzelyurt area (Central Anatolia-Turkey) and their effects. Int. J. Phys. Sci. 2010, 5, 1734–1743. [Google Scholar] [CrossRef]
  34. Shokrlu, Y.H.; Maham, Y.; Tan, X.; Babadagli, T.; Gray, M. Enhancement of the efficiency of in situ combustion technique for heavy-oil recovery by application of nickel ions. Fuel 2013, 105, 397–407. [Google Scholar] [CrossRef]
  35. Chakravartula, S.S.; Steven, S.C. Infrared Study of Strongly and Weakly Adsorbed CO2 on Fresh and Oxidatively Degraded Amine Sorbents. J. Phys. Chem. C 2013, 117, 9196–9205. [Google Scholar] [CrossRef]
  36. Carlos, R.N.; Encncarnacion, R.A.; Ana, L.; Alejandro, B.N.; Miguel, O.H. Thermal decomposition of calcite: Mechanisms of formation and textural evolution of CaO nanocrystals. Am. Miner. 2009, 94, 578–593. [Google Scholar] [CrossRef]
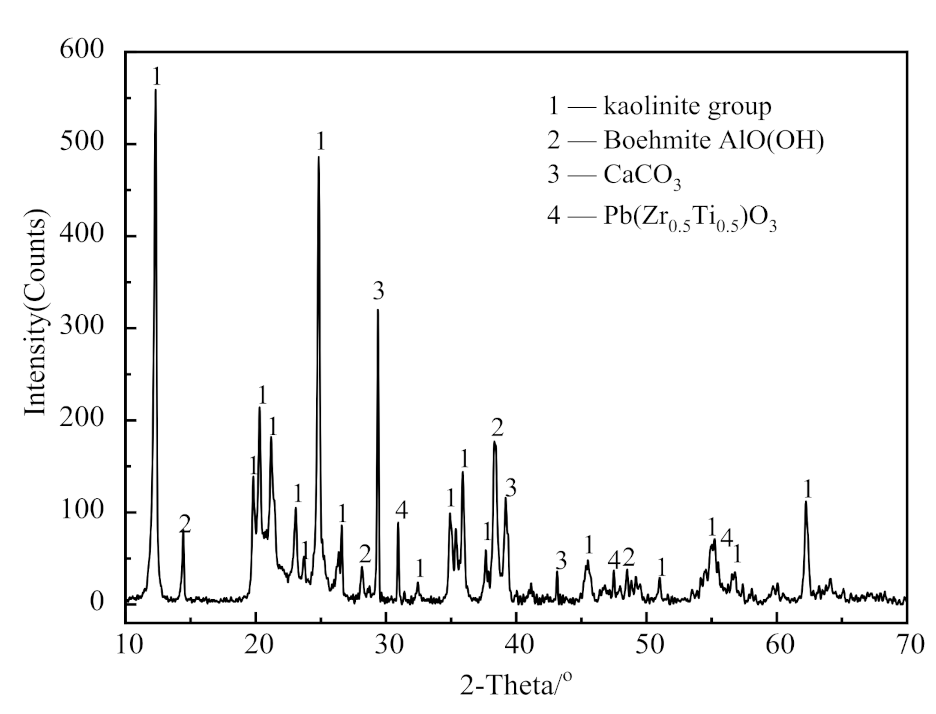
Figure 1. X-ray diffractometer (XRD) patterns of coal series kaolinite (CSK).
Materials 14 01493 g001
Figure 2. TG and DTG curves of CSK at different heating rates.
Materials 14 01493 g002
Figure 3. The mass loss during CSK calcination at different heating rates.
Materials 14 01493 g003
Figure 4. Infrared absorption spectrum (3D) of gaseous products from CSK at the heating rate of 10 °C/min.
Materials 14 01493 g004
Figure 5. Analysis results of infrared absorption spectra of gaseous products at different times (temperature).
Materials 14 01493 g005
Figure 6. The release intensity (abundance) curves of M/z = 18 at different heating rates. (a) 5 °C/min; (b) 10 °C/min; (c) 15 °C/min; and (d) 20 °C/min.
Materials 14 01493 g006
Figure 7. The release intensity (abundance) curves of M/z = 44 at different heating rates. (a) 5 °C/min; (b) 10 °C/min; (c) 15 °C/min; and (d) 20 °C/min. *QMID in the figure is the abbreviation of “quasi multi-ion detection”.
Materials 14 01493 g007
Figure 8. Comparison of reaction temperature range determined by TG/DSC and MS. (a) 5 °C/min; (b) 10 °C/min; (c) 15 °C/min; and (d) 20 °C/min.
Materials 14 01493 g008
Figure 9. The conversion curves for dehydroxylation of CSK at different heating rates.
Materials 14 01493 g009
Figure 10. The conversion curves for decarburization of CSK at different heating rates. (a) The first step of CSK decarburization; (b) the second step of CSK decarburization.
Materials 14 01493 g010
Table 1. Chemical composition of raw material (wt.%).
SiO2Al2O3CaOTiO2Fe2O3K2OMgOSO3P2O5PbOZr2O3
38.4234.774.201.350.390.130.080.050.070.670.18
Table 2. Industrial analysis results of coal series kaolin samples (wt.%).
MoistureAshVolatileTotal SulfurTotal MoistureCarbonHydrogenNitrogen
1.0082.814.740.031.062.621.530.07
Table 3. Integral mechanism functions used for solid-state reactions.
Symbol of g(α)The Sequence Number of FunctionEquation NameExpression of G(α) Function
D11One-dimensional diffusionα2
D22Two-dimensional diffusionα + (1 − α)ln(1 − α)
1D36Tri-dimensional diffusion (spherically symmetric)[1 − (1 − α)1/3]2
2D37Tri-dimensional diffusion (cylindrically symmetric)1 − 2α/3 − (1 − α)2/3
A116Nucleation and growth (n = 1)−ln(1 − α)
A2/317Nucleation and growth (n = 3/2)[−ln(1 − α)]3/2
A213Nucleation and growth (n = 1/2)[−ln(1 − α)]1/2
A311Nucleation and growth (n = 1/3)[−ln(1 − α)]1/3
R231Shrinking core (cylindrically symmetric)1 − (1 − α)1/2
R329Shrinking core (spherically symmetric)1 − (1 − α)1/3
P224Power lawα1/2
P323Power lawα1/3
C237Chemical reaction(1 − α)−1 − 1
C1.538Chemical reaction(1− α)−1/2
Table 4. The characteristic temperatures of coal series kaolinite (CSK) calcination at different heating rates.
Heating Rate (°C/min)Temperature (°C), Stage-ITemperature (°C), Stage-II
Starting
Temperature
Peak
Temperature
Ending
Temperature
Starting
Temperature
Peak
Temperature
Ending
Temperature
5334.5505.9598.9603.2658.1802.2
10341.2520.5615.3629.2668.4826.3
15350.6527.8633.0633.1678.5837.3
20365.3541.0643.1647.2694.4846.6
Table 5. Kinetics results of CSK dehydration.
MethodHeating Rate
(°C/min)
Activation Energy
Ea (kJ·mol−1)
Pre-Exponential
Factor log A (s−1)
Linear Correlation
Coefficient r
Sequence Number
of Function
The general integration5188.329.821850.98746217
10179.819.244240.98734517
15170.418.586770.98926817
20178.209.059050.98842217
Mac Callum–Tanner5194.3410.309100.98925417
10186.109.741080.98928817
15176.889.086220.99105917
20184.919.581100.99028217
Satava–Sestak5191.6810.059200.98925417
10183.899.538540.98928817
15175.188.937950.99105917
20182.779.385470.99028217
Average 182.719.445880.989355
Table 6. Kinetics results for the first step of the decarburization of CSK.
MethodHeating Rate
(°C/min)
Activation Energy
Ea (kJ·mol−1)
Pre-Exponential
Factor log A (s−1)
Linear Correlation
Coefficient r
Sequence Number
of Function
The general integration5160.369.009770.99588117
10155.248.617110.99571917
15153.778.492110.99610717
20162.349.047980.99562317
Mac Callum–Tanner5164.949.372960.99646317
10160.128.992380.99638317
15158.868.887160.99675417
20167.679.465790.99629017
Satava–Sestak5163.949.297190.99646317
10159.368.952560.99638317
15158.178.849420.99675417
20166.499.373220.99629017
Average 160.949.029800.996259
Table 7. Kinetics results for the second step of the decarburization of CSK.
MethodHeating Rate
(°C/min)
Activation Energy
Ea (kJ·mol−1)
Pre-Exponential
Factor log A (s−1)
Linear Correlation
Coefficient r
Sequence Number
of Function
The general integration5210.639.001660.99525929
10211.229.051330.99838229
15204.718.724490.99488129
20217.449.354660.99689929
Mac Callum–Tanner5219.459.680810.99596229
10220.419.751850.99603329
15214.069.426120.99568629
20227.1010.08880.99737629
Satava–Sestak5211.389.293370.99596229
10216.309.359310.99603329
15210.309.067460.99568629
20222.609.661190.99737629
Average 215.479.371750.996295
Table 8. Mechanism equations and physical meaning of No. 17, No. 29, and No. 37.
Symbol of g(α)Sequence Number of FunctionEquation NameExpression of g(α) Function
A2/317Random nucleation and growth (n = 3/2)[−ln(1 − α)]3/2
B329Shrinking core (spherically symmetric)1 − (1 − α)1/3
C237Chemical reaction(1 − α)−1 − 1
Table 9. Kinetics results for the first mass loss stage of CSK calcination by TG.
MethodHeating Rate
(°C/min)
Activation Energy
Ea (kJ·mol−1)
Pre-Exponential
Factor log A (s−1)
Linear Correlation
Coefficient r
Sequence Number
of Function
Agrawal5147.197.180.99873817
10163.568.320.99648417
15147.227.220.99858017
20147.657.240.99728217
Satava–Sestak5152.407.610.99898117
10168.308.680.99707217
15152.967.690.99887717
20153.567.710.99783117
Average 154.117.710.997981
Table 10. Kinetics results for the second mass loss stage of CSK calcination by TG.
MethodHeating Rate
(°C/min)
Activation Energy
Ea (kJ·mol−1)
Pre-Exponential
Factor log A (s−1)
Linear Correlation
Coefficient r
Sequence Number
of Function
Agrawal5257.4611.810.99823037
10254.1411.700.99820937
15262.6012.190.99554837
20254.3111.640.99794337
Satava–Sestak5261.6112.160.99900937
10256.8311.850.99837837
15265.0912.320.99607237
20223.7612.630.99374837
Average 254.4812.040.997142
Table 11. Comparison of kinetic results between TG and TG-FTIR-MS method.
Kinetic MethodReactionActivation Energy Ea (kJ·mol−1)Pre-Exponential Factor log A (s−1)Linear Correlation Coefficient rSequence Number of Function
TG-FTIR-MSdehydroxylation182.719.440.98935517
the first step decarburization160.949.020.99625917
the second step decarburization215.479.370.99629529
Traditional method (TG)the mass loss of first stage154.117.710.99800017
the mass loss of second stage254.4812.040.99712337
Publisher’s Note: MDPI stays neutral with regard to jurisdictional claims in published maps and institutional affiliations.