Article

Cutting Forces and Tool Wear Investigation during Turning of Sintered Nickel-Cobalt Alloy with CBN Tools

by
Wojciech Zębala
,
Grzegorz Struzikiewicz
* and
Ksenia Rumian
Chair of Production Engineering, Faculty of Mechanical Engineering, Cracow University of Technology, Al. Jana Pawła II 37, 31-864 Kraków, Poland
*
Author to whom correspondence should be addressed.
Materials 2021, 14(7), 1623; https://doi.org/10.3390/ma14071623
Submission received: 22 February 2021 / Revised: 19 March 2021 / Accepted: 22 March 2021 / Published: 26 March 2021
(This article belongs to the Special Issue Research on Additive Manufacturing of Novel Alloy Materials)

Abstract

:
This article describes issues related to the machining of parts made of sintered nickel-cobalt alloy. Longitudinal turning with a CBN (cubic boron nitride) tool was analyzed. The results of experiments showed the influence of cutting parameters in the field of finishing machining on the values of cutting forces and specific cutting force, taking into account the wear of the cutting edge. Measurements and analysis of the topography and roughness parameters of the machined surface, as well as the cutting tool wear, were presented. The microscopic examination showed that the average grain size of the sintered nickel-cobalt alloy was 3.22 ± 0.1 (μm). The presence of the hardening state variability of the material during machining, as well as the value of the cutting force fluctuation as a function of the tool wear VB, were stated. The specific cutting force values increased to a small degree for the tool wear in the range of VB = 0–0.2 mm, and reached similar values in the range kc = 5500–7500 N/mm2. The specific cutting force values increased significantly for wear VB > 0.2 mm and were characterized by a large variability. The occurring phenomena were analyzed and several explanations were proposed. A recommendation was developed for the machining of parts made of sintered nickel-cobalt alloy. The Taguchi method was used in the experiment methodology.

1. Introduction

Nickel-cobalt based alloys are mainly used in the aviation industry for the production of engine parts [1,2]. These kind of materials are intended mainly for operation at high temperatures in parts such as turbine blades, engine housings, etc. [3,4]. The most important features of nickel-cobalt based alloys include: high hardness, tendency to react with the workpiece (formation of built-up edges on the cutting edge), high strength at high temperature, low thermal conductivity, and the ability to harden in the cutting zone, which makes these alloys tend to harden in the top layer [5,6]. Thellaputtaa et al. [1] and Deng et al. [2] stated that the characteristic properties of such alloys are a relatively high resistance to oxidation, corrosion resistance in an aggressive environment, resistance to thermal fatigue and creep, and good mechanical properties, both at high temperatures, as well as at cryogenic temperatures [7,8].
Currently, the main focus of research is on the surface quality and the integrity of the surface layer of elements made of the nickel-cobalt alloy. This is important for the durability, functionality, and fatigue limit of the processed elements [9,10]. Various criteria are considered during the optimization of machining of such materials, e.g., surface roughness, maximization of the tool life, and minimization of production costs [11]. Pawade et al. [12] proposed an approach to optimize high-speed turning with the use of TGRA (Taguchi gray relation analysis). Taking into account a significant number of limitations in the cutting process (e.g., related to a machine tool, a workpiece, and the required condition of the surface layer of the material), the problem of selecting optimal cutting parameters is very complex, as demonstrated by Pawade et al. [12]. An analysis of stresses and deformation during the cutting process was performed using the finite element method and verified experimentally by Peng et al. [13]. Struzikiewicz et al. [14] used the TGRA method to optimize the cutting process and to select the optimal parameters for turning sintered alloys made by a laser sintering method.
Nowadays, it is more and more popular to produce parts from metal powders. These materials have a different microstructure than that obtained by casting or forging [15]. The microstructure resulting from the production of an alloy from metal powders has been investigated by various authors. Krawczyk et al. [16] compared two materials: one prepared with casting and another with an additive SLM (Selective Laser Melting) method. They investigated how easily the materials could be machined and analyzed their structure. They demonstrated that during face turning for higher feed ranges, the quality of the machined surface was better for the cast material. Araujo et al. [17] found that with appropriate thermomechanical treatment it is possible to obtain optimal strength of cobalt-nickel alloy with a fine-grained structure while maintaining its properties. Nayan et al. [18] investigated the behavior of nickel-cobalt alloy during hot deformation in order to understand the evolution of the microstructure as a function of strain rate and temperature. This study revealed dynamic recrystallization, occurring at higher material processing temperatures. Based on the research conducted by Wang et al. [19] and DebRoy et al. [20], it can be concluded that the nickel-cobalt alloy obtained using this method has a fine-grained structure, and depending on the applied heat treatment, the material may have increased strength, while reducing plasticity, and it is possible to remove residual stresses and displacements occurring in material. The microstructure depends on the chemical composition and heat treatment. This nickel-cobalt alloy is a complex material intended for processing in AM (additive manufacturing) processes, because it contains a large number of alloy elements and is a precipitation hardened alloy [21,22].
Nickel-based superalloys are known as difficult to machine materials [23]. The authors described the current state of knowledge about the machining characteristics of nickel-based superalloys, explained the influence of different cutting parameters, the cooling method, and the type of cutting tool on the surface integrity features of the material after machining (surface roughness, defects such as surface defects, cracks, feed marks, grooves). Jawahir et al. [24] focused on presenting experimental and theoretical research on the integrity of surfaces in cutting processes, such as residual stress, hardness, and roughness. According to Chen et al. [25], changes in surface and subsurface zones demonstrated during the above-mentioned studies may significantly deteriorate the efficiency and shorten the fatigue limit of the processed parts. The formation of a white layer on the surface and in the machining zone, according to Ezugwu et al. [26] and Devillez et al. [27], is a typical structural change caused by machining in a nickel-cobalt alloy. During high-speed machining of a cobalt-nickel alloy [28], factors influencing the surface roughness are built-up edge, adhesion, and feed marks. Sadat et al. [29] showed the lesions resulting from machining with a tool made of tungsten carbide. These lesions included dents, grooves, cracks, and microcracks. In addition, Sharman et al [30], Zhou et al. [31] and Zhou et al. [32] showed that the built-up edge is the main cause of tool damage, the increase in surface roughness, and the greater the wear of the tool. The use of coolant causes less surface damage [30].
Gupta et al. [33] conducted research on nickel-cobalt alloy, while taking into account various cooling methods and observed that the MQL (minimum quantity lubrication) method is a better cooling technique compared to dry and flood cooling.
Many scientists have studied the residual stresses in machined surfaces and the effect of turning process parameters on the quality of the produced parts. Hua et al. [34] investigated how the direction and value of the main residual stress influences the fatigue limit of the turned nickel-cobalt alloy. They showed that the value of the main residual stress is much greater than the residual surface stress, and that it increases with increasing feed. They found that the main residual stresses can be the main indicator for assessing the effect of the residual stress on the fatigue properties of the turned alloy material. Pawade et al. [35] and Arrazola et al. [36] investigated the residual stresses along the tangential direction of the machined surface when turning nickel-cobalt alloy at high speeds. They showed that the tensile residual stresses increased with the increase of the cutting speed. With the increase in feed, the compressive residual stress changed to tensile stress. Hua et al. [37] investigated the effect of cutting speed, feed, and tool nose radius on the roughness, microhardness, and the degree of hardening of a nickel-cobalt alloy material surface during dry turning. They showed that the feed speed and the nose radius of the tool have the greatest impact on the roughness of the machined surface, while a higher cutting speed and feed increase the material hardening. They concluded that a larger nose radius significantly reduces the degree of material hardening.
D’Addona et al. [38] investigated the efficiency of the machining of a nickel-cobalt alloy at high cutting speeds. They used surface quality after machining and the wear of the cutting tool as the preferred parameters for the analysis of the cutting performance. They showed that with the increase of the cutting speed, the tool wear was faster.
Many authors have analyzed the influence of parameters such as feed, cutting speed of the tools on the microhardness, and roughness of the machined surface of the material in the turning process [39,40].
Unfortunately, despite many studies having been carried out by scientists, the problem of dedicated procedures for optimizing the machining of sintered materials has not been studied in detail, in particular for sintered nickel-cobalt alloy. The authors decided to fill this gap and made an attempt to establish a procedure for determining the optimal cutting parameters of sintered nickel-cobalt alloy, while minimizing the value of the cutting resistance, and taking into account the quality of the machined surface. The article presents the results of measurements of the cutting tool wear and surface roughness, as well as an analysis of topography and microscopic photos of the machined surface, cutting edge, and chip. The obtained results were verified by comparing the test results for the cast nickel-cobalt alloy with similar properties.
This article is organized as follows: The introduction is included in Section 1, Section 2 contains the description of the applied materials, research plan, and the test bench. This section also includes characteristics of the structure and composition of the material before turning. The case study is described in Section 3, where all research results for the applied material are discussed and presented. Conclusions are presented in Section 4.

2. Materials and Methods

In order to conduct the tests, material samples were prepared as a ring with an outer diameter Dc = 330 mm, manufactured with the alloy powder based on nickel and cobalt using a laser sintering method (AM250 Renishaw, Kingswood, New Mills, UK). A series of machining tests were conducted for longitudinal turning of the outer surface of the ring. As part of the research, wear measurements of the cutting edge were carried out with three machining speeds vc = 160, 180, and 200 m/min, and with constant values of feed and depth of cut. The state of the cutting edge was determined by measurement of the maximum value of the VB parameter (the flank wear of the cutting edge) on the flank surface. In addition, the values of the total cutting force components (cutting force Fc, feed force Ff, and thrust force Fp) were obtained during cutting, and the Ra parameter value describing the roughness of the machined surface for each machining test was measured. Average values of 3–5 measurements were determined for each experiment. All turning runs were performed with a cubic boron nitride (CBN) cutting insert.
The following machining test conditions were adopted:
-
cutting speed: vc = 160, 180, 200 m/min
-
feed: f = 0.048 mm/rev
-
cutting depth: ap = 0.5 mm
-
dry machining
Machining tests were carried out on a test bench which included:
-
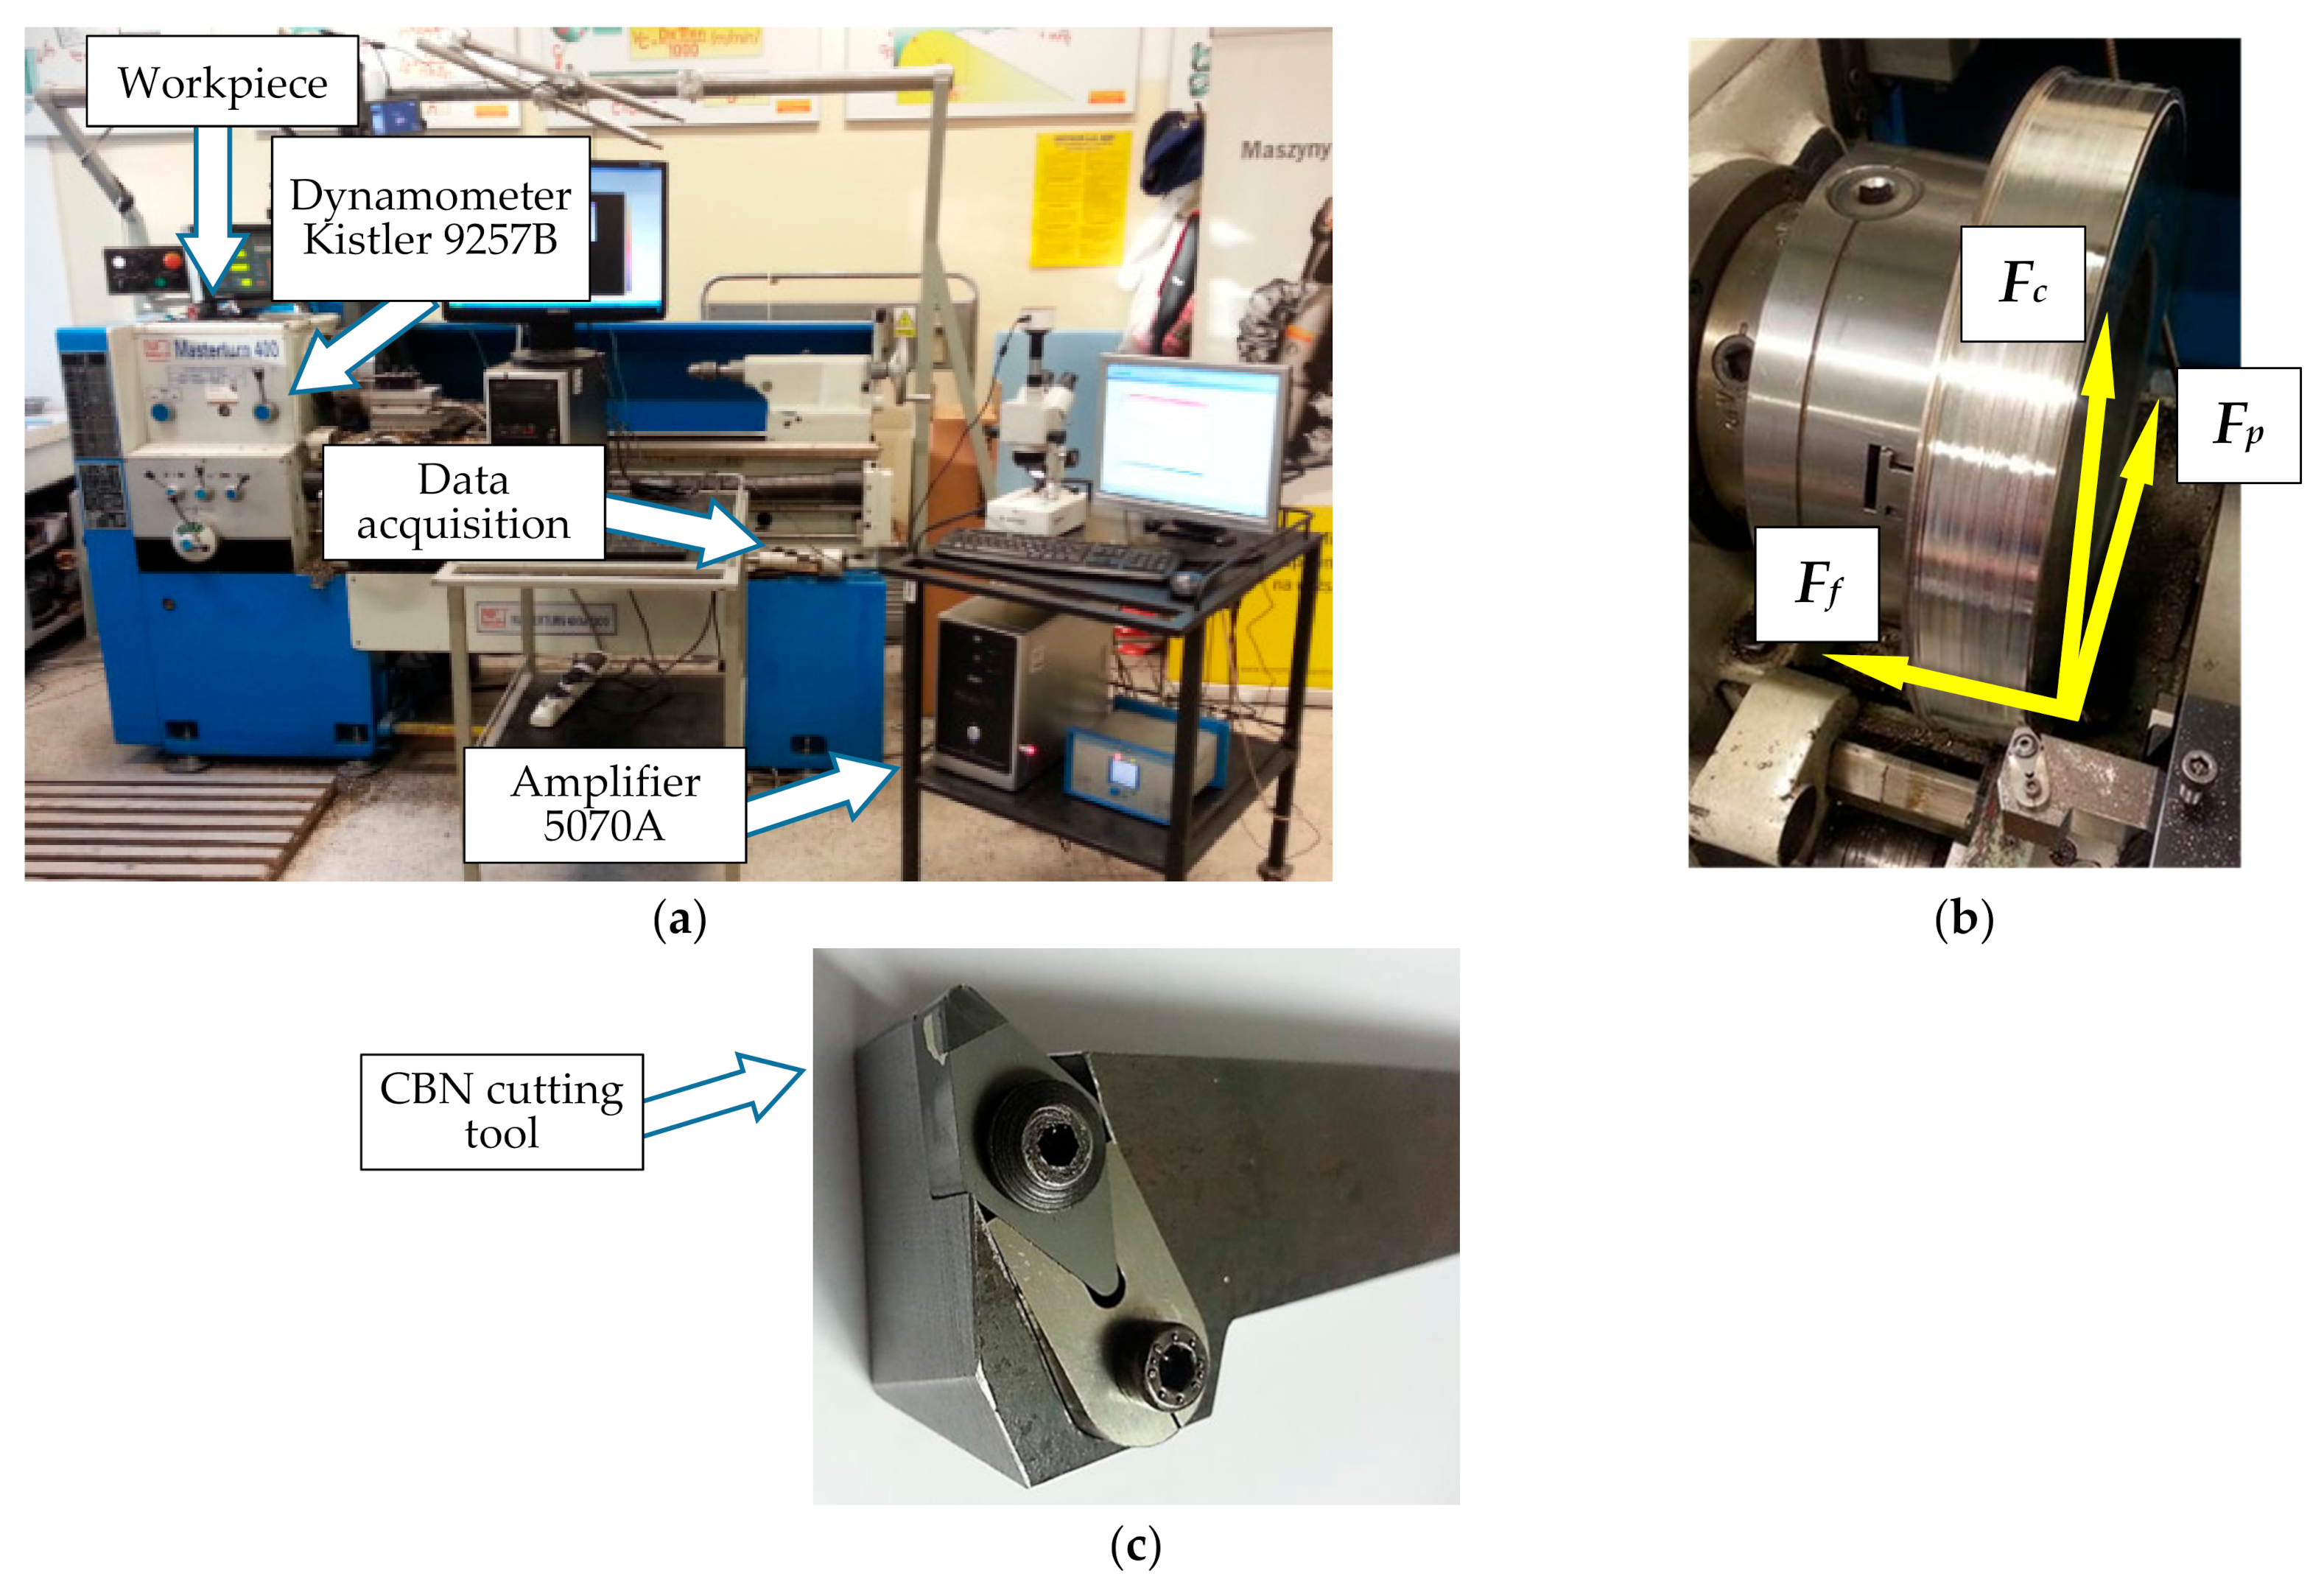
Masterturn 400 lathe (KNUTH Werkzeugmaschinen GmbH, Wasbek, Germany),
-
piezoelectric dynamometer type 9257B, with a Kistler 5070A amplifier (Kistler, Winterthur, Switzerland) and DynoWare software (Version 2825A, Kistler Group, Winterthur, Switzerland),
-
test bench equipped with an Intra 50 profilometer by Taylor Hobson (Leicester, UK) for measuring surface roughness
-
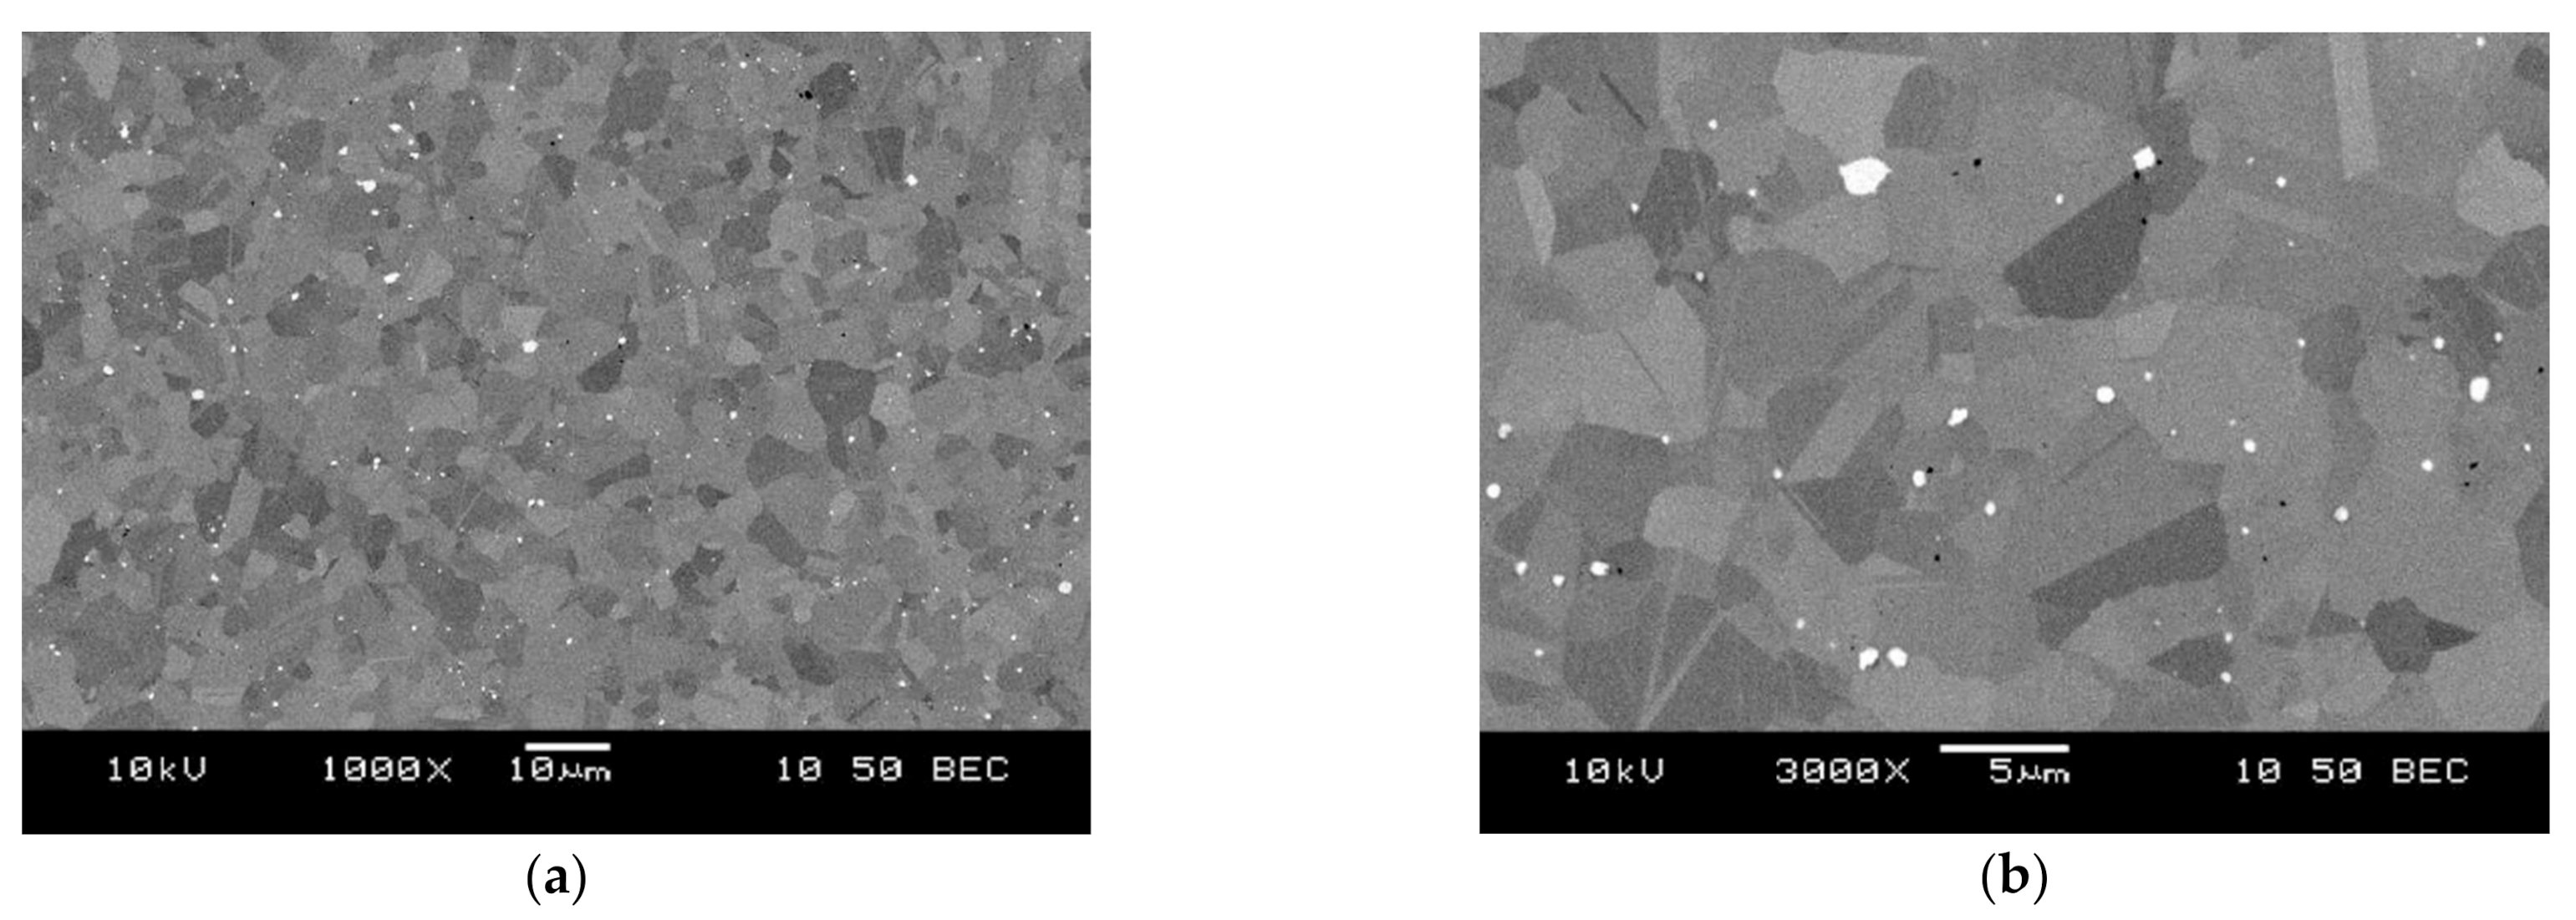
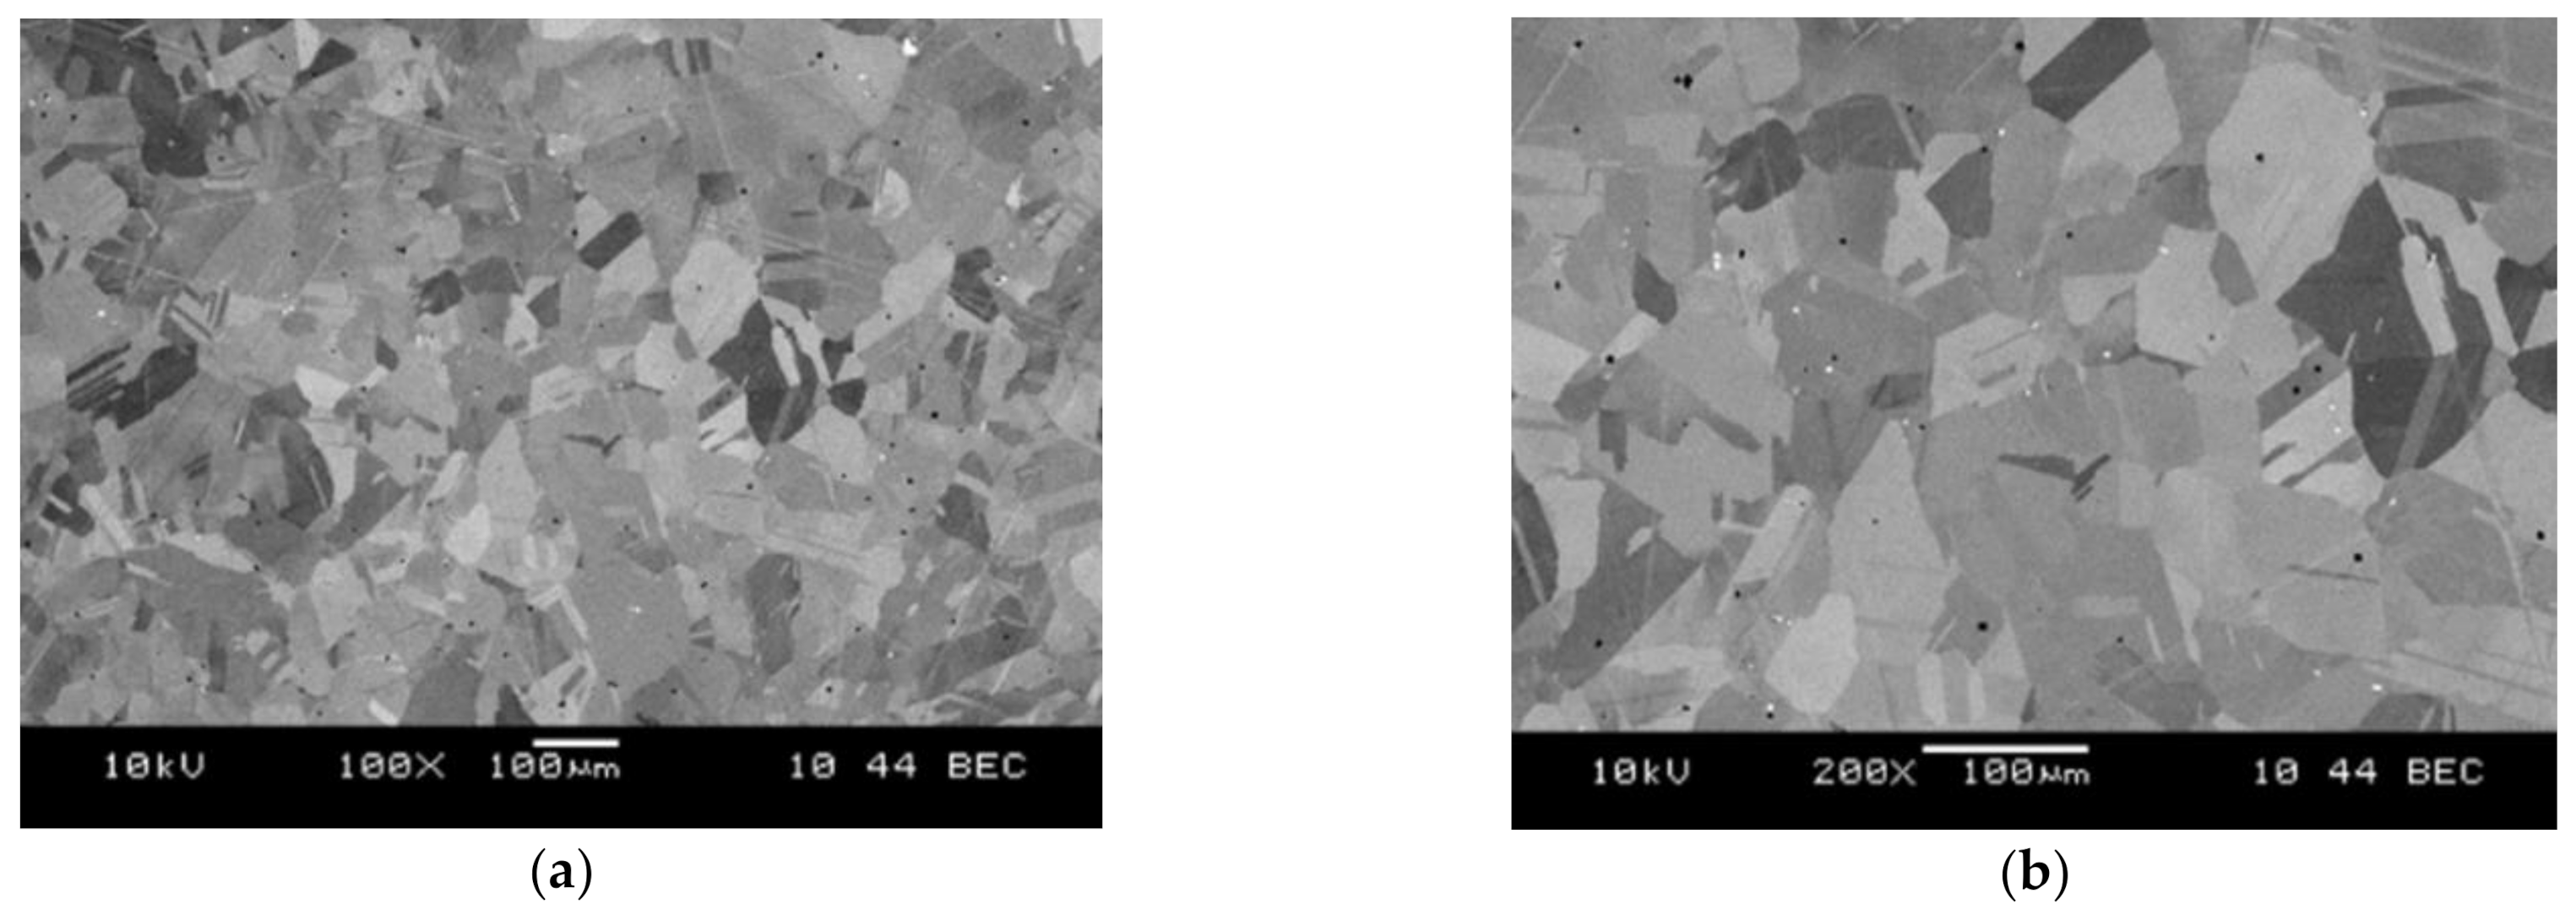
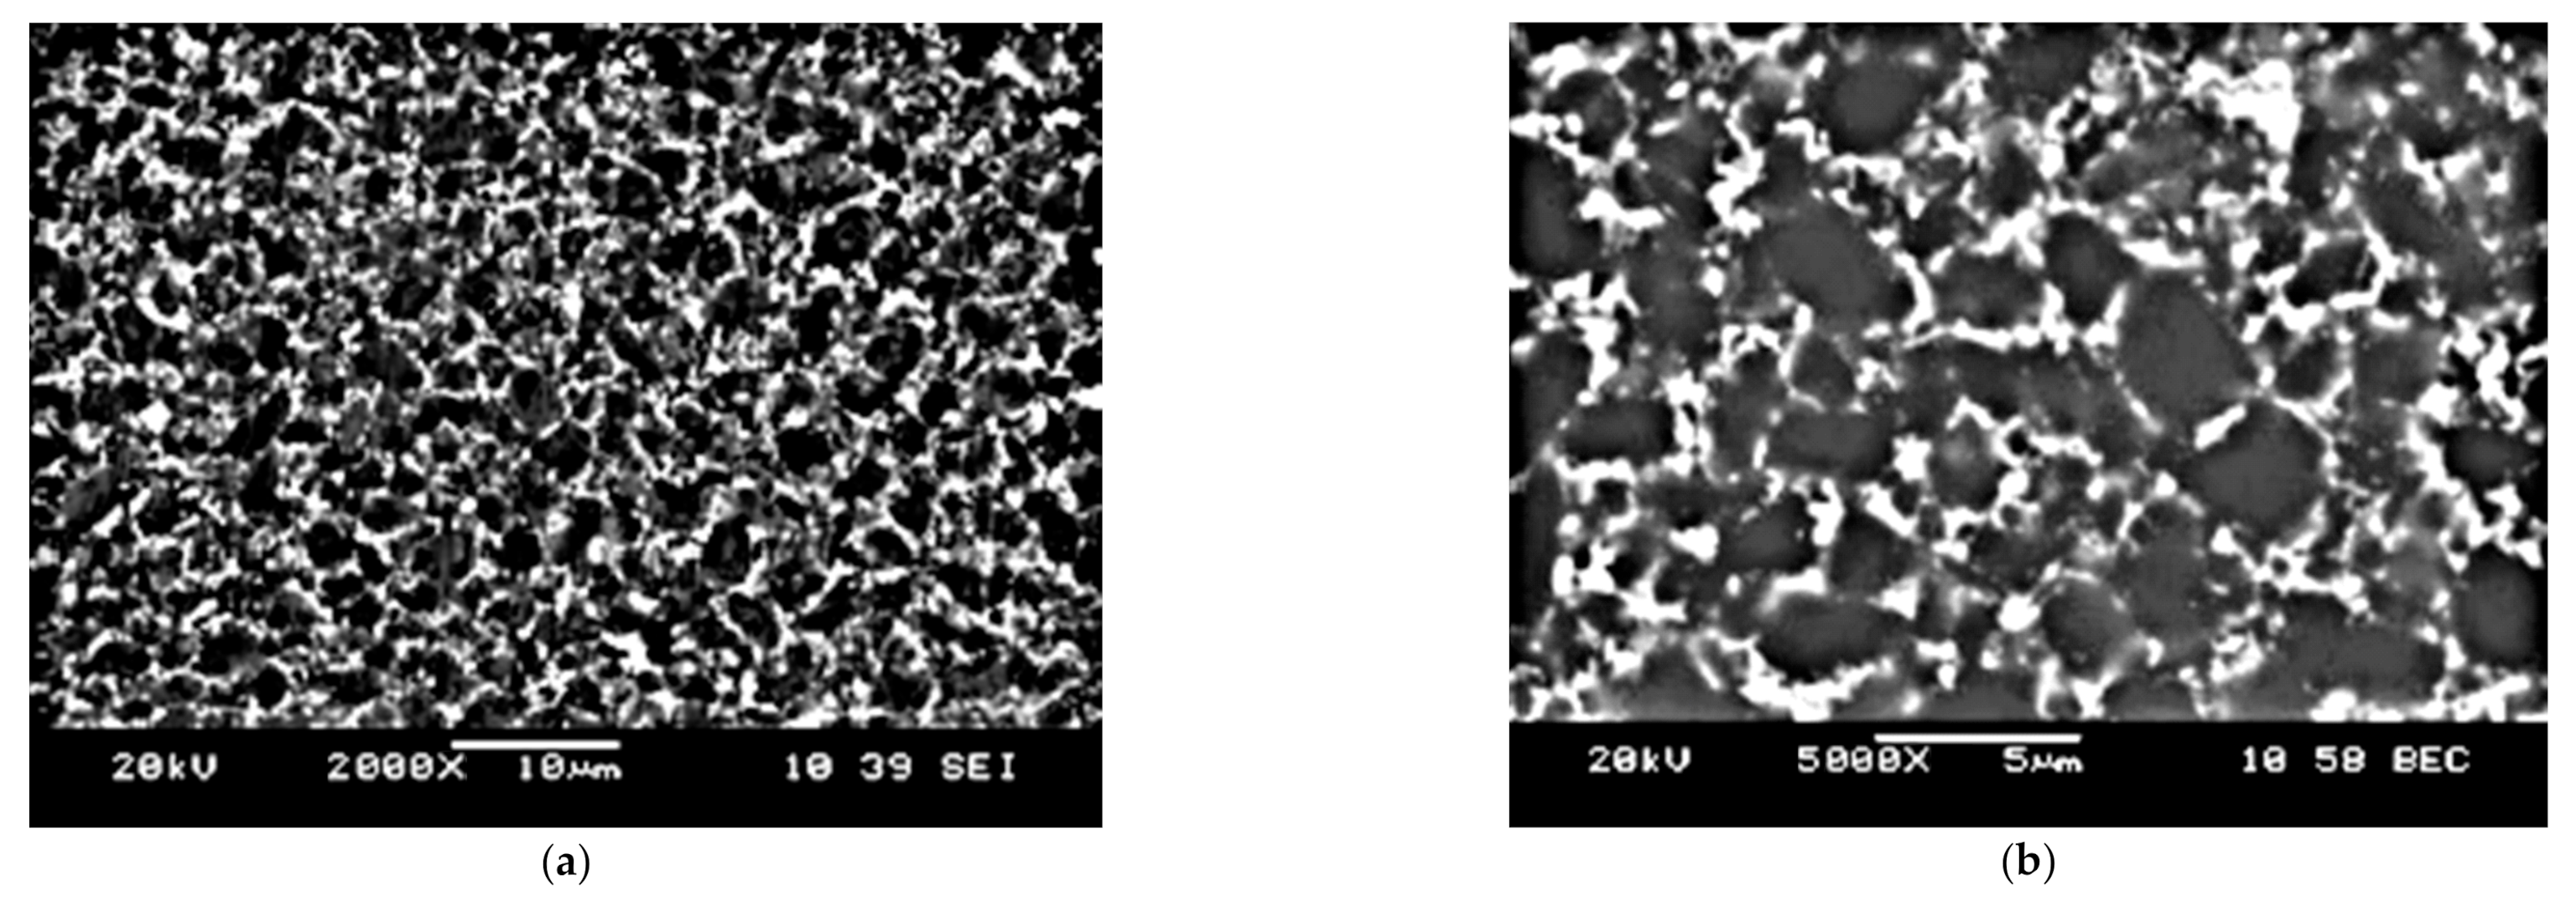
Jeol JSM 6460LV (JEOL Ltd., Tokyo, Japan) microscope for examining the microstructure by scanning electron microscopy.
Figure 1 shows the microstructure of the workpiece before the cutting process. The magnifications 1000×, 2000×, 3000×, and 5000× were used for analysis of the microstructure of the metallographic microsections which were prepared on the surface of the material to be machined. In addition, the images were recorded in the mode which presents the differences in the chemical composition: BEC (Battery Eliminator Circuit). The microstructure showed small, bright, round grains and larger ones with irregular shapes, with different shades of gray. The micro-area analyses’ aim was to determine the chemical composition of individual grains. These analyses mainly showed the presence of increased contents of molybdenum, chromium, and tungsten in round, bright particles. The analyses of the remaining grains, similar in shape, and with different shades of gray, did not show any significant differences in their chemical composition. The difference in shade was a result of a different crystallographic orientation, but the grains had the same phase, which was also visible in the surface distribution of the elements. In order to determine the differences in microstructure in different areas of the sample, measurements of the average grain size were made in the area at the edge of the sample and in the middle. Determination of the mean grain size was made stereologically, using the secant method. For the measurements, electron images of the microstructure were taken in the BEC backscattered electron mode at 1500× and 2000× magnification. The results of the mean grain size calculations are presented in Table 1. In order to compare the results, similar measurements were carried out for the material made by casting. Figure 2 shows the microstructure of the cast alloy.
The measurements showed that the tested material contained grains with an average size of 3.2–3.4 μm. The grain size in the examined areas of the sample did not differ significantly, and the material was homogeneous in terms of grain morphology. This was confirmed by the fact that the material was obtained by sintering from powders. The measurements carried out for the cast alloy showed that the tested material had an average grain size of around 35 μm. It should be noted that this value is 10 times greater than that of the sintered material.
Moreover, an analysis of the chemical composition was performed along a line leading from the edge of the sample to its center. Changes in the concentration of individual elements resulting from passing through grains of different chemical composition were registered. No significant changes were observed in the content of elements related to the line penetration into the material. In order to determine the chemical composition of individual grains, as well as to determine the average chemical composition of this material, analyses were performed in micro-areas using the EDS (Energy Dispersive X-ray Spectroscopy, JEOL Ltd., Tokyo, Japan) method. The analysis of the chemical composition of the entire area visible at 2000× magnification is presented in Table 2.
In the cutting tests, cutting edges with a corner radius rε = 0.8 mm were made of CBN. The tool geometry is presented in Table 3.
The cutting parameters values were within the range of the finishing cutting parameters recommended by the tool manufacturer for nickel-based materials (S group). Figure 3 shows photographs of the test bench, cutting tool, and workpiece.
The next stage of the experiments was to determine the microstructure and chemical composition of the material used for the cutting edge. For this purpose, the lateral surface of the cutting insert was polished, on which the microstructure and chemical composition analysis was carried out. The tests showed that the cutting material was made of a bimodal sinter of cubic boron nitride with a cobalt binding phase (10% mass). EDS analysis also showed a low content of elements such as aluminum (1.5%), nickel (0.9%), and tungsten (2.8%, which most probably came from the process of homogenizing the mixture before sintering the cutting edge). Figure 4 shows the microstructure of the cutting edge surface.
The research plan was developed according to the Taguchi method [13]. Based on the analysis of the problem, the research plan was adopted in accordance with Table 4. The influence of two variables, cutting length (L) and cutting speed (vc) on the values of cutting forces (Fp_avg, Ff_avg, Fc_avg), wear of the cutting edge (VB), and surface roughness parameters (Ra) was investigated. Before starting the tests, experiments were carried out to determine the wear of the cutting edge. In the statistical analysis of the test results, the model of the matching function according to Equation (1) was adopted [13].
Y 1 = y ε = b 0 x 0 + b 1 x 1 + b 2 x 2 + b 3 x 3 + b 4 x 4
In Equation (1), Y1 is the estimated response based on first order equation, and y is the measured parameter (e.g., roughness parameter) on a logarithmic scale, where x0 = 1 (dummy variable) and x1x4 are the logarithmic transformations of cutting speed, feed rate, and depth of cut, respectively; ε is the experimental error and b values are the estimates of corresponding parameters.
The S/N (signal-to-noise) ratio analysis strategy was adopted as “the lowest-best” according to the Equation (2) [13].
S / N = 10 × log 1 n i   =   1 n y i 2
where yi is the respective characteristic and n is the number of observations.

3. Results and Discussion

The research was carried out in two stages. In the first stage, the components of the cutting forces were measured (main cutting Fc, feed Ff, and passive Fp), as well as the surface roughness of the workpiece made of sintered nickel-cobalt alloy powder as a function of the flank wear of the cutting edge VB. Tool wear measurements were carried out after the cutting tool had performed a turning operation of the multiple of the section L = 9 mm. In the next stage, in accordance with the adopted research plan, the influence of the cutting length L and cutting speed vc on the values of the edge wear VB, the cutting component Fc, and the arithmetic mean value of surface roughness Ra were analyzed. Moreover, measurements of the geometrical dimensions of the chips were carried out, along with the analysis of the results. The average values for all analyzed parameters were determined based on 3–5 repetitions of measurements for each sample.
Table 5, Table 6 and Table 7 present selected results of the measurement of the wear of the cutting edge VB, the components of the total cutting force (Fc, Ff, Fp), the and surface roughness parameter Ra, as a function of cutting length L for the cutting parameter values used in the tests (ap = 0.5 mm, f = 0.048 mm/rev).
Figure 5 and Figure 6 show sample photographs of the cutting edge wear used in the machining of the sintered material. To compare, Figure 7 shows an example of the cutting edge wear during machining of the cast alloy. Figure 8 shows the cutting edge wear characteristics for different cutting speeds.
SEM images of the surfaces of the cutting inserts which were used in the cutting tests of sintered material (Figure 5 and Figure 6) and cast material (Figure 7) show the wear of the cutting edge as abrasions on the surface after cutting with different cutting parameters. Significant chipping of the cutting edge material was observed on the surface, which is a common phenomenon for ceramic materials. The extent of the tool wear may have been influenced by the smaller grain size in the investigated sintered material. Based on the obtained results, the VB parameter characteristics were determined as a function of the cutting length (Figure 8). The presented cutting edge wear characteristics are typical, with visible preliminary lapping, then stable wear and a rapid increase in wear. In the comparison of tool wear for the machining of sintered and cast material (Figure 8), accelerated tool wear was observed, as well as a shorter tool life for machining the cast alloy. The analysis of the chemical composition showed the presence of an accumulation of the processed material in the form of elements such as Ni, Mo, Co, Cr, Ti, Al, Si, and others in trace amounts (Fe, Nb). This was also confirmed from the images of the microstructures of the rake surface and the distribution of surface element concentrations, the so called mapping.
Figure 9, Figure 10 and Figure 11 show the characteristics of the components of the total cutting force as a function of the tool wear VB for turning with a different value of the sintered alloy cutting speed.
A stable increase in all the values of the components of total cutting force during cutting was observed for all cutting speeds used in the tests. The highest values were obtained for the passive component Fp. During the tool operation, and thus with the increasing wear of the cutting edge, the values of the passive component were about 2–2.5 times higher than the values of the other component forces.
In the next step, an ANOVA (analysis of variance) analysis of the results was carried out using the Taguchi method for three variables: cutting edge wear VB, surface roughness Ra, and the main cutting force Fc. The research plan according to the Taguchi method consisted of 18 test systems (according to Table 4). In each test system, the mean value of the analyzed variable was determined based on three measurements. Table 8 presents the results of measurements of the values of the analyzed variables.
Figure 12 shows the influence of the variables (i.e., cutting length L and cutting speed vc) on the tool wear described by the VB parameter. Likewise, Figure 13 shows the effect of the variables on the cutting force Fc.
Table 9 and Table 10 show the results of the ANOVA statistical analysis of the test results where: DF—degrees of freedom, Seq SS—sums of squares, Adj SS—adjusted sums of squares, Adj MS—adjusted means squares, P—probability of obtaining a test statistic, F—significance factor, R-Sq—coefficient of determination.
Equations (3) and (4) enable calculating the determined mathematical dependencies for cutting edge wear and the main cutting force as a function of the cutting length and cutting speed.
V B L , v c = 0.204 0.00232 × L + 0.00115 × v C
F c L , v c = 40 + 0.552 × L + 0.571 × v C
Based on the analysis of the results, it can be concluded that the change in the value of the cutting speed vc significantly affects the value of tool wear VB and the value of the cutting force Fc. The cutting length L significantly affects the values of the VB parameter and the tangential component Fc, which is the result of the progressing wear of the tool. Figure 14 shows the effect of the wear of the cutting edge on the value of the surface specific cutting force kc. It was observed that for a cutting edge wear in the range of 0.15 > VB > 0.35 mm, the specific cutting force values stabilized and reached the values of about kc = 8000 N/mm2, despite the increasing values of the cutting force Fc. For wear of VB < 0.15 mm, a faster increase in the value of kc was visible. The reason may have been a change in the value of the cross-section of the cutting layer AD resulting from the progressing wear of the cutting edge VB. Figure 15 shows schematically the change of the nominal cross-sectional area AD in a perpendicular view to the rake and flank surface. The surface specific cutting force is described by the Equation (5) [41].
k c = F c A D = F c f   ×   a p ,   ( N / mm 2 )
where Fc is the main cutting force and AD is the nominal cross-section of the cutting layer.
VB wear on the flank surface translates into visible wear on the rake surface KVB (examples are shown in Figure 5 and Figure 6). The KVB value can be calculated approximately based on the Equation (6).
K V B = V B × tan α ,   ( mm )
The value of the surface of the specific cutting force kc is:
k c = F c A D A V B ,   ( N / mm 2 )
where AVB is approximately a section of a circle and is:
A V B = r ε 2 2 × θ sin θ ,   ( mm 2 )
During the tests, chipping of the cutting edge material on the rake surface was also observed. This phenomenon can also affect the value of the cross-section of the cutting layer during turning. For machining of cast alloy, specific cutting force values increase linearly with tool wear over time. The obtained values are, on average, about 1000 N/mm2 lower than the specific cutting force of the sintered alloy.
Figure 16 shows the curve of the surface roughness Ra as a function of the cutting time Tc and in time of increasing wear of the cutting edge. In the initial phase of the operation (for a new tool) and in the final phase of the cutting tool’s operation (for wear VB > 0.2 mm), a temporary increase in the Ra parameter was observed. These changes may be caused by local deformations on the machined surface. Figure 17 shows the influence of the analyzed variables on the surface roughness Ra values. The results of the statistical analysis showed a significant impact of the cutting length L and the cutting speed vc on the surface roughness Ra values.
Table 11 shows the ANOVA results for the Ra parameter. The relationship of Ra as a function of the cutting length and cutting speed is presented in Equation (9).
R a L , v b = 23.847 0.024 × L 0.292 × v C + 0.0044 × L 2 + 0.00095 × v c 2 0.0000113 × L × v C
Microscopic analysis and surface topography measurements showed a changeable nature of the surface roughness as a function of the cutting length L, and thus the progressing wear of the cutting tool VB. In the initial period of the cutting edge operation, a temporary increase in the Ra surface roughness value was observed. The microscopic analysis of the machined surface revealed that burrs on the machined surface were observed after a short time of tool operation (lapping the cutting edge). This may cause an increase in the value of Ra parameter. Figure 18 shows examples of micrographs of the machined surface, as well as the surface topography and the Ra roughness characteristic. For tool wear VB > 0.2 mm, workpiece build-ups and deformations were visible at the top, along the machining paths after the cutting edge had operated. Figure 19 shows examples of microscopic images with visible deformations. No such deformation was observed when cutting cast alloy. Figure 20 shows examples of microscopic images and surface topography measurements after processing the cast alloy.
During the tests, chips were observed with a segment structure. Chip analysis showed that the chip form changed with the progressing wear of the cutting tool for all applied cutting speeds. A change in the form of chips from continuous and entangled to short and arched was observed. The probable cause of the form change was the change in the cross-section of the cutting layer resulting from the progressing wear of the cutting edge. Figure 21 shows photos of chips obtained in subsequent cutting tests.
The chips were subjected to microscopic examination of the microstructure. The inside of the chips, which adhered to the rake surface, and the outside of the resulting chips were analyzed. Figure 22 shows exemplary images for microscopic chip analysis. Chip cracks were observed for the progressing wear of the cutting edge. The chips from cutting with tools with new edges, regardless of the used cutting speed vc, were silver. On the other hand, chips from cutting with worn tools presented a golden yellow color, the intensity of which increased with the increase in the cutting speed. Presumably, this could have been caused by the temperature increase in the cutting zone with the cutting speed.
Based on the measurements of the geometrical dimensions of the chips obtained in the cutting tests, the relationships between the dimensions of the width h and the thickness b of the chips, chip compression ratio Λl, and the shear angle Φ were determined (Figure 23). A decrease in chip width b was observed with a simultaneous increase in chip thickness h upon the progressive wear of the tool VB. For VB > 0.4 mm, the values of the chip compression ratio for all tested cutting speeds reached the value of Λl = 1.5. The calculated value of the shear angle was in the range of Φ = 18–35 degree.

4. Conclusions

Based on the results and analyses, the following conclusions can be formulated:
-
In the article the characteristics of the machining process were presented for the parts made of sintered nickel-cobalt alloy while using CBN tools.
-
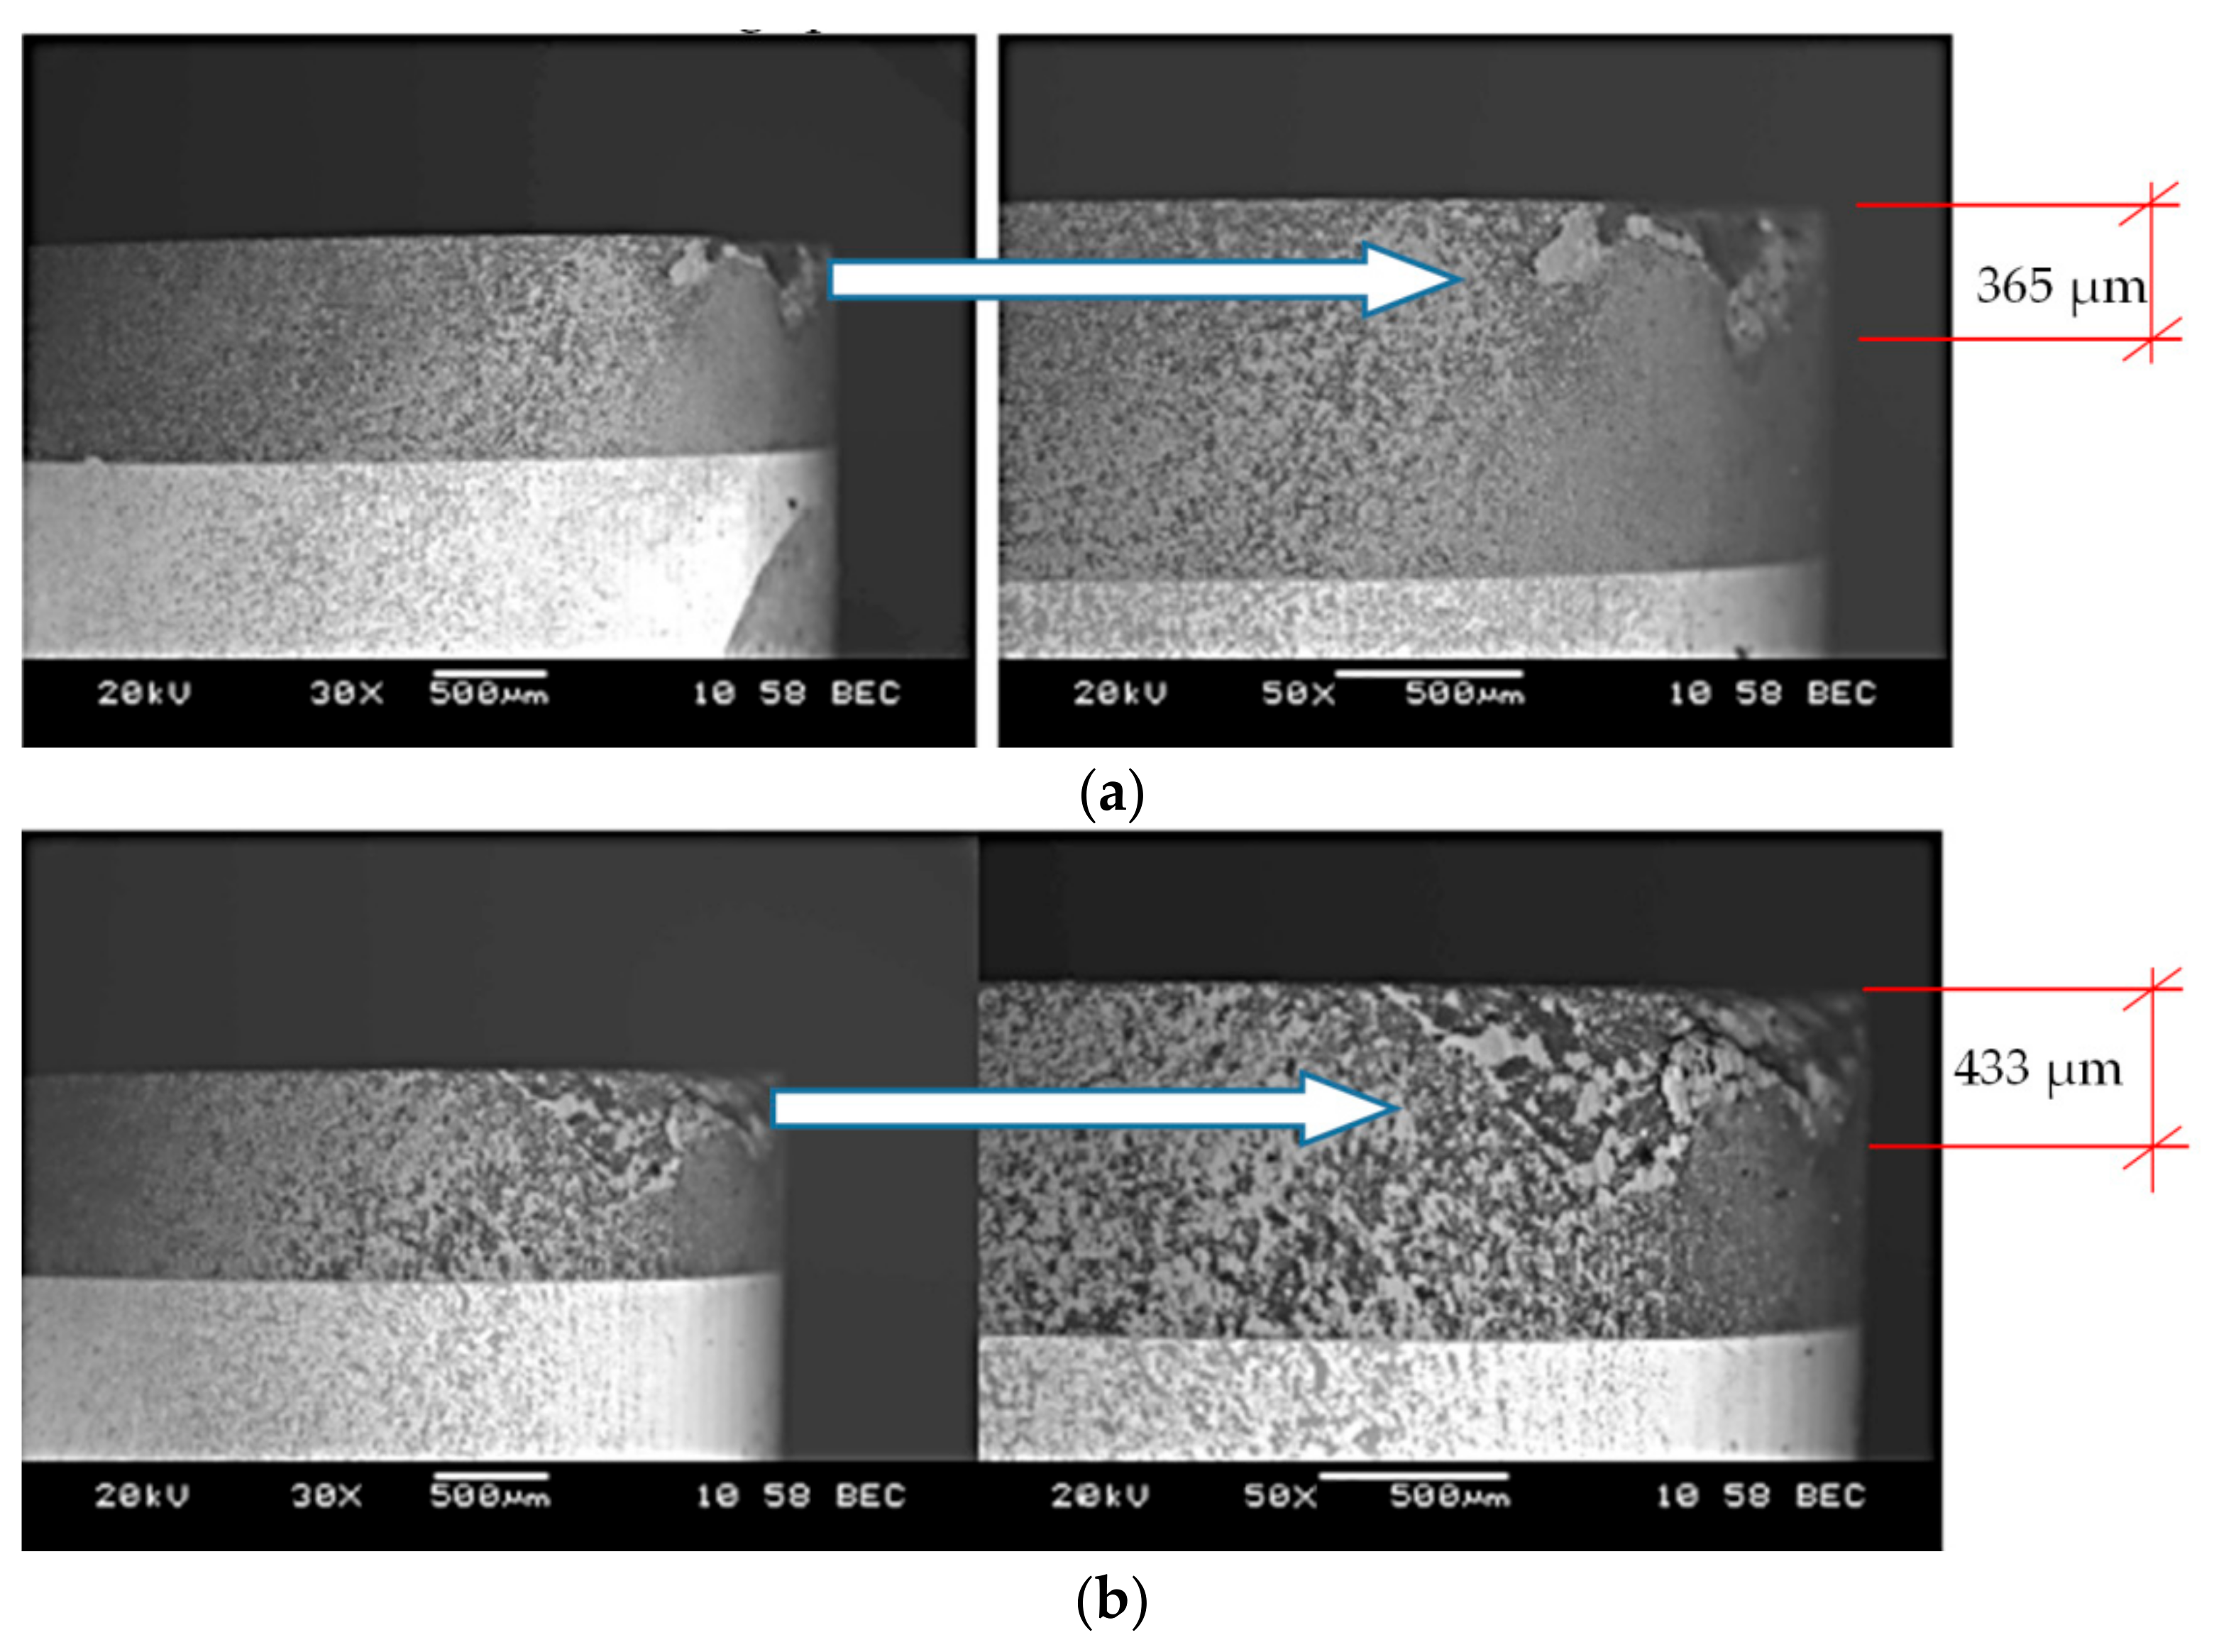
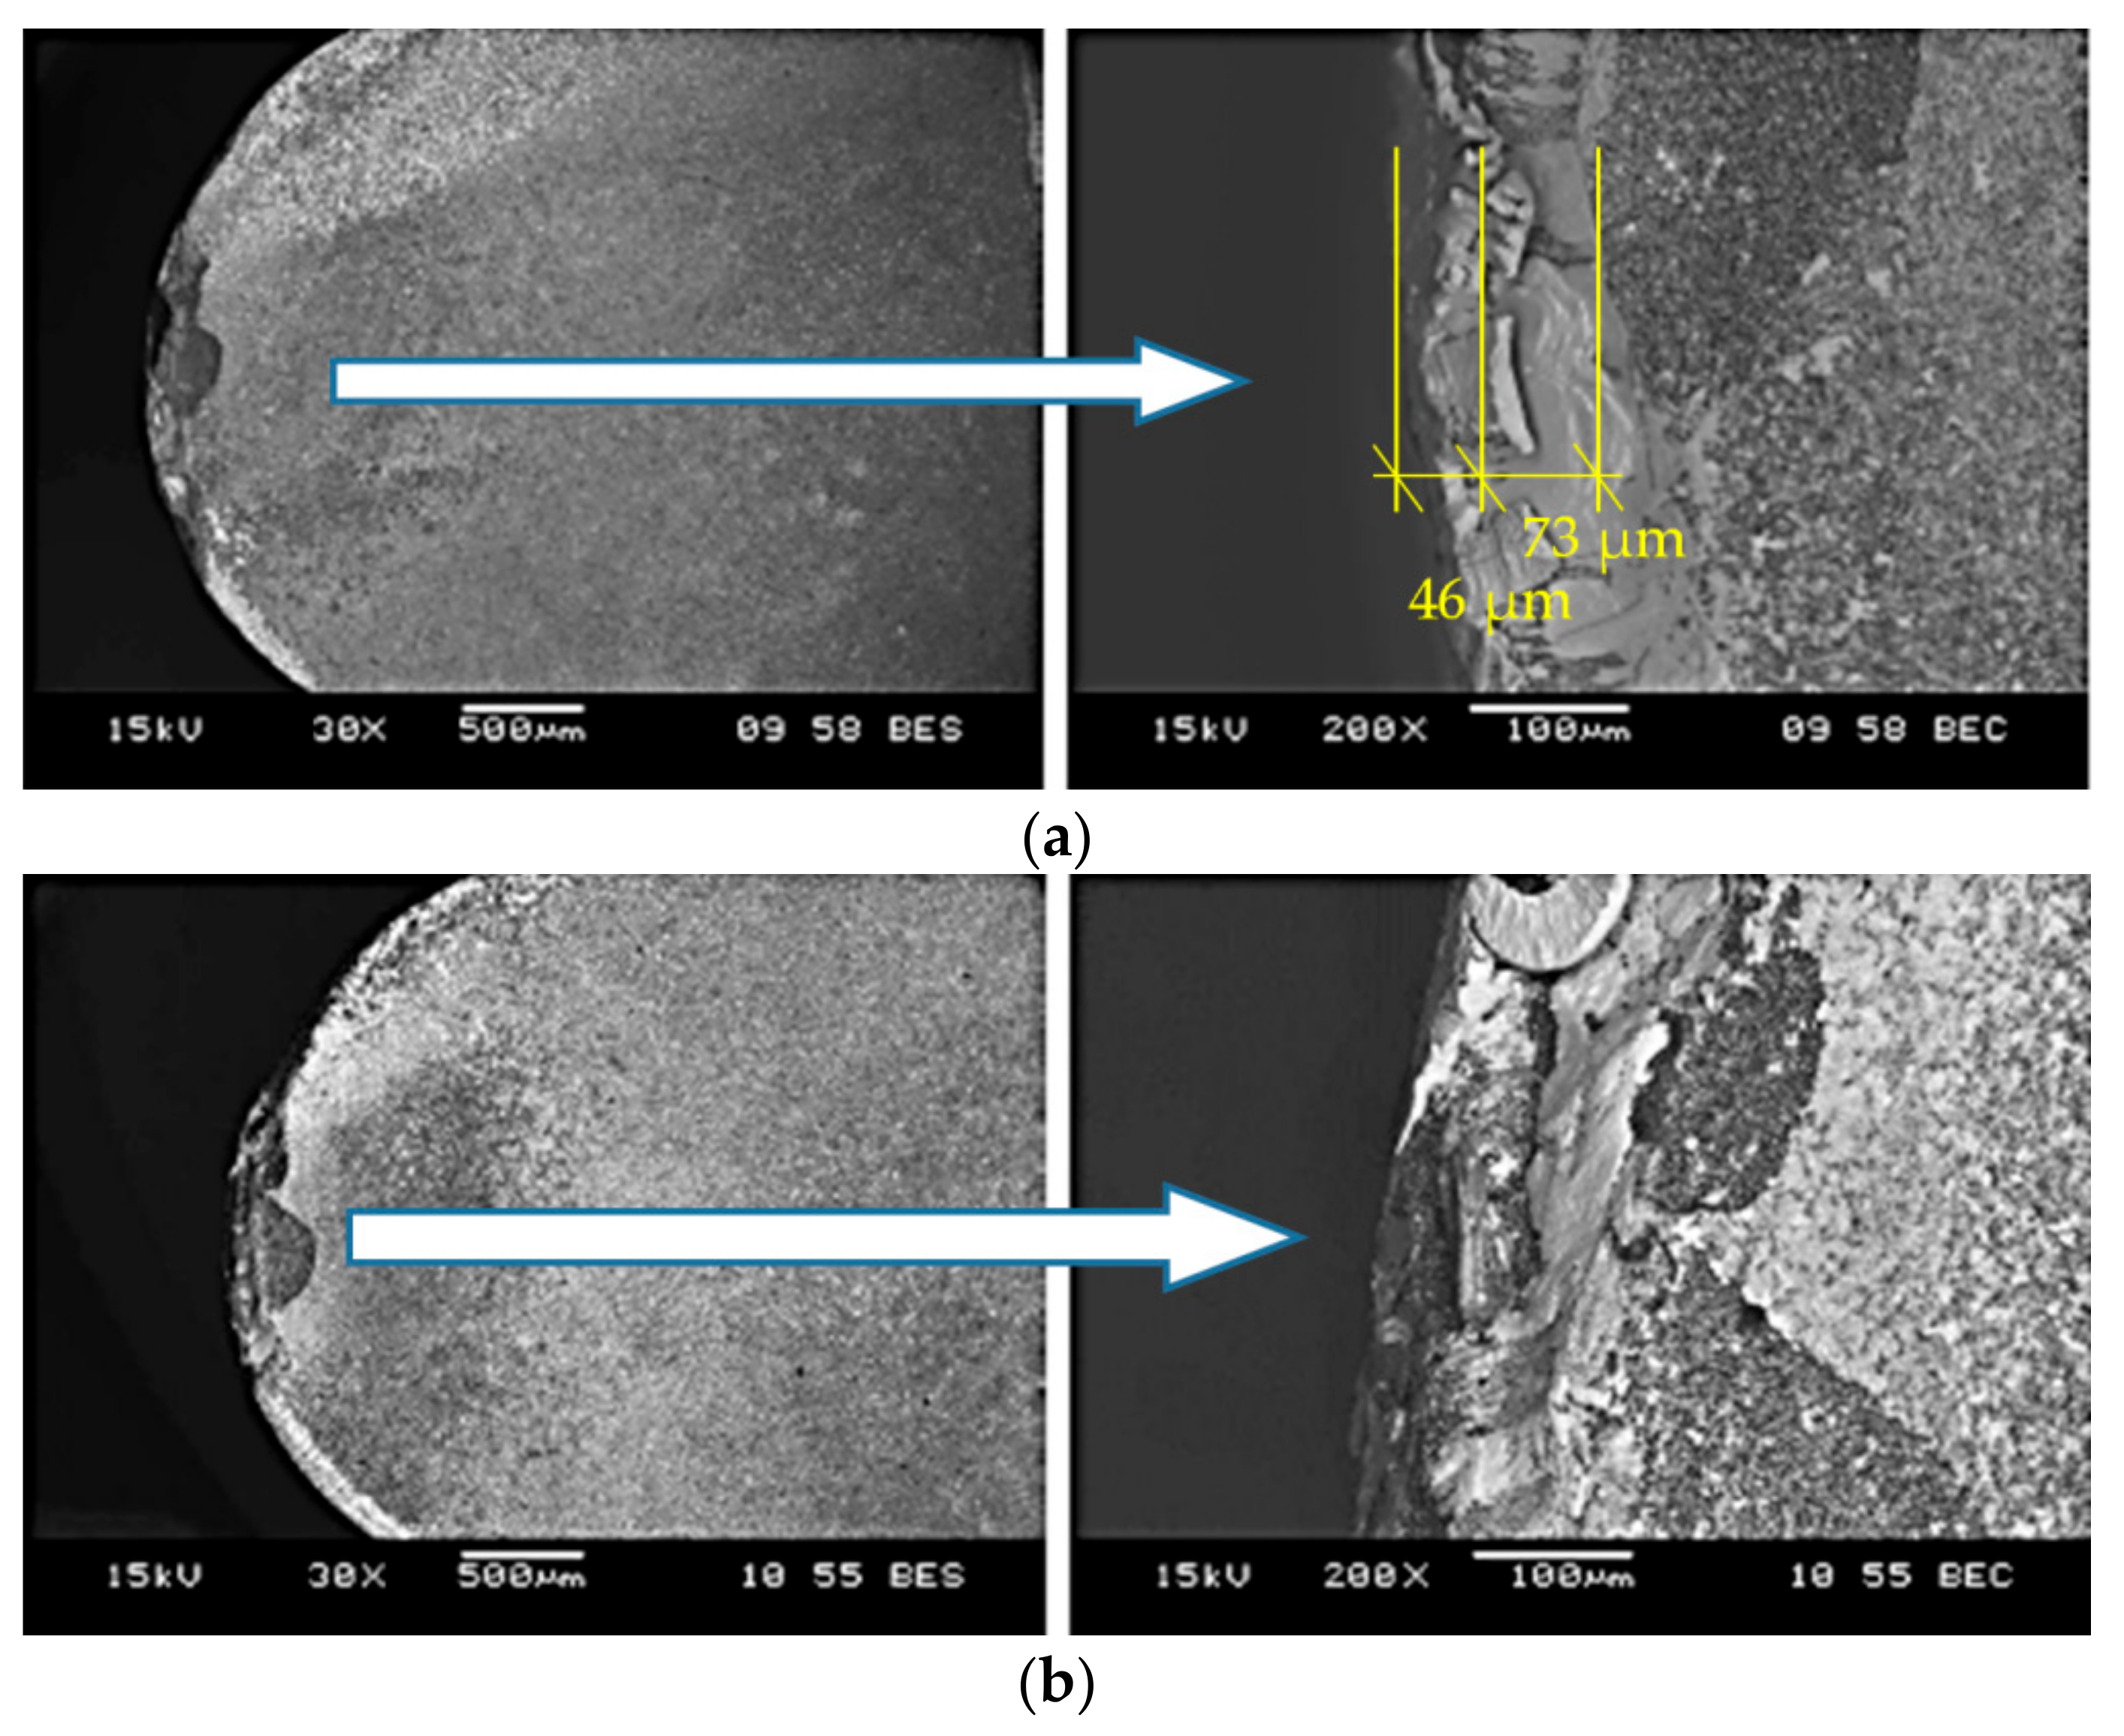
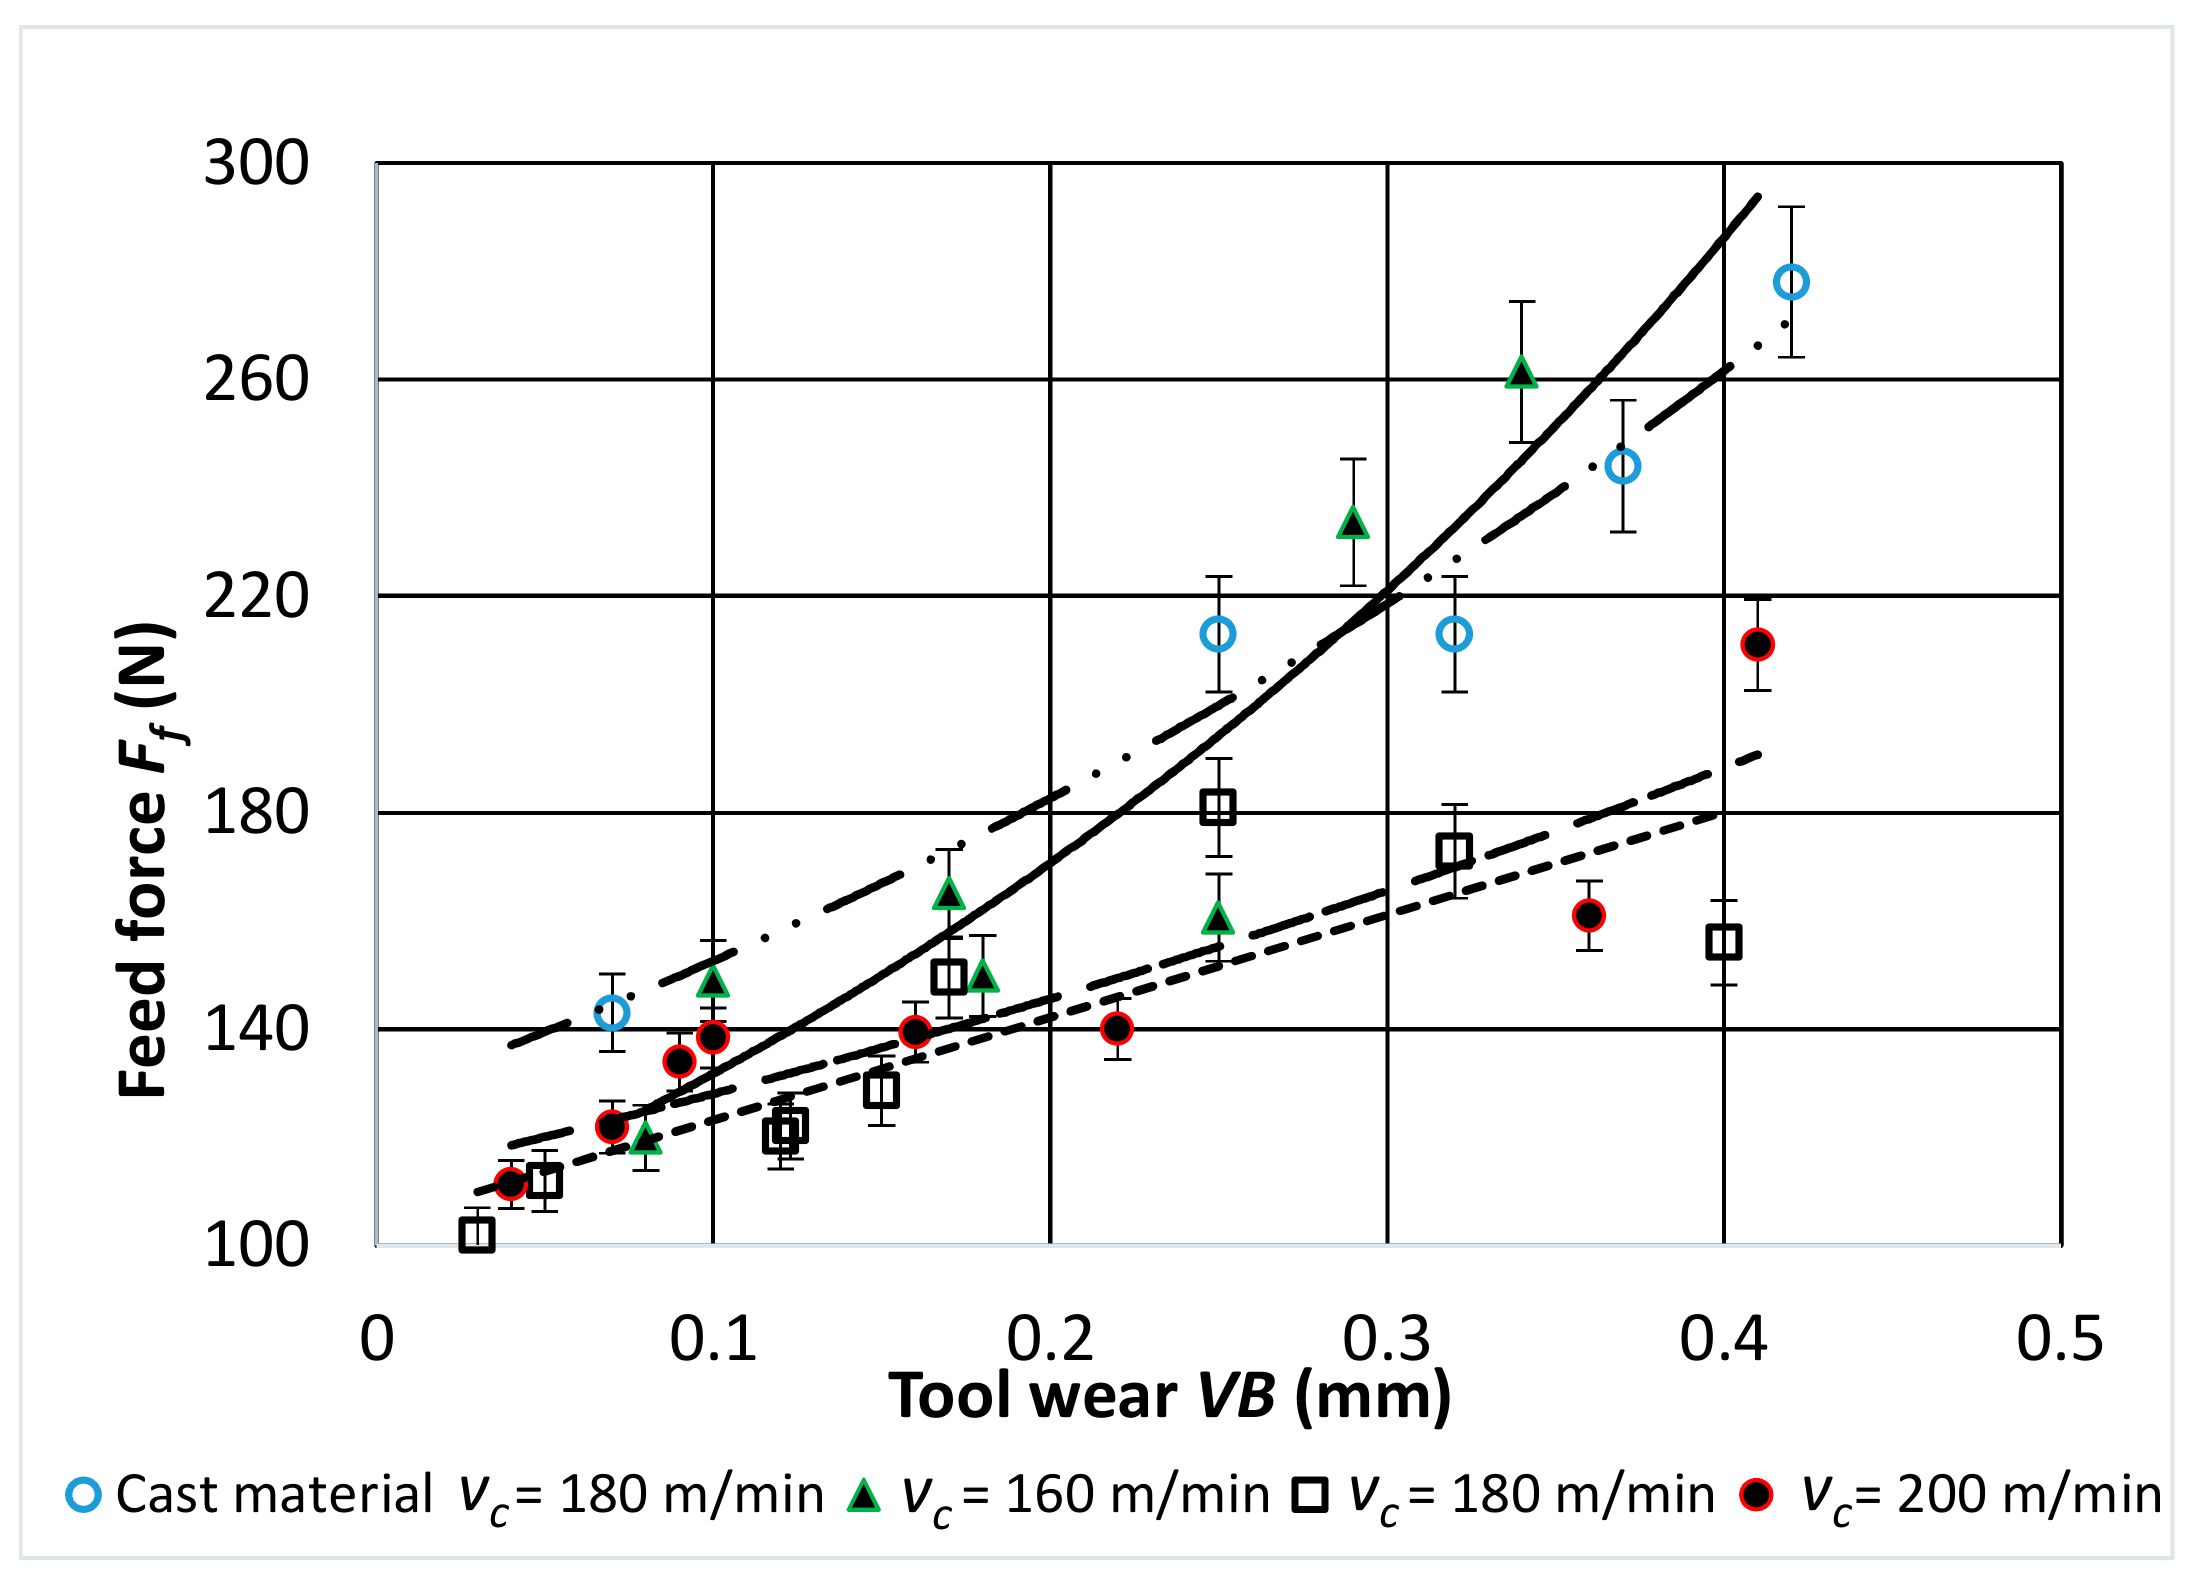
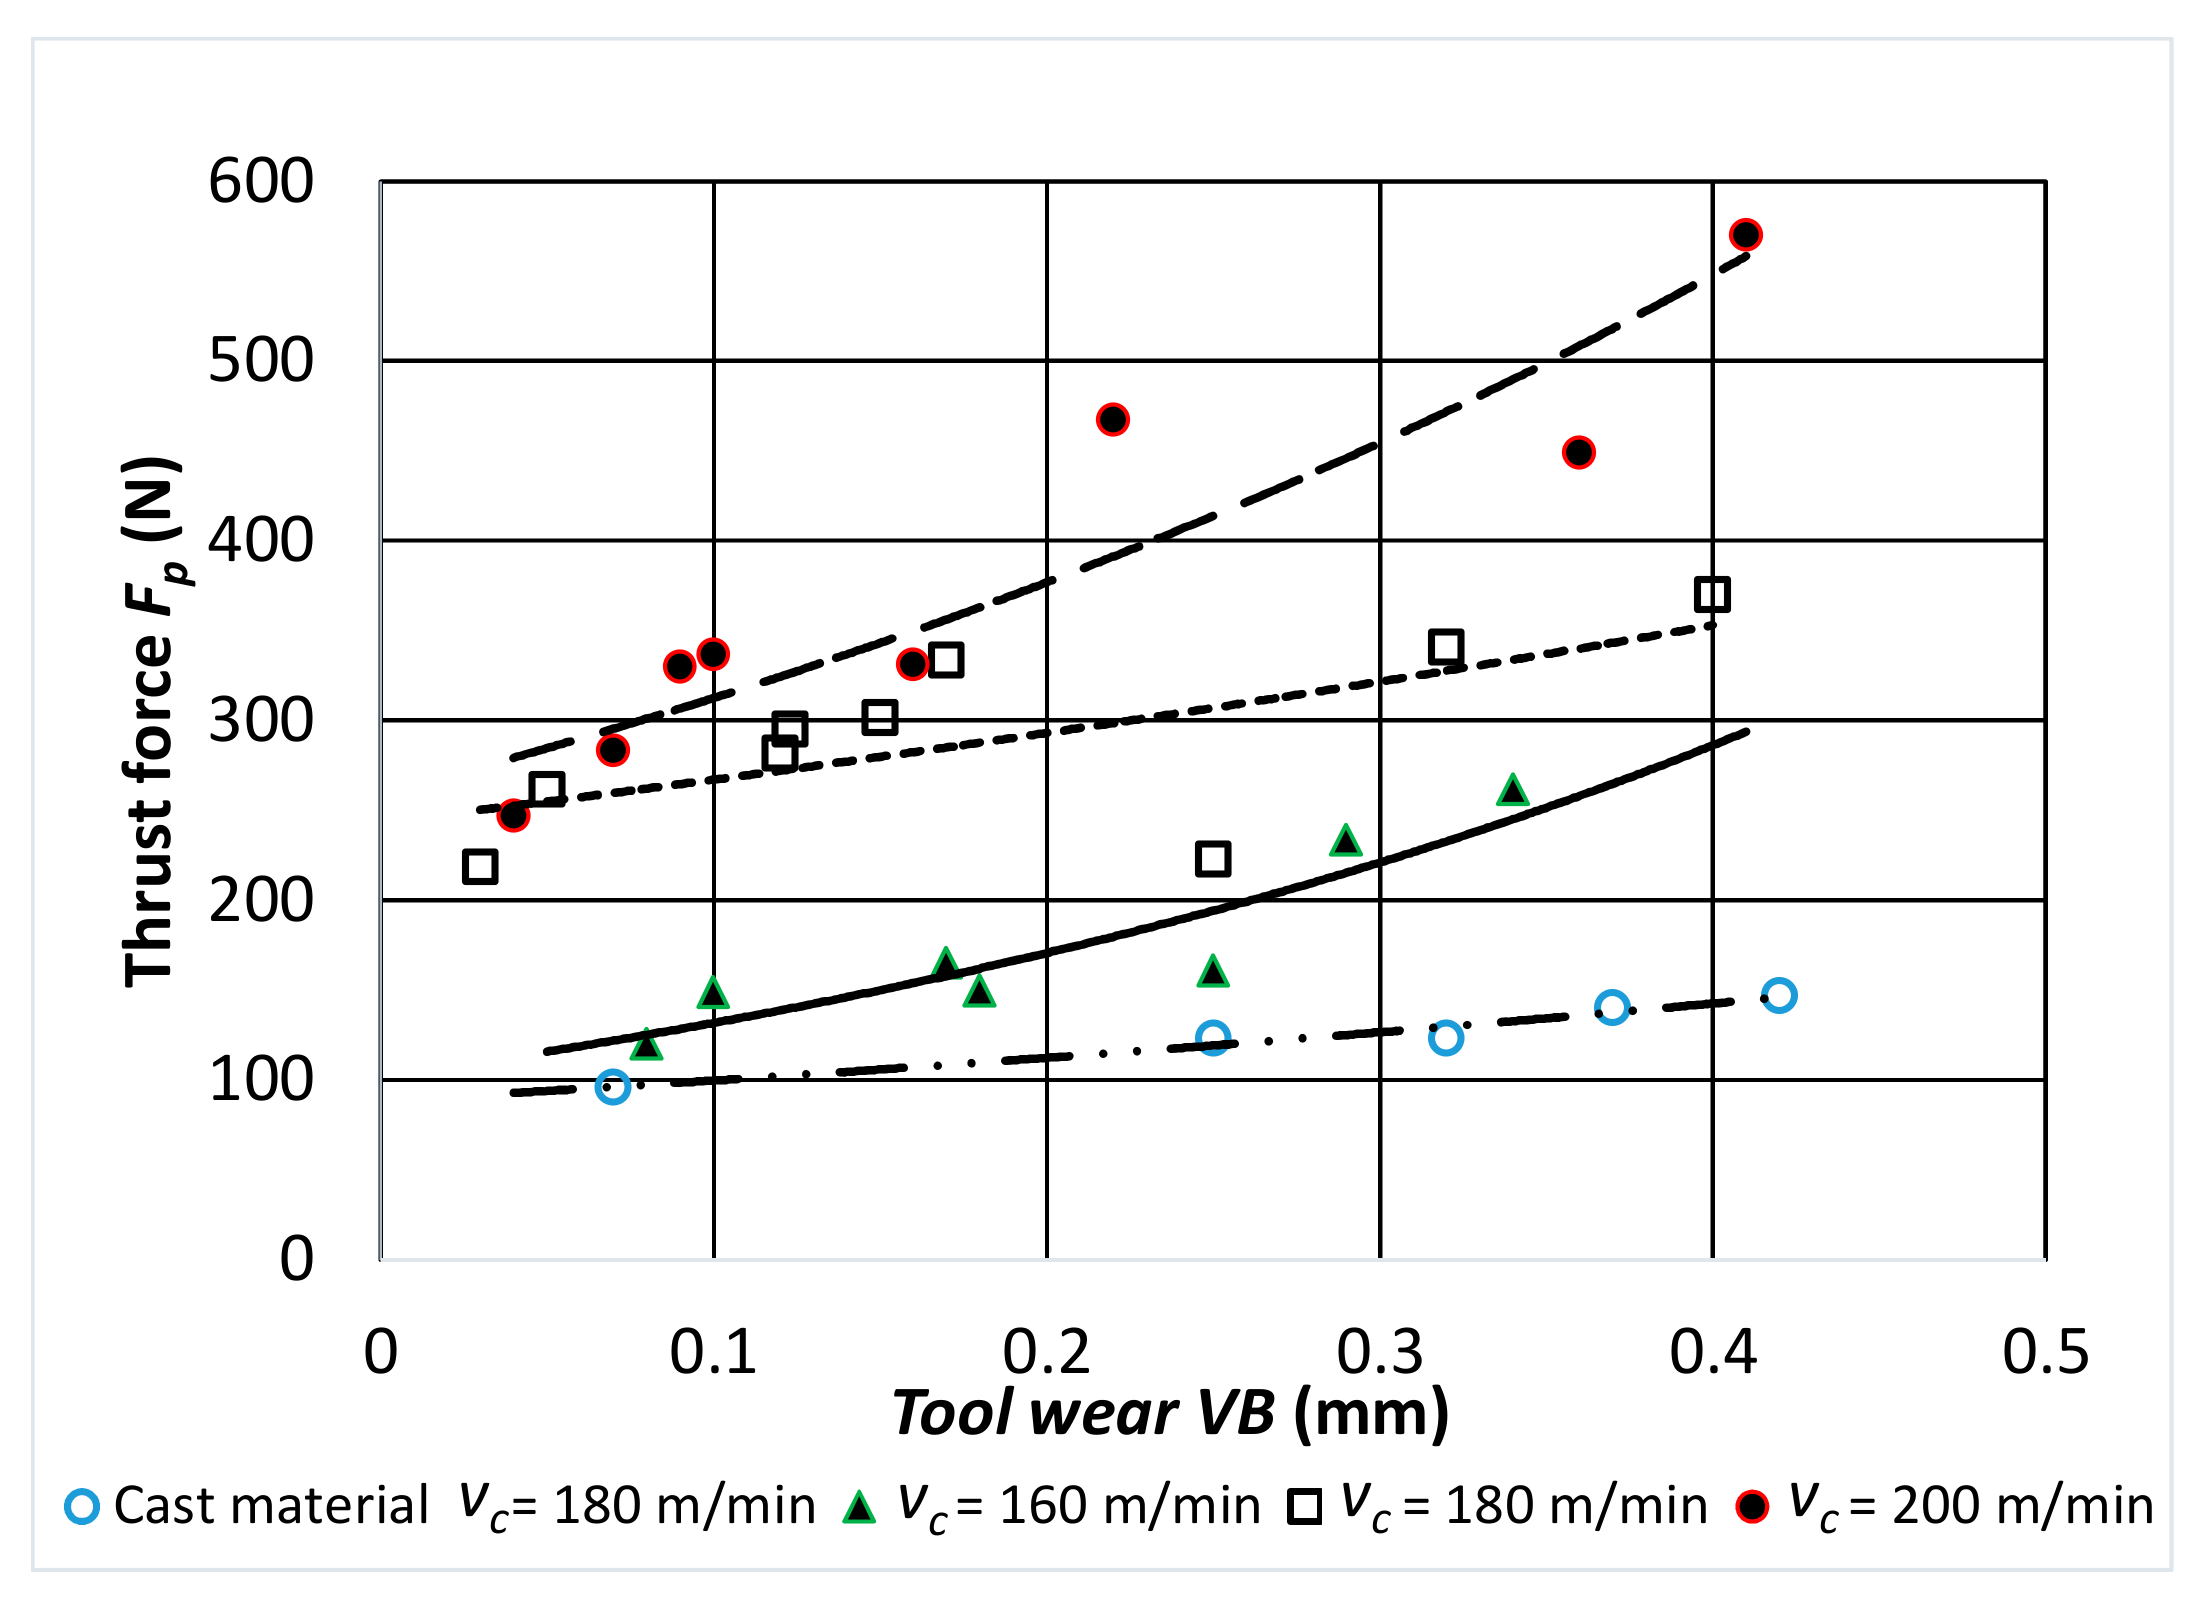
During longitudinal turning of the sintered nickel-cobalt alloy, tool wear was observed. The wear on the rake face in the form of cracks and chipping material was determined. The analysis of the research results showed a significant influence of the cutting edge wear on the values of the cutting forces (Fc, Fp, Ff), specific cutting force kc, surface roughness Ra, and chip form.
-
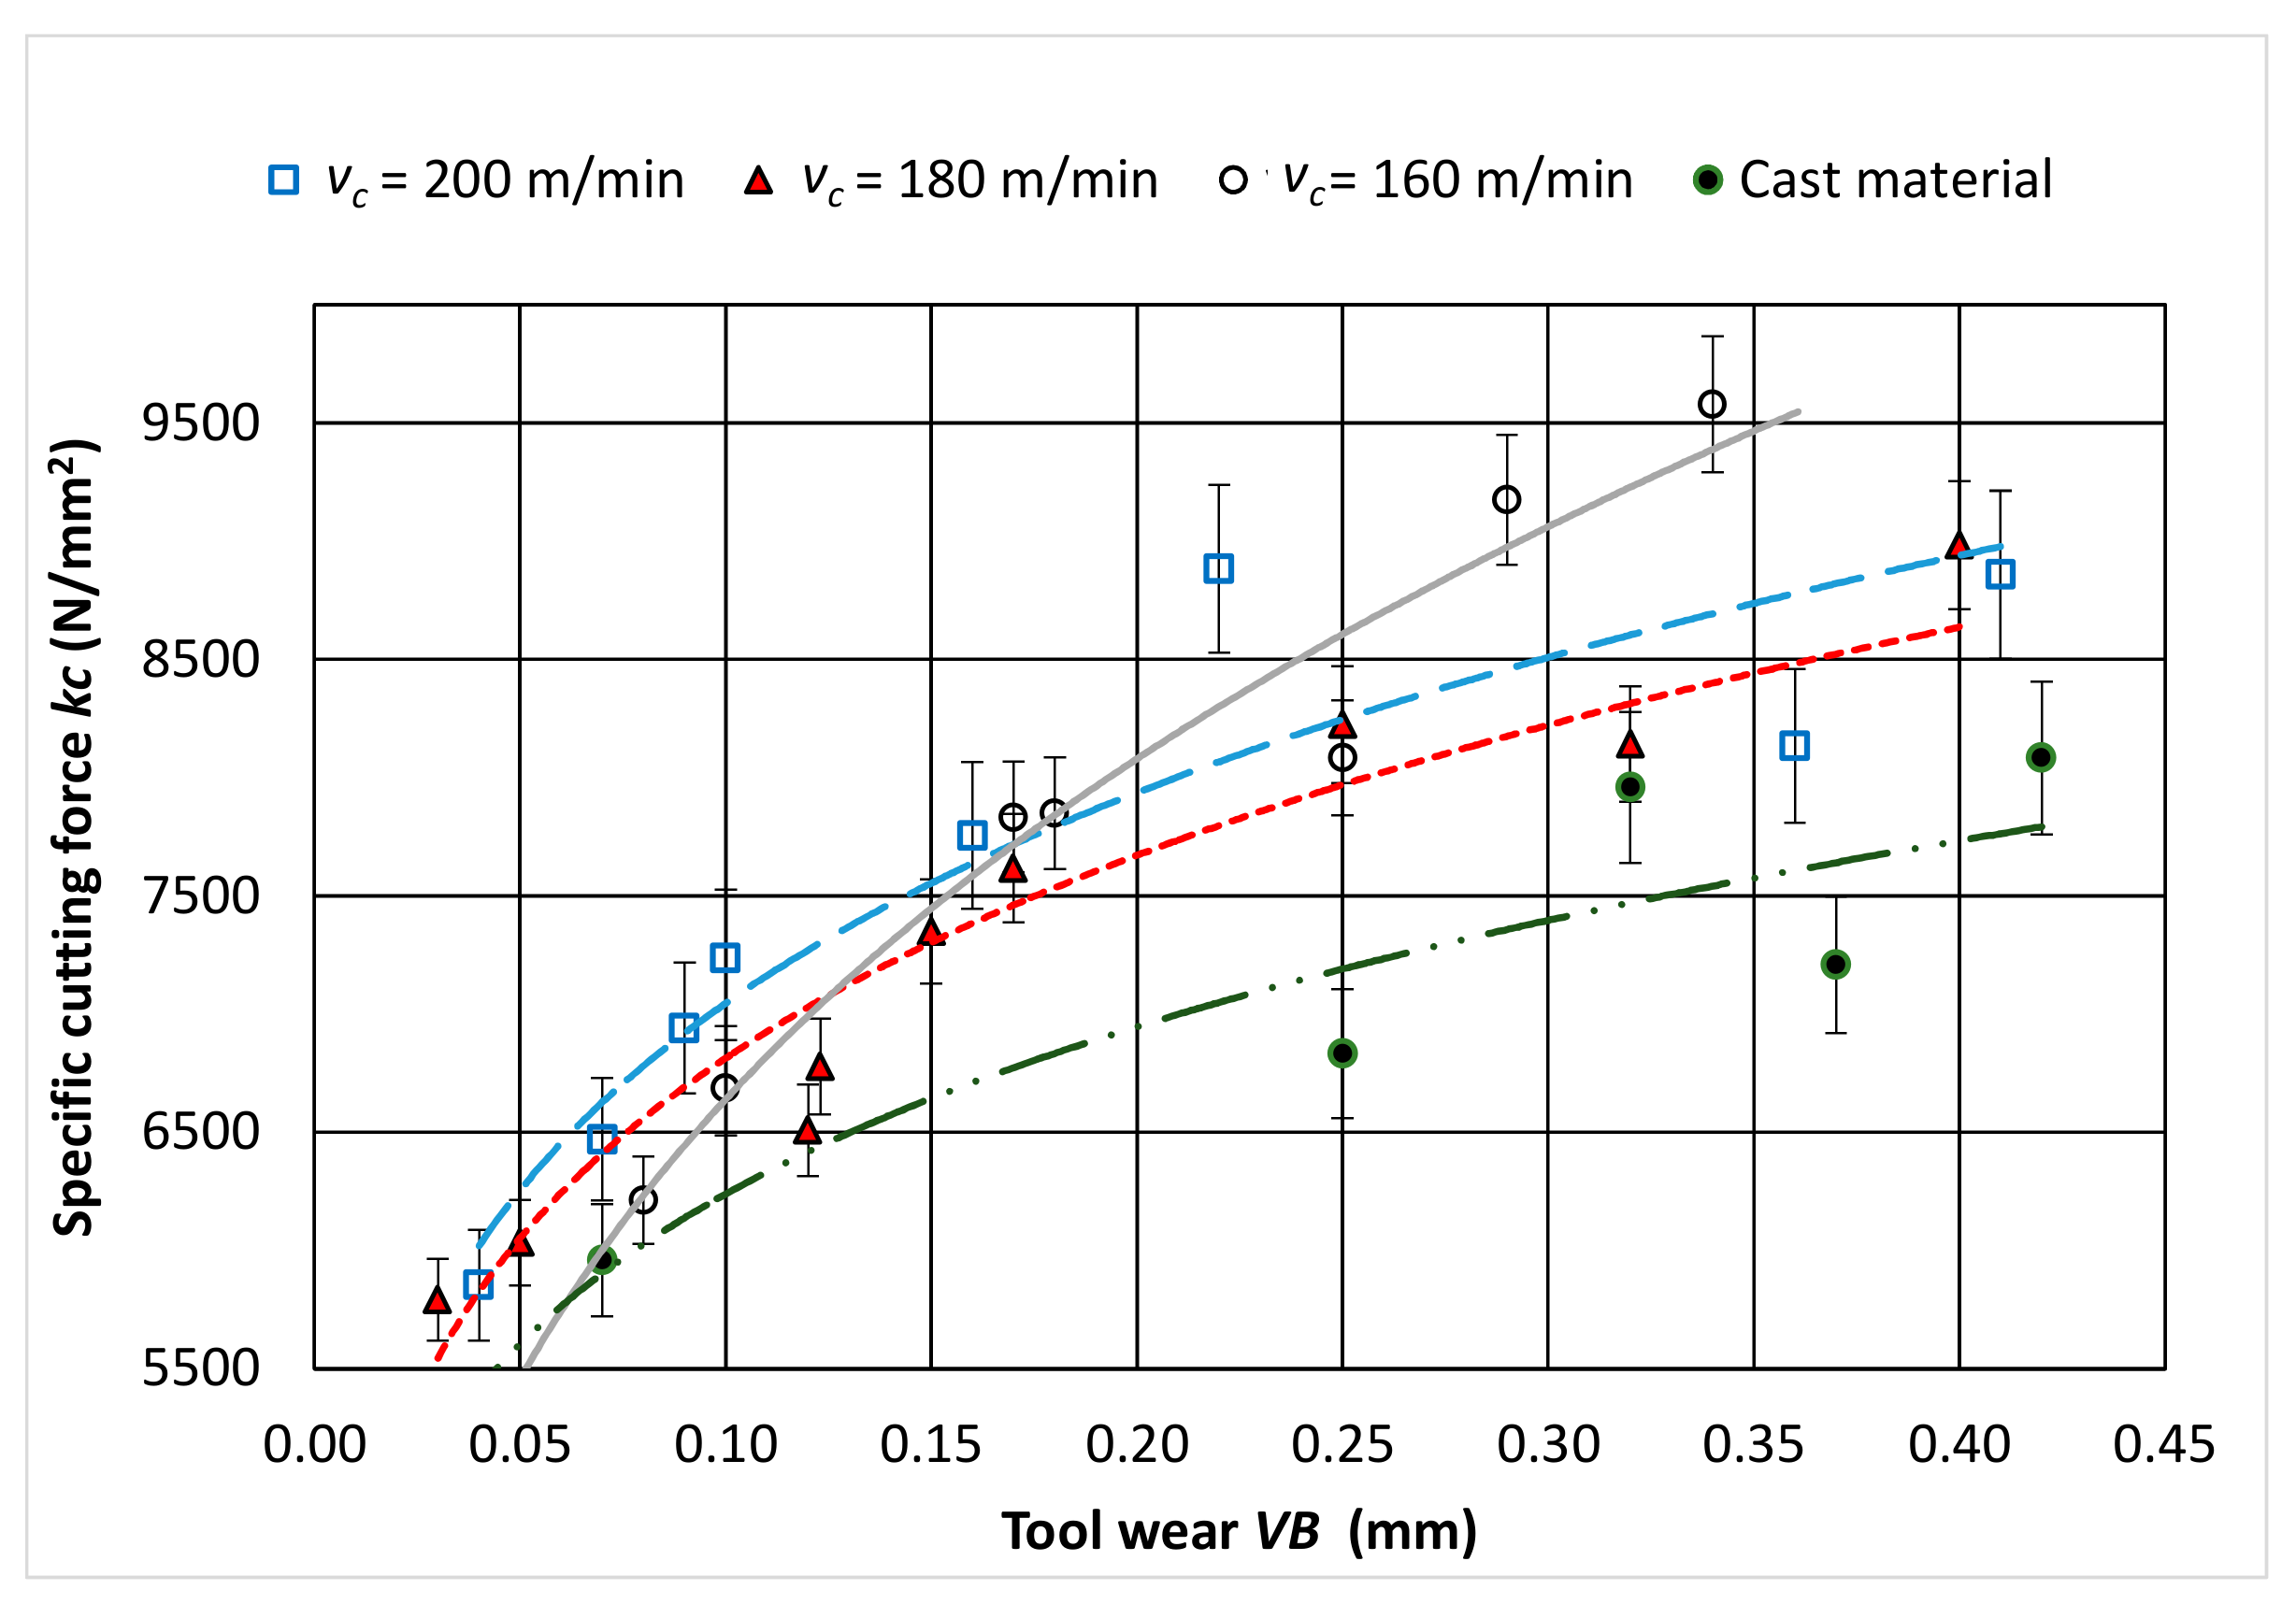
In case of the tool wear in the range of VB = 0–0.2 mm, the specific cutting force values increased slightly and reached similar values equal to kc = 5500–7500 N/mm2. In turn, for the tool wear VB > 0.2 mm, the specific cutting force values increased significantly and they were characterized by a large scatter. The probable cause of this phenomenon was the change of the cross-section of the cutting layer with time due to the tool wear, as well as the change of the nature of the wear on the insert rake face: the observed chipping.
-
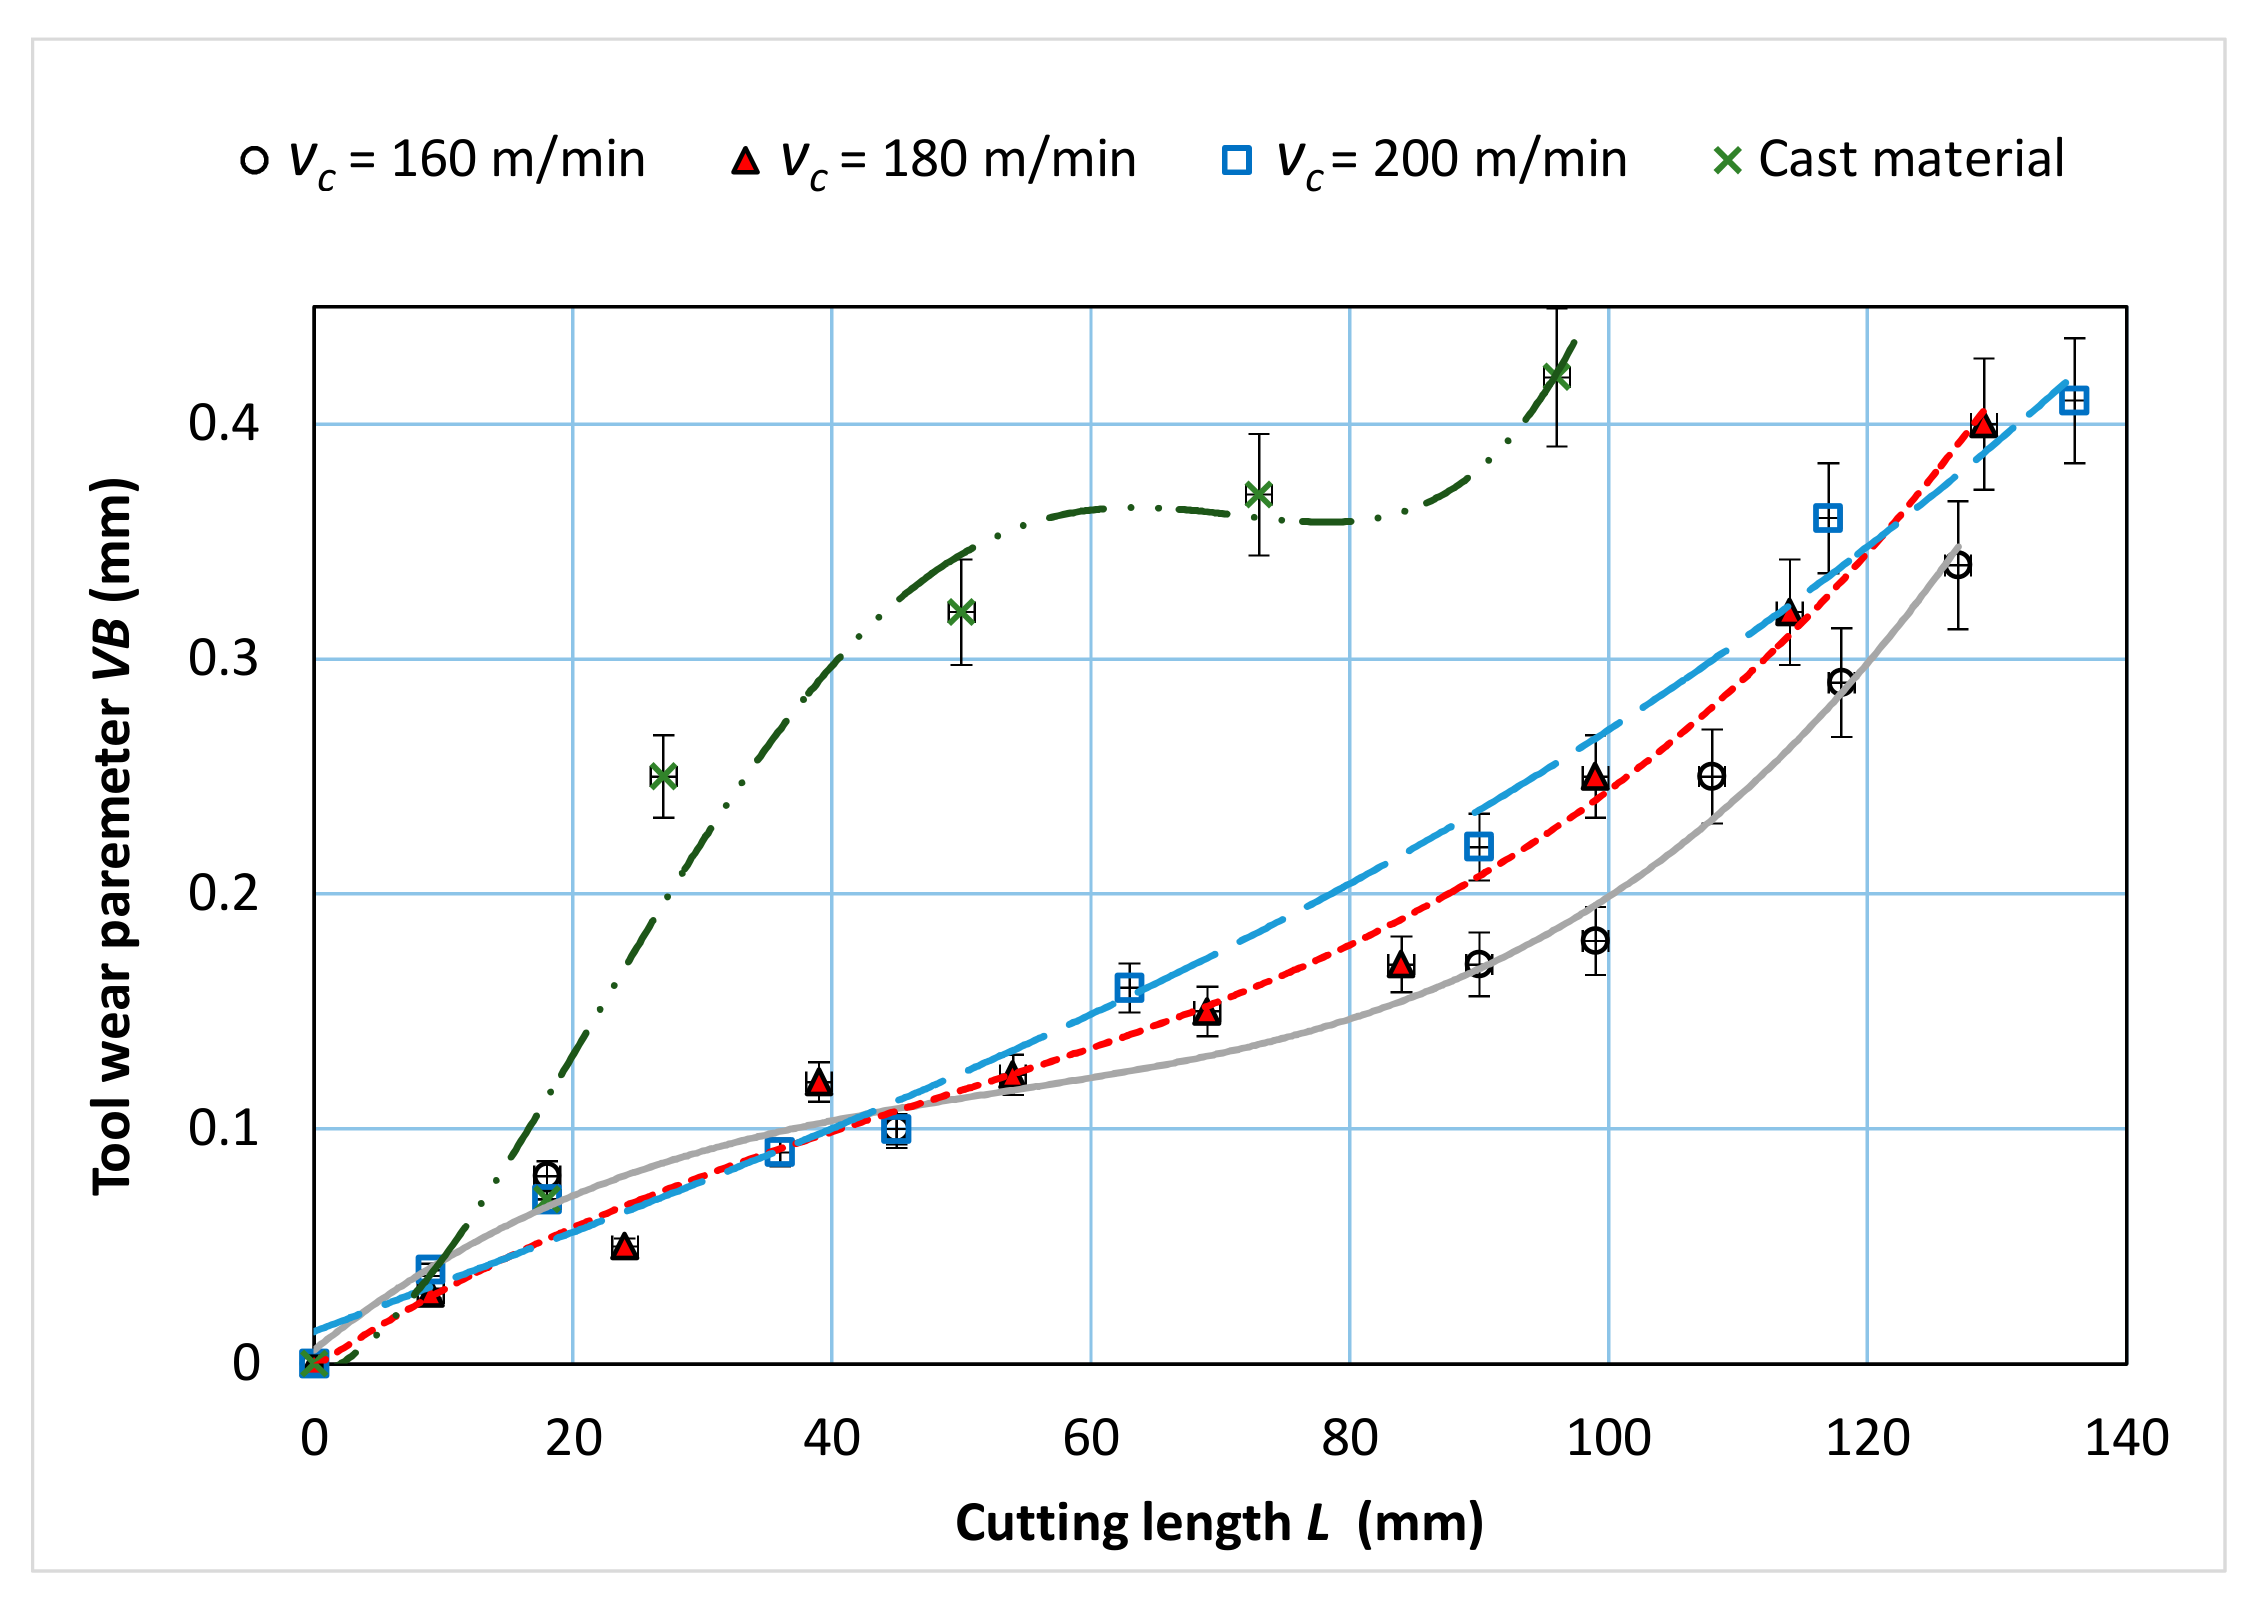
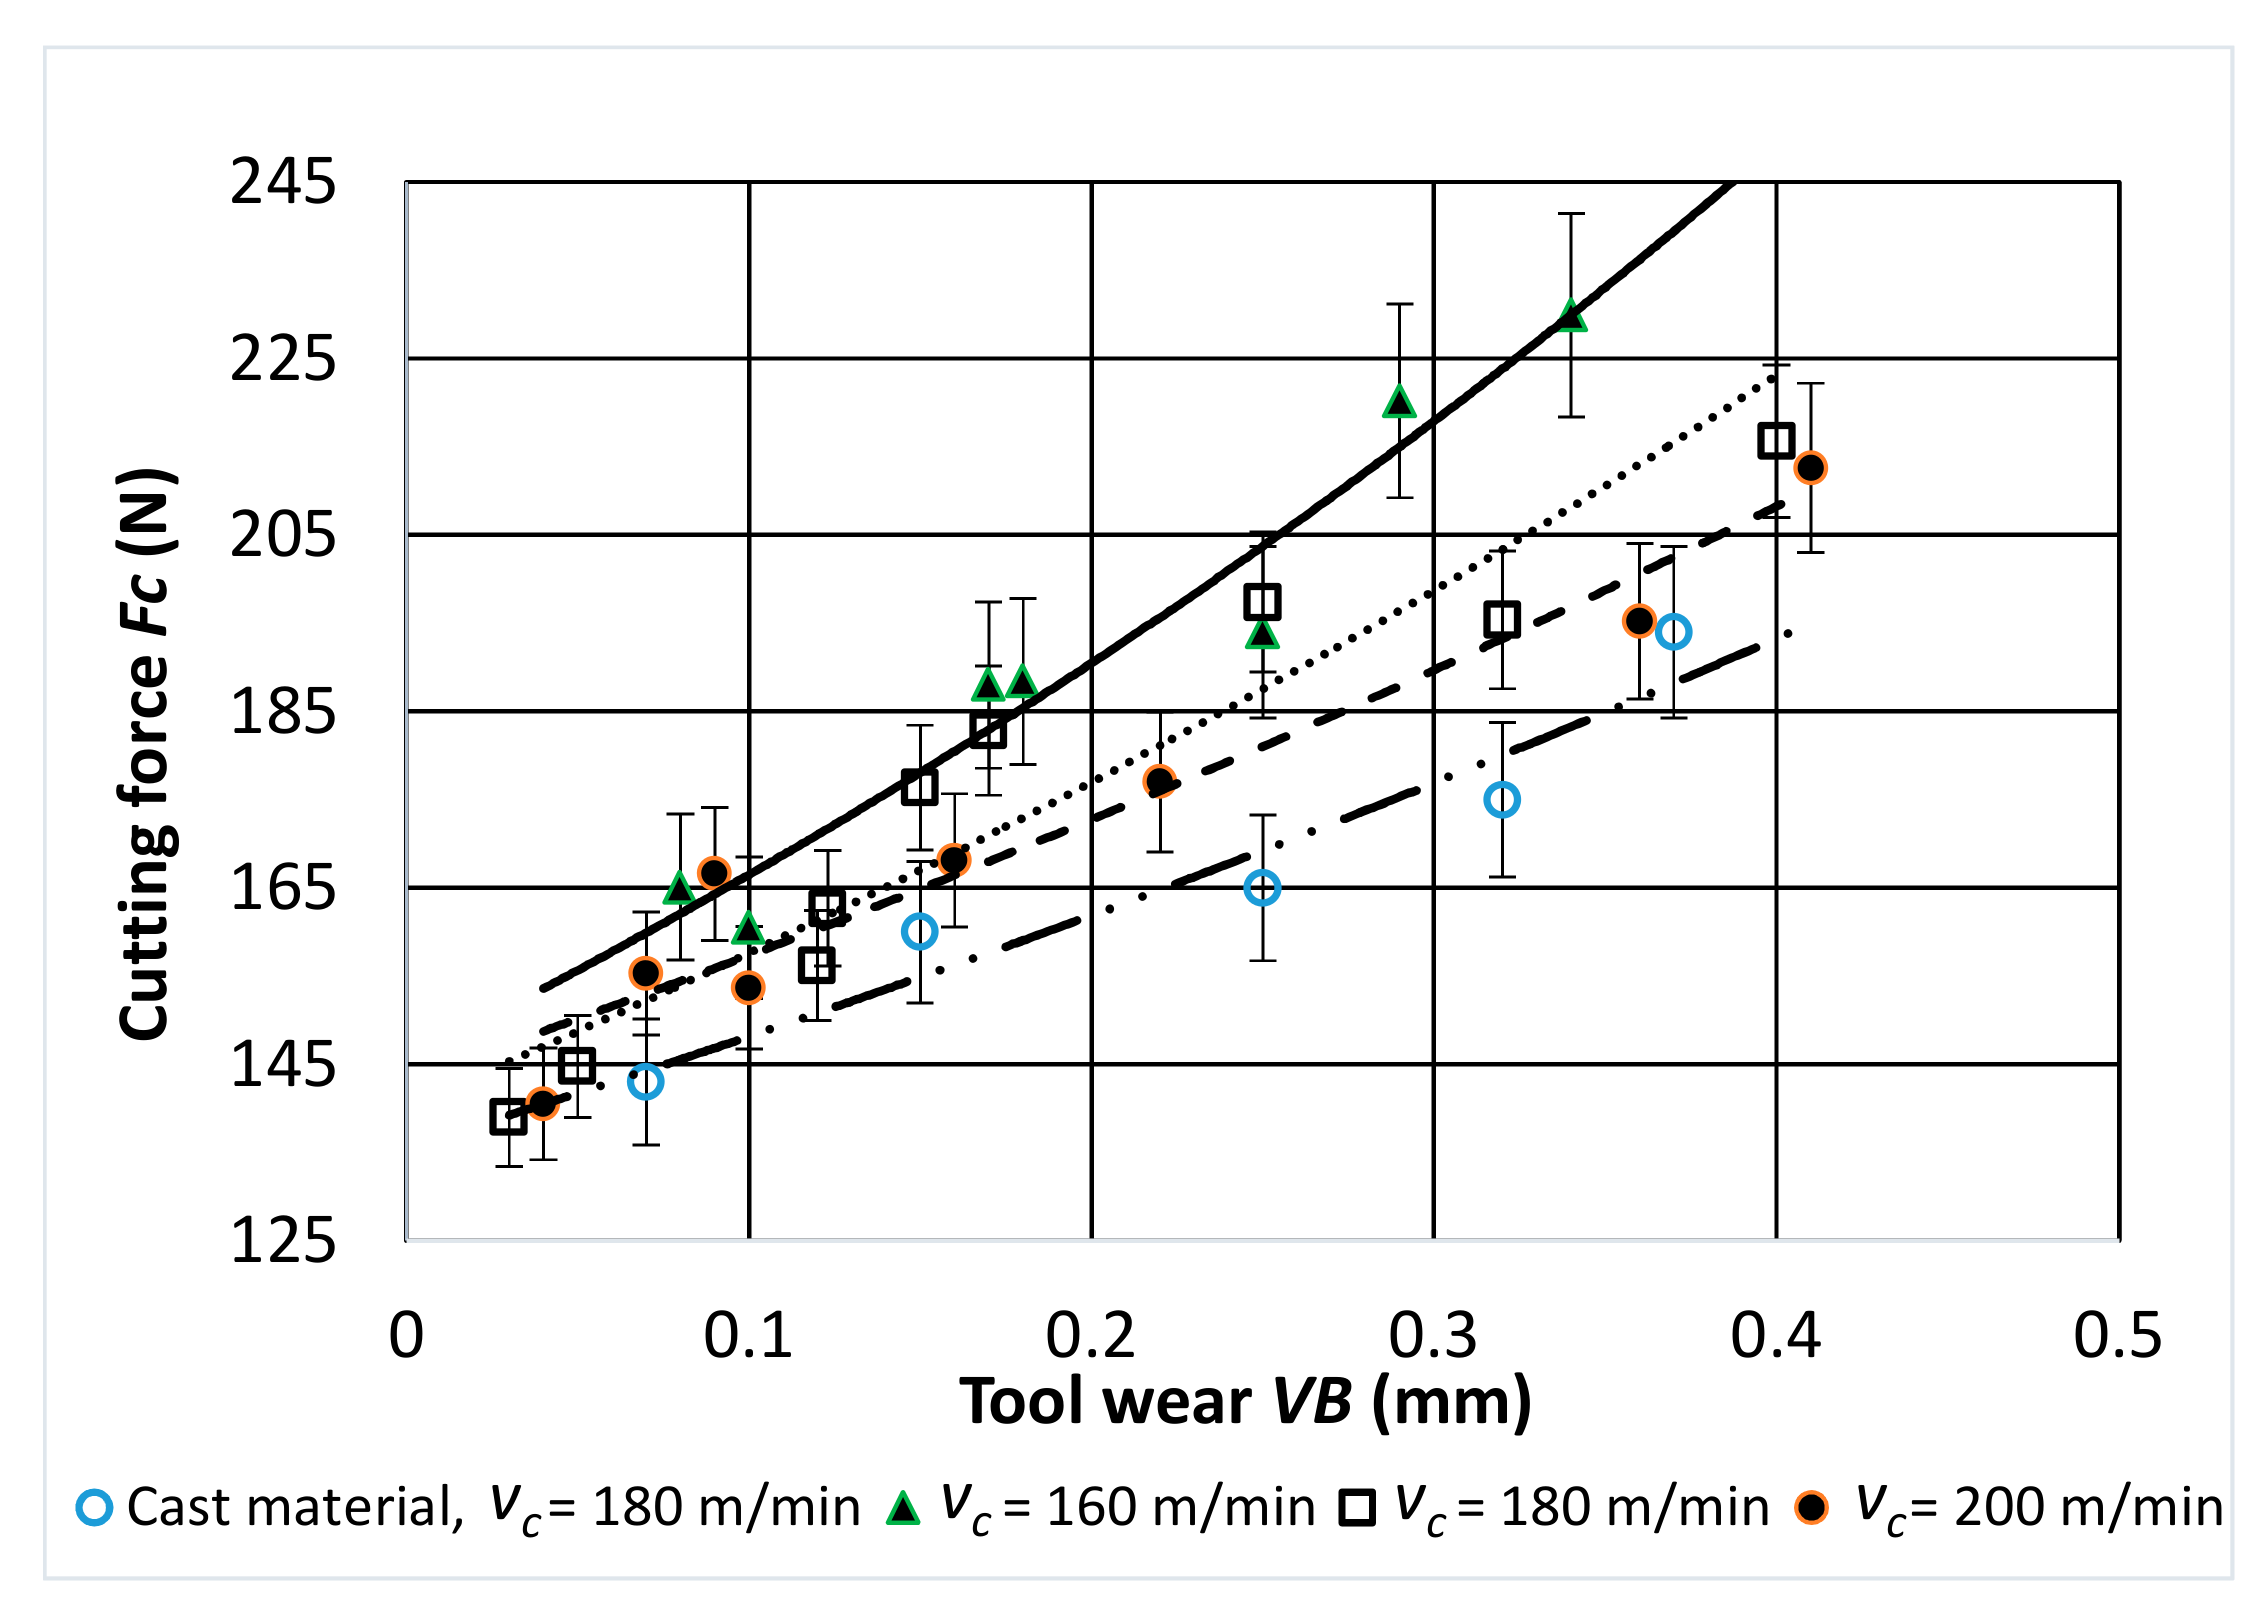
The tool wear when machining the cast nickel-cobalt alloy was significantly higher and the tool life was shorter. Moreover, the specific cutting force values were on average lower by 1000 N/mm2 than the values for turning a sintered nickel-cobalt alloy.
-
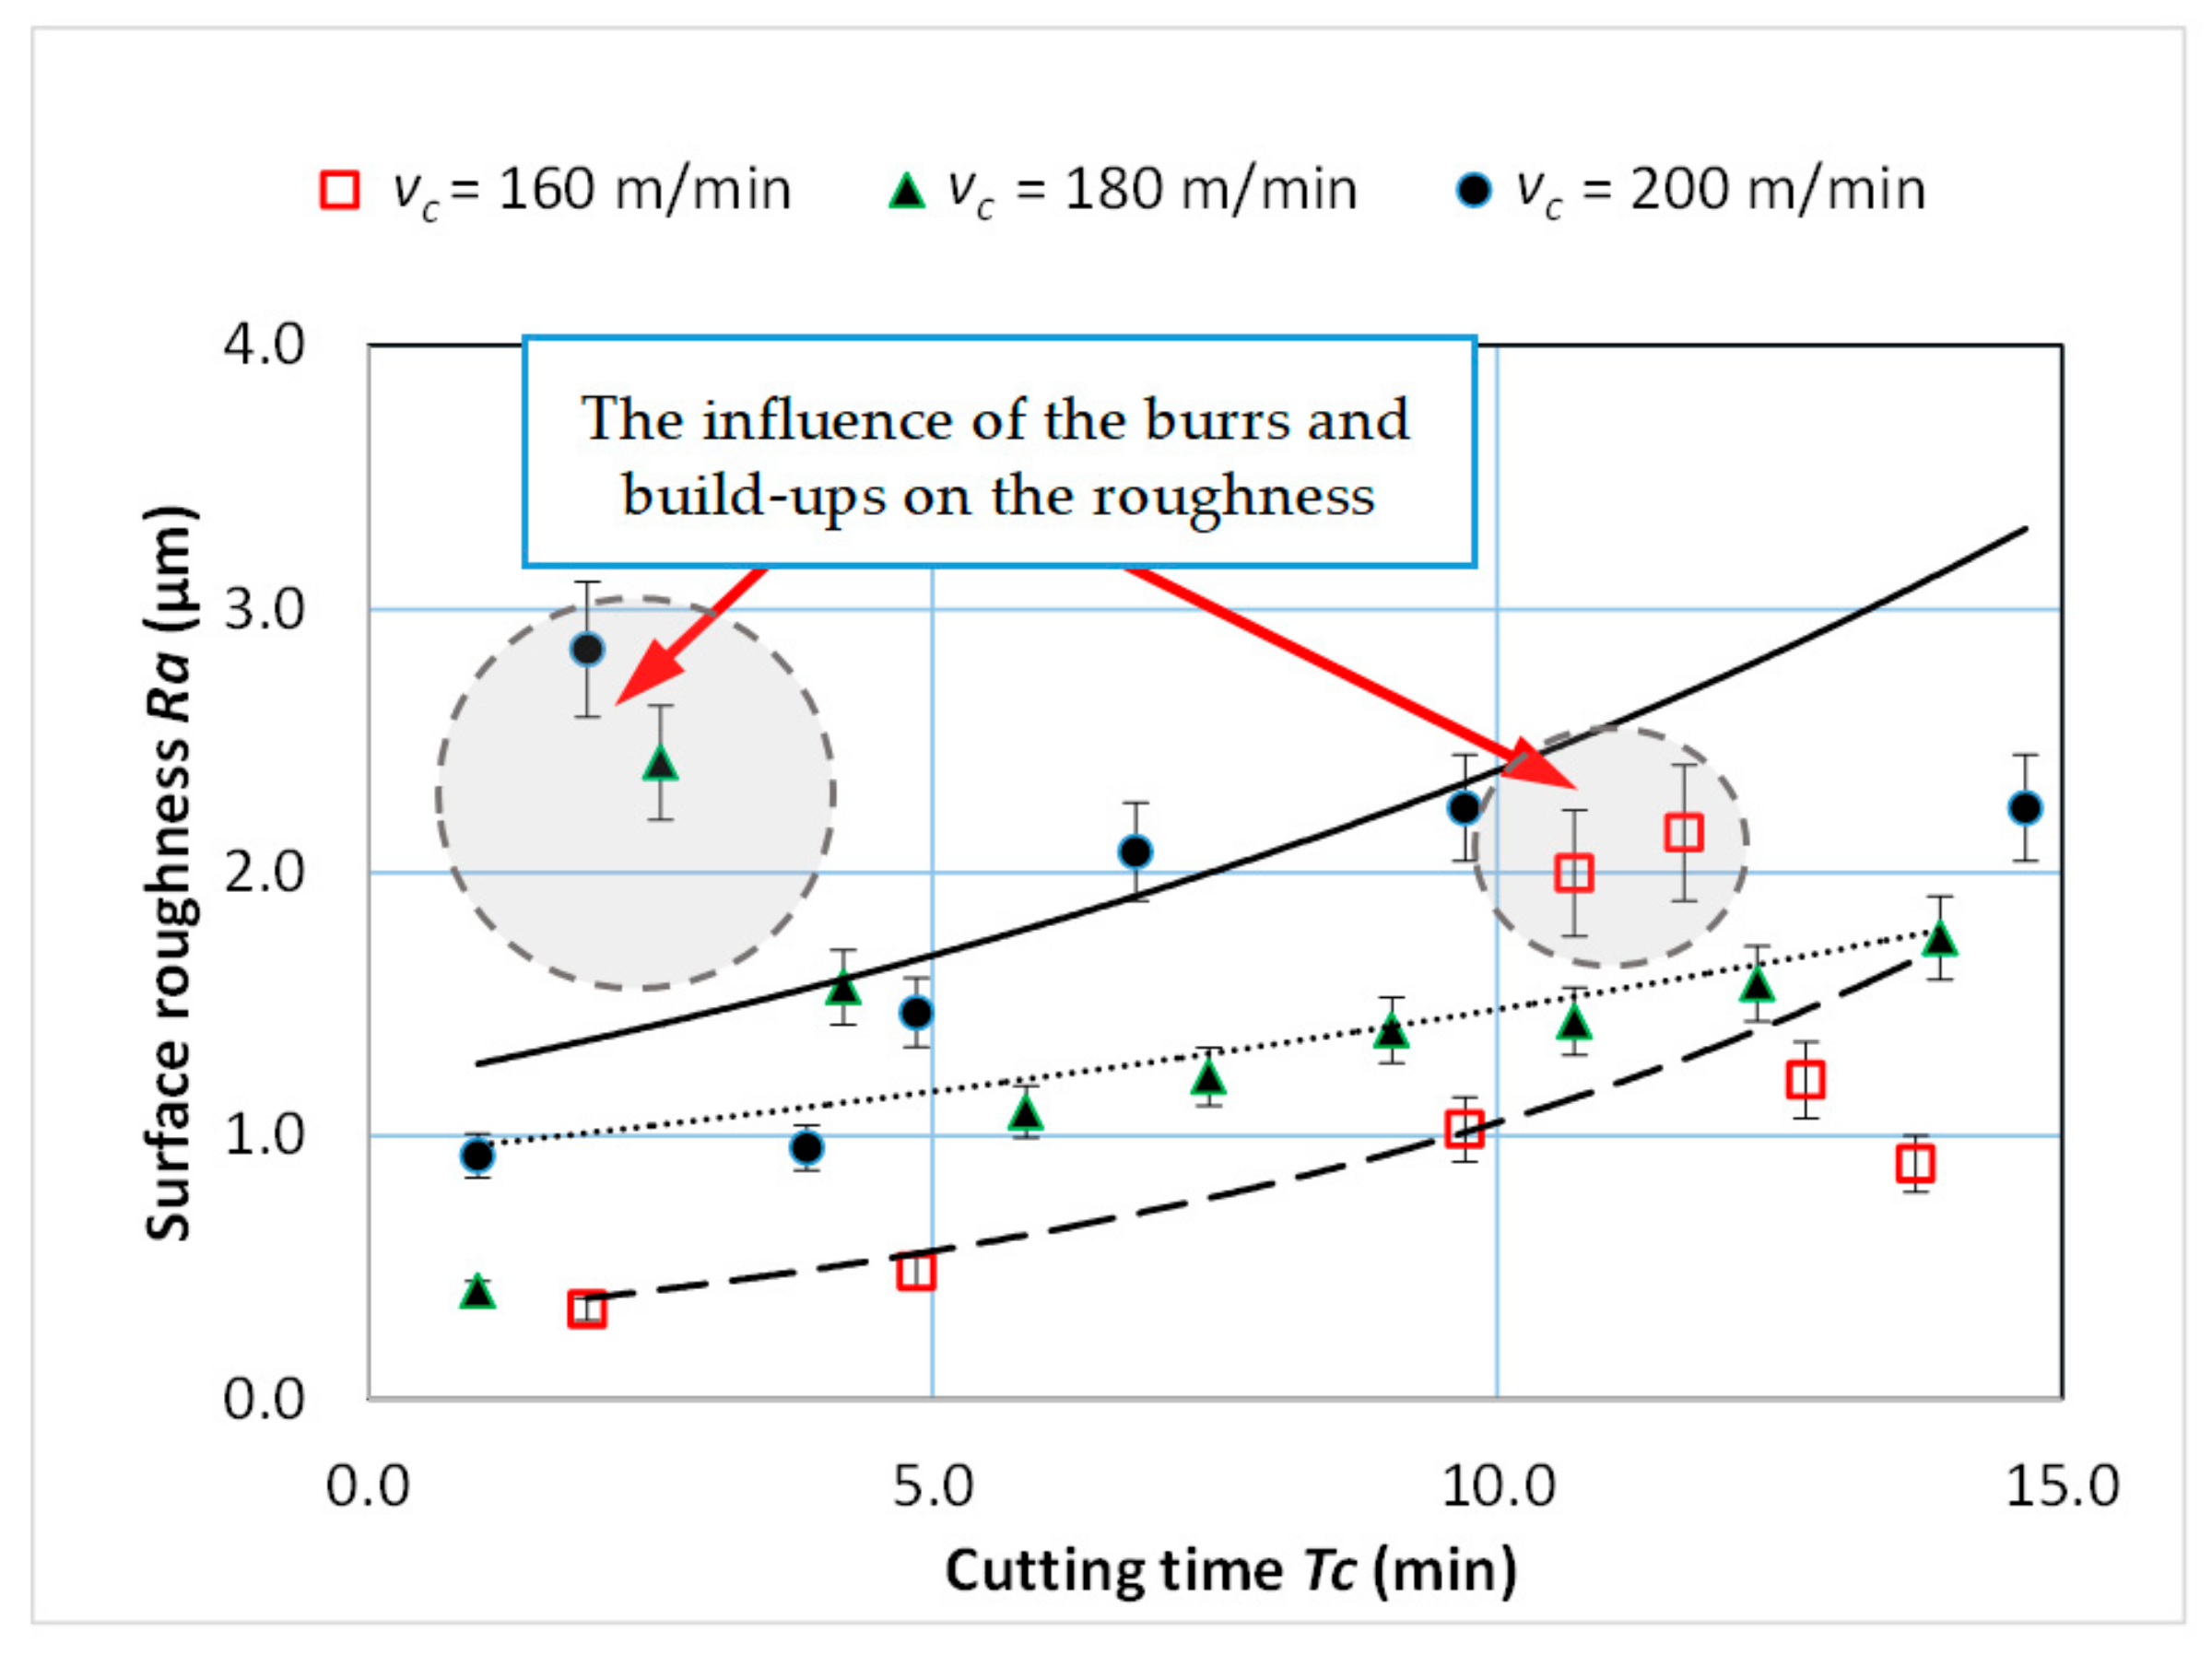
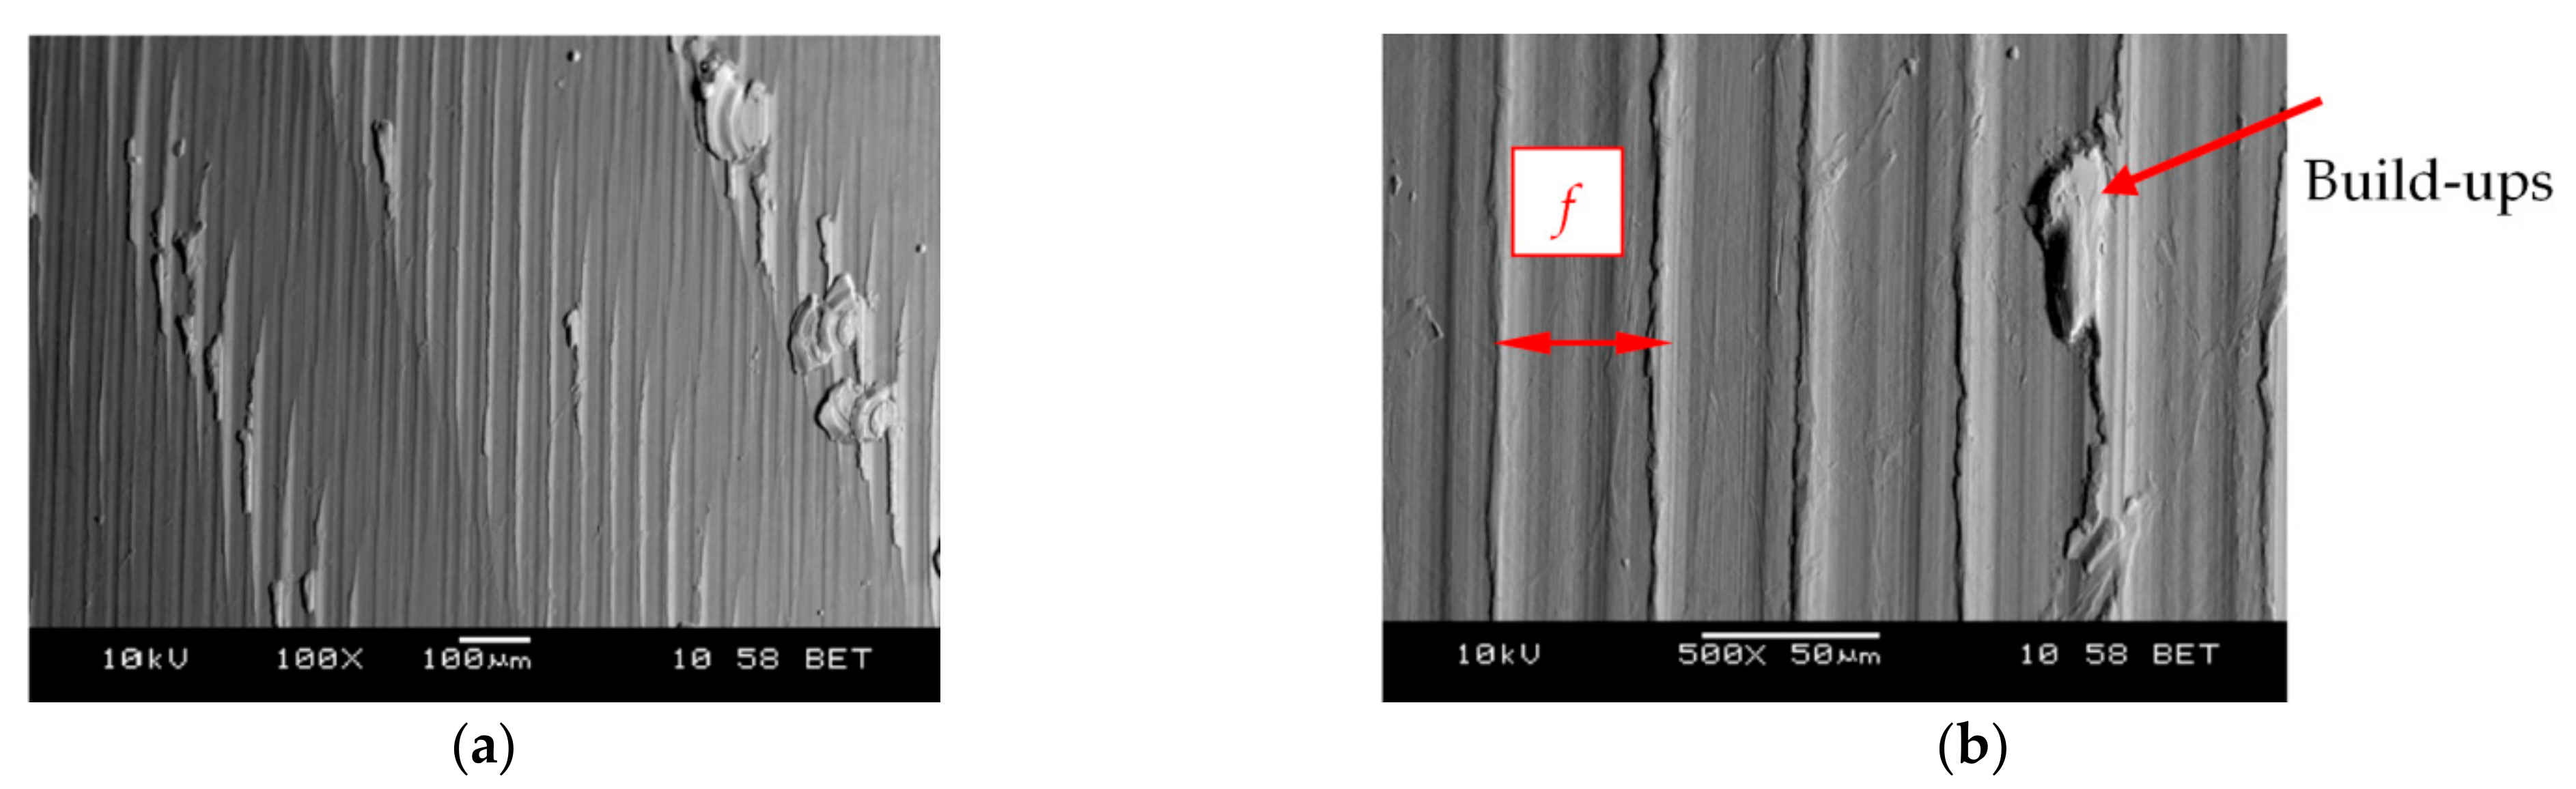
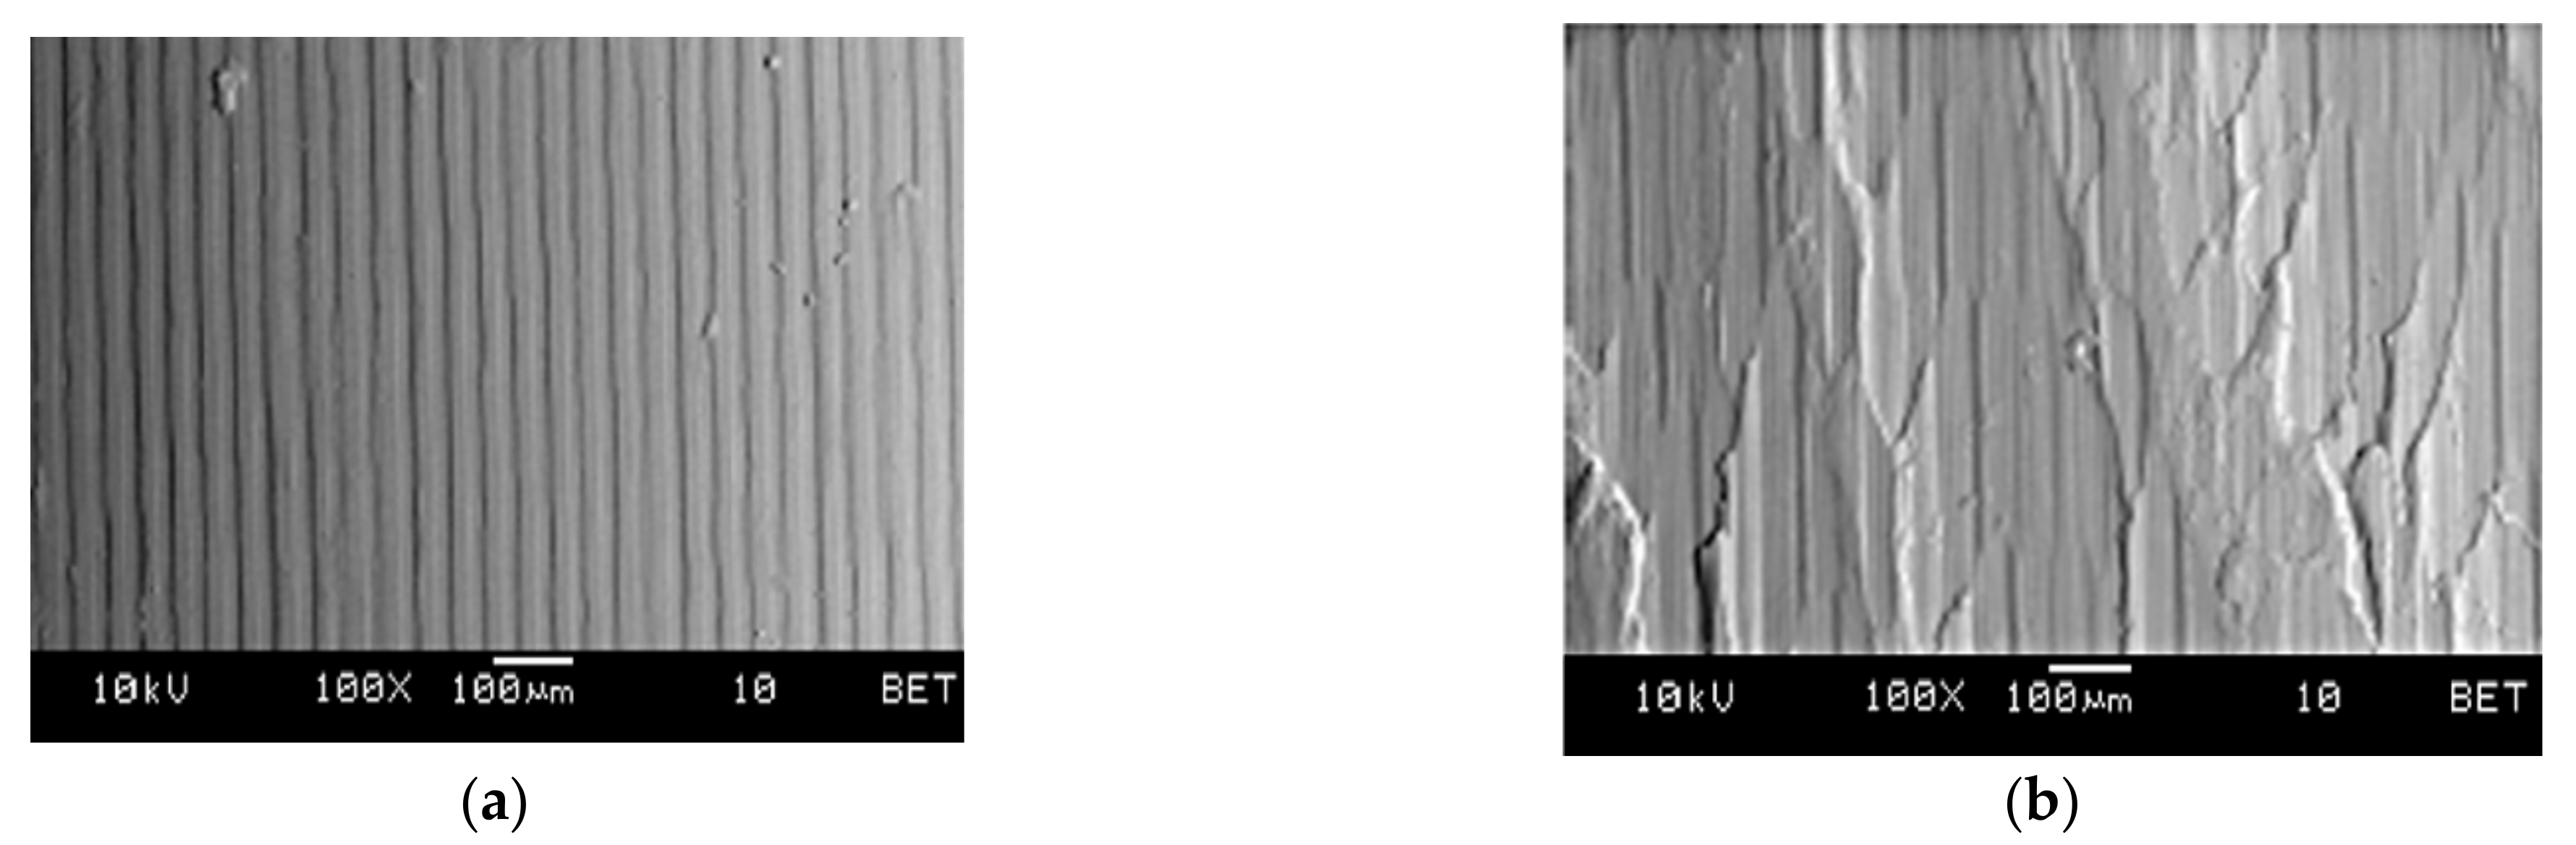
The microscopic analyses of the machined surface showed visible deformations, deposits, and burrs that could significantly affect the parameter values describing the surface roughness (such as Ra). The deterioration in the quality of the surface finish resulted from the significant tool wear. The analysis of the results showed that the surface parameter Ra was higher at the beginning of the tool work, and it increased significantly for the tool wear VB > 0.3 mm.
-
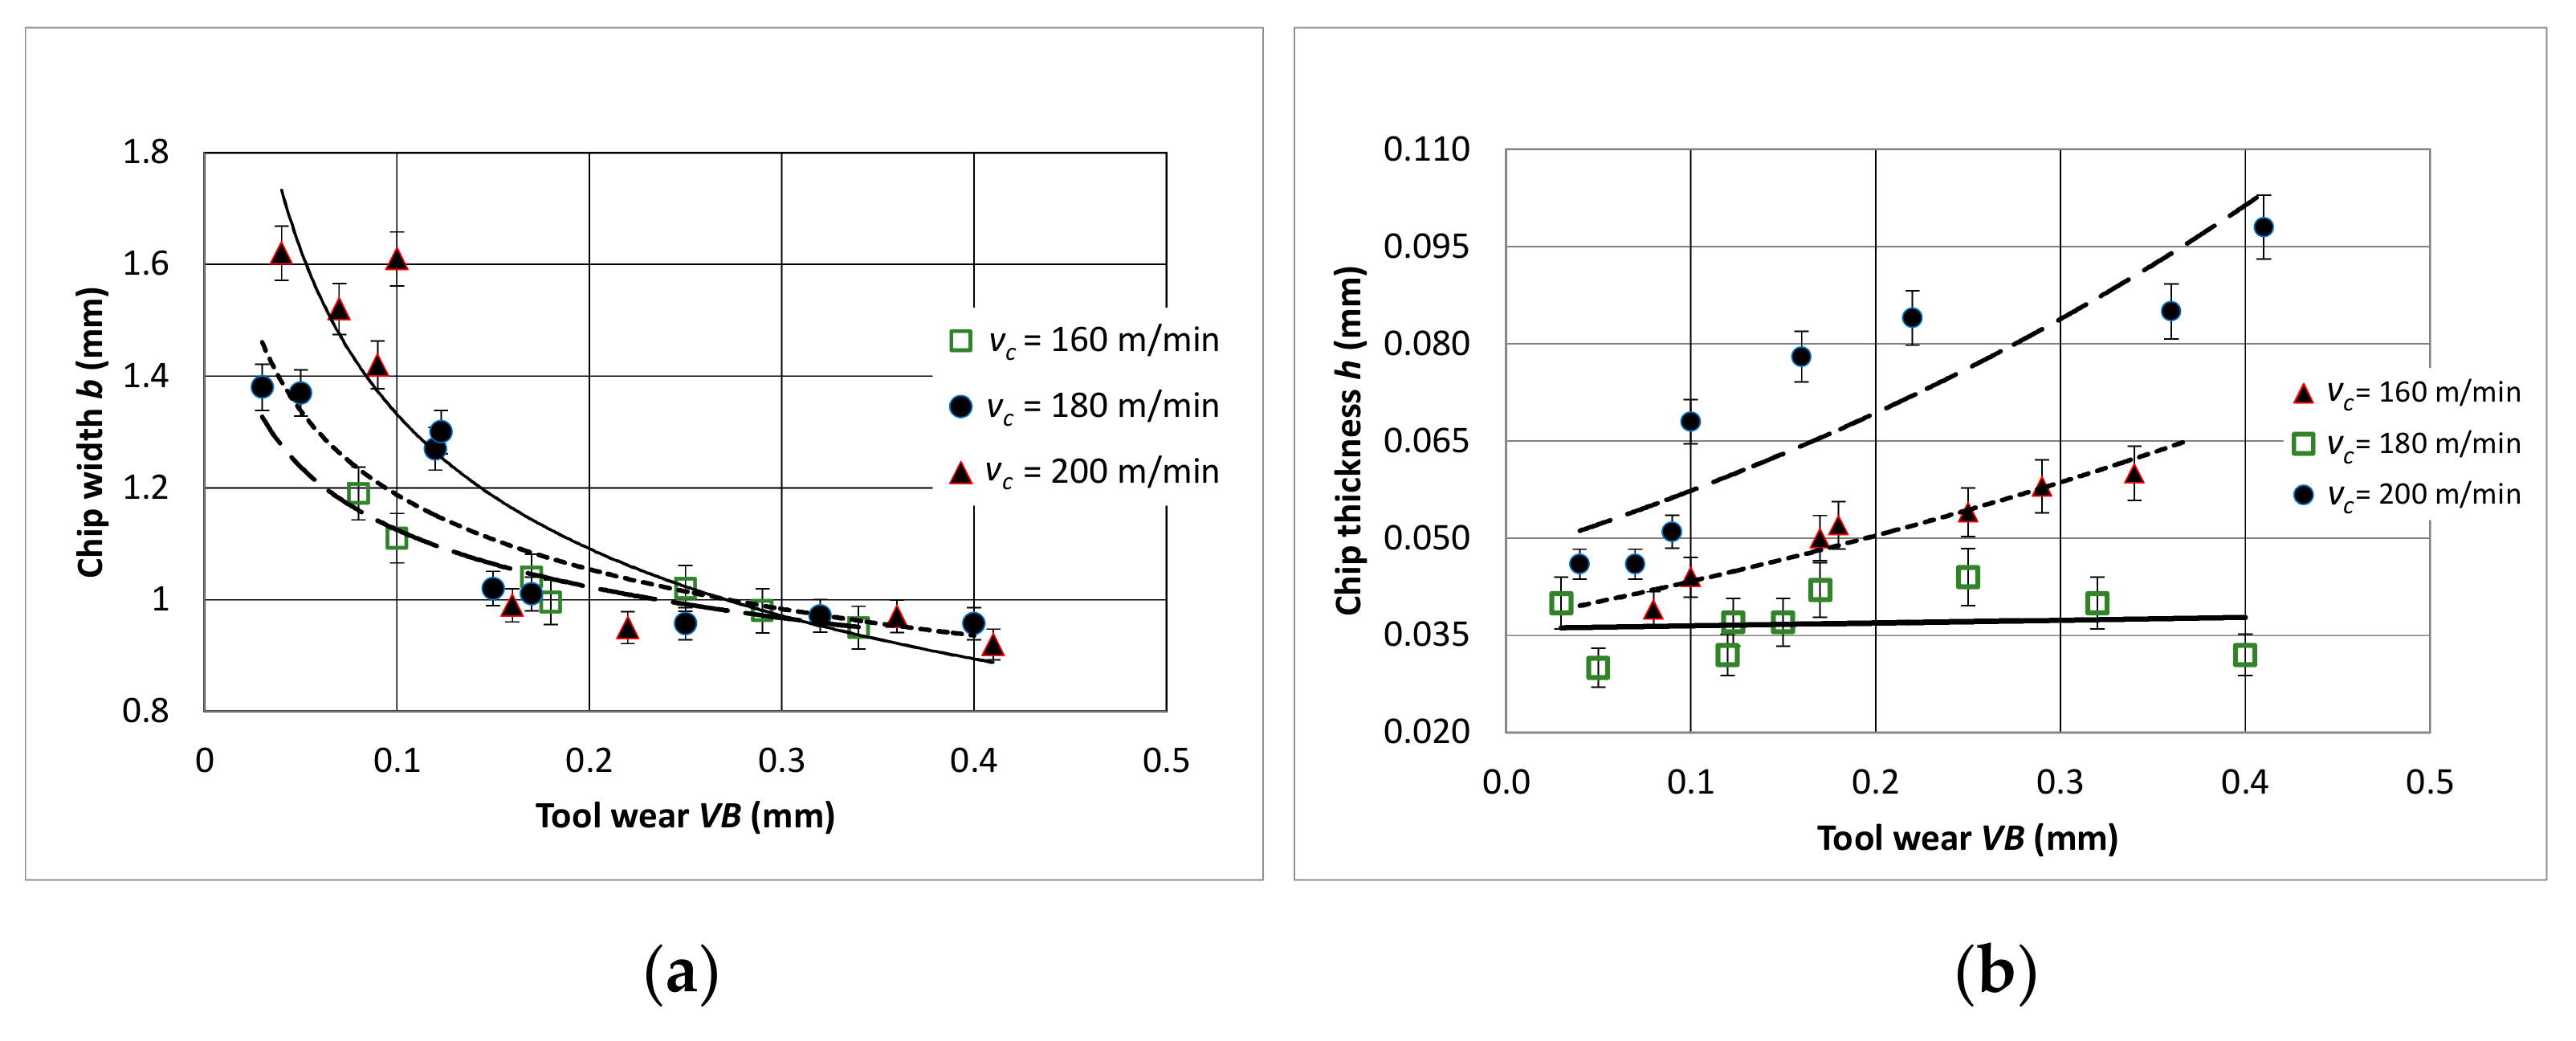
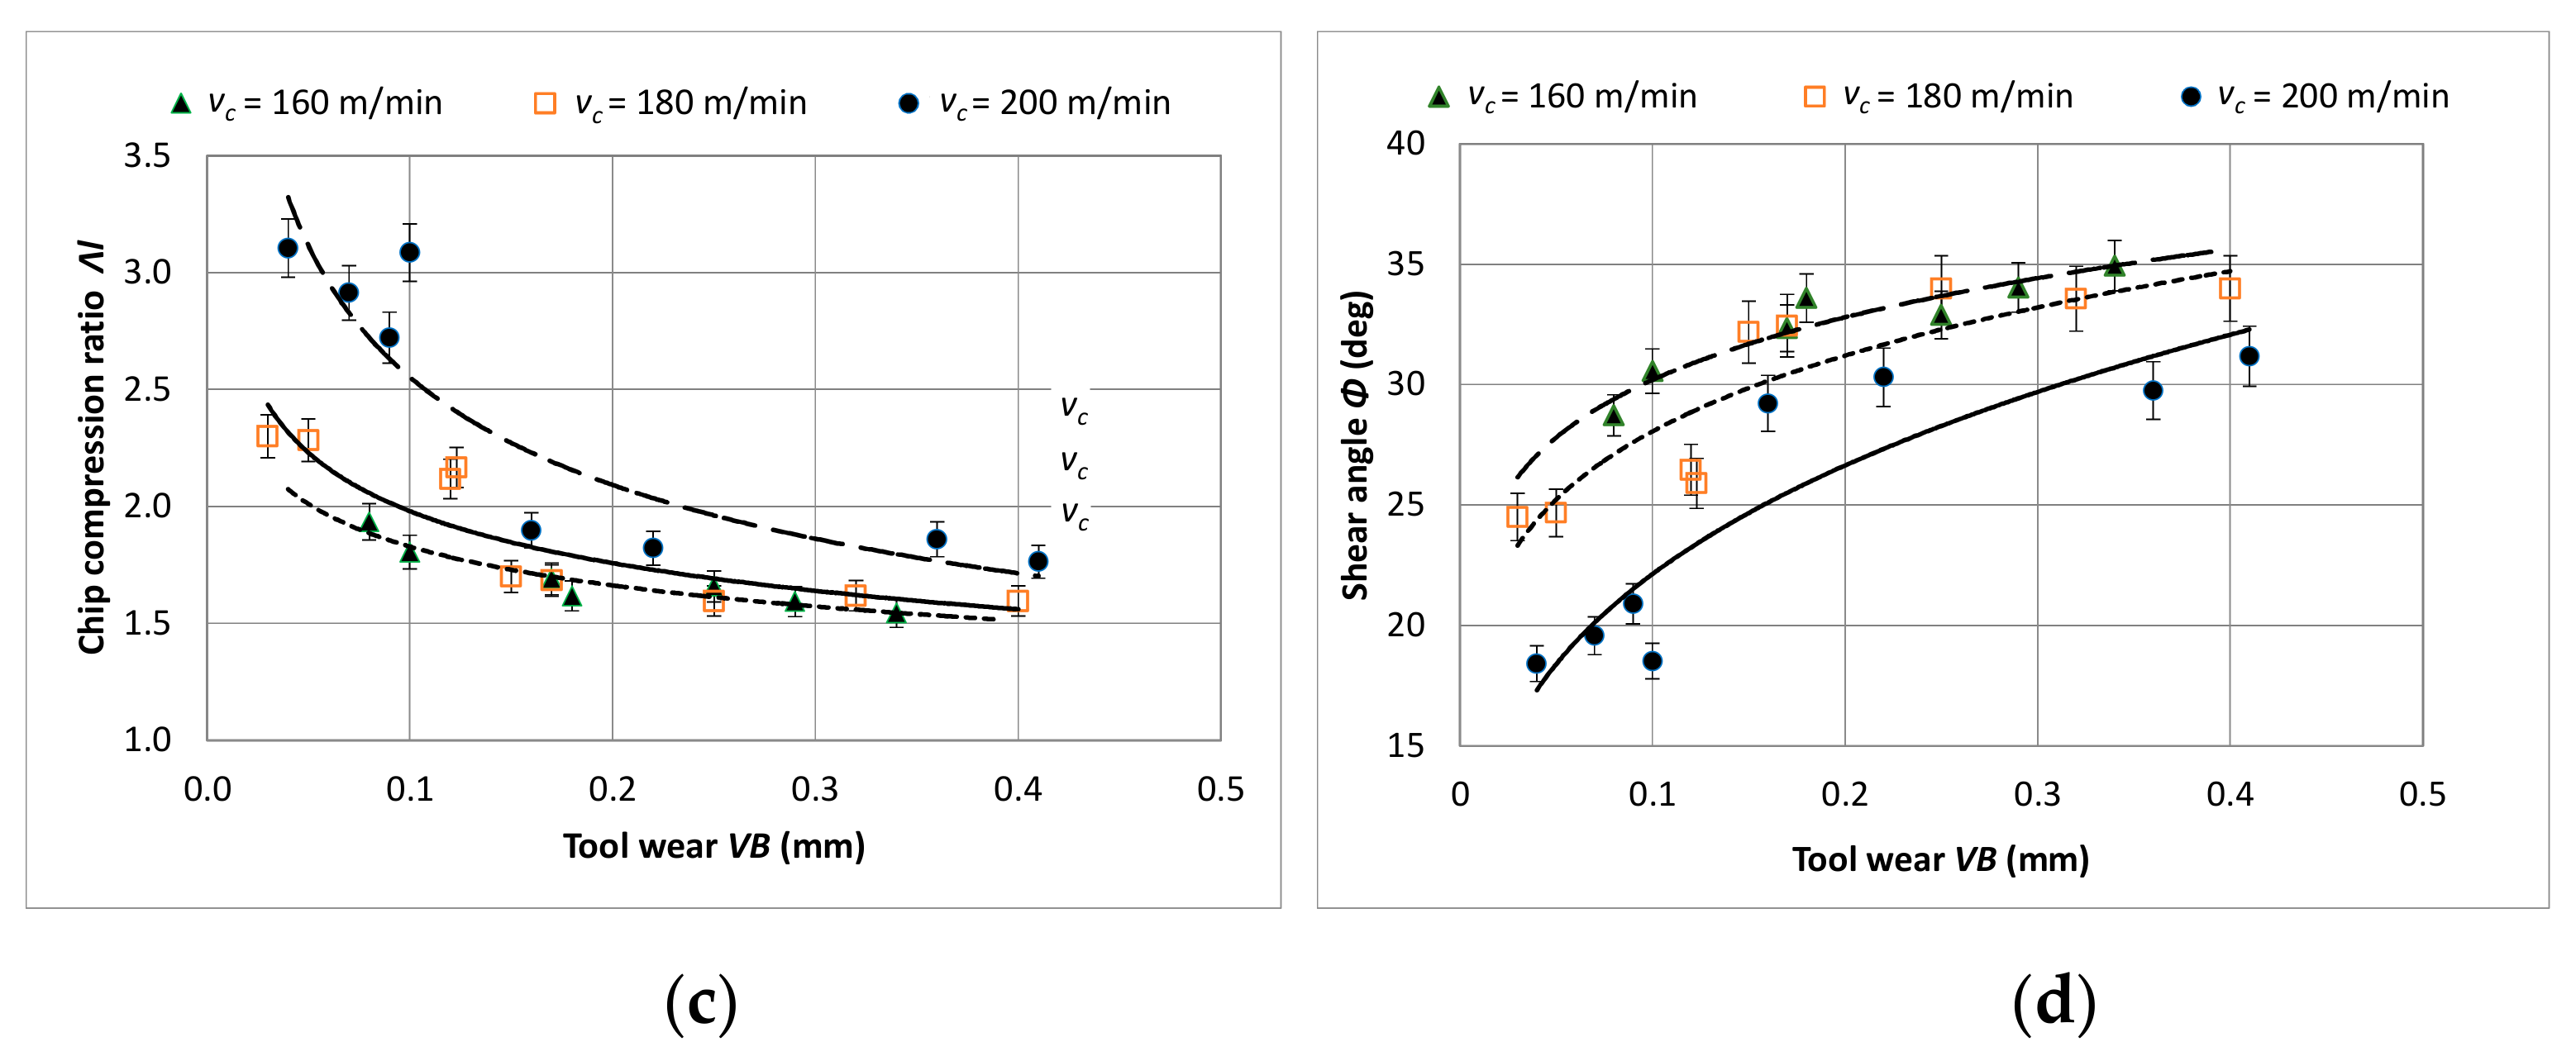
The research showed the influence of the tool wear on the geometrical dimensions of the chips, and the relationships characterizing the process, e.g., the shear angle and the chip compression ratio. A change of the chip form as a function of the cutting edge wear was indicated.
The following general recommendation for the machining of sintered nickel-cobalt alloy is presented: in order to reduce the cutting forces, as well as the surface roughness parameter Ra, the machining should be carried out with a tool with wear not greater than VB = 0.2 mm.

Author Contributions

Conceptualization, K.R. and G.S.; methodology, W.Z. and K.R.; software, G.S.; validation, G.S. and K.R.; formal analysis, G.S. and K.R.; investigation, W.Z. and G.S.; writing—original draft preparation, G.S.; writing—review and editing, W.Z. and G.S.; visualization, G.S.; supervision, W.Z.; project administration, W.Z. All authors have read and agreed to the published version of the manuscript.

Funding

This research received no external funding.

Institutional Review Board Statement

Not applicable.

Informed Consent Statement

Not applicable.

Data Availability Statement

The data presented in this study are available on request from the corresponding author. The data are not publicly available due to privacy.

Conflicts of Interest

The authors declare no conflict of interest.

Abbreviations

ΚrMain cutting edge angle (°)
αRake angle (°)
λCutting edge inclination angle (°)
RaArithmetic mean value of surface roughness (µm)
FcCutting force (N)
FpThrust force (N)
FfFeed force (N)
vcCutting speed (m/min)
kcSpecific cutting force (N/mm2)

References

  1. Thellaputtaa, G.R.; Bose, P.S.C.; Rao, C.S.P. Machinability of nickel based superalloys: A review. Mater. Today Proc. 2017, 4, 3712–3721. [Google Scholar] [CrossRef]
  2. Deng, D.; Peng, R.L.; Brodin, H.; Moverare, J. Microstructure and mechanical properties of Inconel 718 produced by selective laser melting: Sample orientation dependence and effects of post heat treatments. Mater. Sci. Eng. A 2018, 713, 294–306. [Google Scholar] [CrossRef]
  3. Thakur, D.G.; Ramamoorthy, B.; Vijayaraghavan, L. Study on the machinability characteristics of superalloy Inconel 718 during high speed turning. Mater. Des. 2009, 30, 1718–1725. [Google Scholar] [CrossRef]
  4. Hosseini, E.; Popovich, V. A review of mechanical properties of additively manufactured Inconel 718. Addit. Manuf. 2019, 30, 100877. [Google Scholar] [CrossRef]
  5. Ezugwu, E.O.; Wang, Z.M.; Machado, A.R. The machinability of nickel based alloys: A review. J. Mater. Process. Technol. 1999, 86, 1–6. [Google Scholar] [CrossRef]
  6. Anbarasan, N.; Gupta, B.K.; Prakash, S.; Muthukumar, P.; Oyyaravelu, R.; John Felix Kumar, R.; Jerome, S. Effect of heat treatment on the microstructure and mechanical properties of Inconel 718. Mater. Today Proc. 2018, 5, 7716–7724. [Google Scholar] [CrossRef]
  7. Thomas, A.; El-Wahabi, M.; Cabrera, J.M.; Prado, J.M. High temperature deformation of Inconel 718. J. Mater. Process. Technol. 2006, 177, 469–472. [Google Scholar] [CrossRef]
  8. Babu, V.S.; Pavlovic, A.S.; Seehra, M.S. Oxidation Characteristics and Thermal Expansion of Inconel Alloy 718 from 300 K to 1273 K; The Minerals, Metals & Materials Society: Warrendale, PA, USA, 1997; pp. 689–693. [Google Scholar]
  9. Yoo, J.T.; Yoon, J.H.; Lee, H.S.; Youn, S.K. Material characterization of Inconel 718 from free bulging test at high temperature. J. Mech. Sci. Technol. 2012, 26, 2101–2105. [Google Scholar] [CrossRef]
  10. Arunachalam, R.M.; Mannan, M.A.; Spowage, A.C. Residual stress and surface roughness when facing age hardened Inconel 718 with CBN and ceramic cutting tools. Int. J. Mach. Tools Manuf. 2004, 44, 879–887. [Google Scholar] [CrossRef]
  11. Wrigth, P.K.; Chow, J.G. Deformation characteristic of nickel alloys during machining. J. Eng. Mater. Technol. 1982, 104, 85–93. [Google Scholar]
  12. Pawade, R.S.; Joshi, S. Mechanism of chip formation in high-speed turning of Inconel 718. Mach. Sci. Technol. 2011, 15, 132–152. [Google Scholar] [CrossRef]
  13. Peng, H.; Dong, P.; Cheng, X.; Zhang, C.; Tang, W.; Xing, Y.; Zhou, X. Semi-Empirical Prediction of Residual Stress Distributions Introduced by Turning Inconel 718 Alloy Based on Lorentz Function. Materials 2020, 13, 4341. [Google Scholar] [CrossRef]
  14. Struzikiewicz, G.; Zębala, W.; Słodki, B. Cutting parameters selection for sintered alloy AlSi10Mg longitudinal turning. Measurement 2019, 138, 39–53. [Google Scholar] [CrossRef]
  15. Fayed, E.M.; Shahriari, D.; Saadati, M.; Brailovski, V.; Jahazi, M.; Medraj, M. Influence of Homogenization and Solution Treatments Time on the Microstructure and Hardness of Inconel 718 Fabricated by Laser Powder Bed Fusion Process. Materials 2020, 13, 2574. [Google Scholar] [CrossRef] [PubMed]
  16. Krawczyk, M.; Królikowski, M.; Grochała, D.; Powałka, B.; Figiel, P.; Wojciechowski, S. Evaluation of Surface Topography after Face Turning od CoCR Alloys Fabricated by Casting and Selective Laser Melting. Materials 2020, 13, 2448. [Google Scholar] [CrossRef] [PubMed]
  17. Araujo, L.S.; Santos, D.S.D.; Godet, S.; Dille, J.; Pinto, A.L.; de Almeida, L.H. Analysis of Grain Boundary Character in a Fine-Grained Nickel-Based Superalloy 718. J. Mater. Eng. Perform. 2014, 23, 4130–4141. [Google Scholar]
  18. Nayan, N.; Gurao, N.P.; Murty, S.V.S.N.; Jha, A.K.; Pant, B.; George, K.M. Microstructure and micro-texture evolution during large strain deformation of Inconel alloy IN718. Mater. Charact. 2015, 110, 236–241. [Google Scholar] [CrossRef]
  19. Wang, J.; Liu, D.; Ding, X.; Wang, H.; Wang, H.; Chen, J.; Yang, Y. Microstructure Heredity of Inconel 718 Nickel-Based Superalloy during Preheating and Following Deformation. Crystals 2020, 10, 303. [Google Scholar] [CrossRef] [Green Version]
  20. DebRoy, T.; Wei, H.L.; Zuback, J.S.; Mukherjee, T.; Elmer, J.W.; Milewski, J.O.; Beese, A.M.; Wilson-Heid, A.; De, A.; Zhang, W. Additive manufacturing of metallic components—Process, structure and properties. Prog. Mater. Sci. 2018, 92, 112–224. [Google Scholar] [CrossRef]
  21. Tucho, W.M.; Cuvillier, P.; Sjolyst-Kverneland, A.; Hansen, V. Microstructure and hardness studies of Inconel 718 manufactured by selective laser melting before and after solution heat treatment. Mater. Sci. Eng. A 2017, 689, 220–232. [Google Scholar] [CrossRef]
  22. Niaki, M.K.; Torabi, S.A.; Nonino, F. Why manufacturers adopt additive manufacturing technologies: The role of sustainability. J. Clean. Prod. 2019, 222, 381–392. [Google Scholar] [CrossRef]
  23. Thakur, A.; Gangopadhyay, S. State-of-the-art in surface integrity in machining of nickel-based superalloys. Int. J. Mach. Tools Manuf. 2016, 100, 25–54. [Google Scholar] [CrossRef]
  24. Jawahir, I.S.; Brinksmeier, E.; M’Saoubi, R.; Aspinwall, D.K.; Outeiro, J.C.; Meyer, D.; Umbrello, D.; Jayal, A.D. Surface integrity in material removal processes: Recent advances. CIRP Ann. Manuf. Technol. 2011, 60, 603–626. [Google Scholar] [CrossRef]
  25. Chen, Z.; Lin Peng, R.; Moverare, J.; Avdovic, P.; Zhou, J.M.; Johansson, S. Surface Integrity and Structural Stability of Broached, Inconel 718 at High Temperatures. Metall. Mater. Trans. A 2016, 47, 3664–3676. [Google Scholar] [CrossRef] [Green Version]
  26. Ezugwu, E.O.; Tang, S.H. Surface abuse when machining cast iron (G-17) and nickel base superalloy (Inconel 718) with ceramic tools. J. Mater. Process. Technol. 1995, 55, 63–69. [Google Scholar] [CrossRef]
  27. Devillez, A.; Le, G.; Dominiak, S.; Dudzinski, D. Dry machining of Inconel 718, workpiece surface integrity. J. Mater. Process. Technol. 2011, 211, 1590–1598. [Google Scholar] [CrossRef]
  28. Pawade, R.S.; Suhas, S.; Joshi, S.; Brahmankar, P.K.; Rahman, M. An investigation of cutting forces and surface damage in high-speed turning of Inconel 718. J. Mater. Process. Technol. 2007, 192–193, 139–146. [Google Scholar] [CrossRef]
  29. Sadat, A.B. Surface characteristics of machined Inconel-718 nickel-base superalloy using natural and controlled contact length tools. Int. J. Mach. Tool Manuf. 1987, 27, 333–342. [Google Scholar] [CrossRef]
  30. Sharman, A.R.C.; Hughes, J.I. Workpiece surface integrity and tool life issues when turning Inconel 718™ nickel based superalloy. J. Mach. Sci. Technol. 2004, 200, 424–432. [Google Scholar] [CrossRef]
  31. Zhou, J.Z.; Bushlya, V.; Stahl, J.E. An investigation of surface damage in the high speed turning of Inconel 718 with use of whisker reinforced ceramic tools. J. Mater. Process. Technol. 2012, 212, 372–384. [Google Scholar] [CrossRef]
  32. Zhou, J.; Chen, Z.; Persson, H.; Peng, R.L.; M’Saoubi, R.; Gustasson, D. Comparative Assessment of the Surface Integrity of AD730® and IN718 Superalloys in High-Speed Turning with a CBN Tool. J. Manuf. Mater. Process. 2019, 3, 73. [Google Scholar] [CrossRef] [Green Version]
  33. Gupta, M.K.; Mozammel, M.; Pruncu, C.I.; Kapłonek, W.; Nadolny, K.; Patra, K.; Mikolajczyk, T.; Pimenov, D.Y.; Sarikaya, M.; Sharma, V.S. Parametric optimization and process capability analysis for machining of nickel-based superalloy. Int. J. Adv. Manuf. Technol. 2019, 102, 3995–4009. [Google Scholar] [CrossRef] [Green Version]
  34. Hua, Y.; Liu, Z. Experimental Investigation of Principal Residual Stress and Fatigue Performance for Turned Nickel-Based Superalloy Inconel 718. Materials 2018, 11, 879. [Google Scholar] [CrossRef] [Green Version]
  35. Pawade, R.S.; Joshi, S.S.; Brahmankar, P.K. Effect of machining parameters and cutting edge geometry on surface integrity of high-speed turned Inconel 718. Int. J. Mach. Tools Manuf. 2008, 48, 15–28. [Google Scholar] [CrossRef]
  36. Arrazola, P.J.; Kortabarria, A.; Madariaga, A.; Esnaola, J.A.; Fernandez, E.; Cappellini, C.; Ulutan, D.; Özel, T. On the machining induced residual stresses in IN718 nickel-based alloy: Experiments and predictions with finite element simulation. Simul. Model. Pract. Theory 2014, 41, 87–103. [Google Scholar] [CrossRef]
  37. Hua, Y.; Liu, Z. Effects of cutting parameters and tool nose radius on surface roughness and work hardening during dry turning Inconel 718. Int. J. Adv. Manuf. Technol. 2018, 96, 2421–2430. [Google Scholar] [CrossRef]
  38. D’Addona, D.M.; Raykar, S.J.; Narke, M.M. High Speed Machining of Inconel 718: Tool Wear and Surface Roughness Analysis. Proc. CIRP 2017, 62, 269–274. [Google Scholar] [CrossRef]
  39. Krolczyk, G.; Legutko, S.; Nieslony, P.; Gajek, M. Study of the surface integrity microhardness of austenitic stainless steel after turning. Tehn. Vjesnik Tech. Gazette 2014, 21, 1307–1311. [Google Scholar]
  40. Čep, R.; Janásek, A.; Petrů, J.; Sadílek, M.; Mohyla, P.; Valíček, J.; Harničarová, M.; Czán, A. Surface roughness after machining and influence of feed rate on process. Prec. Mach. 2014, 7, 341–347. [Google Scholar] [CrossRef]
  41. Velchev, S.; Kolev, I.; Ivanov, K. Empirical mathematical models of the dependence of the specific cutting force on thickness of cut in turning. Ann. Faculty Eng. Hunedoara-Int. J. Eng. 2001, 3, 303–312. [Google Scholar]
Figure 1. Microstructure of the workpiece material used in the current study before machining (sintered material) at magnification 1000× (a) and 3000× (b).
Materials 14 01623 g001
Figure 2. Microstructure of cast alloy at magnification 100× (a) and 200× (b).
Materials 14 01623 g002
Figure 3. Test bench (a), fastening of the workpiece (b), and cutting tool with cubic boron nitride (CBN) insert (c).
Materials 14 01623 g003
Figure 4. SEM micrograph of the CBN tool: (a) magnification 2000×, (b) magnification 5000×.
Materials 14 01623 g004
Figure 5. Sample photos of cutting edge wear on the cutting insert flank for (a) vc = 160 m/min; f = 0.048 mm/rev; ap = 0.5 mm, (b) vc = 200 m/min; f = 0.048 mm/rev; ap = 0.5 mm.
Materials 14 01623 g005
Figure 6. Sample photos of the cutting edge wear on the rake surface of the cutting insert (a) vc = 160 m/min; f = 0.048 mm/rev; ap = 0.5 mm, (b) vc = 200 m/min; f = 0.048 mm/rev; ap = 0.5 mm.
Materials 14 01623 g006
Figure 7. Sample photos of the cutting edge wear in the side (a), top (b) and front (c) view of the cutting insert for vc = 180 m/min (cast material).
Materials 14 01623 g007
Figure 8. Tool wear characteristic as a function of the turning path L for the turning of sintered nickel-cobalt alloy with parameters: f = 0.048 mm/rev; ap = 0.5 mm.
Materials 14 01623 g008
Figure 9. Characteristic of the Fc component of the total cutting force as a function of cutting edge wear VB for: f = 0.048 mm/rev; ap = 0.5 mm.
Materials 14 01623 g009
Figure 10. Characteristic of the Ff component of the total cutting force as a function of cutting edge wear VB for: f = 0.048 mm/rev; ap = 0.5 mm.
Materials 14 01623 g010
Figure 11. Characteristic of the Fp component of the total cutting force as a function of cutting edge wear VB for: f = 0.048 mm/rev; ap = 0.5 mm.
Materials 14 01623 g011
Figure 12. Graphic presentation of the influence of individual variables on the mean value of the VB parameter, main effect plot (a), surface plot (b).
Materials 14 01623 g012
Figure 13. Graphic presentation of the influence of individual variables on the mean value of the total cutting force Fc, main effect plot (a), surface plot (b).
Materials 14 01623 g013
Figure 14. Relationship between the specific cutting force kc as a function of wear of the cutting tool VB.
Materials 14 01623 g014
Figure 15. Diagram of the change of cross-section area of the cutting layer resulting from the wear of the cutting tool.
Materials 14 01623 g015
Figure 16. Characteristic of surface roughness Ra as a function of turning time for f = 0.048 mm/rev; ap = 0.5 mm.
Materials 14 01623 g016
Figure 17. Graphic representation of the influence of particular variables on the mean value of the Ra parameter, main effect plot (a), surface plot (b).
Materials 14 01623 g017
Figure 18. Microscopic image and topography of the machined surface with the Ra characteristic (sintered nickel-cobalt alloy, VB < 0.2 mm, vc = 160 m/min, ap = 0.5 mm).
Materials 14 01623 g018
Figure 19. Microscopic image of the machined surface with visible deformations (build-ups); (sintered nickel-cobalt alloy, VB = 0.35 mm): (a) magnification 100×, (b) magnification 500×; f—feed.
Materials 14 01623 g019
Figure 20. Microscopic image of the machined surface (cast alloy) (a) machining with a new tool, (b) machining with a worn tool VB = 0.3 mm; vc = 160 m/min, ap = 0.5 mm.
Materials 14 01623 g020
Figure 21. Photographs of chips for vc = 160 m/min (change of chip form), “-” = unacceptable chips with a length of more than 150 mm; “0” = acceptable chips with a length of 20–150 mm, and favorable chips “+” = with a length of up to 20 mm.
Materials 14 01623 g021
Figure 22. Microscopic images of the surface inside (a) and outside (b) of the chips; vc = 160 m/min, ap = 0.5 mm, b—chip width.
Materials 14 01623 g022
Figure 23. Geometric dimensions of the chips in relation to the wear of the cutting edge (a) chip width, (b) chip thickness, (c) chip compression ratio, (d) shear angle; ap = 0.5 mm.
Materials 14 01623 g023aMaterials 14 01623 g023b
Table 1. Average grain size of the materials calculated based on the secant method.
Nickel-Cobalt AlloyAverage Grain Size
(µm)
At the Edge of the SampleIn the Middle of the Sample
Sintered3.38 ± 0.23.22 ± 0.1
Cast34.8 ± 1.9
Table 2. Chemical composition of tested alloy (%).
NiCoCrMoTiSiAl
57.420.613.52.62.70.92.3
Table 3. Tool geometry.
Main Cutting Edge Angle
Κr
Cutting Edge Inclination Angle
λ
Rake Angle
α
95°−5°
Table 4. Research plan based on the Taguchi method.
NumberABL
(mm)
vc
(m/min)
11118160
21218180
31318200
42136160
52236180
62336200
73154160
83254180
93354200
104172160
114272180
124372200
135190160
145290180
155390200
1661108160
1762108180
1863108200
Table 5. Summary of the results of the measurements of the cutting edge wear, the values of the total cutting force components, and Ra arithmetic mean value of surface roughness for the case of turning with a speed vc = 160 m/min.
Test NumberLvcapfFp_avgFf_avgFc_avgRa_avgVBmax
(mm)(m/min)(mm)(mm/rev)(N)(N)(N)(µm)(mm)
1181600.50.048300.5119.9140.00.340.035
2451600.50.048238.2148.9160.50.480.10
3901600.50.048389.9165.0185.01.020.16
4991600.50.048379.6149.8188.42.000.18
51081600.50.048387.4160.6195.02.150.23
61181600.50.048499.1233.6220.21.210.29
71271600.50.048468.6261.4229.90.890.34
Table 6. Summary of the results of measurements of the cutting edge wear, the values of the components of the total cutting force, and the Ra arithmetic mean value of surface roughness for the case of turning with a speed vc = 180 m/min.
Test NumberLvcapfFp_avgFf_avgFc_avgRa_avgVBmax
(mm)(m/min)(mm)(mm/rev)(N)(N)(N)(µm)(mm)
191800.50.048218.6101.9139.00.410.03
2181800.50.048261.5111.9155.01.500.06
3271800.50.048281.6120.2151.32.060.11
4361800.50.048295.1122.1156.21.560.12
5451800.50.048301.6128.7162.71.090.123
6541800.50.048333.7149.6176.41.220.125
7631800.50.048222.6180.9182.81.400.13
8721800.50.048340.7172.9197.41.430.14
9811800.50.048370.0156.0195.41.580.32
10901800.50.048380.4178.5215.61.750.21
Table 7. Summary of the results of measurements of the cutting edge wear, the values of the components of the total cutting force, and the Ra arithmetic mean value of surface roughness for the case of turning with a speed vc = 200 m/min.
Test NumberLvcapfFpFfFcRa_avgVBmax
mmm/minmmmm/revNNNµmmm
192000.50.048246.8111.3140.50.920.04
2182000.50.048283.1121.9155.32.850.07
3362000.50.048329.9134.0166.62.050.09
4452000.50.048336.7138.4173.71.470.10
5632000.50.048331.0139.4186.12.080.16
6902000.50.048467.0140.0213.22.240.22
71172000.50.048449.0160.9195.24.960.36
81352000.50.048570.0211.0212.62.240.41
Table 8. The layout of the research plan with the mean values of the analyzed variables.
ABL
(mm)
vc
(m/min)
VB_avg
(mm)
Ra_avg
(µm)
Fc_avg
(N)
11181600.0350.34140
12181800.0621.50155
13182000.0762.75165
21361600.0900.42151
22361800.1000.95162
23362000.1102.06178
31541600.1100.54165
32541800.1201.25162
33542000.1251.81183
41721600.1150.75172
42721800.1401.25178
43722000.1602.10196
51901600.1601.02185
52901800.2101.40187
53902000.2232.22208
611081600.2302.15195
621081800.3101.58198
631082000.3234.24215
Table 9. ANOVA statistical analysis for VB (mm).
SourceDFSeq SSAdj SSAdj MSFP
L (mm)50.1001660.1001660.02003375.730.0
vc (m/min)20.0068420.0068420.00342112.930.002
Residual Error100.0026450.0026450.000265--
Total170.109653----
R-Sq = 98.3%------
Table 10. ANOVA statistical analysis for Fc (mm).
SourceDFSeq SSAdj SSAdj MSFP
L (mm)55207.85207.81041.57789.530.0
vc (m/min)21696.31696.3848.1772.910.0
Residual Error10116.3116.311.63--
Total177020.5----
R-Sq = 98.3%------
Table 11. ANOVA statistical analysis for Ra (µm).
SourceDFSeq SSAdj SSAdj MSFP
L (mm)54.6304.6300.92593.910.016
vc (m/min)28.8398.8394.419723.460.0
Residual Error101.8841.8840.1884--
Total1715.353----
R-Sq = 87.7%------
Publisher’s Note: MDPI stays neutral with regard to jurisdictional claims in published maps and institutional affiliations.

