
A Strategy for Dimensionality Reduction and Data Analysis Applied to Microstructure–Property Relationships of Nanoporous Metals


Abstract
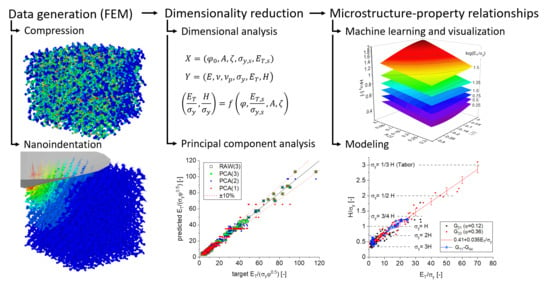
:
1. Introduction
2. FE-Model and Data Generation
2.1. Macroscopic Compression
2.2. Nanoindentation
3. Macroscopic Compression
3.1. Dimensional Analysis
3.2. Principal Component Analysis
3.3. Macroscopic Elastic Properties
3.4. Macroscopic Plastic Properties
4. Nanoindentation
4.1. Dimensional Analysis
4.2. Principal Component Analysis
4.3. Hardness
5. Summary and Conclusions
Funding
Institutional Review Board Statement
Informed Consent Statement
Data Availability Statement
Acknowledgments
Conflicts of Interest
References
- Lilleodden, E.T.; Voorhees, P.W. On the topological, morphological, and microstructural characterization of nanoporous metals. MRS Bull. 2018, 43, 20–26. [Google Scholar] [CrossRef]
- Weissmüller, J.; Sieradzki, K. Dealloyed nanoporous materials with interface-controlled behavior. MRS Bull. 2018, 43, 14–19. [Google Scholar] [CrossRef] [Green Version]
- Jin, H.-J.; Weissmüller, J.; Farkas, D. Mechanical response of nanoporous metals: A story of size, surface stress, and severed struts. MRS Bull. 2018, 43, 35–42. [Google Scholar] [CrossRef]
- Biener, J.; Hodge, A.M.; Hayes, J.R.; Volkert, C.A.; Zepeda-Ruiz, L.A.; Hamza, A.V.; Abraham, F.F. Size effects on the mechanical behavior of nanoporous Au. Nano Lett. 2006, 6, 2379–2382. [Google Scholar] [CrossRef] [PubMed]
- Mameka, N.; Wang, K.; Markmann, J.; Lilleodden, E.T.; Weissmüller, J. Nanoporous Gold—Testing Macro-scale Samples to Probe Small-scale Mechanical Behavior. Mater. Res. Lett. 2016, 4, 27–36. [Google Scholar] [CrossRef]
- Shi, S.; Li, Y.; Ngo-Dinh, B.-N.; Markmann, J.; Weissmüller, J. Scaling behavior of stiffness and strength of hierarchical network nanomaterials. Science 2021, 371, 1026–1033. [Google Scholar] [CrossRef]
- Li, Y.; Dinh Ngô, B.-N.; Markmann, J.; Weissmüller, J. Topology evolution during coarsening of nanoscale metal network structures. Phys. Rev. Mater. 2019, 3. [Google Scholar] [CrossRef] [Green Version]
- Ngô, B.-N.D.; Roschning, B.; Albe, K.; Weissmüller, J.; Markmann, J. On the origin of the anomalous compliance of dealloying-derived nanoporous gold. Scr. Mater. 2017, 130, 74–77. [Google Scholar] [CrossRef] [Green Version]
- Richert, C.; Huber, N. A Review of Experimentally Informed Micromechanical Modeling of Nanoporous Metals: From Structural Descriptors to Predictive Structure-Property Relationships. Materials 2020, 13, 3307. [Google Scholar] [CrossRef]
- Richert, C.; Huber, N. Skeletonization, Geometrical Analysis, and Finite Element Modeling of Nanoporous Gold Based on 3D Tomography Data. Metals 2018, 8, 282. [Google Scholar] [CrossRef] [Green Version]
- Richert, C.; Odermatt, A.; Huber, N. Computation of Thickness and Mechanical Properties of Interconnected Structures: Accuracy, Deviations, and Approaches for Correction. Front. Mater. 2019, 6, 352. [Google Scholar] [CrossRef] [Green Version]
- Farkas, D.; Caro, A.; Bringa, E.; Crowson, D. Mechanical response of nanoporous gold. Acta Mater. 2013, 61, 3249–3256. [Google Scholar] [CrossRef]
- Ngô, B.-N.D.; Stukowski, A.; Mameka, N.; Markmann, J.; Albe, K.; Weissmüller, J. Anomalous compliance and early yielding of nanoporous gold. Acta Mater. 2015, 93, 144–155. [Google Scholar] [CrossRef] [Green Version]
- Farkas, D.; Stuckner, J.; Umbel, R.; Kuhr, B.; Demkowicz, M.J. Indentation response of nanoporous gold from atomistic simulations. J. Mater. Res. 2018, 33, 1382–1390. [Google Scholar] [CrossRef]
- Saane, S.S.R.; Mangipudi, K.R.; Loos, K.U.; de Hosson, J.T.M.; Onck, P.R. Multiscale modeling of charge-induced deformation of nanoporous gold structures. J. Mech. Phys. Solids 2014, 66, 1–15. [Google Scholar] [CrossRef]
- Soyarslan, C.; Bargmann, S.; Pradas, M.; Weissmüller, J. 3D stochastic bicontinuous microstructures: Generation, topology and elasticity. Acta Materialia 2018, 149, 326–340. [Google Scholar] [CrossRef]
- Roberts, A.P.; Garboczi, E.J. Elastic properties of model random three-dimensional open-cell solids. J. Mech. Phys. Solids 2002, 50, 33–55. [Google Scholar] [CrossRef]
- Gong, L.; Kyriakides, S.; Jang, W.-Y. Compressive response of open-cell foams. Part I: Morphology and elastic properties. Int. J. Solids Struct. 2005, 42, 1355–1379. [Google Scholar] [CrossRef]
- Kanaun, S.; Tkachenko, O. Representative volume element and effective elastic properties of open cell foam materials with random microstructures. JOMMS 2007, 2, 1607–1628. [Google Scholar] [CrossRef] [Green Version]
- Jang, W.-Y.; Kraynik, A.M.; Kyriakides, S. On the microstructure of open-cell foams and its effect on elastic properties. Int. J. Solids Struct. 2008, 45, 1845–1875. [Google Scholar] [CrossRef] [Green Version]
- Luxner, M.H.; Stampfl, J.; Pettermann, H.E. Finite element modeling concepts and linear analyses of 3D regular open cell structures. J. Mater. Sci. 2005, 40, 5859–5866. [Google Scholar] [CrossRef]
- Luxner, M.H.; Stampfl, J.; Pettermann, H.E. Numerical simulations of 3D open cell structures—influence of structural irregularities on elasto-plasticity and deformation localization. Int. J. Solids Struct. 2007, 44, 2990–3003. [Google Scholar] [CrossRef] [Green Version]
- Huber, N.; Viswanath, R.N.; Mameka, N.; Markmann, J.; Weißmüller, J. Scaling laws of nanoporous metals under uniaxial compression. Acta Mater. 2014, 67, 252–265. [Google Scholar] [CrossRef] [Green Version]
- Roschning, B.; Huber, N. Scaling laws of nanoporous gold under uniaxial compression: Effects of structural disorder on the solid fraction, elastic Poisson’s ratio, Young’s modulus and yield strength. J. Mech. Phys. Solids 2016, 92, 55–71. [Google Scholar] [CrossRef] [Green Version]
- Jiao, J.; Huber, N. Deformation mechanisms in nanoporous metals: Effect of ligament shape and disorder. Comput. Mater. Sci. 2017, 127, 194–203. [Google Scholar] [CrossRef] [Green Version]
- Jiao, J.; Huber, N. Effect of nodal mass on macroscopic mechanical properties of nanoporous metals. Int. J. Mech. Sci. 2017, 134, 234–243. [Google Scholar] [CrossRef]
- Odermatt, A.; Richert, C.; Huber, N.; Odermatt, A.; Richert, C.; Huber, N. Prediction of elastic-plastic deformation of nanoporous metals by FEM beam modeling: A bottom-up approach from ligaments to real microstructures. Mater. Sci. Eng. A 2020, 791, 139700. [Google Scholar] [CrossRef]
- Huber, N. Connections Between Topology and Macroscopic Mechanical Properties of Three-Dimensional Open-Pore Materials. Front. Mater. 2018, 5, 5801. [Google Scholar] [CrossRef]
- Dassault Systemes. Abaqus 3DEXPERIENCE; Dassault Systemes SIMULIA Corp.: Johnston, RI, USA, 2020. [Google Scholar]
- Mangipudi, K.R.; Epler, E.; Volkert, C.A. Topology-dependent scaling laws for the stiffness and strength of nanoporous gold. Acta Materialia 2016, 119, 115–122. [Google Scholar] [CrossRef]
- Hu, K.; Ziehmer, M.; Wang, K.; Lilleodden, E.T. Nanoporous gold: 3D structural analyses of representative volumes and their implications on scaling relations of mechanical behaviour. Philos. Mag. 2016, 96, 3322–3335. [Google Scholar] [CrossRef]
- Lührs, L.; Zandersons, B.; Huber, N.; Weissmüller, J. Plastic Poisson’s Ratio of Nanoporous Metals: A Macroscopic Signature of Tension-Compression Asymmetry at the Nanoscale. Nano Lett. 2017, 17, 6258–6266. [Google Scholar] [CrossRef] [Green Version]
- Liu, L.-Z.; Jin, H.-J. Scaling equation for the elastic modulus of nanoporous gold with “fixed” network connectivity. Appl. Phys. Lett. 2017, 110, 211902. [Google Scholar] [CrossRef]
- Huber, N.; Nix, W.D.; Gao, H. Identification of elastic-plastic material parameters from pyramidal indentation of thin films. Proc. R. Soc. Lond. A 2002, 458, 1593–1620. [Google Scholar] [CrossRef]
- Gibson, L.J.; Ashby, M.F. Cellular Solids: Structure & Properties, 1st ed.; Pergamon Press: Oxford, UK, 1988; ISBN 0-08-036607-4. [Google Scholar]
- Fischer-Cripps, A.C. Nanoindentation, 2nd ed.; Springer: New York, NY, USA, 2004; ISBN 978-1-4757-5943-3. [Google Scholar]
- Biener, J.; Hodge, A.M.; Hamza, A.V.; Hsiung, L.M.; Satcher, J.H. Nanoporous Au: A high yield strength material. J. Appl. Phys. 2005, 97, 24301. [Google Scholar] [CrossRef] [Green Version]
- Hodge, A.M.; Biener, J.; Hayes, J.R.; Bythrow, P.M.; Volkert, C.A.; Hamza, A.V. Scaling equation for yield strength of nanoporous open-cell foams. Acta Materialia 2007, 55, 1343–1349. [Google Scholar] [CrossRef] [Green Version]
- Gibbings, J.C. Dimensional Analysis; Springer: London, UK, 2011; ISBN 1849963177. [Google Scholar]
- Huber, N.; Tsakmakis, C. A neural network tool for identifying the material parameters of a finite deformation viscoplasticity model with static recovery. Comput. Methods Appl. Mech. Eng. 2001, 191, 353–384. [Google Scholar] [CrossRef]
- Tyulyukovskiy, E.; Huber, N. Identification of viscoplastic material parameters from spherical indentation data: Part I. Neural networks. J. Mater. Res. 2006, 21, 664–676. [Google Scholar] [CrossRef]
- Pedregosa, F.; Varoquaux, G.; Gramfort, A.; Michel, V.; Thirion, B.; Grisel, O.; Blondel, M.; Prettenhofer, P.; Weiss, R.; Dubourg, V.; et al. Scikit-learn: Machine Learning in Python. J. Mach. Learn. Res. 2011, 12, 2825–2830. [Google Scholar]
- Bock, F.E.; Aydin, R.C.; Cyron, C.J.; Huber, N.; Kalidindi, S.R.; Klusemann, B. A Review of the Application of Machine Learning and Data Mining Approaches in Continuum Materials Mechanics. Front. Mater. 2019, 6, 443. [Google Scholar] [CrossRef] [Green Version]
- Huber, N.; Kalidindi, S.R.; Klusemann, B.; Cyron, C.J. (Eds.) Machine Learning and Data Mining in Materials Science; Frontiers Media SA: Lausanne, Switzerland, 2020; ISBN 9782889636518. [Google Scholar]
- Chinesta, F.; Cueto, E.; Abisset-Chavanne, E.; Duval, J.L.; Khaldi, F.E. Virtual, Digital and Hybrid Twins: A New Paradigm in Data-Based Engineering and Engineered Data. Arch. Computat. Methods Eng. 2020, 27, 105–134. [Google Scholar] [CrossRef] [Green Version]
- Gibson, L.J.; Ashby, M.F. The mechanics of three-dimensional cellular materials. Proc. R. Soc. Lond. A 1982, 382, 43–59. [Google Scholar] [CrossRef]
- Lee, J.A.; Verleysen, M. (Eds.) Nonlinear Dimensionality Reduction; Springer Science+Business Media LLC: New York, NY, USA, 2007; ISBN 9780387393513. [Google Scholar]
- Yun, M.; Argerich, C.; Cueto, E.; Duval, J.L.; Chinesta, F. Nonlinear Regression Operating on Microstructures Described from Topological Data Analysis for the Real-Time Prediction of Effective Properties. Materials 2020, 13, 2335. [Google Scholar] [CrossRef] [PubMed]
- Lührs, L.; Soyarslan, C.; Markmann, J.; Bargmann, S.; Weissmüller, J. Elastic and plastic Poisson’s ratios of nanoporous gold. Scr. Mater. 2016, 110, 65–69. [Google Scholar] [CrossRef] [Green Version]
- Tabor, D. The Hardness of Metals; Oxford University Press: Oxford, UK, 2000; ISBN 9780198507765. [Google Scholar]
- Nachtrab, S.; Kapfer, S.C.; Arns, C.H.; Madadi, M.; Mecke, K.; Schröder-Turk, G.E. Morphology and linear-elastic moduli of random network solids. Adv. Mater. Weinheim. 2011, 23, 2633–2637. [Google Scholar] [CrossRef]
- Greer, J.R.; Nix, W.D. Nanoscale gold pillars strengthened through dislocation starvation. J. Mater. Res. 2006, 73, 4125. [Google Scholar] [CrossRef] [Green Version]


| Shape | |||
|---|---|---|---|
Publisher’s Note: MDPI stays neutral with regard to jurisdictional claims in published maps and institutional affiliations. |
© 2021 by the author. Licensee MDPI, Basel, Switzerland. This article is an open access article distributed under the terms and conditions of the Creative Commons Attribution (CC BY) license (https://creativecommons.org/licenses/by/4.0/).
Share and Cite
Huber, N. A Strategy for Dimensionality Reduction and Data Analysis Applied to Microstructure–Property Relationships of Nanoporous Metals. Materials 2021, 14, 1822. https://doi.org/10.3390/ma14081822
Huber N. A Strategy for Dimensionality Reduction and Data Analysis Applied to Microstructure–Property Relationships of Nanoporous Metals. Materials. 2021; 14(8):1822. https://doi.org/10.3390/ma14081822
Chicago/Turabian StyleHuber, Norbert. 2021. "A Strategy for Dimensionality Reduction and Data Analysis Applied to Microstructure–Property Relationships of Nanoporous Metals" Materials 14, no. 8: 1822. https://doi.org/10.3390/ma14081822