Article

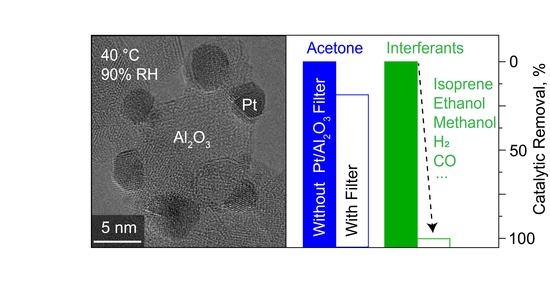
Room-Temperature Catalyst Enables Selective Acetone Sensing

by
Ines C. Weber
1,
Chang-ting Wang
1 and
Andreas T. Güntner
1,2,*
1
Particle Technology Laboratory, Department of Mechanical and Process Engineering, ETH Zurich, CH-8092 Zurich, Switzerland
2
Department of Endocrinology, Diabetology, and Clinical Nutrition, University Hospital Zurich (USZ) and University of Zurich (UZH), CH-8091 Zurich, Switzerland
*
Author to whom correspondence should be addressed.
Materials 2021, 14(8), 1839; https://doi.org/10.3390/ma14081839
Submission received: 27 February 2021 / Revised: 29 March 2021 / Accepted: 1 April 2021 / Published: 8 April 2021
(This article belongs to the Special Issue Flame Synthesis and Characterization of Oxide Nanoparticles)

Abstract

:
Catalytic packed bed filters ahead of gas sensors can drastically improve their selectivity, a key challenge in medical, food and environmental applications. Yet, such filters require high operation temperatures (usually some hundreds °C) impeding their integration into low-power (e.g., battery-driven) devices. Here, we reveal room-temperature catalytic filters that facilitate highly selective acetone sensing, a breath marker for body fat burn monitoring. Varying the Pt content between 0–10 mol% during flame spray pyrolysis resulted in Al2O3 nanoparticles decorated with Pt/PtOx clusters with predominantly 5–6 nm size, as revealed by X-ray diffraction and electron microscopy. Most importantly, Pt contents above 3 mol% removed up to 100 ppm methanol, isoprene and ethanol completely already at 40 °C and high relative humidity, while acetone was mostly preserved, as confirmed by mass spectrometry. When combined with an inexpensive, chemo-resistive sensor of flame-made Si/WO3, acetone was detected with high selectivity (≥225) over these interferants next to H2, CO, form-/acetaldehyde and 2-propanol. Such catalytic filters do not require additional heating anymore, and thus are attractive for integration into mobile health care devices to monitor, for instance, lifestyle changes in gyms, hospitals or at home.

Graphical Abstract

1. Introduction

Chemical gas sensors are promising for the next generation of handheld devices for air [1] or food quality monitoring [2], medical breath analysis [3] and human detection (e.g., in search and rescue [4] or translational crime control [5]). Additional filters [6] can drastically improve their performance to meet the challenging selectivity requirements of these applications, such as the quantification of single analytes among >800 [7] compounds in breath or >250 [8] in indoor air. Particularly interesting are catalytic filters that can convert interferants completely and continuously to sensor-inert species, while target analytes remain unaffected. Such filters have been investigated to remove confounders like CO [9] and ethanol [10] in alkane detection and very recently enabled selective benzene detection [1].
Breath acetone is a metabolic marker for lipolysis, and is thus interesting for monitoring the effectiveness of lifestyle changes (e.g., fasting [11], ketogenic dieting [12] and exercise [13]) or the treatment of metabolic diseases [14]. However, current acetone sensors lack sufficient selectivity to interferants. For instance, Co-doped ZnO nanofibers [15] and TiO2/WO3 nanocrystals [16] respond to H2 that forms in the intestinal tract after food intake and can reach significantly higher concentrations (>50 ppm) than breath acetone (e.g., 700–1000 ppb during exercise [17]). Al-ZnO [18] and Si/WO3 [19] are interfered by isoprene that spikes during physical activity [17]. Finally, SnO2, with multi-walled carbon nanotubes [20] and Au vertical hematite nanotube arrays [21] are interfered by ethanol that is omnipresent in hospitals and gyms from disinfectants (>100 ppm [22]).
Recently, a packed bed catalytic filter of flame-made ZnO nanoparticles at 260 °C was introduced that removed ethanol selectively (i.e., up to 185 ppm) over acetone [23] by exploiting the ZnO’s distinct surface basicity [24]. However, this filter did not remove critical methanol, isoprene and H2. While Co3O4 and PdO nanocatalysts on In2O3 hollow spheres removed toluene, CO, H2 and NH3 quite effectively over acetone, their performance on ethanol has not been evaluated yet to assess possible interference [25]. This was addressed with a 0.2 mol% Pt/Al2O3 catalyst at 135 °C that featured unprecedented acetone selectivity (>250) over ethanol, H2, CO, isoprene, NH3, methanol, formaldehyde, acetaldehyde, toluene and m-xylene at 90% relative humidity (RH) [19], as proven also for human breath with mass spectrometry [26]. The high acetone selectivity was associated [19] with interferant oxidation (e.g., ethanol/methanol [27]) by hydroxyl-related species on Al2O3 surfaces. In contrast, acetone remains intact since the Lewis acidic sites required for acetone conversion [28] are blocked by dissociating water [29] present in highly humid breath. The addition of 0.2 mol% Pt enhanced the catalytic conversion to lower temperatures. However, a consistent drawback of these catalytic packed bed filters remained their elevated operation temperatures (e.g., 135 °C [19]), requiring additional heating power. This impedes their integration into hand-held, battery-driven devices or even wearables that are desirable for mobile health care [30].
The reactivity of catalysts, and thus operational temperature, is influenced strongly by noble metals, as they lower the activation energy, for instance, by dissociatively adsorbing highly reactive oxygen [31]. Specifically for Pt, cluster size, oxidation state [32], loading [33] and dispersion [34] determine its reactivity. For instance, metallic Pt clusters of 6 nm size showed higher reactivity to methanol, another endogenous breath compound [35], than smaller (i.e., <1 nm) and oxidized PtOx clusters [32]. Similarly, ethanol reactivity was increased by an order of magnitude when increasing Pt cluster size from 2.1 to 7.4 nm [36] as was the case also for methane and cyclopentane combustion with increasing Pt cluster sizes from 1.3 to 5.7 nm [37]. Finally, the loading and dispersion of noble metals on metal-oxide surfaces leads to a shift of conversion to lower temperatures, as was reported for toluene and propene combustion on 0.5–1.5 wt% Pt/Al2O3, while preserving selectivity [33].
Here, room-temperature catalytic filters are introduced that remove alcohols, aldehydes and inorganics (e.g., H2 and CO) selectively over acetone. This is achieved by flame spray pyrolysis (FSP) yielding highly dispersed Pt/PtOx clusters (0–10 mol%) on Al2O3 nanoparticles at controlled composition [38]. Their crystal structure, cluster size distribution and specific surface area (SSA) were characterized by X-ray diffraction (XRD), electron microscopy and N2 adsorption. The catalytic performance towards methanol, ethanol (up to 100 ppm), isoprene and acetone was investigated at breath analysis-relevant 90% RH by proton-transfer-reaction time-of-flight mass spectrometry (PTR-ToF-MS). To demonstrate the filters’ immediate practical impact, it was connected to a flame-made, chemoresistive Si/WO3 sensor [39] and tested for selective acetone sensing.

2. Materials and Methods

2.1. Pt/Al2O3 Fabrication

Pt/Al2O3 nanoparticles were prepared by FSP [38] with a reactor described elaborately elsewhere [40]. Therefore, Pt acetylacetonate (Alfa Aesar, Pt ≥ 48.0%) and Al-tri-sec-butoxide (Sigma-Aldrich, 97%) were dissolved in a xylene/acetonitrile mixture (7:3 v/v) to achieve a total metal content (Pt + Al) of 0.5 M and a Pt loading of 0, 1, 3, 5 and 10 mol%. This corresponds in the product (Pt on Al2O3) to 0, 3.7, 7.2, 16.8 and 29.8 wt%, respectively. The precursor was fed at 5 mL/min through a nozzle and dispersed by 5 L/min oxygen at a pressure drop of 1.7 bar. A ring-shaped premixed methane/oxygen flow (1.25 and 3.2 L/min, respectively) ignited the spray and sustained the flame. The powder was collected with a vacuum pump (Seco SV 1025 C, Busch) on a water-cooled glass fiber filter (GF6 Albert-Hahnemuehle, D = 257 mm) at 50 cm height above the burner. The particles were scraped off the filter with a spatula and thermally stabilized by annealing in air at 500 °C for 1 h in an oven (Carbolite Gero GmbH, 30–3000 °C, Neuhausen, Germany).

2.2. Pt/Al2O3 Characterization

X-ray diffraction (XRD) patterns were recorded at 2θ = 15–70° with a scanning step and speed of 0.011° and 0.0057°/s using a Bruker AXS D8 Advance diffractometer operated at 40 kV and 30 mA. Crystal phases were identified by the software Bruker Diffrac.eva V3.1 by comparison to structural parameters of cubic γ-Al2O3 (PDF 10–0425), cubic Pt (PDF 01-1311) and tetragonal PtO (PDF 85-0714). To identify peak shifts, crystalline NiO (Bunsenite, ~325 mesh, Sigma-Aldrich, Buchs, Switzerland, PDF 47-1049) was admixed in a 1:1 w/w ratio as internal standard [41] to align the XRD patterns. The crystallite sizes were calculated using the Scherrer equation:
D = K λ β cos θ
where D is the crystallite size in nm; K is the Scherrer constant (i.e., 0.9); λ is the wavelength of the CuKα X-ray source (i.e., 0.15406 nm); β is the full width at half maximum (FWHM) and θ is the peak position (both in radian). Bimodality of Pt was identified by subtracting first the pure Al2O3 pattern and subsequent peak deconvolution at 2θ = 39.7° using the software OriginPro 2018G (OriginLab Corporation). Al2O3 crystal sizes were determined with the Scherrer Equation at 2θ = 67.1°, while for 10 mol% Pt, the Al2O3 peak was first deconvoluted from the Pt peak.
For in situ XRD analysis during H2 reduction, a high temperature cell was used (HTK 1200N, Anton Paar, Graz, Austria). For this, the 3 mol% Pt/Al2O3 powder was filled into a 16 mm sampler holder featuring a 1 mm high edge (Anton Paar, Graz, Austria). The particles were flushed with a constant flow of 50 mL/min H2/Ar and the temperature was increased stepwise with 0.5 °C/s from 30 °C to 150, 250 and 350 °C. The particles remained in isothermal conditions for 2 h at each temperature prior to analysis.
N2 adsorption was carried out at 77 K using a Tri-Star Micromeritics II Plus. All powders were degassed at 150 °C in N2 for 1 h prior to the analysis to remove humidity and other residues from the particle surfaces. The SSA was determined with the Brunauer-Emmett-Teller (BET) model. Particle sizes were calculated assuming separate Al2O3 and Pt spherical particles and an averaged density based on the relative amounts of Al2O3 (3.95 g/cm3) and Pt (21.45 g/cm3) while neglecting PtOx.
For electron microscopy imaging, the particles were dispersed in ethanol and deposited onto a copper grid-supported perforated carbon foil. High resolution transmission electron microscopy (HRTEM) images were acquired on a JEM-ARM300F (GrandArm, JEOL, Tokyo, Japan) operated at 300 kV. Furthermore, a high-angle annular dark-field scanning transmission electron microscope (HAADF-STEM, HD-2700CS, Hitachi, Tokyo, Japan) operated at 200 kV and equipped with an Energy-dispersive X-ray spectroscopy detector (EDXS) was used to image the Pt/Al2O3 particles. The area-derived particle diameters were determined from HAADF-STEM images using the NanoDefine tool of ImageJ (version 1.53c) to measure the Pt particle/cluster area and assuming spherical particles. A lognormal fit was applied to derive the number count-based particle size distribution (PSD) and to identify the mean geometric diameter (dg) and standard deviation (σg).

2.3. Catalytic Evaluation

The measurement setup comprised a gas mixing unit [42] that was connected to a catalytic reactor [23] through inert and heated Teflon tubing to mitigate water condensation and analyte adsorption. The gas mixing unit was composed of several high-resolution mass flow controllers (Bronkhorst) that dosed the calibrated analytes (i.e., ethanol (10 and 495 ppm), acetone (15 ppm), isoprene (15 ppm) and methanol (15 ppm), all from PanGas in synthetic air, into a hydrocarbon-free air stream (PanGas, CnHm and NOx ≤ 100 ppb) at 150 mL/min, unless otherwise specified. Humidity was admixed by guiding synthetic air through a 125 mL glass bubbler (Drechsel bottle, sintered glass frit, Sigma-Aldrich, Buchs, Switzerland) filled with ultrapure water (Milli-Q S90, Merck, Switzerland) and adjusted to reach 0–90% RH that remained quite stable (±0.3% [43]) during 12 h of continuous operation, as confirmed with a humidity sensor (SHT2x, Sensirion AG, Stäfa, Switzerland).
The catalyst consisted of 30 mg nanoparticles prepared as a packed bed inside a tailor-made quartz glass reactor (inner diameter = 4 mm) and fixated at both ends with quartz wool and quartz sand [23]. Only where specified, catalysts were reduced with 5% H2/Ar (PanGas) at 350 °C for 2 h prior to measurements. The reactor was then placed inside an oven (Nabertherm, P320, Lilienthal, Germany) and heated to the desired temperature (i.e., 25–400 °C). Effluent gas at the filter outlet was analyzed using a PTR-ToF-MS 1000 (Ionicon, Innsbruck, Austria) [44] with H3O+ as precursor ions at 600 V drift voltage, 60 °C drift temperature and 2.4 mbar drift pressure. Analyte concentrations were identified at m/z values of 33.03 (methanol [45]), 47.05 (ethanol [46]), 59.05 (acetone [46]) and 69.07 (isoprene [45]). Prior to the measurements, 5-point calibrations were carried out with each analyte. Analyte conversion was calculated from the analyte (i) concentration at the inlet (cin,i) and outlet (cout,i) using the following formula:
C o n v e r s i o n = ( 1 c o u t , i c i n , i )

2.4. Detector Fabrication and Evaluation

Sensing tests were carried out with a flame-made 10 mol% Si-containing WO3 (Si/WO3) sensor [39]. The precursor solution consisted of ammonium metatungstate hydrate (Sigma-Aldrich, ≥97%) and hexamethyldisiloxane (Sigma-Aldrich, ≥98%) dissolved in a 1:1 (v/v) mixture of ethanol (Fluka, ≥99.8%) and diethylene glycol monobutyl ether (Sigma-Aldrich, ≥98%). For comparison, also a 0.5 mol% Pd/SnO2 sensor was prepared [47] with a precursor solution containing tin(II)-ethylhexanoate (STREM Chemicals, purity ≥ 90%) and palladium(II)-acetylacetonate (Sigma Aldrich, purity ≥ 99%) dissolved in xylene (Sigma Aldrich, ≥96%) with a total metal content of 0.5 M. The FSP conditions were identical to the above for Pt/Al2O3 particles. The Si/WO3 and Pd/SnO2 nanoparticles were directly deposited onto an Al2O3 substrate (15 × 13 × 0.8 mm3, Electronic Design Center, Case Western Reserve University) featuring interdigitated electrodes and a Pt back-heater [48], situated at 20 cm height above the burner (HAB). Subsequently, the substrate was lowered to 14 cm HAB and in situ annealed [49] with a particle-free xylene flame for 30 s. Thereafter, the sensor was annealed in air at 500 °C for 5 h (Carbolite Gero GmbH, Neuhausen, Germany) and mounted on a Macor holder installed inside a Teflon chamber [48]. There, it was heated to 350 °C (being the optimal temperature for acetone sensing [48]) by passing a DC current (R&S HMC8043) through the back-heater of the sensor substrate. The ohmic film resistance was recorded using a multimeter (Keithley, 2700).
Sensing tests were performed both with an inactive (i.e., pure Al2O3) and active (3 mol% Pt/Al2O3) catalytic filter (30 mg) that was fixated at both sides with quartz wool and quartz sand inside a compact glass tube (i.e., 4 mm inner diameter, 5 cm length, Supelco, Sigma Aldrich, Buchs, Switzerland). The filter was then connected downstream of the gas mixing unit and upstream of the sensor. Note that the filter was slightly heated (i.e., to 40 °C), being the standard in breath analysis [50]. Sensing tests were performed with the above analytes, and additionally with 2-propanol (250 ppm), acetaldehyde (15 ppm), CO (50 ppm), H2 (50 ppm, all PanGas, in synthetic air) and formaldehyde (10 ppm, in N2). The sensor response to each analyte was calculated as:
R e s p o n s e =   R a i r R a n a l y t e 1
where Rair and Ranalyte represent the film resistances in air or during analyte exposure, respectively. The acetone selectivity was defined as the ratio between the acetone response and that to a specific analyte following IUPAC guidelines [51].

3. Results and Discussion

3.1. Tailoring Pt Size and Dispersion

First, the crystallinity and crystal sizes of flame-made and annealed (500 °C for 1 h) powders with 0–10 mol% Pt on Al2O3 were investigated. In the absence of Pt, flame-made Al2O3 forms the cubic γ-phase (stars, Figure 1a), in agreement with the literature [38]. Most importantly, adding up to 10 mol% Pt systematically emerges the peaks at 2θ = 39.7° and 46.3°. This suggests the formation of highly crystalline and metallic Pt crystals with peaks (triangles, Figure 1a) that overlap with those of γ-Al2O3, as had been observed previously for wet-impregnated Pt/Al2O3 after rather similar (500 °C for 2 h) annealing [52]. Importantly, no crystalline PtO (circles) is detected, which is desired for highly reactive catalytic filters [32]. While it is known that metallic Pt dominates acidic supports [53] like Al2O3 [24], the presence of some amorphous PtOx (not detectable by XRD) has been revealed with an extended X-ray absorption fine structure (EXAFS) on flame-made and similarly annealed Pt/Al2O3 (i.e., 2 h at 500 °C) before [54].
Interestingly, the Pt peaks feature sharp tips and broader bases, indicative of bimodal crystal size distributions [55]. In fact, deconvolution of the peak at 2θ = 39.7° (Figure S1) reveals smaller and larger Pt crystals. The smaller Pt crystals (triangles, Figure 1b) feature rather constant sizes of 5.5 ± 0.6 nm, close to the 6 nm and 7.4 nm, that showed high reactivity towards methanol [32] and ethanol [36]. Such small Pt crystals dominate (relative abundance 82–94%, Figure 1c) for all Pt contents over larger ones (with sizes ranging from 14.2 to 21.4 nm, circles in Figure 1b) and are probably stabilized by strong anchoring on penta-coordinated Al3+ sites on the γ-Al2O3 (100) surfaces [56], as had been reported for Pt/Al2O3 before [57].
It is noteworthy that the addition of Pt decreased the γ-Al2O3 crystal size from 8.1 to 6.7 nm (Figure 1d, stars). This might indicate some (substitutional or interstitial) incorporation of Pt into the Al2O3 lattice, that was investigated further by XRD peak shift analysis (Figure S2) with an internal standard (i.e., crystalline NiO [41]). However, no lattice distortion was observed, suggesting no Pt incorporation, which is likely due to the significantly larger ionic radii of Pt (i.e., 80 pm Pt2+ or 63 ppm Pt4+ [58]) compared to Al (54 pm Al3+ [58]) at a coordination number of VI, as relevant for γ-Al2O3. Note that the BET-equivalent particle diameters (determined by N2 adsorption) for 0–10 mol% Pt were 7.7–9.5 nm (Figure 1d, squares), consistently larger than the γ-Al2O3 crystal size (stars), suggesting some polycrystallinity.
The morphology and dispersion of the Pt crystals was investigated further by electron microscopy, exemplarily for 3 mol% Pt/Al2O3. HRTEM reveals the presence of separate Al2O3 (brighter) and Pt (dark) particles/clusters (Figure 2a) that both feature a rather spherical shape. Their faceted appearance and visible lattice fringes support high crystallinity, in line with XRD (Figure 1a). When magnifying such a Pt particle/cluster (inset of Figure 2a), a lattice spacing of 0.224 nm is measured that matches well with the Pt (111) plane. Most such Pt crystals seem well dispersed over the Al2O3 support, forming fine surface clusters that are favorable for catalytic filtering given their large reactive surface areas.
A further distinction between Pt and Al2O3 particles/clusters is provided by HAADF-STEM, where the Pt particles appear now brighter than Al2O3 due to their higher scattering potential (Figure 2b). In fact, corresponding EDXS analysis validates the presence of mostly Pt (Figure 2c, green square in Figure 2b) for bright clusters while Al and O (Figure 2d, blue square in Figure 2b) dominate the darker particles. Note that the C and Cu signals originate from the sample grid (i.e., perforated carbon foil on Cu grid, see Materials and Methods).
The size distribution (Figure 2e) for 1000 Pt particles/clusters was determined from such HAADF-STEM images (Figure S3). A lognormal fit (red line) yields a geometric average diameter (dg) and standard deviation (σg) of 5 nm and 1.53, respectively, that agrees well with the average crystal size of the small Pt clusters (Figure 1b: 5 nm). Note that no bimodality is visible in the number frequency size distribution here, likely since the relative abundance of larger particles is rather small (Figure 1c). Remarkably, quite similar dg (i.e., 5–5.9 nm) are obtained for all Pt contents (Figure S4). This should be associated with the aforementioned strong anchoring of the small Pt clusters on the Al2O3 [56] that prevents their sintering during annealing, while the larger clusters grow with increasing Pt content (Figure 1b). As a result, Pt content affects primarily the surface loading, while the size of small Pt clusters and their dispersion remain rather invariant.

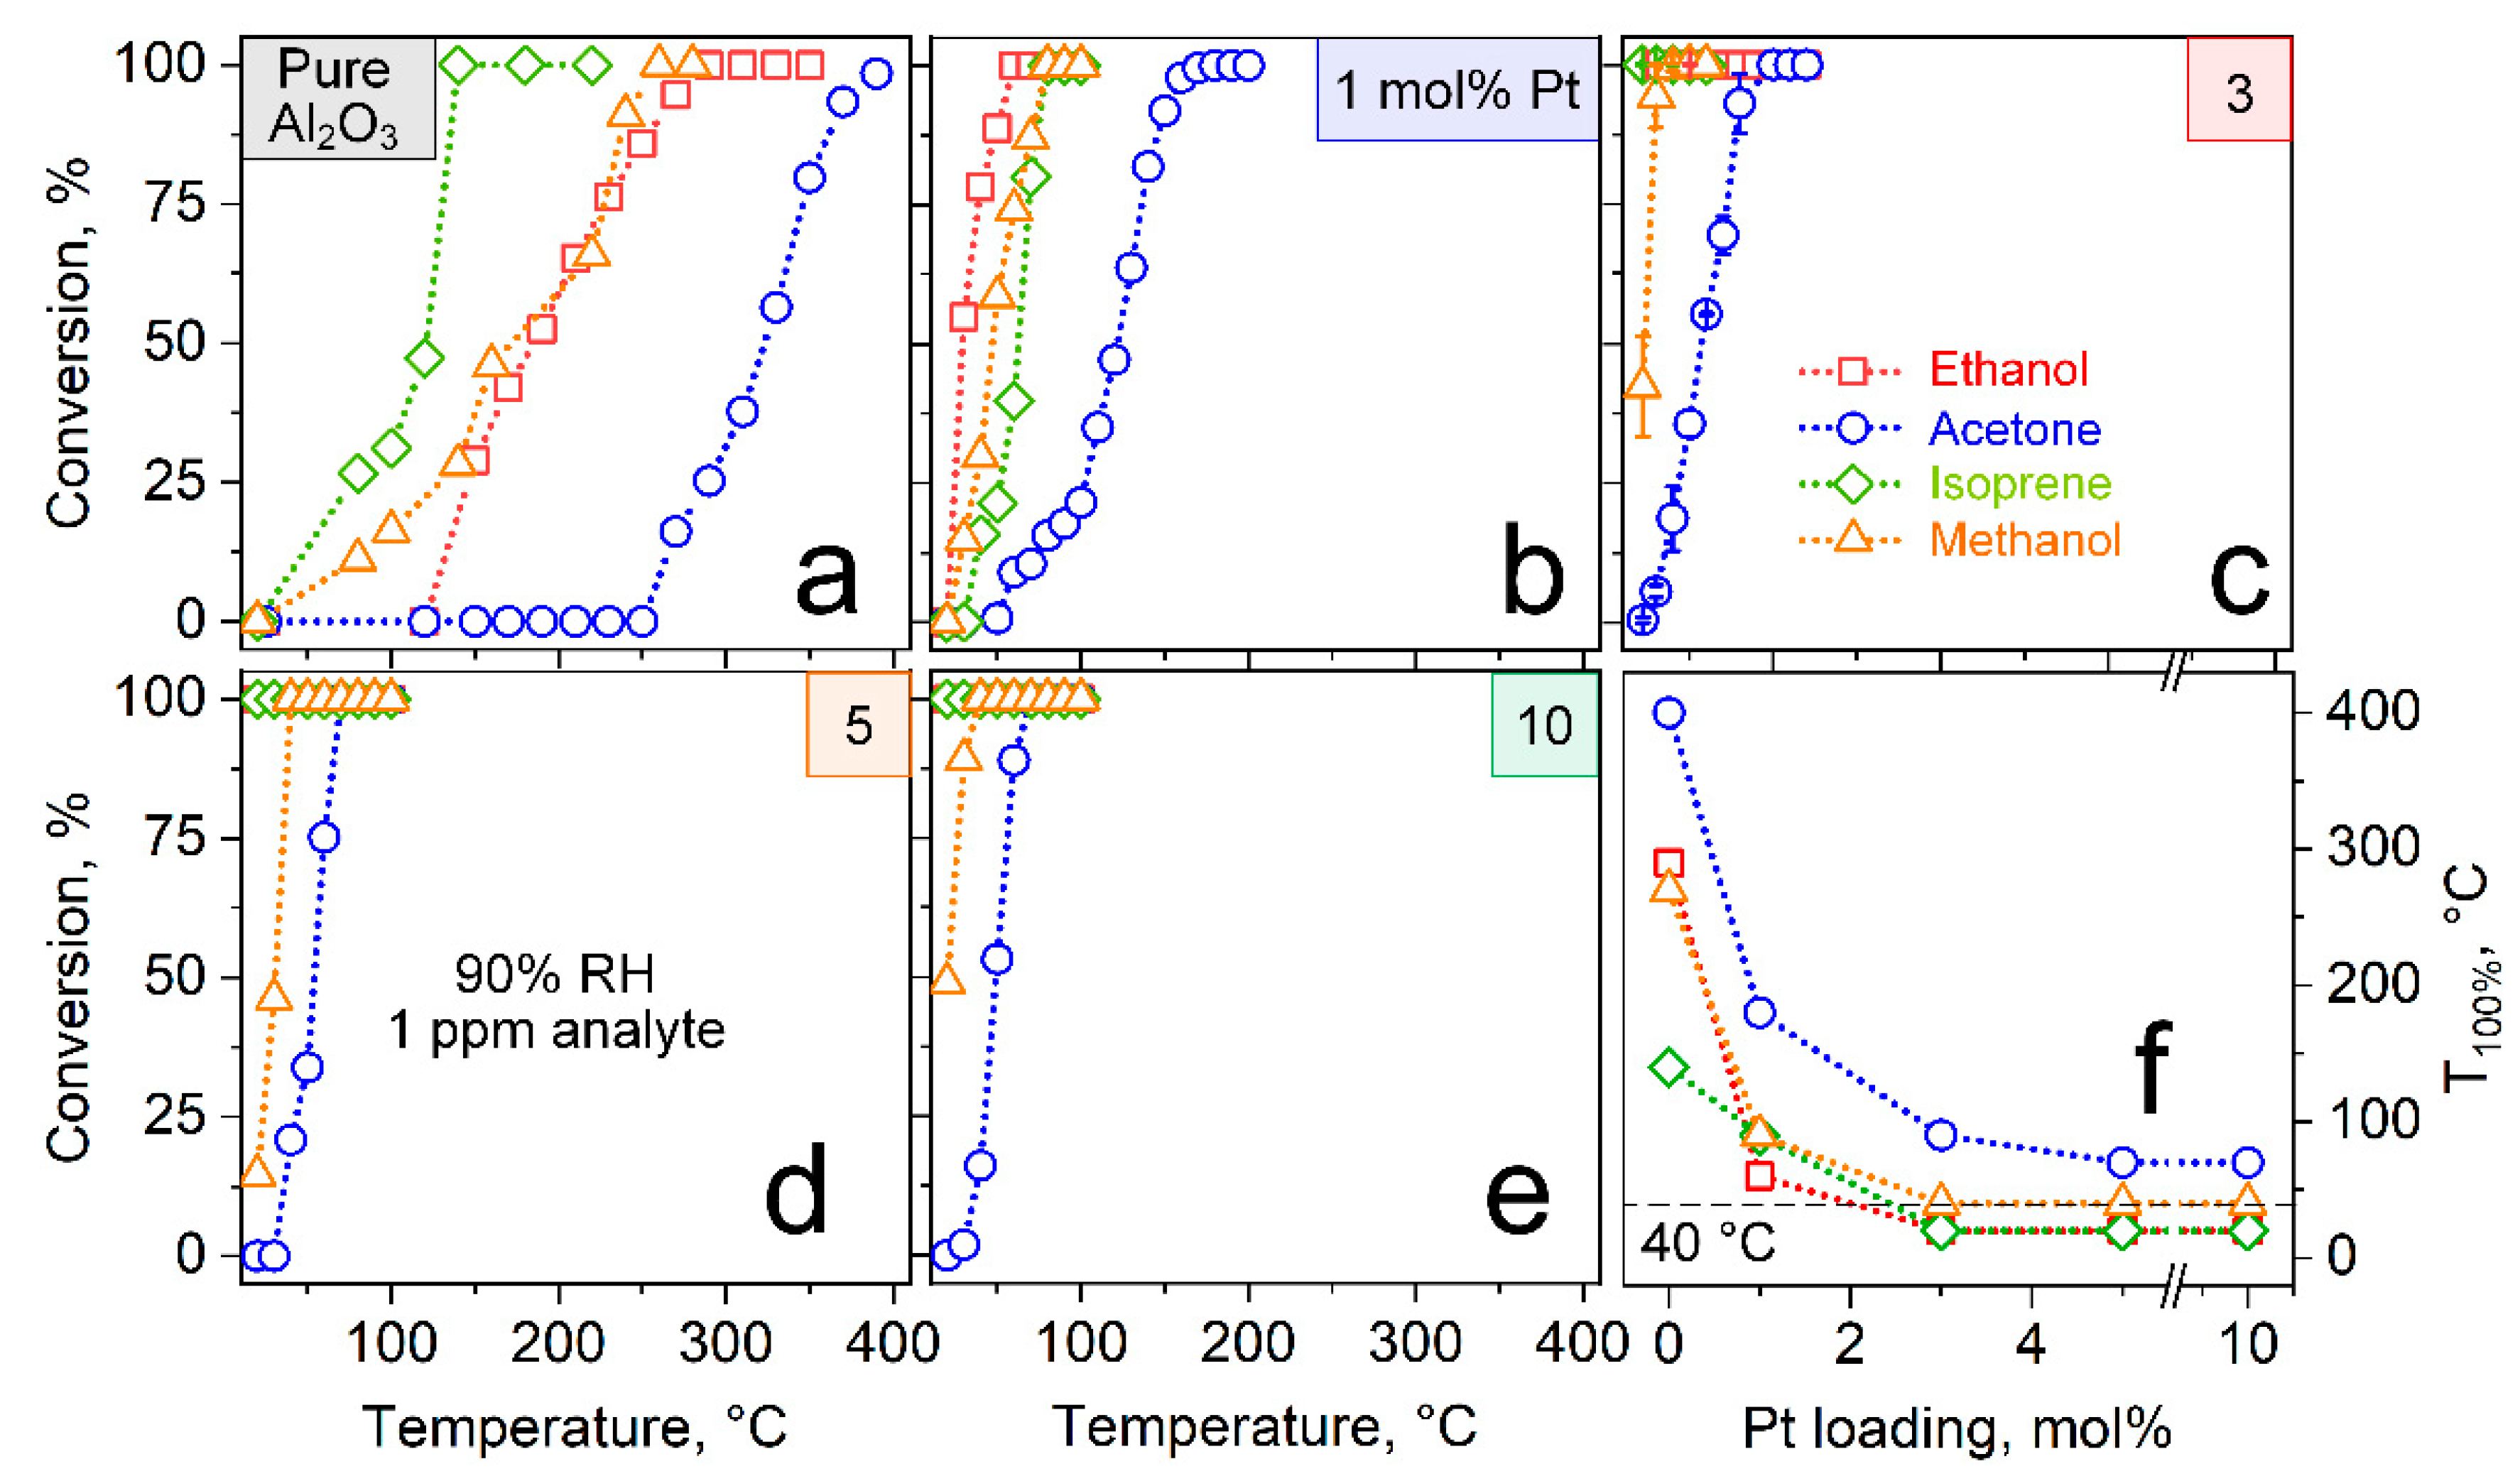
3.2. Catalytic Reactivity

The catalytic performance of these nanoparticles was tested by analyzing the exhaust of a 30 mg Pt/Al2O3 packed bed with bench-top PTR-ToF-MS (Figure 3). Tests were performed with 1 ppm of gaseous acetone (circles), isoprene (diamonds), methanol (triangles) and ethanol (squares) at 90% RH to simulate breath-realistic conditions. When increasing the temperature sequentially from 25–400 °C, the pure Al2O3 catalyst (Figure 3a) converts first isoprene (100% conversion at 140 °C) followed by methanol (260 °C) and ethanol (290 °C). Remarkably, acetone starts to convert only at 270 °C and complete conversion is observed even after 390 °C, resulting in distinct acetone selectivity, as had been shown previously for ethanol and acetone [19].
Most importantly, when increasing the Pt content, the conversion curves are systematically shifted towards lower temperatures (Figure 3b–e). Specifically, all interferants are converted completely at 90 °C with only 1 mol% Pt and this is further reduced to 40 °C in the case of 3, 5 and 10 mol% Pt. Note that the filter should not be operated below 40 °C, which is standard [35,59] in breath analysis to avoid water condensation from rather humid exhalations (i.e., >90% RH [60] at body temperature). The high reactivity of 3–10 mol% Pt/Al2O3 at room temperature should be attributed to the well dispersed Pt clusters of 5.0–5.9 nm size (Figure 2 and Figure S4). In fact, similar Pt cluster sizes were reported to be highly reactive for methanol [32], ethanol [36] and hydrocarbons [37], as had been specified in the Introduction.
Most importantly, the high acetone selectivity is maintained for all Pt contents, as the acetone is converted consistently at higher temperatures (Figure 3f, circles) than the confounders. For instance, for three identically prepared 3 mol% Pt/Al2O3 packed beds at 40 °C, only 18.7% ± 5.8% (Figure 3c, circles) of the acetone are lost while all confounders are removed completely. To further investigate this acetone selectivity, we reduced the 1 and 10 mol% Pt/Al2O3 in H2 prior to catalytic characterization (Figure S5). While this resulted in even lower conversion temperatures for all confounders, the acetone selectivity was deteriorated (i.e., 50.6 and 59.3% acetone conversion at complete interferant removal for 1 and 10 mol% Pt, respectively). This suggests the presence of less reactive [61] but apparently more acetone-selective PtOx on the metallic Pt clusters [54], that might be amorphous since it is not detectable by XRD (Figure 1). In fact, in situ XRD (Figure S6) during this treatment also revealed neither changes of the crystalline phases nor their sizes. However, the detailed reaction mechanism remains to be clarified.
To challenge the catalytic filter further, the 3 mol% Pt/Al2O3 packed bed at 40 °C was tested for the removal of 5–100 ppm ethanol (Figure 4) at 50% RH. Such high ethanol concentrations can be present in hospitals from sanitizers [22] and are removed by the catalytic filter completely (red vs. blue line), as confirmed by PTR-ToF-MS. This is, at least, competitive to filters based on Au/Fe2O3 (at 200 °C) [62] and ZnO (at 260 °C) [23], that had to be heated though. Furthermore, the catalyst was fairly robust to changing RH between 30 and 90% RH (acetone loss 46–14% at complete interferant conversion, Figure S7a), as it is usually present in room air and exhaled breath, and performs well also for other flows (i.e., 50–200 mL/min, Figure S7b) through the packed bed.

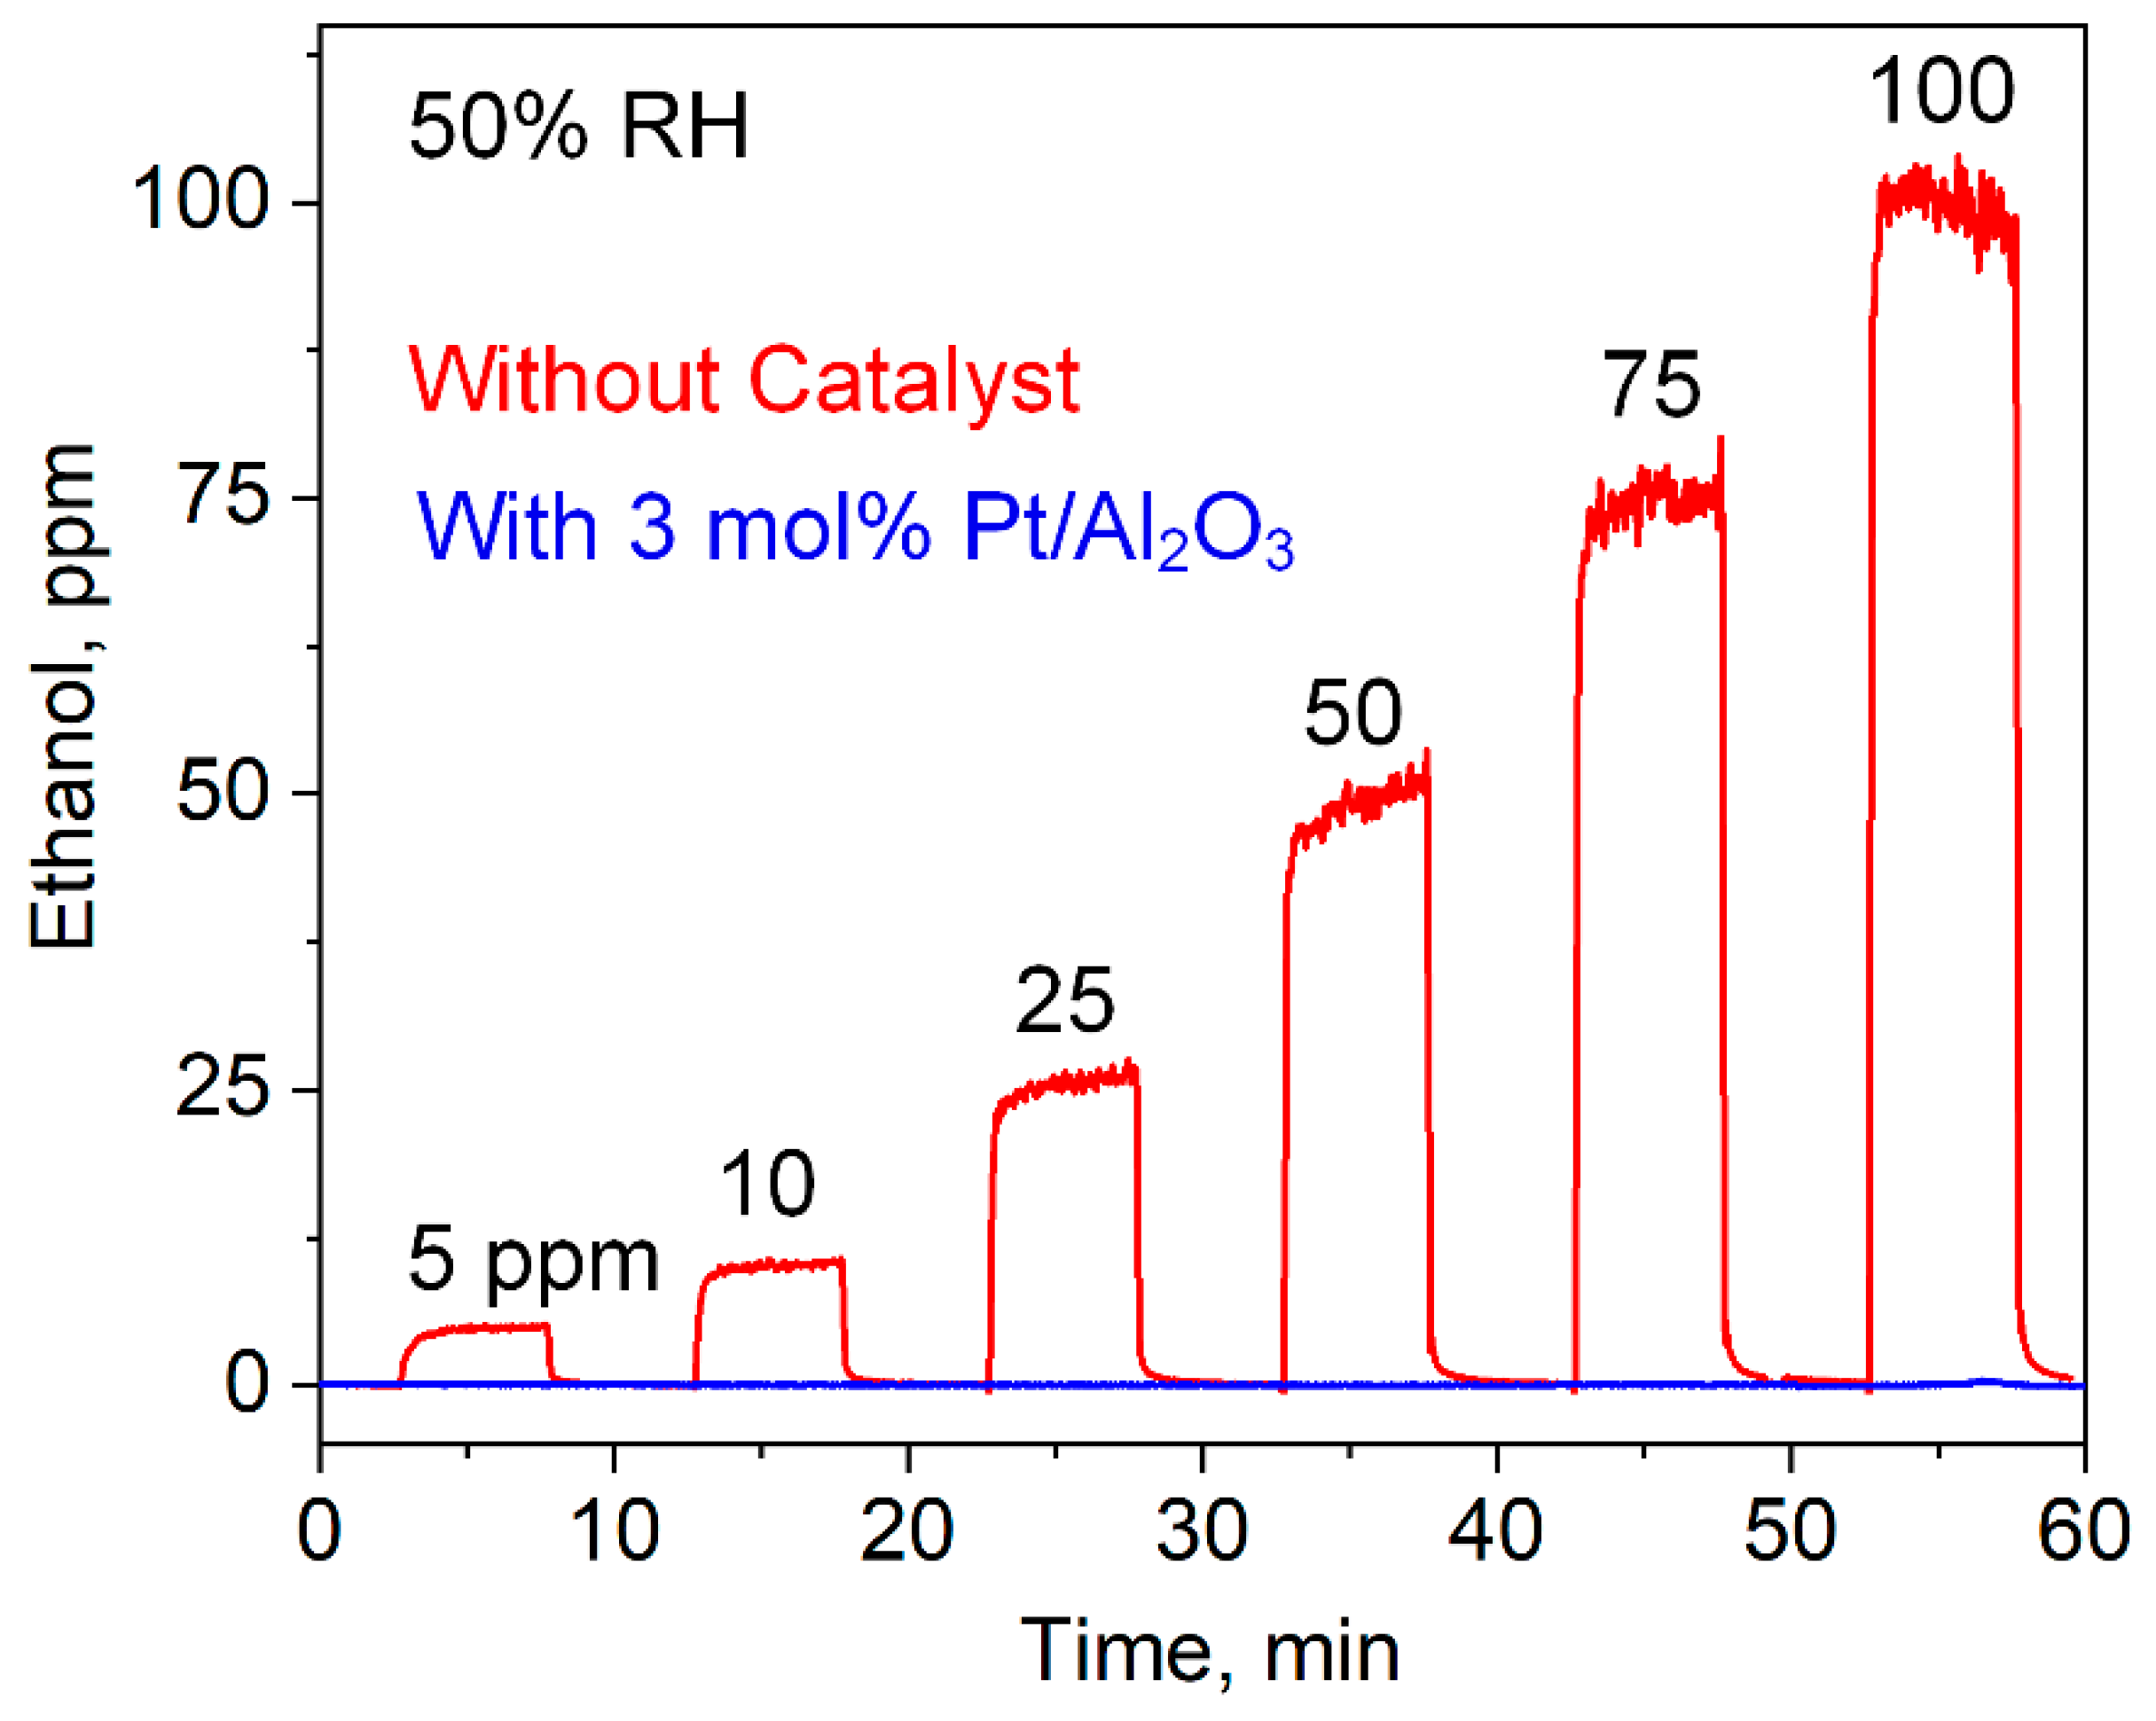
3.3. Selective Acetone Sensing with Room Temperature Filter

To demonstrate immediate practical impact, 30 mg of such 3 mol% Pt/Al2O3 at 40 °C were placed as packed bed filter ahead of a flame-made, chemoresistive Si/WO3 [48] sensor. When testing the sensor alone to 1 ppm acetone and eight breath-relevant interferants at 90% RH (Figure 5a), it responded to acetone (18) but showed an even higher response to isoprene (43.2) and was interfered by ethanol (2) and H2 (0.5) that can be present at orders of magnitude higher concentrations than acetone. The resulting selectivity at the same analyte concentrations range from 0.4–600 and are in fair agreement with earlier reports for ethanol (6.7 but at 400 °C [63]) and isoprene (0.5 [19]). However, these are insufficient and can lead to significant measurement errors, for instance, when monitoring breath acetone in situ during cardio-respiratory fitness-adapted [64] cycling [26].
This is eliminated effectively by the filter. In fact, the 3 mol% Pt/Al2O3 packed bed at 40 °C reduces these interferences (Figure 5b). Now, only acetone is detected with a response of 15.8, while the interferants are hardly recognized anymore (responses <0.1), in line with the catalytic characterization (Figure 3c). This results in high selectivity for all analytes (≥225, Figure 5b in brackets), and is highest for CO, ethanol and 2-propanol (all >1′000). Note that the acetone response reduction of 12.2% (Figure 5b) is in fair agreement with Figure 3c (18.7 ± 5.8%). The obtained selectivities are comparable to the ones achieved with a 0.2 mol% Pt/Al2O3 filter (at 135 °C); however, operated here at room temperature. Moreover, it outperforms state-of-the-art acetone sensors (e.g., Al-ZnO [18], Si/WO3 [19], Co-doped ZnO nanofibers [15], TiO2/WO3 nanocrystals [16], SnO2 with multi-walled carbon nanotubes [20] and Au vertical hematite nanotube arrays [21]).
End-tidal breath acetone levels are usually between 148–2744 ppb, as observed during weekly breath tests of 30 volunteers during 6 months [59]. Therefore, the detector was exposed subsequently to 100 and 50 ppb of acetone (Figure 6a). These concentrations are clearly distinguished with high signal to noise ratios (i.e., SNR > 50). Note that the extrapolated LOD (at SNR = 3) is even 2 ppb. Importantly, the detector features also a good repeatability (dashed lines, Figure 6a) with a response change <5% and excellent reproducibility of ±5.8% for the filter (error bars in Figure 3c at 40 °C) and 8% [19] for the Si/WO3 sensor alone, when testing three identically prepared samples.
Since exhaled human breath is a mixture of analytes, we tested also binary combinations of these acetone concentrations with 1 ppm of ethanol (circles, Figure 6b), methanol (diamonds) and formaldehyde (triangles). Most importantly, the detector response to acetone hardly changes (e.g., 15.2 ± 0.5 at 1 ppm), highlighting its excellent selectivity. Finally, the detector was tested for its RH robustness when sensing 100 ppb acetone (Figure 6c). Remarkably, the response changed only little from 1.5 to 1.7 between 30–90% RH, demonstrating outstanding humidity robustness. Previous studies [63] showed reduced acetone response at increasing RH for the Si/WO3 sensor alone that apparently compensates for the filter’s higher acetone loss (Figure S7a).

4. Conclusions

We demonstrated the systematic design of a room temperature catalytic filter for selective acetone sensing by optimizing the cluster size and loading of Pt/PtOx on Al2O3 nanoparticles with FSP. Such Pt/PtOx clusters were rather dispersed on the Al2O3 and showed bimodal distribution. Small Pt clusters were predominantly present and their size remained rather constant (dg = 5.0–5.9 nm) when altering Pt content, probably by stabilization on penta-coordinated Al3+ sites. Catalytic filters of such 3–10 mol% Pt/Al2O3 nanoparticles were highly reactive already at 40 °C, as confirmed by the complete conversion of up to 100 ppm ethanol with high robustness to 50–90% RH. We also suggested the presence of some PtOx, that was less reactive than metallic Pt but seemed beneficial for acetone selectivity.
As a proof-of-concept, such filters enhanced the acetone selectivity dramatically (i.e., ≥225 for eight critical confounders) that is required for accurate breath monitoring of lipolysis (e.g., during exercise and dieting). Due to the filter’s modular design, it can be combined flexibly also with other chemo-resistive sensors, like established [65] SnO2-based sensors (e.g., 0.5 mol% Pd/SnO2 [47], Figure S8), to turn them acetone-selective. Furthermore, it should even be compatible with different sensor types (e.g., electrochemical, optical, etc.). Importantly, the small filter size (i.e., 30 mg powder, 1.5 cm length × 0.4 cm diameter) allows its integration into compact and portable detectors. Since it requires no heating, it can be used readily with hand-held, smartphone-assisted and battery-driven devices [66] for breath acetone monitoring in mobile health care applications [67].

Supplementary Materials

The following are available online at https://www.mdpi.com/article/10.3390/ma14081839/s1, Figure S1: Deconvolution of Pt XRD peak, Figure S2: Pt/Al2O3 XRD patterns with NiO internal standard, Figure S3: STEM Pt cluster size determination, Figure S4: Particle size distributions, Figure S5: Catalytic performance before and after H2 reduction, Figure S6: In situ XRD during H2 reduction, Figure S7: Effect of relative humidity and flow. Figure S8: Filter performance with Pd/SnO2 sensor.

Author Contributions

Conceptualization, I.C.W. and A.T.G.; methodology, I.C.W. and A.T.G.; investigation, I.C.W. and C.-t.W.; analysis, I.C.W., C.-t.W. and A.T.G.; data curation, I.C.W. and C.-t.W.; writing—original draft preparation, I.C.W.; writing—review and editing, I.C.W., C.-t.W. and A.T.G.; visualization, I.C.W. and A.T.G.; supervision, A.T.G.; funding, A.T.G. All authors have read and agreed to the published version of the manuscript.

Funding

This research was funded primarily by the ETH Zurich Research Grant (ETH-05 19-2), the Particle Technology Laboratory at ETH Zurich and partially by the Swiss National Science Foundation R’Equip Grant 170729).

Institutional Review Board Statement

Not applicable.

Informed Consent Statement

Not applicable.

Data Availability Statement

Data are contained within the article or supplementary material. The data presented in this study are available in [insert article or supplementary material here].

Acknowledgments

The authors thank S.E. Pratsinis (ETH Zurich) for his support and stimulating discussions. Help by Frank Krumeich and the Scientific Center for Optical and Electron Microscopy (ScopeM) of ETH Zurich with the electron microscopy is gratefully acknowledged.

Conflicts of Interest

The authors declare no conflict of interest.

References

  1. Moon, Y.K.; Jeong, S.Y.; Jo, Y.K.Y.M.; Kang, Y.K.; Lee, J.H. Highly Selective Detection of Benzene and Discrimination of Volatile Aromatic Compounds Using Oxide Chemiresistors with Tunable Rh-TiO2 Catalytic Overlayers. Adv. Sci. 2021, 2004078. [Google Scholar] [CrossRef]
  2. Van den Broek, J.; Abegg, S.; Pratsinis, S.E.; Güntner, A.T. Highly selective detection of methanol over ethanol by a handheld gas sensor. Nat. Commun. 2019, 10, 4220. [Google Scholar] [CrossRef]
  3. Beauchamp, J.; Davis, C.E.; Pleil, J.D. Breathborne Biomarkers and the Human Volatilome; Elsevier: Amsterdam, The Netherlands, 2020; ISBN 978-0-12-819967-1. [Google Scholar]
  4. Güntner, A.T.; Pineau, N.J.; Mochalski, P.; Wiesenhofer, H.; Agapiou, A.; Mayhew, C.A.; Pratsinis, S.E. Sniffing Entrapped Humans with Sensor Arrays. Anal. Chem. 2018, 90, 4940–4945. [Google Scholar] [CrossRef] [PubMed] [Green Version]
  5. Ruzsanyi, V.; Wiesenhofer, H.; Ager, C.; Herbig, J.; Aumayr, G.; Fischer, M.; Renzler, M.; Ussmueller, T.; Lindner, K.; Mayhew, C.A. A portable sensor system for the detection of human volatile compounds against transnational crime. Sens. Actuators B Chem. 2021, 328, 129036. [Google Scholar] [CrossRef]
  6. Van den Broek, J.; Weber, I.C.; Güntner, A.T.; Pratsinis, S.E. Highly selective gas sensing enabled by filters. Mater. Horiz. 2021, 8, 661–684. [Google Scholar] [CrossRef]
  7. De Lacy Costello, B.; Amann, A.; Al-Kateb, H.; Flynn, C.; Filipiak, W.; Khalid, T.; Osborne, D.; Ratcliffe, N.M. A review of the volatiles from the healthy human body. J. Breath Res. 2014, 8, 014001. [Google Scholar] [CrossRef]
  8. Hänninen, O.O.; Alm, S.; Katsouyanni, K.; Künzli, N.; Maroni, M.; Nieuwenhuijsen, M.J.; Saarela, K.; Srám, R.J.; Zmirou, D.; Jantunen, M.J. The EXPOLIS study: Implications for exposure research and environmental policy in Europe. J. Expo. Anal. Environ. Epidemiol. 2004, 14, 440–456. [Google Scholar] [CrossRef]
  9. Portnoff, M.A.; Grace, R.; Guzman, A.M.; Runco, P.D.; Yannopoulos, L.N. Enhancement of MOS gas sensor selectivity by “on-chip” catalytic filtering. Sens. Actuators B Chem. 1991, 5, 231–235. [Google Scholar] [CrossRef]
  10. Fleischer, M.; Kornely, S.; Weh, T.; Frank, J.; Meixner, H. Selective gas detection with high-temperature operated metal oxides using catalytic filters. Sens. Actuators B Chem. 2000, 69, 205–210. [Google Scholar] [CrossRef]
  11. Statheropoulos, M.; Agapiou, A.; Georgiadou, A. Analysis of expired air of fasting male monks at Mount Athos. J. Chromatogr. B 2006, 832, 274–279. [Google Scholar] [CrossRef]
  12. Güntner, A.T.; Kompalla, J.F.; Landis, H.; Theodore, S.J.; Geidl, B.; Sievi, N.A.; Kohler, M.; Pratsinis, S.E.; Gerber, P.A. Guiding ketogenic diet with breath acetone sensors. Sensors 2018, 18, 3655. [Google Scholar] [CrossRef] [Green Version]
  13. Güntner, A.T.; Sievi, N.A.; Theodore, S.J.; Gulich, T.; Kohler, M.; Pratsinis, S.E. Noninvasive Body Fat Burn Monitoring from Exhaled Acetone with Si-doped WO3-sensing Nanoparticles. Anal. Chem. 2017, 89, 10578–10584. [Google Scholar] [CrossRef] [PubMed]
  14. Ruzsányi, V.; Kalapos, M.P. Breath acetone as a potential marker in clinical practice. J. Breath Res. 2017, 11, 024002. [Google Scholar] [CrossRef] [PubMed]
  15. Liu, L.; Li, S.; Zhuang, J.; Wang, L.; Zhang, J.; Li, H.; Liu, Z.; Han, Y.; Jiang, X.; Zhang, P. Improved selective acetone sensing properties of Co-doped ZnO nanofibers by electrospinning. Sens. Actuators B Chem. 2011, 155, 782–788. [Google Scholar] [CrossRef]
  16. Epifani, M.; Comini, E.; Díaz, R.; Genç, A.; Andreu, T.; Siciliano, P.; Morante, J.R. Acetone sensors based on TiO2 nanocrystals modified with tungsten oxide species. J. Alloy. Compd. 2016, 665, 345–351. [Google Scholar] [CrossRef]
  17. King, J.; Kupferthaler, A.; Unterkofler, K.; Koc, H.; Teschl, S.; Teschl, G.; Miekisch, W.; Schubert, J.; Hinterhuber, H.; Amann, A. Isoprene and acetone concentration profiles during exercise on an ergometer. J. Breath Res. 2009, 3, 027006. [Google Scholar] [CrossRef] [PubMed]
  18. Yoo, R.; Güntner, A.T.; Park, Y.; Rim, H.J.; Lee, H.S.; Lee, W. Sensing of acetone by Al-doped ZnO. Sens. Actuators B Chem. 2019, 283, 107–115. [Google Scholar] [CrossRef]
  19. Weber, I.C.; Braun, H.P.; Krumeich, F.; Güntner, A.T.; Pratsinis, S.E. Superior Acetone Selectivity in Gas Mixtures by Catalyst-Filtered Chemoresistive Sensors. Adv. Sci. 2020, 7, 2001503. [Google Scholar] [CrossRef] [PubMed]
  20. Narjinary, M.; Rana, P.; Sen, A.; Pal, M. Enhanced and selective acetone sensing properties of SnO2-MWCNT nanocomposites: Promising materials for diabetes sensor. Mater. Des. 2017, 115, 158–164. [Google Scholar] [CrossRef]
  21. Kim, D.H.; Kim, T.H.; Sohn, W.; Suh, J.M.; Shim, Y.S.; Kwon, K.C.; Hong, K.; Choi, S.; Byun, H.G.; Lee, J.H.; et al. Au decoration of vertical hematite nanotube arrays for further selective detection of acetone in exhaled breath. Sens. Actuators B Chem. 2018, 274, 587–594. [Google Scholar] [CrossRef]
  22. Bessonneau, V.; Thomas, O. Assessment of exposure to alcohol vapor from alcohol-based hand rubs. Int. J. Environ. Res. Public Health 2012, 9, 868–879. [Google Scholar] [CrossRef] [Green Version]
  23. Güntner, A.T.; Weber, I.C.; Pratsinis, S.E. Catalytic filter for continuous and selective ethanol removal prior to gas sensing. ACS Sens. 2020, 5, 1058–1067. [Google Scholar] [CrossRef]
  24. Jeong, N.C.; Lee, J.S.; Tae, E.L.; Lee, Y.J.; Yoon, K.B. Acidity scale for metal oxides and Sanderson’s electronegativities of lanthanide elements. Angew. Chem. Int. Ed. 2008, 47, 10128–10132. [Google Scholar] [CrossRef]
  25. Jo, Y.M.; Lim, K.; Choi, H.J.; Yoon, J.W.; Kim, S.Y.; Lee, J.H. 2D metal-organic framework derived co-loading of Co3O4 and PdO nanocatalysts on In2O3 hollow spheres for tailored design of high-performance breath acetone sensors. Sens. Actuators B Chem. 2020, 325, 128821. [Google Scholar] [CrossRef]
  26. Weber, I.C.; Derron, N.; Königstein, K.; Gerber, P.A.; Güntner, A.T.; Pratsinis, S.E. Monitoring Lipolyis by Sensing Breath Acetone down to ppb. Small Sci. 2021, 2100004. [Google Scholar] [CrossRef]
  27. Mallat, T.; Baiker, A. Oxidation of Alcohols with Molecular Oxygen on Solid Catalysts. Chem. Rev. 2004, 104, 3037–3058. [Google Scholar] [CrossRef] [PubMed]
  28. Dai, Q.L.; Yan, B.; Liang, Y.; Xu, B.Q. Water effects on the acidic property of typical solid acid catalysts by 3,3-dimethybut-1-ene isomerization and 2-propanol dehydration reactions. Catal. Today 2017, 295, 110–118. [Google Scholar] [CrossRef]
  29. Panov, A.G.; Fripiat, J.J. Acetone condensation reaction on acid catalysts. J. Catal. 1998, 178, 188–197. [Google Scholar] [CrossRef]
  30. Kvedar, J.C.; Fogel, A.L. MHealth advances clinical research, bit by bit. Nat. Biotechnol. 2017, 35, 337–339. [Google Scholar] [CrossRef]
  31. Muroi, T. Role of Precious Metal Catalysts. In Noble Metals; Industrial Catalysts Laboratory: Kukushima, Japan, 2012. [Google Scholar]
  32. Wang, H.; Wang, Y.; Zhu, Z.; Sapi, A.; An, K.; Kennedy, G.; Michalak, W.D.; Somorjai, G.A. Influence of Size-Induced Oxidation State of Platinum Nanoparticles on Selectivity and Activity in Catalytic Methanol Oxidation in the Gas Phase. Nano Lett. 2013, 13, 2976–2979. [Google Scholar] [CrossRef]
  33. Liotta, L.F. Catalytic oxidation of volatile organic compounds on supported noble metals. Appl. Catal. B Environ. 2010, 100, 403–412. [Google Scholar] [CrossRef]
  34. Haneda, M.; Wantanabe, T.; Kamiuchi, N.; Ozawa, M. Effect of platinum dispersion on the catalytic activity of Pt/Al2O3 for the oxidation of carbon monoxide and propene. Appl. Catal. B Environ. 2013, 142–143, 8–14. [Google Scholar] [CrossRef]
  35. Turner, C.; Španěl, P.; Smith, D. A longitudinal study of methanol in the exhaled breath of 30 healthy volunteers using selected ion flow tube mass spectrometry, SIFT-MS. Physiol. Meas. 2006, 27, 637–648. [Google Scholar] [CrossRef] [PubMed]
  36. Kourtelesis, M.; Panagiotopoulou, P.; Verykios, X.E. Influence of structural parameters on the reaction of low temperature ethanol steam reforming over Pt/Al2O3 catalysts. Catal. Today 2015, 258, 247–255. [Google Scholar] [CrossRef]
  37. Garetto, T.F.; Apesteguía, C.R. Oxidative catalytic removal of hydrocarbons over Pt/Al2O3 catalysts. Catal. Today 2000, 62, 189–199. [Google Scholar] [CrossRef]
  38. Strobel, R.; Stark, W.J.; Mädler, L.; Pratsinis, S.E.; Baiker, A. Flame-made platinum/alumina: Structural properties and catalytic behaviour in enantioselective hydrogenation. J. Catal. 2003, 213, 296–304. [Google Scholar] [CrossRef]
  39. Righettoni, M.; Tricoli, A.; Pratsinis, S.E. Thermally stable, silica-doped ε-WO3 for sensing of acetone in the human breath. Chem. Mater. 2010, 22, 3152–3157. [Google Scholar] [CrossRef]
  40. Mädler, L.; Kammler, H.K.; Mueller, R.; Pratsinis, S.E. Controlled synthesis of nanostructured particles by flame spray pyrolysis. J. Aerosol Sci. 2002, 33, 369–389. [Google Scholar] [CrossRef]
  41. Güntner, A.T.; Pineau, N.J.; Chie, D.; Krumeich, F.; Pratsinis, S.E. Selective sensing of isoprene by Ti-doped ZnO for breath diagnostics. J. Mater. Chem. B 2016, 4, 5358–5366. [Google Scholar] [CrossRef] [PubMed]
  42. Güntner, A.T.; Righettoni, M.; Pratsinis, S.E. Selective sensing of NH3 by Si-doped α-MoO3 for breath analysis. Sens. Actuators B Chem. 2016, 223, 266–273. [Google Scholar] [CrossRef]
  43. Güntner, A.T.; Wied, M.; Pineau, N.J.; Pratsinis, S.E. Rapid and Selective NH3 Sensing by Porous CuBr. Adv. Sci. 2020, 7, 19033907. [Google Scholar] [CrossRef] [PubMed] [Green Version]
  44. Ellis, A.M.; Mayhew, C.A. Proton Transfer Reaction Mass Spectrometry; Wiley: New York, NY, USA, 2014; ISBN 9781405176682. [Google Scholar]
  45. Müller, M.; Mikoviny, T.; Feil, S.; Haidacher, S.; Hanel, G.; Hartungen, E.; Jordan, A.; Märk, L.; Mutschlechner, P.; Schottkowsky, R.; et al. A compact PTR-ToF-MS instrument for airborne measurements of volatile organic compounds at high spatiotemporal resolution. Atmos. Meas. Tech. 2014, 7, 3763–3772. [Google Scholar] [CrossRef] [Green Version]
  46. Schwarz, K.; Filipiak, W.; Amann, A. Determining concentration patterns of volatile compounds in exhaled breath by PTR-MS. J. Breath Res. 2009, 3, 027002. [Google Scholar] [CrossRef]
  47. Güntner, A.T.; Koren, V.; Chikkadi, K.; Righettoni, M.; Pratsinis, S.E. E-nose Sensing of Low-ppb Formaldehyde in Gas Mixtures at High Relative Humidity for Breath Screening of Lung Cancer? ACS Sens. 2016, 1, 528–535. [Google Scholar] [CrossRef]
  48. Righettoni, M.; Tricoli, A.; Gass, S.; Schmid, A.; Amann, A.; Pratsinis, S.E. Breath acetone monitoring by portable Si:WO3 gas sensors. Anal. Chim. Acta 2012, 738, 69–75. [Google Scholar] [CrossRef] [Green Version]
  49. Tricoli, A.; Graf, M.; Mayer, F.; Kühne, S.; Hierlemann, A.; Pratsinis, S.E. Micropatterning layers by flame aerosol deposition-annealing. Adv. Mater. 2008, 20, 3005–3010. [Google Scholar] [CrossRef]
  50. Schon, S.; Theodore, S.J.; Güntner, A.T. Versatile breath sampler for online gas sensor analysis. Sens. Actuators B Chem. 2018, 273, 1780–1785. [Google Scholar] [CrossRef]
  51. Vessman, J.; Stefan, R.I.; Van Staden, J.F.; Danzer, K.; Lindner, W.; Burns, D.T.; Fajgelj, A.; Müller, H. Selectivity in analytical chemistry. Pure Appl. Chem. 2001, 73, 1381–1386. [Google Scholar] [CrossRef]
  52. Lee, J.; Jang, E.J.; Kwak, J.H. Effect of number and properties of specific sites on alumina surfaces for Pt-Al2O3 catalysts. Appl. Catal. A Gen. 2019, 569, 8–19. [Google Scholar] [CrossRef]
  53. Yazawa, Y.; Yoshida, H.; Hattori, T. The support effect on platinum catalyst under oxidizing atmosphere: Improvement in the oxidation-resistance of platinum by the electrophilic property of support materials. Appl. Catal. A Gen. 2002, 237, 139–148. [Google Scholar] [CrossRef]
  54. Casapu, M.; Fischer, A.; Gänzler, A.M.; Popescu, R.; Crone, M.; Gerthsen, D.; Türk, M.; Grunwaldt, J.D. Origin of the Normal and Inverse Hysteresis Behavior during CO Oxidation over Pt/Al2O3. ACS Catal. 2017, 7, 343–355. [Google Scholar] [CrossRef]
  55. Touir, H.; Dixmier, J.; Zellama, K.; Morhange, J.F.; Elkaim, P. Bimodal crystal size distribution in annealed r.f. magnetron silicon films: A memory effect of the local order inhomogeneities in the initial amorphous state. J. Non. Cryst. Solids 1998, 227–230, 906–910. [Google Scholar] [CrossRef]
  56. Mei, D.; Kwak, J.H.; Hu, J.; Cho, S.J.; Szanyi, J.; Allard, L.F.; Peden, C.H.F. Unique Role of Anchoring Penta-Coordinated Al3+ Sites in the Sintering of γ-Al2O3-Supported Pt Catalysts. Phys. Chem. Lett. 2010, 1, 2688–2691. [Google Scholar] [CrossRef]
  57. Adibi, P.T.Z.; Zhdanov, V.P.; Langhammer, C.; Grönbeck, H. Transient Bimodal Particle Size Distributions during Pt Sintering on Alumina and Silica. J. Phys. Chem. C 2015, 119, 989–996. [Google Scholar] [CrossRef]
  58. Shannon, R.D. Revised effective ionic radii in halides and chalcogenides. Acta Crystallogr. 1976, A32, 751–767. [Google Scholar] [CrossRef]
  59. Turner, C.; Španěl, P.; Smith, D. A longitudinal study of ammonia, acetone and propanol in the exhaled breath of 30 subjects using selected ion flow tube mass spectrometry, SIFT-MS. Physiol. Meas. 2006, 27, 321–337. [Google Scholar] [CrossRef] [PubMed]
  60. Ferrus, L.; Guenard, H.; Vardon, G.; Varene, P. Respiratory Water Loss. Respir. Physiol. 1980, 39, 367–381. [Google Scholar] [CrossRef]
  61. Butcher, D.R.; Grass, M.E.; Zeng, Z.; Aksoy, F.; Bluhm, H.; Li, W.X.; Mun, B.S.; Somorjai, G.A.; Liu, Z. In situ oxidation study of Pt(110) and its interaction with CO. J. Am. Chem. Soc. 2011, 133, 20319–20325. [Google Scholar] [CrossRef] [PubMed]
  62. Oliaee, S.N.; Khodadadi, A.; Mortazavi, Y.; Alipour, S. Highly selective Pt/SnO2 sensor to propane or methane in presence of CO and ethanol, using gold nanoparticles on Fe2O3 catalytic filter. Sens. Actuators B Chem. 2010, 147, 400–405. [Google Scholar] [CrossRef]
  63. Righettoni, M.; Tricoli, A.; Pratsinis, S.E. Si:WO3 sensors for highly selective detection of acetone for easy diagnosis of diabetes by breath analysis. Anal. Chem. 2010, 82, 3581–3587. [Google Scholar] [CrossRef]
  64. Königstein, K.; Abegg, S.; Schorn, A.N.; Weber, I.C.; Derron, N.; Krebs, A.; Gerber, P.A.; Schmidt-Trucksäss, A.; Güntner, A.T. Breath acetone change during aerobic exercise is moderated by cardiorespiratory fitness. J. Breath Res. 2020, 15, 016006. [Google Scholar] [CrossRef] [PubMed]
  65. Eranna, G.; Joshi, B.C.; Runthala, D.P.; Gupta, R.P. Oxide Materials for Development of Integrated Gas Sensors—A Comprehensive Review. Crit. Rev. Solid State Mater. Sci. 2004, 29, 111–188. [Google Scholar] [CrossRef]
  66. Abegg, S.; Magro, L.; Van den Broek, J.; Pratsinis, S.E.; Güntner, A.T. A pocket-sized device enables detection of methanol adulteration in alcoholic beverages. Nat. Food 2020, 1, 351–354. [Google Scholar] [CrossRef]
  67. Güntner, A.T.; Abegg, S.; Königstein, K.; Gerber, P.A.; Schmidt-Trucksäss, A.; Pratsinis, S.E. Breath Sensors for Health Monitoring. ACS Sens. 2019, 4, 268–280. [Google Scholar] [CrossRef] [PubMed]
Figure 1. (a) XRD patterns of as-prepared pure (black), 1 (blue), 3 (red), 5 (orange) and 10 mol% (green) Pt/Al2O3 particles with reference peaks for cubic Al2O3 (stars), Pt (triangles) and PtO (circles). Note that all spectra were normalized to the Al2O3 peak at 2θ = 67.1°, that is less affected by Pt content. (b) Average crystallite size and (c) relative abundance of small (triangles) and larger (circles) Pt crystals, respectively, as a function of Pt content. Bimodal Pt crystal sizes were calculated using the Scherrer Equation after deconvolution of the Pt peak at 2θ = 39.7° (Figure S1). The abundance was determined from the respective peak areas. (d) Pt/Al2O3 particles size (BET-equivalent, squares) as determined by N2 adsorption and Al2O3 crystal size (stars) as calculated with the Scherrer Equation at 2θ = 67.1° as a function of Pt content.
Materials 14 01839 g001
Figure 2. (a) HRTEM image of 3 mol% Pt/Al2O3. The inset shows the lattice fringes corresponding to the Pt (111) crystal plane. (b) HAADF-STEM image of such Pt/Al2O3 particles. EDXS analysis of the green (c) and blue (d) areas in (b). (e) Particle size distribution as determined from HAADF-STEM, together with the mean geometric diameter (dg), standard deviation (σg) and number (N) of counted particles.
Materials 14 01839 g002
Figure 3. Conversion of 1 ppm ethanol (squares), acetone (circles), isoprene (diamonds) and methanol (triangles) over pure Al2O3 (a) and with 1 (b), 3 (c), 5 (d) and 10 mol% (e) Pt at 90% RH, as determined by PTR-ToF-MS. Error bars in (c) indicate the standard deviations for three identically prepared packed beds. (f) The corresponding temperature of complete conversion (T100%) as a function of Pt loading. Minimum required filter temperature (i.e., 40 °C) to avoid water condensation in breath analysis is indicated as horizontal dashed line.
Materials 14 01839 g003
Figure 4. Exposure to 5–100 ppm ethanol, as detected by the PTR-ToF-MS without (red) and with (blue) the 3 mol% Pt/Al2O3 filter at 40 °C. Note that 50% RH is used instead of 90% due to a limitation of the measurement setup at such high analyte concentrations.
Materials 14 01839 g004
Figure 5. Response of a Si/WO3 sensor to 1 ppm acetone, acetaldehyde, H2, isoprene, CO, methanol, ethanol, formaldehyde and 2-propanol (a) with 30 mg pure Al2O3 (i.e., inactive, Figure 3a) and (b) 3 mol% Pt/Al2O3 (i.e., active, Figure 3c) at 40 °C and 90% RH. Acetone selectivity is shown in parentheses. Note the logarithmic ordinate scale.
Materials 14 01839 g005
Figure 6. (a) Detector (i.e., Si/WO3 sensor with Pt/Al2O3 filter at 40 °C) response to consecutive exposures to 100 and 50 ppb acetone at 90% RH. (b) Detector response to 0.05, 0.1, 0.25, 0.5 and 1 ppm acetone as single analyte (squares) and in mixture with 1 ppm ethanol (circles), methanol (diamonds) and formaldehyde (triangles) at 90% RH. (c) Detector response to 100 ppb acetone at 30–90% RH.
Materials 14 01839 g006
Publisher’s Note: MDPI stays neutral with regard to jurisdictional claims in published maps and institutional affiliations.

