3.2. Cracking and Crack Width
Prism samples were cracked under closed-loop controlled three-point bending tests, and the residual crack widths were measured.
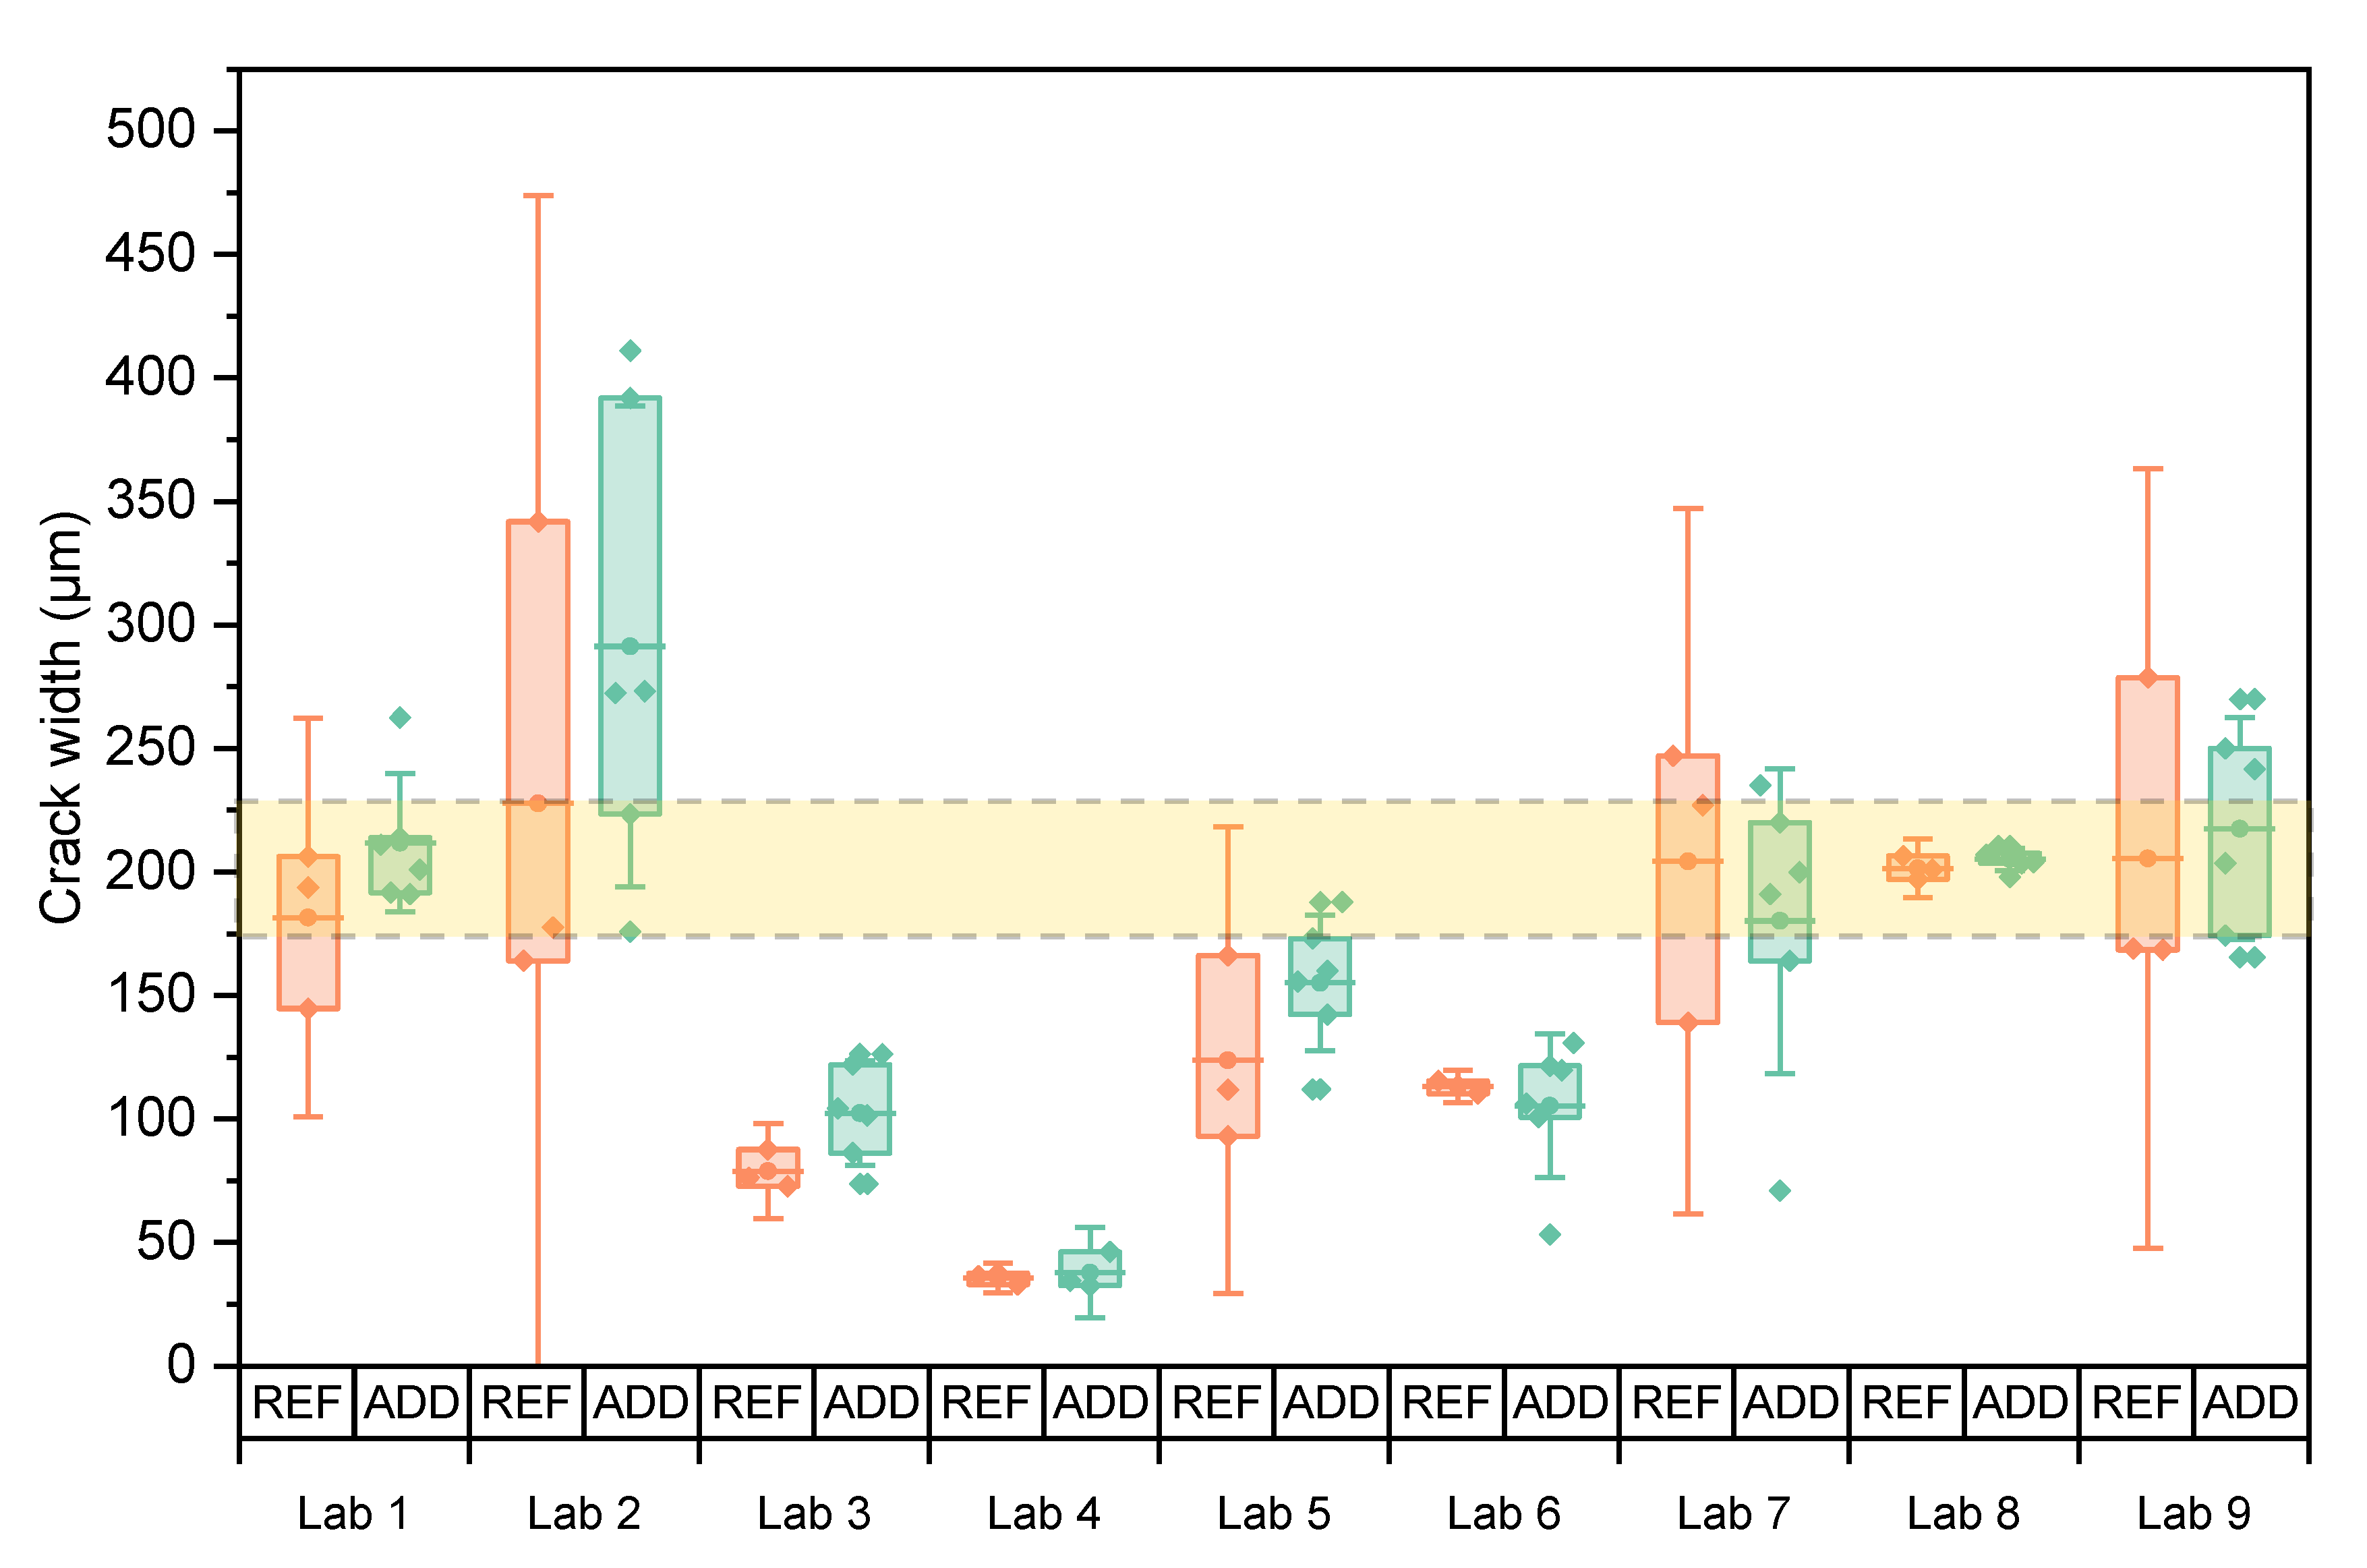
Figure 6 shows the individual mean crack width of each specimen as well as the mean of the series and the 95% confidence interval on this mean (error bars) for both REF and ADD specimens. The area between the two dotted lines indicates the desired crack width. There is evident variation in the results. For each lab, it was statistically analysed if the mean crack width of the REF and ADD series was equal to the target crack of 200 μm (level of significance, LoS = 5%).
Table 7 indicates that this hypothesis was not valid for both the REF and ADD series of Lab 3, 4, 5, and 6. In particular, Lab 4 reported the lowest crack width of all participating laboratories. Most labs used CMOD control to produce the cracks by loading to a higher crack opening (~300–350 μm) and then allowing for elastic recovery due to the presence of fibre reinforcement and closure during unloading. Lab 2 applied an LVDT controlled cracking following a similar loading pattern. When lower openings were targeted such as in the case of Labs 3–6, the load was not enough to force a larger residual crack. Moreover, lab 4 measured the crack opening on the sides of the specimens due to limitations of the microscope used for the size of the samples and the depth of the notch. This could have skewed the measurements towards smaller values. Lab 7 also reported similar difficulties, performing crack monitoring predominantly on the side of the samples rather than on the crack mouth. Considering that both labs used CMOD to control the crack mouth, it can be assumed that the overall crack under loading for Lab 4 was lower than the target 300 μm leading to a lower residual crack opening.
For each lab, independent sample t-test analysis (LoS = 5%) was conducted to assess the difference of the mean crack width of the REF and ADD series.
Table 7 suggests that for all labs, results were not significantly different (
p > 5%). Indeed
Figure 6 shows that within each lab the crack width creation was repeatable, although consistently ADD series reported higher initial crack widths. This could also be a result of the reduced mechanical properties of this mixture [
18,
27]. Lab 6 and Lab 7 reported a reverse trend, yet the coefficient of variation (CV) of the ADD series is consistently higher than the REF specimens. Overall, a high CV was reported for both REF and ADD series in participating labs. This could be ascribed to the addition of steel fibres, since their random orientation and distribution may have affected the cracking behaviour and concurred to increase the variability in the residual crack widths.
To study if there was a significant difference for the crack widths obtained by the different labs, the results of the REF and ADD specimens were taken together. The equality was investigated through ANOVA analysis of means. Equal variances were confirmed by a Levene’s test (LoS = 5%,
p = 13.2%). Tests confirmed that means were not all equal (LoS = 5%,
p~0%). In the post hoc analysis, a Tukey multiple comparison revealed four groups: the means of Labs 2, 9, and 8 were equal (
pmin = 5.6%); the means of Labs 8, 1, 7, and 5 (
pmin = 12.7%) were equal; the means of Labs 5, 6, and 3 (
pmin = 30.6%); and the means of Labs 6, 3, and 4 (
pmin = 26.7%) were equal. Similar results were obtained between the REF and ADD specimens (
p = 22.4%) within each lab, and labs using a higher CMOD obtained (nearly) comparable results. The initial crack width was also assessed for the disc specimens used for the water permeability tests.
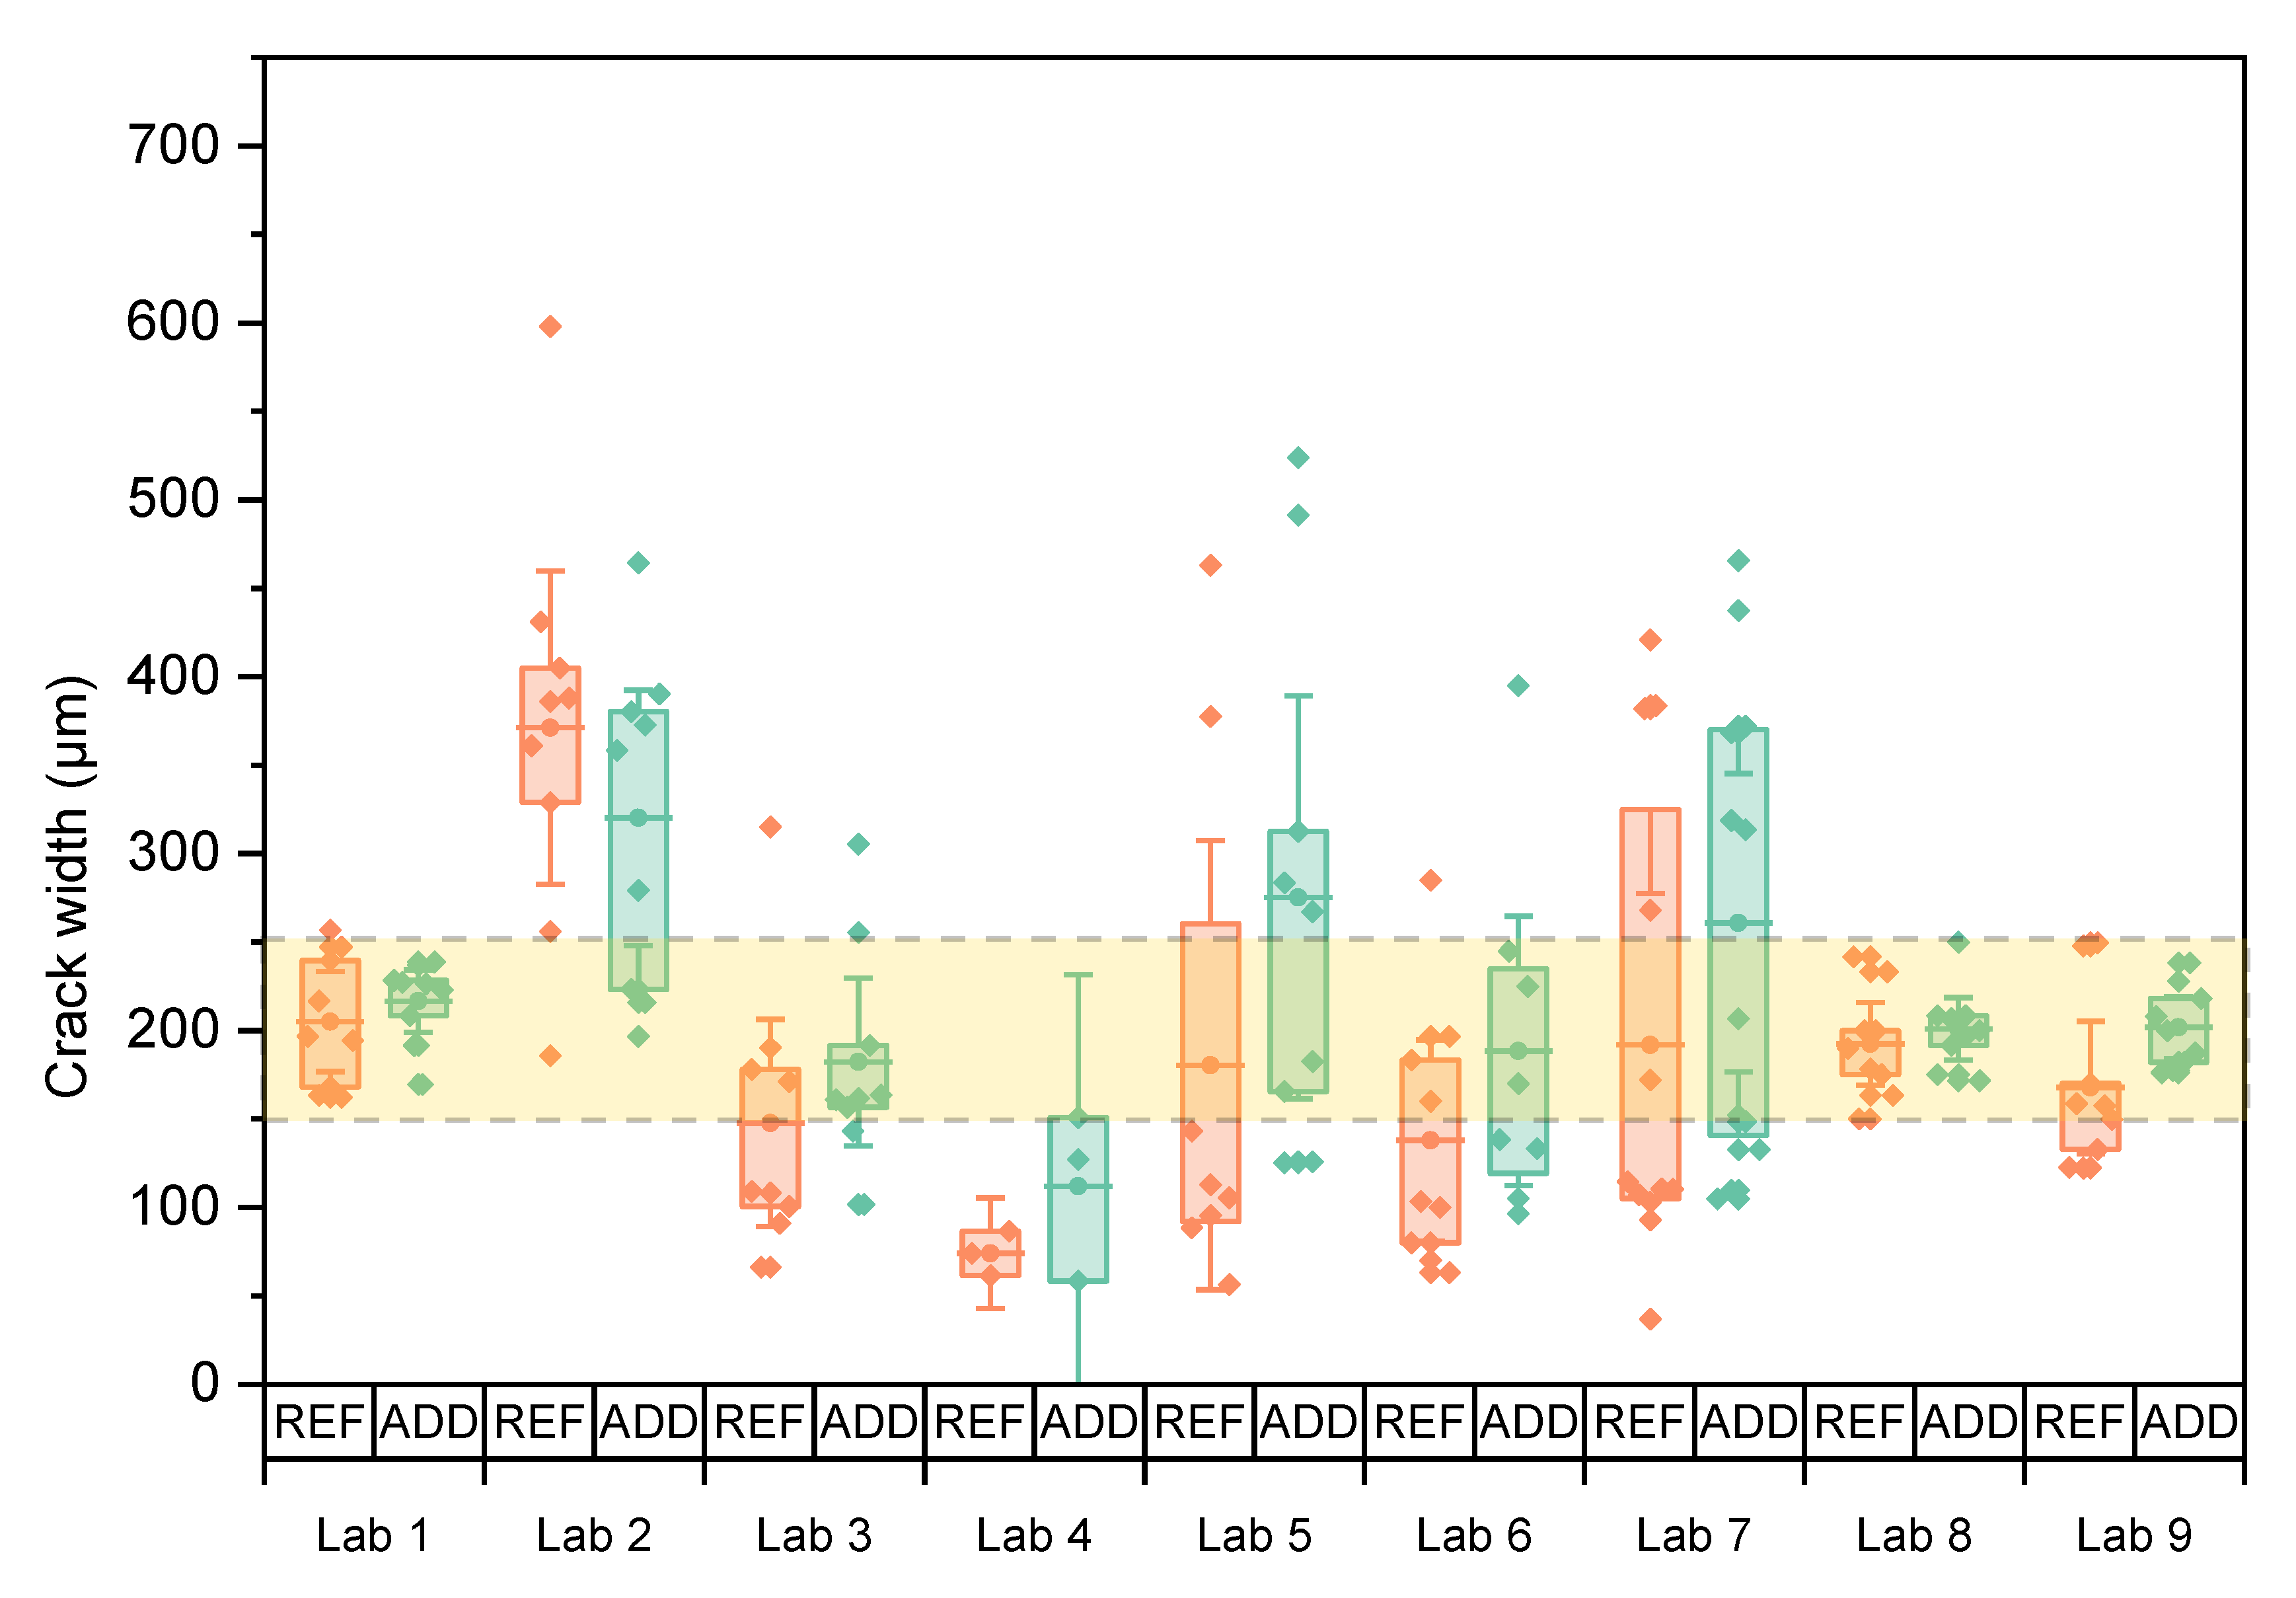
Figure 7 shows individual values as well as the mean crack width of both series with the respective 95% confidence interval. The variation of crack width is higher than the one observed for the prisms even though three maximal outliers (one for Lab 5 REF, one for Lab 6 ADD, and one for Lab 2 REF) were discarded from the dataset prior to plotting this graph and subsequent statistical analysis. Because of the higher variation on the crack width, the water permeability tests were expected to be influenced.
Overall, the execution of the splitting test with passive crack width control was characterized by application difficulties. Labs reported high scattering in crack size along the crack and between the two sides of each specimen. This was reflected in the CV of the reported crack widths. For each lab, it was statistically analysed if the mean crack width was equal to the target crack width of 200 μm (LoS = 5%).
Table 8 indicates that this hypothesis was not valid in the case of the REF and ADD series of Lab 2, the REF series of Lab 4, and the REF series of Lab 6. The crack width of the REF samples was equal to the ADD specimens within each lab, as verified by independent sample tests (LoS = 5%, all
p-values > 15%). Based on this, the REF and ADD values were combined to study if there was a significant difference for the crack widths obtained between different labs. Equal variances could not be assumed (Welch’s test
p~0%). Results showed that not all means were equal (LoS = 5%,
p = 0%). A subsequent post hoc test (Games-Howell pairwise comparison) identified three groupings: Labs 2, 5, and 7 were equal (
pmin = 5.9%); Labs 5, 7, 1, 8, 9, 3, and 6 were equal (
pmin = 24.3%); and Lab 3, 6, and 4 were equal (
pmin = 9.4%). Splitting tests resulted in most labs having crack widths which fell within the desired crack range with similar results obtained between ADD and REF series within each lab (LoS = 5%,
p = 12.9%). However, it should be noted that a large variation remains in reported values, underlining the need for control of the crack width, on both sides of the specimen.
Crack width was monitored for REF and ADD series by all labs over time. It should be noted here that Lab 3 measured crack widths only at
ti and at the end of the final monitoring period. The crack mouth healing following Equation (1) is presented in
Figure 8. Results from all concrete specimens for REF and ADD series were considered together to counterbalance the effect of the increased variability for the disc series. Overall results confirmed an improvement of observed crack sealing with time. Mean CMH increased with healing time, reaching values of 30.5%, 54%, and 66% at 1, 3, and 6 months of healing for the REF series and 27.2%, 50.1%, and 64.8% for ADD series, respectively. Statistical analysis for all the labs across all monitoring intervals confirmed no significant difference in the means of the REF and ADD series (LoS = 5%,
p = 70.8%), with CMH for ADD series ranging from 11.8 to 80.5% and for the REF series from 27.1 to 76.2%, respectively. Further analysis of the REF series indicated that all means across labs were equal (LoS = 5%,
p = 24.4%). However, ADD series showed higher CV (~29%) overall compared to the REF series. The higher variability reflects the higher CV in the measured crack width for the ADD series. Post hoc analysis (Tukey pairwise) identified two groups in terms of performance of the ADD series. Means CMH for Labs 8, 7, 4, 3, 2, 9, 1, and 5 were equal and above 30% (LoS = 5%,
pmin = 22.1%), and, respectively, Labs 4, 3, 2, 9, 1, 5, 6 (
pmin = 31.9%) were equal and between 10–50%. It should be noted that crack width of the ADD series was reportedly higher than the REF series. This could have affected the observed healing.
High levels of healing could be observed for the ADD series reaching 100% as early as 3 months for some of the participating, namely Labs 5, 7, and 8. However, the overall mean crack healing is lower than previously reported in mortar specimen [
18,
27] for the same content of healing agents by weight of cement for the same range of crack sizes and lower than reported by [
17,
21] when these minerals were introduced encapsulated in glass vials. This difference could be attributed to a dilution effect as the total content of healing agent by mass fraction is reduced as we scale up from mortar to concrete specimen. In addition, compared to previous observations [
21,
22], the majority of crack width reduction takes place after 1 month. Moreover, an increase in the duration of healing proved to be beneficial to the observed performance. For Lab 4 (13 months healing) and Lab 7 (10 months of healing), the presence of additions appeared to be most beneficial. Concurrently, although it could be assumed that as the matrix ages the volume of healing compounds formation decreases reducing the self-healing performance, the ADD series reported consistent healing even for older age cracking. Labs 7 and 8 reported above 70% mean crack width reduction after 6 months of healing. Similarly, Lab 9 reported CMH up to 80% for ADD series after 6 months of healing.
3.3. Capillary Water Absorption of Concrete
Figure 9 shows the average cumulative water infiltration for the specimens of all nine labs at time
ti for REF, ADD and UNCR series. All samples were waterproofed with aluminium tape. In the case of the cracked series (REF and ADD), the average was calculated using the results of 3 and 6 specimens, respectively. For the uncracked series (UNCR), the results of 3 samples were used. Results showed significant variability between the participating laboratories. A closer look at the cumulative water infiltration for the UNCR series at
ti allows for a better comparison of the repeatability and reproducibility of the method, removing the effect of the crack width opening on the behaviour of the samples (see
Figure 10). Overall, most labs reported similar trends up to 6 h with exception of Lab 4 and Lab 3.
The latter exhibited almost a twofold increase of water uptake at 24 h compared to other labs for the same series. Lab 8 on the other hand showed the lowest uptake. It should be noted that the age of the specimens at the moment of initial testing (
ti) was 2 months for Labs 3 and 8, and 6 months for Lab 9. All other labs performed the first capillary absorption test at the age of 1 month. A higher degree of hydration and densification of the structure could have resulted in a lower sorptivity [
38]. Nonetheless, there is a significant difference in cumulative water infiltration between Lab 3 and 8 with the former reporting 12.5 times higher total infiltration than the latter. At the same time, Lab 9 reported values on the lower range of the investigated laboratories but still higher than Lab 8. The water ingress for Lab 8 might have been slightly different as these specimens were not tested with a notch. This could have reduced the overall area of the concrete in contact with the water and thus affected the observed results. However, the variation of the uncracked series of the lab, though surprising, can be explained by operator sensitivity and imperfect waterproofing. The former can be exacerbated by systematic errors and different environmental factors as previously reported by [
10].
Herein difficulties were reported by most laboratories in handling the samples due to the size and weight of the specimens. The prescribed measuring intervals could be fulfilled only by adopting a time offset for the initial measurement instants, in such a way to allow for a correct handling of the specimens [
10]. Moreover, the presence of sharp fibres protruding from the surface of the samples exacerbated the operating errors as it affected the quality of the waterproofing. Some labs who removed the aluminium tape immediately after testing noted that the concrete was moist in certain areas away from the crack and where the fibres had penetrated the tape. Moreover, capillary water uptake between the tape and the specimen was also frequently observed close to the sides, depending on how the tape was applied.
Comparing UNCR with REF and ADD series for all labs, it clearly appears that the presence of the crack increases the water uptake. In fact, a linear relationship between crack width and sorption coefficient has been reported [
39]. Although crack widths were controlled during cracking, there is still variation on the reported ranges which will reflect on the observed water uptake. In all labs, the REF and ADD series showed higher water infiltration compared to the UNCR, with ADD series showing higher water uptake as higher crack openings have been observed. Concurrently, the presence of bentonite could account for the increase in water uptake due to its high water absorption properties [
21]. However, surprisingly Lab 6 reported higher water uptake for the UNCR series compared to both REF and ADD series. This further highlights the importance of correct waterproofing and the limitations due to the use of traditional aluminium waterproofing tapes. Work completed as part of another interlaboratory testing within SARCOS (Salt Lake City, UT, USA) [
10] considered the influence of the nature of waterproofing on the sorptivity results, observing a significant reduction in variability when coating with a waterproofing resin was adopted instead.
The sorptivity coefficient was monitored as a function of healing time. It should be noted here that due to COVID-19 interruptions the last healing period was extended for some of the participating laboratories: Lab 3 (9 months), Lab 4 (13 months), Lab 6 (12 months), and Lab 7 (10 months). To calculate the sealing efficiency, the slope of linear regression curve was determined as prescribed by EN 13,057 from 10 min to 24 h. Results are reported in
Figure 11. The measured sorptivity coefficient values reflected the variability observed in crack widths and testing process. For each lab, results were statistically analysed to understand the overall trends and influence of additives and healing period on the observed sorption values. Post hoc analysis (Tukey pairwise) identified three separate groups (LoS = 5%): results from Labs 3 and 4 (
pmin = 12.1%); Labs 6, 1, 7, 5, 9, and 2 (
pmin = 44.4%); and Labs 7, 5, 9, 2, 8, and 1 (
pmin = 5.1%) were statistically equal. No lab was distinctly different. However, Labs 3 and 4 consistently reported higher sorption values compared to the other participating laboratories. Overall trends of the means (
Figure 12) confirmed a general reduction of sorptivity coefficient with time. However, labs showed fluctuations of the reported sorptivity after 1 month of healing. Labs 1, 2, 3, and 7 showed the same or increased sorption coefficients between 1 and 3 months of healing. On the other hand, Labs 4, 5, and 8 showed a consistent decrease of sorption with increasing healing time for all series. Surprisingly, Lab 6 showed an increase of all observed sorption coefficients after 1 month of healing with significant variation of the results. This was attributed to an error during preliminary testing at time 0. Lab 6 was then excluded from further considerations regarding the sealing efficiency. Regardless across all labs, values after 6 months of healing confirm an improved performance for both REF and ADD series. However, when longer periods of healing are adopted (for example by Lab 3 and Lab 4), an increase in sorption coefficients is evident across all series. This was more pronounced for the ADD series. Generally, the mean sorptivity coefficient values of the ADD series were higher than the reference ones.
From these sorptivity coefficients, the sealing efficiency was calculated for each lab and series, as given in
Figure 13. The sealing efficiency was calculated for each lab for the REF and ADD series. The results confirmed the improvement of the sealing with time in agreement with CMH observations. Statistical analysis across all labs and monitoring times, confirmed that there is no statistical difference (LoS = 5%,
p = 93.2%) between observed sealing efficiency for the REF and ADD series. However, the presence of mineral healing additions can more consistently improve healing in the long term. In particular, after 6 months of healing, the mean SE for the ADD series ranged from 35 to 73.9%, while for the REF series, from 10 to 71.3%, respectively. This confirms previous observations by [
22] on healing performance determined from sorptivity coefficient measurements for the same mineral additives. Nonetheless, compared to previous work on mortars where a higher sealing of ~90% was seen, the reported improvement herein is lower, highlighting the influence of healing agent dilution in a concrete matrix.
3.4. Water Permeability
Disc specimens (ADD and REF series) were subjected to water flow tests after cracking, at the prescribed healing time intervals.
Figure 14 shows the water flow rate (mL/min) leaking from the samples during the test at time
ti and after 1, 3, and 6 months of healing in water, respectively. It should be noted here that due to COVID-19 interruptions 6 months measurements were postponed for two of the participating laboratories (Lab 4 and Lab 7). Moreover, 3 months measurements could not be taken for Lab 9. The variation of the water flow was significantly higher than for the crack width; see
Table 9 for comparison at
ti. The crack width was measured only at the surface of the specimens, while the flow is also influenced by the internal crack geometry (tortuosity). Even for low variations of crack width, the flow variation through the crack can be a magnitude higher [
40]. Moreover, labs reported difficulties controlling the crack propagation on the side of the disc specimens. Even though care was taken to waterproof and seal the sides of the crack, some water could be seen escaping from the sides giving higher flow rates, such as in the case of Lab 9. On the other hand, Lab 2 reported minimal flow rates, even though it showed the largest crack width amongst all labs. This lab observed that the acrylic sealant used to waterproof the sides had penetrated the length of the crack and sealed part of it internally. Moreover, most labs used a temperature of 40 °C to pretreat the samples for 24 h before the water permeability test. However, the pretreatment conditions could also affect the water flow influencing water absorption into the matrix. This effect of pretreatment was investigated by Lab 6. This lab reported a higher water flow at the second monitoring interval, which was attributed to the highly saturated condition of the samples between
ti and 1 month. Samples at
ti could be affected by storing conditions leading to higher water absorption until saturation was reached. It was then suggested that water flow measurements are done twice to allow saturation of the sample and cancel any effects of pretreatment or storage. Then, measurements were only recorded from the second run for interpretation purposes.
Considering the overall performance of both series, the sealing efficiency was calculated for all labs (
Figure 15). It can be shown that in terms of SE
flow results of Lab 2 fall in line with the other labs. The mean sealing efficiency for the REF series varied from 25.3 to 85.7% and for the ADD series from 17.8 to 77.8%. This confirms the literature reporting up to 75% regain in liquid tightness when MgO-based minerals are considered measured, however with the gas permeability test [
18,
27]. There is significant improvement of healing reported with time with a more than two-fold increase from 1 to 6 months of healing. This correlates with observations for CMH and is in agreement with the previous findings by [
21], reporting an accelerated rate of healing from 28 to 56 days. Moreover, the use of the same type of MgO within the same range of content has been shown previously to improve crack area healing by 74–99% between 14 and 56 days of healing [
22]. Interestingly, REF and ADD series are comparable with no significant difference in the means overall (
p = 84.3%). Nonetheless, the effect of additions appears more beneficial after 3 months of healing, with ADD series reporting consistently higher mean SE
flow (58.1%) compared to the REF series (51.4%). Moreover, for later age of cracking (6 months) as reported by Lab 9, the presence of additions gave significant SE
flow (~48%), even as early as 1 month of healing compared to the REF series (7%).
Overall, results reveal that the sealing efficiency can be promising with the ADD series with individual labs reporting even 100% healing as early as 1 month (Lab 3 and Lab 5). However, the variability needs to be controlled. The imperfect cracking had the same effect on results as reported earlier in sorptivity tests. The effect of additions on the mechanical strength leading to wider cracks hindered direct performance comparison. It is further expected that an increase in self-healing agent fraction to counteract the dilution effect could further improve the healing reported. Finally, it should be remarked that for most operators in the different labs, this was the first time to work with this kind of healing material, in this scale, and with this kind of testing method. Familiarity with technique would harmonize results.


 ,
, 


