
Potential of Metallurgical Gradients in the Design of Structural Components Made of Nodular Cast Iron

 , , and
Abstract
:1. Introduction
1.1. Origin and Control of Metallurgical Gradients in Ductile Cast Iron
1.2. Influence of MG on the Mechanical Properties of DCI
1.3. Calculating Component Strength Considering MG
2. Materials and Methods
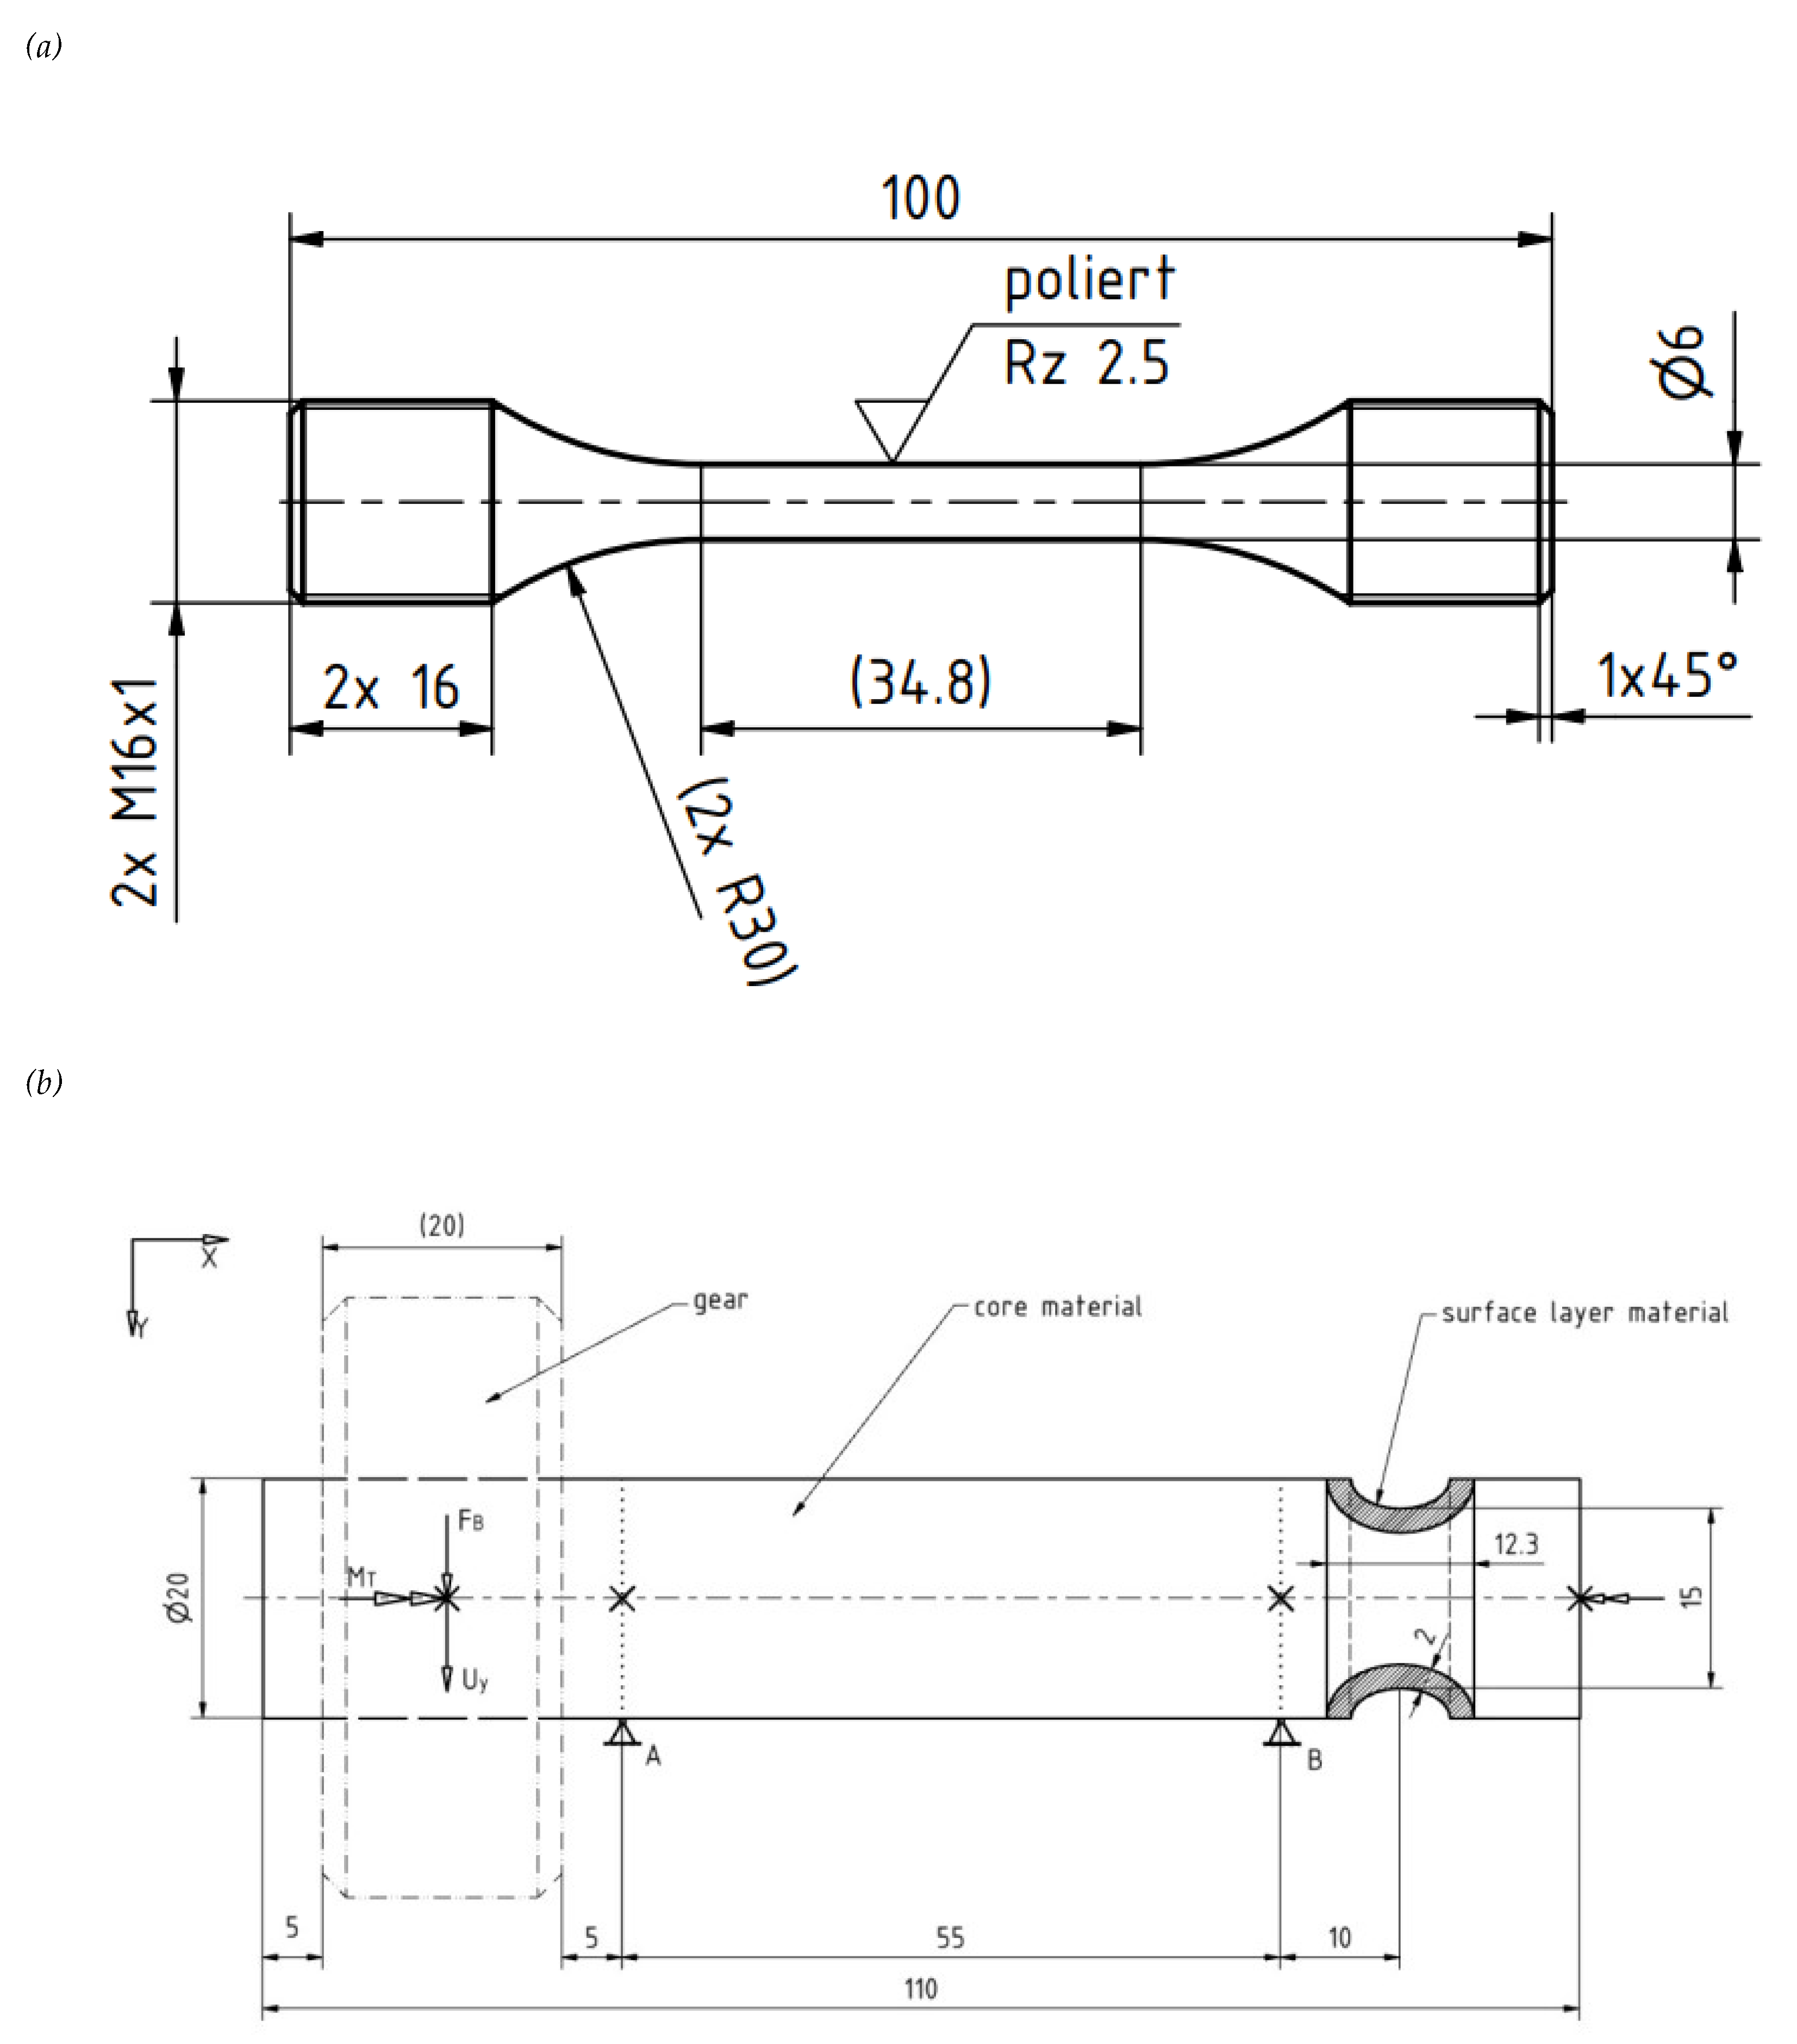
2.1. Materials
2.2. Mechanical Properties
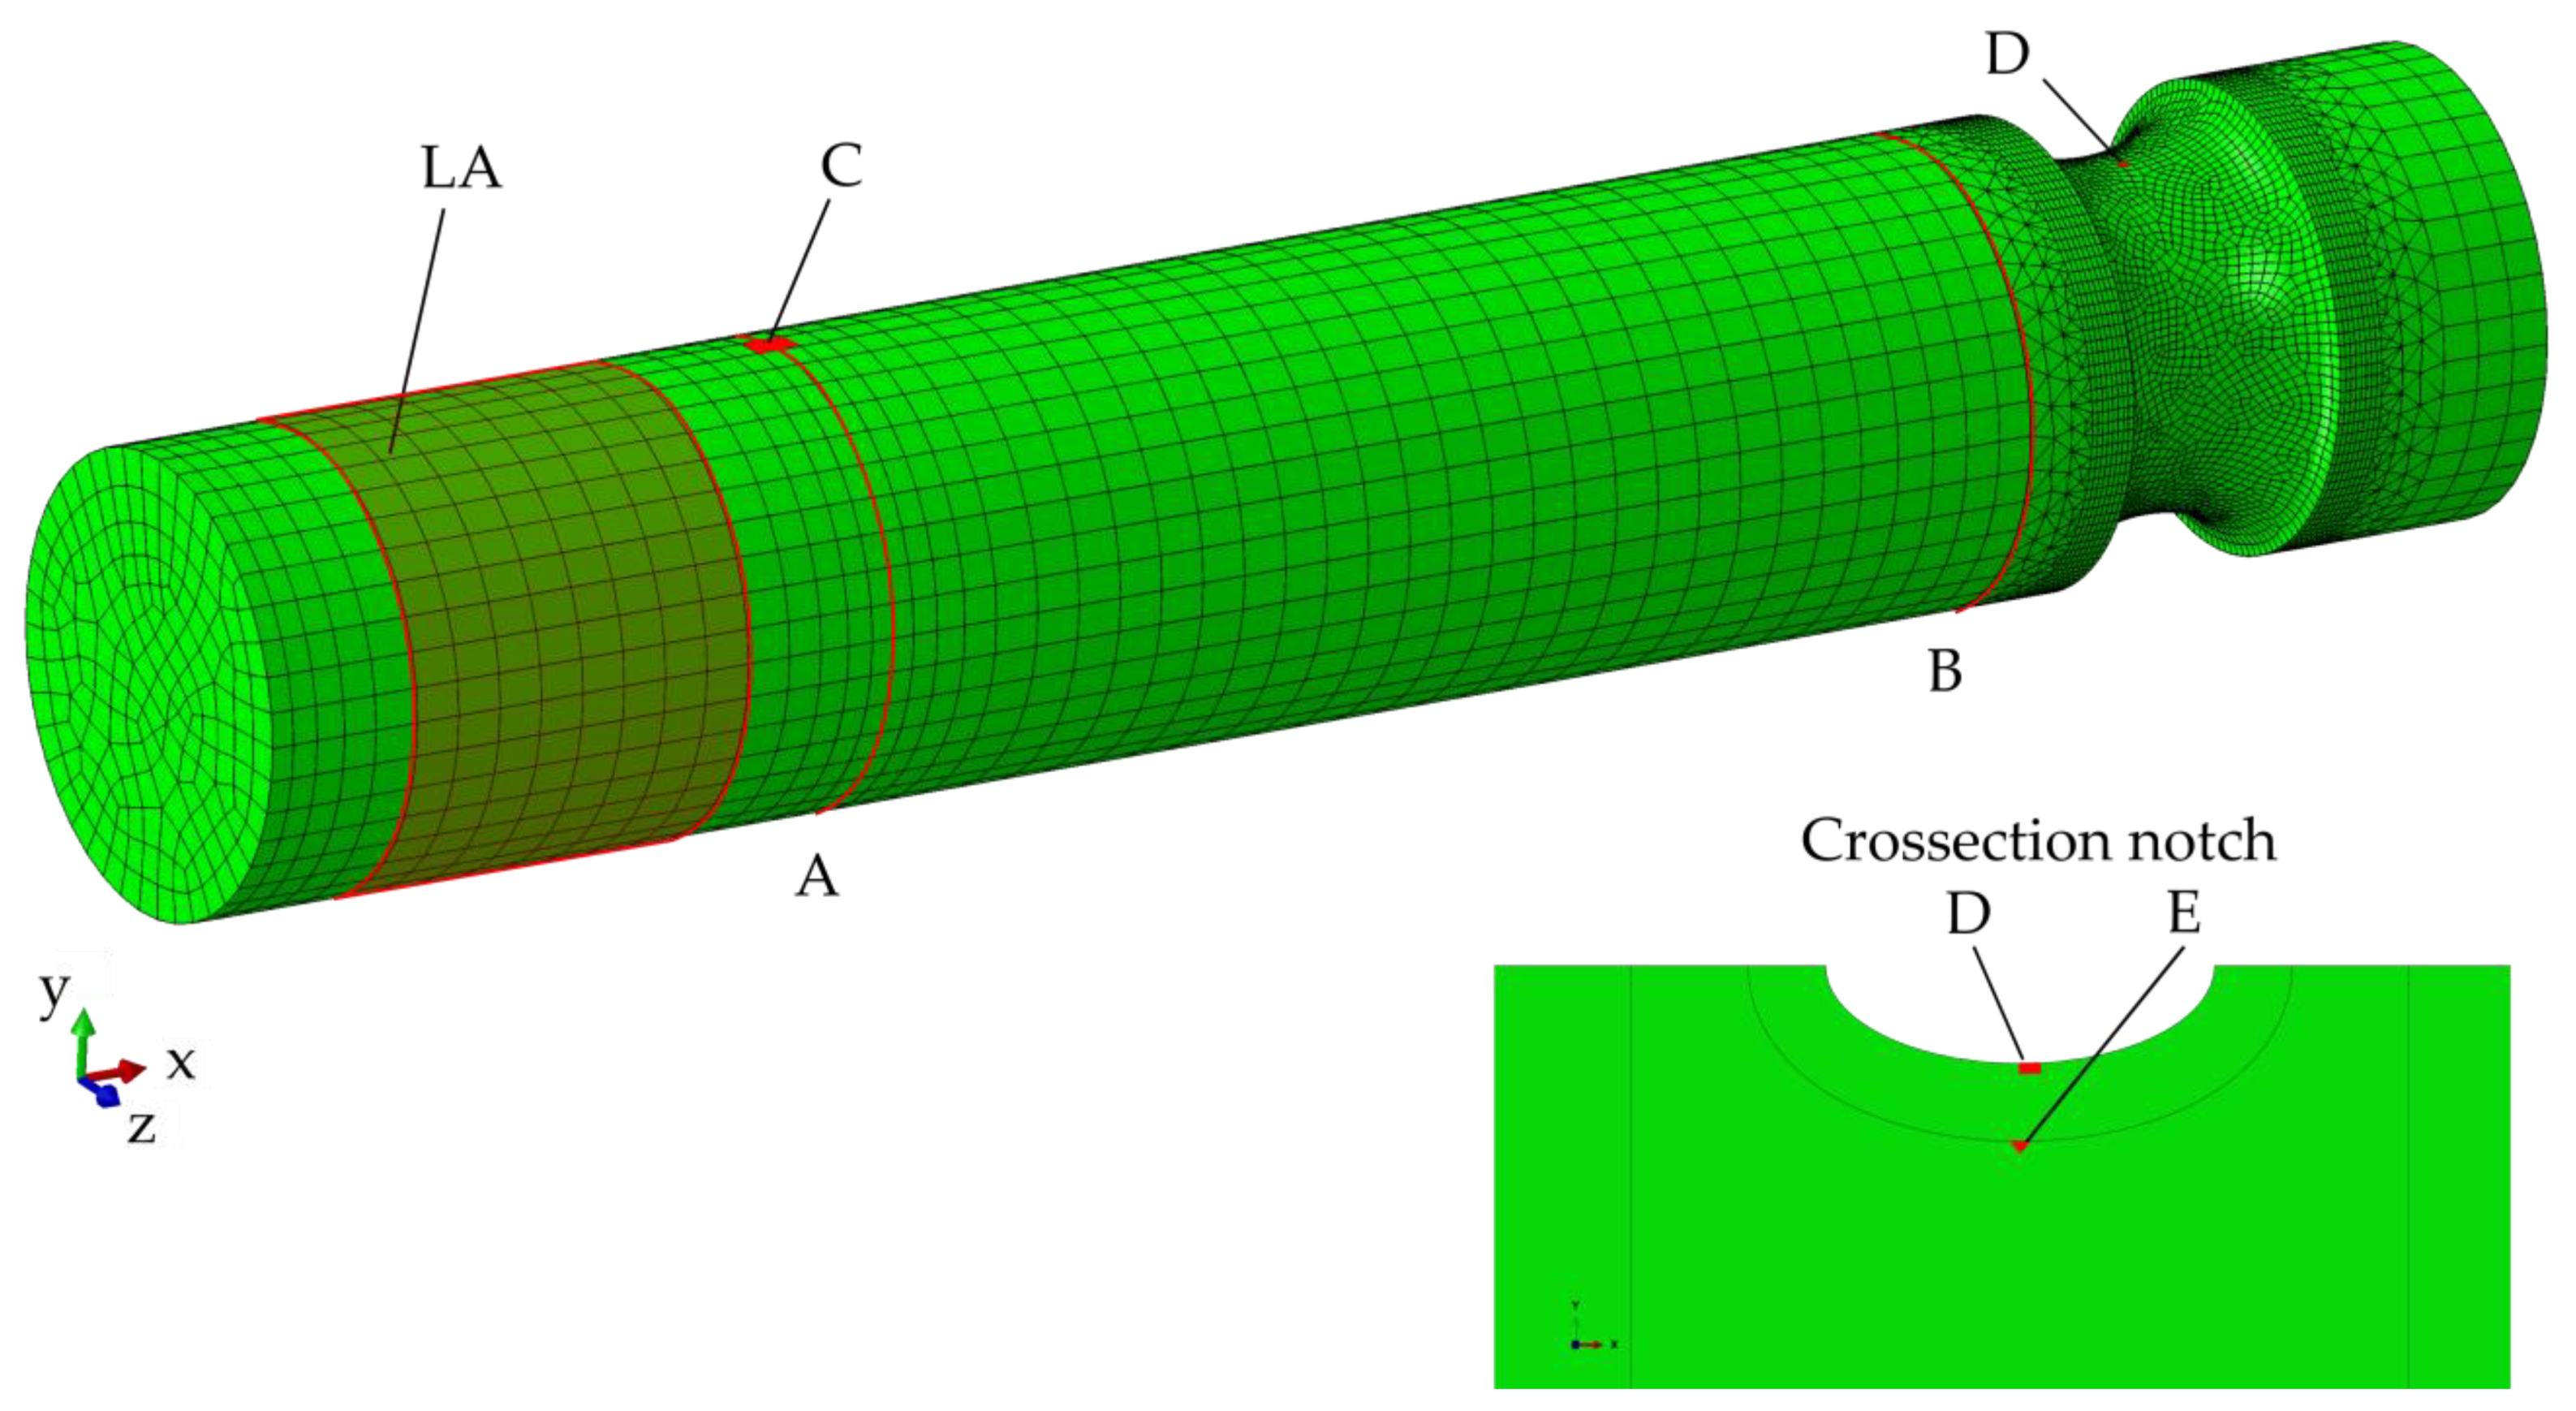
2.3. Finite Element Model
3. Results
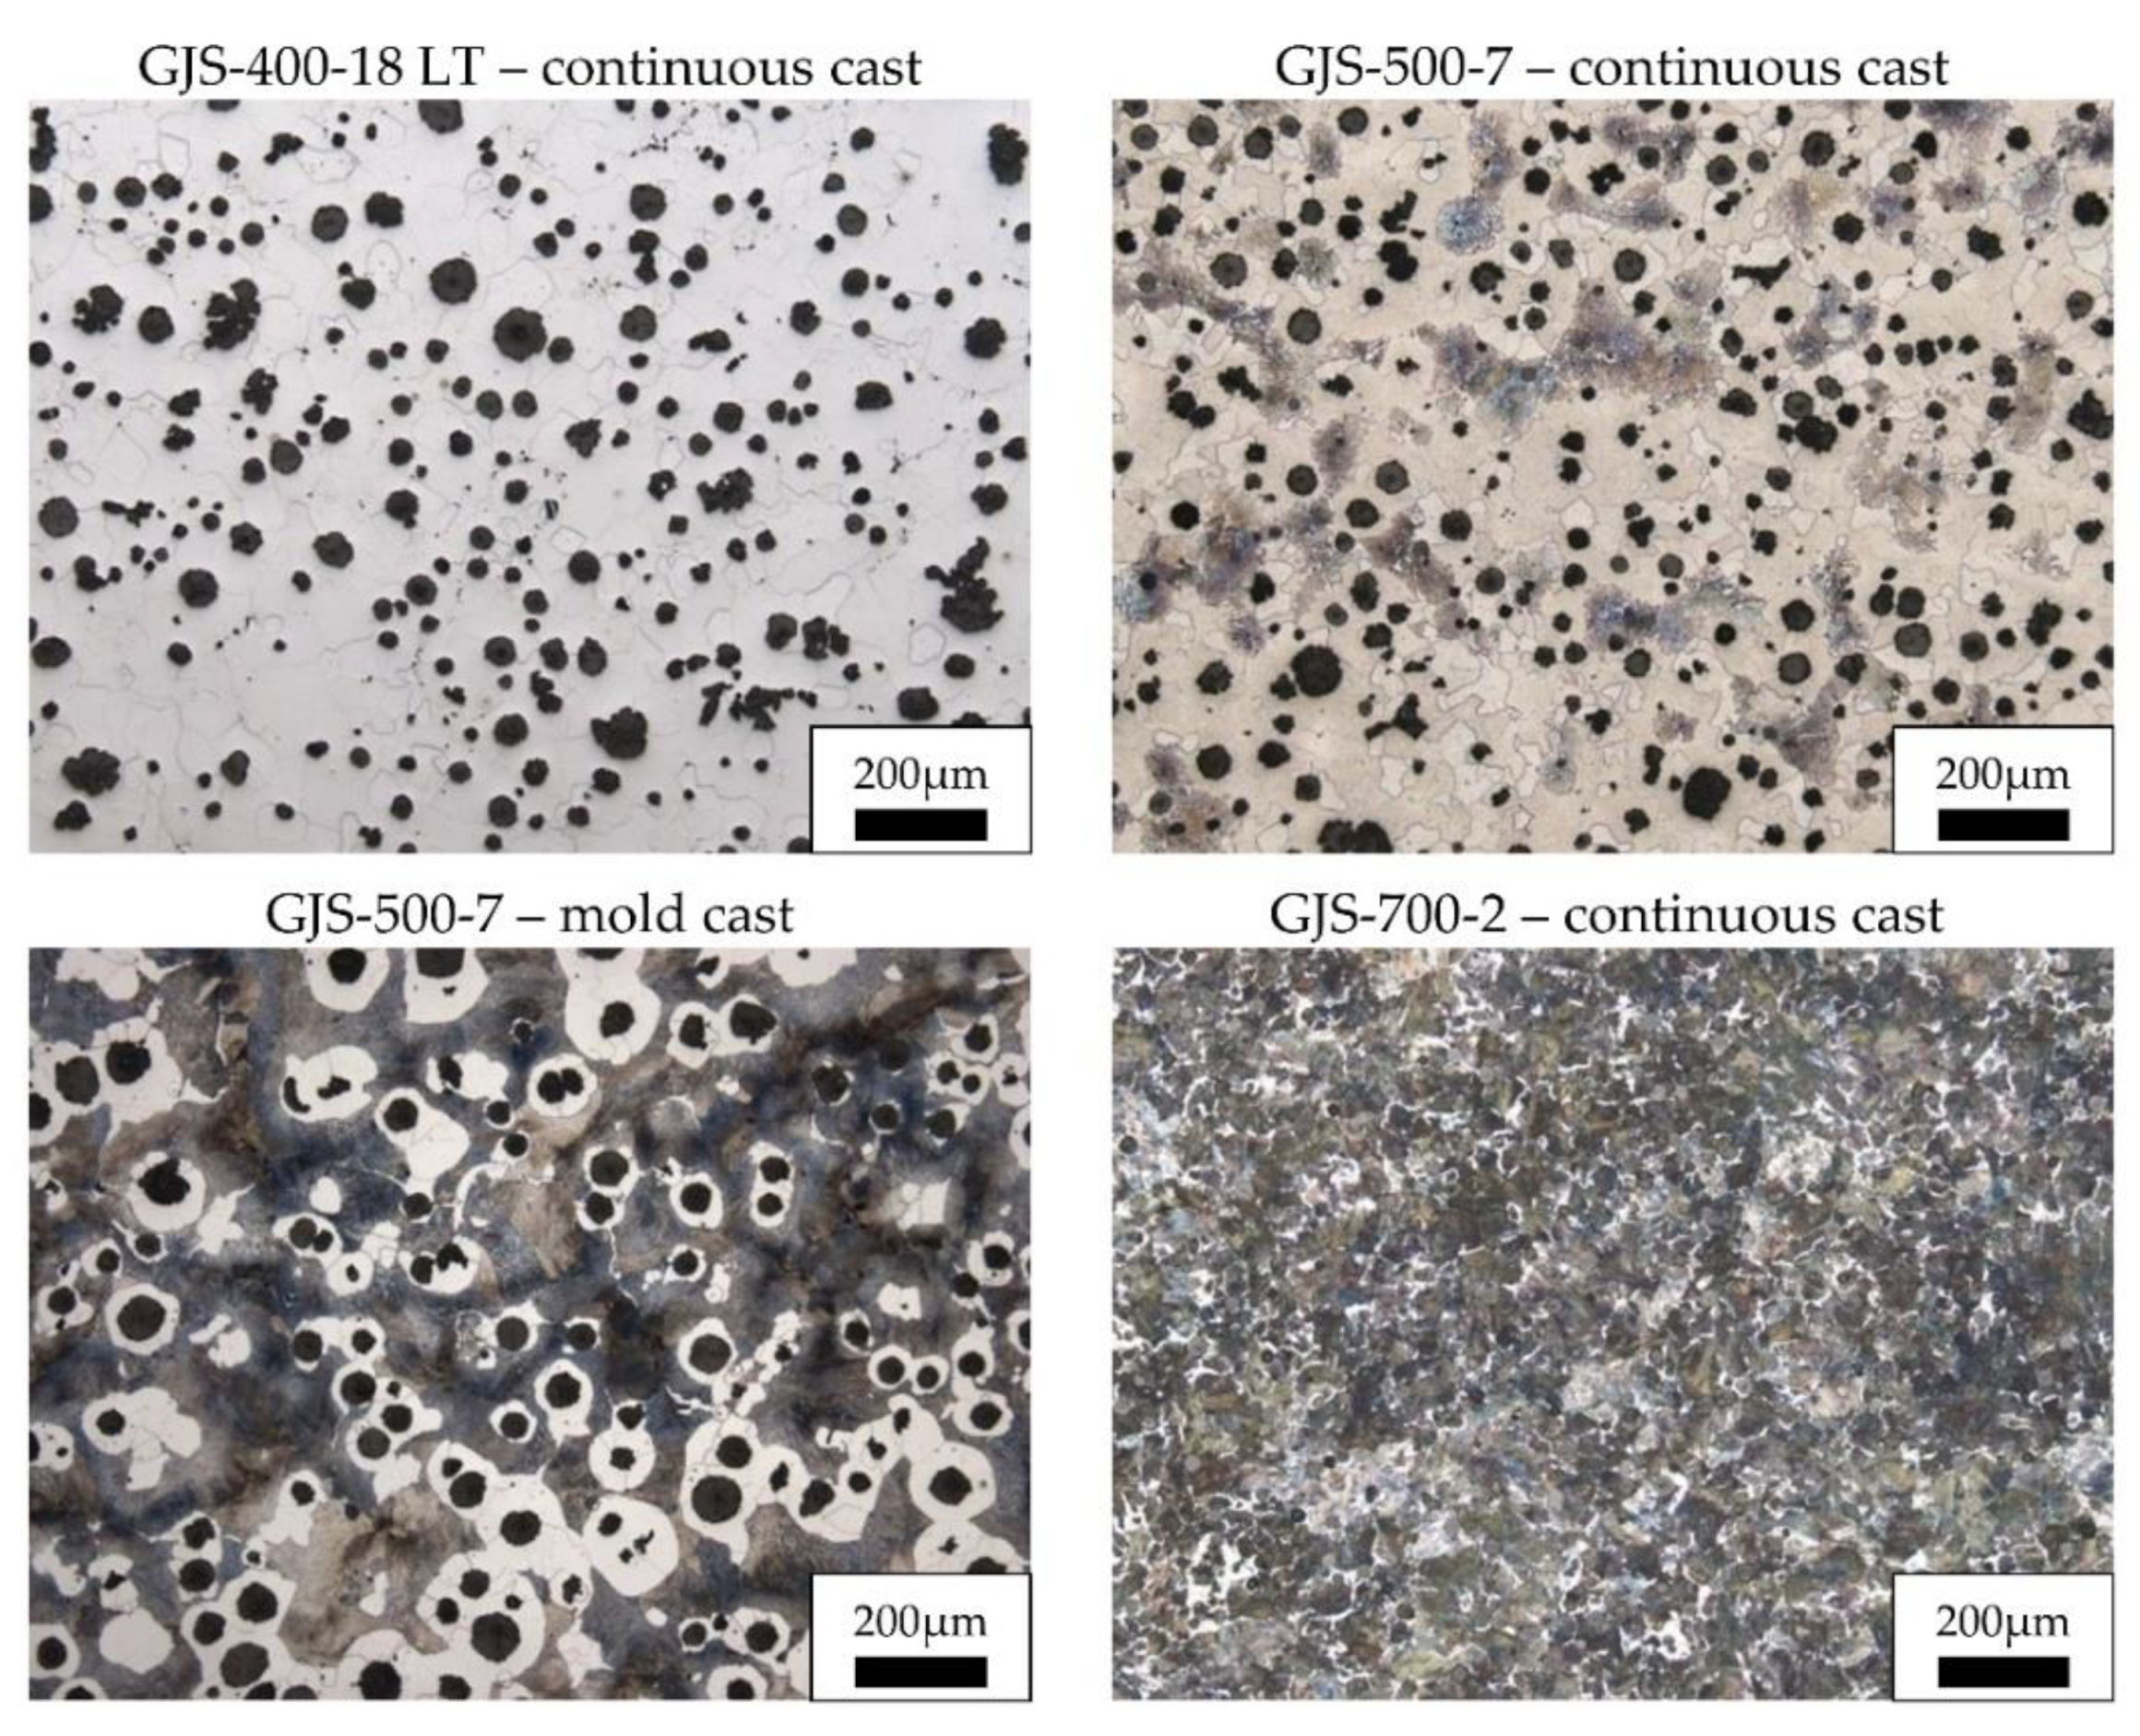
3.1. Quantitative Microstructure Analysis
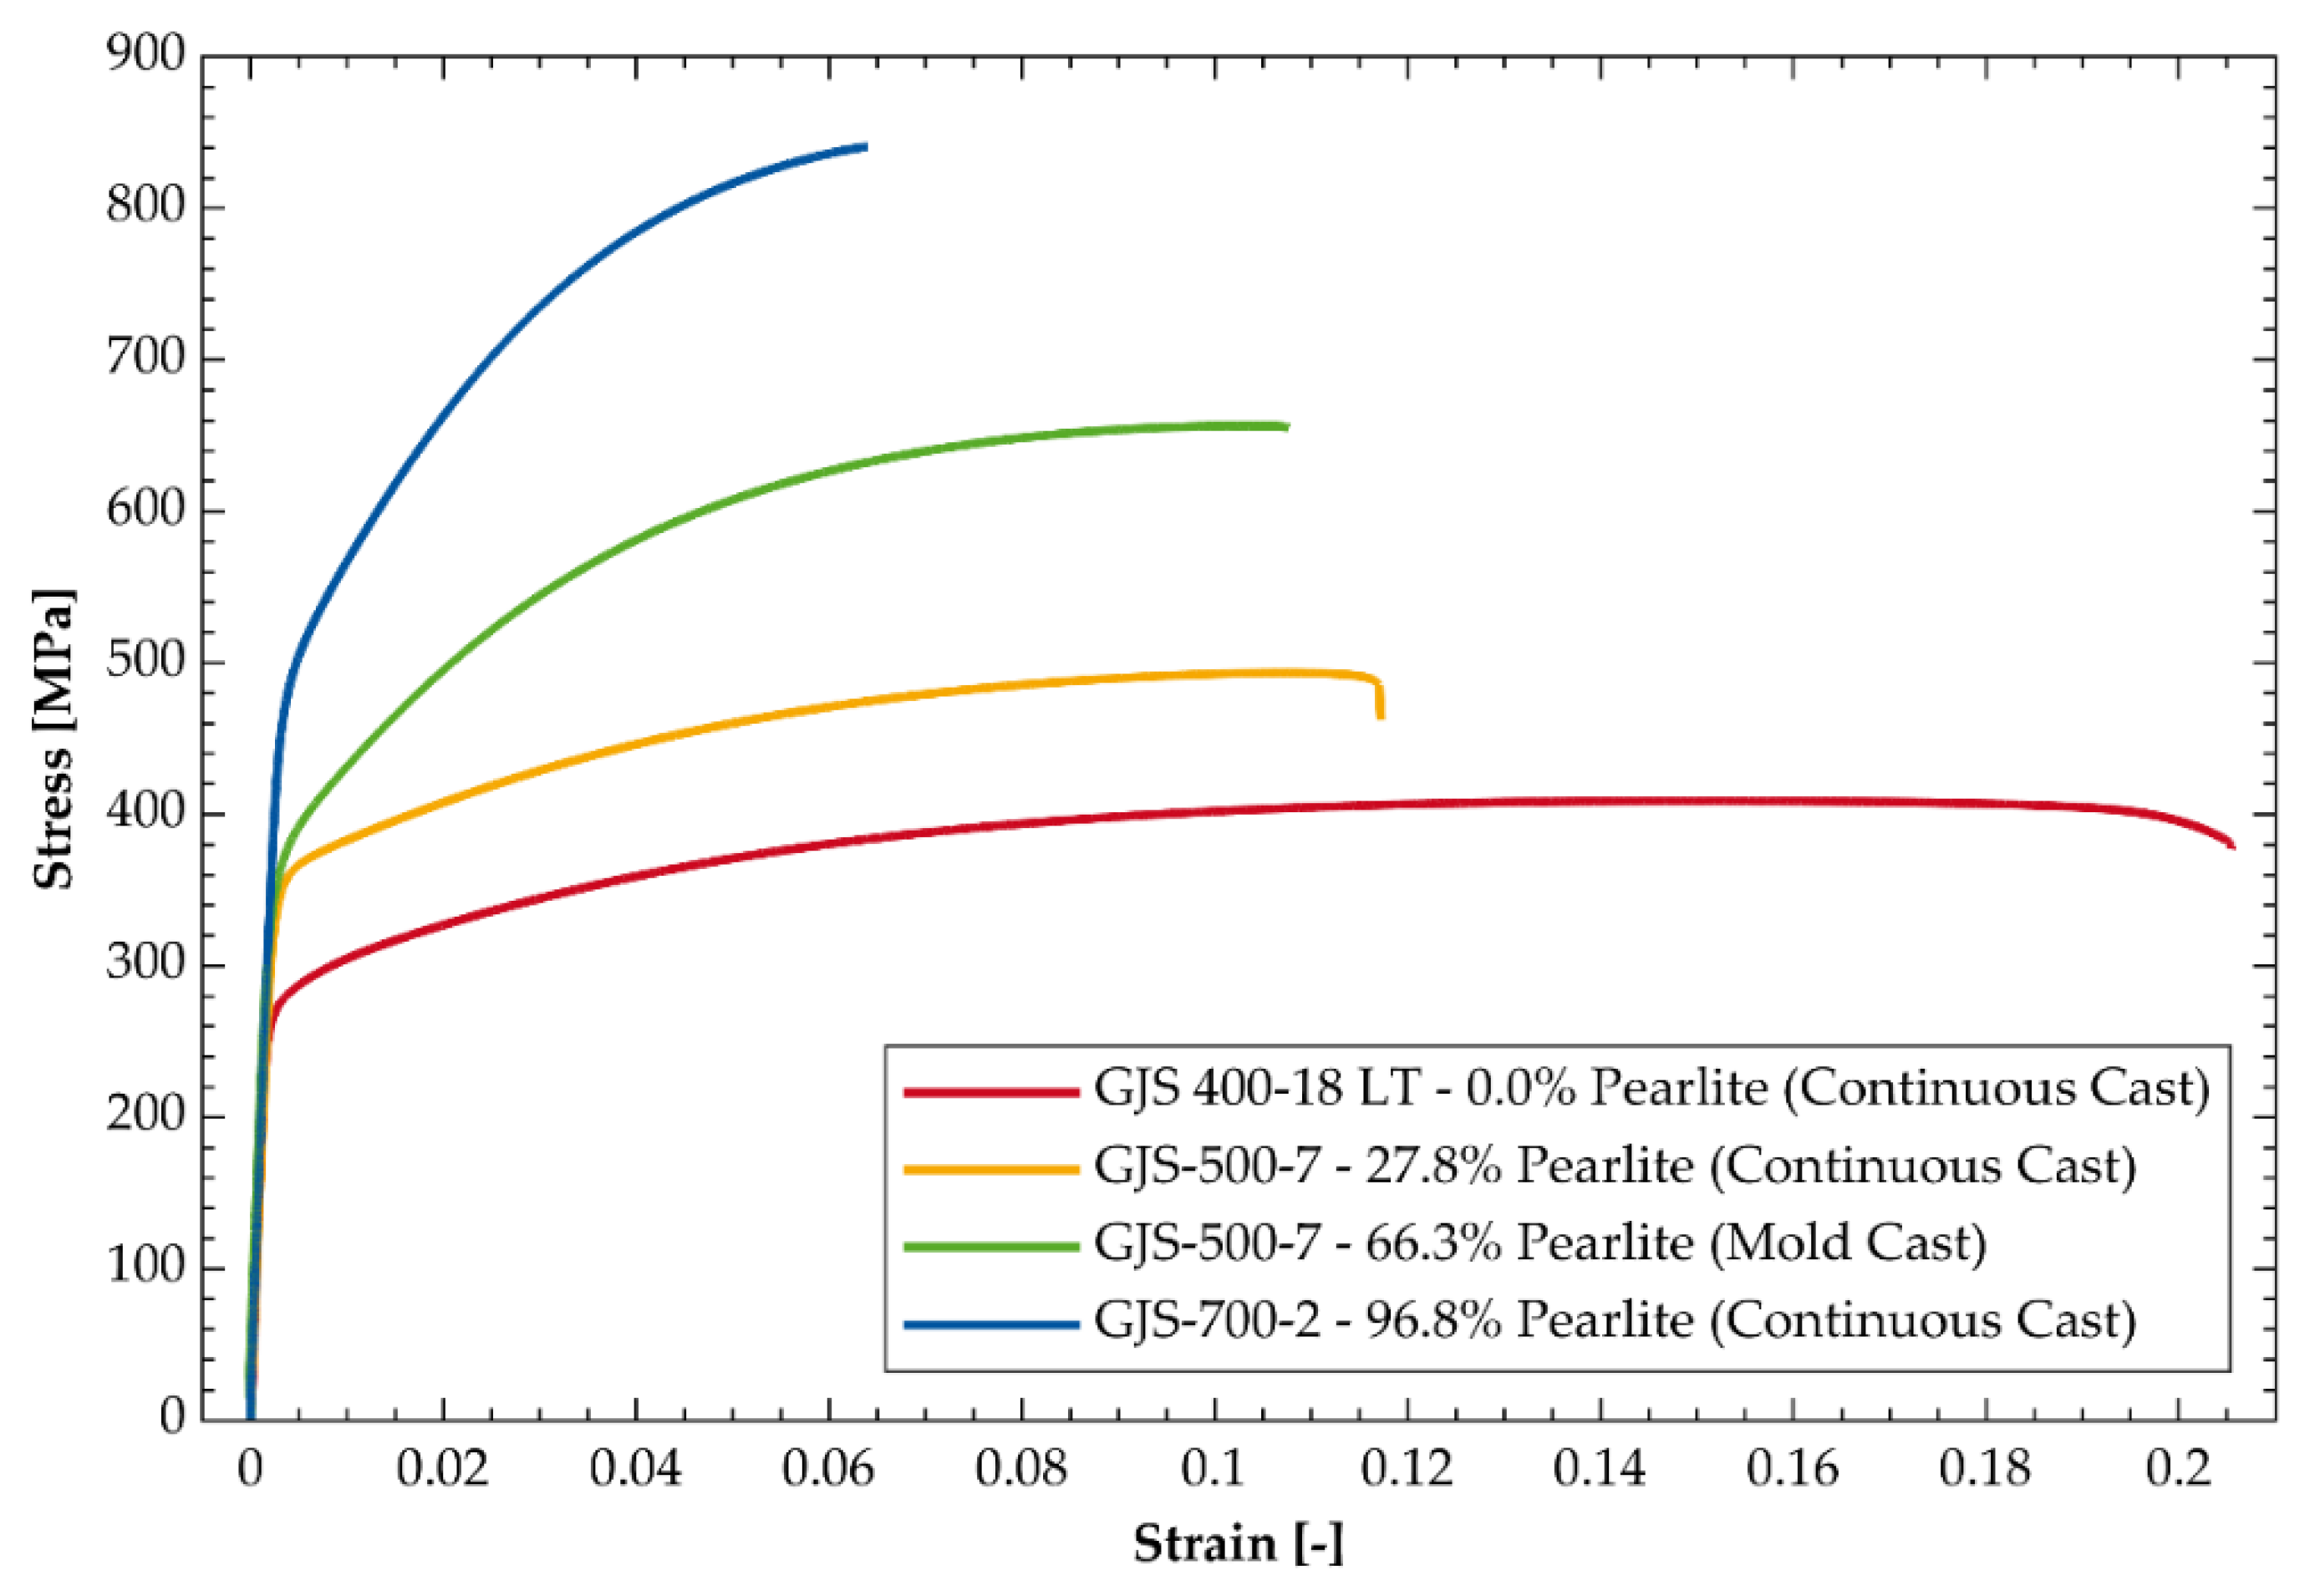
3.2. Tensile Tests
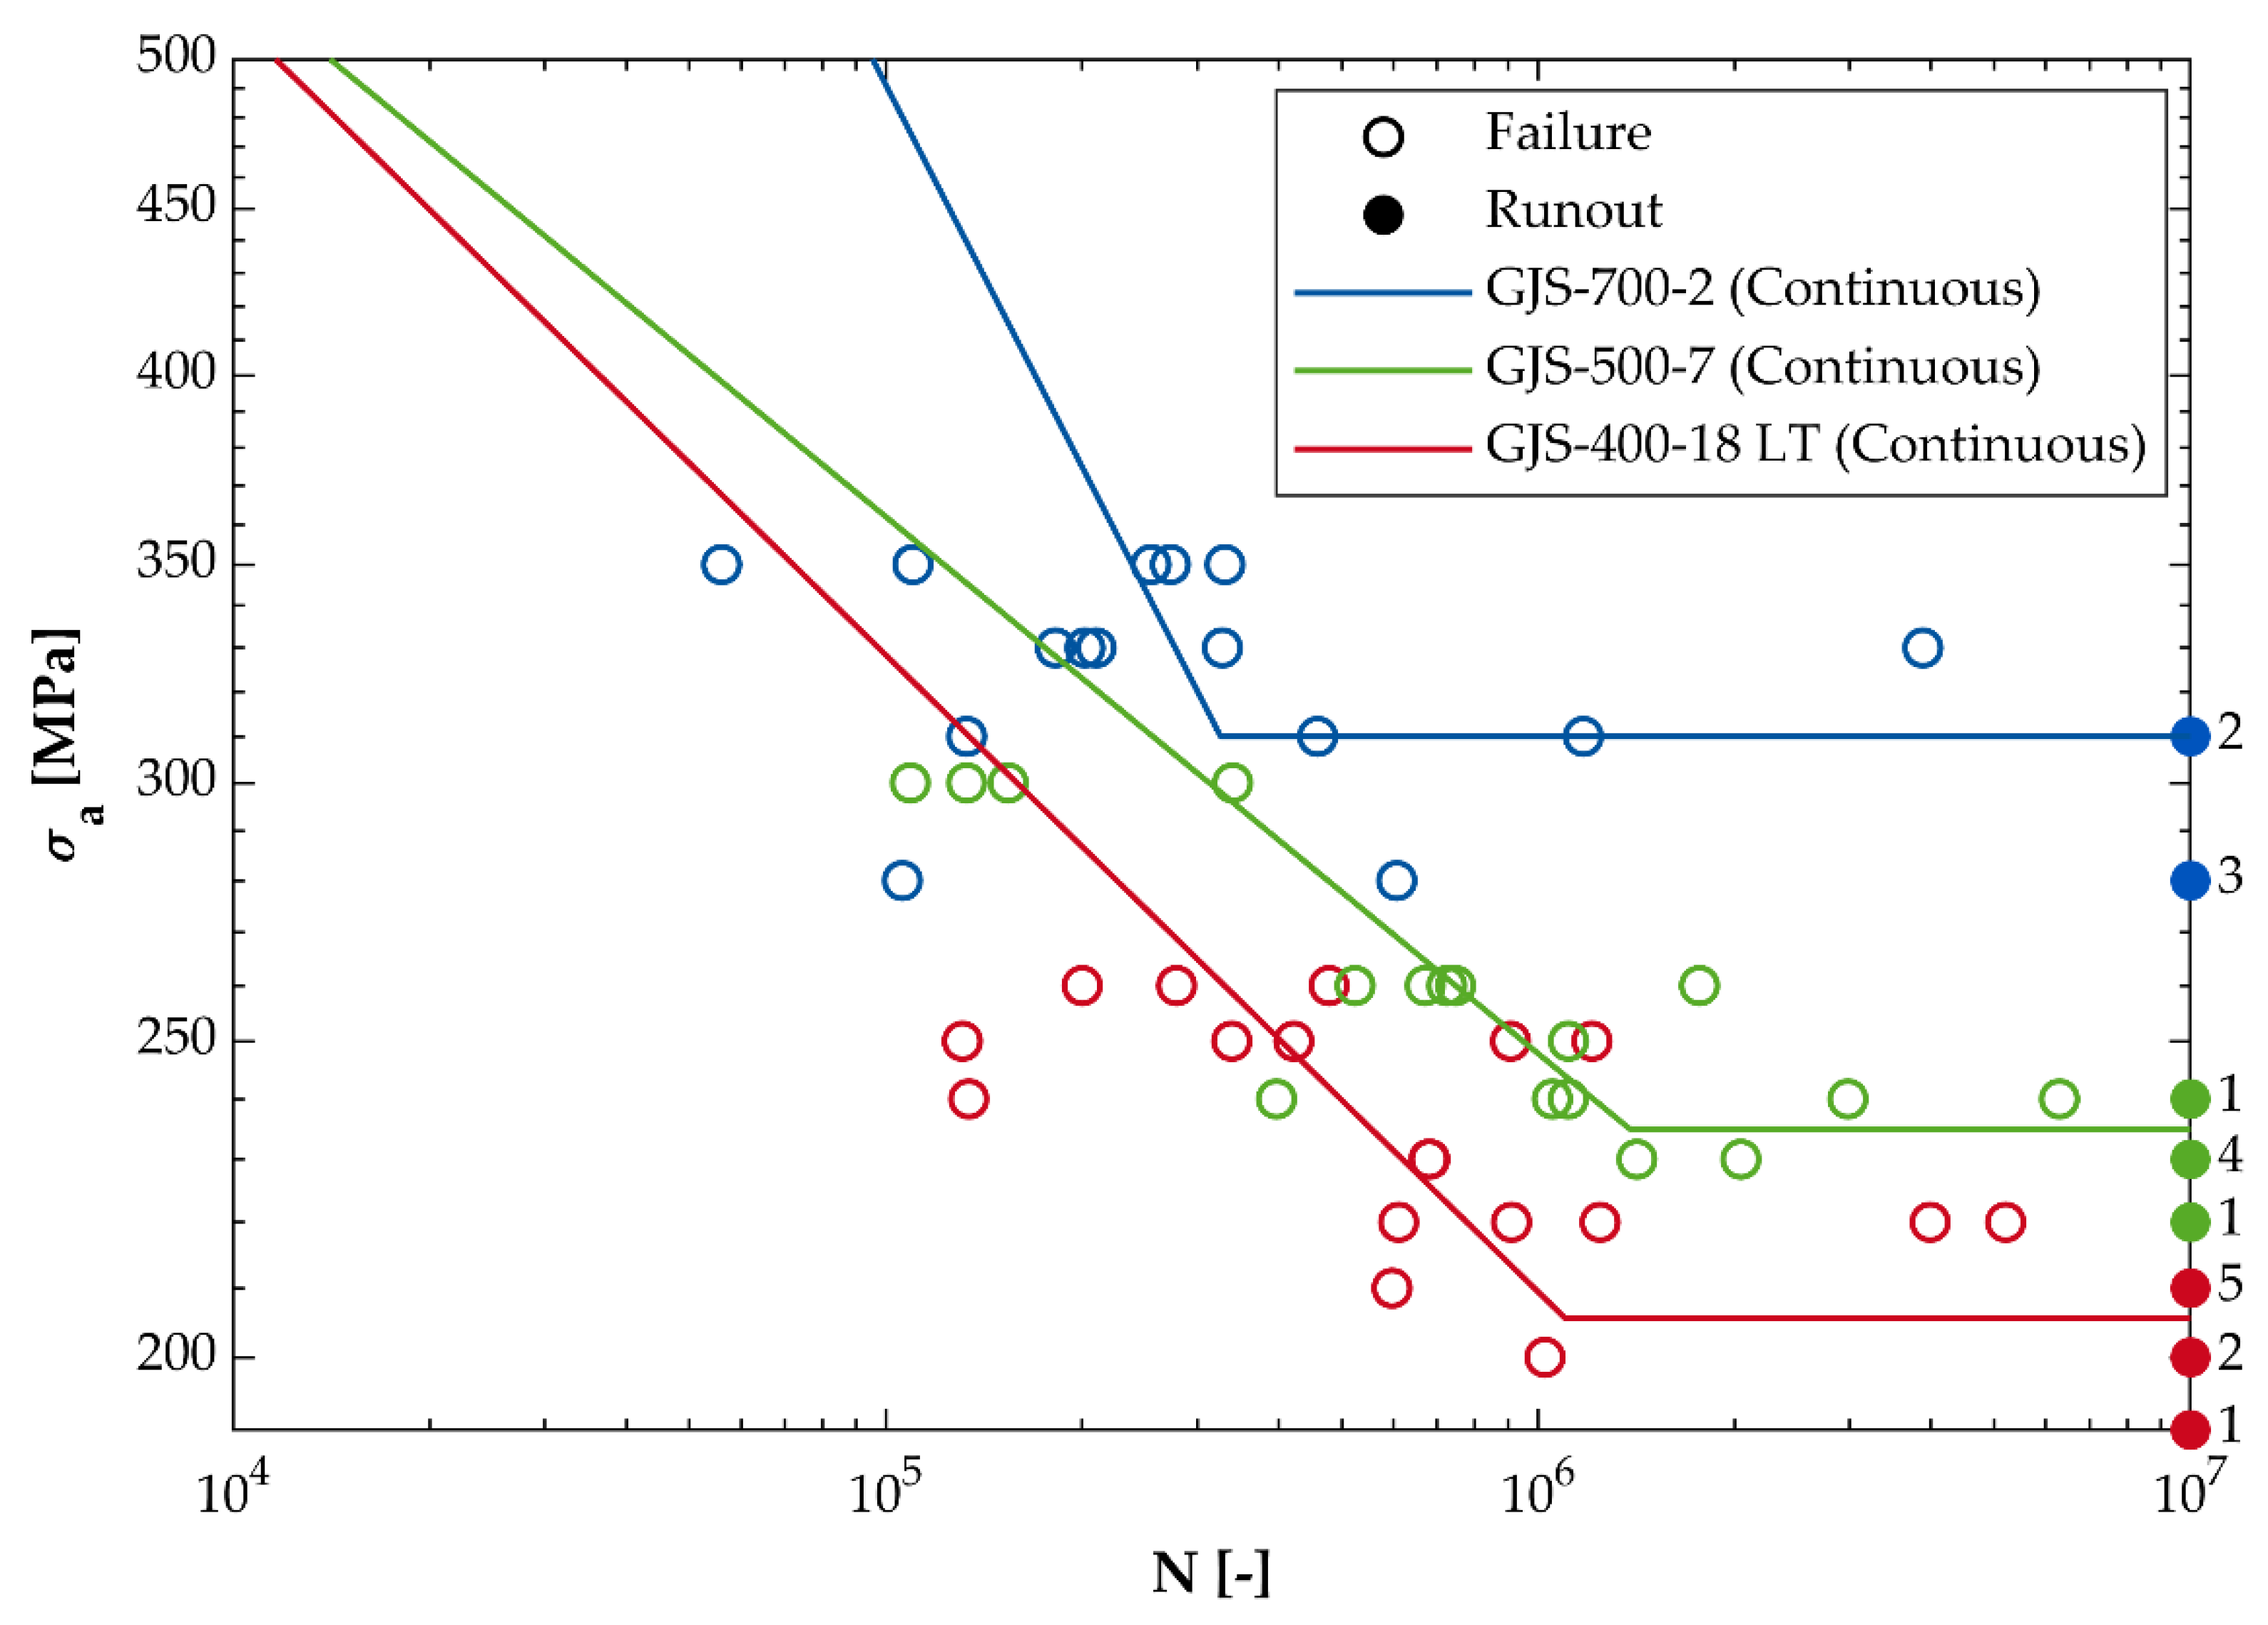
3.3. Fatigue Strength
3.4. Finite Element Model
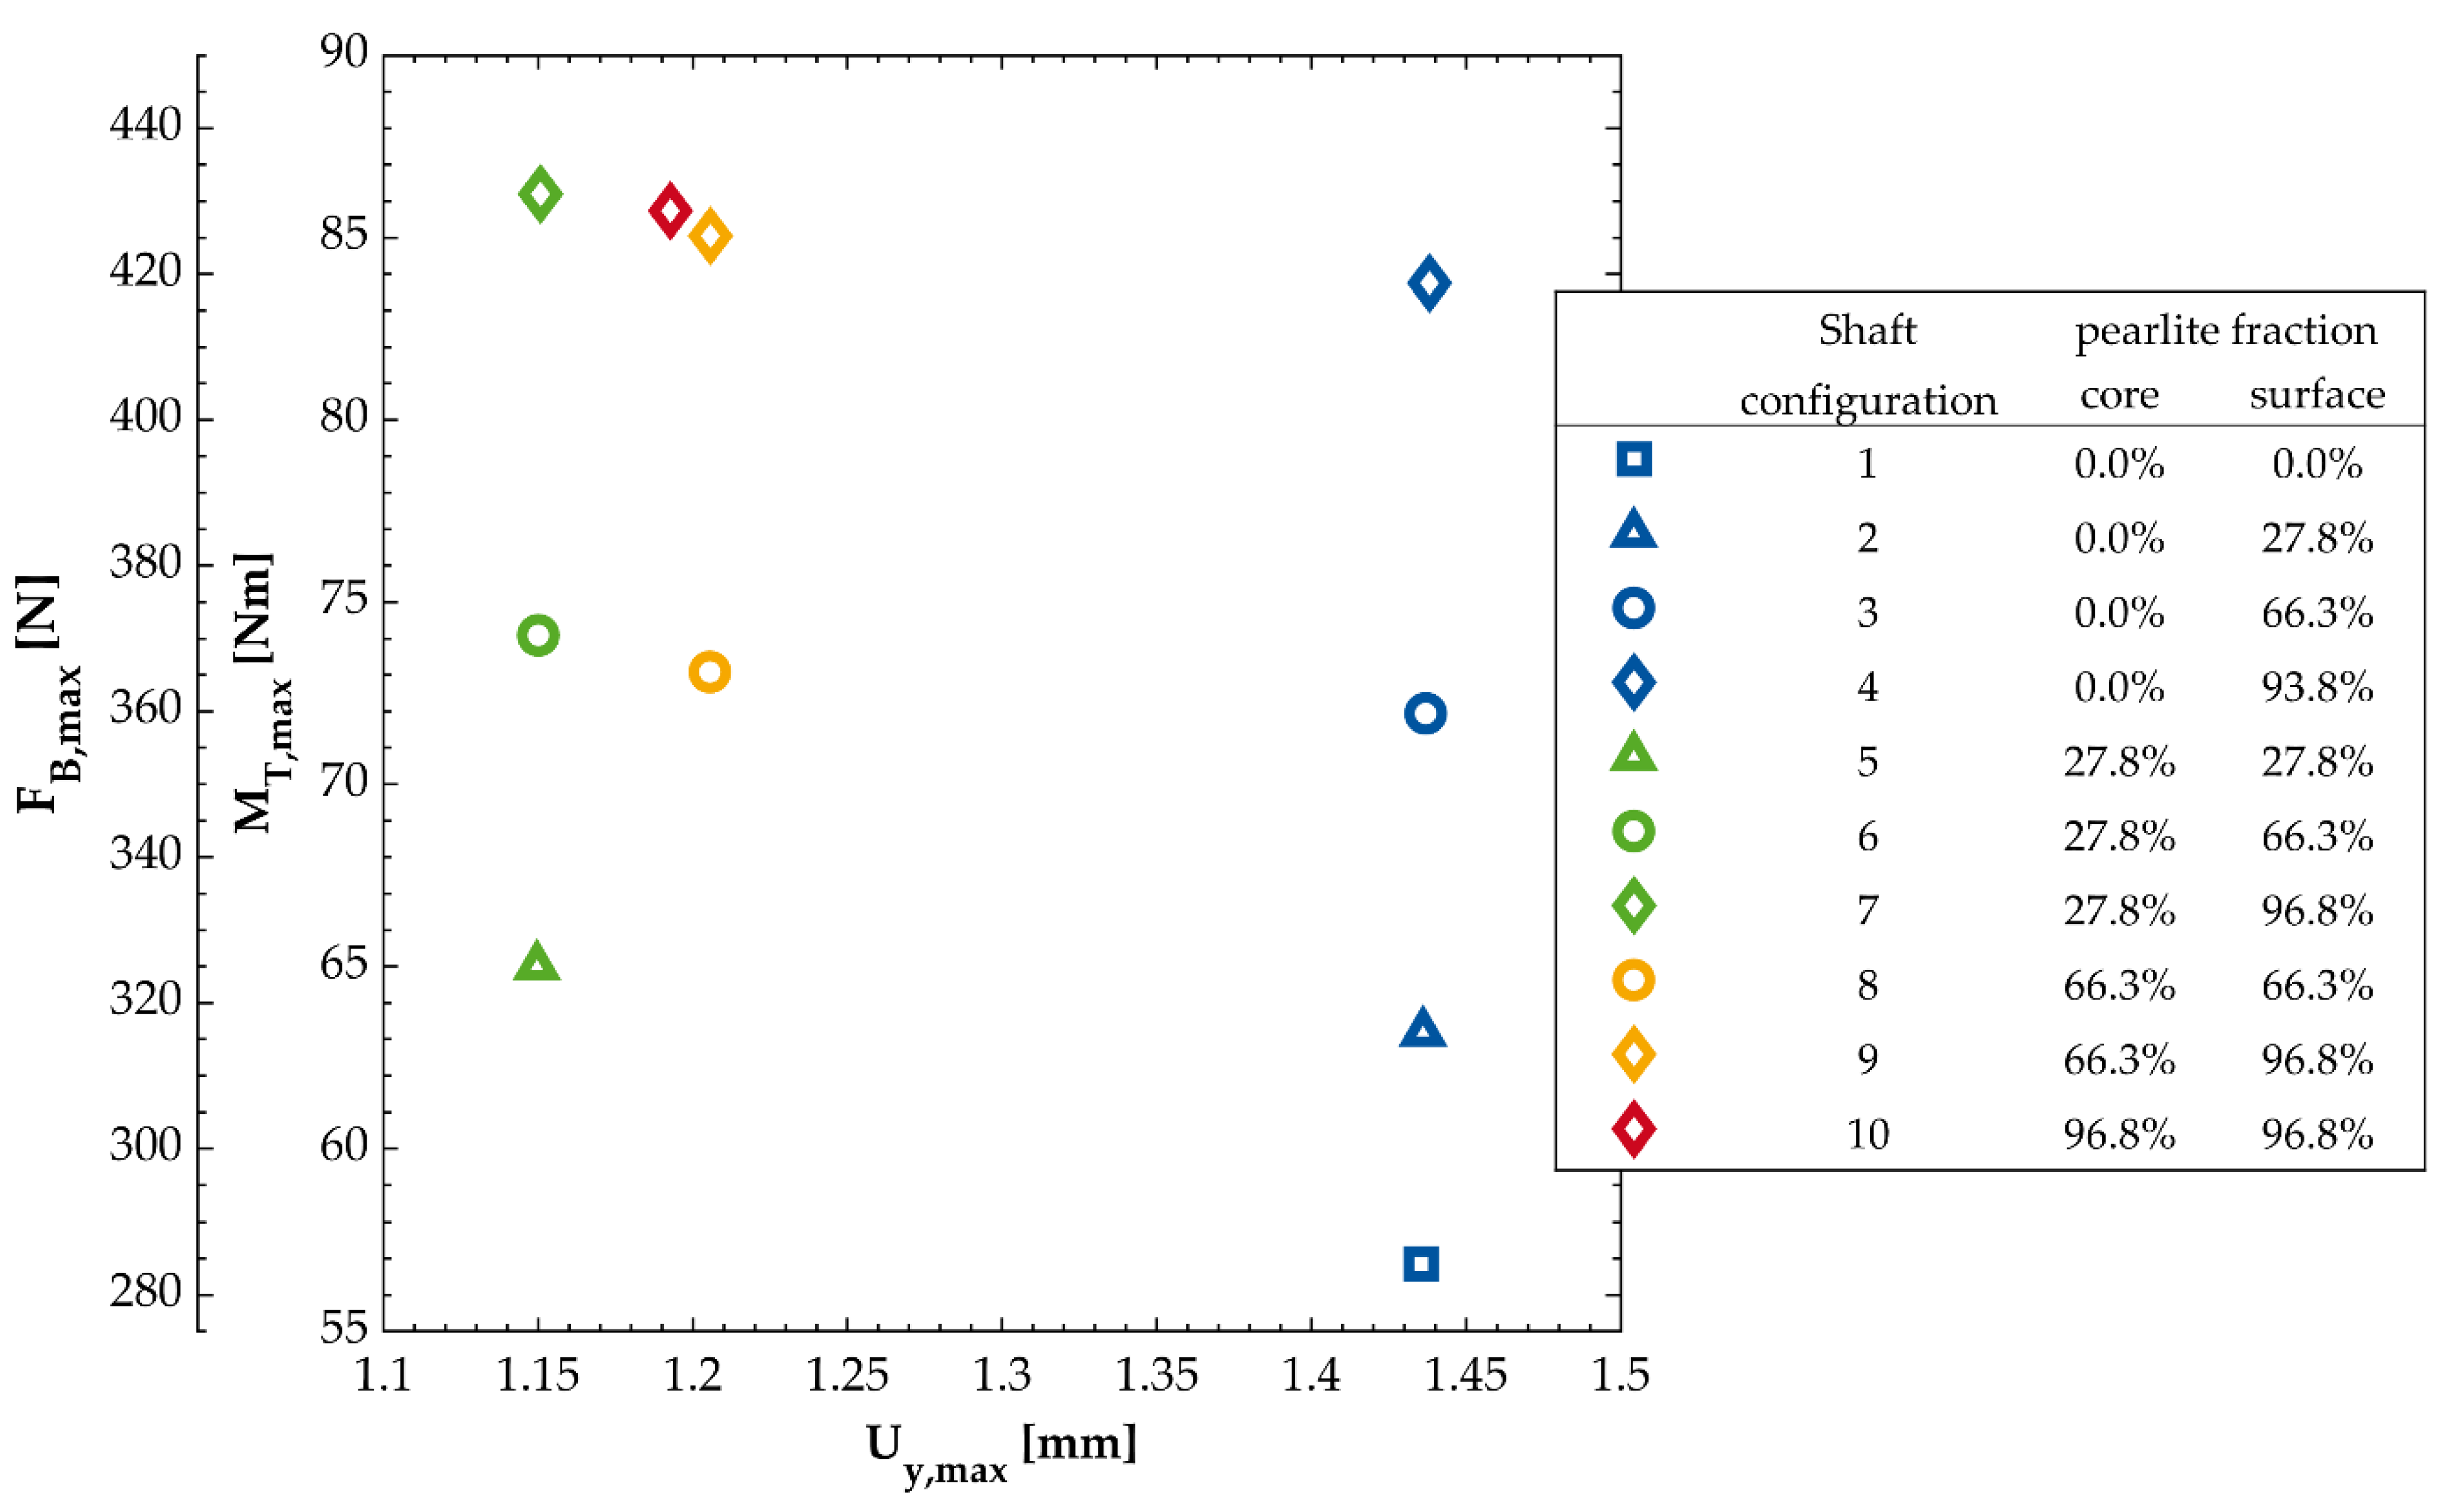
3.5. Calculation of Allowable Cyclic Torsional Moments and Static Bending Displacements
4. Discussion
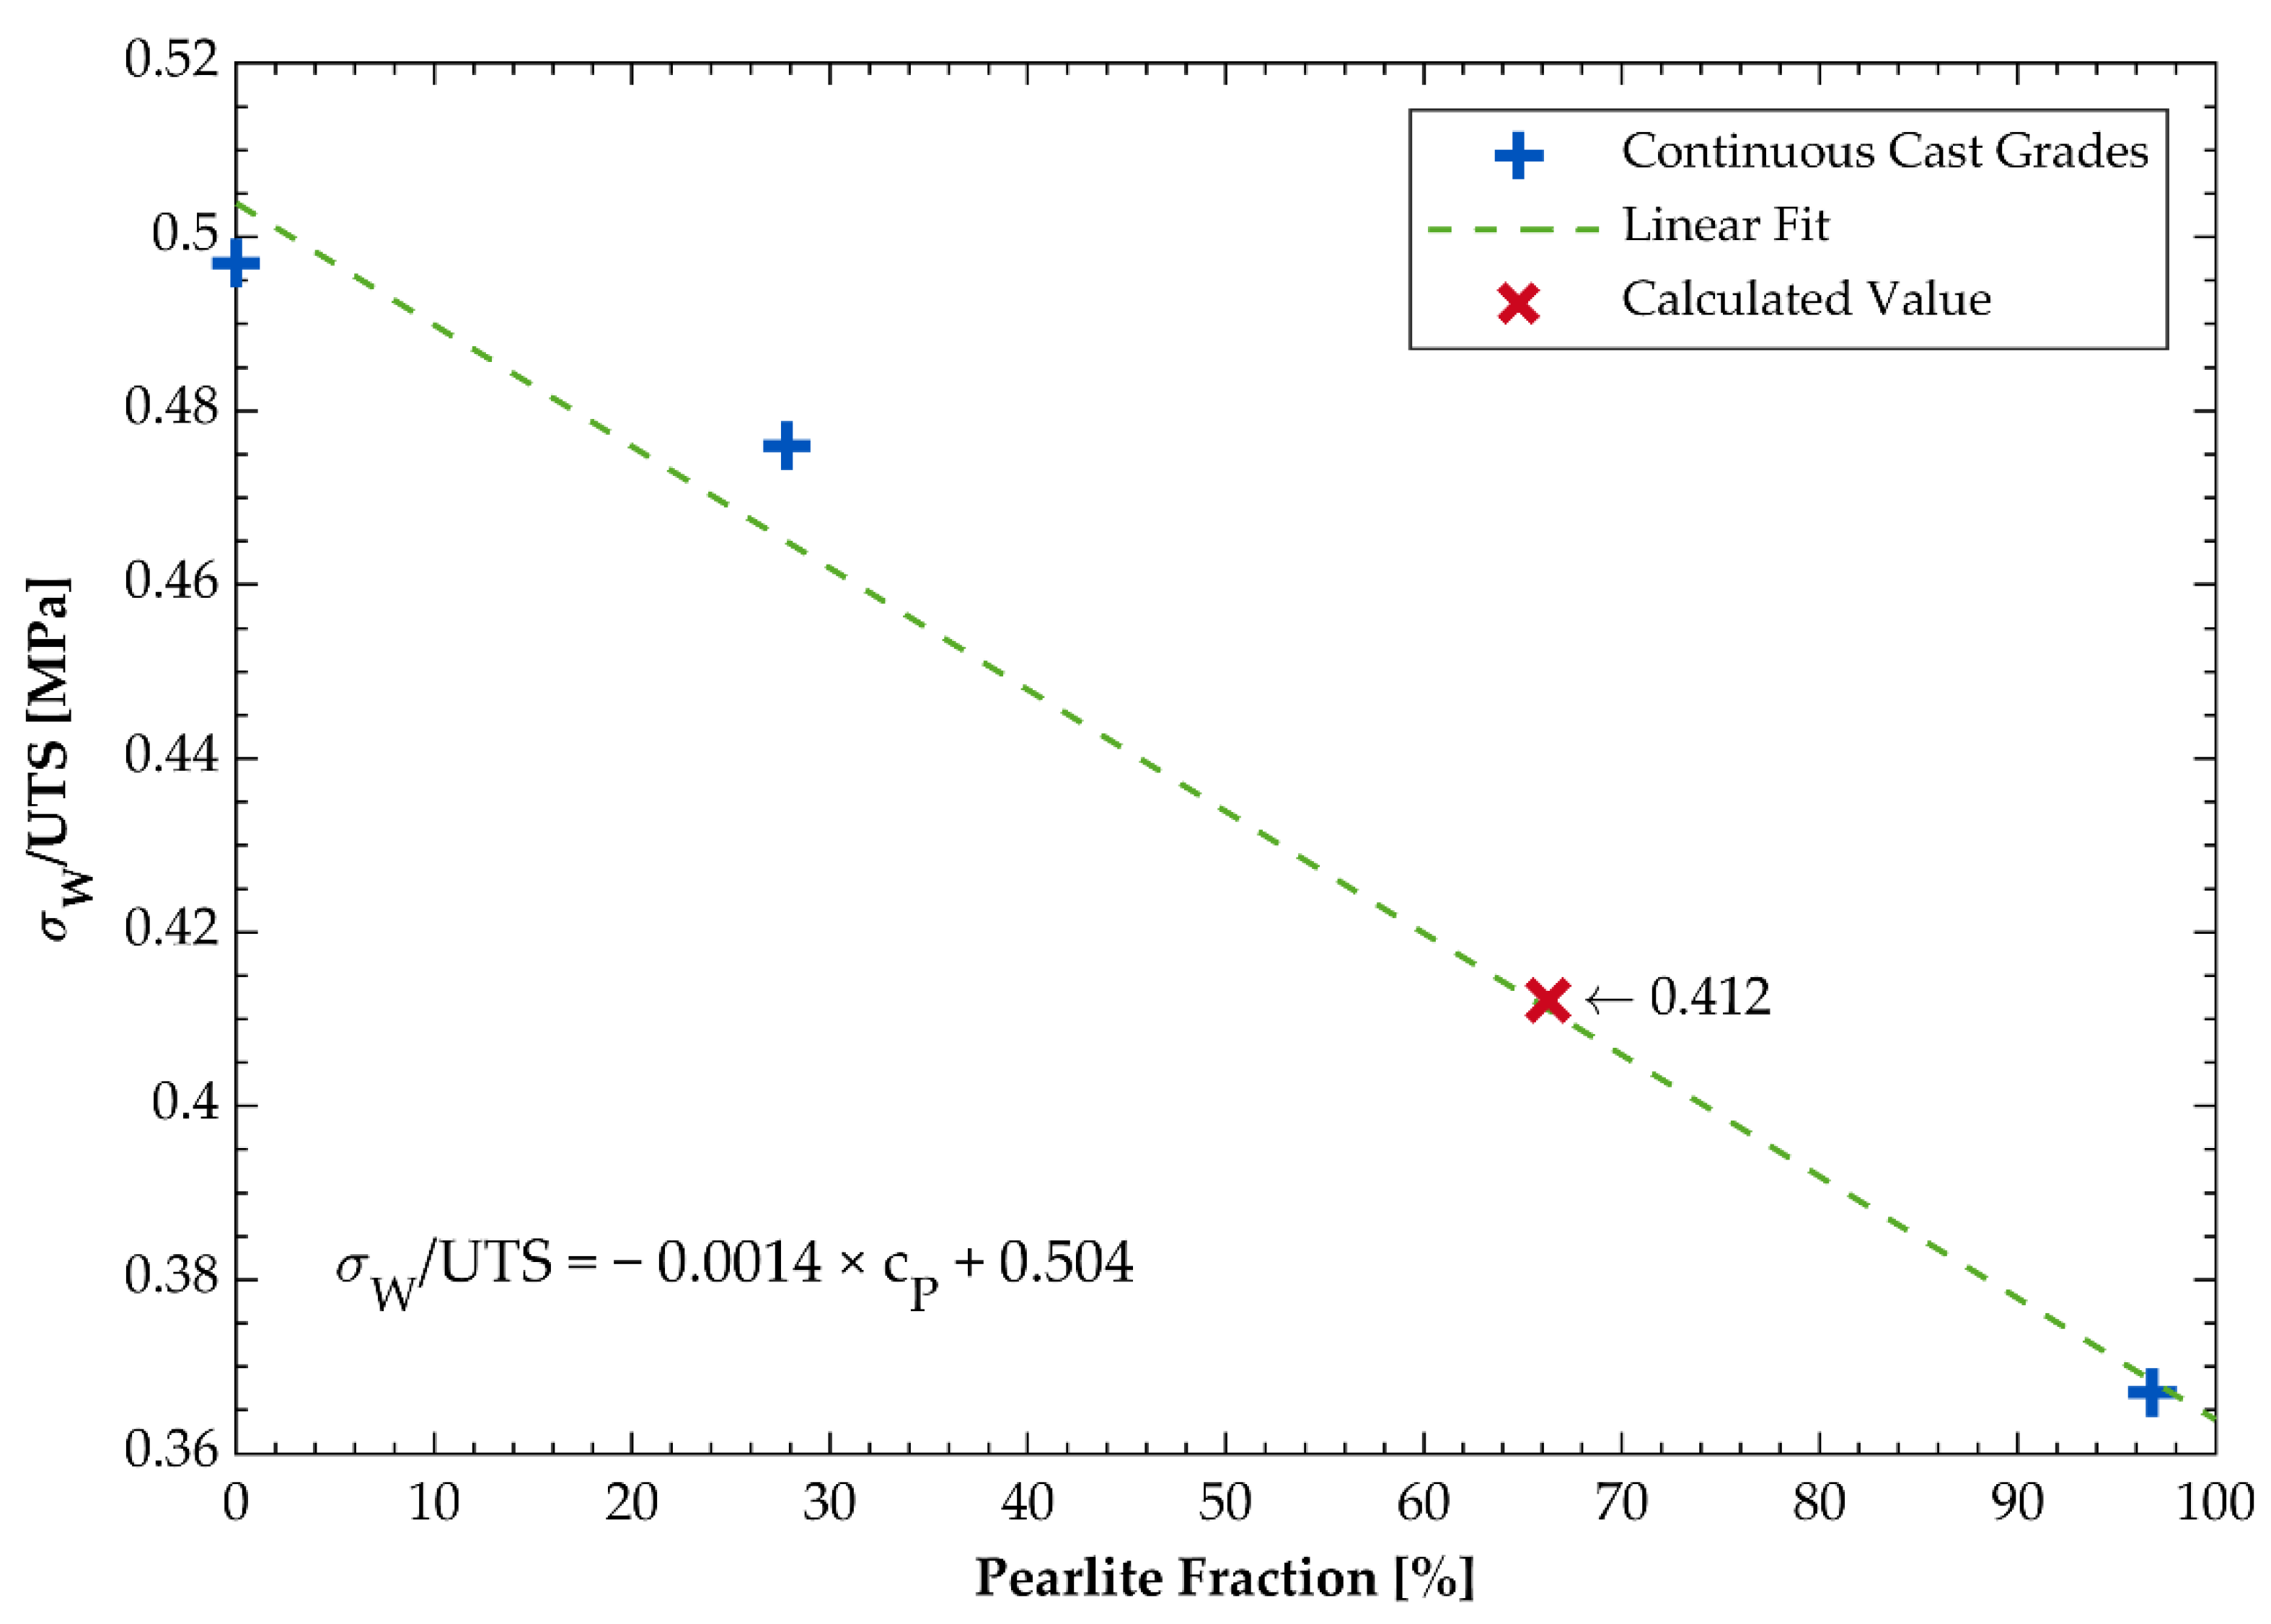
5. Conclusions
Author Contributions
Funding
Institutional Review Board Statement
Informed Consent Statement
Data Availability Statement
Acknowledgments
Conflicts of Interest
References
- Beuth. DIN EN 1563:2019-04, Gießereiwesen—Gusseisen mit Kugelgraphit; Deutsche Fassung EN_1563:2018; Beuth Verlag GmbH: Berlin, Germany, 2018. [Google Scholar]
- Ceccarelli, B.A.; Dommarco, R.C.; Martínez, R.A.; Martínez Gamba, M.R. Abrasion and impact properties of partially chilled ductile iron. Wear 2004, 256, 49–55. [Google Scholar] [CrossRef]
- Chang, W.S.; Lin, C.M. Relationship between cooling rate and microsegregation in bottom-chilled directionally solidified ductile irons. J. Min. Metall. B Metall. 2013, 49, 315–322. [Google Scholar] [CrossRef] [Green Version]
- Dhaneswara, D.; Suharno, B.; Aprilio, A.; Ariobimo, R.D.S.; Sofyan, N. Effect of Mould Coating on Skin Formation and Nodule Characteristics of Thin Wall Ductile Iron Casting. IOP Conf. Ser. Mater. Sci. Eng. 2017, 196, 12045. [Google Scholar] [CrossRef] [Green Version]
- Boonmee, S.; Stefanescu, D.M. American Foundry Society. Casting Skin Management in Compacted Graphite Iron Part I: Effect of Mold Coating and Section Thickness (13-1391). In Transactions of the American Foundry Society, Proceedings of the 117th Metalcasting Congress, St. Louis, MI, USA, 6–9 April 2013, in Conjunction with CastExpo’13; AFS: Schaumburg, IL, USA, 2013; Volume 121, pp. 435–448. ISBN 0874334055. [Google Scholar]
- Boonmee, S.; Stefanescu, D. On the Mechanism of Casting Skin Formation in Compacted Graphite Cast Iron. Int. Metalcast. 2009, 3, 19–24. [Google Scholar] [CrossRef]
- Kutz, A.; Martin, P.; Bührig-Polaczek, A. Microstructural Adjustment of the Degenerated Graphite Layer in Ductile Iron for Targeted Evaluation on the Fatigue Properties. Int. Metalcast. 2020, 14, 1183–1194. [Google Scholar] [CrossRef] [Green Version]
- Cholewa, M.; Wróbel, T.; Tenerowicz, S.; Szuter, T. Diffusion phenomena between alloy steel and gray cast iron in layered bimetallic casting. Arch. Matell. Mater. 2010, 55, 771–777. [Google Scholar]
- Neira Torres, I.; Gilles, G.; Tchoufang Tchuindjang, J.; Flores, P.; Lecomte-Beckers, J.; Habraken, A.M. FE modeling of the cooling and tempering steps of bimetallic rolling mill rolls. Int. J. Mater. Form. 2017, 10, 287–305. [Google Scholar] [CrossRef]
- Polajnar, M.; Kalin, M.; Thorbjornsson, I.; Thorgrimsson, J.T.; Valle, N.; Botor-Probierz, A. Friction and wear performance of functionally graded ductile iron for brake pads. Wear 2017, 382-383, 85–94. [Google Scholar] [CrossRef]
- Leibholz, R.; Robert, M.H.; Leibholz, H.; Bayraktar, E. Development of Functionally Graded Nodular Cast Iron Reinforced with Recycled WC Particles. In Mechanics of Composite and Multi-Functional Materials; Ralph, W.C., Singh, R., Tandon, G., Thakre, P.R., Zavattieri, P., Zhu, Y., Eds.; Springer International Publishing: Cham, Switzerland, 2017; Volume 7, pp. 241–249. ISBN 978-3-319-41765-3. [Google Scholar]
- A04 Committee. Specification for Ductile Iron Castings; ASTM International: West Conshohocken, PA, USA, 2019. [Google Scholar]
- Sjögren, T.; Svensson, I.L. Studying elastic deformation behaviour of cast irons by acoustic emission. Int. J. Cast Met. Res. 2005, 18, 249–256. [Google Scholar] [CrossRef]
- Kasvayee, K.A.; Salomonsson, K.; Ghassemali, E.; Jarfors, A.E.W. Microstructural strain distribution in ductile iron; comparison between finite element simulation and digital image correlation measurements. Mater. Sci. Eng. A 2016, 655, 27–35. [Google Scholar] [CrossRef]
- Iacoviello, F.; Di Bartolomeo, O.; Di Cocco, V.; Piacente, V. Damaging micromechanisms in ferritic–pearlitic ductile cast irons. Mater. Sci. Eng. A 2008, 478, 181–186. [Google Scholar] [CrossRef]
- Sjögren, T.; Persson, P.E.; Vomacka, P. Analysing the Deformation Behaviour of Compacted Graphite Cast Irons Using Digital Image Correlation Techniques. KEM 2010, 457, 470–475. [Google Scholar] [CrossRef]
- Schönborn, S.; Trinkel, D.; Bleicher, C.; Melz, T.; Klubberg, F.; Broeckmann, C. Einfluss der Einsatztemperatur auf das Schwingfestigkeitsverhalten von Proben aus dick- sowie dünnwandig abgegossenem Sphärogusswerkstoff EN-GJS-400-18-LT. Giess. Spec. 2019, 2, 46–58. [Google Scholar]
- Trinkel, D.; Klubberg, F.; Bezold, A.; Broeckmann, C. Schwingfestigkeit von Gusseisen mit Kugelgraphit unter Temperatureinfluss. In Werkstoffe und Bauteile auf dem Prüfstand: Prüftechnik—Kennwertermittlung—Schadensvermeidung; Christ, H.-J., Ed.; DVM: Berlin, Germany, 2020; pp. 63–68. [Google Scholar]
- FKM. Forschungskuratorium Maschinenbau/Verband Deutscher Maschinen- und Anlagenbau. In Rechnerischer Festigkeitsnachweis für Maschinenbauteile aus Stahl, Eisenguss- und Aluminiumwerkstoffen; 6.; überarb. Ausg.; VDMA-Verlag: Frankfurt am Main, Gemany, 2012. [Google Scholar]
- Pang, J.C.; Li, S.X.; Wang, Z.G.; Zhang, Z.F. General relation between tensile strength and fatigue strength of metallic materials. Mater. Sci. Eng. A 2013, 564, 331–341. [Google Scholar] [CrossRef]
- Mollenhauer, K.; Tschöke, H. Handbook of Diesel Engines; Springer: Berlin/Heidelberg, Germany, 2010; ISBN 978-3-540-89082-9. [Google Scholar]
- ISO. ISO 10803:2011-12 Design Method for Ductile Iron Pipes; 2011-12-00, 23.040.10; ISO International Organization for Standardization: Geneva, Switzerland, 2011. [Google Scholar]
- IEC. Wind Turbines: Part 4: Design Requirements for Wind Turbine Gearboxes; International Standard IEC 61400-4; IEC: Geneva, Switzerland, 2012. [Google Scholar]
- Menk, W.; Tunzini, S.; Rieck, T.; Honsel, C.; Weiss, K. Development of Ductile Iron Material, Simulation and Production Technology to Locally Strengthen Castings. KEM 2010, 457, 343–348. [Google Scholar] [CrossRef]
- ISO. Spheroidal Graphite Cast Irons—Classification; 2018-04-00, 77.080.10 (ISO 1083); ISO: Geneva, Switzerland, 2018. [Google Scholar]
- Velichko, A.; Mücklich, F. Shape analysis and classification of irregular graphite morphology in cast iron. Prakt. Metall. 2006. [Google Scholar] [CrossRef]
- Bartels, C.; Gerhards, R.; Hanselka, H.; Herfurth, K.; Kaufmann, H.; Kleinkröger, W.; Lampic, M.; Löblich, H.; Menk, W.; Pusch, G.; et al. Gusseisen mit Kugelgraphit: Herstellung—Eigenschaften—Anwendung. Konstruieren Giessen 2017, 32, 1–104. [Google Scholar]
- Schönborn, S.; Richter, T.; Winge, J.; Bergmann, J.; Kleemann, S.; Kleemann, A.; Trinkel, D.; Klubberg, F.; Bezold, A. Ableitung von Synthetischen Wöhlerlinien für Eisengusswerkstoffe: Abschlussbericht; IGF-Vorhaben Nr. 19257 BG; IGF: Aachen, Germany, 2019. [Google Scholar]

| DCI Grade | Sample | Fe | C | Si | Mn | P | S | Cr | Mo | Ni | Al | Co | Cu |
|---|---|---|---|---|---|---|---|---|---|---|---|---|---|
| GJS-400-18 LT | Continuous | 92.9 | 3.71 | 2.47 | 0.12 | 0.015 | 0.010 | 0.016 | 0.006 | 0.30 | 0.0126 | 0.01 | 0.013 |
| GJS-500-7 | Continuous | 92.4 | 2.93 | 2.72 | 0.62 | 0.017 | 0.012 | 0.043 | 0.008 | 0.04 | 0.0102 | 0.01 | 0.988 |
| GJS-500-7 | Mold | 92.9 | 3.90 | 2.30 | 0.21 | 0.014 | 0.015 | 0.025 | 0.005 | 0.07 | 0.0089 | 0.01 | 0.344 |
| GJS-700-2 | Continuous | 92.1 | 3.24 | 2.71 | 0.62 | 0.016 | 0.011 | 0.044 | 0.008 | 0.04 | 0.0106 | 0.01 | 0.990 |
| Maximum feret diameter | Maximum diameter of a graphite nodule | 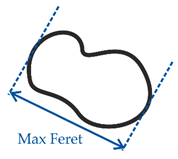 |
| Minimum feret diameter | Minimum diameter of a graphite nodule |  |
| Circularity | =(Nodule area/(0.25 × pi × MaxFeret²))^0.5 | 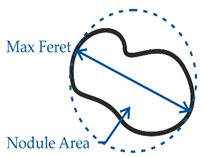 |
| Compactness | =Nodule Area/convex hull area | 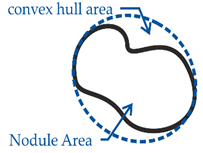 |
| DCI Grade | Sample | Young’s Modulus [GPa] | Poisson’s Ratio [27] [-] | Perlite Concentration [-] | Yield Strength [MPa] | Tensile Strength (UTS) [MPa] | Uniform Elongation [%] |
|---|---|---|---|---|---|---|---|
| GJS-400-18 LT | Continuous | 151.4 | 0.28 | 0.0% | 281.9 ± 1.4 | 414.0 ± 3.2 | 17.55 ± 0.28 |
| GJS-500-7 | Continuous | 169.3 | 0.28 | 27.8% | 360.2 ± 2.7 | 494.0 ± 3.9 | 13.53 ± 1.14 |
| GJS-500-7 | Mold | 160.9 | 0.28 | 66.3% | 373.8 ± 9.0 | 641.0 ± 22.0 | 11.40 ± 0.34 |
| GJS-700-2 | Continuous | 165.9 | 0.28 | 96.8% | 514.5 ± 13.2 | 844.6 ± 9.4 | 6.00 ± 1.13 |
| DCI Grade | Sample | Perlite Fraction [-] | Circularity [-] | Compactness [-] | Max Feret [µm] | Min Feret [µm] |
|---|---|---|---|---|---|---|
| GJS-400-18 LT | Continuous | 0.0% | 67.0% | 91.4% | 26.4 | 20.2 |
| GJS-500-7 | Continuous | 27.8% | 70.1% | 90.2% | 38.8 | 30.8 |
| GJS-500-7 | Mold | 66.3% | 71.2% | 93.7% | 26.7 | 21.2 |
| GJS-700-2 | Continuous | 96.8% | 72.4% | 94.3% | 25.9 | 20.7 |
| DCI Grade | Sample | Perlite Fraction [-] | σW [MPa] | τW [MPa] |
|---|---|---|---|---|
| GJS-400-18 LT | Continuous | 0.0% | 205.6 | 164.0 |
| GJS-500-7 | Continuous | 27.8% | 235.0 | 187.5 |
| GJS-500-7 | Mold | 66.3% | 264.2 | 210.8 |
| GJS-700-2 | Continuous | 96.8% | 310.0 | 247.3 |
| Shaft Configuration | Pearlite Fraction | MT,max [Nm] | FB,max [N] | Critical Position | |
|---|---|---|---|---|---|
| Core [-] | Surface [-] | ||||
| 1 | 0.0% | 0.0% | 56.86 | 284.28 | D |
| 2 | 0.0% | 27.8% | 63.19 | 315.94 | D |
| 3 | 0.0% | 66.3% | 71.94 | 359.70 | D |
| 4 | 0.0% | 93.8% | 83.75 | 486.84 | D |
| 5 | 27.8% | 27.8% | 65.00 | 325.01 | D |
| 6 | 27.8% | 66.3% | 74.09 | 370.44 | D |
| 7 | 27.8% | 96.8% | 86.19 | 511.68 | D |
| 8 | 66.3% | 66.3% | 73.08 | 365.40 | D |
| 9 | 66.3% | 96.8% | 85.04 | 425.22 | D |
| 10 | 96.8% | 96.8% | 85.73 | 428.67 | D |
| Shaft Configuration | Pearlite Fraction | Uy,max [mm] | Critical Position | |
|---|---|---|---|---|
| Core [-] | Surface [-] | |||
| 1 | 0.0% | 0.0% | 1.4355 | C |
| 2 | 0.0% | 27.8% | 1.4361 | C |
| 3 | 0.0% | 66.3% | 1.4369 | C |
| 4 | 0.0% | 93.8% | 1.4383 | C |
| 5 | 27.8% | 27.8% | 1.1496 | C |
| 6 | 27.8% | 66.3% | 1.1500 | C |
| 7 | 27.8% | 96.8% | 1.1507 | C |
| 8 | 66.3% | 66.3% | 1.2055 | C |
| 9 | 66.3% | 96.8% | 1.2058 | C |
| 10 | 96.8% | 96.8% | 1.1928 | C |
Publisher’s Note: MDPI stays neutral with regard to jurisdictional claims in published maps and institutional affiliations. |
© 2021 by the authors. Licensee MDPI, Basel, Switzerland. This article is an open access article distributed under the terms and conditions of the Creative Commons Attribution (CC BY) license (https://creativecommons.org/licenses/by/4.0/).
Share and Cite
Ripplinger, C.; Gastens, M.; Zimmermann, J.; Pustal, B.; Broeckmann, C.; Schröder, K.-U.; Bührig-Polaczek, A. Potential of Metallurgical Gradients in the Design of Structural Components Made of Nodular Cast Iron. Materials 2021, 14, 2411. https://doi.org/10.3390/ma14092411
Ripplinger C, Gastens M, Zimmermann J, Pustal B, Broeckmann C, Schröder K-U, Bührig-Polaczek A. Potential of Metallurgical Gradients in the Design of Structural Components Made of Nodular Cast Iron. Materials. 2021; 14(9):2411. https://doi.org/10.3390/ma14092411
Chicago/Turabian StyleRipplinger, Christoph, Markus Gastens, Jannik Zimmermann, Björn Pustal, Christoph Broeckmann, Kai-Uwe Schröder, and Andreas Bührig-Polaczek. 2021. "Potential of Metallurgical Gradients in the Design of Structural Components Made of Nodular Cast Iron" Materials 14, no. 9: 2411. https://doi.org/10.3390/ma14092411
APA StyleRipplinger, C., Gastens, M., Zimmermann, J., Pustal, B., Broeckmann, C., Schröder, K.-U., & Bührig-Polaczek, A. (2021). Potential of Metallurgical Gradients in the Design of Structural Components Made of Nodular Cast Iron. Materials, 14(9), 2411. https://doi.org/10.3390/ma14092411