
Early-Age Mechanical Properties of 3D-Printed Mortar with Spent Garnet

 ,
,  , , and
Abstract
:1. Introduction
2. Materials and Experimental Procedure
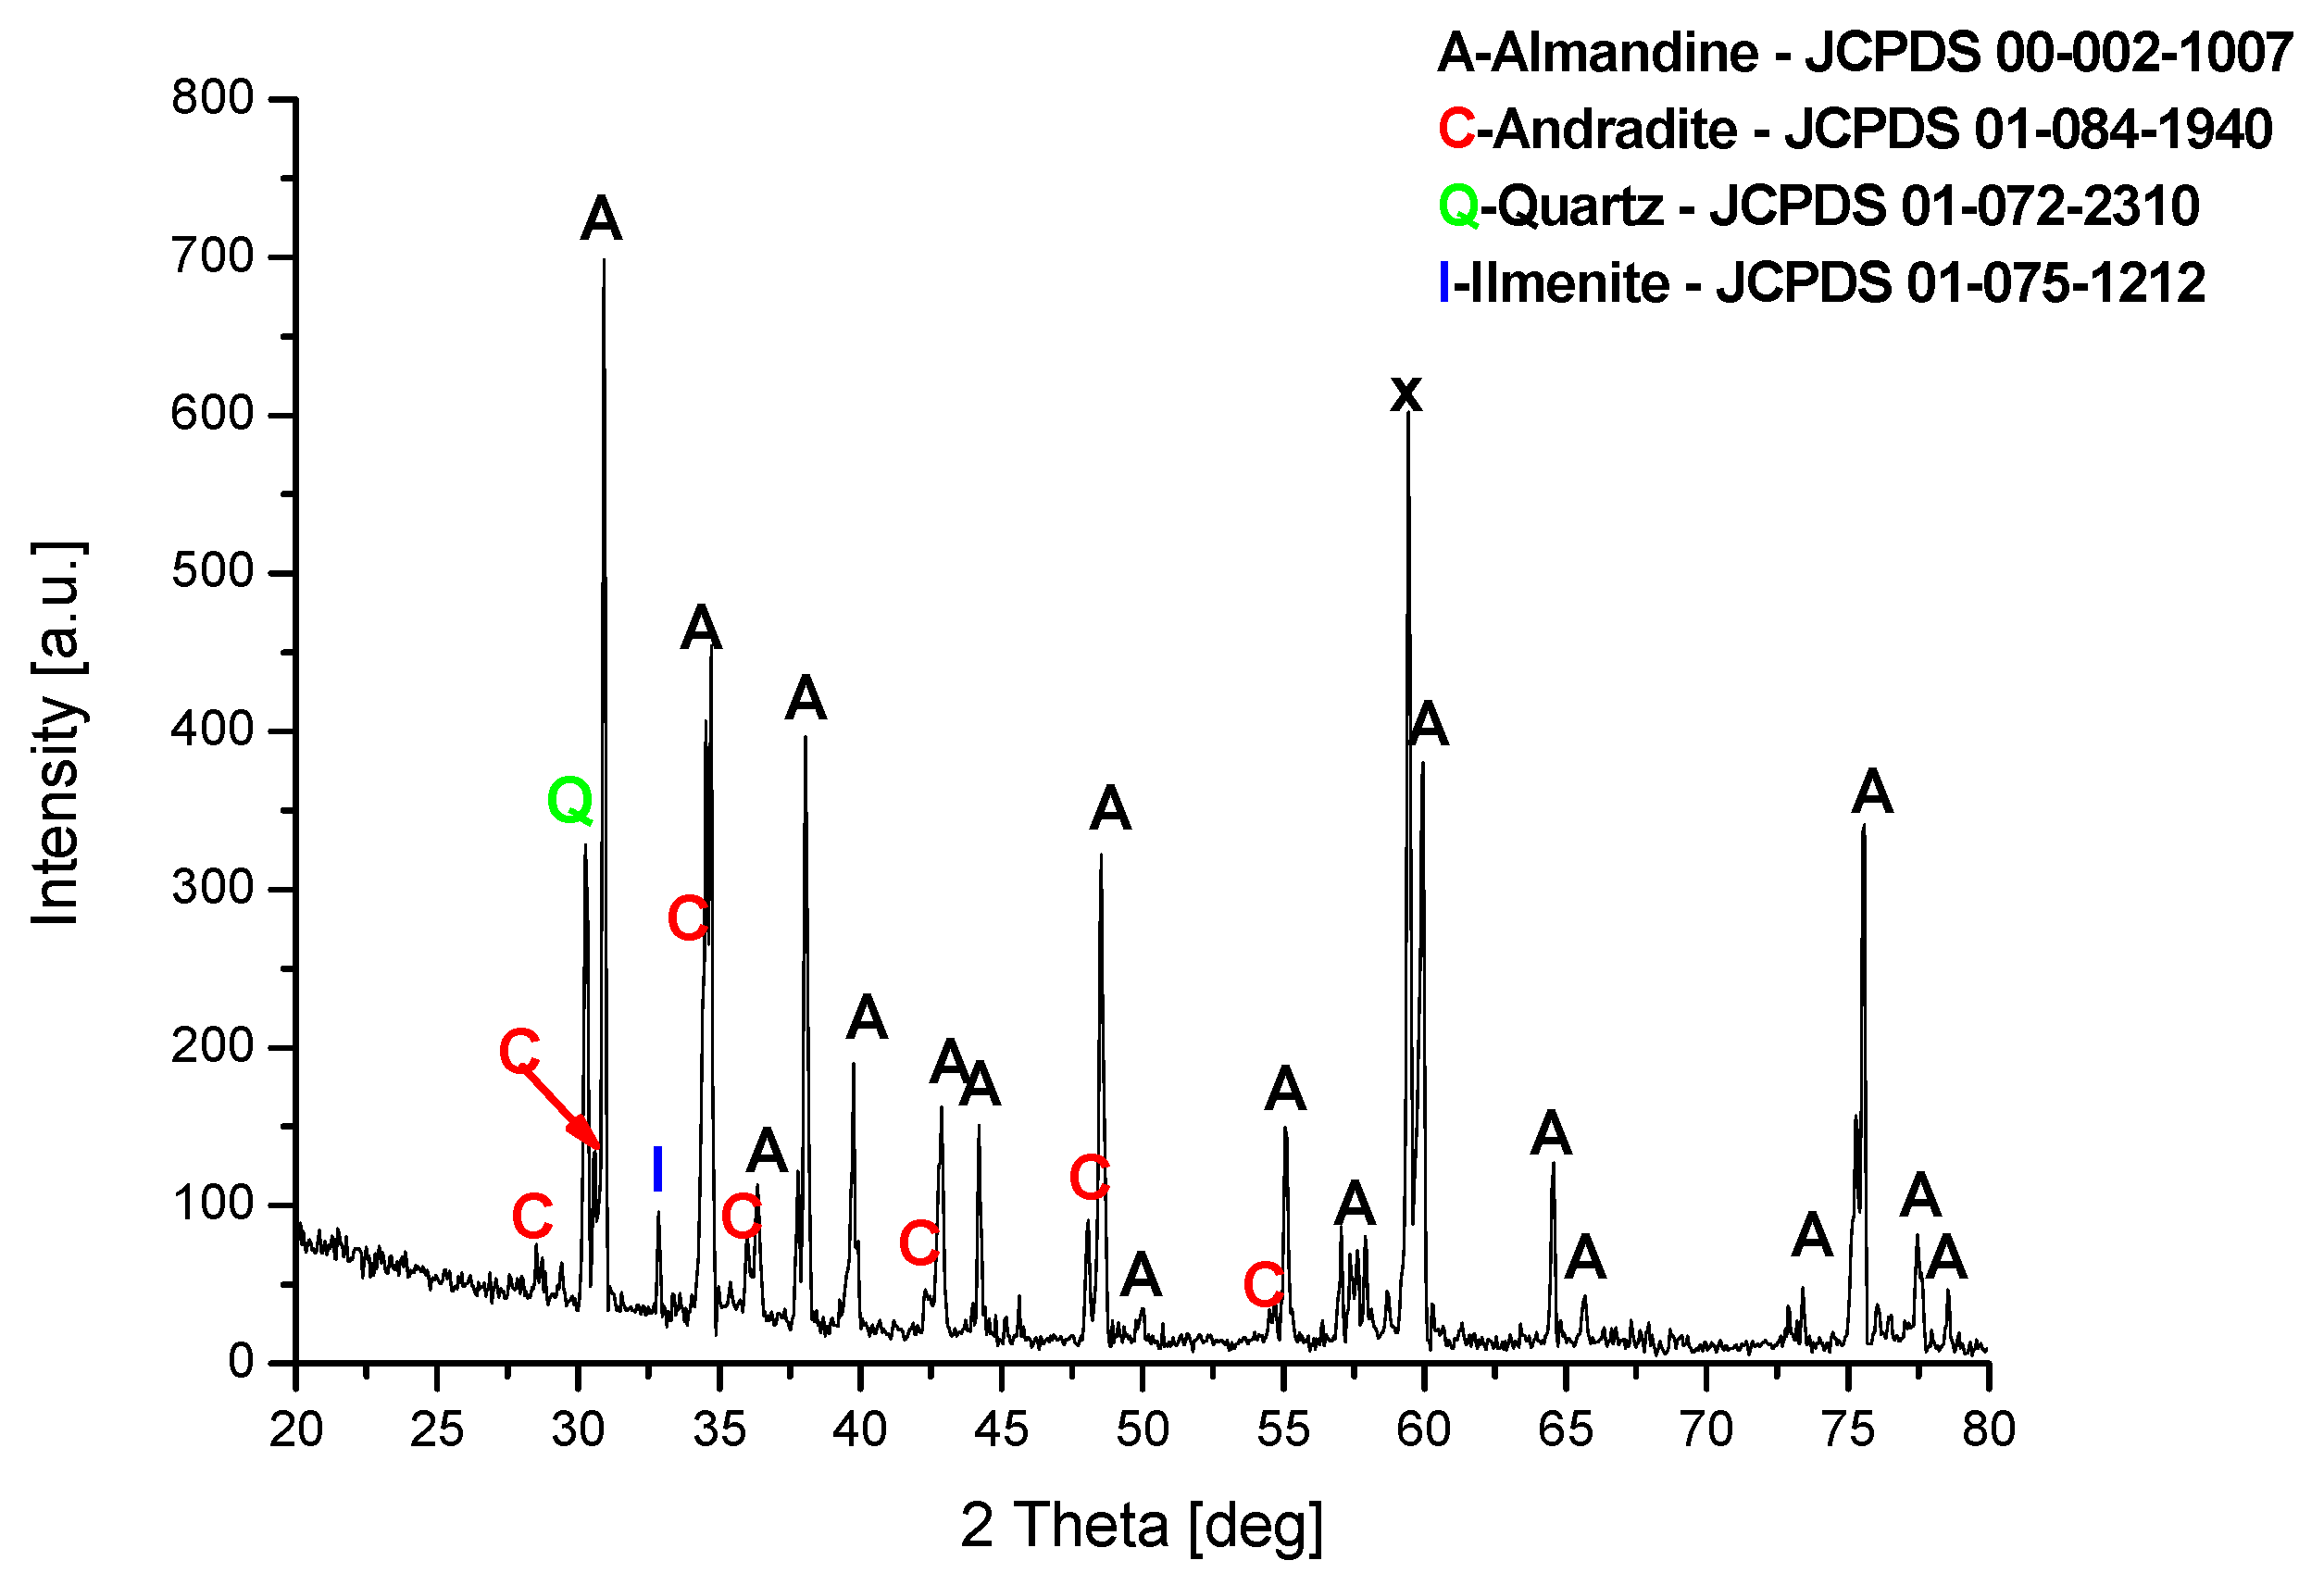
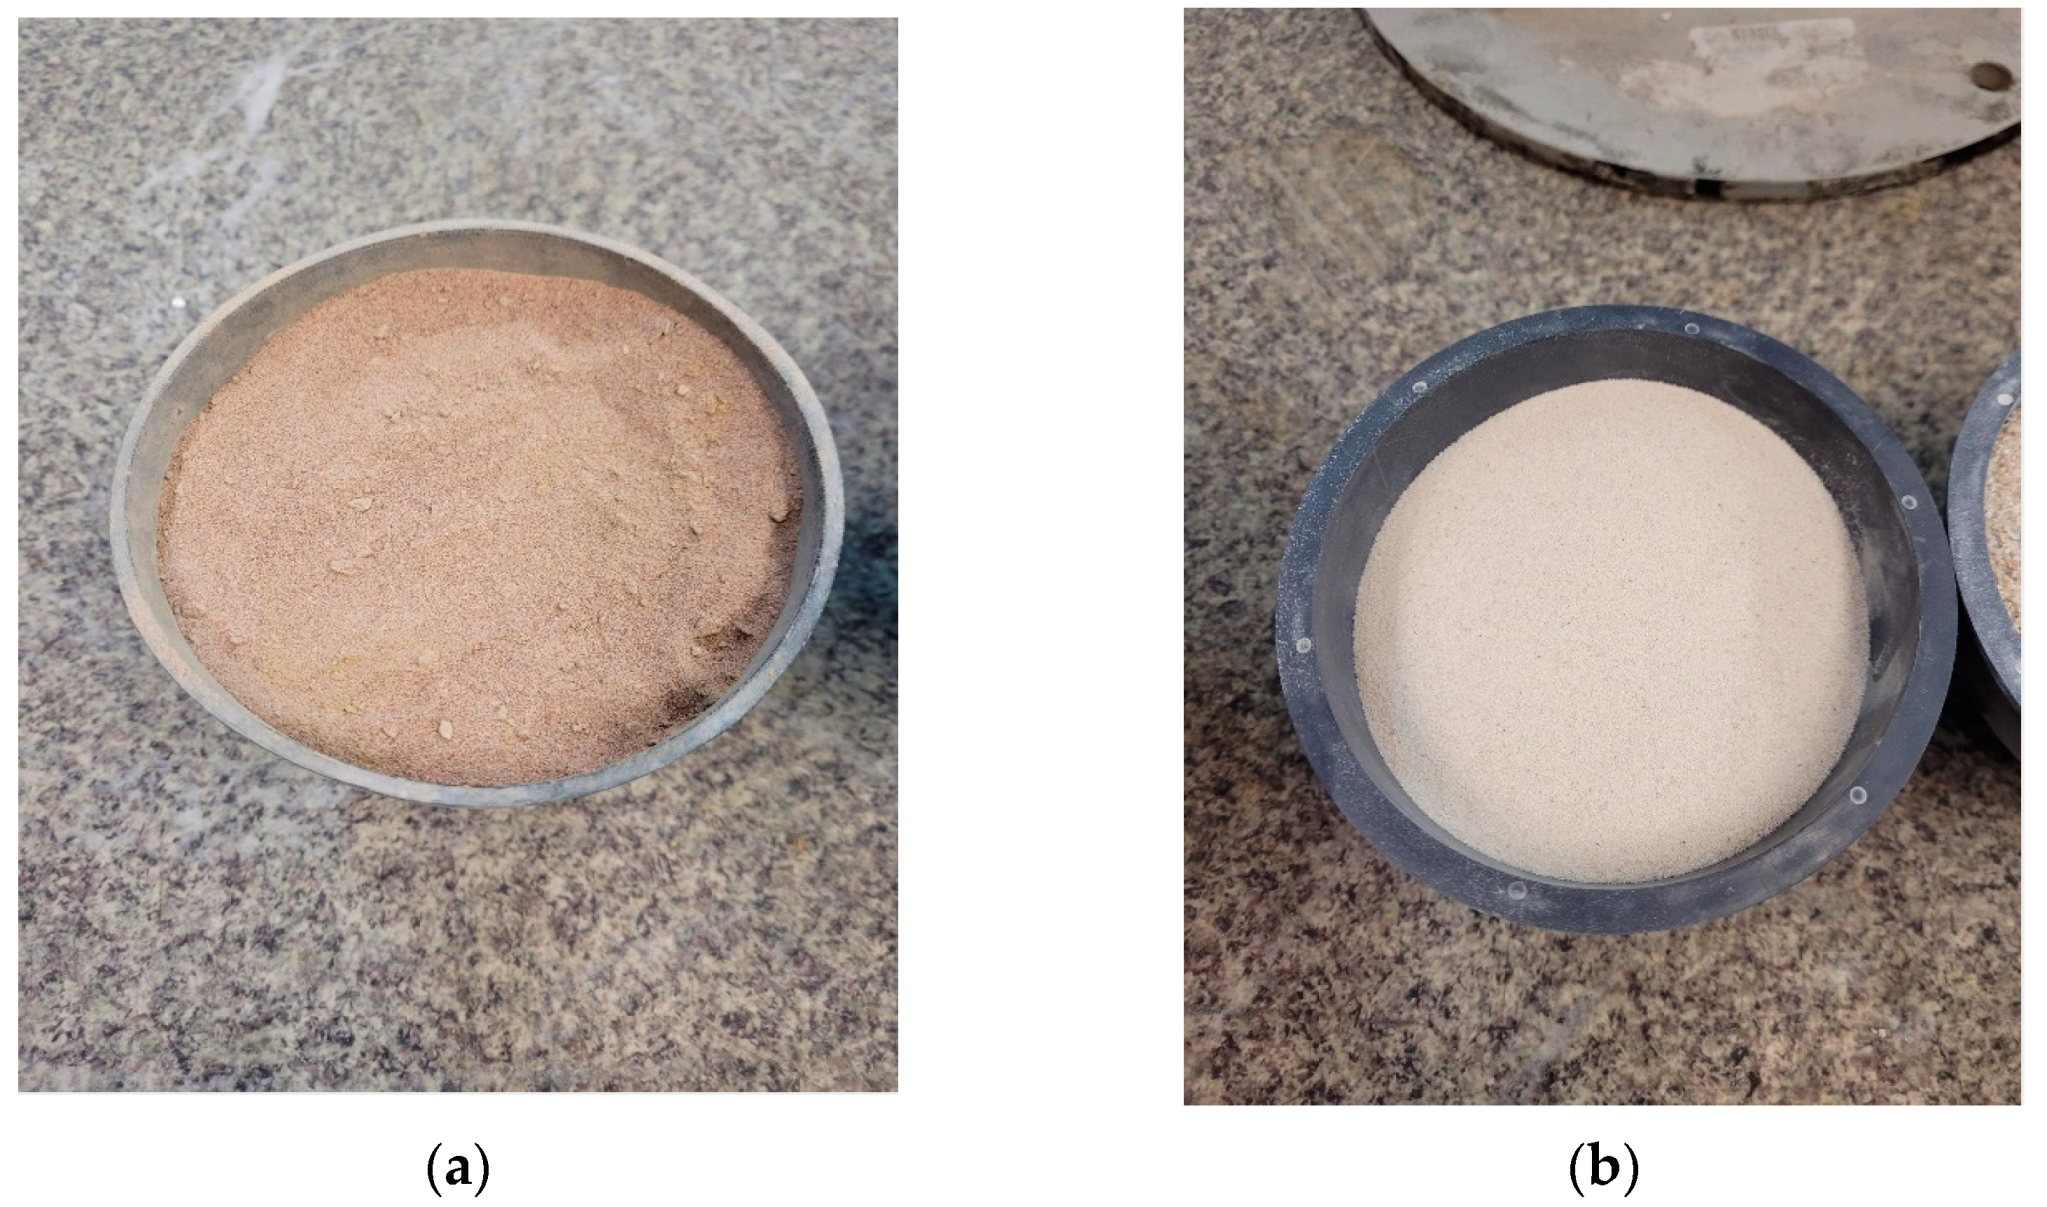
2.1. Materials
2.2. Mix Design
3. Experimental Procedure
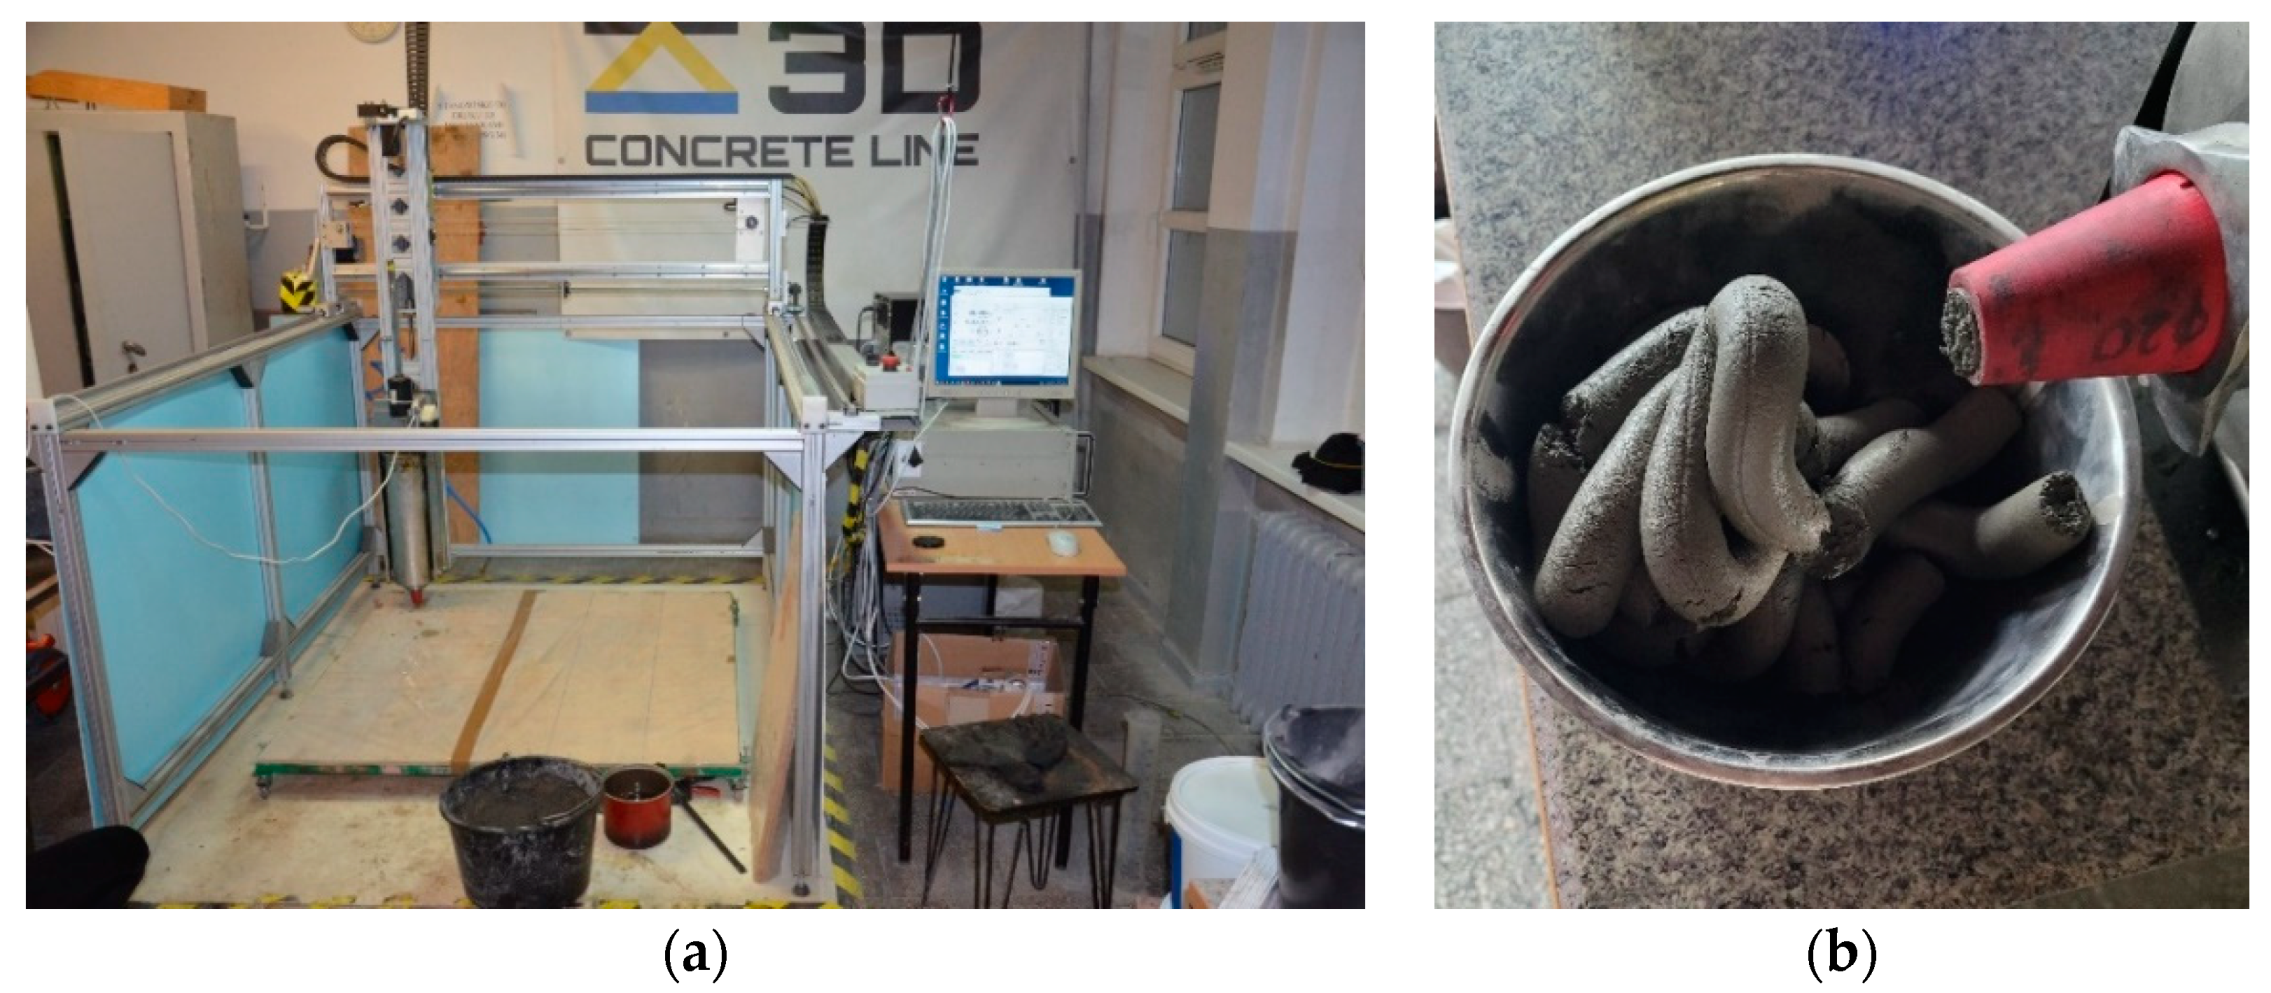
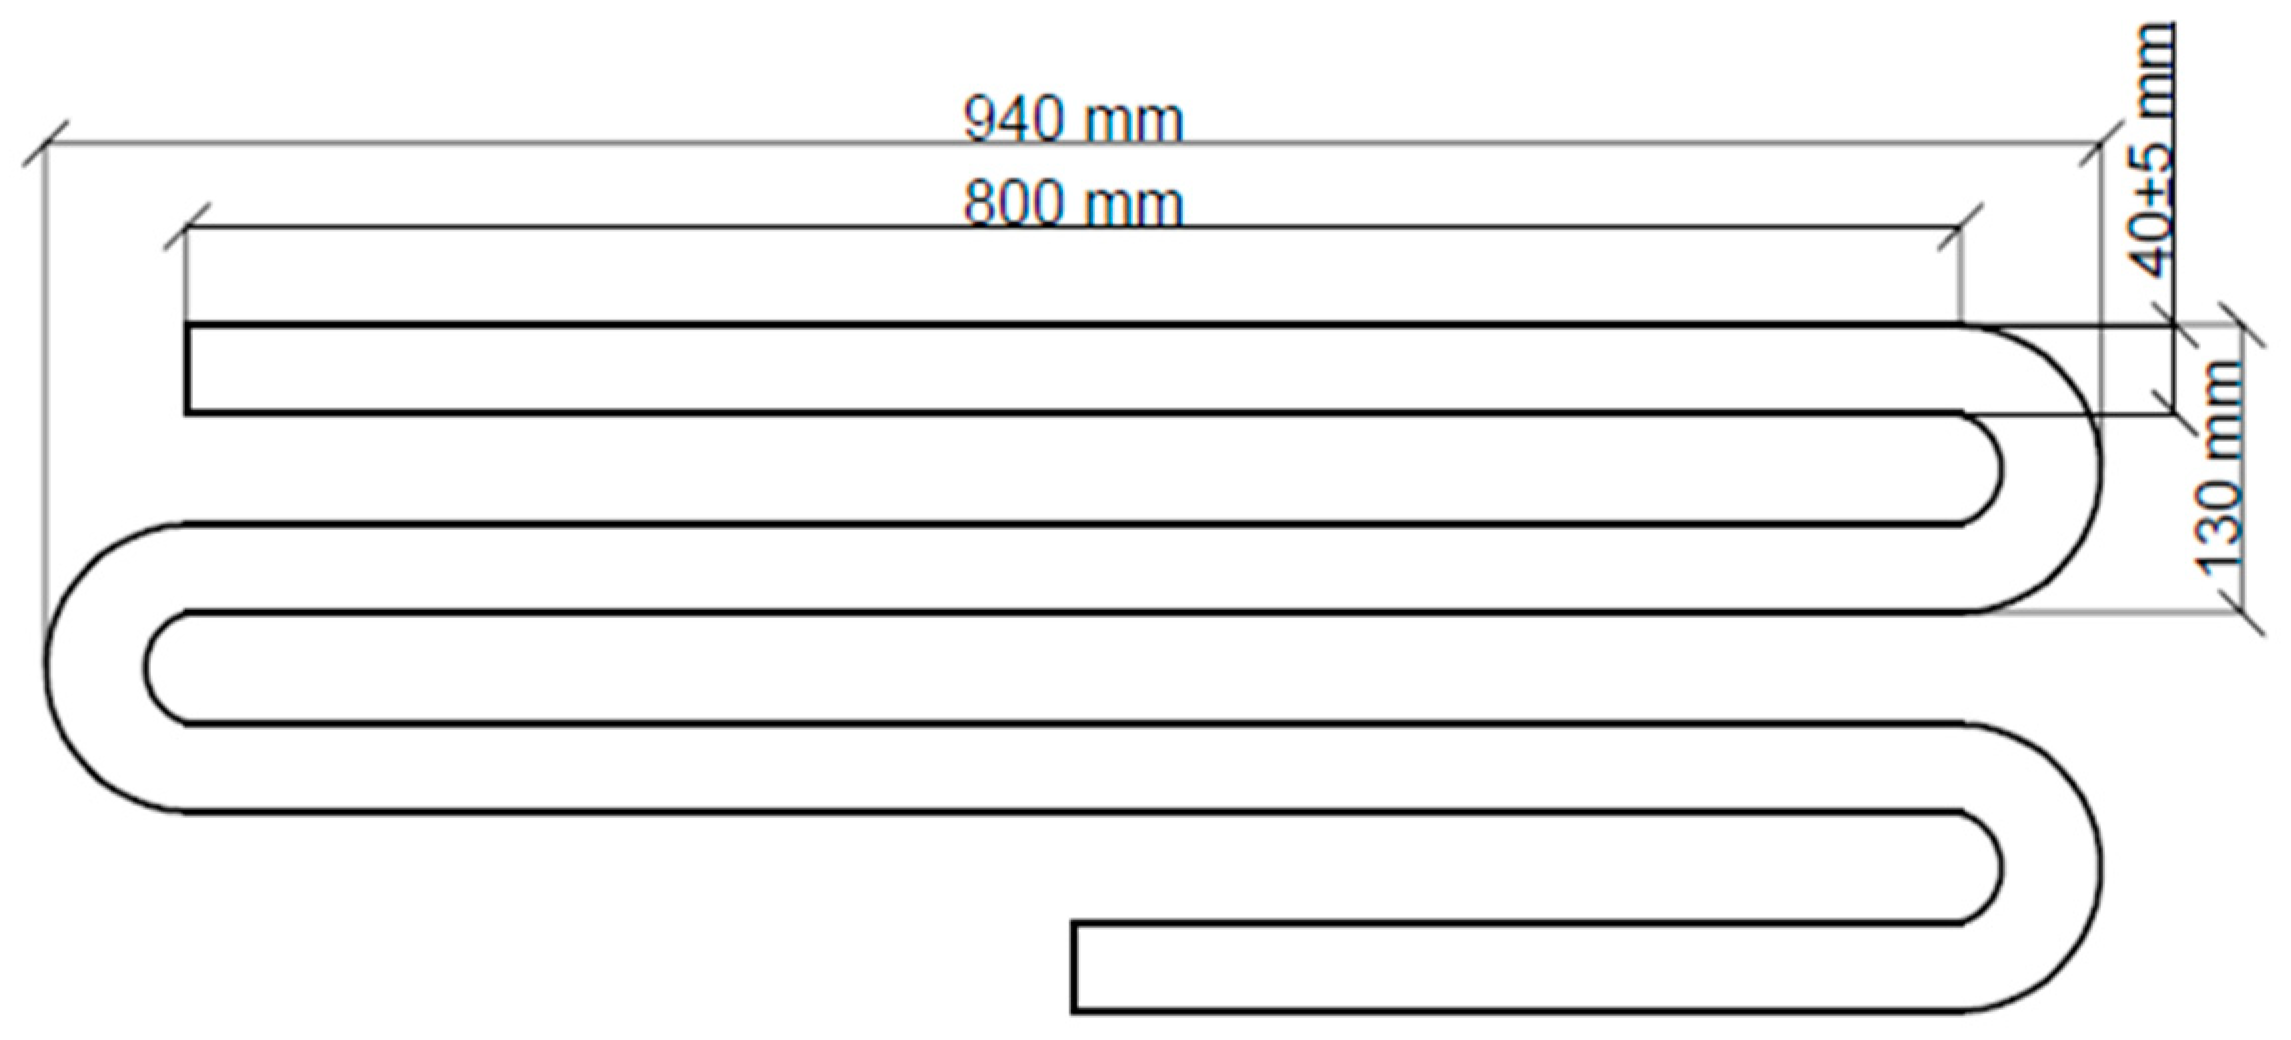
3.1. Printing Test
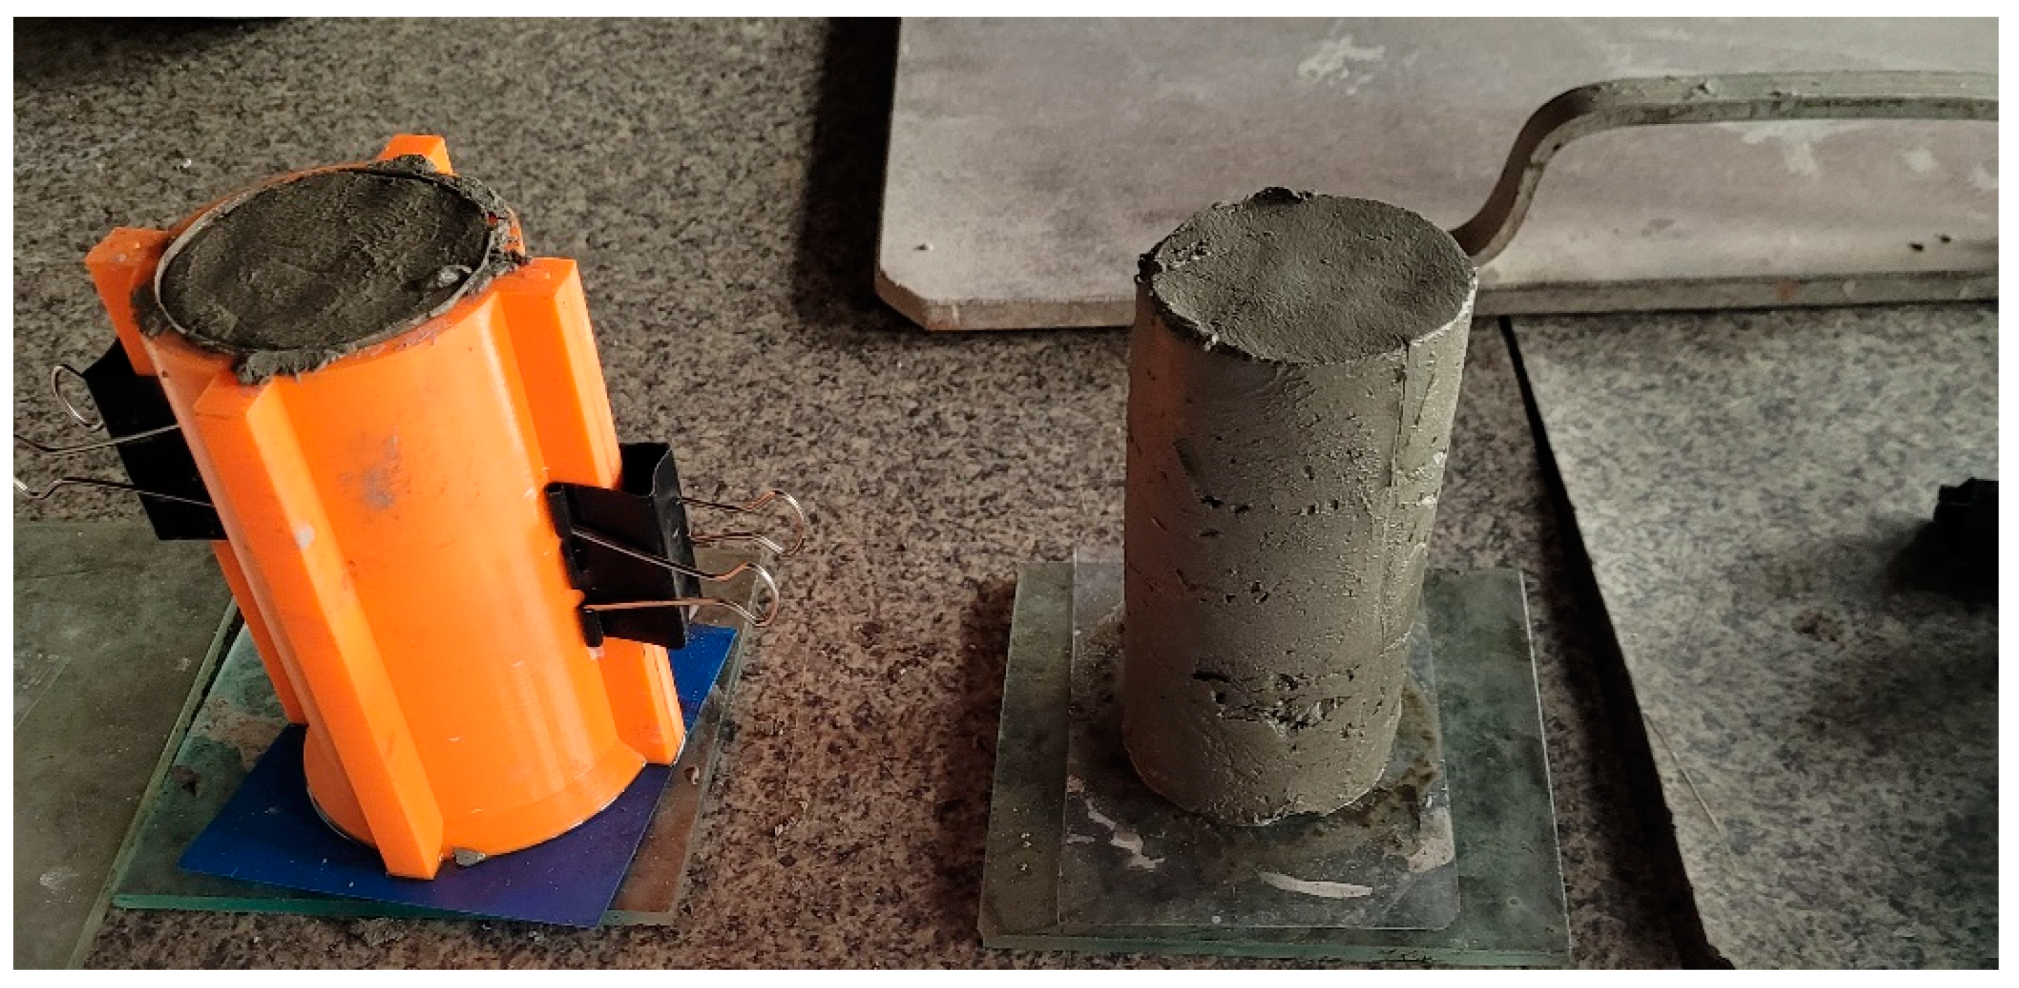
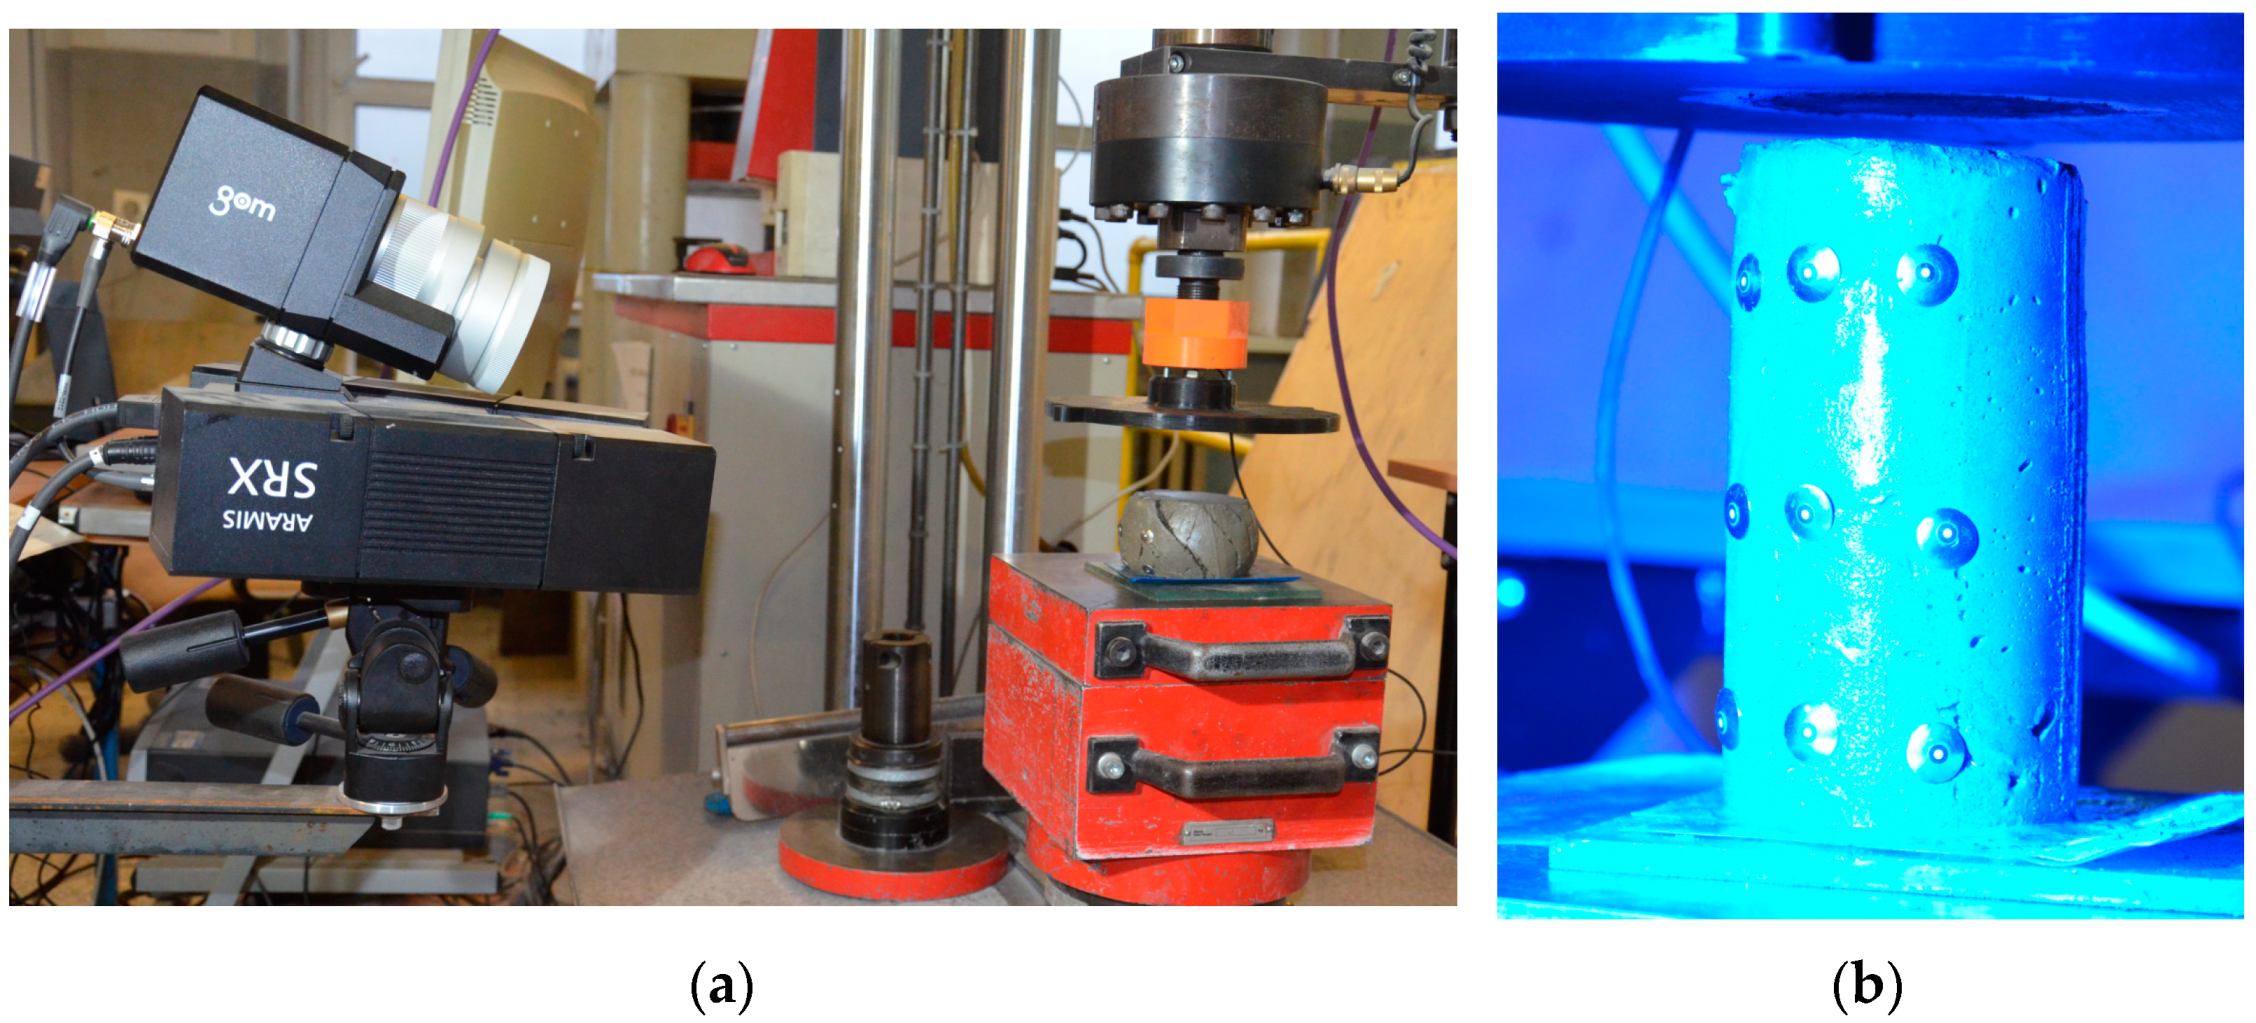
3.2. Test Setup and Uniaxial Compression Test
4. Results
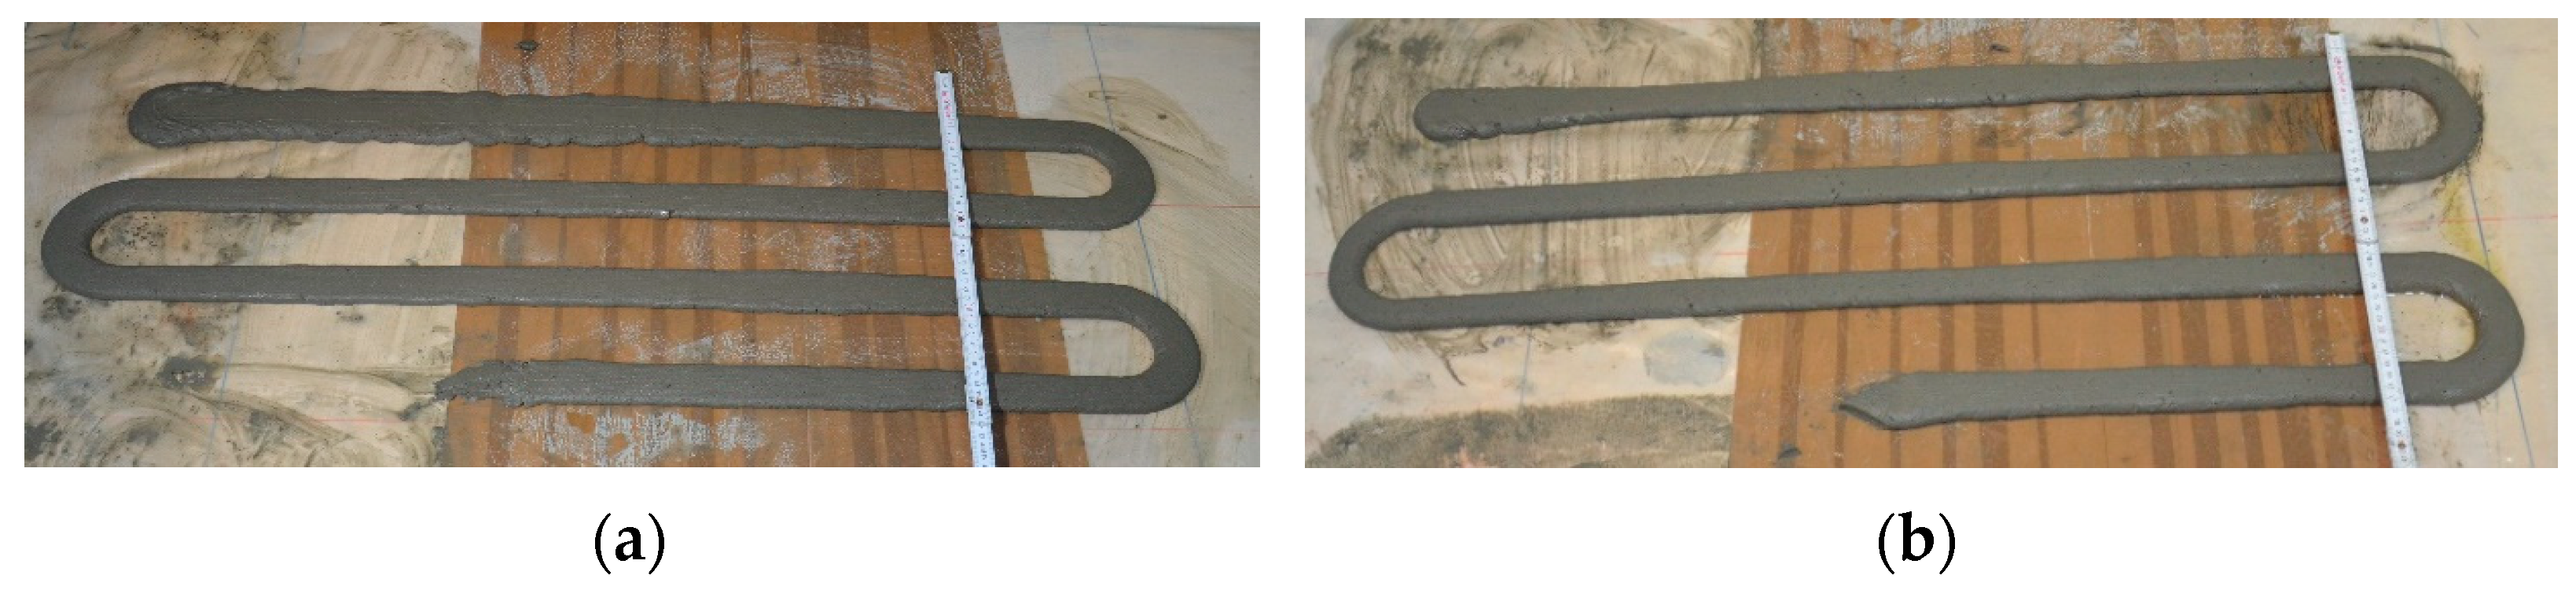
4.1. Printing Test
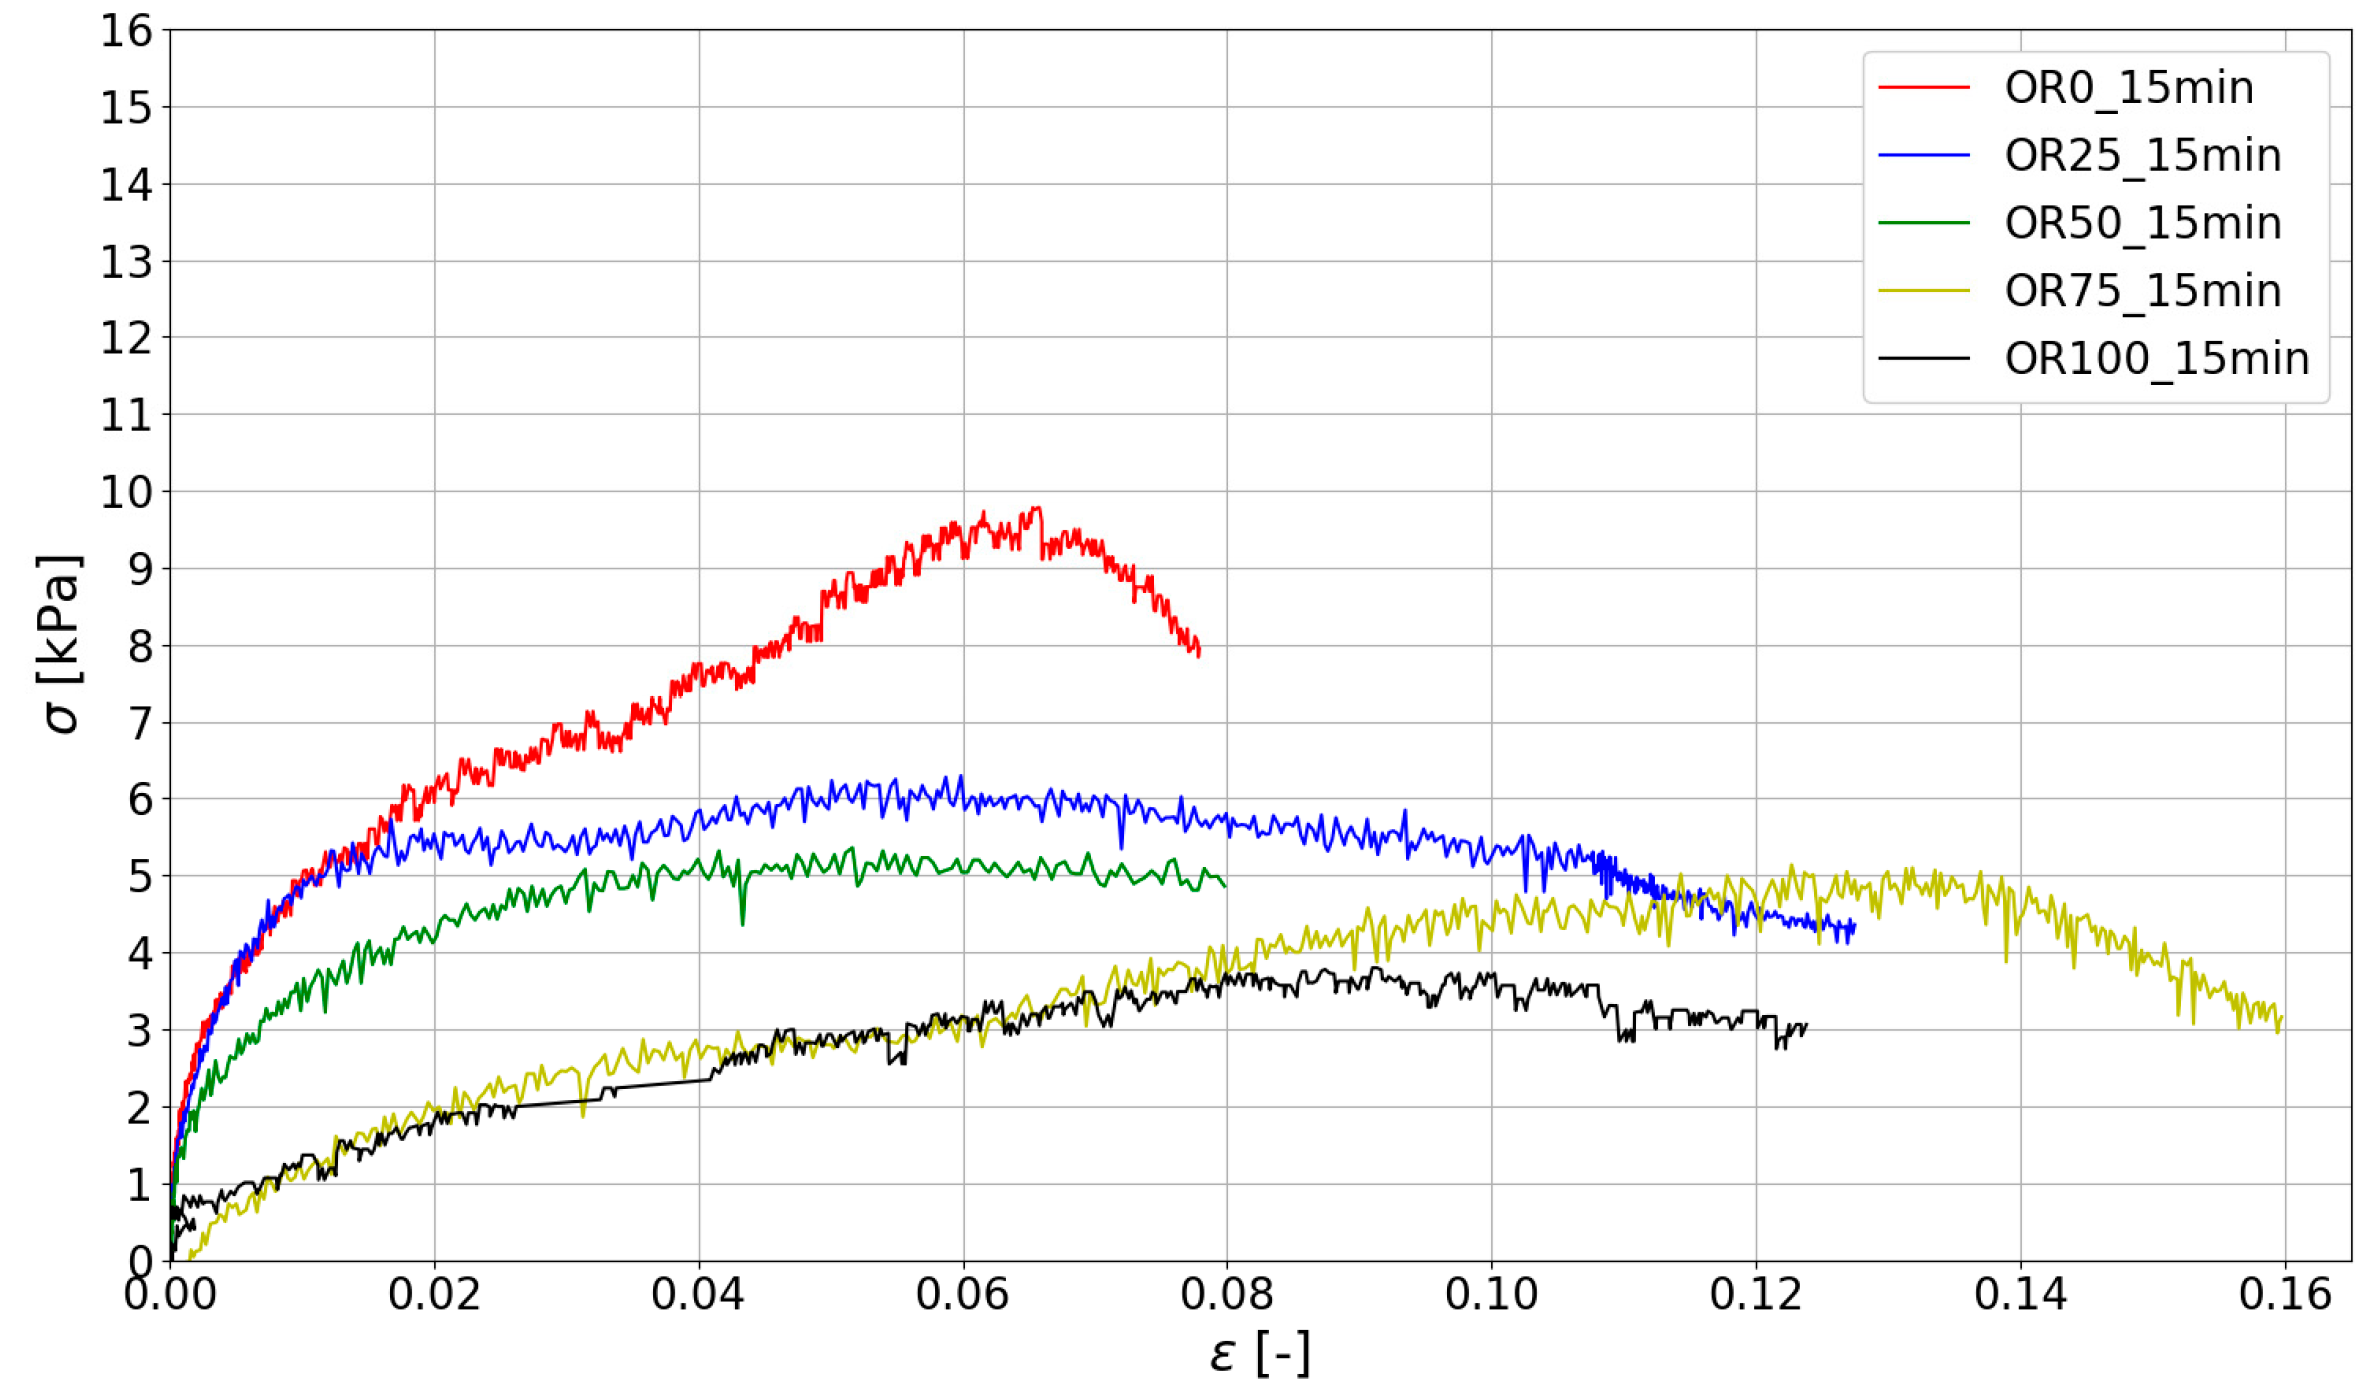
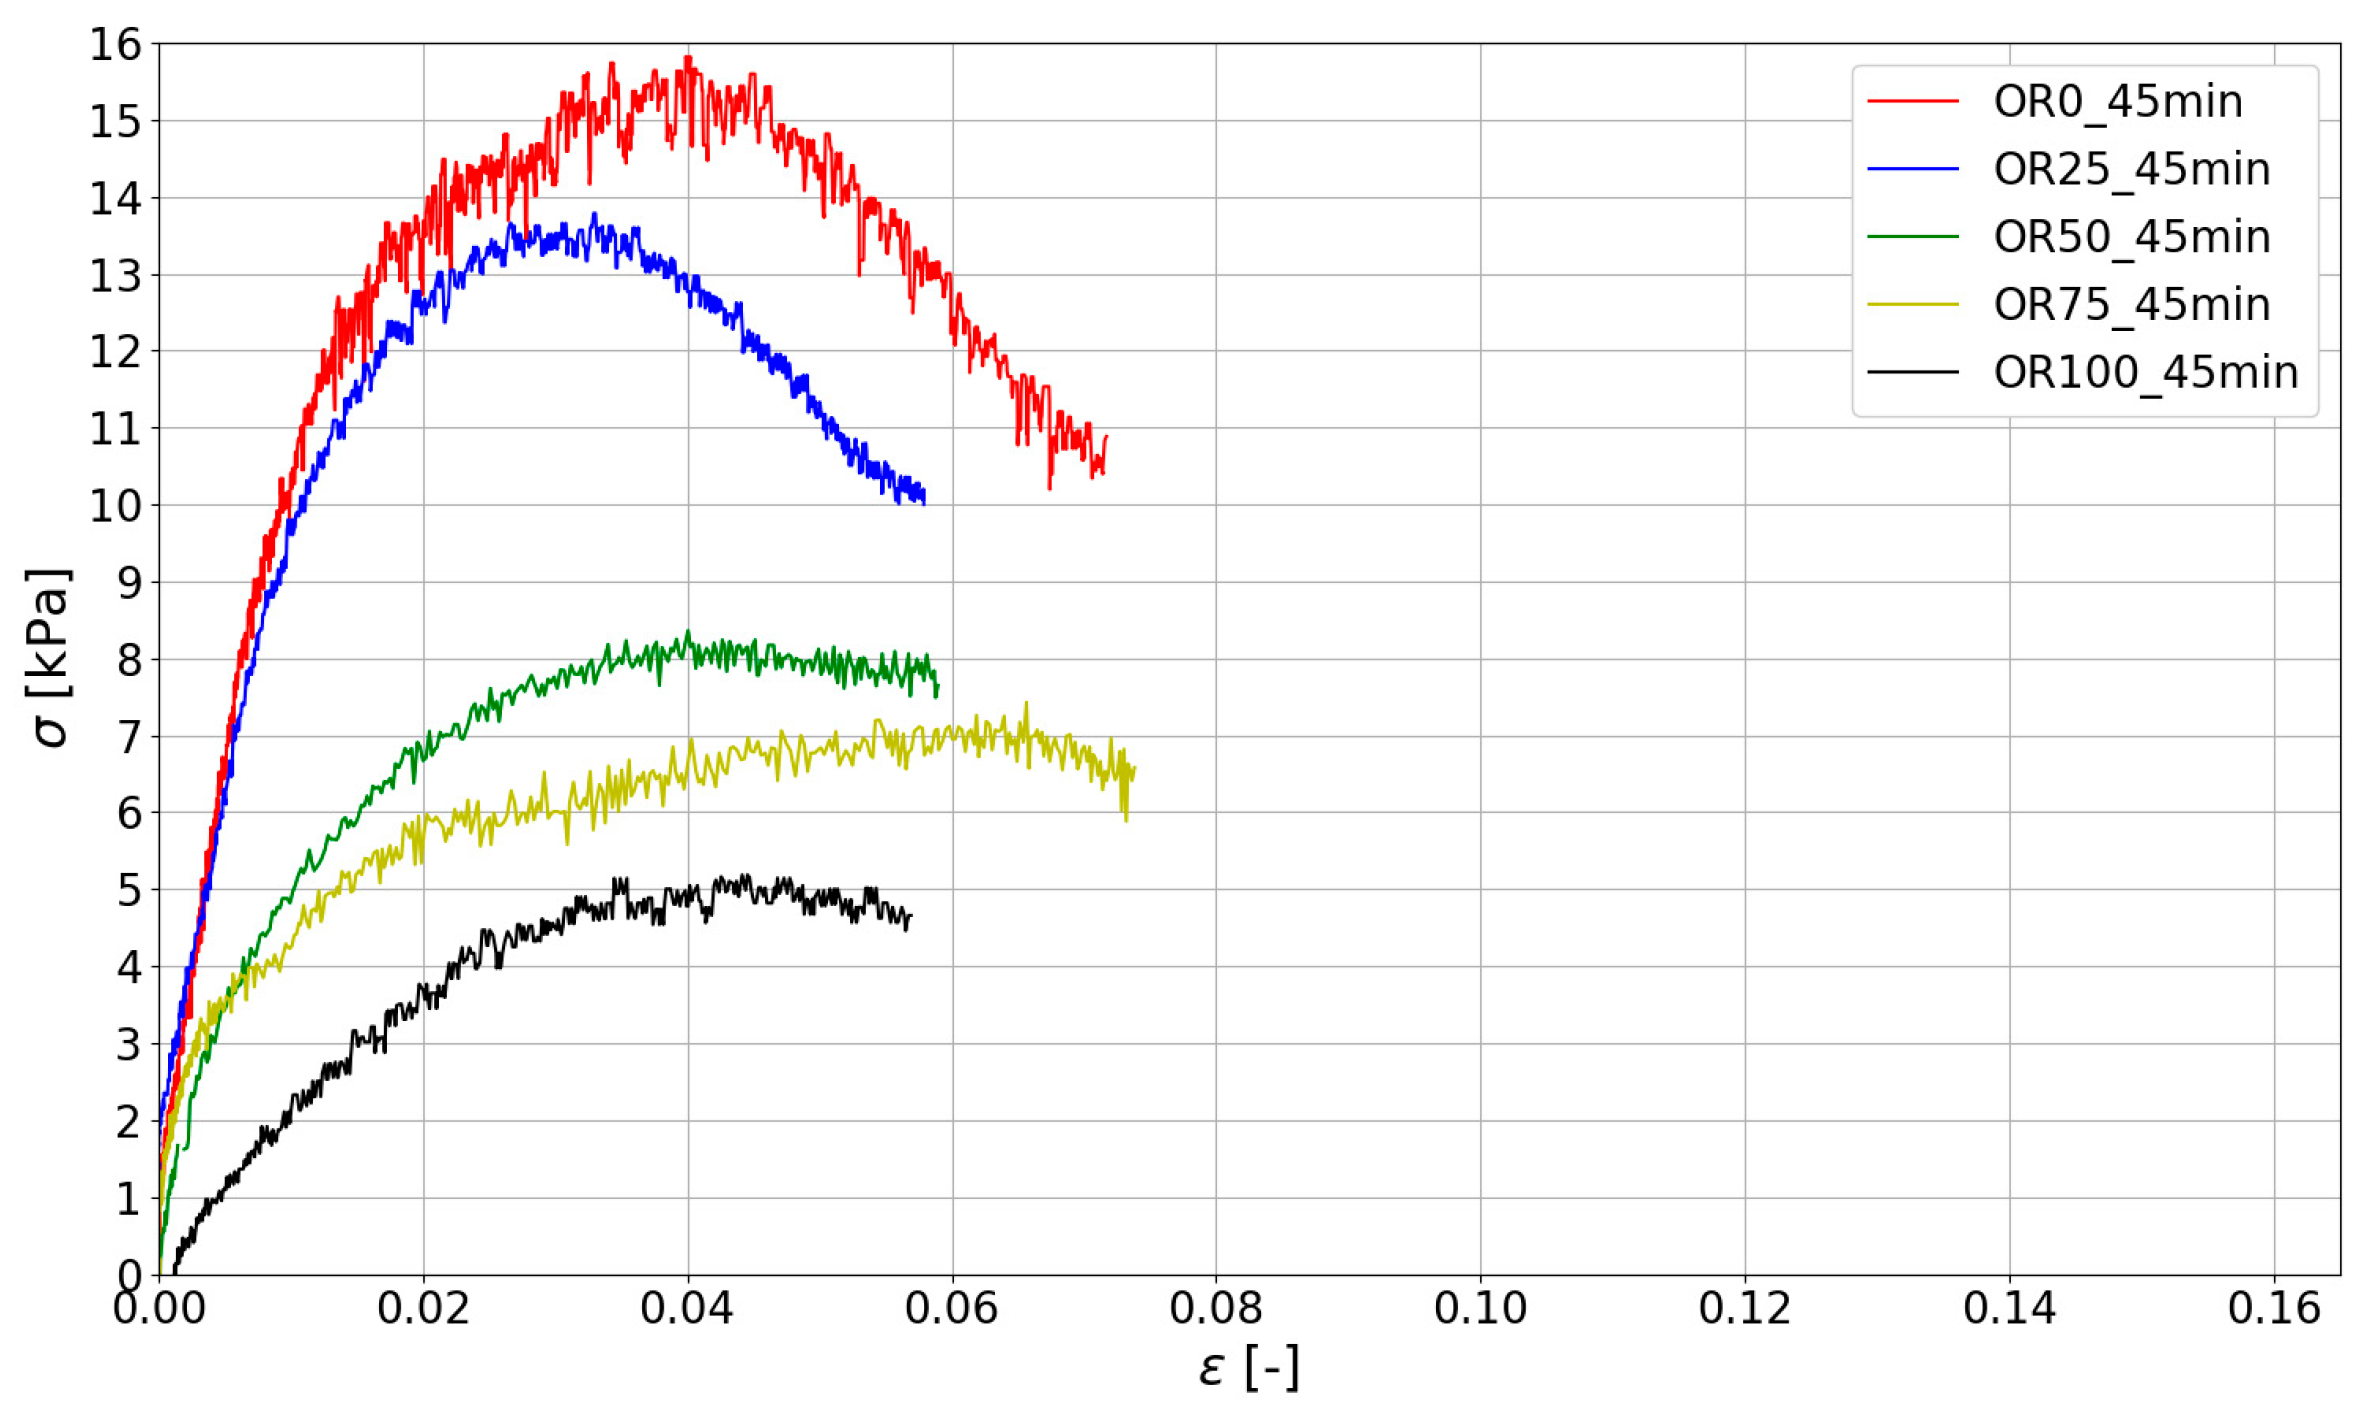
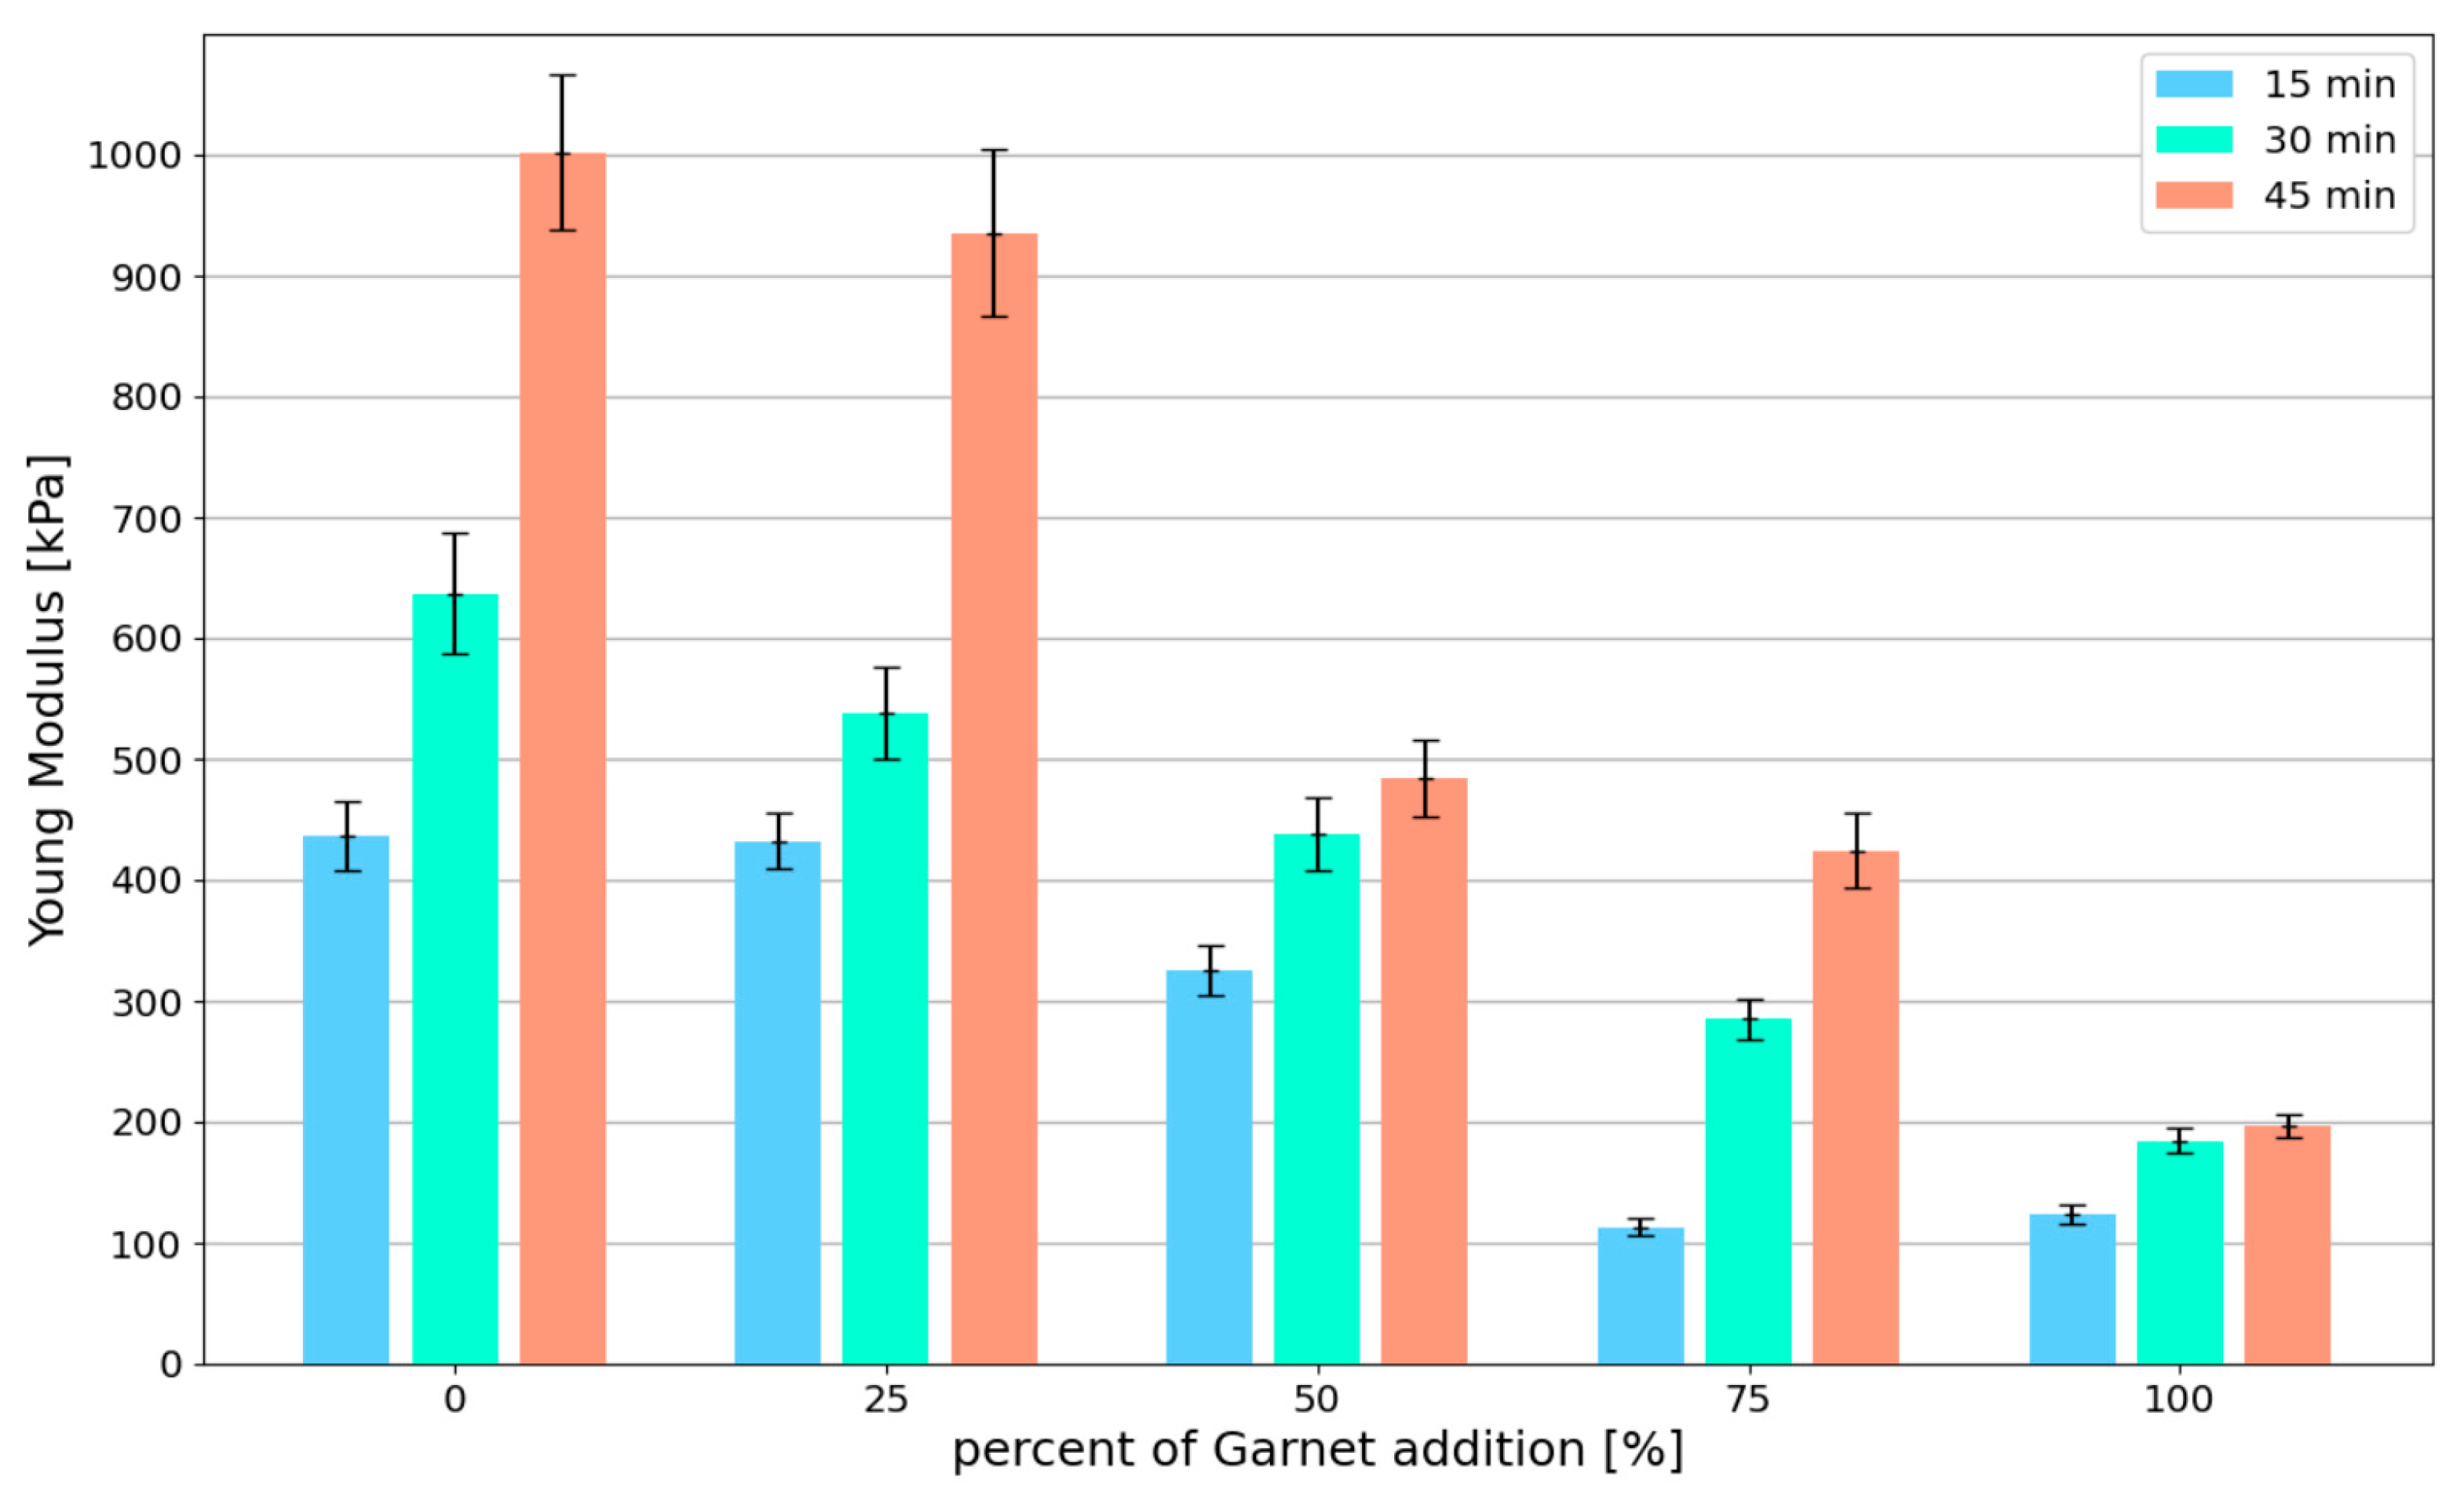
4.2. Green Strength and Young’s Modulus Development
- —Force measured on HBM C9C 0,5kN;
- —Area during the test. The ARAMIS system allows to determine the real-time area, by analyzing the displacement of markers placed on the sample (in three dimensions).
- —percentage reduction of value (—for maximum stresses; —for Young’s Modulus);
- —mean value for the control specimen;
- —mean value for specimen with spent garnet.
5. Discussion
6. Conclusions
- The maximum stresses obtained in this study in the uniaxial compressive test for the control mix are higher or equal to the results obtained by other researchers [14,21,22,23]. In addition, print quality tests (Section 4.1) were performed for all tested mixes. The mixes designed in this study meet the requirements for printing mixes and have sufficient buildability.
- Replacing the natural sand with spent garnet resulted in a decrease in maximum stress and Young’s Modulus. Significant decreases in green strength and Young’s Modulus were achieved for replacement rates of 75% and 100% (a decrease in up to 69.61% compared to control mix; a decrease in up to 80.37%). Results for the mentioned replacement ratio obtained in this study were lower than the ones found in the in the literature [14,21,22,23] (). This means that in the context of maintaining proper buildability, the recommended maximum replacement rate of natural sand with garnet is 50%. A detailed analysis is presented in Section 5.
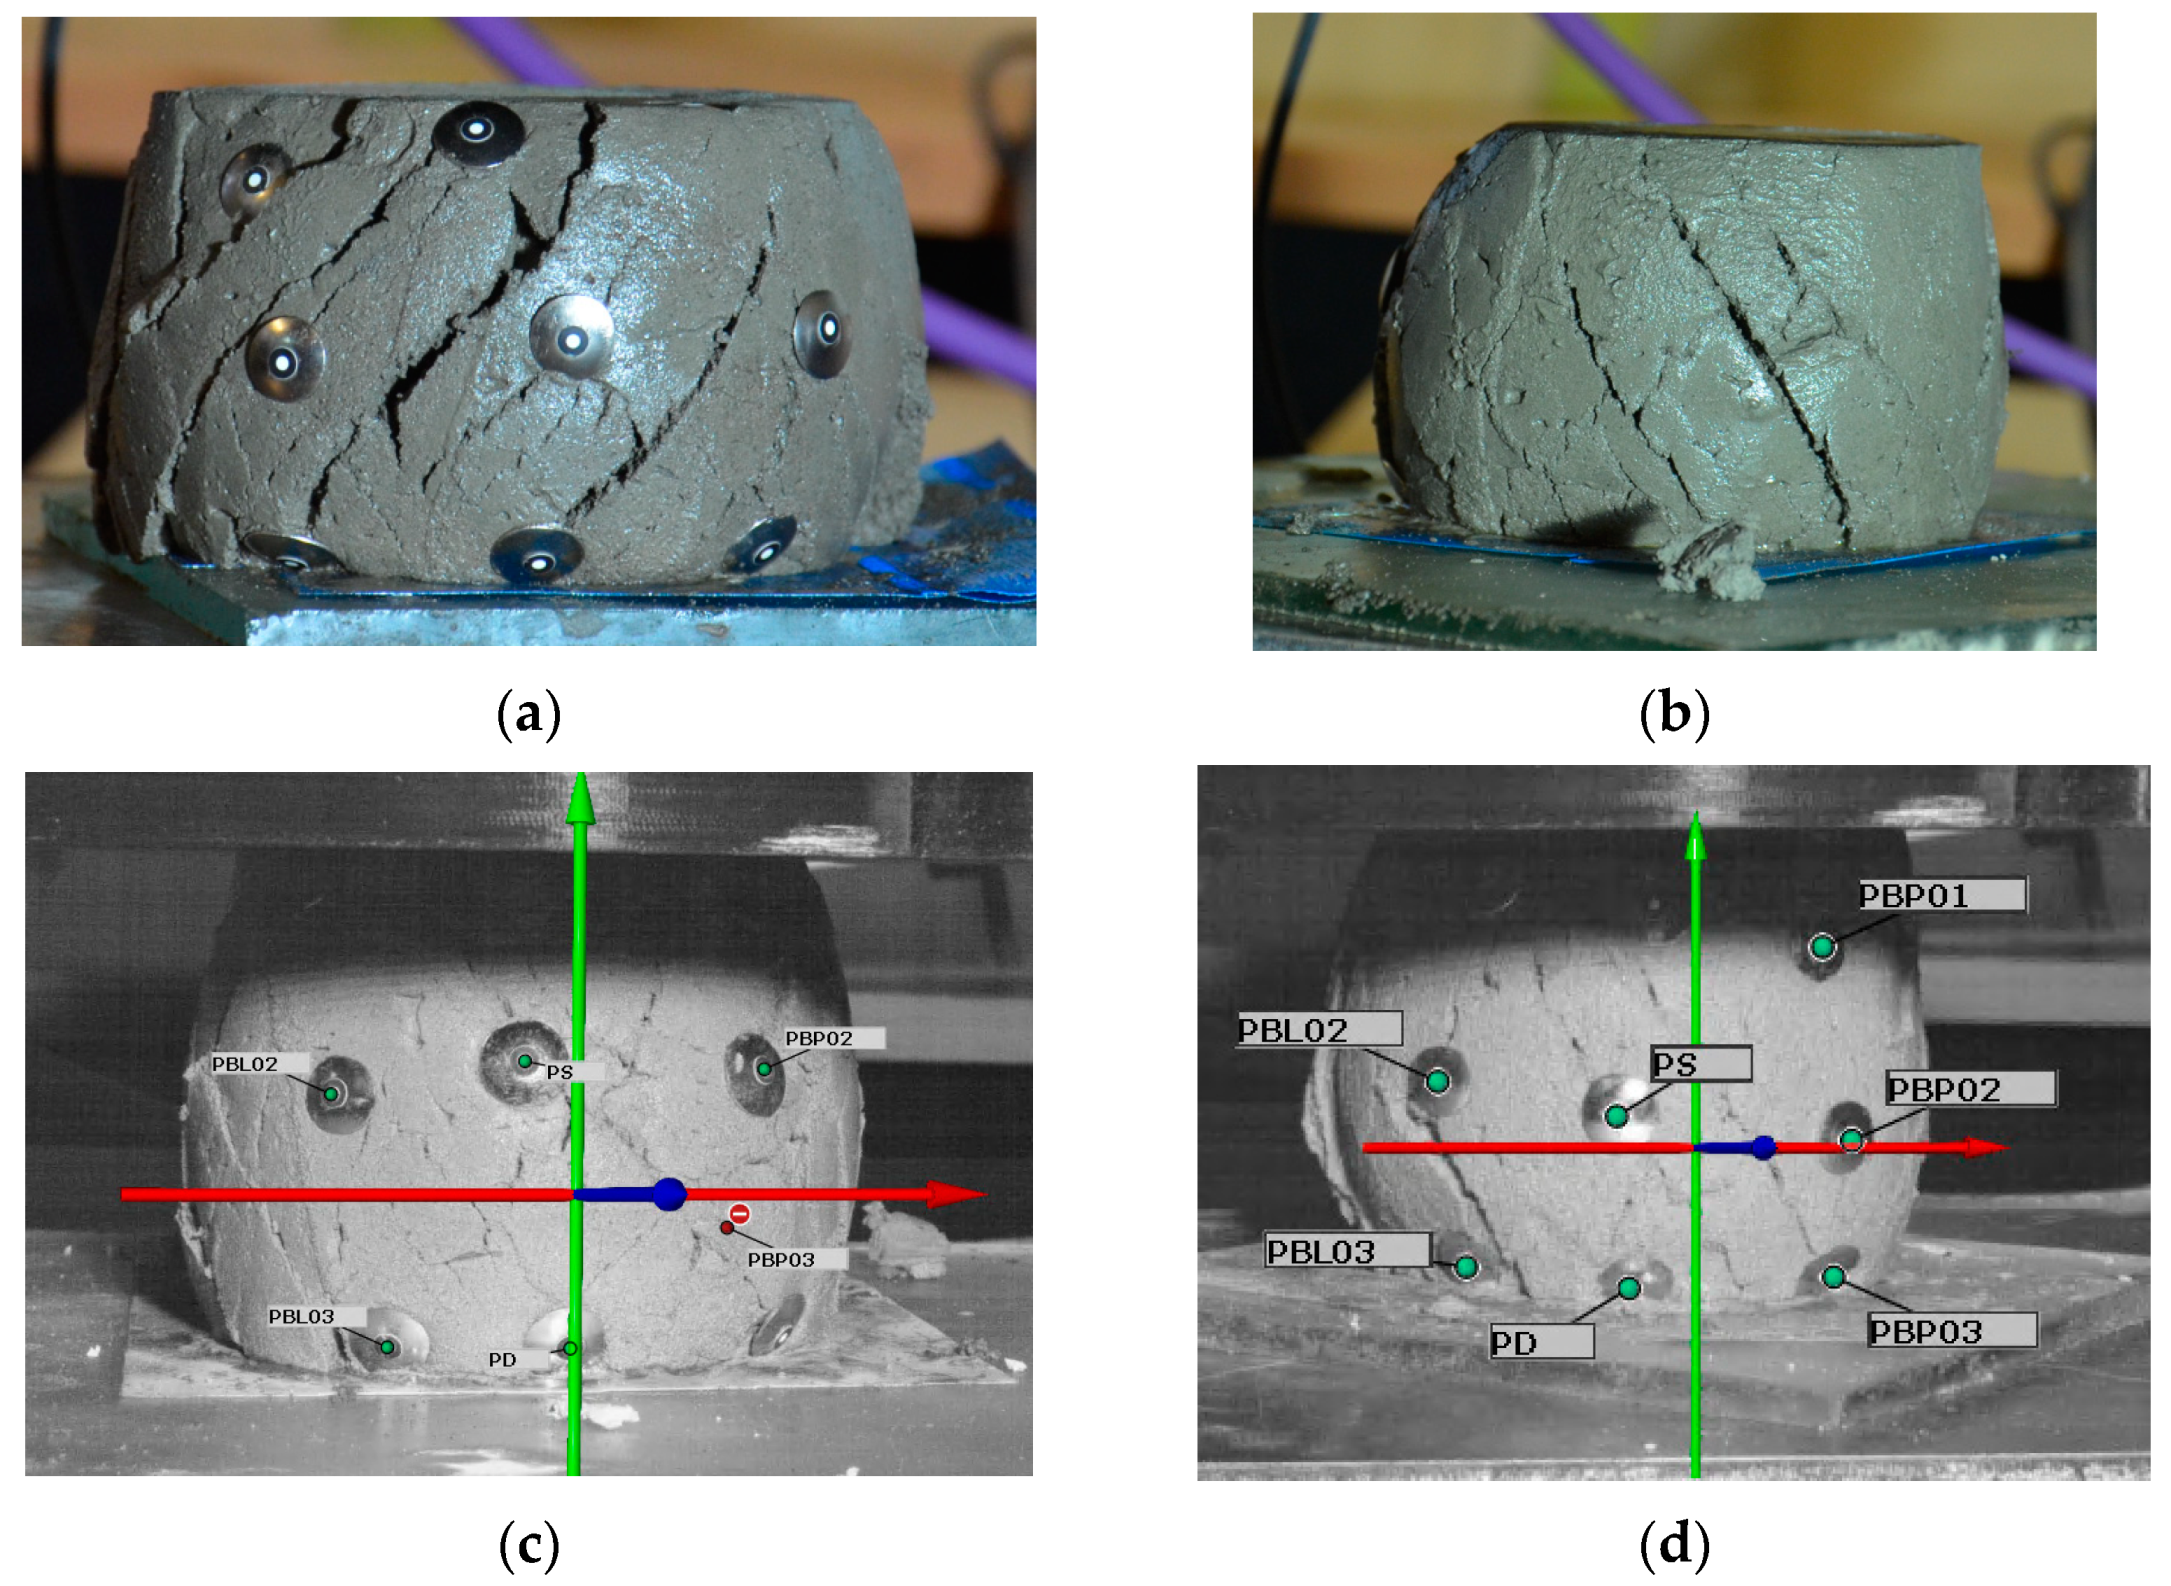
- All specimens have a similar failure pattern (Section 4.2). As the axial force was increased, the cross-section of the specimen increased significantly. When the specimen reached the maximum stress σ(ϵ), shear failure plane formation began. No differences were observed between the failure mechanisms for specimens with or without spent garnet. The content of the spent garnet did not affect the failure pattern regardless of test time.
Author Contributions
Funding
Institutional Review Board Statement
Informed Consent Statement
Data Availability Statement
Acknowledgments
Conflicts of Interest
References
- Le, T.T.; Austin, S.A.; Lim, S.; Buswell, R.A.; Gibb, A.G.F.; Thorpe, T. Mix Design and Fresh Properties for High-Performance Printing Concrete. Mater. Struct. Mater. Et Constr. 2012, 45, 1221–1232. [Google Scholar] [CrossRef] [Green Version]
- Lim, S.; Buswell, R.A.; Le, T.T.; Austin, S.A.; Gibb, A.G.F.; Thorpe, T. Developments in Construction-Scale Additive Manufacturing Processes. Autom. Constr. 2012, 21, 262–268. [Google Scholar] [CrossRef] [Green Version]
- Le, T.T.; Austin, S.A.; Lim, S.; Buswell, R.A.; Law, R.; Gibb, A.G.F.; Thorpe, T. Hardened Properties of High-Performance Printing Concrete. Cem. Concr. Res. 2012, 42, 558–566. [Google Scholar] [CrossRef] [Green Version]
- Wangler, T.; Roussel, N.; Bos, F.P.; Salet, T.A.M.; Flatt, R.J. Digital Concrete: A Review. Cem. Concr. Res. 2019, 123, 105780. [Google Scholar] [CrossRef]
- Wolfs, R.J.M.; Bos, F.P.; Salet, T.A.M. Hardened Properties of 3D Printed Concrete: The Influence of Process Parameters on Interlayer Adhesion. Cem. Concr. Res. 2019, 119, 132–140. [Google Scholar] [CrossRef]
- Skibicki, S.; Pultorak, M.; Kaszynska, M. Evaluation of Material Modification Using PET in 3D Concrete Printing Technology. IOP Conf. Ser. Mater. Sci. Eng. 2021, 1044, 012002. [Google Scholar] [CrossRef]
- Sikora, P.; Chougan, M.; Cuevas, K.; Liebscher, M.; Mechtcherine, V.; Ghaffar, S.H.; Liard, M.; Lootens, D.; Krivenko, P.; Sanytsky, M.; et al. The Effects of Nano- and Micro-Sized Additives on 3D Printable Cementitious and Alkali-Activated Composites: A Review. Appl. Nanosci. 2021. [Google Scholar] [CrossRef]
- Sikora, P.; Chung, S.-Y.; Liard, M.; Lootens, D.; Dorn, T.; Kamm, P.H.; Stephan, D.; Abd Elrahman, M. The Effects of Nanosilica on the Fresh and Hardened Properties of 3D Printable Mortars. Constr. Build. Mater. 2021, 281, 122574. [Google Scholar] [CrossRef]
- Federowicz, K.; Kaszyńska, M.; Zieliński, A.; Hoffmann, M. Effect of Curing Methods on Shrinkage Development in 3D-Printed Concrete. Materials 2020, 13, 2590. [Google Scholar] [CrossRef]
- Farina, I.; Fabbrocino, F.; Carpentieri, G.; Modano, M.; Amendola, A.; Goodall, R.; Feo, L.; Fraternali, F. On the Reinforcement of Cement Mortars through 3D Printed Polymeric and Metallic Fibers. Compos. Part B Eng. 2016, 90, 76–85. [Google Scholar] [CrossRef]
- Farina, I.; Fabbrocino, F.; Colangelo, F.; Feo, L.; Fraternali, F. Surface Roughness Effects on the Reinforcement of Cement Mortars through 3D Printed Metallic Fibers. Compos. Part B Eng. 2016, 99, 305–311. [Google Scholar] [CrossRef]
- Skibicki, S.; Techman, M.; Federowicz, K.; Olczyk, N.; Hoffmann, M. Experimental Study of Hardened Young’s Modulus for 3D Printed Mortar. Materials 2021, 14, 7643. [Google Scholar] [CrossRef]
- Skibicki, S.; Kaszyńska, M.; Wahib, N.; Techman, M.; Federowicz, K.; Zieliński, A.; Wróblewski, T.; Olczyk, N.; Hoffmann, M. Properties of Composite Modified with Limestone Powder for 3D Concrete Printing. In RILEM International Conference on Concrete and Digital Fabrication; Springer: Cham, Switzerland, 2020; pp. 125–134. [Google Scholar]
- Casagrande, L.; Esposito, L.; Menna, C.; Asprone, D.; Auricchio, F. Effect of Testing Procedures on Buildability Properties of 3D-Printable Concrete. Constr. Build. Mater. 2020, 245, 118286. [Google Scholar] [CrossRef]
- Lorenzo, L.E.; Costantino, C.; Domenico, M.; Ferdinando Auricchio, A. Early-Age Creep Behaviour of 3D Printable Mortars: Experimental Characterisation and Analytical Modelling. Mater. Struct. 2021, 54, 1–16. [Google Scholar] [CrossRef]
- Reiter, L.; Wangler, T.; Roussel, N.; Flatt, R.J. The Role of Early Age Structural Build-up in Digital Fabrication with Concrete. Cem. Concr. Res. 2018, 112, 86–95. [Google Scholar] [CrossRef]
- Roussel, N. Rheological Requirements for Printable Concretes. Cem. Concr. Res. 2018, 112, 76–85. [Google Scholar] [CrossRef]
- Secrieru, E.; Fataei, S.; Schröfl, C.; Mechtcherine, V. Study on Concrete Pumpability Combining Different Laboratory Tools and Linkage to Rheology. Constr. Build. Mater. 2017, 144, 451–461. [Google Scholar] [CrossRef]
- Perrot, A.; Rangeard, D.; Pierre, A. Structural Built-up of Cement-Based Materials Used for 3D-Printing Extrusion Techniques. Mater. Struct. 2016, 49, 1213–1220. [Google Scholar] [CrossRef]
- Toutou, Z.; Roussel, N.; Lanos, C. The Squeezing Test: A Tool to Identify Firm Cement-Based Material’s Rheological Behaviour and Evaluate Their Extrusion Ability. Cem. Concr. Res. 2005, 35, 1891–1899. [Google Scholar] [CrossRef]
- Ding, T.; Xiao, J.; Qin, F.; Duan, Z. Mechanical Behavior of 3D Printed Mortar with Recycled Sand at Early Ages. Constr. Build. Mater. 2020, 248, 118654. [Google Scholar] [CrossRef]
- Wolfs, R.J.M.; Bos, F.P.; Salet, T.A.M. Early Age Mechanical Behaviour of 3D Printed Concrete: Numerical Modelling and Experimental Testing. Cem. Concr. Res. 2018, 106, 103–116. [Google Scholar] [CrossRef]
- Panda, B.; Lim, J.H.; Tan, M.J. Mechanical Properties and Deformation Behaviour of Early Age Concrete in the Context of Digital Construction. Compos. Part B Eng. 2019, 165, 563–571. [Google Scholar] [CrossRef]
- Kaszyńska, M.; Zieliński, A. Influence of Mixture Composition on Shrinkage Cracking of Lightweight Self-Consolidating Concrete. In Brittle Matrix Composites 10; Elsevier: Amsterdam, The Netherlands, 2012; pp. 265–274. [Google Scholar]
- Kaszynska, M.; Skibicki, S. Influence of Eco-Friendly Mineral Additives on Early Age Compressive Strength and Temperature Development of High-Performance Concrete. IOP Conf. Ser. Earth Environ. Sci. 2017, 95, 042060. [Google Scholar] [CrossRef]
- Federowicz, K.; Techman, M.; Sanytsky, M.; Sikora, P. Modification of Lightweight Aggregate Concretes with Silica Nanoparticles-a Review. Materials 2021, 14, 4242. [Google Scholar] [CrossRef] [PubMed]
- Kaszyńska, M.; Skibicki, S.; Hoffmann, M. 3D Concrete Printing for Sustainable Construction. Energies 2020, 13, 6351. [Google Scholar] [CrossRef]
- Pichór, W.; Barna, M.; Kapeluszna, E.; Łagosz, A.; Kotwica, Ł. The Influence of Waste Expanded Perlite on Chemical Durability of Mortars. Solid State Phenom. 2015, 227, 194–198. [Google Scholar] [CrossRef]
- Kaszyńska, M.; Hoffmann, M.; Skibicki, S.; Zieliński, A.; Techman, M.; Olczyk, N.; Wróblewski, T. Evaluation of Suitability for 3D Printing of High Performance Concretes. MATEC Web Conf. 2018, 163, 01002. [Google Scholar] [CrossRef]
- Lu, B.; Weng, Y.; Li, M.; Qian, Y.; Leong, K.F.; Tan, M.J.; Qian, S. A Systematical Review of 3D Printable Cementitious Materials. Constr. Build. Mater. 2019, 207, 477–490. [Google Scholar] [CrossRef]
- Chougan, M.; Ghaffar, S.H.; Sikora, P.; Chung, S.-Y.; Rucinska, T.; Stephan, D.; Albar, A.; Swash, M.R. Investigation of Additive Incorporation on Rheological, Microstructural and Mechanical Properties of 3D Printable Alkali-Activated Materials. Mater. Des. 2021, 202, 109574. [Google Scholar] [CrossRef]
- Cuevas, K.; Chougan, M.; Martin, F.; Ghaffar, S.H.; Stephan, D.; Sikora, P. 3D Printable Lightweight Cementitious Composites with Incorporated Waste Glass Aggregates and Expanded Microspheres—Rheological, Thermal and Mechanical Properties. J. Build. Eng. 2021, 44, 102718. [Google Scholar] [CrossRef]
- Marinković, S.; Radonjanin, V.; Malešev, M.; Ignjatović, I. Comparative Environmental Assessment of Natural and Recycled Aggregate Concrete. Waste Manag. 2010, 30, 2255–2264. [Google Scholar] [CrossRef] [PubMed]
- Faleschini, F.; Zanini, M.A.; Pellegrino, C.; Pasinato, S. Sustainable Management and Supply of Natural and Recycled Aggregates in a Medium-Size Integrated Plant. Waste Manag. 2016, 49, 146–155. [Google Scholar] [CrossRef]
- Safiuddin, M.; Alengaram, U.J.; Rahman, M.; Salam, M.A.; Jumaat, Z. Use of recycled concrete aggregate in concrete: A review. J. Civ. Eng. Manag. 2013, 19, 796–810. [Google Scholar] [CrossRef]
- Jamaludin, N.F.A.; Muthusamy, K.; Isa, N.N.; Md Jaafar, M.F.; Ghazali, N. Use of Spent Garnet in Industry: A Review. Mater. Today Proc. 2021. [Google Scholar] [CrossRef]
- Huseien, G.F.; Sam, A.R.M.; Shah, K.W.; Budiea, A.M.A.; Mirza, J. Utilizing Spend Garnets as Sand Replacement in Alkali-Activated Mortars Containing Fly Ash and GBFS. Constr. Build. Mater. 2019, 225, 132–145. [Google Scholar] [CrossRef]
- Muttashar, H.L.; Ariffin, M.A.M.; Hussein, M.N.; Hussin, M.W.; Ishaq, S. bin Self-Compacting Geopolymer Concrete with Spend Garnet as Sand Replacement. J. Build. Eng. 2018, 15, 85–94. [Google Scholar] [CrossRef]
- Usman, K.R.; Hainin, M.R.; Satar, M.K.I.M.; Warid, M.N.M.; Usman, A.; Al-Saffar, Z.H.; Bilema, M.A. A Comparative Assessment of the Physical and Microstructural Properties of Waste Garnet Generated from Automated and Manual Blasting Process. Case Stud. Constr. Mater. 2021, 14, e00474. [Google Scholar] [CrossRef]
- Žibret, G.; Teran, K.; Žibret, L.; Šter, K.; Dolenec, S. Building of the Al-Containing Secondary Raw Materials Registry for the Production of Low CO 2 Mineral Binders in South-Eastern European Region. Sustainability 2021, 13, 1535. [Google Scholar] [CrossRef]
- Kapeluszna, E.; Kotwica, Ł.; Pichór, W.; Nocuń-Wczelik, W. Cement-Based Composites with Waste Expanded Perlite—Structure, Mechanical Properties and Durability in Chloride and Sulphate Environments. Sustain. Mater. Technol. 2020, 24, e00160. [Google Scholar] [CrossRef]
- Kapeluszna, E.; Kotwica, Ł.; Nocuń-Wczelik, W. Comparison of the Effect of Ground Waste Expanded Perlite and Silica Fume on the Hydration of Cements with Various Tricalcium Aluminate Content—Comprehensive Analysis. Constr. Build. Mater. 2021, 303, 124434. [Google Scholar] [CrossRef]
- Kunchariyakun, K.; Sukmak, P. Utilization of Garnet Residue in Radiation Shielding Cement Mortar. Constr. Build. Mater. 2020, 262, 120122. [Google Scholar] [CrossRef]
- Ding, T.; Xiao, J.; Zou, S.; Wang, Y. Hardened Properties of Layered 3D Printed Concrete with Recycled Sand. Cem. Concr. Compos. 2020, 113, 103724. [Google Scholar] [CrossRef]
- Ding, T.; Xiao, J.; Zou, S.; Yu, J. Flexural Properties of 3D Printed Fibre-Reinforced Concrete with Recycled Sand. Constr. Build. Mater. 2021, 288, 123077. [Google Scholar] [CrossRef]
- Zhang, H.; Xiao, J. Plastic Shrinkage and Cracking of 3D Printed Mortar with Recycled Sand. Constr. Build. Mater. 2021, 302, 124405. [Google Scholar] [CrossRef]
- Wu, Y.; Liu, C.; Liu, H.; Zhang, Z.; He, C.; Liu, S.; Zhang, R.; Wang, Y.; Bai, G. Study on the Rheology and Buildability of 3D Printed Concrete with Recycled Coarse Aggregates. J. Build. Eng. 2021, 42, 103030. [Google Scholar] [CrossRef]
- EN 1744-3:2002. Tests for Chemical Properties of Aggregates—Part 3: Preparation of Eluates by Leaching of Aggregates. Available online: https://standards.iteh.ai/catalog/standards/cen/9a6307ba-a188-4e25-855d-c1516d621a71/en-1744-3-2002 (accessed on 30 November 2021).
- Musson, S.E.; Jang, Y.-C.; Townsend, T.G.; Chung, I.-H. Characterization of Lead Leachability from Cathode Ray Tubes Using the Toxicity Characteristic Leaching Procedure. Environ. Sci. Technol. 2000, 34, 4376–4381. [Google Scholar] [CrossRef]
- EN 1015-3:2000. Methods of Test for Mortar for Masonry—Part 3: Determination of Consistence of Fresh Mortar (by Flow Table). Available online: https://standards.iteh.ai/catalog/standards/cen/f427f20a-2746-4ab7-bd55-d1c455b1f009/en-1015-3-1999 (accessed on 30 November 2021).
- Hoffmann, M.; Skibicki, S.; Pankratow, P.; Zieliński, A.; Pajor, M.; Techman, M. Automation in the Construction of a 3D-Printed Concrete Wall with the Use of a Lintel Gripper. Materials 2020, 13, 1800. [Google Scholar] [CrossRef] [PubMed] [Green Version]
- Cho, S.; Kruger, J.; Bester, F.; van den Heever, M.; van Rooyen, A.; van Zijl, G. A Compendious Rheo-Mechanical Test for Printability Assessment of 3D Printable Concrete. In RILEM International Conference on Concrete and Digital Fabrication; Springer: Cham, Switzerland, 2020; pp. 196–205. [Google Scholar]
- Kazemian, A.; Yuan, X.; Cochran, E.; Khoshnevis, B. Cementitious Materials for Construction-Scale 3D Printing: Laboratory Testing of Fresh Printing Mixture. Constr. Build. Mater. 2017, 145, 639–647. [Google Scholar] [CrossRef]


| Element | Concentration [mg/L] | Method of Metal Analysis |
|---|---|---|
| Zn | 0.011 | Flame—air/acetylene |
| Cd | 0.016 | Flame—air/acetylene |
| Cu | 0.037 | Flame—air/acetylene |
| Ni | 0.053 | Flame—air/acetylene |
| Pb | 0.074 | Flame—air/acetylene |
| Fe | 0.053 | Flame—air/acetylene |
| Hg | 0.0008 | Hydrides—cold vapors |
| Cr | 0.011 | Flame—nitrous oxide/acetylene |
| Chemical Composition, % by Weight | CEM I 52.5 R | Fly Ash | Silica Fume |
|---|---|---|---|
| SiO2 | 19.70 | 54.00 | 94.00 |
| Al2O3 | 4.93 | 28.40 | – |
| Fe2O3 | 2.54 | 7.30 | – |
| CaO | 64.23 | 3.10 | 0.30 |
| CaCO3 | – | – | – |
| MgO | 1.32 | 2.40 | – |
| SO3 | 2.91 | 0.40 | 1.90 |
| Na2O | 0.12 | 1.10 | – |
| K2O | 0.76 | 2.90 | – |
| Cl- | 0.07 | 0.01 | 0.10 |
| H2O | – | – | 0.70 |
| Na20eq | 0.63 | – | – |
| LOI | – | – | 3.00 |
| Mix | Spent Garnet [% by Vol] | Natural Sand [% by Vol] | Cement CEM I 52.5R [kg] | Fly Ash [kg] | Silica Fume [kg] |
|---|---|---|---|---|---|
| OR0 | 0 | 0 | 750 | 200 | 50 |
| OR25 | 25 | 75 | |||
| OR50 | 50 | 50 | |||
| OR75 | 75 | 25 | |||
| OR100 | 100 | 0 |
| Mix | Fresh Density [kg/m3] | Bulk Denity [kg/m3] |
|---|---|---|
| OR0 | 2053.6 | 1908.69 |
| OR25 | 2133.5 | 1960.41 |
| OR50 | 2255.1 | 2111.57 |
| OR75 | 2313.6 | 2175.23 |
| OR100 | 2409.1 | 2348.03 |
| Recycled Sand Replacement Ratio | Rest Time [min] | [kPa] | [%] | [%] | [kPa] | [%] | [%] |
|---|---|---|---|---|---|---|---|
| 0 | 15 | 9.78 | 5.9% | - | 436.32 | 6.6% | - |
| 30 | 13.65 | 7.8% | - | 636.82 | 7.9% | - | |
| 45 | 15.82 | 6.9% | - | 1002.26 | 6.5% | - | |
| 25 | 15 | 6.92 | 5.5% | −29.26% | 432.50 | 5.4% | −0.88% |
| 30 | 11.96 | 7.3% | −12.39% | 538.11 | 7.0% | −15.50% | |
| 45 | 13.78 | 7.5% | −12.87% | 935.21 | 7.4% | −6.69% | |
| 50 | 15 | 5.36 | 7.4% | −45.20% | 325.59 | 6.2% | −25.38% |
| 30 | 6.50 | 8.0% | −52.40% | 437.56 | 6.9% | −31.29% | |
| 45 | 8.56 | 6.3% | −45.89% | 483.92 | 6.4% | −51.72% | |
| 75 | 15 | 5.14 | 5.5% | −47.45% | 113.30 | 6.1% | −74.03% |
| 30 | 6.09 | 7.5% | −55.38% | 285.61 | 5.8% | −55.15% | |
| 45 | 7.43 | 6.4% | −53.03% | 424.42 | 7.2% | −57.65% | |
| 100 | 15 | 3.80 | 7.4% | −61.16% | 124.05 | 6.2% | −71.57% |
| 30 | 4.15 | 5.8% | −69.61% | 184.86 | 5.9% | −70.97% | |
| 45 | 5.19 | 6.9% | −67.21% | 196.78 | 5.0% | −80.37% |
| Research Team | Recycled Sand Replacement [% by Vol] | Rest Time t [min] | Maximum Stress [kPa] | Young Modulus [kPa] | Specimen [mm] |
|---|---|---|---|---|---|
| Ding et al. [21] | 0 | 15 | - | - | 75 × 150 |
| 0 | 30 | 9.51 | 28.82 | ||
| 0 | 45 | 10.68 | 31.9 | ||
| 25 | 15 | - | - | ||
| 25 | 30 | 8.89 | 32.9 | ||
| 25 | 45 | 11.41 | 29.9 | ||
| 50 | 15 | - | - | ||
| 50 | 30 | 9.06 | 27.92 | ||
| 50 | 45 | 12.23 | 36.47 | ||
| Casagrande et al. [14] | - | 15 | 3.82–12.54 | 94–256 | 60 × 120 |
| - | 30 | 4.30–26.04 | 93–488 | ||
| - | 45 | - | - | ||
| Wolfs et al. [22] | - | 15 | 7.71 | 99 | 70 × 140 |
| - | 30 | 10.05 | 117 | ||
| - | 45 | - | - | ||
| Panda et al. [23] | - | 15 | - | - | 70 × 140 |
| - | 30 | 10.65 | 350 | ||
| - | 45 | - | - |
Publisher’s Note: MDPI stays neutral with regard to jurisdictional claims in published maps and institutional affiliations. |
© 2021 by the authors. Licensee MDPI, Basel, Switzerland. This article is an open access article distributed under the terms and conditions of the Creative Commons Attribution (CC BY) license (https://creativecommons.org/licenses/by/4.0/).
Share and Cite
Skibicki, S.; Jakubowska, P.; Kaszyńska, M.; Sibera, D.; Cendrowski, K.; Hoffmann, M. Early-Age Mechanical Properties of 3D-Printed Mortar with Spent Garnet. Materials 2022, 15, 100. https://doi.org/10.3390/ma15010100
Skibicki S, Jakubowska P, Kaszyńska M, Sibera D, Cendrowski K, Hoffmann M. Early-Age Mechanical Properties of 3D-Printed Mortar with Spent Garnet. Materials. 2022; 15(1):100. https://doi.org/10.3390/ma15010100
Chicago/Turabian StyleSkibicki, Szymon, Patrycja Jakubowska, Maria Kaszyńska, Daniel Sibera, Krzysztof Cendrowski, and Marcin Hoffmann. 2022. "Early-Age Mechanical Properties of 3D-Printed Mortar with Spent Garnet" Materials 15, no. 1: 100. https://doi.org/10.3390/ma15010100
APA StyleSkibicki, S., Jakubowska, P., Kaszyńska, M., Sibera, D., Cendrowski, K., & Hoffmann, M. (2022). Early-Age Mechanical Properties of 3D-Printed Mortar with Spent Garnet. Materials, 15(1), 100. https://doi.org/10.3390/ma15010100