
Identification of Grain Oriented SiFe Steels Based on Imaging the Instantaneous Dynamics of Magnetic Barkhausen Noise Using Short-Time Fourier Transform and Deep Convolutional Neural Network


Abstract
:1. Introduction
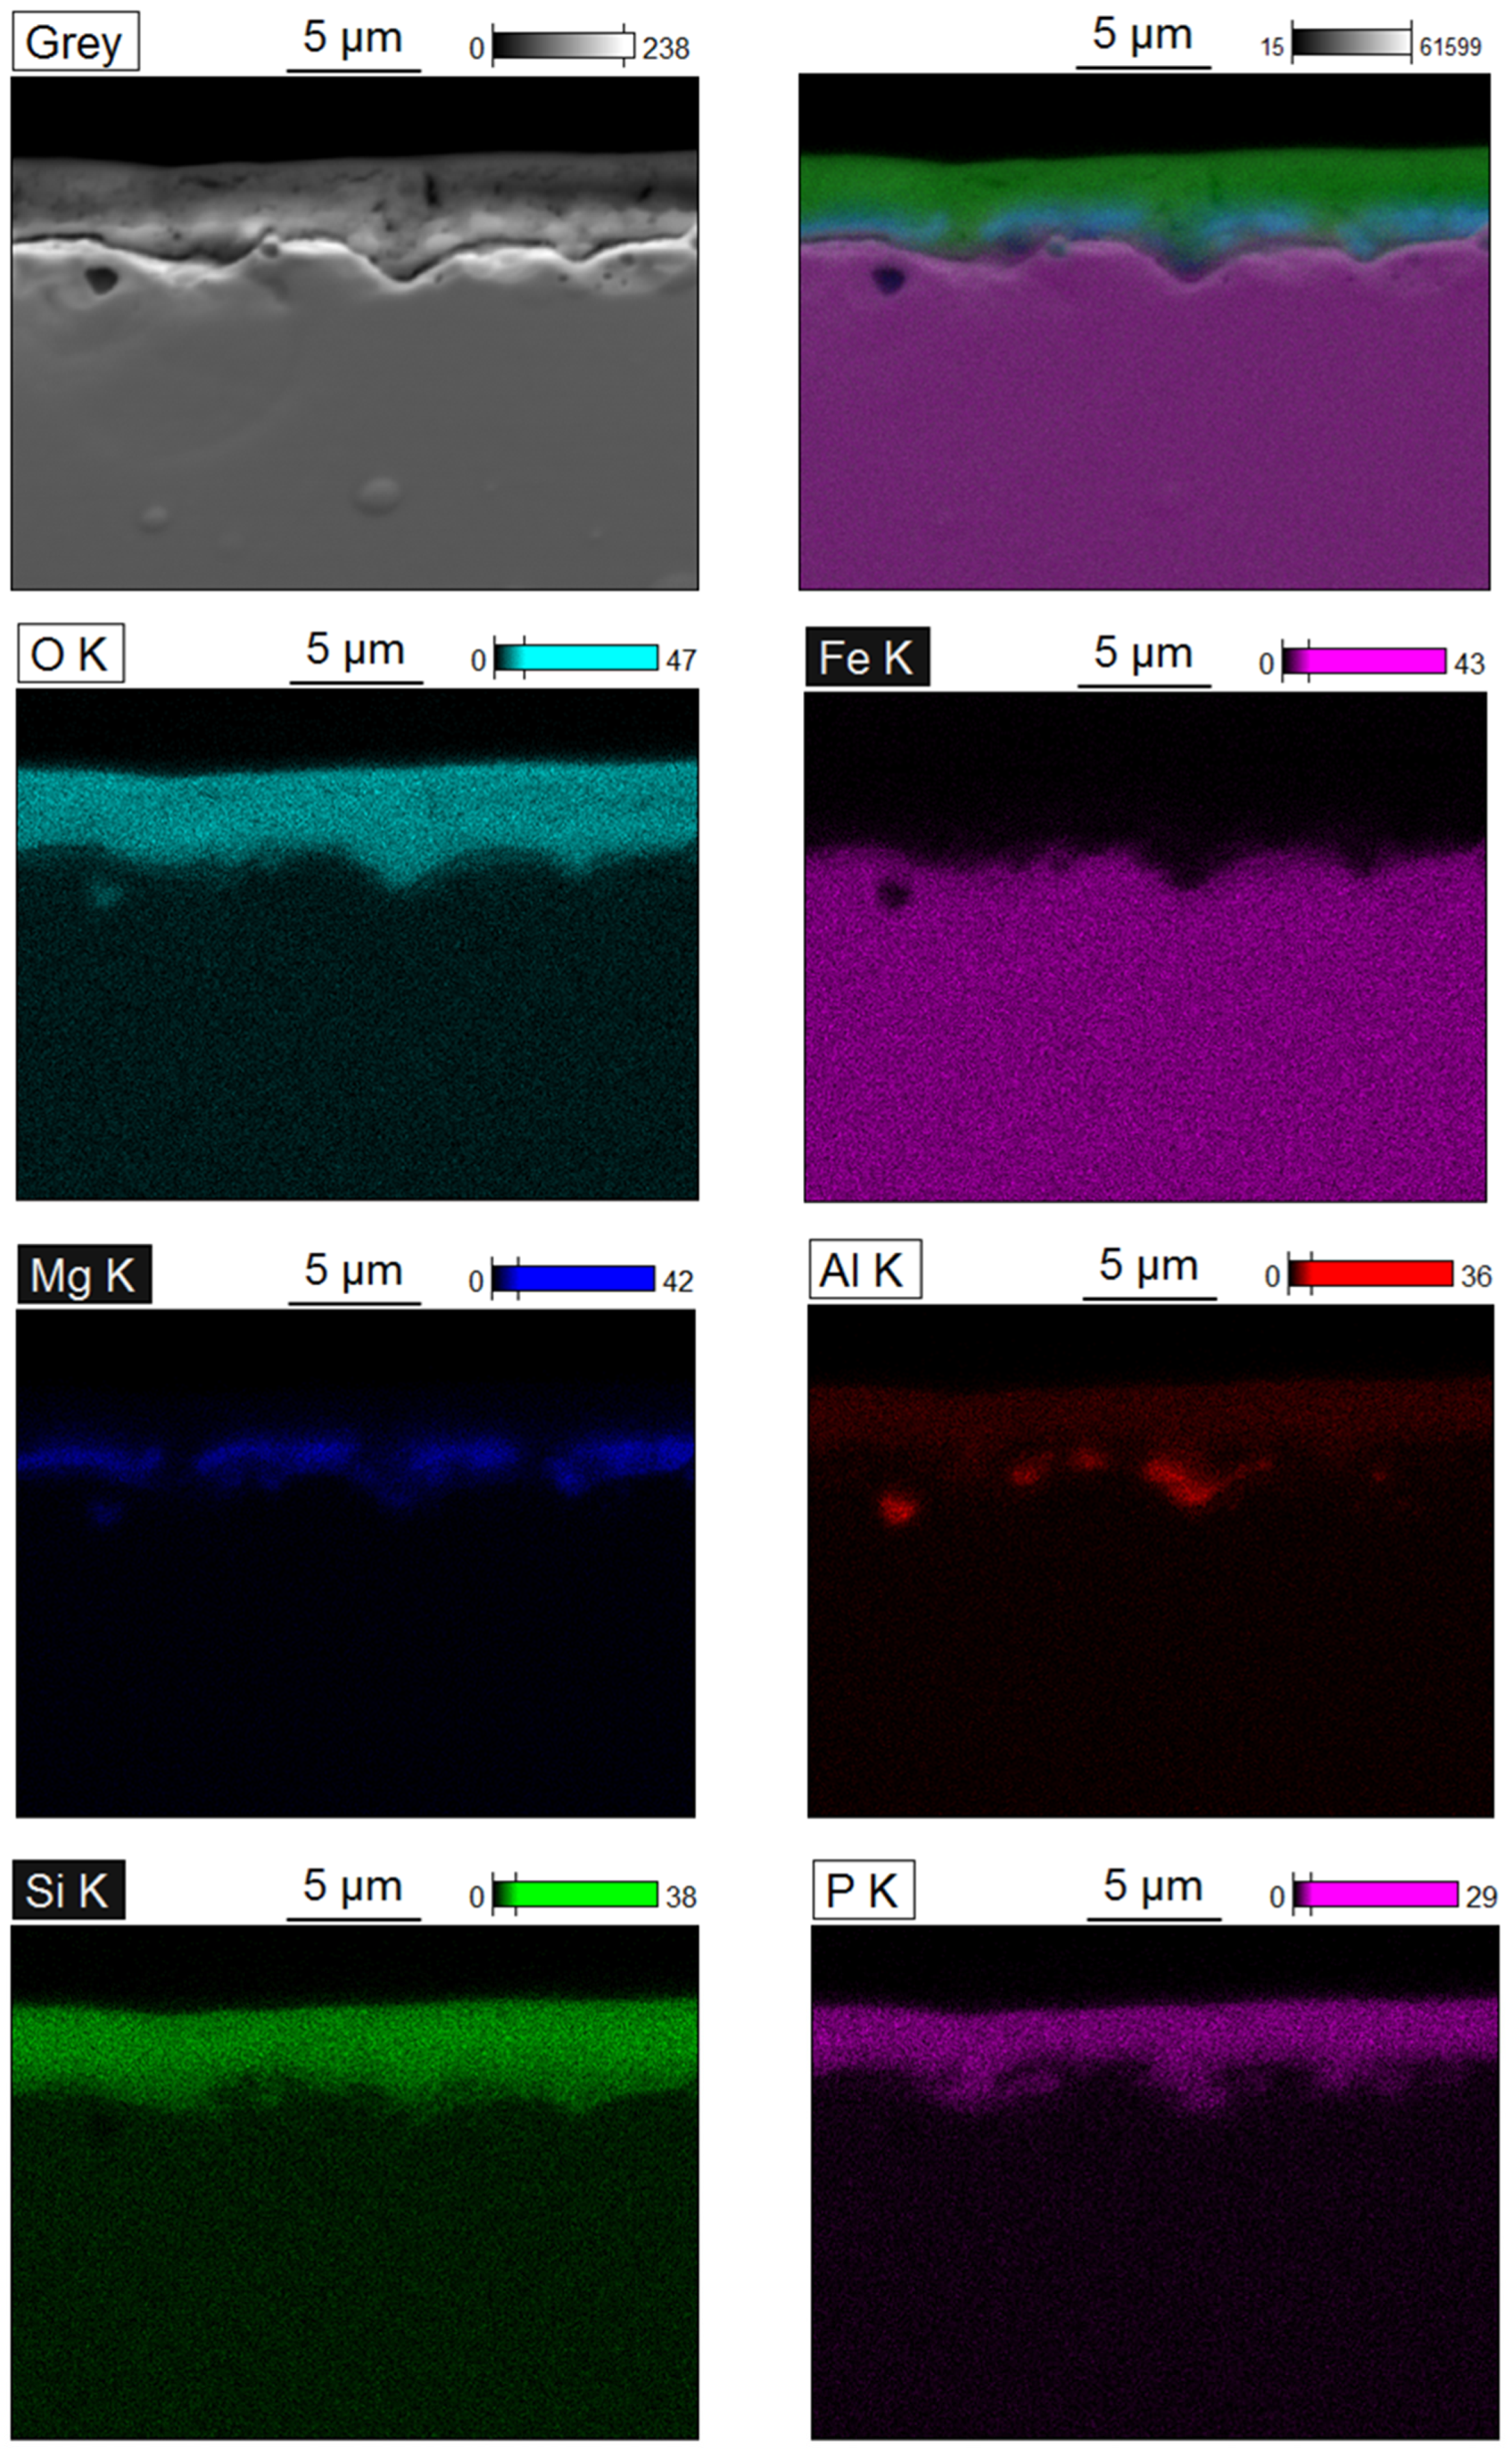
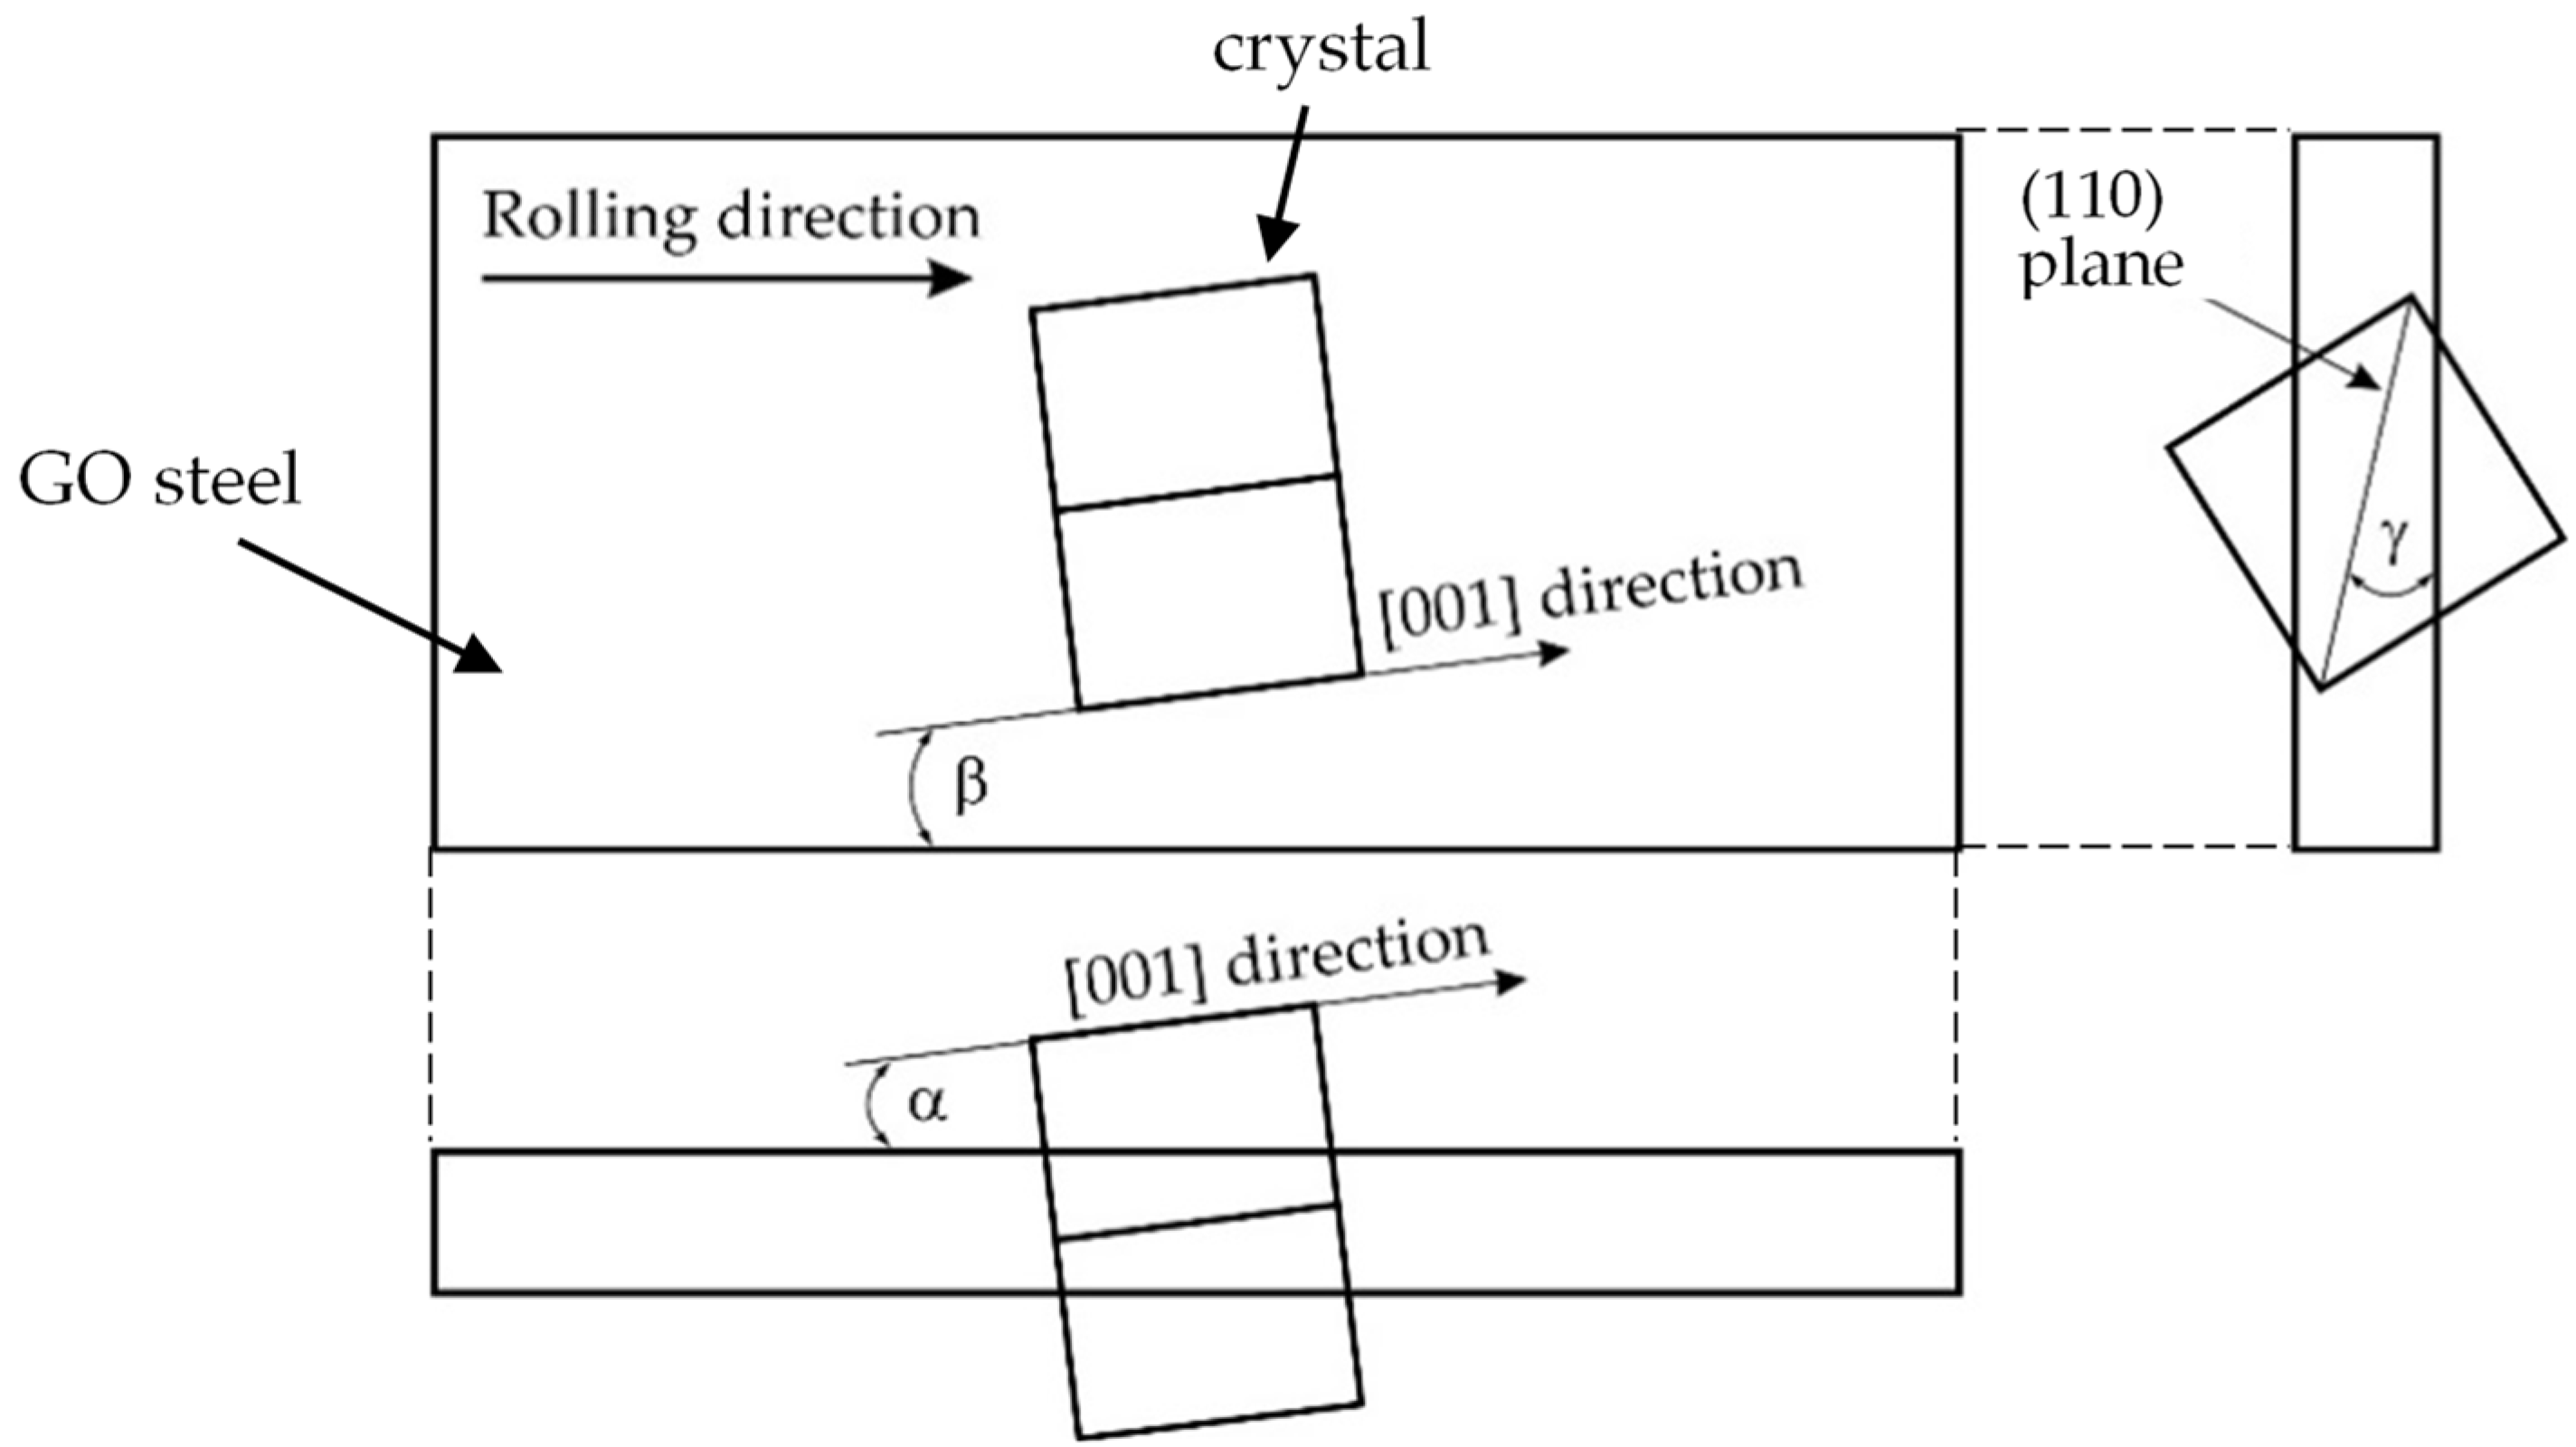
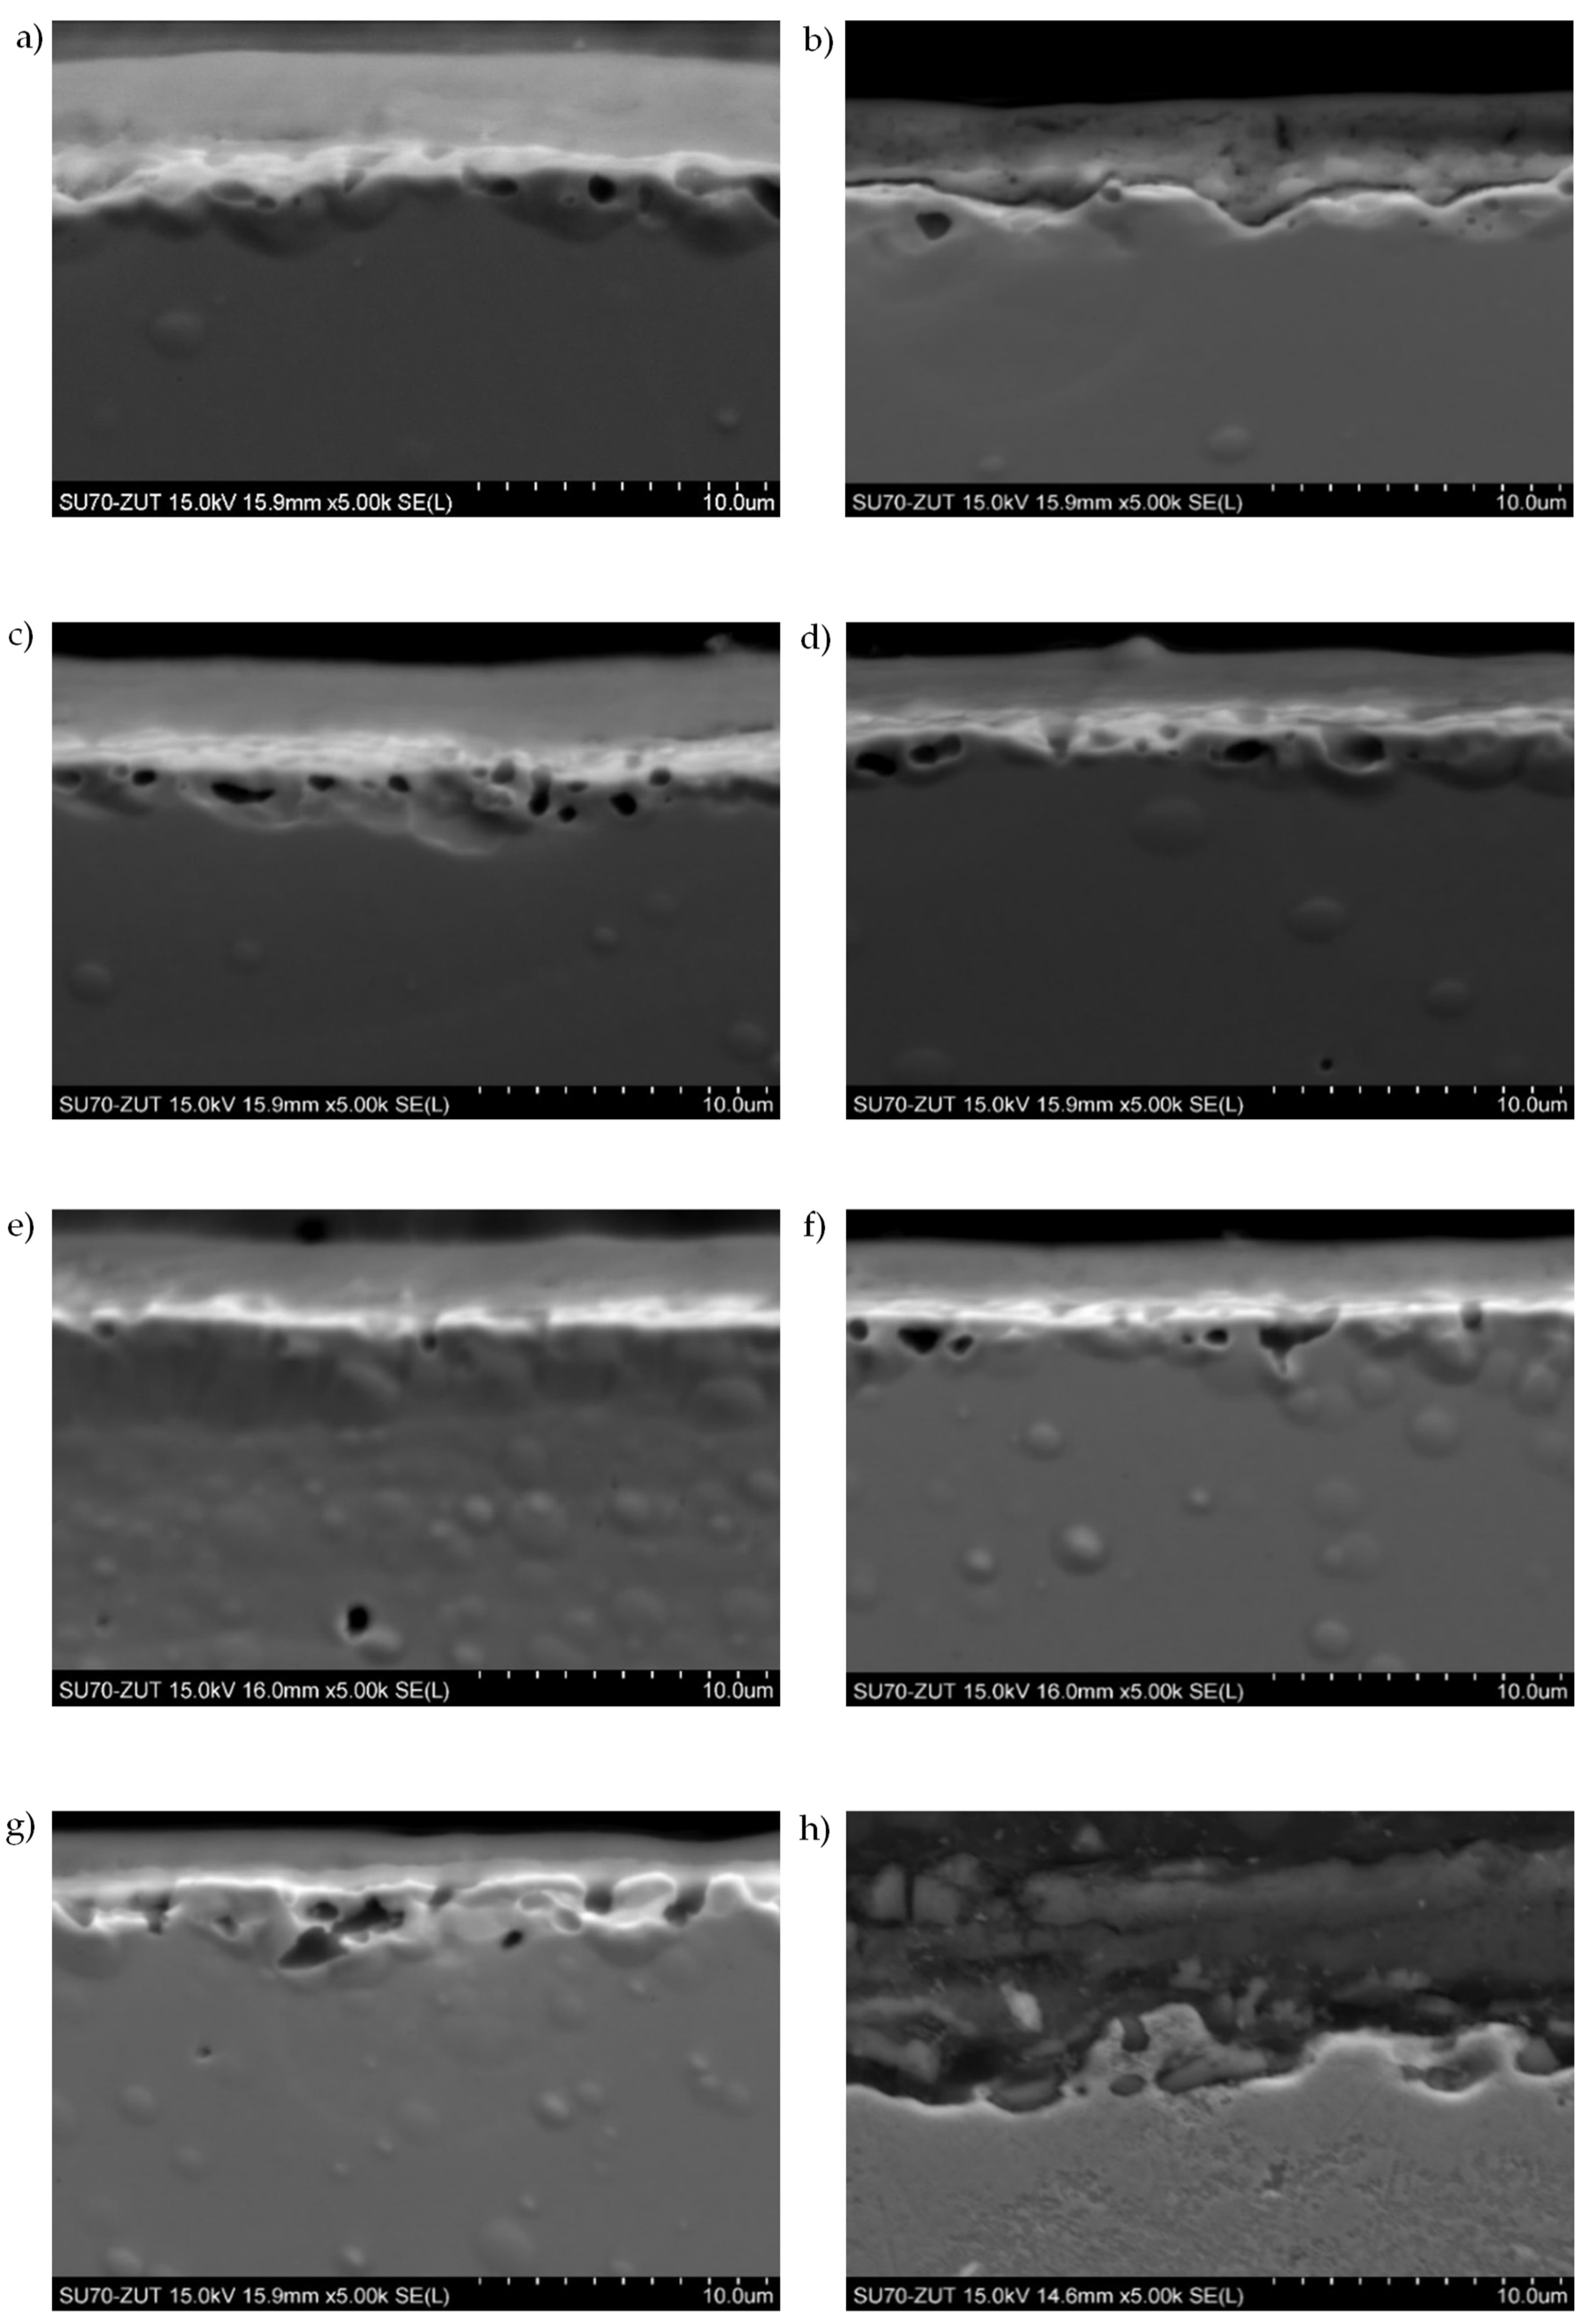
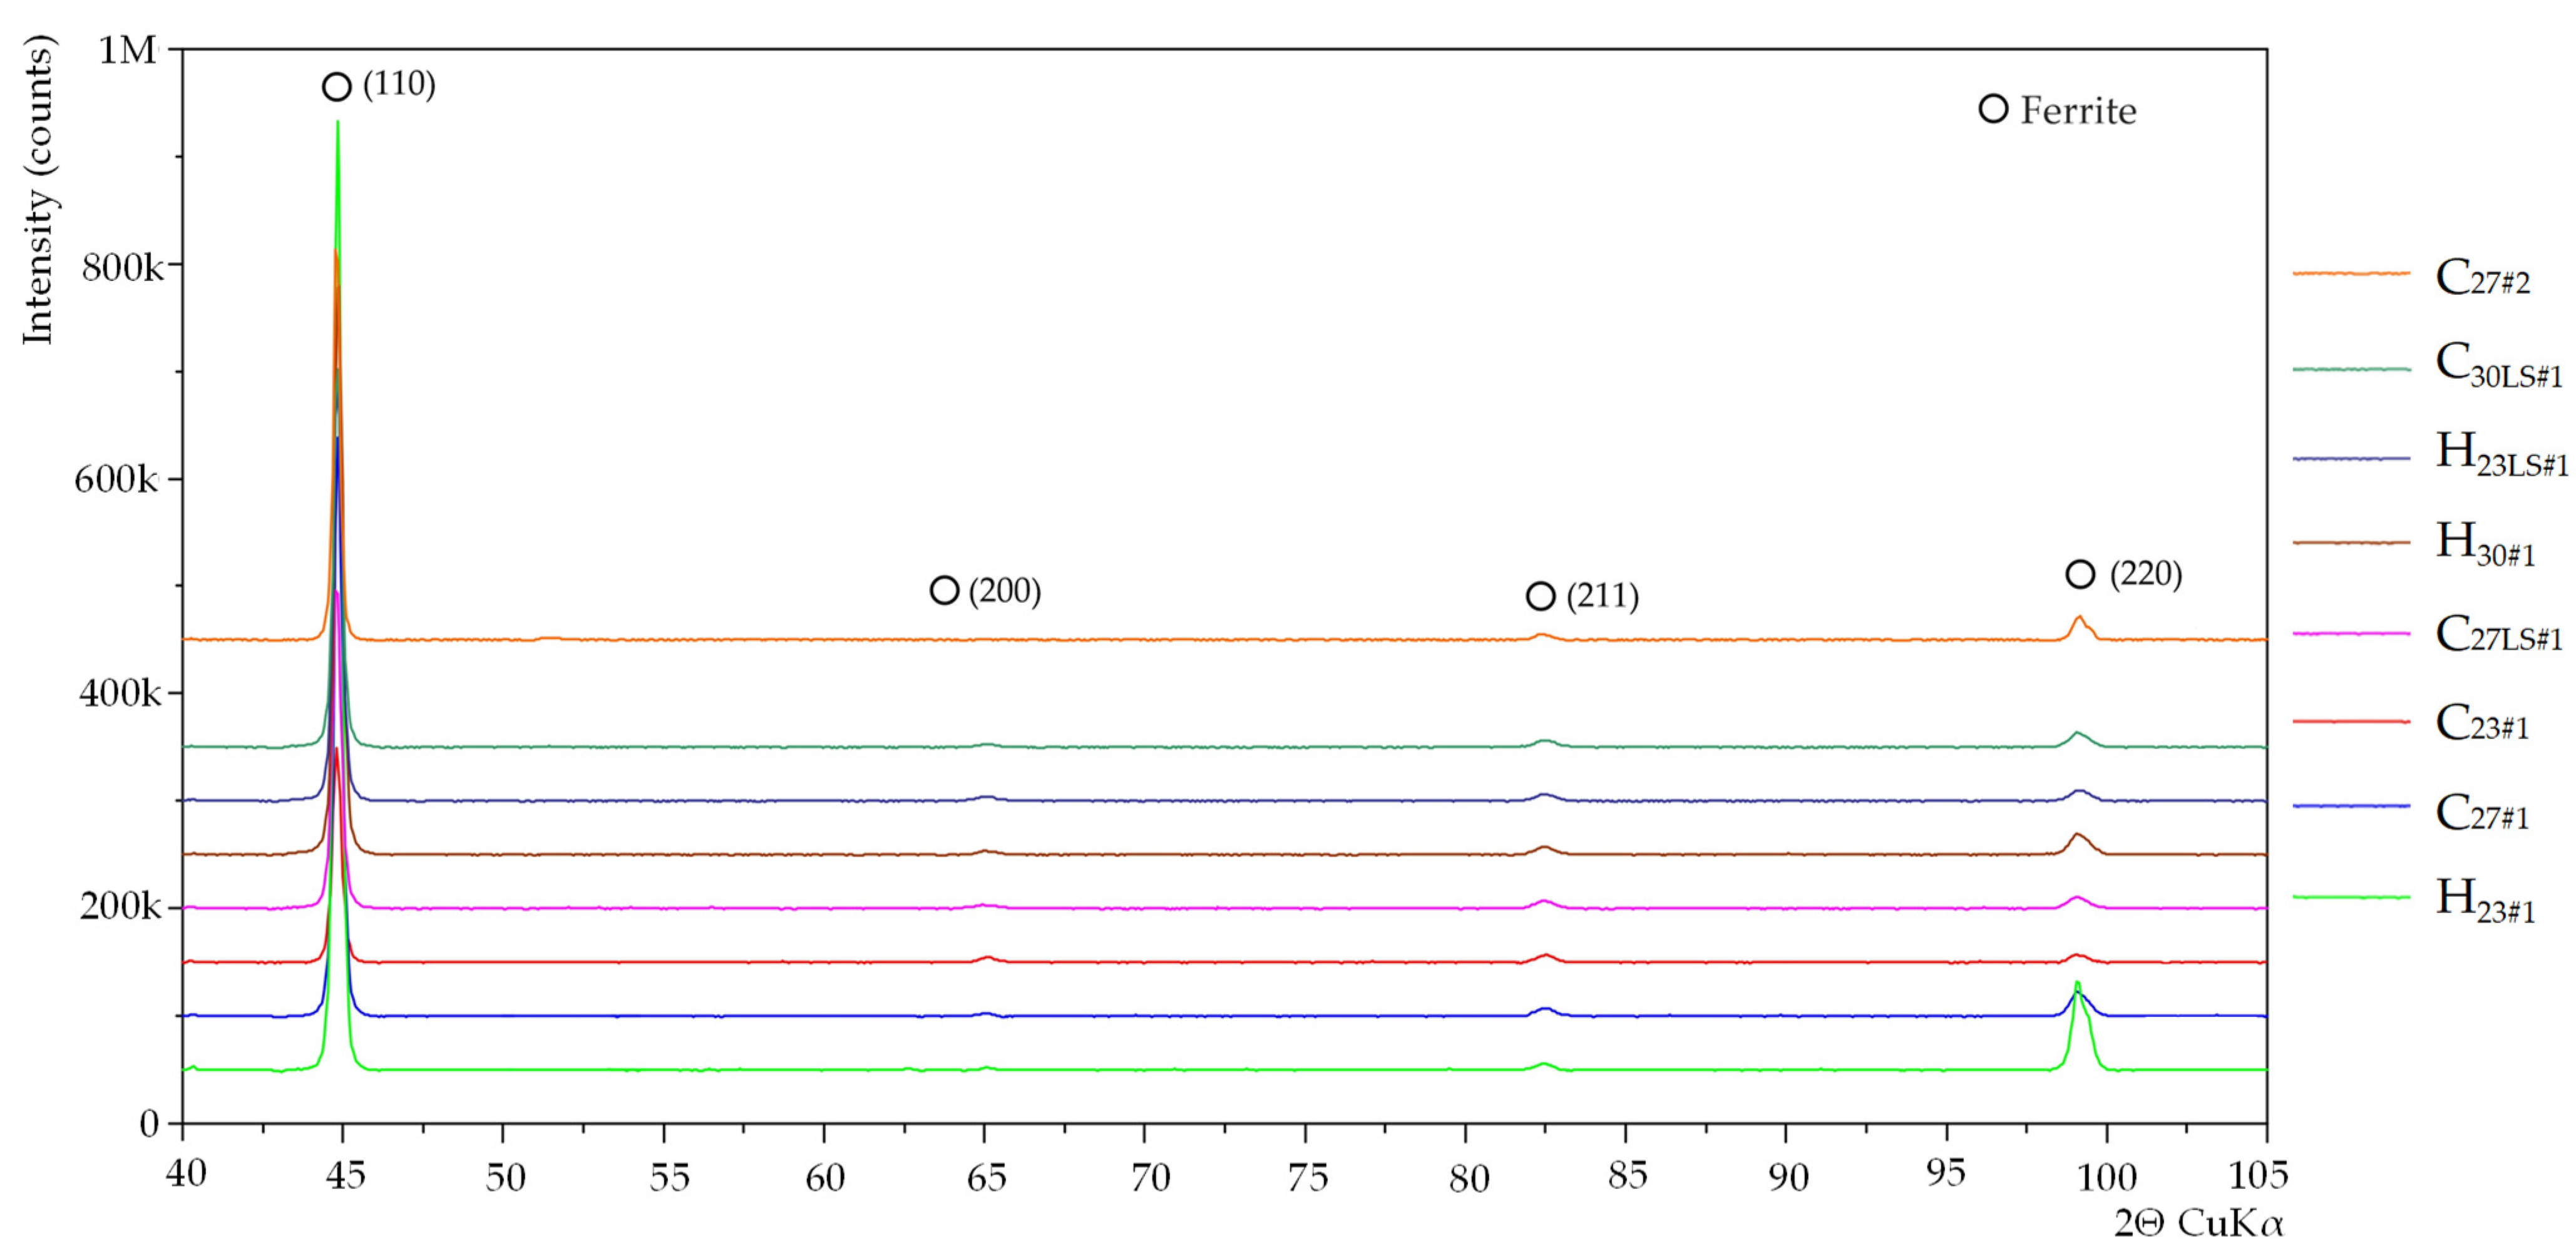
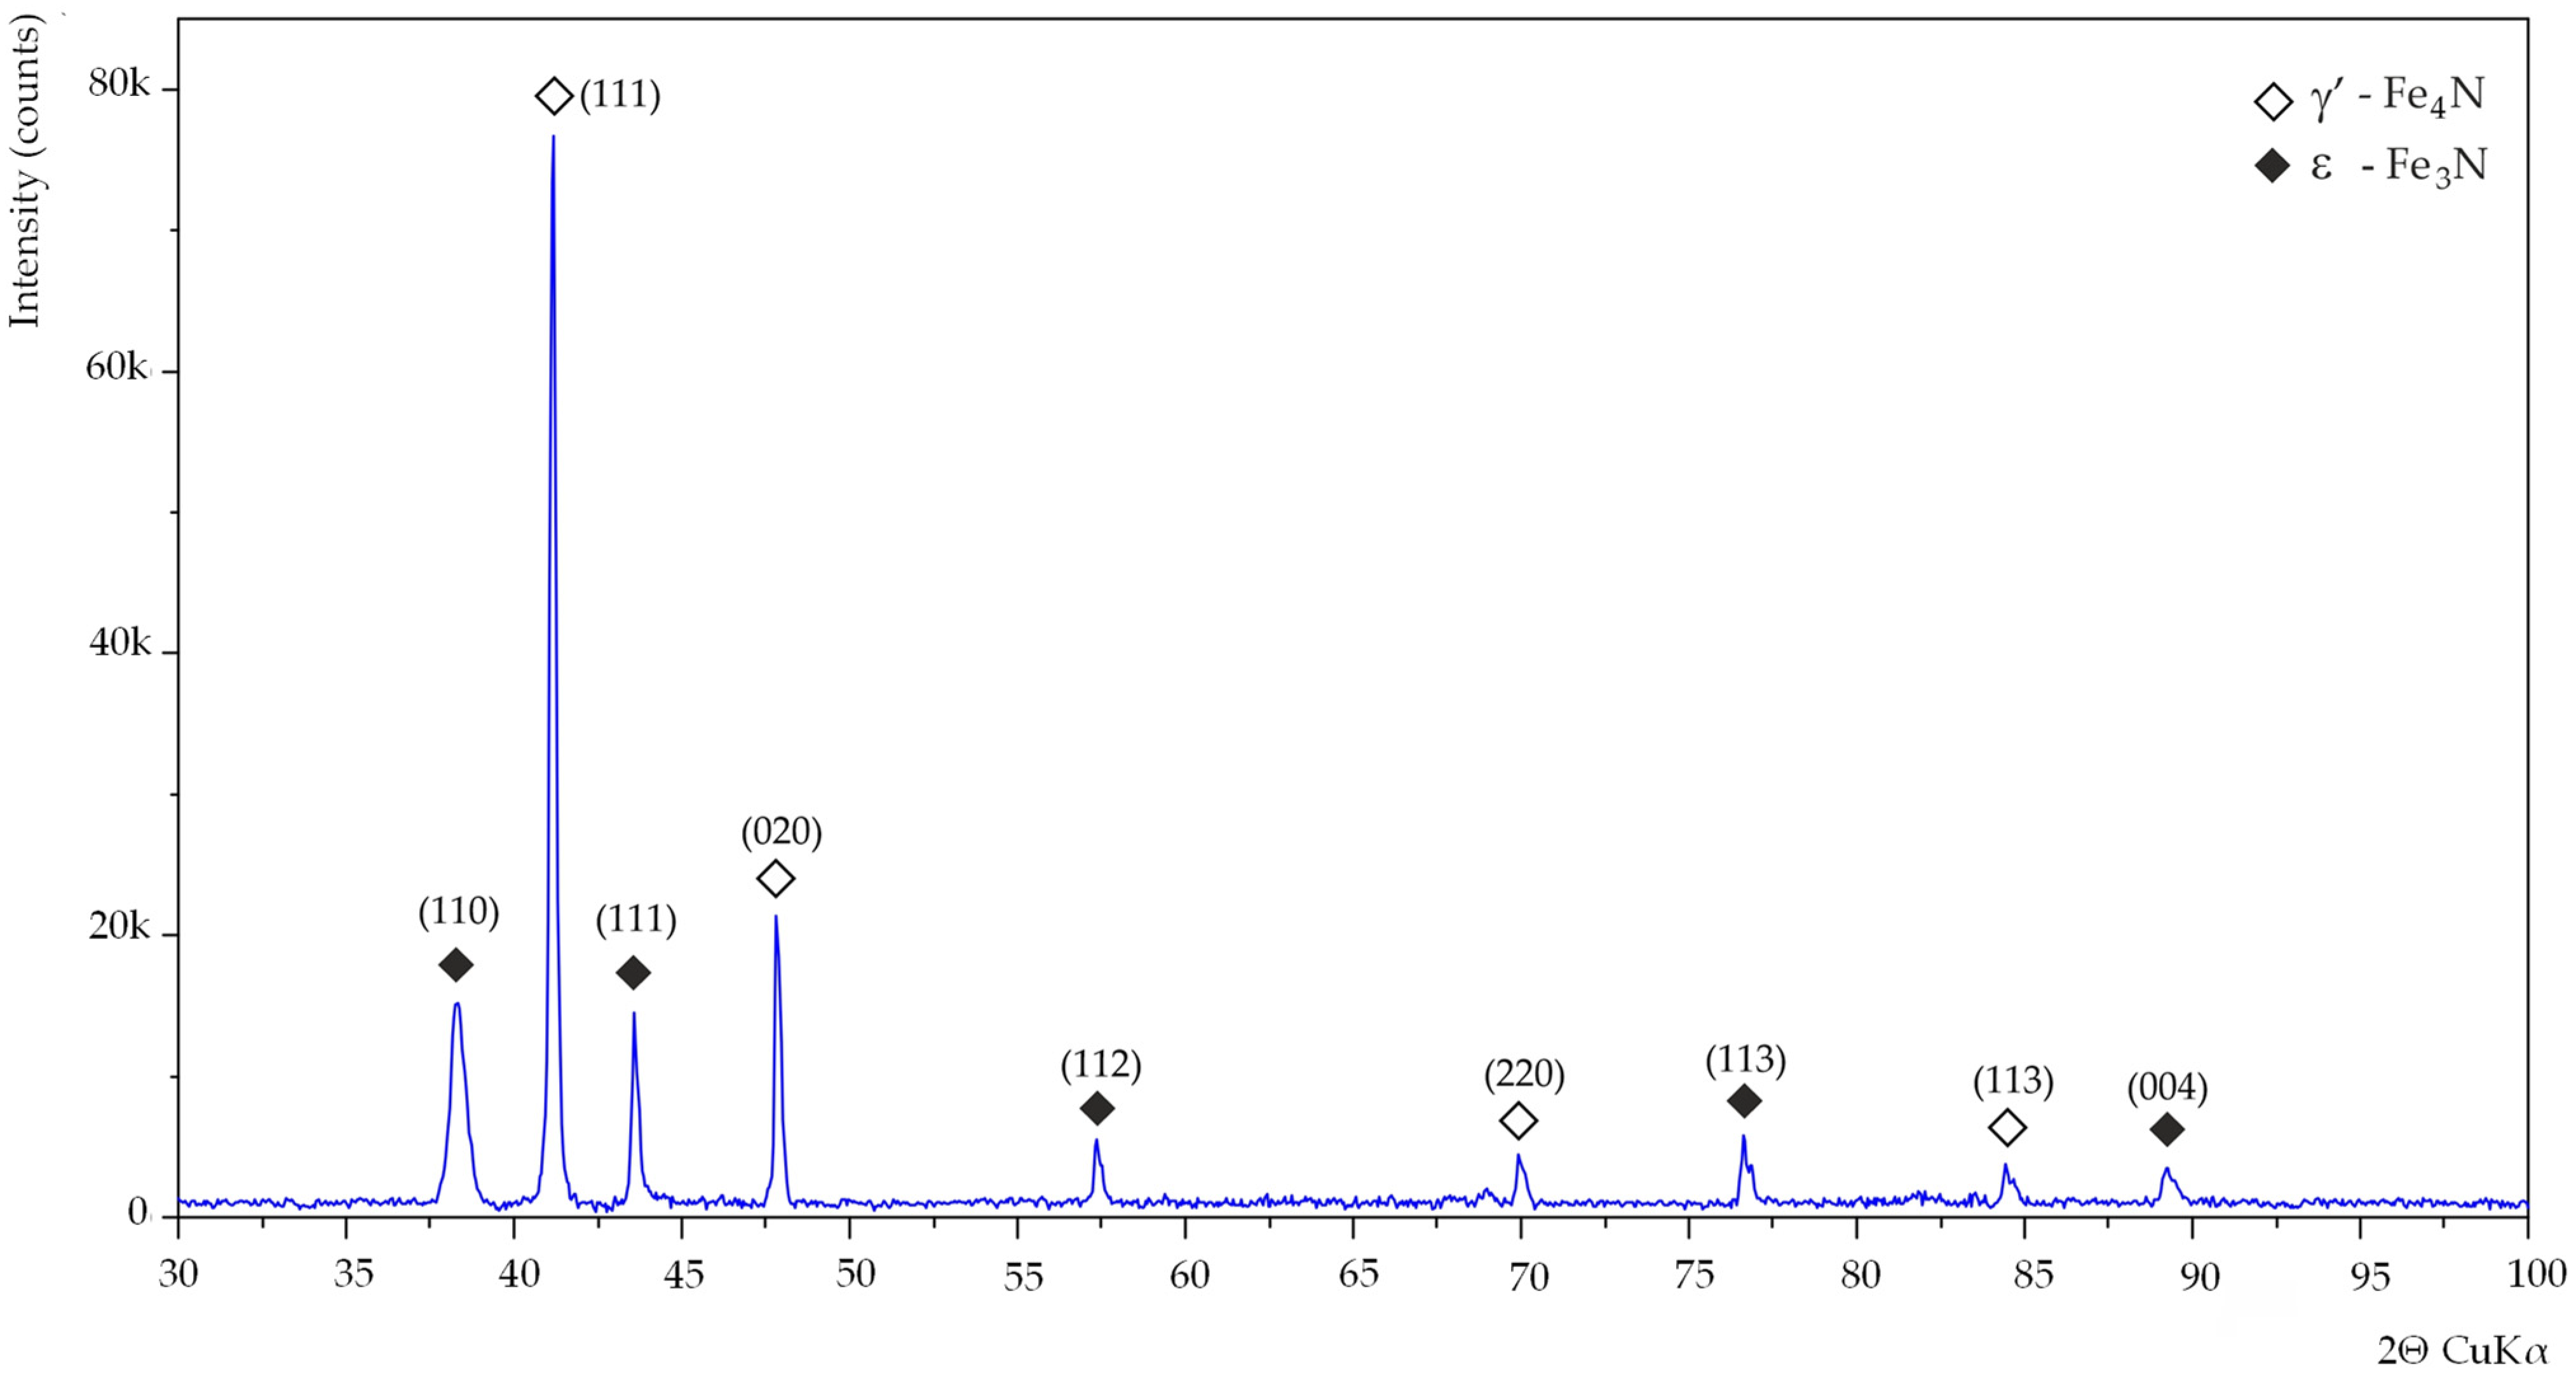
2. Measuring Samples and Characterization of Materials
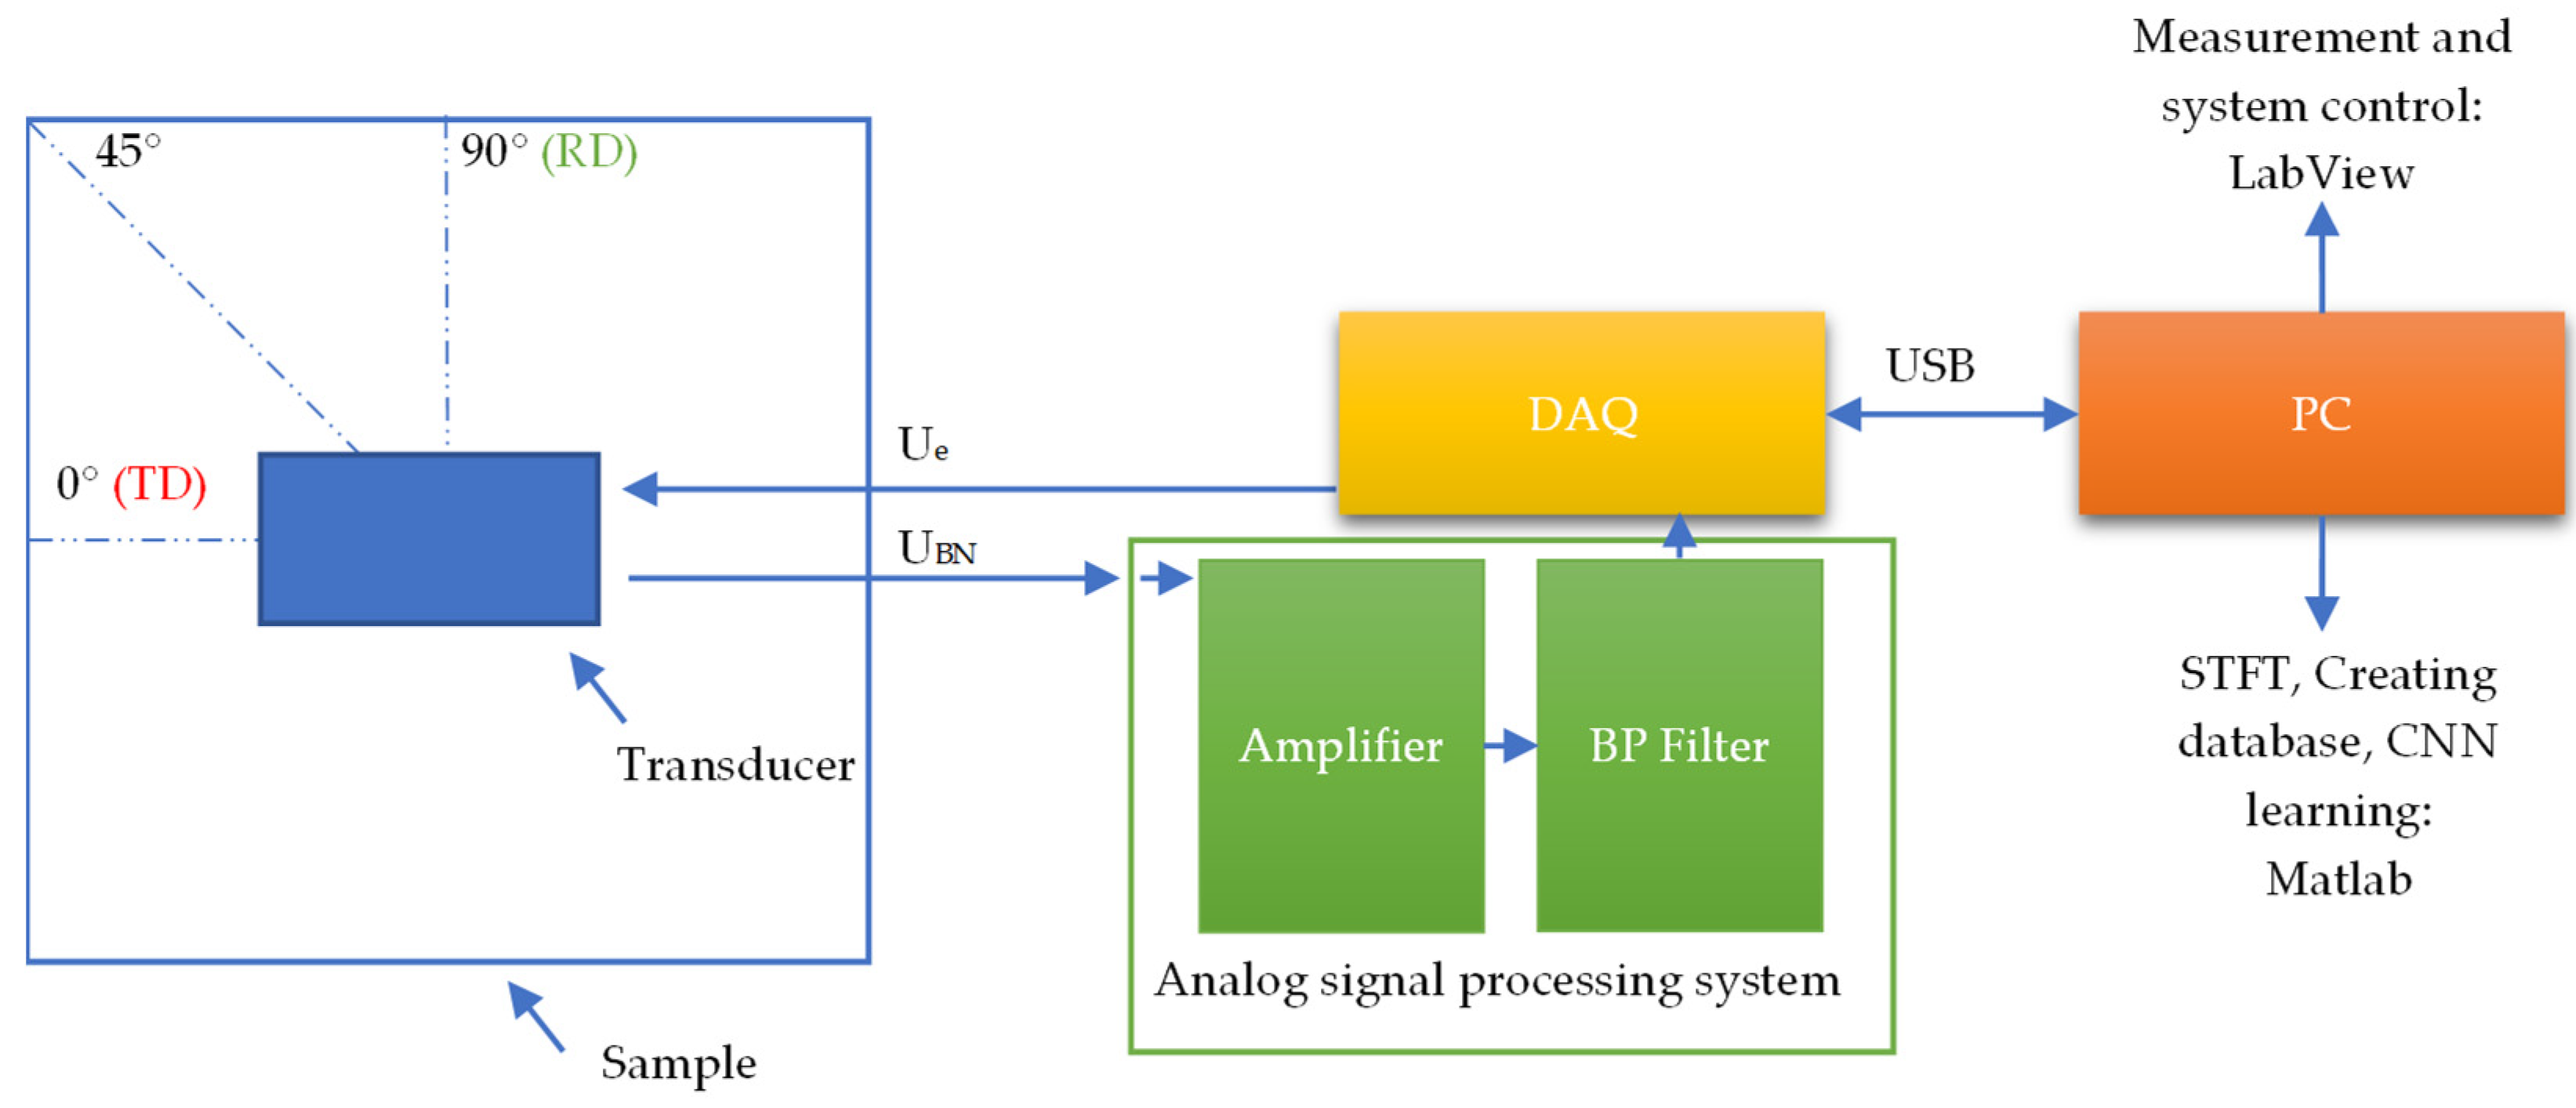
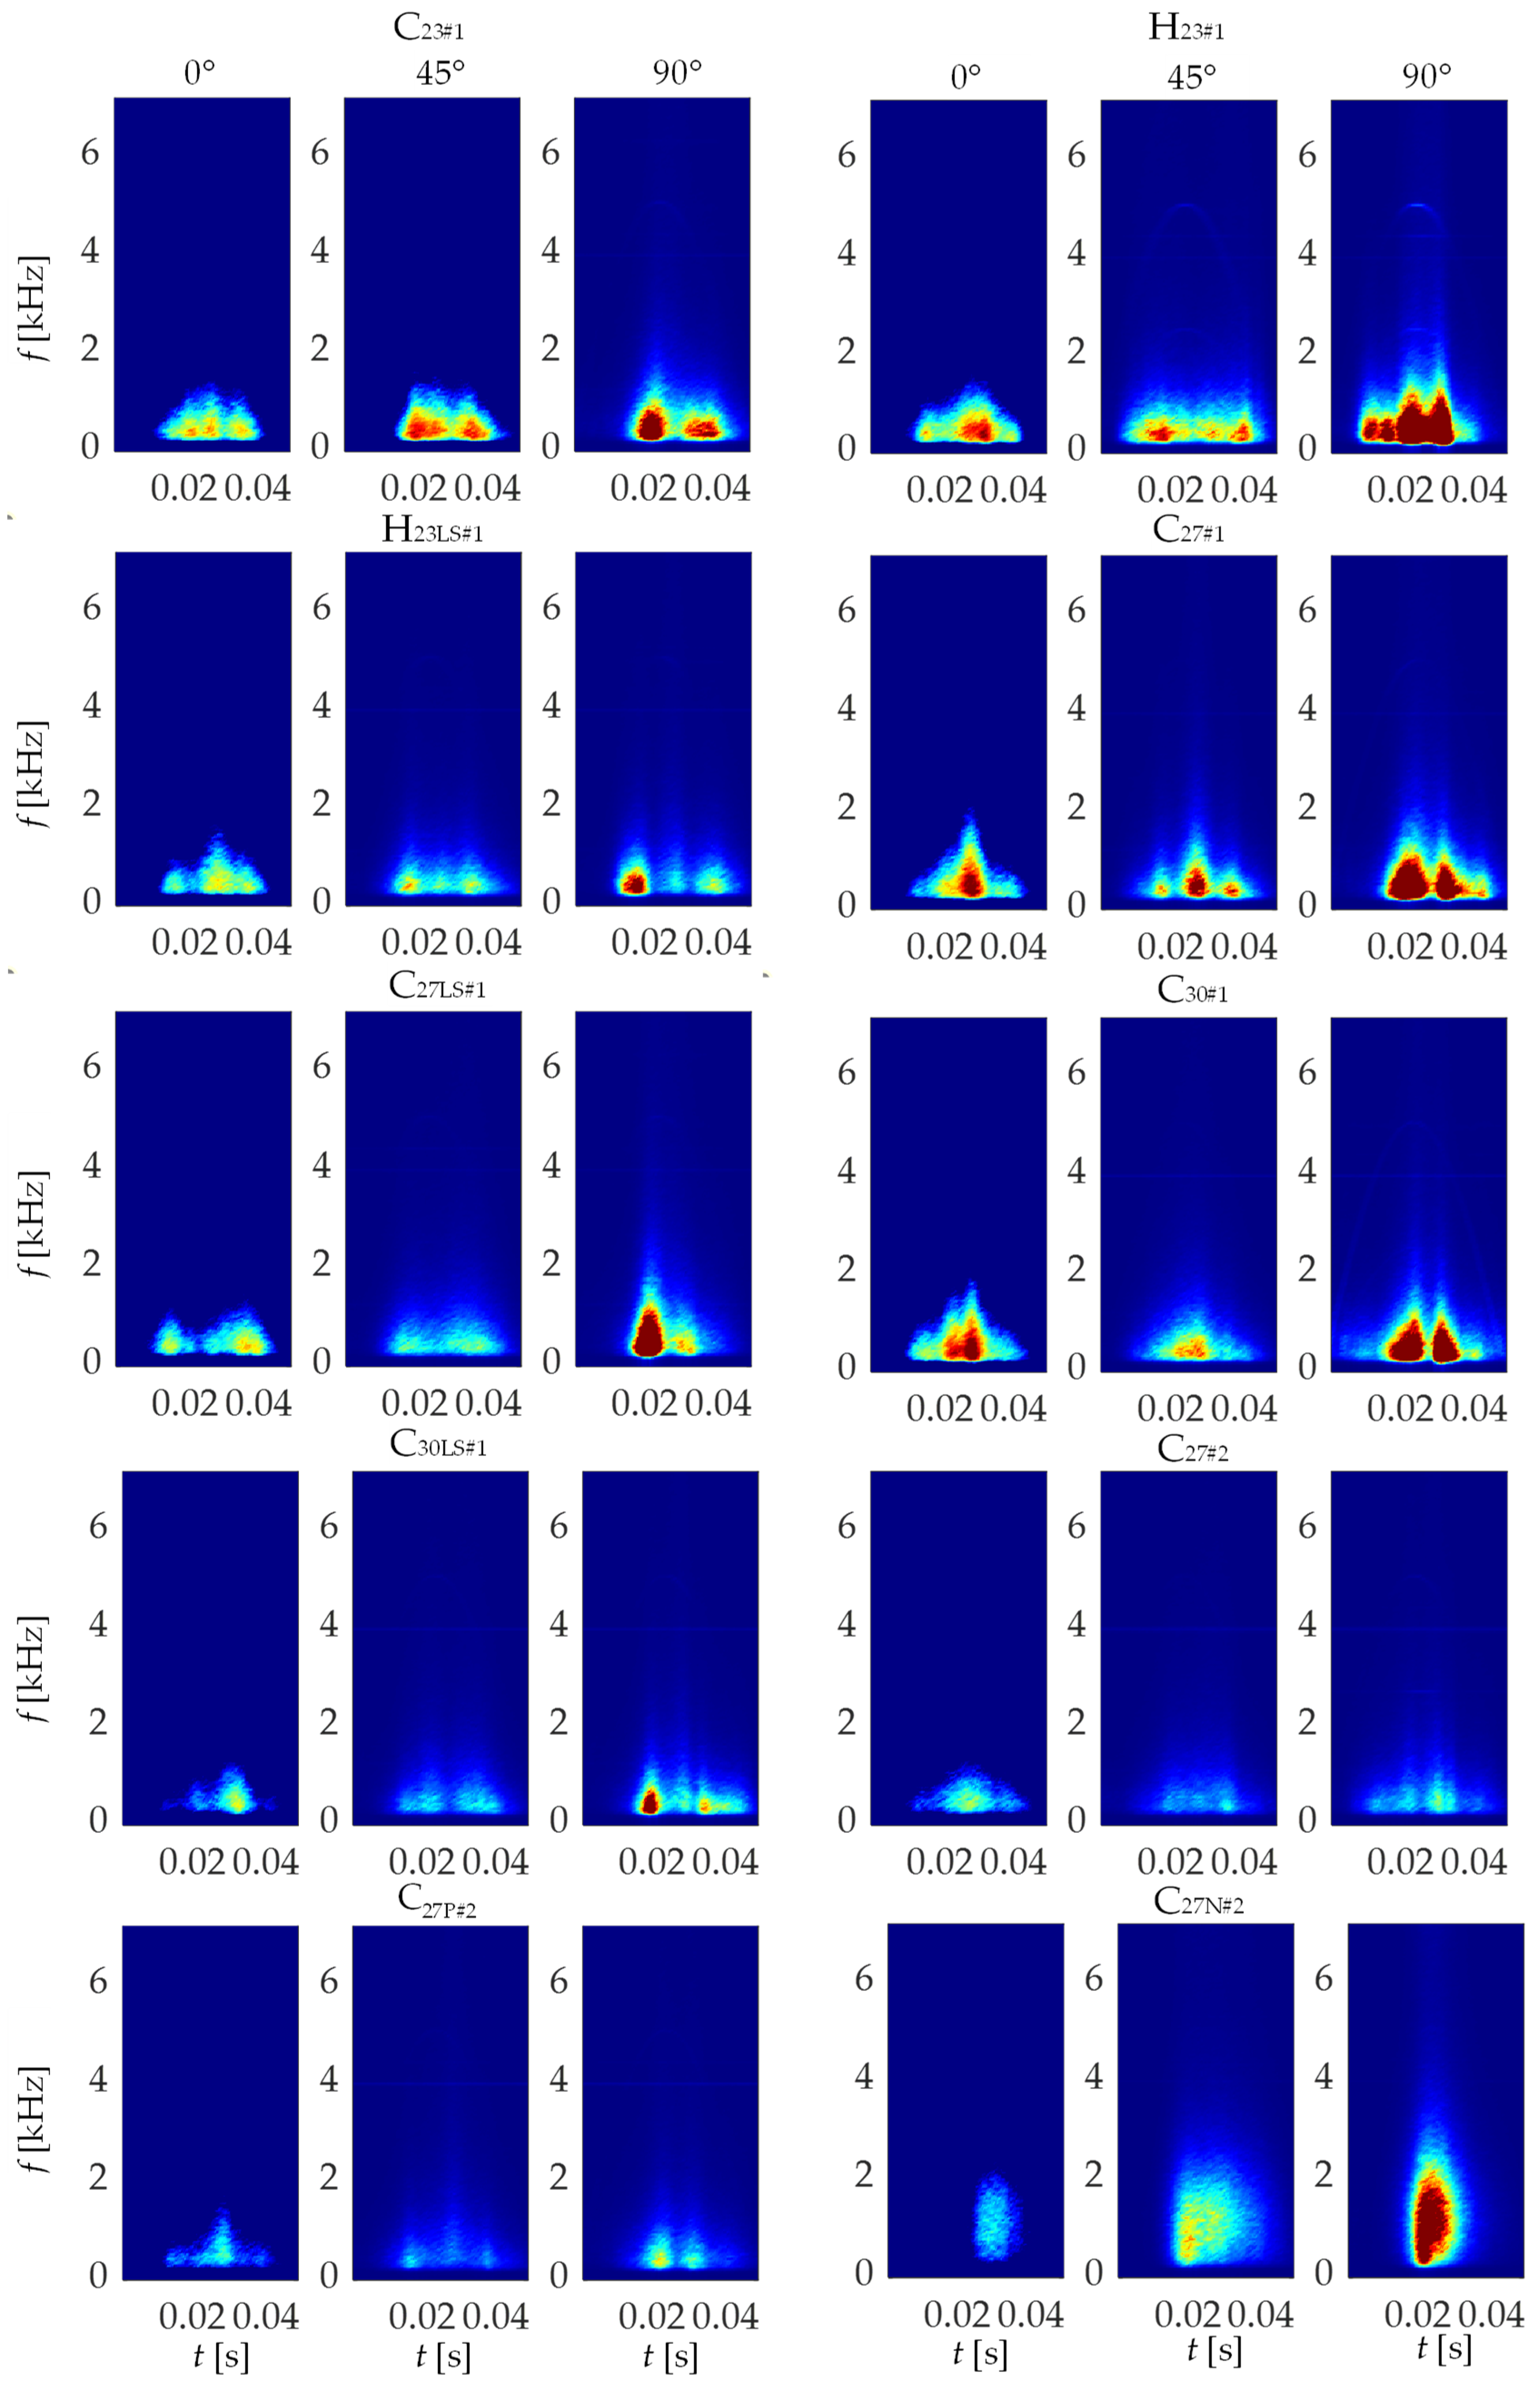
3. Measuring System and Measurements Results Processing
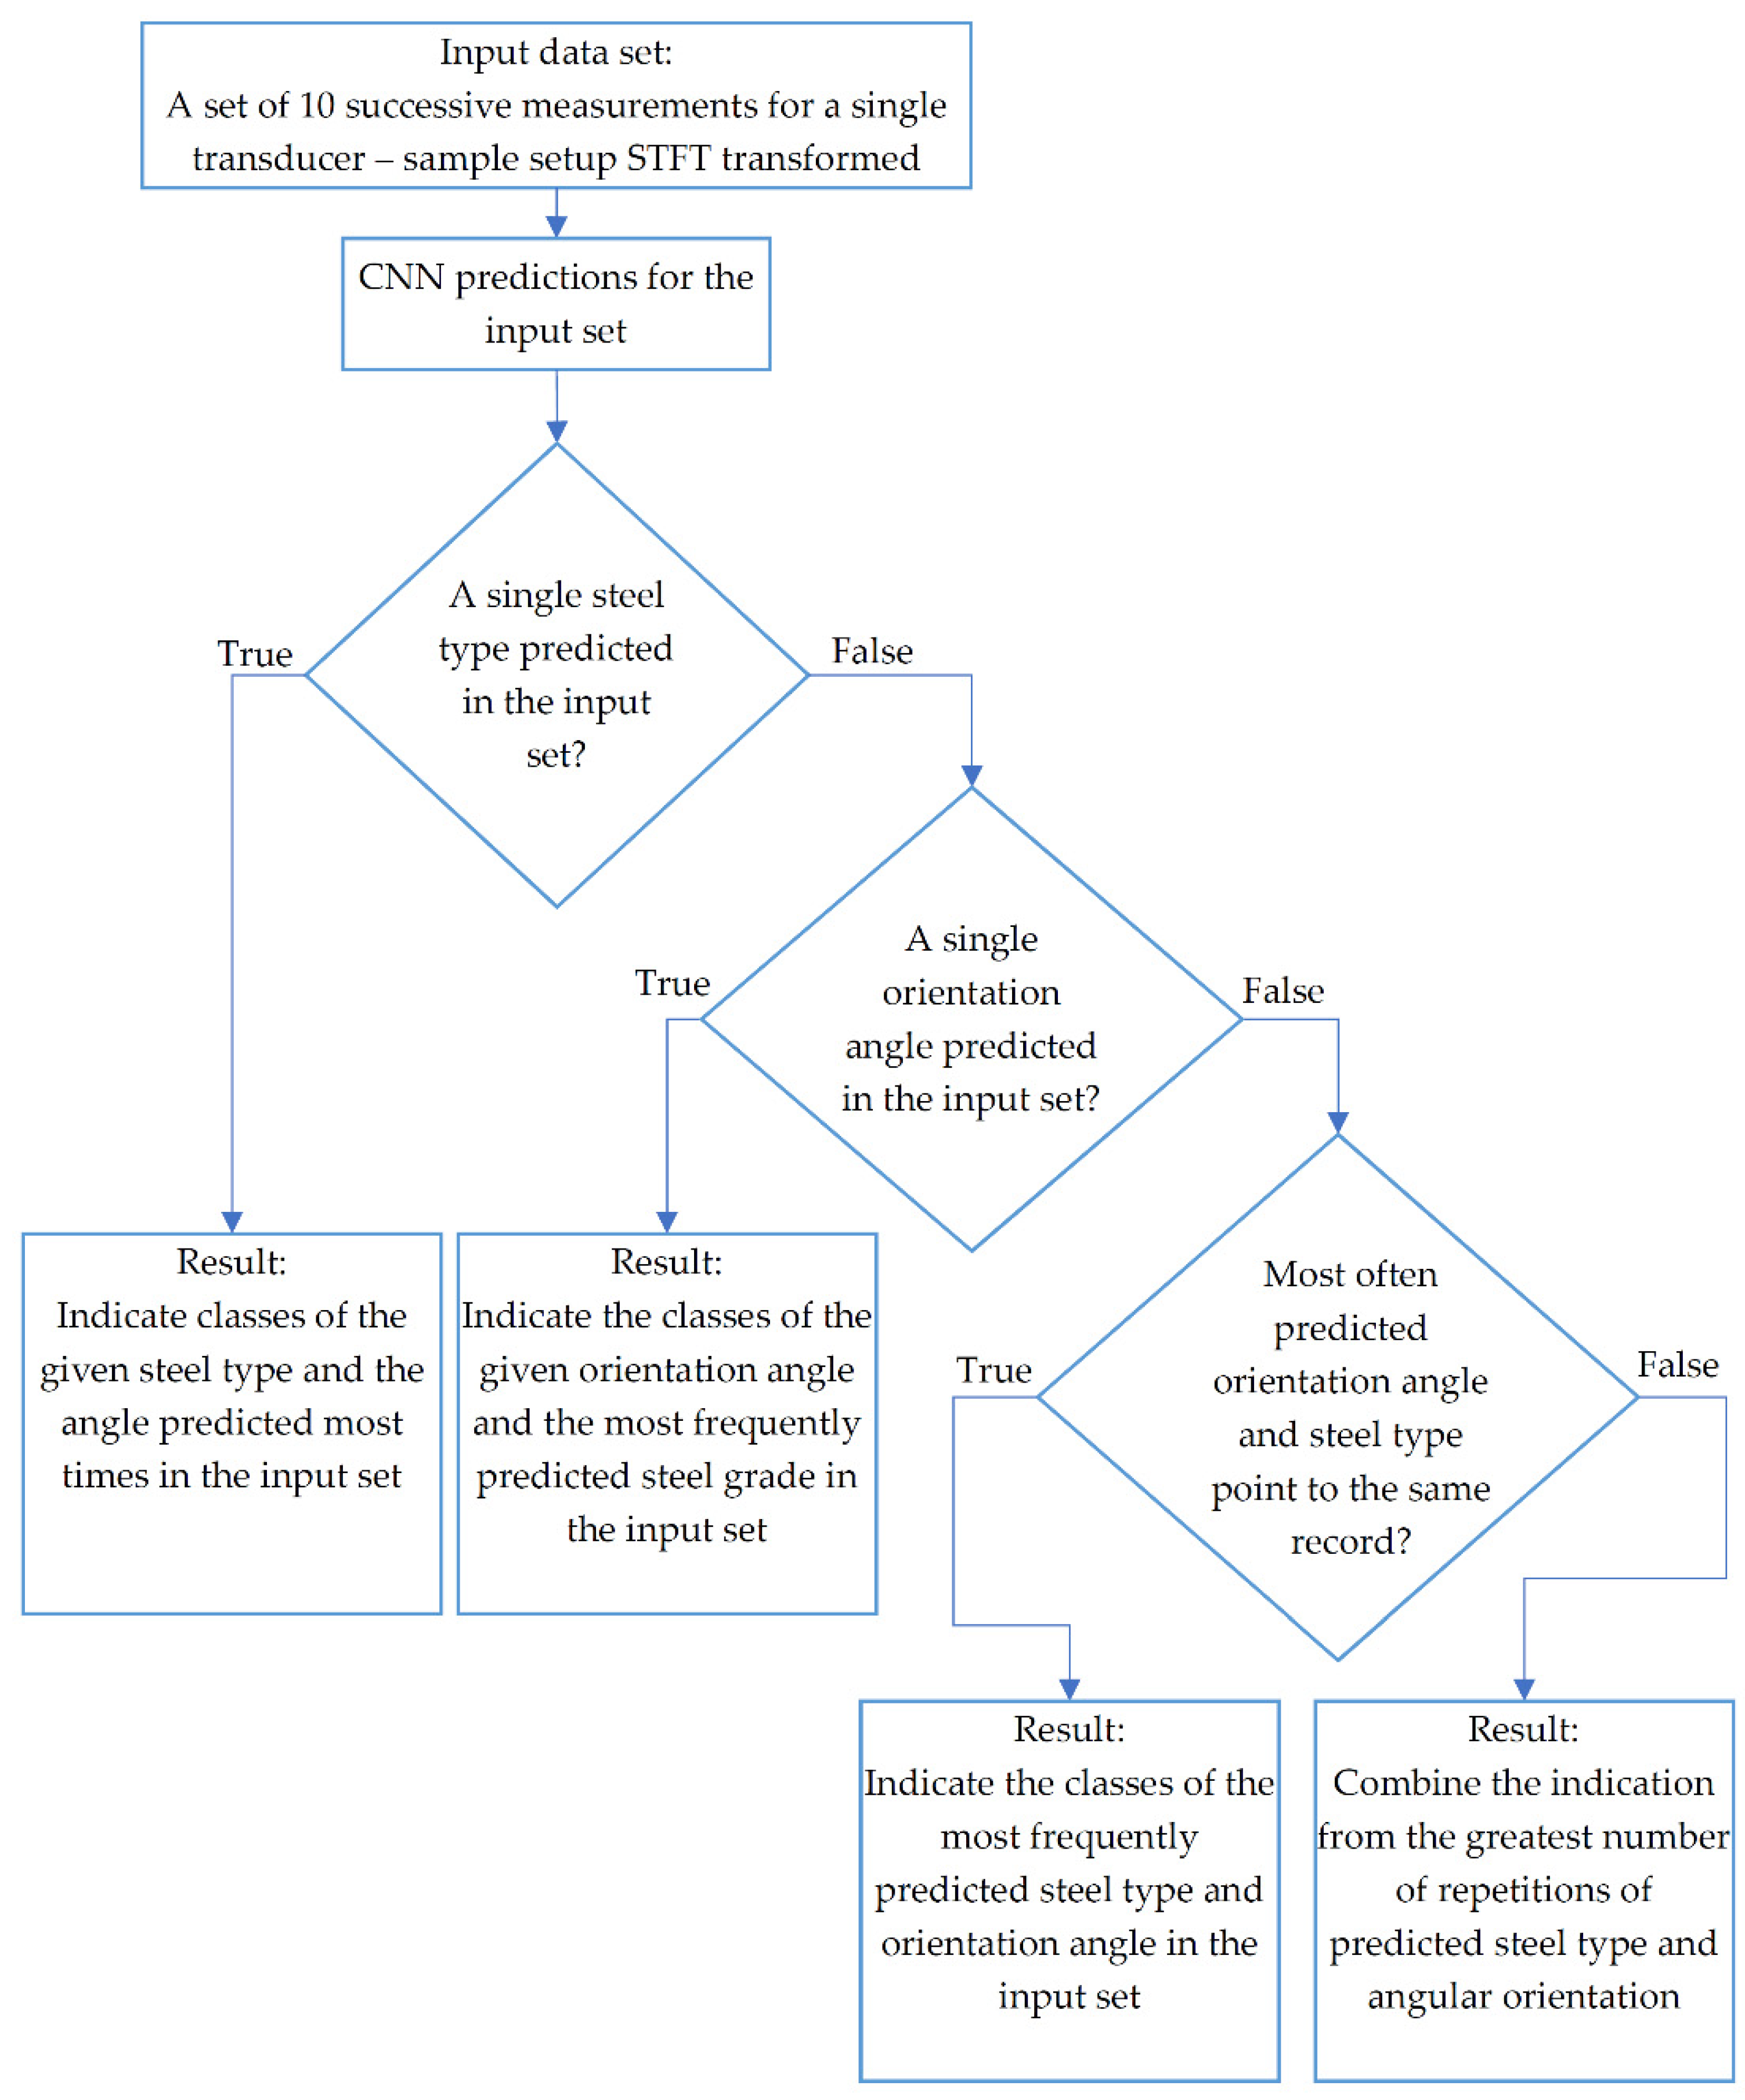
4. Deep CNN-Based GO Steel Identification Procedure
4.1. Convolution Neural Networks
4.2. Construction of Database and Network Structure
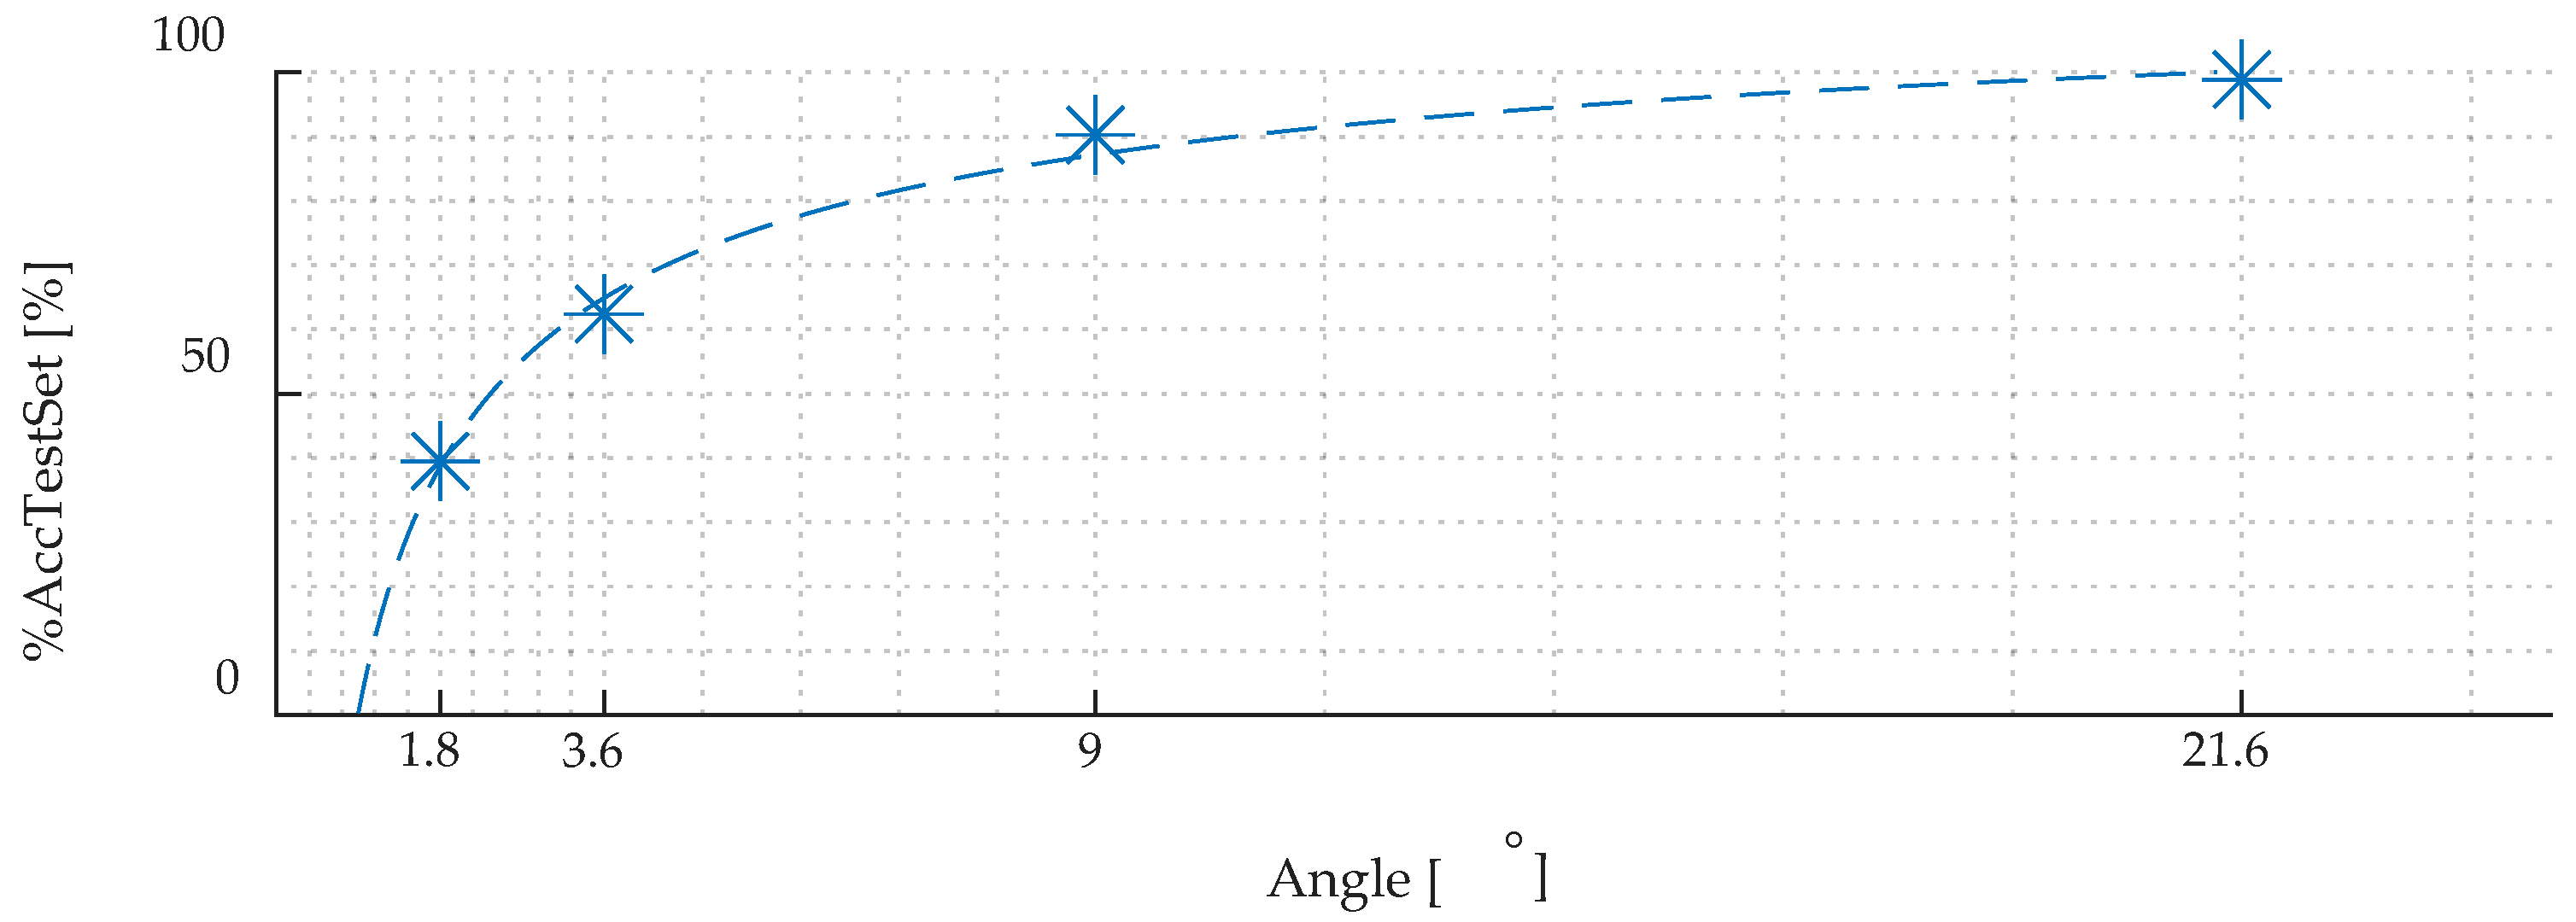
4.3. Analysis of the Constructed Network Operation
5. Conclusions
Author Contributions
Funding
Institutional Review Board Statement
Informed Consent Statement
Data Availability Statement
Conflicts of Interest
References
- Korzunin, G.S.; Sysolyatina, I.P.; Chstyakov, V.K.; Bulychev, O.A. The Effect of the Anisotropy of Magnetic Properties of Electrical Steel on Magnetic Losses in Power Transformer Cores. Russ. J. Nondestruct. Test. 2010, 46, 632–637. [Google Scholar] [CrossRef]
- Elleuch, M.; Poloujadoff, M. Anisotropy in Three-Phase Transformer Circuit Model. IEEE Trans. Magn. 1997, 33, 4319–4326. [Google Scholar] [CrossRef]
- Lee, J.-J.; Kwon, S.-O.; Hong, J.-P.; Ha, K.-H. Cogging Torque Analysis of the PMSM for High Performance Electrical Motor Considering Magnetic Anisotropy of Electrical Steel. WEVJ 2009, 3, 365–369. [Google Scholar] [CrossRef] [Green Version]
- Di Napoli, A.; Paggi, R. A Model of Anisotropic Grain-Oriented Steel. IEEE Trans. Magn. 1983, 19, 1557–1561. [Google Scholar] [CrossRef]
- Shirkoohi, G.H.; Liu, J. A Finite Element Method for Modelling of Anisotropic Grain-Oriented Steels. IEEE Trans. Magn. 1994, 30, 1078–1080. [Google Scholar] [CrossRef]
- Żurek, Z.H.; Solecka, B.; Stokłosa, Z.; Witoś, M. Selection of Transformer Sheets Using an Impedance Method. In Proceedings of the International Symposium on Structural Health Monitoring and Nondestructive Testing, Saarbruecken, Germany, 4–5 October 2018; p. 10. [Google Scholar]
- Mazgaj, W.; Warzecha, A. Influence of Electrical Steel Sheet Textures on Their Magnetization Curves. Arch. Electr. Eng. 2013, 62, 425–437. [Google Scholar] [CrossRef] [Green Version]
- Wodzyński, A.; Suliga, M.; Chwastek, K. Blachy elektrotechniczne o ziarnach zorientowanych—wybrane zagadnienia. Pr. Inst. Elektrotechniki 2014, Z. 267. [Google Scholar]
- Tumanski, S. Modern Magnetic Materials—The Review. Przeglad Elektrotechniczny 2010, 4, 10. [Google Scholar]
- Tumański, S. Handbook of Magnetic Measurements; CRC Press: Boca Raton, FL, USA, 2011; ISBN 978-1-4398-2952-3. [Google Scholar]
- Cullity, B.D.; Graham, C.D. Introduction to Magnetic Materials, 2nd ed.; IEEE/Wiley: Hoboken, NJ, USA, 2009; ISBN 978-0-471-47741-9. [Google Scholar]
- Guo, V.W.; Lu, B.; Wu, X.; Ju, G.; Valcu, B.; Weller, D. A Survey of Anisotropy Measurement Techniques and Study of Thickness Effect on Interfacial and Volume Anisotropies in Co/Pt Multilayer Media. J. Appl. Phys. 2006, 99, 08E918. [Google Scholar] [CrossRef]
- Silva, E.; Paula, A.; Leite, J.; Leite, J.; Andrade, L.; de Albuquerque, V.; Tavares, J. Detection of the Magnetic Easy Direction in Steels Using Induced Magnetic Fields. Metals 2016, 6, 317. [Google Scholar] [CrossRef] [Green Version]
- Sievert, J. The Measurement of Magnetic Properties of Electrical Sheet Steel—Survey on Methods and Situation of Standards. J. Magn. Magn. Mater. 2000, 215–216, 647–651. [Google Scholar] [CrossRef]
- Tumański, S. Modern Methods of Electrical Steel Testing—A Review. Electrotech. Rev. 2021, 1, 164–169. [Google Scholar] [CrossRef]
- Clapham, L.; Heald, C.; Krause, T.; Atherton, D.L.; Clark, P. Origin of a Magnetic Easy Axis in Pipeline Steel. J. Appl. Phys. 1999, 86, 1574. [Google Scholar] [CrossRef]
- Caldas-Morgan, M.; Padovese, L.R. Fast Detection of the Magnetic Easy Axis on Steel Sheet Using the Continuous Rotational Barkhausen Method. NDT E Int. 2012, 45, 148–155. [Google Scholar] [CrossRef]
- Martínez-Ortiz, P.; Pérez-Benitez, J.A.; Espina-Hernández, J.H.; Caleyo, F.; Hallen, J.M. On the Estimation of the Magnetic Easy Axis in Pipeline Steels Using Magnetic Barkhausen Noise. J. Magn. Magn. Mater. 2015, 374, 67–74. [Google Scholar] [CrossRef]
- de Campos, M.F.; Campos, M.A.; Landgraf, F.J.G.; Padovese, L.R. Anisotropy Study of Grain Oriented Steels with Magnetic Barkhausen Noise. J. Phys. Conf. Ser. 2011, 303, 012020. [Google Scholar] [CrossRef]
- Pérez-Benítez, J.A.; Espina-Hernández, J.H.; Man, T.L.; Caleyo, F.; Hallen, J.M. Identification of Different Processes in Magnetization Dynamics of API Steels Using Magnetic Barkhausen Noise. J. Phys. D Appl. Phys. 2015, 48, 295002. [Google Scholar] [CrossRef]
- Chávez-Gonzalez, A.F.; Martínez-Ortiz, P.; Pérez-Benítez, J.A.; Espina-Hernández, J.H.; Caleyo, F. Comparison of Angular Dependence of Magnetic Barkhausen Noise of Hysteresis and Initial Magnetization Curve in API5L Steel. J. Magn. Magn. Mater. 2018, 446, 18–27. [Google Scholar] [CrossRef]
- Kleber, X.; Vincent, A. On the Role of Residual Internal Stresses and Dislocations on Barkhausen Noise in Plastically Deformed Steel. NDT E Int. 2004, 37, 439–445. [Google Scholar] [CrossRef]
- AKÇAO, F.Ü.; Lu, Z.; Gür, C.H. Monitoring Magnetic Anisotropy Variations in Cold-Rolled Steels by Magnetic Barkhausen Noise Method. In Proceedings of the 11th European Conference on Non-Destructive Testing (ECNDT 2014), Prague, Czech Republic, 6–10 October 2014. [Google Scholar]
- Jiles, D. Introduction to Magnetism and Magnetic Materials, 3rd ed.; CRC Press: Boca Raton, FL, USA; Taylor & Francis Group: Boca Raton, FL, USA, 2016; ISBN 978-1-4822-3887-7. [Google Scholar]
- Shilling, J.; Houze, G. Magnetic Properties and Domain Structure in Grain-Oriented 3% Si-Fe. IEEE Trans. Magn. 1974, 10, 195–223. [Google Scholar] [CrossRef]
- Maciusowicz, M.; Psuj, G. Use of Time-Dependent Multispectral Representation of Magnetic Barkhausen Noise Signals for the Needs of Non-Destructive Evaluation of Steel Materials. Sensors 2019, 19, 1443. [Google Scholar] [CrossRef] [Green Version]
- Łopato, P.; Psuj, G.; Herbko, M.; Maciusowicz, M. Evaluation of Stress in Steel Structures Using Electromagnetic Methods Based on Utilization of Microstrip Antenna Sensor and Monitoring of AC Magnetization Process. Inform. Autom. Pomiary Gospod. Ochr. Sr. 2016, nr 4, 32–36. [Google Scholar] [CrossRef]
- Anglada-Rivera, J.; Padovese, L.R.; Capó-Sánchez, J. Magnetic Barkhausen Noise and Hysteresis Loop in Commercial Carbon Steel: Influence of Applied Tensile Stress and Grain Size. J. Magn. Magn. Mater. 2001, 231, 299–306. [Google Scholar] [CrossRef]
- Franco Grijalba, F.A.; Padovese, L.R. Non-Destructive Scanning for Applied Stress by the Continuous Magnetic Barkhausen Noise Method. J. Magn. Magn. Mater. 2018, 446, 231–238. [Google Scholar] [CrossRef]
- Stewart, D.M.; Stevens, K.J.; Kaiser, A.B. Magnetic Barkhausen Noise Analysis of Stress in Steel. Curr. Appl. Phys. 2004, 4, 308–311. [Google Scholar] [CrossRef]
- Ding, S.; Tian, G.; Dobmann, G.; Wang, P. Analysis of Domain Wall Dynamics Based on Skewness of Magnetic Barkhausen Noise for Applied Stress Determination. J. Magn. Magn. Mater. 2017, 421, 225–229. [Google Scholar] [CrossRef] [Green Version]
- Roskosz, M.; Fryczowski, K.; Schabowicz, K. Evaluation of Ferromagnetic Steel Hardness Based on an Analysis of the Barkhausen Noise Number of Events. Materials 2020, 13, 2059. [Google Scholar] [CrossRef] [PubMed]
- Piotrowski, L.; Chmielewski, M.; Golański, G.; Wieczorek, P. Analysis of the Possibility of Creep Damage Detection in T24 Heat Resistant Steel with the Help of Magnetic Nondestestructive Testing Methods. Eng. Fail. Anal. 2019, 102, 384–394. [Google Scholar] [CrossRef]
- Garstka, T. Barkhausen Noise Stress Characteristic of P265GH Boiler Steel. Acta Phys. Pol. A 2012, 121, 954–958. [Google Scholar] [CrossRef]
- Ktena, A.; Hristoforou, E.; Gerhardt, G.J.L.; Missell, F.P.; Landgraf, F.J.G.; Rodrigues, D.L.; Alberteris-Campos, M. Barkhausen Noise as a Microstructure Characterization Tool. Phys. B Condens. Matter 2014, 435, 109–112. [Google Scholar] [CrossRef]
- Espina-Hernández, J.H.; Pérez-Benítez, J.A.; Caleyo, F.; Baudin, T.; Helbert, A.L.; Hallen, J.M. Barkhausen Noise Measurements Give Direct Observation of Magnetocrystalline Anisotropy Energy in Ferromagnetic Polycrystals. J. Phys. D Appl. Phys. 2013, 46, 392001. [Google Scholar] [CrossRef]
- Maciusowicz, M.; Psuj, G. Time-Frequency Analysis of Barkhausen Noise for the Needs of Anisotropy Evaluation of Grain-Oriented Steels. Sensors 2020, 20, 768. [Google Scholar] [CrossRef] [PubMed] [Green Version]
- Maciusowicz, M.; Psuj, G. Use of Time-Frequency Representation of Magnetic Barkhausen Noise for Evaluation of Easy Magnetization Axis of Grain-Oriented Steel. Materials 2020, 13, 3390. [Google Scholar] [CrossRef] [PubMed]
- Tran-Ngoc, H.; Khatir, S.; Le-Xuan, T.; De Roeck, G.; Bui-Tien, T.; Abdel Wahab, M. A Novel Machine-Learning Based on the Global Search Techniques Using Vectorized Data for Damage Detection in Structures. Int. J. Eng. Sci. 2020, 157, 103376. [Google Scholar] [CrossRef]
- Tran-Ngoc, H.; Khatir, S.; Ho-Khac, H.; De Roeck, G.; Bui-Tien, T.; Abdel Wahab, M. Efficient Artificial Neural Networks Based on a Hybrid Metaheuristic Optimization Algorithm for Damage Detection in Laminated Composite Structures. Compos. Struct. 2021, 262, 113339. [Google Scholar] [CrossRef]
- Bhandare, A.; Bhide, M.; Gokhale, P.; Chandavarkar, R. Applications of Convolutional Neural Networks. Int. J. Comput. Sci. Inf. Technol. 2016, 7, 10. [Google Scholar]
- Akinosho, T.D.; Oyedele, L.O.; Bilal, M.; Ajayi, A.O.; Delgado, M.D.; Akinade, O.O.; Ahmed, A.A. Deep Learning in the Construction Industry: A Review of Present Status and Future Innovations. J. Build. Eng. 2020, 32, 101827. [Google Scholar] [CrossRef]
- Azimi, M.; Eslamlou, A.; Pekcan, G. Data-Driven Structural Health Monitoring and Damage Detection through Deep Learning: State-of-the-Art Review. Sensors 2020, 20, 2778. [Google Scholar] [CrossRef]
- Liu, W.; Liu, Z.; Nunez, A.; Han, Z. Unified Deep Learning Architecture for the Detection of All Catenary Support Components. IEEE Access 2020, 8, 17049–17059. [Google Scholar] [CrossRef]
- Lee, S.Y.; Tama, B.A.; Moon, S.J.; Lee, S. Steel Surface Defect Diagnostics Using Deep Convolutional Neural Network and Class Activation Map. Appl. Sci. 2019, 9, 5449. [Google Scholar] [CrossRef] [Green Version]
- Perez-Montes, F.; Ortega-Labra, O.; Manh, T.L.; Perez-Benitez, J.A. Enhancing the Precision of Magnetocrystalline Anisotropy Energy Estimation from Barkhausen Noise Using a Deep Neural Network. Mater. Today Commun. 2020, 24, 101145. [Google Scholar] [CrossRef]
- Qiao, J.; Guo, F.; Qiu, S.; Zhang, X.; Wang, H. Formation Mechanism of Surface Oxide Layer of Grain-Oriented Silicon Steel. J. Iron Steel Res. Int. 2021, 28, 327–334. [Google Scholar] [CrossRef]
- Puchý, V.; Kováč, F.; Hvizdoš, P.; Petryshynets, I.; Sopko, M. Effect of Fiber Laser Treating on Magnetic Domains in the Grain-Oriented Silicon Steel: Imaging Domains by Bitter, MFM and Kerr Microscopy. High Temp. Mater. Processes 2016, 35, 739–744. [Google Scholar] [CrossRef]
- Chukwuchekwa, N.; Moses, A.J.; Anderson, P. Study of the Effects of Surface Coating on Magnetic Barkhausen Noise in Grain-Oriented Electrical Steel. IEEE Trans. Magn. 2012, 48, 1393–1396. [Google Scholar] [CrossRef]
- Chukwuchekwa, N.; Moses, A.J.; Anderson, P.I. Effect of Magnetic Domain Refinement on Barkhausen Noise of Large Grain High Permeability Oriented Electrical Steel. In Proceedings of the Soft Magnetic Materials Conference (SMM21), Budapest, Hungary, 1 September 2013. [Google Scholar]
- Géron, A. Hands-On Machine Learning with Scikit-Learn, Keras, and TensorFlow: Concepts, Tools, and Techniques to Build Intelligent Systems, 2nd ed.; O’Reilly Media: Sebastopol, CA, USA, 2019; ISBN 978-1-4920-3264-9. [Google Scholar]
- Schwendicke, F.; Golla, T.; Dreher, M.; Krois, J. Convolutional Neural Networks for Dental Image Diagnostics: A Scoping Review. J. Dent. 2019, 91, 103226. [Google Scholar] [CrossRef]
- Napoletano, P.; Piccoli, F.; Schettini, R. Anomaly Detection in Nanofibrous Materials by CNN-Based Self-Similarity. Sensors 2018, 18, 209. [Google Scholar] [CrossRef] [PubMed] [Green Version]
- Psuj, G. Multi-Sensor Data Integration Using Deep Learning for Characterization of Defects in Steel Elements. Sensors 2018, 18, 292. [Google Scholar] [CrossRef] [Green Version]
- Szymanik, B.; Psuj, G.; Hashemi, M.; Lopato, P. Detection and Identification of Defects in 3D-Printed Dielectric Structures via Thermographic Inspection and Deep Neural Networks. Materials 2021, 14, 4168. [Google Scholar] [CrossRef]
- Kłosowski, G.; Rymarczyk, T.; Kania, K.; Świć, A.; Cieplak, T. Maintenance of Industrial Reactors Supported by Deep Learning Driven Ultrasound Tomography. EiN 2019, 22, 138–147. [Google Scholar] [CrossRef]
- Tan, R.K.; Zhang, N.L.; Ye, W. A Deep Learning–Based Method for the Design of Microstructural Materials. Struct Multidisc. Optim. 2020, 61, 1417–1438. [Google Scholar] [CrossRef]
- Curilem, M.; Canário, J.P.; Franco, L.; Rios, R.A. Using CNN To Classify Spectrograms of Seismic Events from Llaima Volcano (Chile). In Proceedings of the 2018 International Joint Conference on Neural Networks (IJCNN), Rio de Janeiro, Brazil, 8–13 July 2018; pp. 1–8. [Google Scholar]
- Chen, Z.; Xu, Y.-Q.; Wang, H.; Guo, D. Deep STFT-CNN for Spectrum Sensing in Cognitive Radio. IEEE Commun. Lett. 2021, 25, 864–868. [Google Scholar] [CrossRef]
- Nie, J.; Xiao, Y.; Huang, L.; Lv, F. Time-Frequency Analysis and Target Recognition of HRRP Based on CN-LSGAN, STFT, and CNN. Complexity 2021, 2021, 6664530. [Google Scholar] [CrossRef]
- Dogo, E.M.; Afolabi, O.J.; Nwulu, N.I.; Twala, B.; Aigbavboa, C.O. A Comparative Analysis of Gradient Descent-Based Optimization Algorithms on Convolutional Neural Networks. In Proceedings of the 2018 International Conference on Computational Techniques, Electronics and Mechanical Systems (CTEMS), Belgaum, India, 21–22 December 2018; IEEE: Belgaum, India; pp. 92–99. [Google Scholar]
- Grandini, M.; Bagli, E.; Visani, G. Metrics for Multi-Class Classification: An Overview. arXiv 2020, arXiv:2008.05756. [Google Scholar]


| Sample Name | Sample Type | Thickness [mm] | Min. Lossiness (1.7 T/50 Hz) [W/kg] | Min. Induction [T] |
|---|---|---|---|---|
| C23#1 | CGO | 0.23 | 1.10 | 1.80 |
| H23#1 | HGO | 0.23 | 0.95 | 1.88 |
| H23LS#1 | HGO with LS | 0.23 | 0.95 | 1.87 |
| C27#1 | CGO | 0.27 | 1.14 | 1.80 |
| C27LS#1 | CGO with LS | 0.27 | 1.05 | 1.80 |
| C30#1 | CGO | 0.30 | 1.17 | 1.80 |
| C30LS#1 | CGO with LS | 0.30 | 1.07 | 1.80 |
| C27#2 | CGO | 0.27 | 1.20 | 1.80 |
| C27P#2 | decoated CGO | 0.27 | N/A | N/A |
| C27N#2 | nitrided CGO | 0.27 | N/A | N/A |
| Sample | α [°] | Std. dev. [°] | β [°] | Std. dev. [°] | γ [°] | Std. dev. [°] |
|---|---|---|---|---|---|---|
| C23#1 | 26.9 | 0.9 | 4.3 | 0.5 | 4.8 | 0.2 |
| H23#1 | 5.3 | 0.6 | 2.8 | 0.7 | 0.7 | 0.5 |
| H23LS#1 | 4.7 | 1.5 | 2.1 | 1.6 | 9.9 | 0.5 |
| C27#1 | 8.6 | 0.7 | 5.8 | 0.8 | 3.3 | 0.6 |
| C27LS#1 | 1.0 | 0.8 | 3.4 | 1.8 | 4.7 | 0.9 |
| C30#1 | 1.0 | 0.8 | 3.1 | 1.2 | 2.4 | 0.8 |
| C30LS#1 | 3.8 | 0.8 | 3.1 | 2.0 | 3.9 | 1.0 |
| Sample | C23#1 | H23#1 | H23LS#1 | C27#1 | C27LS#1 | C30#1 | C30LS#1 | C27#2 |
|---|---|---|---|---|---|---|---|---|
| Si content | 2.9 | 3.1 | 3.1 | 2.9 | 2.8 | 2.9 | 2.9 | 3.0 |
| Sample | C23#1 | H23#1 | H23LS#1 | C27#1 | C27LS#1 | C30#1 | C30LS#1 | C27#2 |
|---|---|---|---|---|---|---|---|---|
| Thickness | 4.8 | 3.8 | 4.2 | 4.0 | 2.9 | 3.4 | 3.6 | 9.0 |
| Lp. | Layers | Size | Stride | FilterNum |
|---|---|---|---|---|
| 1 | Image Input | 145 × 94 × 1 | N/A | N/A |
| 2 | Convolutuon | 60 × 60 | 1 × 1 | 32 |
| 3 | Batch Normalization | N/A | N/A | N/A |
| 4 | ReLU | N/A | N/A | N/A |
| 5 | AveragePooling | 8 × 8 | 5 × 5 | N/A |
| 6 | Convolutuon | 4 × 4 | 3 × 3 | 128 |
| 7 | Batch Normalization | N/A | N/A | N/A |
| 8 | ReLU | N/A | N/A | N/A |
| 9 | AveragePooling | 1 × 1 | 2 × 2 | N/A |
| 10 | Fully Connected | N/A | N/A | N/A |
| 11 | Softmax | N/A | N/A | N/A |
| 12 | Classification Output | N/A | N/A | N/A |
| Parameter | Value/Name |
|---|---|
| Training algorythm | RMSProp |
| Initial learning rate | 0.005 |
| Mini Batch Size | 32 |
| Number of epoch | 75 |
| Name of Parameter | Formula | |
| Precision | (2) | |
| Recall | (3) | |
| F1-Score | (4) | |
| MacroAvreagePrecision | (5) | |
| MacroAvreageRecall | (6) | |
| MacroF1-Score | (7) |
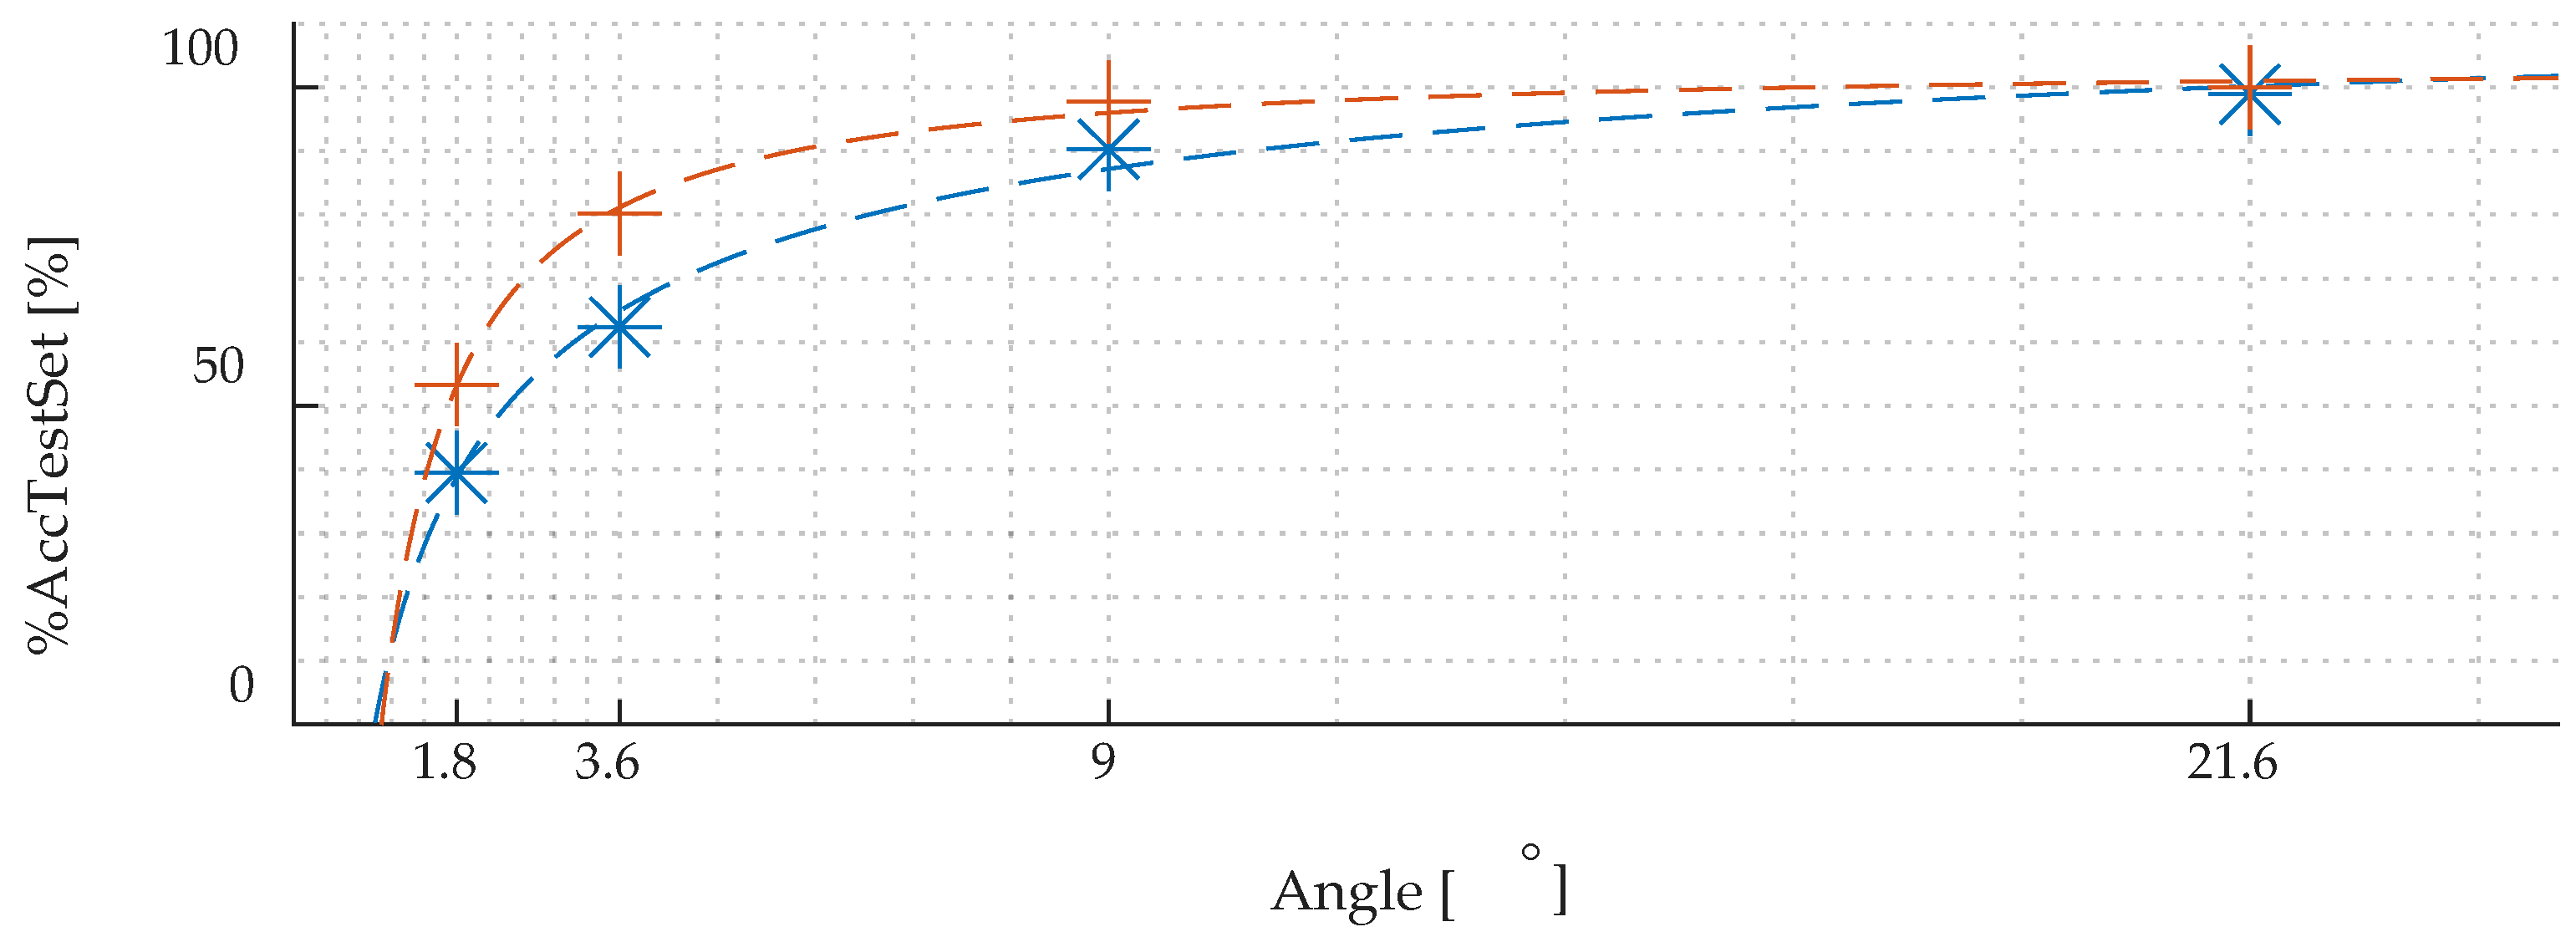
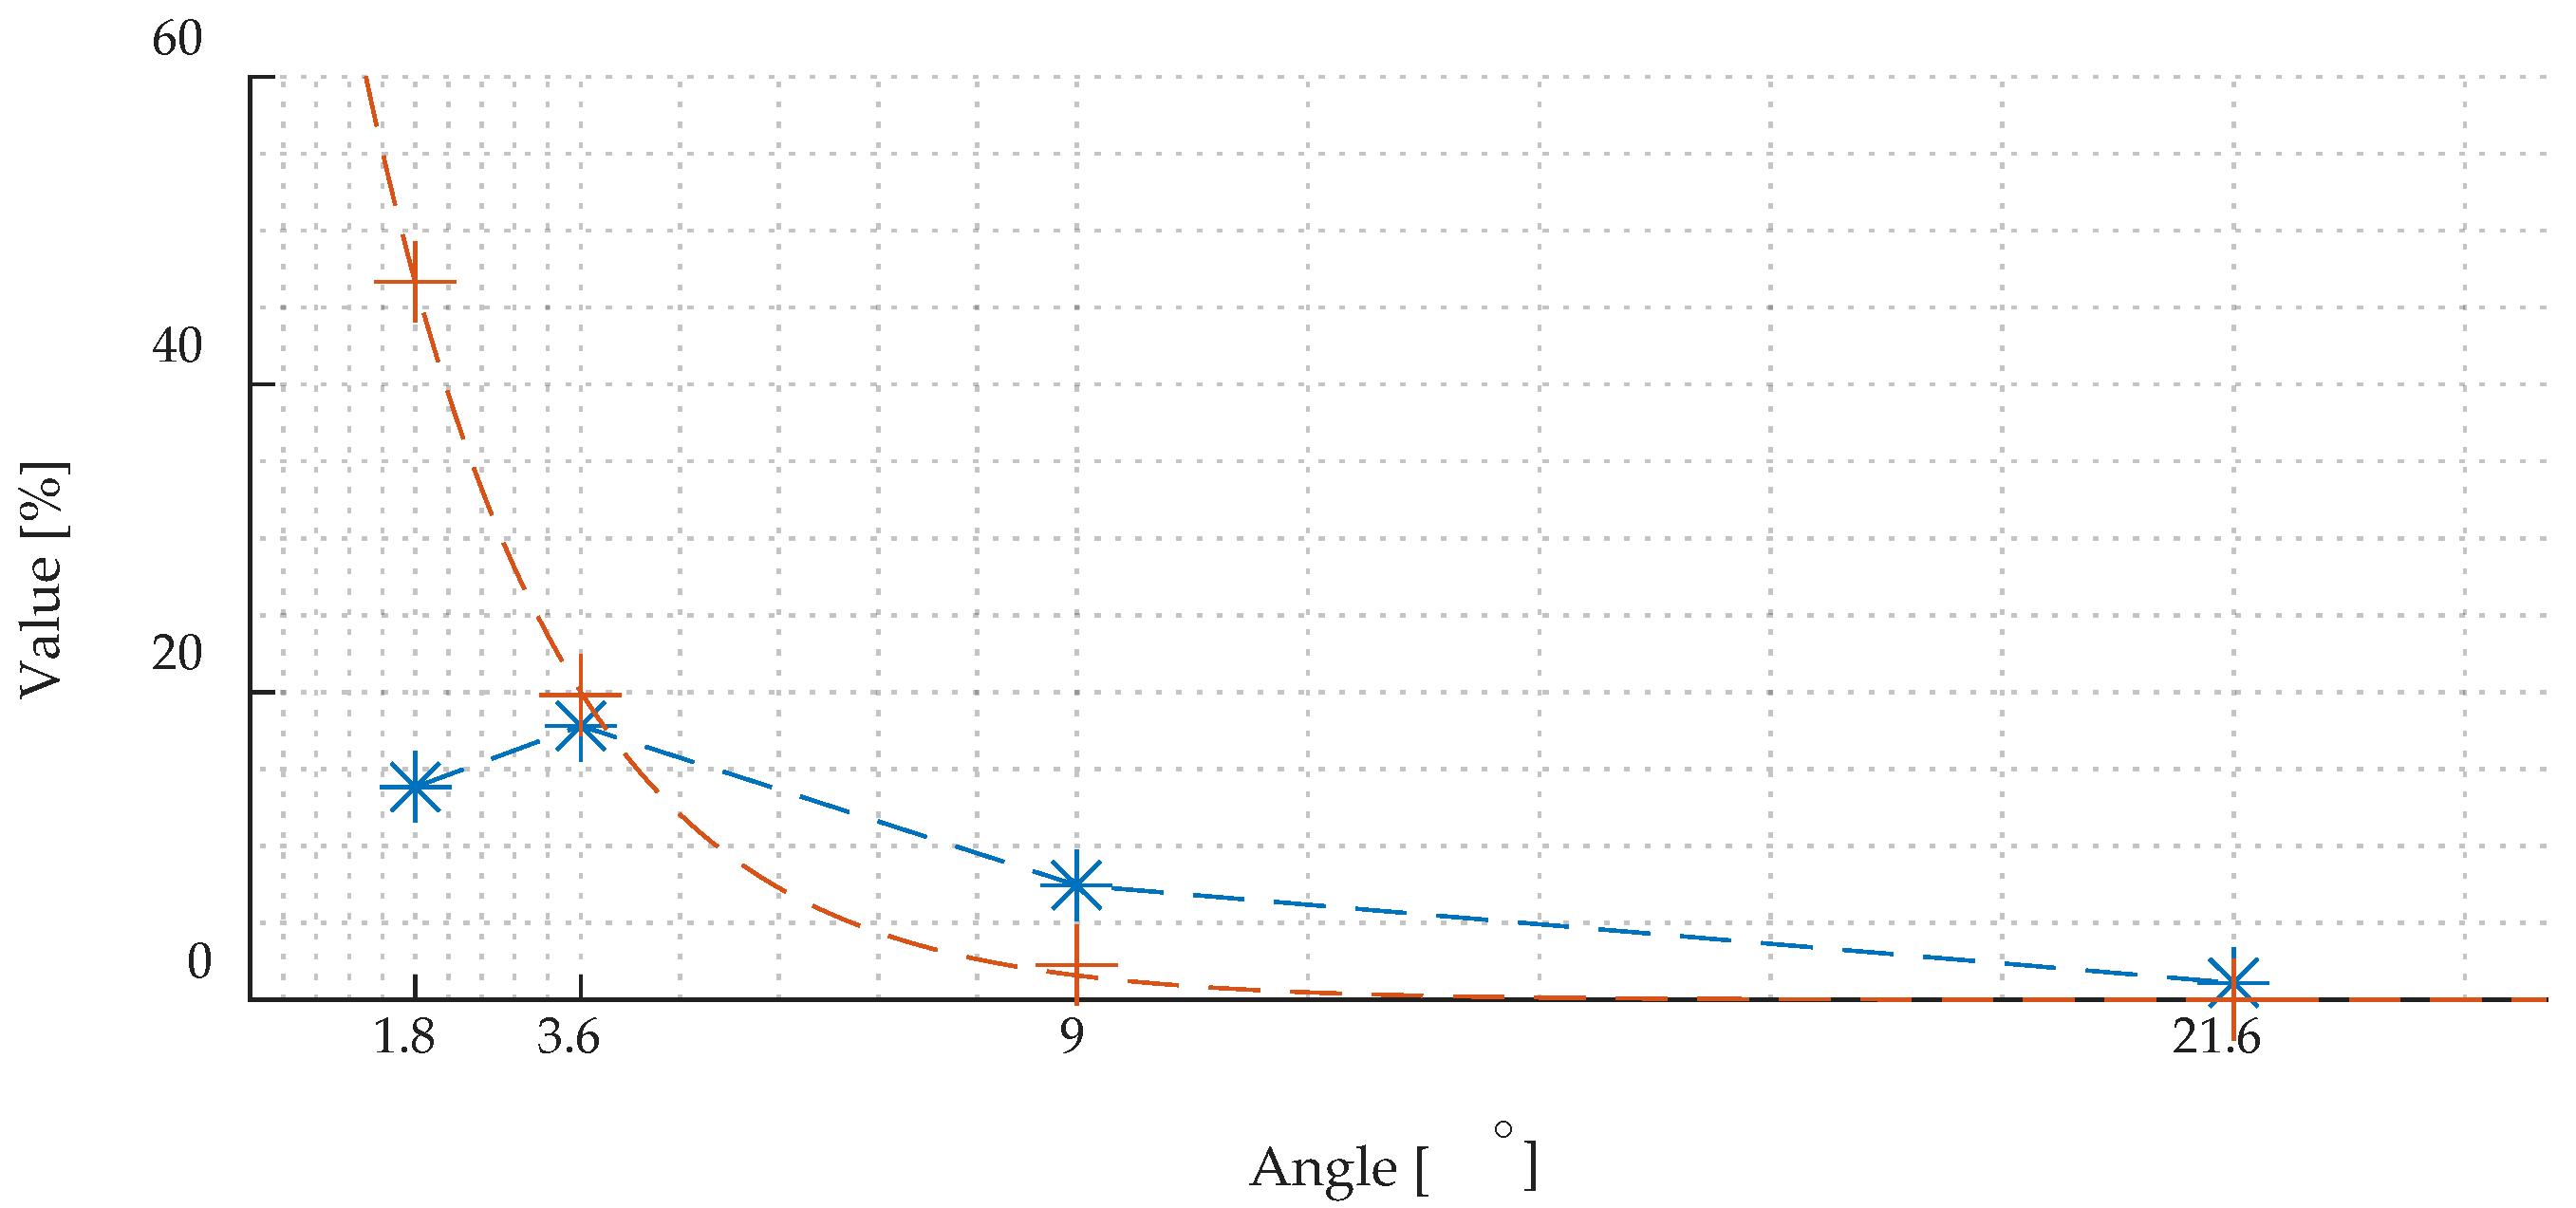
| Angle Resolution | MacroAvreageRecall | MacroAvreagePrecision | MacroF1-Score |
|---|---|---|---|
| 1.8° | 0.3950 | 0.3927 | 0.3802 |
| 3.6° | 0.6238 | 0.6387 | 0.6207 |
| 9° | 0.9027 | 0.9097 | 0.9029 |
| 21.6° | 0.9890 | 0.9892 | 0.9889 |
Publisher’s Note: MDPI stays neutral with regard to jurisdictional claims in published maps and institutional affiliations. |
© 2021 by the authors. Licensee MDPI, Basel, Switzerland. This article is an open access article distributed under the terms and conditions of the Creative Commons Attribution (CC BY) license (https://creativecommons.org/licenses/by/4.0/).
Share and Cite
Maciusowicz, M.; Psuj, G.; Kochmański, P. Identification of Grain Oriented SiFe Steels Based on Imaging the Instantaneous Dynamics of Magnetic Barkhausen Noise Using Short-Time Fourier Transform and Deep Convolutional Neural Network. Materials 2022, 15, 118. https://doi.org/10.3390/ma15010118
Maciusowicz M, Psuj G, Kochmański P. Identification of Grain Oriented SiFe Steels Based on Imaging the Instantaneous Dynamics of Magnetic Barkhausen Noise Using Short-Time Fourier Transform and Deep Convolutional Neural Network. Materials. 2022; 15(1):118. https://doi.org/10.3390/ma15010118
Chicago/Turabian StyleMaciusowicz, Michal, Grzegorz Psuj, and Paweł Kochmański. 2022. "Identification of Grain Oriented SiFe Steels Based on Imaging the Instantaneous Dynamics of Magnetic Barkhausen Noise Using Short-Time Fourier Transform and Deep Convolutional Neural Network" Materials 15, no. 1: 118. https://doi.org/10.3390/ma15010118
APA StyleMaciusowicz, M., Psuj, G., & Kochmański, P. (2022). Identification of Grain Oriented SiFe Steels Based on Imaging the Instantaneous Dynamics of Magnetic Barkhausen Noise Using Short-Time Fourier Transform and Deep Convolutional Neural Network. Materials, 15(1), 118. https://doi.org/10.3390/ma15010118