Article

Microstructure and Magnetocaloric Effect by Doping C in La-Fe-Si Ribbons

School of Materials Science and Engineering, Shanghai University, Shanghai 200072, China
*
Author to whom correspondence should be addressed.
Materials 2022, 15(1), 343; https://doi.org/10.3390/ma15010343
Submission received: 28 November 2021 / Revised: 29 December 2021 / Accepted: 30 December 2021 / Published: 4 January 2022

Abstract

:
The melt-spun ribbons of LaFe11.5Si1.5Cx (x = 0, 0.1, 0.2, 0.3) compounds are prepared by the melt fast-quenching method. The doping of C is beneficial to the nucleation and precipitation of the La (Fe, Si)13 phase, which is indicated by the microstructure observation and the elemental analysis. Subsequently, the ribbons of LaFe11.5Si1.5C0.2 are annealed at different times, and the phase composition, the microstructures, and the magnetic properties are investigated. The LaFe11.5Si1.5C0.2 ribbons annealed at 1273 K for 2 h achieved the best magnetic properties, and the maximum isothermal magnetic entropy change with a value of 9.45 J/(kg·K) upon an applied field of 1.5 T at an increased Curie temperature 255 K.

1. Introduction

Magnetic refrigeration, as a new pollution-free and efficient refrigeration technology, has attracted widespread attention and systematic research [1]. Among the magnetic refrigeration materials currently developed, the LaFe13-xSix (1.2 ≤ x ≤ 1.6) alloy is a promising candidate because of its large magnetocaloric effect, low cost, and environmentally friendly properties [1,2,3,4,5,6]. However, there are still some issues, such as the low Curie/working temperature and the long annealing time to generate the La (Fe, Si)13 phase producing the large magnetocaloric effect, that hinder this kind of material from practical applications. At present, transition elements such as Co [7,8] and Ni are widely used to replace Fe, or elements such as B [9], H [10], and C [11,12,13] with a small atomic radius can be doped as interstitial atoms to improve the Curie temperature of the La-Fe-Si alloy. The addition of a few rare earth elements, such as Ce instead of La, can greatly improve the magneto-thermal performance of the LaFe13-xSix alloy, but there is the problem of the Curie temperature reduction. Although Co replacing Fe can improve the Curie temperature of the La-Fe-Si alloy, the maximum isothermal magnetic entropy change of the alloy isreduced significantly [14]. Furthermore, the H element is doped as gap atoms in the La-Fe-Si alloy, while the Curie temperature increases, but the hydride is chemically unstable above 330 K, which is an unavoidable problem in practical applications [15].
In 2016, the structural and magnetothermal properties of the LaFe13-xSixCy carbide were investigated by V. Paul-Boncour et al. [16], who found that C atom doping leads to an increase in the Curie temperature and a drastic decrease of the magnetic entropy change. An almost single 1:13 phase was obtained after only a 30 min of heat treatment at 1393 K for the ball-milled samples. Even though doping C in the La-Fe-Si alloy ingot can increase the Curie temperature and obtain the optimal magnetic properties with a maximum isothermal magnetic entropy 12.7 J/(kg·K) (ΔH = 5 T) [17,18], the alloy ingot needs a long-time heat treatment for around 1 week for the formation of the La (Fe, Si)13 phase. Therefore, in order to increase the Curie temperature and reduce the heat-treatment time simultaneously, we investigated melt-spun ribbons of LaFe11.5Si1.5Cx (x = 0, 0.2) compounds prepared using the melt fast-quenching method. The formation of La (Fe, Si)13 phase in solidification and subsequent heat treatments by doping C was studied using an X-ray diffraction analyzer. The magneto-thermal properties were systematically studied using a vibration sample magnetometer.

2. Experimental Details

The raw materials used in this experiment were Fe (purity not less than 99.55%), La (purity not less than 99.9%), Si (purity not less than 99.999%), and graphite (purity not less than 99.9%). Considering the volatile rare earth elements in the melting process, the burn loss of the rare earth element La was measured by 10%. To make the sample composition uniform, electromagnetic stirring was initiated during the melting process and each sample was flipped and melted four times. The ingots were melt and spun into ribbons using a melt-spinner with a copper wheel at a surface speed of 35 m/s. For the subsequent heat treatment in a muffle furnace, the melt-spun ribbons were sealed in glass tubes filled with inert gas. The heat-treatments at a temperature of 1273 K to the LaFe11.5Si1.5C0.2 ribbons were 3 min and 2 h, respectively.
The phase structure analysis to the melt-spun ribbons was conducted by an X-ray diffraction instrument, D/MAX-2200-type (Cu target, Kα-ray). The magnetic properties were determined by a vibration sample magnetometer, namely the Lakeshore7470. The thermal magnetic curve was tested under the 0.1 T magnetic field. The isothermal magnetization curve was tested under the 0–1.5 T magnetic field. The magnetic entropy variation was calculated using the Maxwell Equation (1).
Δ S M ( T , H ) = S M ( T , H ) S M ( T , H = 0 ) = 0 H ( M T ) H d H

3. Result and Discussions

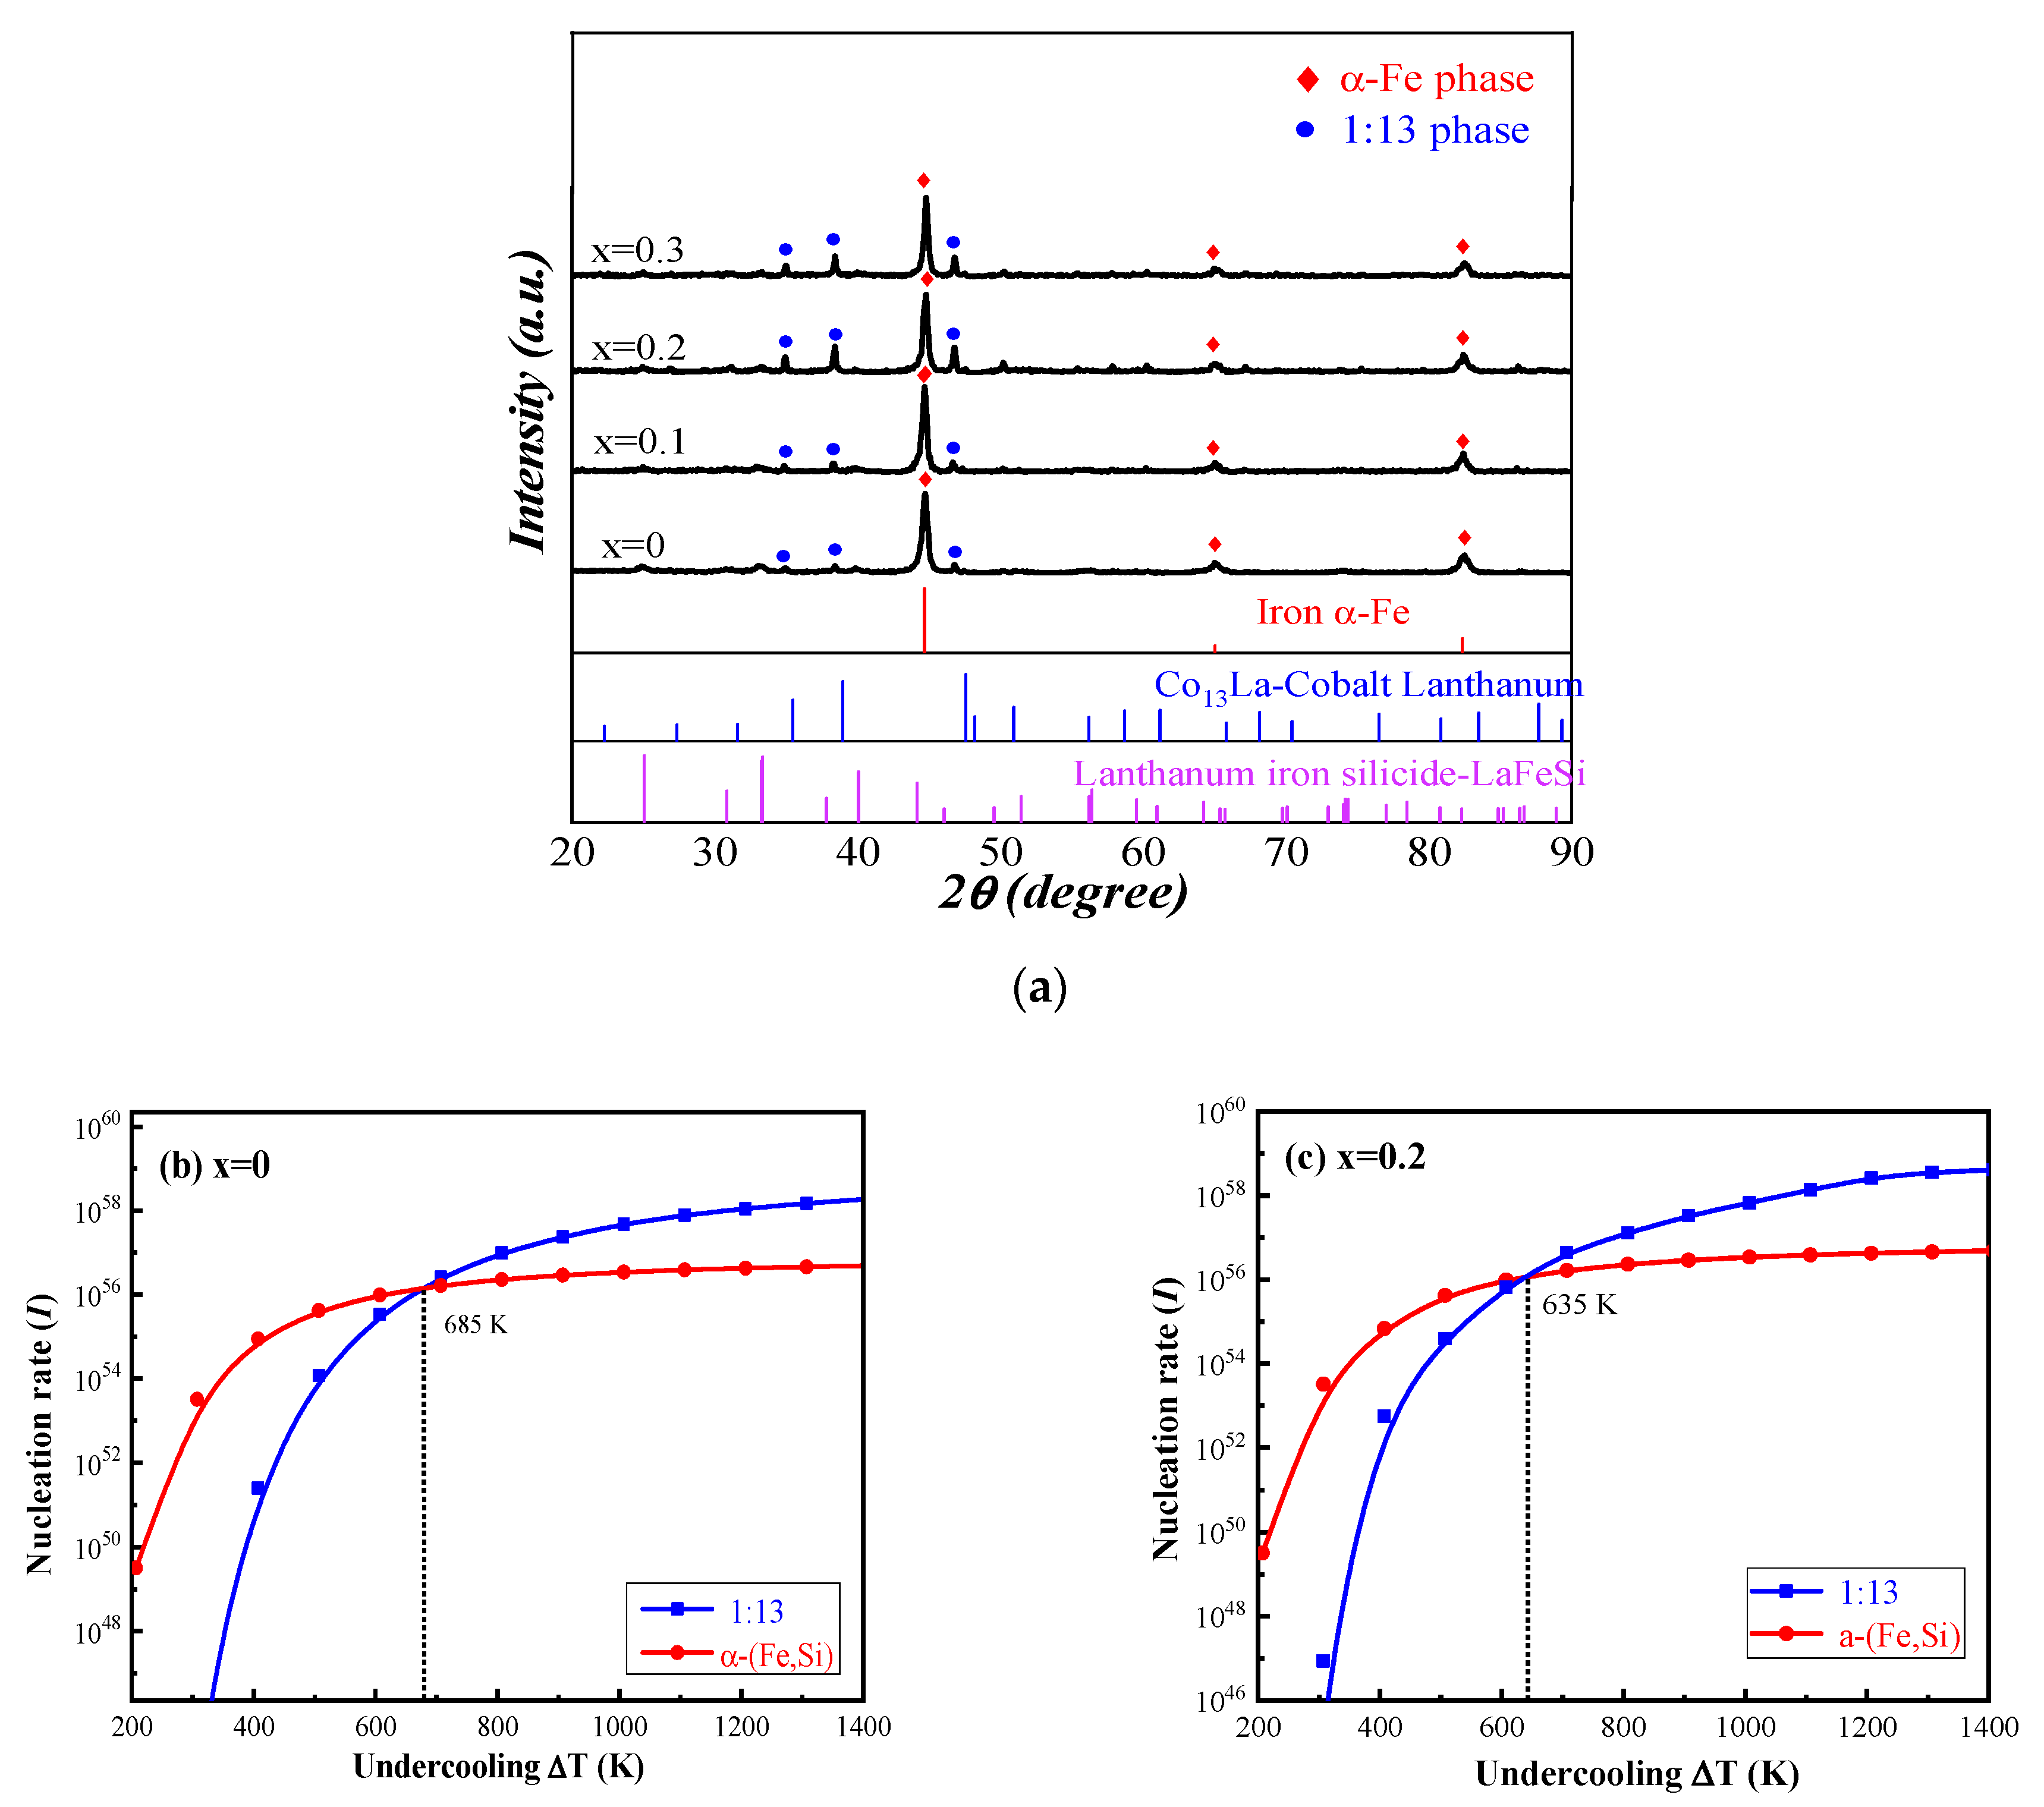
3.1. Nucleation Rate and Phase Structure

Figure 1a shows the XRD pattern of unannealed LaFe11.5Si1.5Cx (x = 0, 0.1, 0.2, 0.3) ribbons. It is not hard to see from the XRD pattern that in the fast-spun ribbons of LaFe11.5Si1.5Cx (x = 0.2) compounds without heat treatment, the main phases are all α-(Fe, Si) phases, and only a small amount of La (Fe, Si)13 phases are contained. With the increase in C content, the relative content of the NaZn13 type phase with a magnetocaloric effect increases first and then decreases, and the relative content of the La (Fe, Si)13 phase reaches a maximum in the sample of x = 0.2. With the continued increase in C content, the relative content of the La (Fe, Si)13 phases tended to decrease. The doping of C favors the formation of the La (Fe, Si)13 phases in the LaFe11.5Si1.5Cx(x = 0, 0.1, 0.2, and 0.3) alloy. This is because during the rapid solidification process, the La (Fe, Si)13 phase competed with the α-(Fe, Si) phase, while the doping of C favored the shaped nucleus and the dissolution of the La (Fe, Si)13 phase.
According to the analysis of the jade software, the 2θ of the main peak of the La (Fe, Si)13 phase in the unannealed LaFe11.5Si1.5CX (x = 0, 0.1, 0.2, 0.3) alloy was 46.762°, 46.677°, 46.642°, and 46.512°, respectively, as well as with the doping of the C element. According to the Bragg formula 2dsinθ = λ (d is the interplanar spacing, θ is the diffraction half angle, λ is the wavelength), it can be seen that the interplanar spacing of the La (Fe, Si)13 phase in the alloy rapid quenching band was increasing, which shows that C atoms as interstitial atoms entered the lattice of the La (Fe, Si)13 phase of the NaZn13 cubic structure, which caused the expansion of the crystal structure and the increase of the lattice constant. The results are shown in Table 1.
With the increase in C content, the relative content of the La (Fe, Si)13 phase decreased. The doping C was beneficial to the nucleation and precipitation of the La (Fe, Si)13 phase in the LaFe11.5Si1.5C0.2 ribbons, because there was a competitive nucleation relationship between the La (Fe, Si)13 phase and the α-(Fe, Si) phase during rapid solidification.
The heterogeneous nucleation rate [19,20] can be calculated by the following
I = k B TN n 3 π η ( T ) a 0 3 · exp [ Δ G * k B T ]
Figure 1b,c shows the nucleation rates of the α-(Fe, Si) and La (Fe, Si)13 phases versus the under-cooling degree at different C contents. During the solidification process of the ribbons, the degree of under-cooling affects the phase formation mechanism of the La-Fe-Si alloy. Figure 1b shows that in the solidification process of the La-Fe-Si alloy, the nucleation rate of the α-(Fe, Si) phase is higher than that of the La (Fe, Si)13 phase when the under-cooling degree is small. Thus, the lower under-cooling degree is not conducive to the formation of the La (Fe, Si)13 phase, and the main phase of the alloy is the α-(Fe, Si) phase. When the over cooling degree is large, the shaped nucleus rate of the La (Fe, Si)13 phase is higher than the α-(Fe, Si) phase, facilitating the formation of more La (Fe, Si)13 phases. The results show that the undercooling degree affects the competitive precipitation of the La (Fe, Si)13 phase and α-(Fe, Si) phase.
Under certain chamber pressure, the faster quenching speed, that is, the larger under-cooling degree, creates conditions for the nucleation and precipitation of the La (Fe, Si)13 phase, which is beneficial to the effective formation of the La (Fe, Si)13 single phase. Secondly, the large undercooling degree during rapid solidification is conducive to the formation of a small La-Fe-Si alloy microstructure [21].
The non-equilibrium rapid solidification process in the La-Fe-Si ribbons provides a high degree of undercooling for the nucleation and precipitation of the La (Fe, Si)13 phase, which induces the primary precipitation of the competitive La (Fe, Si)13 phase. Meanwhile, the crystal structure of the α-(Fe, Si) phase and La-Fe-Si phase grows slowly, and the nanoscale α-(Fe, Si) phase is distributed periodically and uniformly, which is beneficial to the diffusion of La, Fe, and Si atoms during heat treatment and promotes the inclusion reaction of the La (Fe, Si)13 phase. Therefore, the single-phase La (Fe, Si)13 phase can be obtained only in a short time by using a fast quenching method to prepare La-Fe-Si alloy rapid quenching strips.
In Figure 2a, region Ⅰ is small, corresponding to the La (Fe, Si)13 phase when x = 0, and region Ⅱ is the α-(Fe, Si) phase. The regions between region Ⅰ and region Ⅱ are the transition regions. Figure 2b shows that region Ⅰ (La (Fe, Si)13 phase) is significantly increased when x = 0.2. Figure 2c is an enlarged diagram of region Ⅱ, and Figure 2d is an enlarged diagram of the transition region. Table 2 is the EDS analysis of the micro-structure of the La-Fe-Si alloys. With the increasing C content, the content change of each element is not obvious.

3.2. LaFe11.5Si1.5C0.2 Heat Treatment

Figure 3 shows the XRD pattern of the LaFe11.5Si1.5C0.2 ribbons annealed at a temperature of 1273 K with different times. As shown in the diagram, the main phase is the α-(Fe, Si) phase and the secondary phase is the La (Fe, Si)13 phase to the unannealed LaFe11.5Si1.5C0.2 ribbons. After heat treatment, the main phase changes from the α-(Fe, Si) to the La (Fe, Si)13 phase, and the secondary phase changes from the La (Fe, Si)13 phase to the α-(Fe, Si) phase. When the heat-treatment time increases from 3 min to 2 h, the relative content of the α-phase decreases. This is due to the inclusion reaction between the α-(Fe, Si) phase and the La (Fe, Si)13 phase when the heat treatment of the ribbons is carried out at a temperature of 1273 K for 2 h.
Through the analysis of jade software, it is found that with the extension of heat treatment time, the 2θ of the main peak of the 13 phases of La (Fe, Si) in the fast quenched strip are 46.800°, 46.730°, and 46.698°, respectively. The main peak of La (Fe, Si)13 phase shifts to a small angle, because with the increase in heat treatment time, C atoms are fully spaced from the lattice of the La (Fe, Si)13 phase with a NaZn13 cubic structure, which makes its lattice expand and causes the lattice constant of the La (Fe, Si)13 phase to increase [22]. In addition, it can be clearly seen from the figure that the La (Fe, Si)13 phase in the alloy has become the main phase when the LaFe11.5Si1.5C0.2 strip is heat treated for 3 min. Compared with the alloy samples prepared by the traditional melting ingot method, the melt quenching process with a certain rapid quenching speed provides deep undercooling conditions for the formation of the La (Fe, Si)13 phase in the peritectic reaction process. It promotes the competitive nucleation and precipitation of La (Fe, Si)13 phase in the rapid solidification process, and the La (Fe, Si)13 phase formed in the early stage and the refined La (Fe, Si)13 phase grains in the melt rapid quenching shorten the time required for inclusion reaction in the heat treatment process. The results in Table 3 show that the lattice parameters are 11.4985 Å, 11.5036 Å, and 11.5107 Å at a wheel speed of 35 m/s annealed at 1273 K for as spun, 3 min and 2 h, respectively. In other words, the longer annealing time, the bigger the expansion of the alloy lattice.
Figure 4 is a free surface SEM appearance of the LaFe11.5Si1.5C0.2 fast quenching strip at 35 m/s at different times at a temperature of 1273 K. As is seen in Figure 4a, the free surface of the rapid quenching ribbon without heat treatment has a flat surface, no obvious branch crystal tissue, with cluster boundaries similar to the crystal boundary, probably due to the fast cooling speed and small grain size. After 3 min of heat treatment, some white particles of the rapid quenching ribbon began to precipitate through the EDS analysis (see Table 4). After the preliminary analysis of the research group, it can be inferred that the white particles are La2O3 [23]. Through the energy spectrum analysis of the free surface grain after heat treatment (see Table 4), in the atomic percentage of each element at different times, the internal phase composition of the grain is close to the La (Fe, Si)13 phase, and the analysis results are consistent with the results of the XRD in Figure 3. As can be seen from Figure 4c, in the free surface of the ribbon after heat treatment for 2 h, the triangle appearance has grown almost completely into a quadrilateral appearance, has spread over the whole surface, the crystal boundary is relatively flat, and the white particles of the La-rich phase are mostly distributed at the grain boundary of the circle particles, rarely at the quadrilateral crystal boundary.
Figure 5 shows the microstructure appearance image and high resolution image of LaFe11.5Si1.5C0.2 with a rapid quenching speed of 35 m/s and 3 min of heat treatment. Figure 5b is the Fourier transform of the lattice stripe of the circle region of Figure 5a, calibrated as the uniform La (Fe, Si)13 phase. Figure 5c is the Fourier transform of the lattice stripes of the Figure 5d white strips, labeled as a uniform La-Fe-Si phase. Figure 5e is the Fourier transform of the lattice stripe of the Figure 5a dark area, labeled as a uniform α-(Fe, Si) phase.
Figure 6 shows the tissue appearance image and high resolution image of LaFe11.5Si1.5C0.2 with a fast quenching speed of 35 m/s and 2 h heat treatment. As can be seen from Figure 6a, the area in the fast quenching strip consists of two different shapes. Figure 6b is an enlarged picture of region 1. It can be found that the quadular bulge in the SEM diagram of the free surface is composed of small and uniform particles, the matrix consists of gray and white particles, with a particle size within 200–500nm, and the two shapes are distinguished by a straight boundary. The formation of a quadratic crystal boundary in Figure 4c is also confirmed.
From the LaFe11.5Si1.5C0.2 fast quenched strip powder XRD pattern with a fast quenching speed of 35 m/s in Figure 3, the main phase is the La (Fe, Si)13 phase, containing only a small number of α-(Fe, Si) phases, so a large number of quadrilateral bumps in the free surface should be a relatively uniform La (Fe, Si)13 phase and a small number of α-(Fe, Si) phases in the white particles. A high-resolution morphology is taken at the junction of the base and the quadrilateral projection, as shown in Figure 6c. The Fourier transform of the lattice stripes of the high-resolution matrix A region is normalized to the uniform La (Fe, Si)13 phase, the lattice stripe of the gray grain in the B, C region of a high resolution, and the raised gray particles to the La-Fe-Si phase.

3.3. Effects on the Magnetic Properties

As can be seen from Figure 7, with the extension of the heat treatment time, the Curie temperature of the LaFe11.5Si1.5C0.2 quenching strip increases at 224 K (0 min), 231 K (3 min), and 255 K (2 h). This is because, with the increase of heat treatment time, the lattice expansion of the NaZn13 structure is caused by the effective entry of atomic energy into the gap position of La (Fe, Si)13 phase C. The three strong peaks of the La (Fe, Si)13 phase in Figure 3 can effectively prove this. With the C atoms entering the gap position in the La (Fe, Si)13 lattice, the 3D band of the Fe becomes narrower, the ferromagnetic interaction is enhanced, and the curie temperature tends to increase obviously.
Figure 8 shows the LaFe11.5Si1.5C0.2 fast quenching strip with a fast quenching speed of 35 m/s at a temperature of 1273 K, the maximum isothermal temperature after different times of heat treatment. We can see from Figure 8 that when the heat treatment time is 0 min, 3 min, and 2 h, the maximum isothermal magnetic entropy change of the LaFe11.5Si1.5C0.2 fast quenched strip is 2.32 J/(kg·K), 6.8 J/(kg·K), and 9.45 J/(kg·K), respectively. The maximum isothermal magnetic entropy change mutated after 20 min of heat treatment, and then showed an obvious trend of first increasing and then decreasing, and reached the maximum value after 2 h of heat treatment. This change in the magneto-thermal effect as the heat treatment time extends comes from the following reason. It is difficult to complete the crystallization reaction of the La (Fe, Si)13 phase during solidification, and La-Fe-Si as the primary α-(Fe, Si) phase is the main phase in the fast-quenched strip of the alloy, and the relative content of the La (Fe, Si)13 phase with a giant magnetothermic effect is relatively small, so it has a small maximum isothermal magnetic entropy change. After thermal treatment, during the wafer coating reaction process, the not fully reactive α-(Fe, Si) phase and the La-Fe-Si phase generates the La (Fe, Si)13 phase, causing the La (Fe, Si)13 phase in the alloy, thus having a large maximum isothermal magnetic entropy change, and mutations for the slightly longer thermal treatment (20 min). This agrees with the XRD result in Figure 3.
Figure 9 is the 3D curve of the temperature, magnetic field, and maximum isothermal magnetic entropy change of (x = 0.2) after thermal treatment for 2 h at 1273 K. As the magnetic fields increase, the ΔS−T curve changes from the symmetrical herringbone to the asymmetric curve, indicating that the alloy phase transition type from the secondary phase transition to the primary phase transition and ΔS shows an increasing trend (because the primary phase transition is the change of material magnetic ordered state caused by lattice distortion, the resulting magnetic entropy change is much greater than the secondary phase transition and reaches values of 9.45 J/(kg·K) upon an applied field of 1.5 T).

4. Conclusions

Considering the disadvantages of the low magneto-thermal effect and the long heat treatment time of room temperature magnetic refrigeration materials using the La-Fe-Si alloy, the magneto-thermal effect is improved, and the heat treatment time in the preparation process is greatly shortened by the melt fast quenching process. At the same time, the effects of different heat treatment times on the phase composition, magnetic properties, and micro-tissue of LaFe11.5Si1.5C0.2 are also studied. We present the following conclusions:
  • The doping of C promotes the formation of La (Fe, Si)13 phases in the La-Fe-Si series alloy. Compared with La-Fe-Si alloy without C doping, the LaFe11.5Si1.5Cx (x = 0.1, 0.2, 0.3) alloy obtained more of the La (Fe, Si)13 phase without heat treatment.
  • The process of heat treatment for 2 h at 1273 K facilitates a large isothermal variation of LaFe11.5Si1.5C0.2 entropy of alloy. With the extended thermal treatment time, the maximum isothermal magnetic entropy change of the LaFe11.5Si1.5C0.2 alloy fast strip tends to increase first before decreasing, reaching a maximum at 2 h of thermal treatment of 9.45 J/(kg·K).
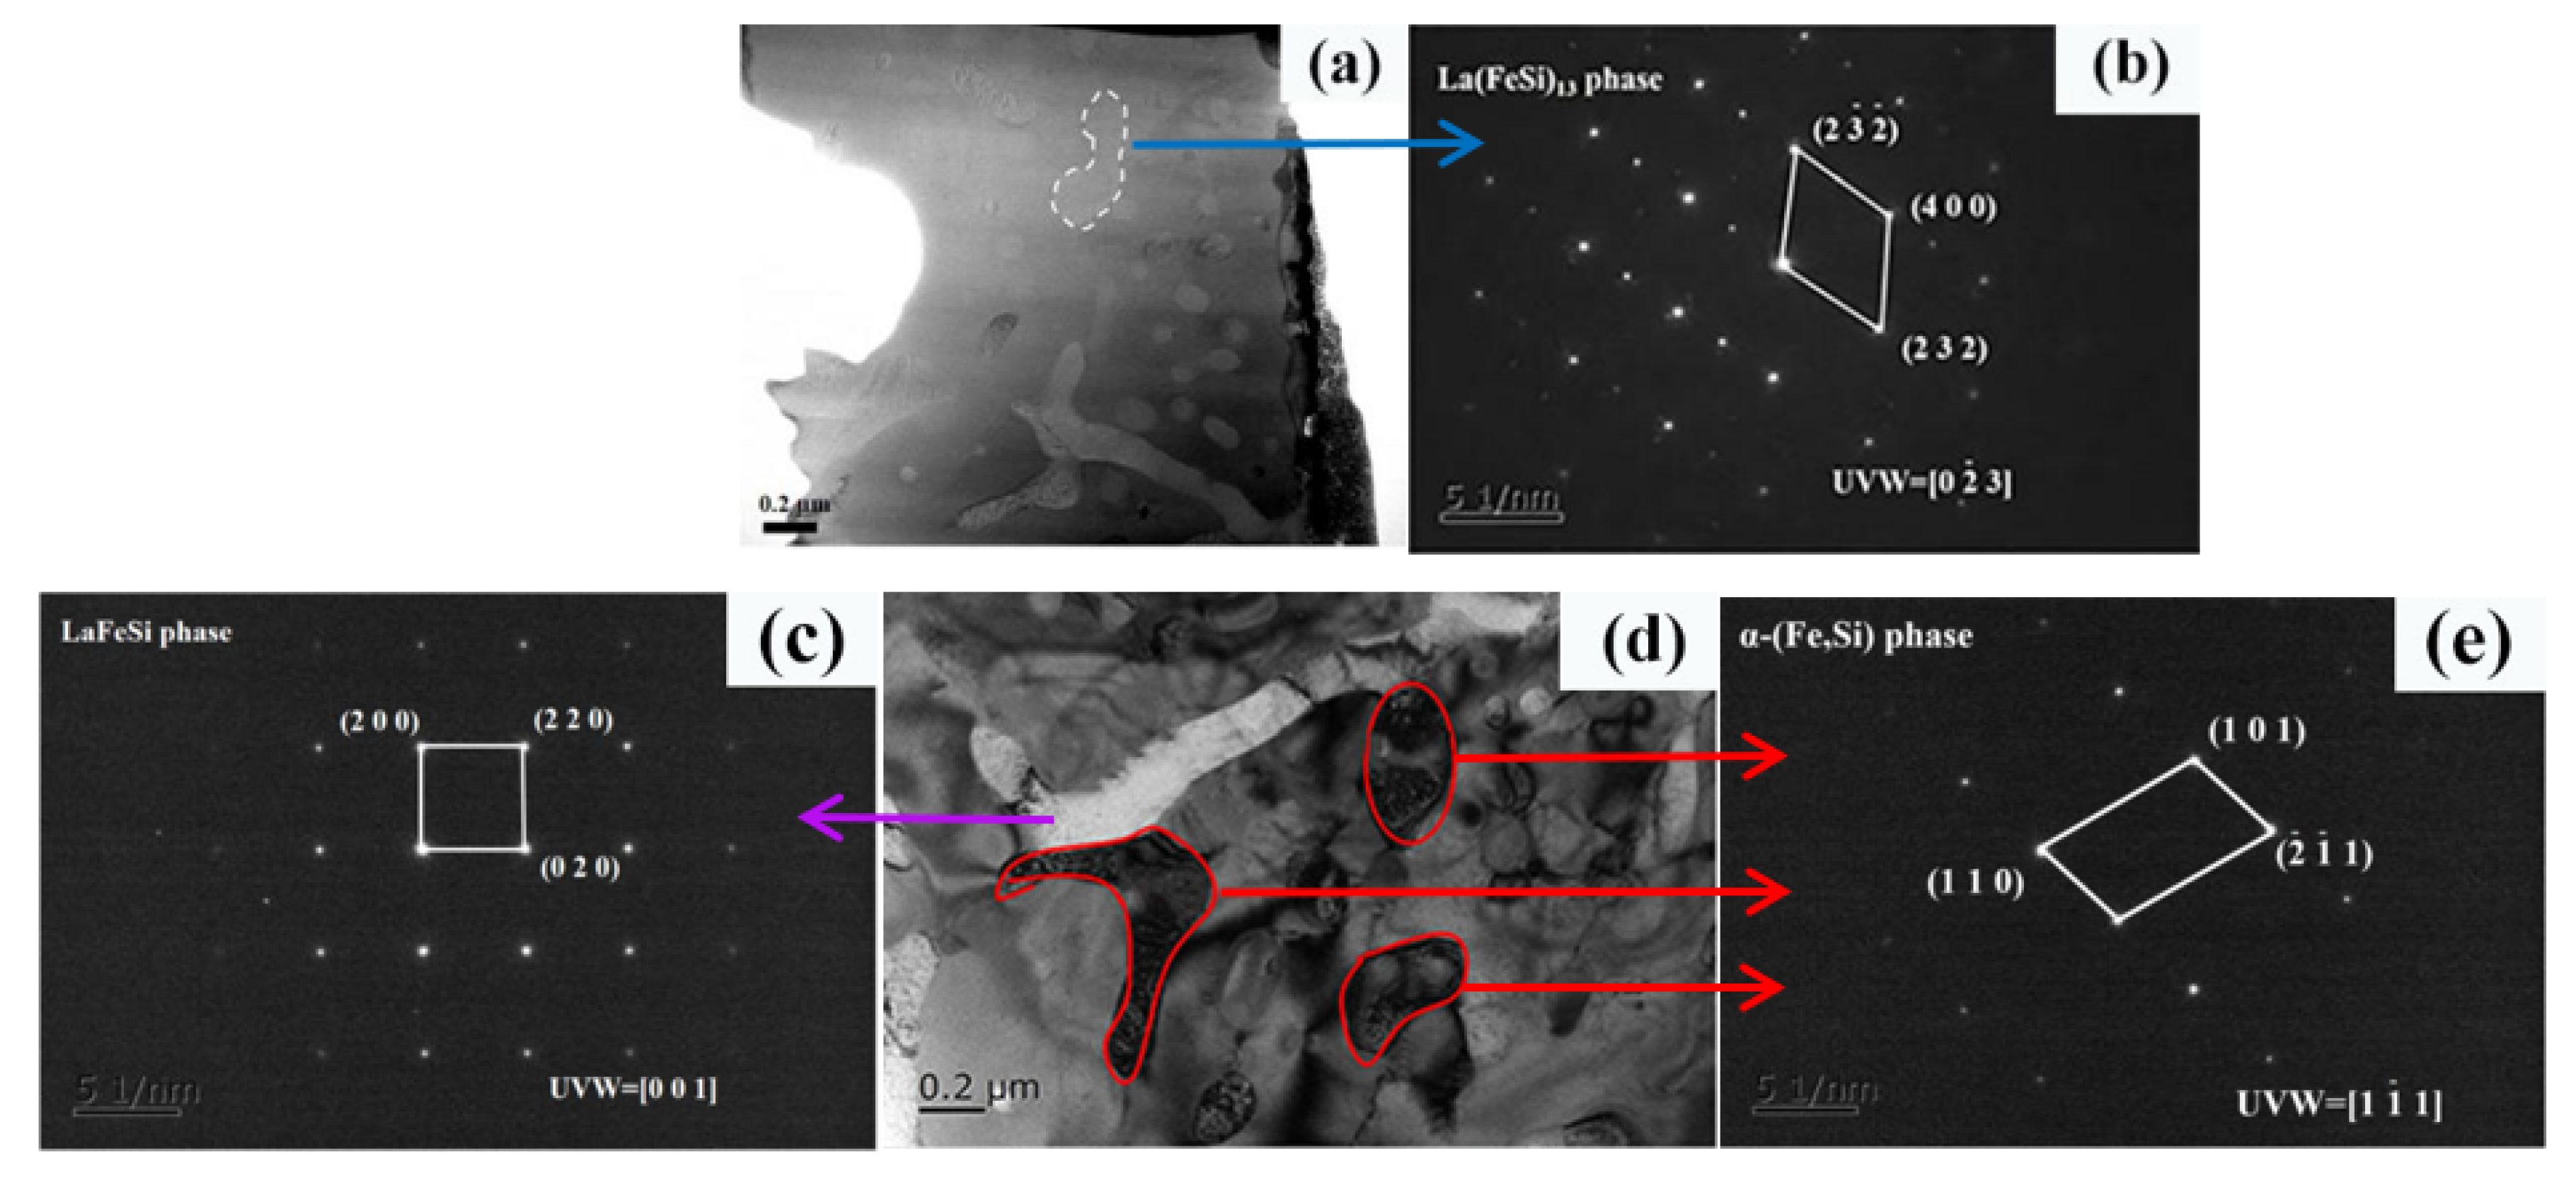
  • The characteristic quadrangle morphology in the LaFe11.5Si1.5C0.2 alloy fast quenching strip with 2 h pf heat treatment is benefitted by obtaining a higher magneto-thermal effect. Through the transmission analysis, the quadrilateral convex appearance in the 2 h heat treatment is the uniformly distributed La (Fe, Si)13 phase, and also the uniformly staggered distributed α-(Fe, Si) phase in the fast quenching band and the La-Fe-Si phase, which facilitates the contact between the α-(Fe, Si) phase and the La-Fe-Si phase, and promotes the packet analysis reaction. The uneven α-(Fe, Si) phase white large particles distributed in the alloy strip during 3 min heat treatment are difficult to contact using La-Fe-Si during heat treatment, which is not conducive to the packet analysis reaction, so the magneto-thermal effect is poor.

Author Contributions

Conceptualization, H.S. and Y.H.; methodology, H.S.; software, J.Z.; validation, J.Z. and J.F.; formal analysis, X.H.; investigation, Y.H.; resources, H.S.; data curation, H.S.; writing—original draft preparation, H.S.; writing—review and editing, H.S. All authors have read and agreed to the published version of the manuscript.

Funding

This research received no external funding.

Institutional Review Board Statement

Not applicable.

Informed Consent Statement

Not applicable.

Data Availability Statement

The study does not include publicly archived datasets.

Conflicts of Interest

The authors declare no conflict of interest.

References

  1. Hou, X.; Lampen-Kelley, P.; Xue, Y.; Liu, C.; Xu, H.; Han, N.; Ma, C.; Srikanth, H.; Phan, M.H. Formation mechanisms of NaZn13-type phase in giant magnetocaloric La-Fe-Si compounds during rapid solidification and annealing. J. Alloys Compd. 2015, 646, 503–511. [Google Scholar] [CrossRef] [Green Version]
  2. Xiao, S.; Chen, Y.; Guan, D.; Yang, T.; Tu, M. Thermodynamical evaluation on magnetocaloric effect of magnetic refrigerating materials near room temperature. J. Chin. Rare Earth Soc. 2003, 21, 648–653. [Google Scholar]
  3. Hou, X.L.; Xue, Y.; Liu, C.Y.; Xu, H.; Han, N.; Ma, C.W.; Phan, M.H. Nucleation mechanism of nano-sized NaZn13-type and α-(Fe,Si) Phase in La-Fe-Si alloys during rapid solidification. Nanoscale Res. Lett. 2015, 10, 143. [Google Scholar] [CrossRef] [PubMed] [Green Version]
  4. Chen, Z.; Pingkerton, F.E.; Herbst, J.F. High Curie temperature of Ce-Fe-Si compounds with ThMn12 structure. Scripta Mater. 2015, 95, 66. [Google Scholar]
  5. Xie, K.; Song, X.; Lü, W. Magnetic entropy change in LaFe11.5Si1.5 ribbons. Raremetal Mater. Eng. 2005, 34, 1910. [Google Scholar]
  6. Zhang, Z.; He, C.; Zhang, M.; Liu, J. Influence of extra La and annealing temperature on microstructure and magnetocaloric properties of La-Fe-Co-Si alloys. Phys. B Condens. Matter 2015, 476, 167–170. [Google Scholar] [CrossRef]
  7. Hu, F.X.; Qian, X.L.; Sun, J.R.; Wang, G.J.; Zhang, X.X.; Cheng, Z.H.; Shen, B.G. Magnetic entropy change and its temperature variation in compounds La(Fe1−xCox)11.2Si1.8. J. Appl. Phys. 2002, 92, 3620–3623. [Google Scholar] [CrossRef]
  8. Chen, X.; Chen, Y.; Tang, Y. The effect of different temperature annealing on phase relation of LaFe11.5Si1.5 and the magnetocaloric effects of La0.8Ce0.2Fe11.5−xCoxSi1.5 alloys. J. Magn. Magn. Mater. 2011, 323, 3177–3183. [Google Scholar] [CrossRef]
  9. Zhang, H.; Long, Y.; Cao, Q.; Mudryk, Y.; Zou, M.; Gschneidner, K.A., Jr.; Pecharsky, V.K. Microstructure and magnetocaloric effect in cast LaFe11.5Si1.5Bx (x = 0.5, 1.0). J. Magn. Magn. Mater. 2010, 322, 1710–1714. [Google Scholar] [CrossRef]
  10. Fujita, A.; Fujieda, S.; Hasegawa, Y.; Fukamichi, K. Itinerant-electron metamagnetic transition and large magnetocaloric effects in La(FexSi1−x)13 compounds and their hydrides. Phys. Rev. B 2003, 67, 104416. [Google Scholar] [CrossRef] [Green Version]
  11. Bao, B.; Long, Y.; Fu, B.; Wang, C.; Ye, R.; Chang, Y.; Zhao, J.; Shen, J. The study on the microstructure and the magnetocaloric effects in LaFe10.8Co0.7Si1.5C0.2 compound at different annealing times. J. Appl. Phys. 2010, 107, 9. [Google Scholar] [CrossRef]
  12. Chen, Y.F.; Wang, F.; Shen, B.G.; Sun, J.R.; Wang, G.J.; Hu, F.X.; Cheng, Z.H.; Zhu, T. Effects of carbon on magnetic properties and magnetic entropy change of the LaFe11.5Si1.5 compound. J. Appl. Phys. 2003, 93, 6981–6983. [Google Scholar] [CrossRef]
  13. Hu, F.X.; Chen, L.; Wang, J.; Bao, L.F.; Sun, J.R.; Shen, B.G. Particle size dependent hysteresis loss in La0.7Ce0.3Fe11.6Si1.4C0.2 first-order systems. Appl. Phys. Lett. 2012, 100, 072403. [Google Scholar] [CrossRef] [Green Version]
  14. Hu, F.X.; Gao, J.; Qian, X.L.; Ilyn, M.; Tishin, A.M.; Sun, J.R.; Shen, B.G. Magnetocaloric effect in itinerant electron metamagnetic systems. J. Appl. Phys. 2005, 97, 10M303. [Google Scholar] [CrossRef] [Green Version]
  15. Zheng, H.; Tang, Y.; Chen, Y.; Wu, J.; Wang, H.; Xue, X.; Wang, J.; Pang, W. The high-temperature hydrogenation behavior of LaFe11.6Si1.4 and splitting of LaFe11.6Si1.4Hy magnetocaloric transition. J. Alloys Compd. 2015, 646, 124–128. [Google Scholar] [CrossRef]
  16. Phejar, M.; Paul-Boncour, V.; Bessais, L. Investigation on structural and magnetocaloric properties of LaFe13−x Six (H, C)y compounds. Solid State Chem. 2016, 233, 95–102. [Google Scholar] [CrossRef]
  17. Balli, M.; Fruchart, D.; Gignoux, D. The LaFe11.2Co0.7Si1.1Cx carbides for magnetic refrigeration close to room temperature. Appl. Phys. Lett. 2008, 93, 232505. [Google Scholar] [CrossRef]
  18. Christian, J.W. The Theory of Transformations in Metals and Alloys; Pergamon Press: Oxford, UK, 1981; p. 12. [Google Scholar]
  19. Spaepen, F. The Temperature Dependence of the Crystal-melt Iinterfacial Tension: A Simple Model. Mater. Sci. Eng. 1994, 178, 15–18. [Google Scholar] [CrossRef]
  20. Hou, X.; Liu, C.; Xue, Y.; Han, N.; Xu, H.; Ma, C.; Phan, M.H. Formation of NaZn13-type phase in LaFe11.5Si1.5 alloy during solidification process. Mater. Res. Soc. Symp. Proc. 2014, 1708, 696. [Google Scholar] [CrossRef]
  21. Xiang, J. Study on Magnetothermal Performance and Phase Transformation of LaFe11.5Si1.5 by Fast Quenching. Master’s Thesis, Shanghai University, Shanghai, China, 2013. [Google Scholar]
  22. Fu, S.; Long, Y.; Sun, Y.; Hu, J. Microstructural evolution and phase transition dependent on annealing temperature and carbon content for LaFe11.5Si1.5Cx compounds prepared by arc-melting. Intermetallics 2013, 39, 79–83. [Google Scholar] [CrossRef]
  23. Gong, M. Met-Nuclear Dynamics of the Crystal Phase in Lanthanide Ferrosilicon Alloy Deep Super-Cooled Melt. Master’s Thesis, Northeastern University, Boston, MA, USA, 2008. [Google Scholar]
Figure 1. X-ray diffraction patterns of unannealed LaFe11.5Si1.5Cx (x = 0, 0.1, 0.2, 0.3) ribbons at a surface speed of 35 m/s (a); calculated nucleation rates of the α-(Fe, Si) and La (Fe, Si)13 phases versus under-cooling degrees at different C contents; (b) x = 0; (c) x = 0.2.
Materials 15 00343 g001
Figure 2. SEM images of a melt-spun La-Fe-Si ribbon (a,b) cross-sectional images of a melt-spun LaFe11.5Si1.5Cx (x = 0, 0.2) ribbons; (c) Magnification of region Ⅱ; (d) Magnification of the transition region.
Materials 15 00343 g002
Figure 3. X-ray diffraction patterns of LaFe11.5Si1.5C0.2 ribbons at a wheel speed of 35 m/s annealed at 1273 K for different times.
Materials 15 00343 g003
Figure 4. SEM images of LaFe11.5Si1.5C0.2 ribbons annealed at 1273 K for different times: (a) 0 min; (b) 3 min; (c) 2 h.
Materials 15 00343 g004
Figure 5. Selected area electron diffraction of LaFe11.5Si1.5C0.2 ribbons after heat treatment for 3 min. (a) Display of selected area in TEM; (b) Fourier transform at the SAED of (a); (c) Fourier transform at the SAED of (d) white strips; (d) display of selected area in TEM; (e) Fourier transform at the SAED of (ae).
Materials 15 00343 g005
Figure 6. (a,b) Microstructure morphology (c,f) HRTEM micro-graph; (d) Fourier transform; (e) display of selected area in TEM of 35 m/s LaFe11.5Si1.5C0.2 ribbons near the free surface annealed at 1273 K for 2 h.
Materials 15 00343 g006aMaterials 15 00343 g006b
Figure 7. Thermomagnetic curves of 35 m/s LaFe11.5Si1.5C0.2 ribbons annealed at 1273 K for different times.
Materials 15 00343 g007
Figure 8. (a) ΔS−T curves and (b) histogram of the maximum isothermal magnetic entropy of LaFe11.5Si1.5C0.2 ribbons at a wheel speed of 35 m/s annealed at 1273 K for different times.
Materials 15 00343 g008
Figure 9. 3D curve of the temperature, magnetic field, and maximum isothermal magnetic entropy variation of the LaFe11.5Si1.5C0.2 fast quenched band at 35 m/s (after 1273 K × 2 h heat treatment).
Materials 15 00343 g009
Table 1. Lattice parameters of unannealed LaFe11.5Si1.5Cx (x = 0, 0.1, 0.2, 0.3) ribbons.
C ContentLattice Parameters (Å)
x = 011.4883
x = 0.111.4931
x = 0.211.4985
x = 0.311.5024
Table 2. The EDS analysis of the micro-structure of LaFe11.5Si1.5Cx (x = 0, 0.2) alloys.
Chemical CompositionLa (at %)Fe (at %)Si (at %)Phase
x = 0white point14.2870.5815.14La (Fe, Si)13
dark gray094.485.52α-(Fe, Si)
gray white34.2632.6533.09LaFeSi
x = 0.2white point13.8771.1414.99La (Fe, Si)13
dark gray094.455.55α-(Fe, Si)
gray white33.6432.9733.39LaFeSi
Table 3. Lattice parameters of annealed LaFe11.5Si1.5C0.2 ribbons at 1273 K for different times.
Annealing TimeLattice Parameters (Å)
as spun11.4985
3 min11.5036
2 h11.5107
Table 4. Inside grains and white grains the EDS analysis of LaFe11.5Si1.5C0.2 ribbons at a wheel speed of 35 m/s annealed at 1273 K for different times.
Heat Treatment TimeAreaLa (at%)Fe (at%)Si (at%)O (at%)C (at%)Phase
0 minI (white particles)9.1174.827.434.973.66La2O3
II (intracrystalline)11.8472.5610.940.084.58La (Fe, Si)13
3 minI (white particles)15.2849.746.3621.636.99La2O3
II (intracrystalline)11.7371.6211.011.334.31La (Fe, Si)13
2 hI (white particles)18.9725.934.9636.8813.26La2O3
II (intracrystalline)11.3369.1011.144.374.06La (Fe, Si)13
Publisher’s Note: MDPI stays neutral with regard to jurisdictional claims in published maps and institutional affiliations.

