
Correlation of Statistical Distributions of the Dimension of Yeast Cells Attached to the Substrate and Its Surface Electrical Potential

 ,
,
Abstract
:1. Introduction
- q—electric charge of the dipole point charges,
2. Materials and Methods
2.1. Materials
2.2. Electrical Charge Provision to the Substrates
2.3. Cells and Their Immobilization
3. Results and Discussion
4. Conclusions
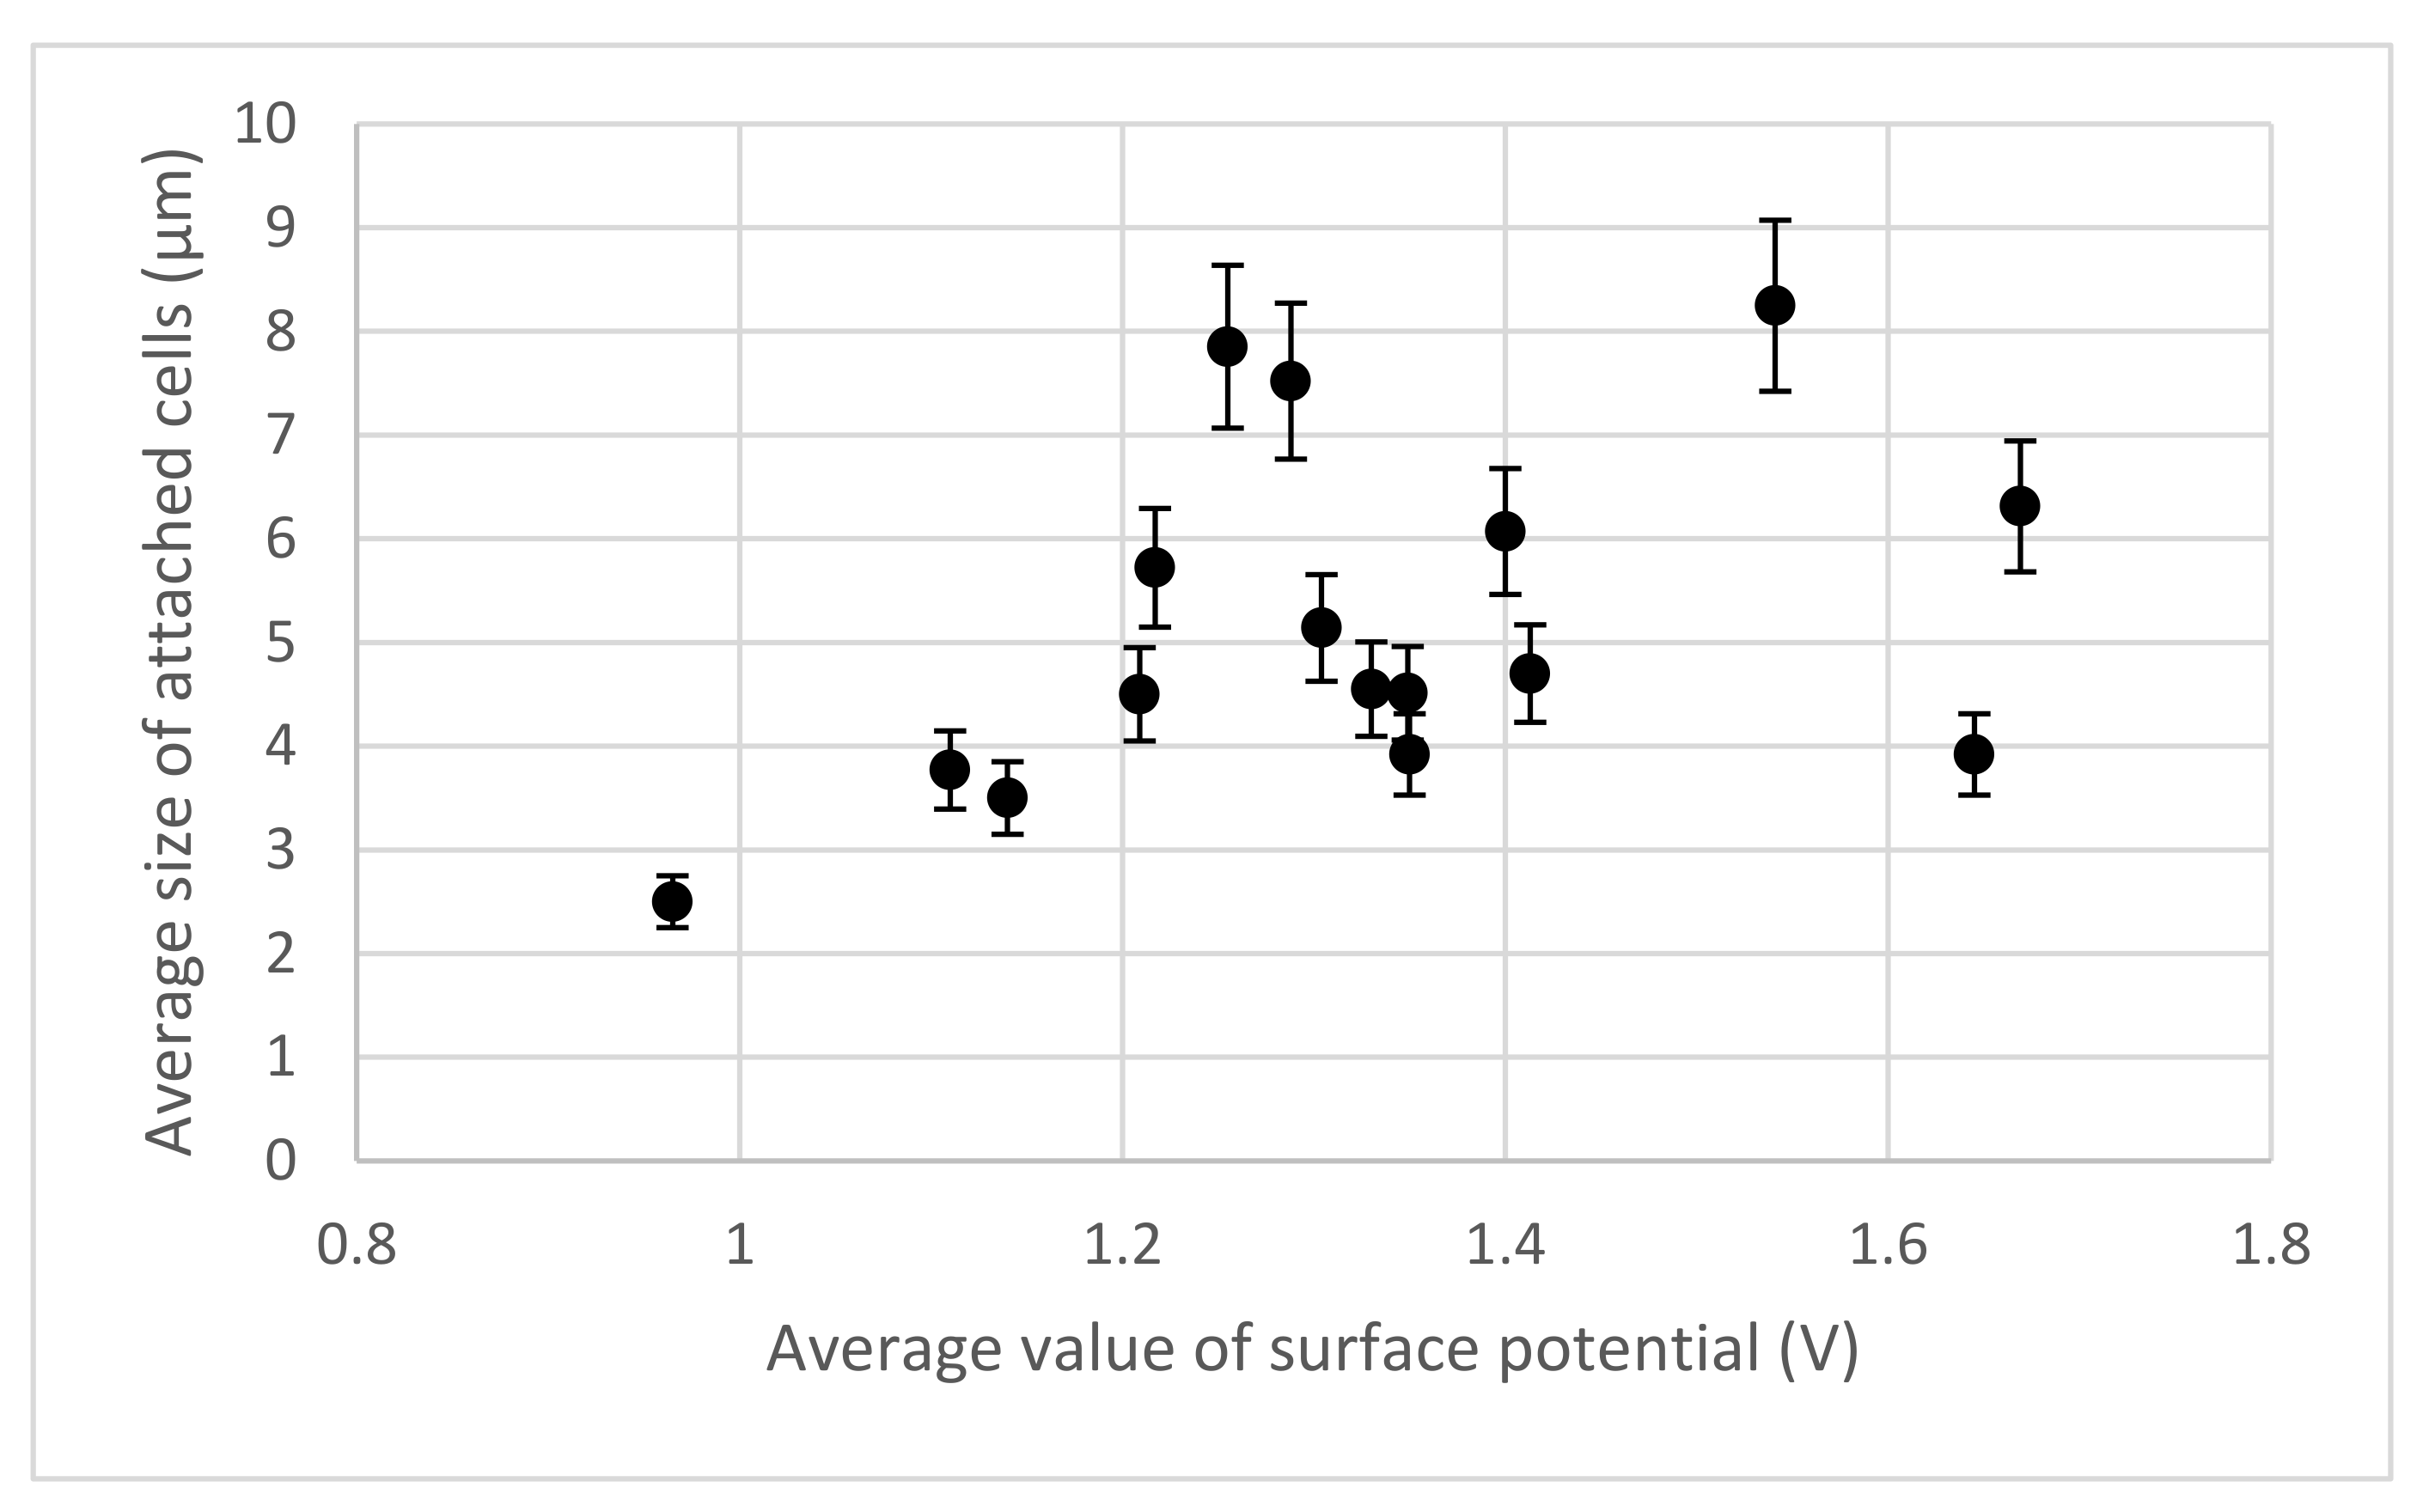
- The average size of yeast cells (S. cerevisiae) attached to the substrate surface increases with its electrical potential average value.
- The statistical distribution of the sizes of the yeast cells (S. cerevisiae) attached to the substrate surface is in accordance with its surface electrical potential statistical distribution.
- The results may be used to:
- Sort cells by cell size;
- Process the surface of biosubstrates to achieve the high distribution of differently sized immobilized cells.
Author Contributions
Funding
Institutional Review Board Statement
Informed Consent Statement
Data Availability Statement
Acknowledgments
Conflicts of Interest
References
- Mattanovich, D.; Sauer, M.; Gasser, B. Yeast biotechnology: Teaching the old dog new tricks. Microb. Cell Factories 2014, 13, 34. [Google Scholar] [CrossRef] [PubMed]
- Parapouli, M.; Vasileiadi, A.; Afendra, A.-S.; Hatziloukas, E. Saccharomyces cerevisiae and its industrial applications. AIMS Microbiol. 2020, 6, 1–32. [Google Scholar] [CrossRef]
- Borovikova, D.; Scherbaka, R.; Patmalnieks, A.; Rapoport, A. Effects of yeast immobilization on Bioethanol Production. Biotechnol. Appl. Biochem. 2014, 61, 33–39. [Google Scholar] [CrossRef] [PubMed]
- Bangrak, P.; Limtong, S.; Phisalaphong, M. Continuous ethanol production using immobilized yeast cells entrapped in loofa-reinforced alginate carriers. Braz. J. Microbiol. 2011, 42, 676–684. [Google Scholar] [CrossRef] [PubMed]
- Ramaswamy, Y.; Roohani, I.; No, Y.J.; Madafiglio, G.; Chang, F.; Zhao, F.; Lu, Z.; Zreiqat, H. Nature-inspired topographies on hydroxyapatite surfaces regulate stem cells behaviour. Bioact. Mater. 2021, 6, 1107–1117. [Google Scholar] [CrossRef]
- Rana, D.; Ramasamy, K.; Leena, M.; Pasricha, R.; Manivasagam, G.; Ramalingam, M. Surface functionalization of Biomaterials. In Biology and Engineering of Stem Cell Niches; Vishwakarma, A., Karp, J.M., Eds.; Academic Press: Cambridge, MA, USA, 2017; pp. 331–343. [Google Scholar] [CrossRef]
- Robert, P.; Biarnes-Pelicot, M.; Garcia-Seyda, N.; Hatoum, P.; Touchard, D.; Brustlein, S.; Nicolas, P.; Malissen, B.; Valignat, M.-P.; Theodoly, O. Functional mapping of adhesiveness on live cells reveals how guidance phenotypes can emerge from complex spatiotemporal integrin regulation. Front. Bioeng. Biotechnol. 2021, 9, 226. [Google Scholar] [CrossRef]
- Portan, D.V.; Deligianni, D.D.; Papanicolaou, G.C.; Kostopoulos, V.; Psarras, G.C.; Tyllianakis, M. Combined optimized effect of a highly self-organized nanosubstrate and an electric field on osteoblast bone cells activity. BioMed Res. Int. 2019, 2019, 7574635. [Google Scholar] [CrossRef]
- Dekhtyar, Y.; Polyaka, N.; Sammons, R. Electrically charged hydroxyapatite enhances immobilization and proliferation of osteoblasts. IFMBE Proc. 2008, 20, 23–25. [Google Scholar] [CrossRef]
- Kobayashi, T.; Nakamura, S.; Yamashita, K. Enhanced osteobonding by negative surface charges of electrically polarized hydroxyapatite. J. Biomed. Mater. Res. 2001, 59, 595. [Google Scholar] [CrossRef]
- Bystrov, V.; Bystrova, A.; Dekhtyar, Y. HAP nanoparticle and substrate surface electrical potential towards bone cells adhesion: Recent results review. Adv. Colloid Interface Sci. 2017, 249, 213–219. [Google Scholar] [CrossRef]
- Derjaguin, B.; Landau, L. Theory of the stability of strongly charged lyophobic sols and of the adhesion of strongly charged particles in solutions of electrolytes. Prog. Surf. Sci. 1993, 43, 30–59. [Google Scholar] [CrossRef]
- Eckhardt, C.J. Organic Molecular Crystals: Interaction, Localization and Transport Phenomena by Edgar A. Silinsh, and Vladislav Capek; American Institute of Physics: New York, NY, USA, 1994. [Google Scholar]
- Crowley, J.M. Fundamentals of Applied Electrostatics; Robert E. Krieger Publishing Company: Malabar, FL, USA, 1991. [Google Scholar]
- Panklang, N.; Techaumnat, B.; Wisitsoraat, A. Analysis of the equivalent dipole moment of red blood cell by using the boundary element method. Eng. Anal. Bound. Elem. 2020, 112, 68–76. [Google Scholar] [CrossRef]
- Suzuki, M.; Asada, Y.; Watanabe, D.; Ohya, Y. Cell shape and growth of budding yeast cells in restrictive microenvironments. Yeast 2004, 21, 983–989. [Google Scholar] [CrossRef] [Green Version]
- Saito, T.L. SCMD: Saccharomyces cerevisiae morphological database. Nucleic Acids Res. 2004, 32, 90001. [Google Scholar] [CrossRef] [Green Version]
- Product Specification for Thermo Scientific Microscope Slides. Available online: https://tslabor.hu/depo/Shandon/Menzel_MicroscopeSlides_UK.pdf (accessed on 2 December 2021).
- Petrov, M.I.; Lepen’kin, Y.A.; Lipovskii, A.A. Polarization of glass containing fast and slow ions. J. Appl. Phys. 2012, 112, 043101. [Google Scholar] [CrossRef]
- Griscom, D.L. Trapped-electron centers in pure and doped glassy silica: A review and synthesis. J. Non-Cryst. Solids 2011, 357, 1945–1962. [Google Scholar] [CrossRef]
- Moura, A.L.; de Araujo, M.T.; Gouveia, E.A.; Vermelho, M.V.; Aitchison, J.S. Deep and shallow trap contributions to the ionic current in the thermal-electric field poling in soda-lime glasses. Opt. Express 2007, 15, 143. [Google Scholar] [CrossRef]
- Skuja, L.; Hirano, M.; Hosono, H.; Kajihara, K. Defects in oxide glasses. Phys. Status Solidi (C) 2005, 2, 15–24. [Google Scholar] [CrossRef]
- Massey, F.J. The Kolmogorov-Smirnov test for goodness of fit. J. Am. Stat. Assoc. 1951, 46, 68–78. [Google Scholar] [CrossRef]
- Feldmann, H. Yeast Cell Architecture and Functions. In Yeast: Molecular and Cell Biology; Wiley: Weinheim, Germany, 2013; Chapte 2. [Google Scholar]
- Dekhtyar, Y.; Lancere, L. UV radiation influence on prosthetic PMMA surface charge. IFMBE Proc. 2013, 39, 2302–2304. [Google Scholar] [CrossRef]
- Faliya, K.; Kliem, H.; Dias, C.J. Space charge measurements with Kelvin Probe Force Microscopy. IEEE Trans. Dielectr. Electr. Insul. 2017, 24, 1913–1922. [Google Scholar] [CrossRef]
- Baltacis, K.; Bystrov, V.; Bystrova, A.; Dekhtyar, Y.; Freivalds, T.; Raines, J.; Rozenberga, K.; Sorokins, H.; Zeidaks, M. Physical fundamentals of biomaterials surface electrical functionalization. Materials 2020, 13, 4575. [Google Scholar] [CrossRef]
- Schneider, C.A.; Rasband, W.S.; Eliceiri, K.W. NIH image to imagej: 25 years of image analysis. Nat. Methods 2012, 9, 671–675. [Google Scholar] [CrossRef]
- Eppendorf. OD600 Measurements Using Different Photometers. September 2015. Available online: www.eppendorf.com (accessed on 5 December 2021).


| Angle α | P, V | Dp, V | P/Dp |
|---|---|---|---|
| 30 | 1.39 ± 0.05 | 0.063 ± 0.005 | 22.06 ± 0.1 |
| 45 | 1.72 ± 0.08 | 0.135 ± 0.017 | 12.74 ± 0.47 |
| 60 | 1.65 ± 0.07 | 0.084 ± 0.009 | 19.64 ± 0.77 |
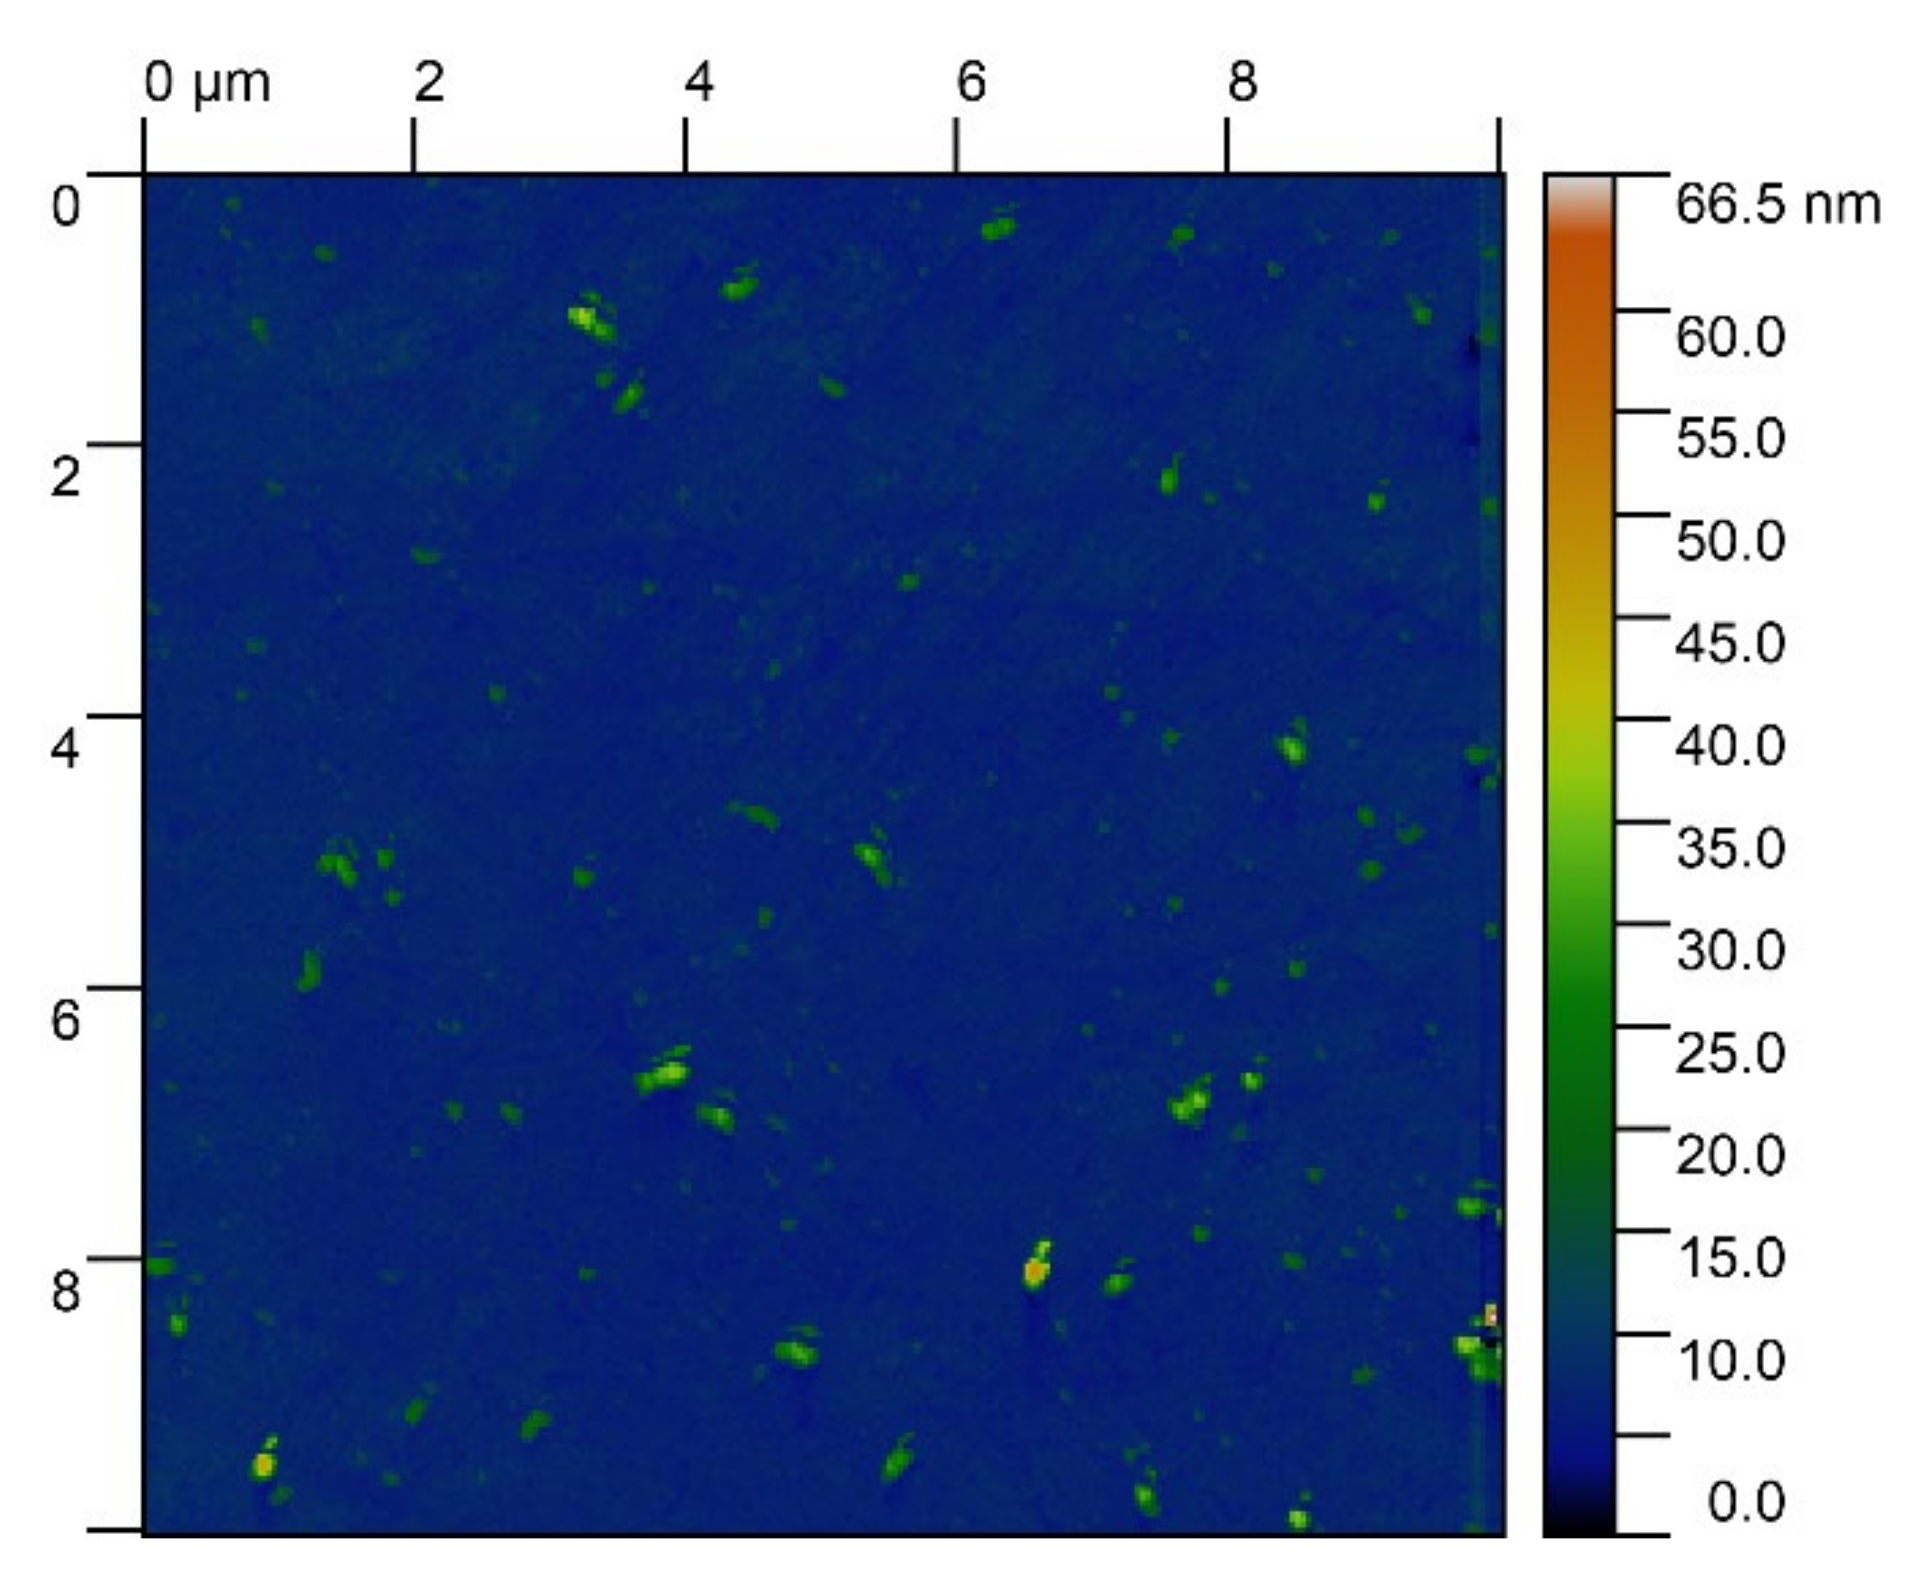
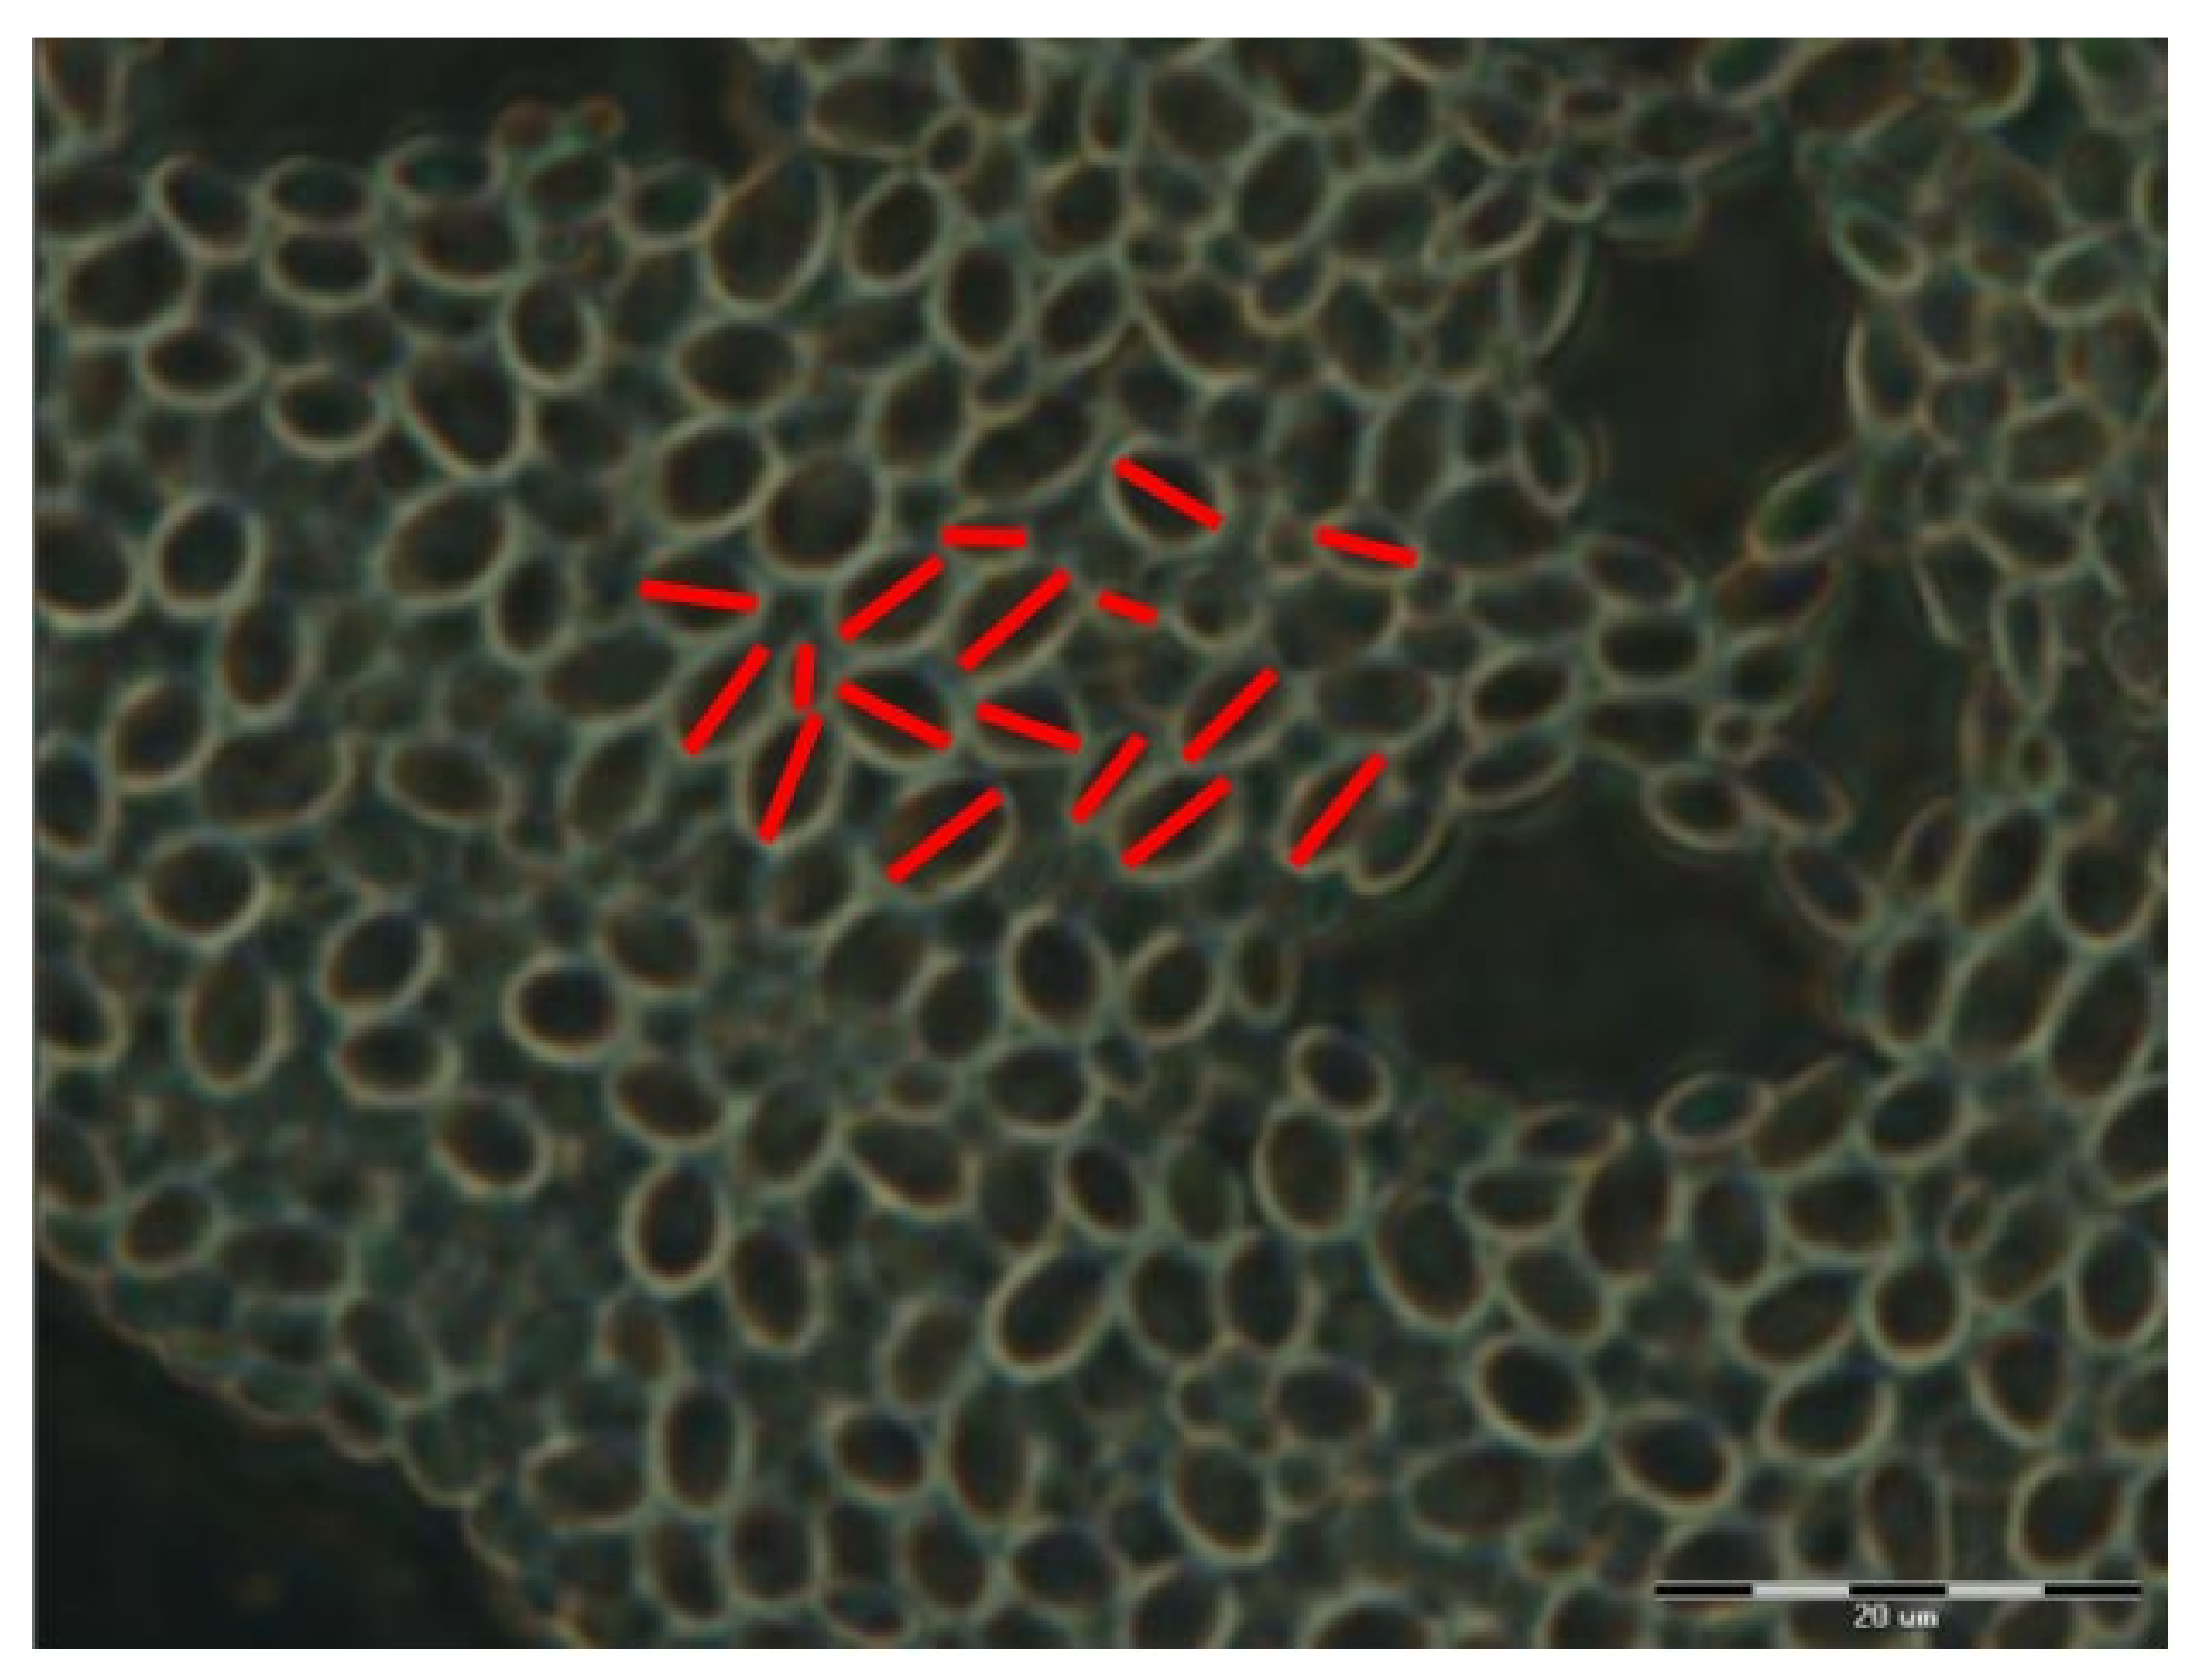
| Substrate Type | Distribution of Electrical Potentials, V | Distribution of Attached Cell Sizes, μm | |
|---|---|---|---|
| Native substrate | 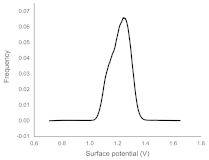 | 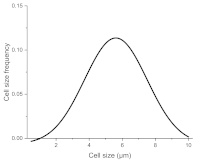 | |
| Irradiated substrate | α = 30° |  |  |
| α = 45° | 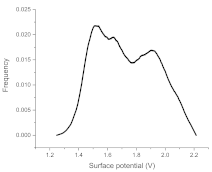 |  | |
| α = 60° |  |  | |
Publisher’s Note: MDPI stays neutral with regard to jurisdictional claims in published maps and institutional affiliations. |
© 2021 by the authors. Licensee MDPI, Basel, Switzerland. This article is an open access article distributed under the terms and conditions of the Creative Commons Attribution (CC BY) license (https://creativecommons.org/licenses/by/4.0/).
Share and Cite
Bondareva, E.; Dekhtyar, Y.; Gorosko, V.; Sorokins, H.; Rapoport, A. Correlation of Statistical Distributions of the Dimension of Yeast Cells Attached to the Substrate and Its Surface Electrical Potential. Materials 2022, 15, 6. https://doi.org/10.3390/ma15010006
Bondareva E, Dekhtyar Y, Gorosko V, Sorokins H, Rapoport A. Correlation of Statistical Distributions of the Dimension of Yeast Cells Attached to the Substrate and Its Surface Electrical Potential. Materials. 2022; 15(1):6. https://doi.org/10.3390/ma15010006
Chicago/Turabian StyleBondareva, Elina, Yuri Dekhtyar, Vladislavs Gorosko, Hermanis Sorokins, and Alexander Rapoport. 2022. "Correlation of Statistical Distributions of the Dimension of Yeast Cells Attached to the Substrate and Its Surface Electrical Potential" Materials 15, no. 1: 6. https://doi.org/10.3390/ma15010006