In the first part, we present results regarding the deformation of bond lengths and bond angles upon uniaxial strain applied along the armchair or along the zigzag directions and in the second part we discuss the optical phonon frequencies at the Γ point, i.e., at the center of the Brillouin zone.
3.1. Bond Lengths and Bond Angles of Uniaxially Strained Graphene
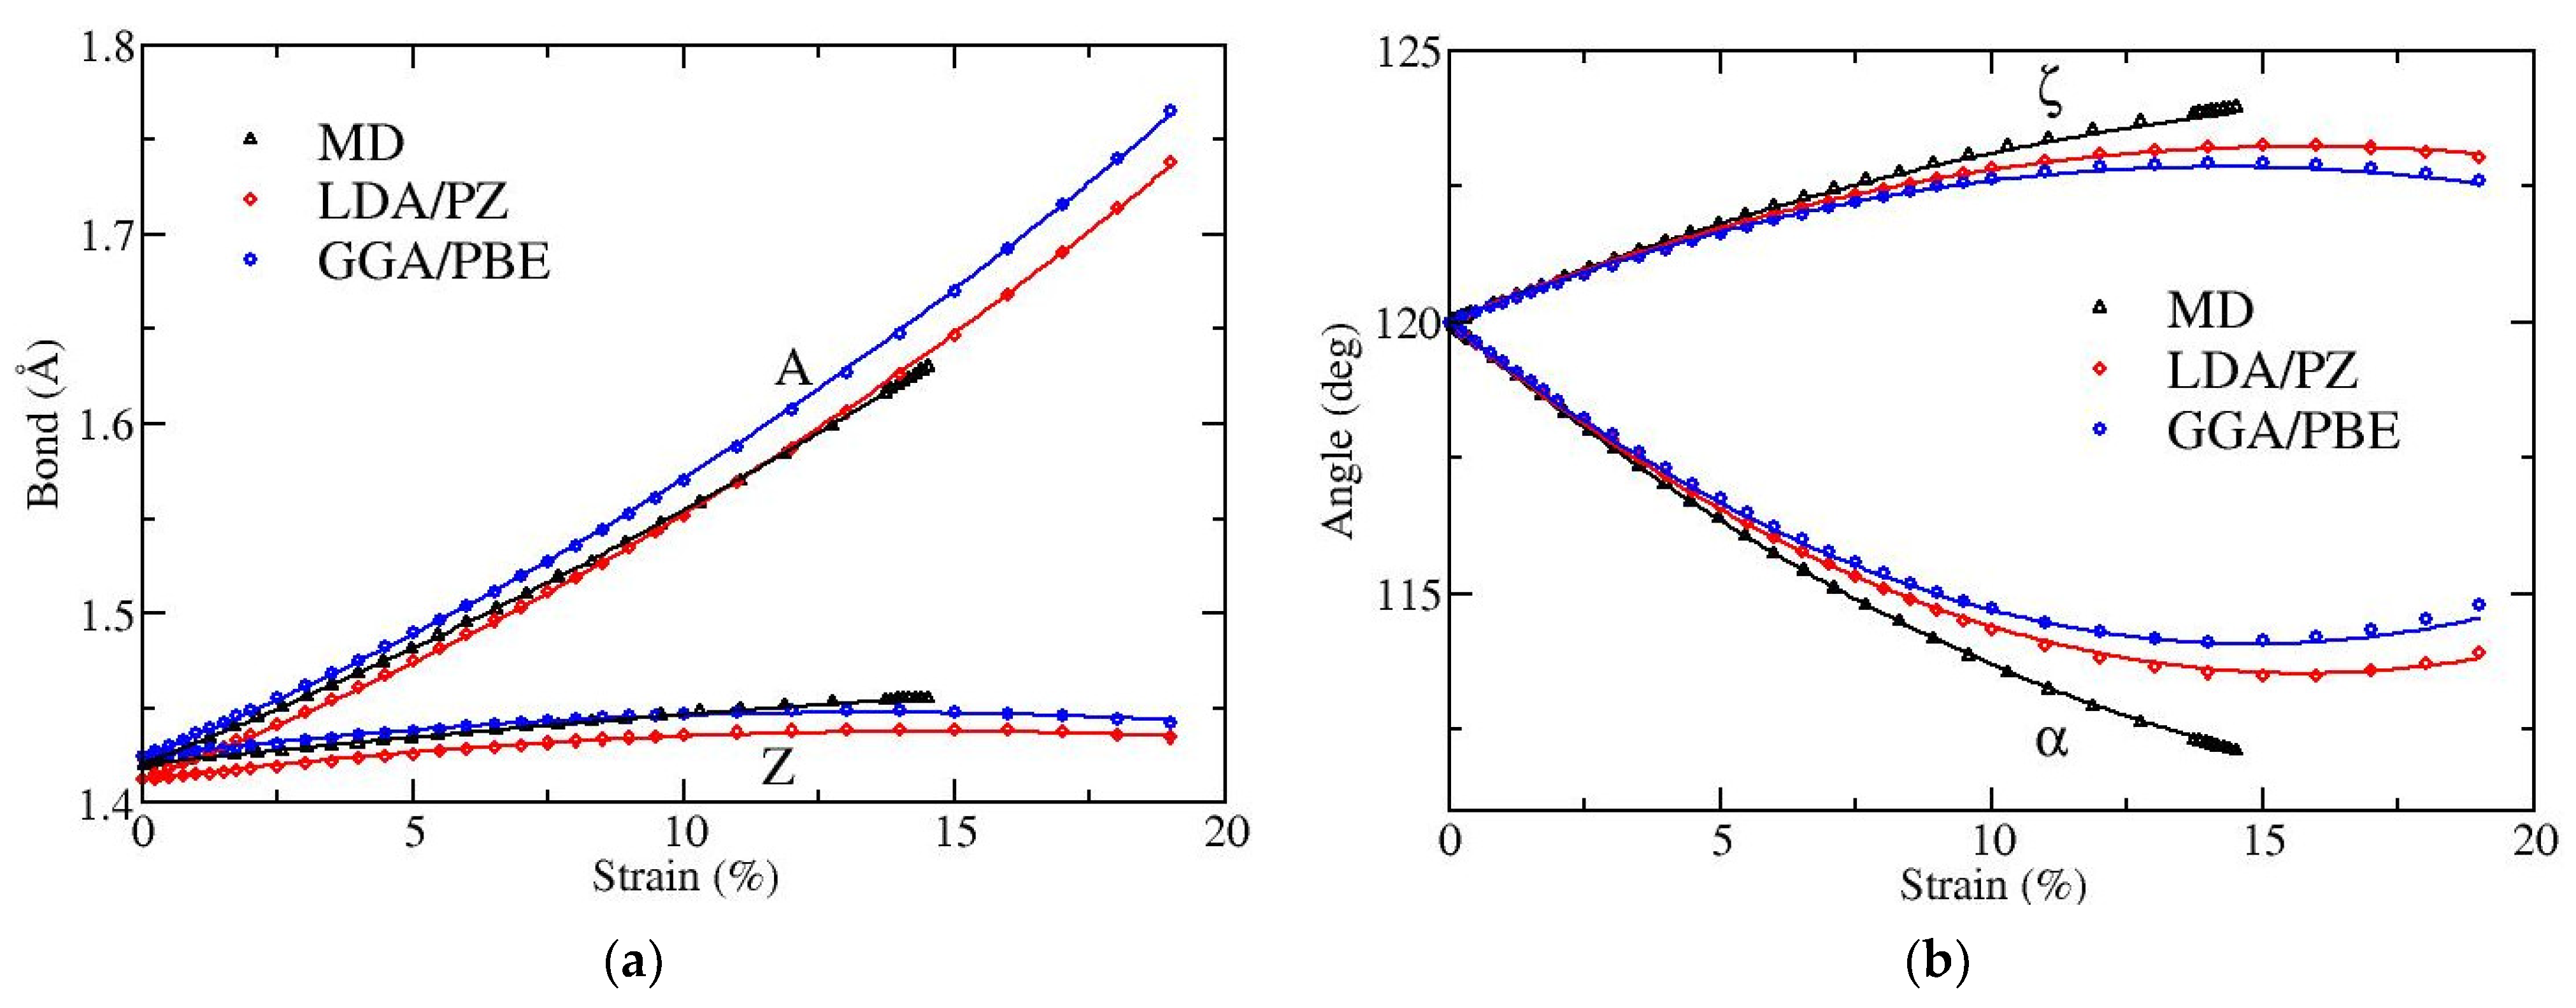
Figure 2 and
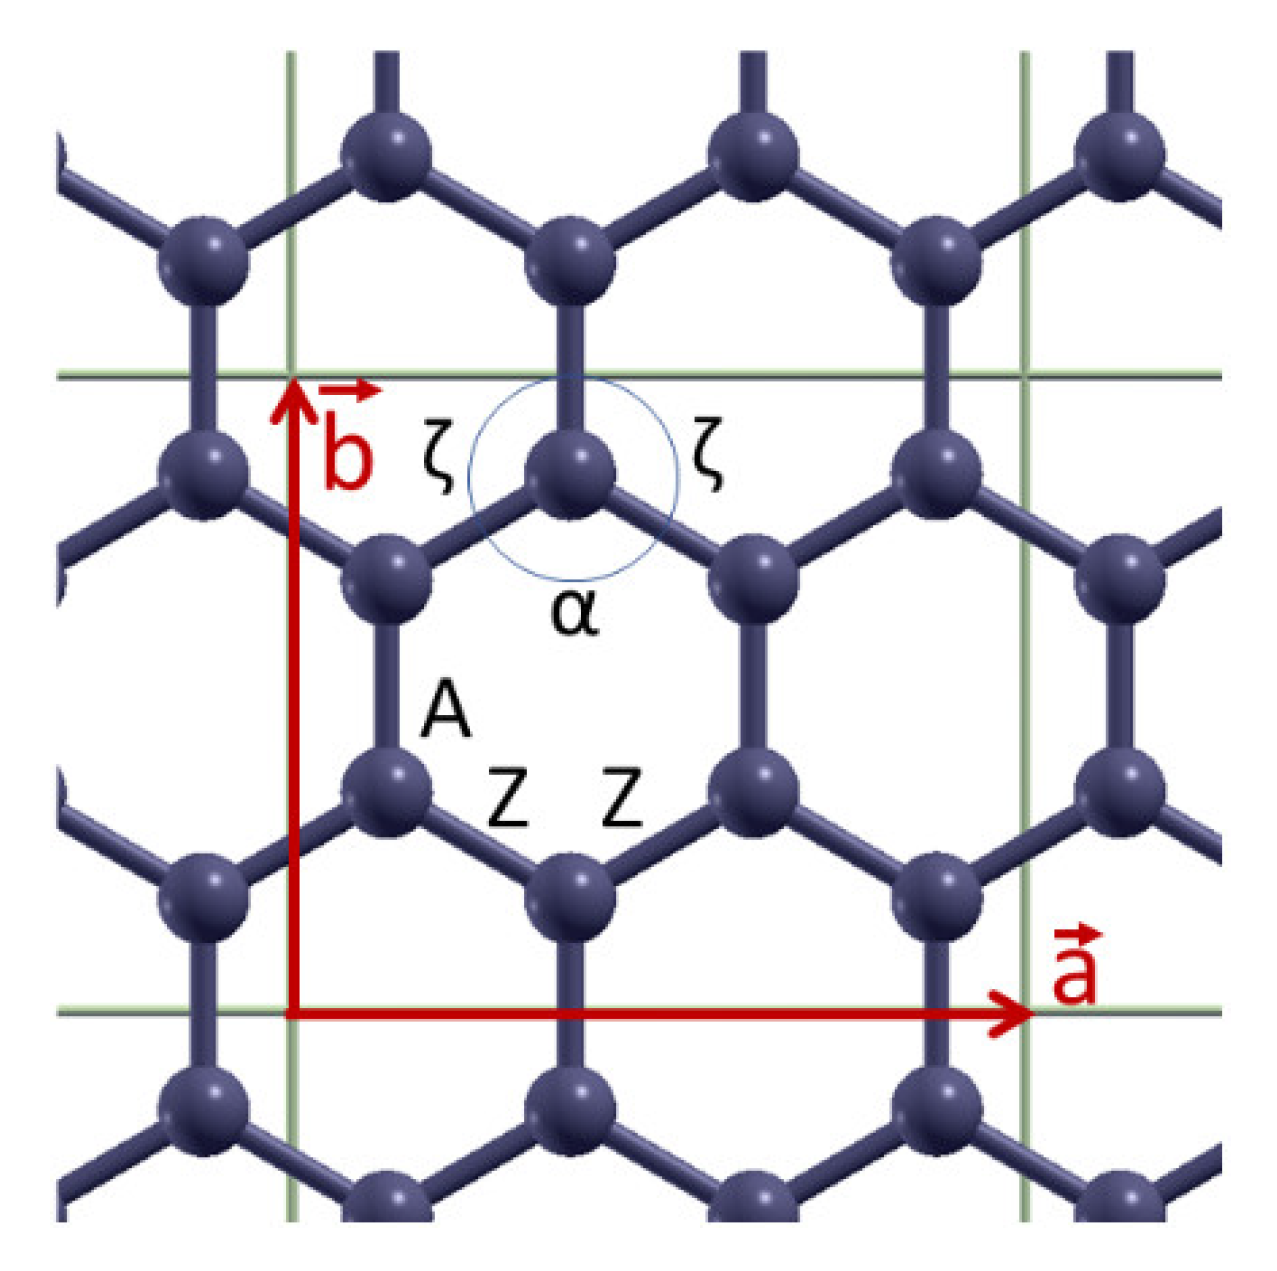
Figure 3 depict the variation with strain of bond lengths [panels (a)] and bond angles [panels (b)] when the applied strain is along the armchair and along the zigzag directions, respectively. There are two distinct kinds of bonds (A and Z) as well as of angles (α and ζ), as illustrated in
Figure 1. The angles α and ζ are not varied independently since they satisfy the condition α + 2ζ = 120°.
As expected, when the strain is along the armchair direction the lengths of both bonds A and Z increase, the angle α decreases while the angle ζ increases, as the strain is increased (see
Figure 2). The results obtained by MD and DFT show similar behavior. The angle variation is larger in the MD atomistic simulations. Note that the fracture strain is slightly below 15% in MD, while it is around 19% in DFT [
20].
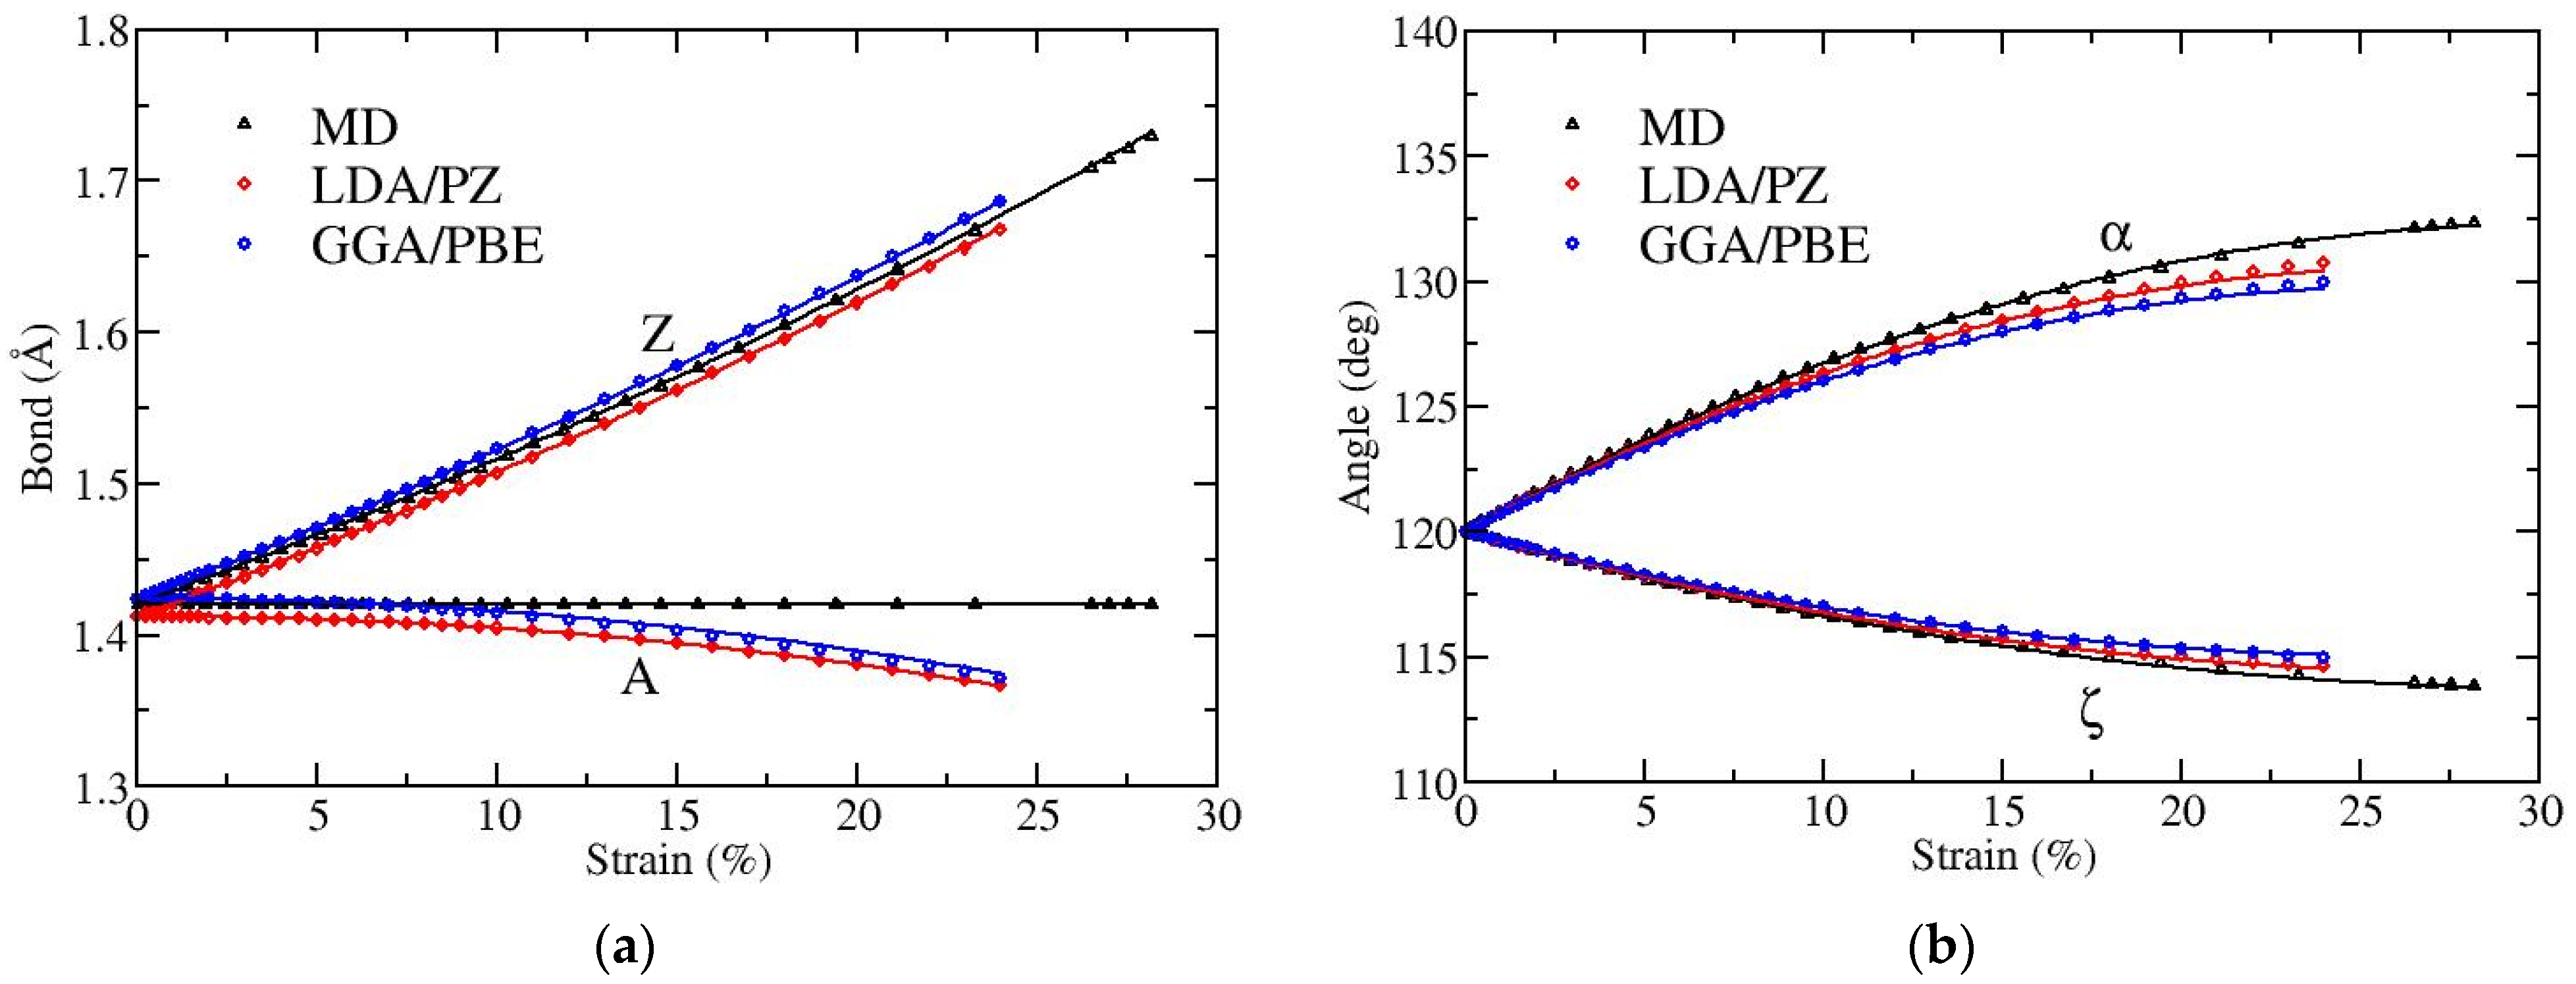
For strains along the zigzag direction (
Figure 3), the bond Z is elongated while the bond A is not. In MD the bond A is independent of strain, due to the fact that the force field contains solely first neighboring stretching terms [
22], while in DFT the bond A shrinks. Regarding the strain variation of bond angles, angle α increases and ζ decreases, as expected. In the MD case, the decrease of graphene’s size in the lateral direction is exclusively due to the increase of angle α. The fracture strain in this direction of tension is around 28% in MD and around 24% in DFT [
20].
Comparing our results with the MD data presented in reference [
17] we observe similar trends, except for the case of A bonds in strains along the zigzag direction, where these bonds are found to increase with strain in that work. This behavior is different from what we obtain here, as our MD simulations show no variation of this bond length, while the DFT computations result in decreasing lengths of these bonds with strain. The bond length and bond angle deformations presented in Figure 5 of reference [
22], using DFT calculations, are in good agreement with the results of this work, even at a quantitative level.
In order to facilitate efficient use of the bond length and bond angle deformations with the applied strain in potential strain engineering devices or other applications, we provide analytical relations describing these dependencies, which are obtained through appropriate fittings of the numerical results presented in
Figure 2 and
Figure 3. In particular, we observed that quadratic functions are able to accurately fit the numerical data shown above.
Thus, the lengths of both types of bonds (A and Z) are changing with the strain according to the relation
where
is the bond length in Å at strain
,
is the bond length in the absence of strain (which is equal to 1.42 Å in MD, 1.424 Å in DFT with GGA/PBE functionals, and 1.412 Å in DFT with LDA/PZ functionals),
and
are coefficients (shown in
Table 1 and
Table 2 for strains applied along the armchair and the zigzag directions, respectively), and
is the percentage strain.
Similarly, the strain dependence of both types of bond angles, α and ζ, is described by the formula
where
is the bond angle in degrees at strain
,
and
are coefficients (shown in
Table 3 and
Table 4 for strains applied along the armchair and the zigzag directions, respectively), and
is the percentage strain.
A very crude approximation of the A bond length variation with the strain along the armchair direction can be obtained through the analytical derivation of the extension of a single bond, described by the stretching potential used in our MD calculations, under an applied force. In particular, the Morse potential used for the carbon-carbon bond stretching in graphene is
, where
5.7 eV,
1.96 Å
−1, and
1.42 Å is the equilibrium distance [
20]. Applying a constant tensile force
at the ends of such a bond, one can easily obtain the force extension relationship. Then taking into account that
, where
is the corresponding stress and
is the distance at which tensile forces are applied on the atoms of a zigzag edge in graphene, and by substituting the stress–strain relation
with
320 N/m [
20], one finally obtains that the extension of an A bond is
This analytical formula deviates by a factor of 2 from the numerical results of the strain dependence of the A bond length shown in
Figure 2a. In the linear regime, for relatively small strains, the last formula gives
, where by substituting the values of the parameters mentioned above, we obtain the coefficient multiplying the strain as exactly half of the value of
, which is given in
Table 1 for the A bond.
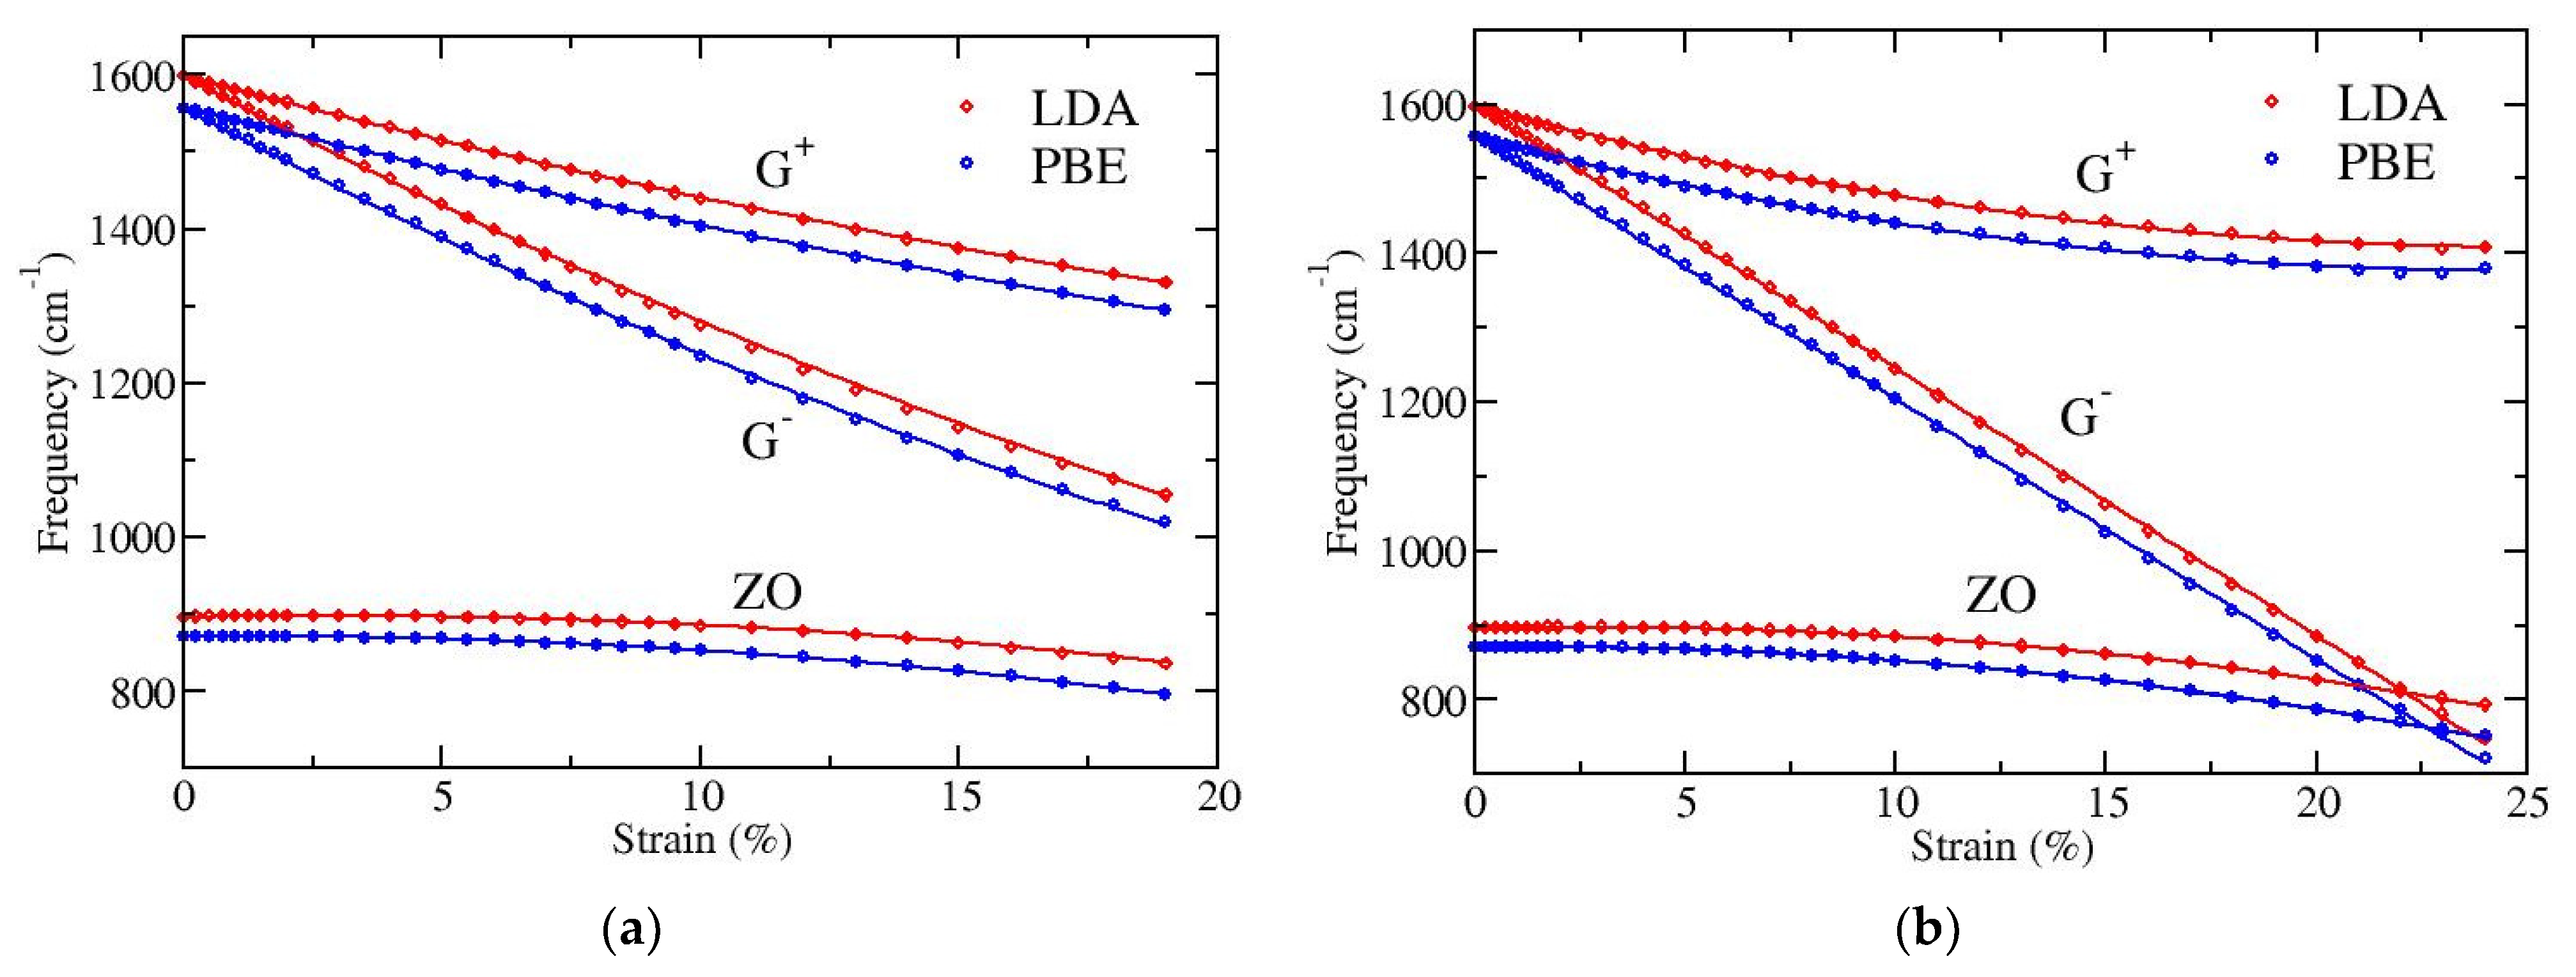
3.2. Optical Phonons of Uniaxially Strained Graphene at the Center of the Brillouin Zone
We have performed DFT calculations in order to investigate the dependence on strain of the long wavelength optical phonons at the Γ point and to quantify the splitting of the doubly degenerate E
2g mode (G band). LDA and PBE functionals have again been used, as previously. The results are presented in
Figure 4. Both functionals show the same behavior, apart from a small (almost constant) shift of the optical frequencies; the PBE functional gives a few percent (2–3%) lower frequencies than LDA. In particular, for zero strain the doubly degenerate LO/TO optical frequency at Γ point is found 1598 cm
−1 with LDA and 1557 cm
−1 with PBE, while the out-of-plane ZO optical mode is at 896 cm
−1 and 871 cm
−1, respectively.
Figure 4a depicts results for strain applied along the armchair direction of graphene and
Figure 4b for strain along the zigzag direction. All displayed phonons show softening, i.e., their frequencies decrease with increasing strain. The G
− band exhibits the larger softening and the ZO mode the smaller one. The softening of the G
+ and G
− bands has been experimentally observed [
44,
45] because these modes are Raman active. G
− corresponds to an eigenmode parallel to the direction of strain, thus bearing higher extension and showing larger softening, while G
+ corresponds to a perpendicular to strain eigenmode. Note that the strong softening of the G
− mode leads to a crossing with the lower frequency out-of-plane ZO mode when the tension is along the zigzag direction of graphene, where larger strains (more than 20%) can be applied (see
Figure 4b).
To quantify the strain dependence of the optical modes at the center of the Brillouin zone, we have fitted the DFT obtained numerical data with the quadratic formula
where
is the frequency of the corresponding mode in cm
−1,
is the frequency at zero strain, and
and
are linear and second order coefficients, respectively, on the percentage strain
. The results of these fittings are presented in
Table 5 and
Table 6 for the cases where the strain is along the armchair (
Figure 4a) and the zigzag (
Figure 4b) directions, respectively.
As already noted, the G
+ and G
− bands are Raman active and their softening rates have been experimentally determined. A detailed discussion in reference [
45] was able to isolate the effect of the substrate on the measured G
+ and G
– softening, leading to corresponding redshift rate estimates for free standing graphene which are around −18 and −36 cm
−1/(%strain) for G
+ and G
−, respectively, for strains up to around 1%. For such a small strain the softening rates are provided directly by the coefficient
of Equation (3). The values of
presented in
Table 5 and
Table 6 for the G
+ and G
− bands are in agreement with these experimental observations.
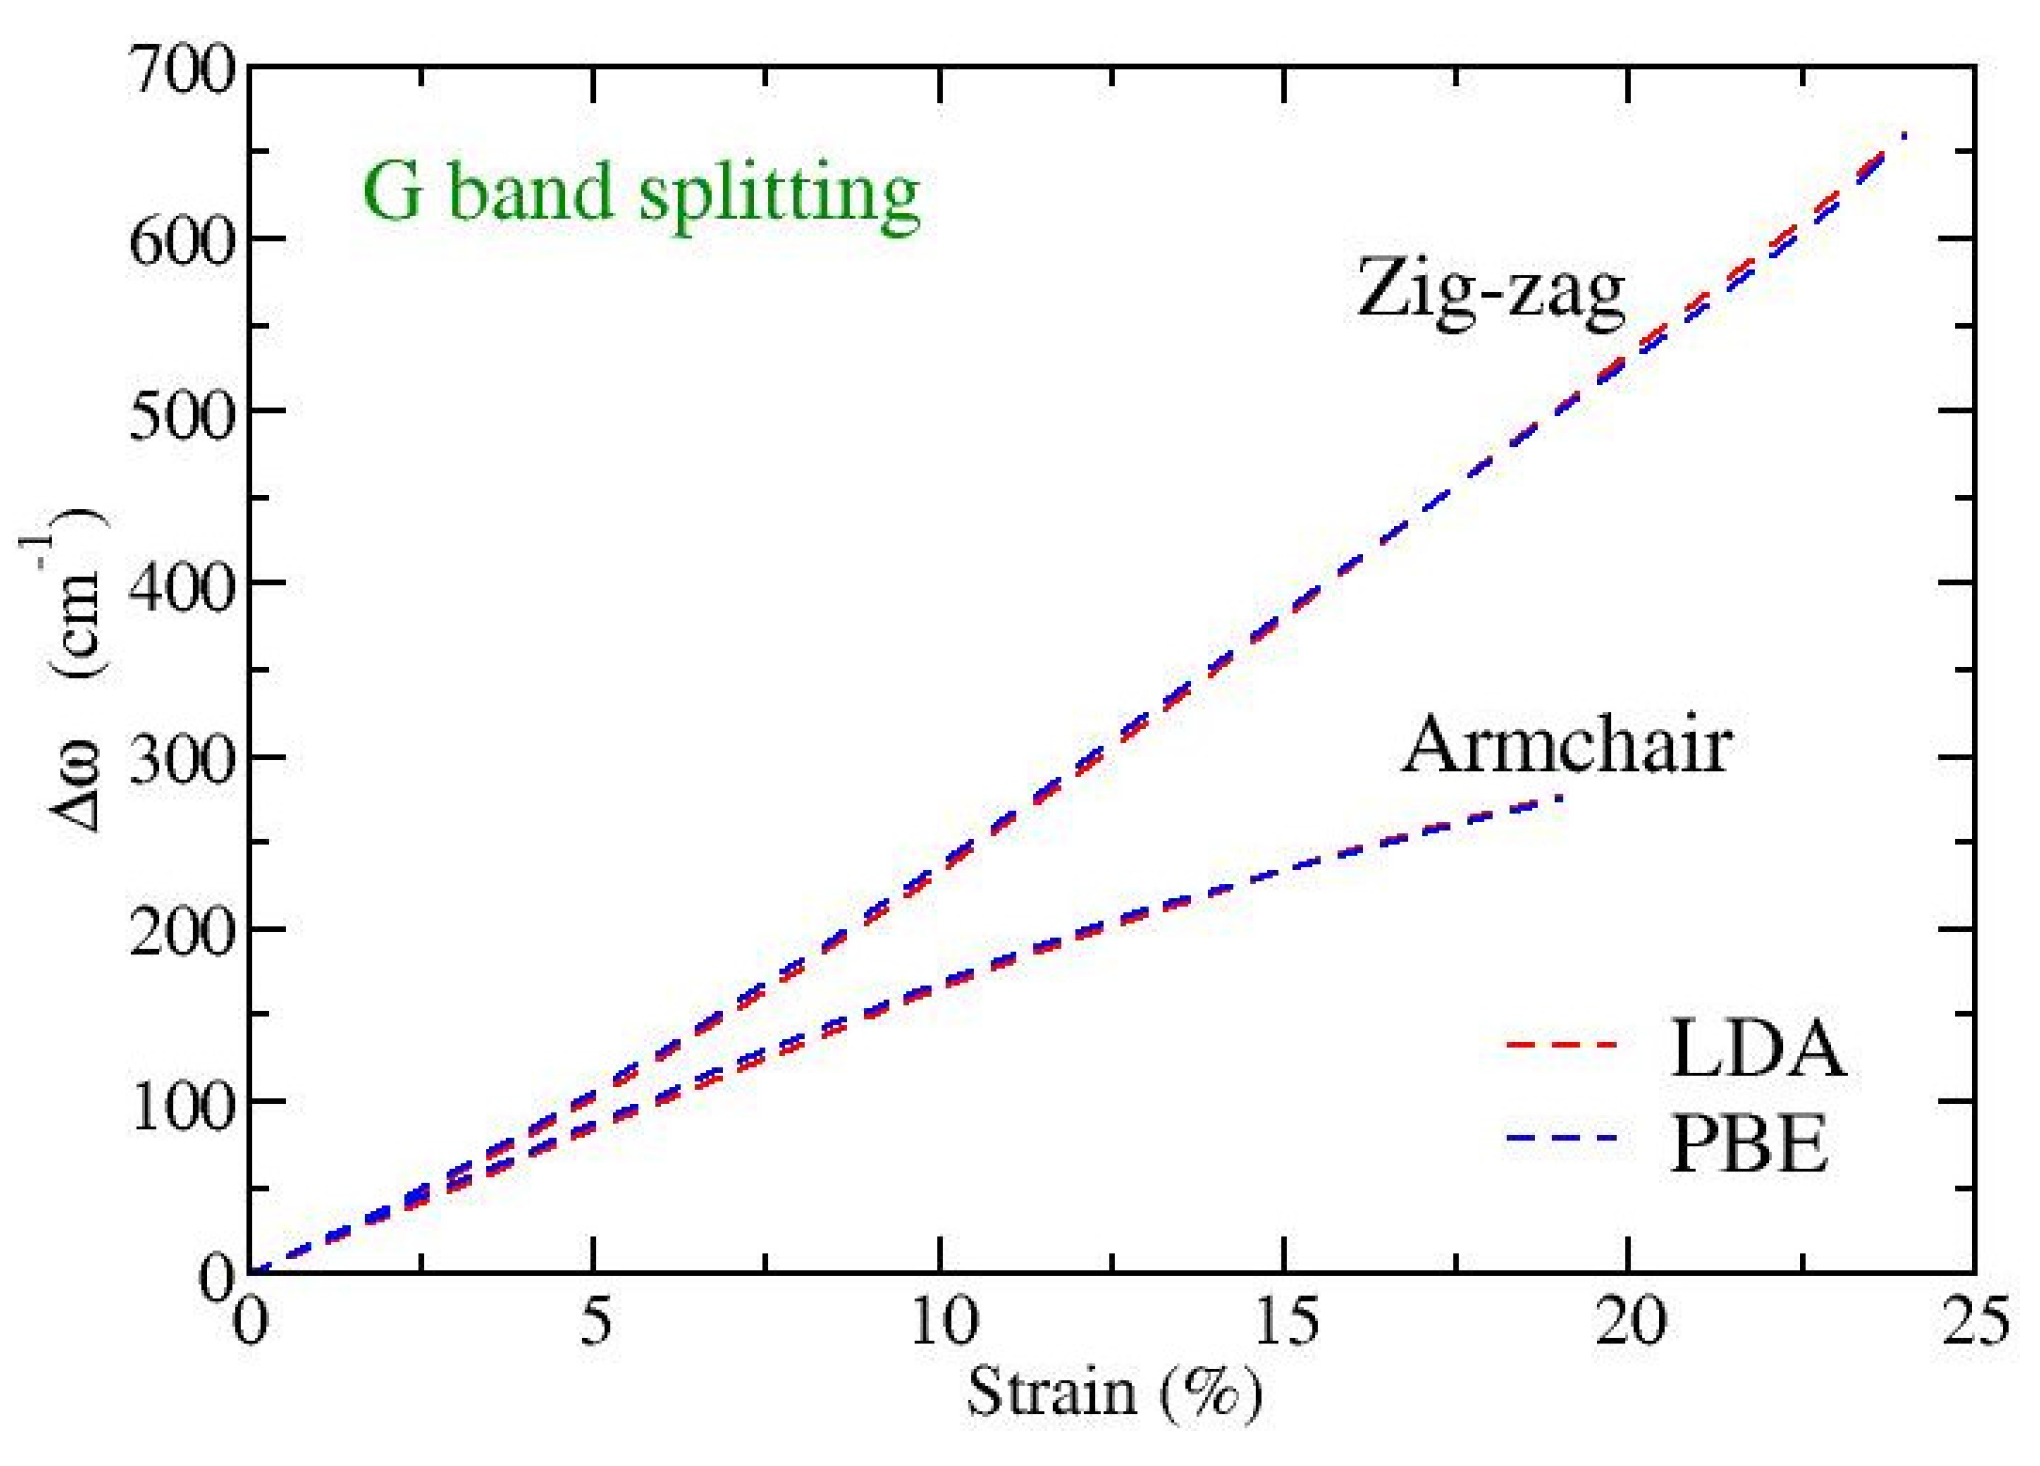
Finally, we have explicitly calculated the variation with strain of the frequency splitting,
, between the perpendicular (G
+) and parallel to strain (G
−) in-plane eigenmodes, with
and
being their corresponding frequencies. In
Figure 5 this dependence for strains applied along the armchair or the zigzag directions is shown. We see that while for small strains, up to 1–2%, the G-band splitting is independent of the direction of strain, for larger strains there is a strong dependence on the direction of the applied tension. The higher the strain, the larger this difference, where a tension along the zigzag direction exhibits larger G-band splitting than a similar strain in the armchair direction. Note that experimental observations in different directions of strain, as well as theoretical calculations, have found isotropic behavior regarding the G
+ and G
− softening rates and the resulting G-band splitting [
45]. However, both the experimental data and the theoretical computations were restricted in small strains (up to around 1%) in that work [
45]. Our results shown in
Figure 5 are consistent with these reports; for such small values of strain an isotropic behavior of the splitting is revealed. However, this behavior is no longer valid for larger strains.
A linear fitting of the splittings depicted in
Figure 5 at small strains (below 1%) results in a rate of increase of the splitting with the strain around 17–18 cm
−1/%strain, in both directions. This is in very good quantitative agreement with the experimental and theoretical results discussed in page 4 and page 5, respectively, of reference [
45]. A crude analytical estimate of the splitting through the second derivative of the Morse stretching potential (see the discussion at the end of
Section 3.1), when one substitutes the MD derived A and Z bond-length extensions on each direction of strain, leads to splitting around 30–35 cm
−1/%strain, which are about twice the above mentioned DFT obtained values.


