
Study on the Influence of Silica Fume (SF) on the Rheology, Fluidity, Stability, Time-Varying Characteristics, and Mechanism of Cement Paste


Abstract
:1. Introduction
2. Materials and Methodology
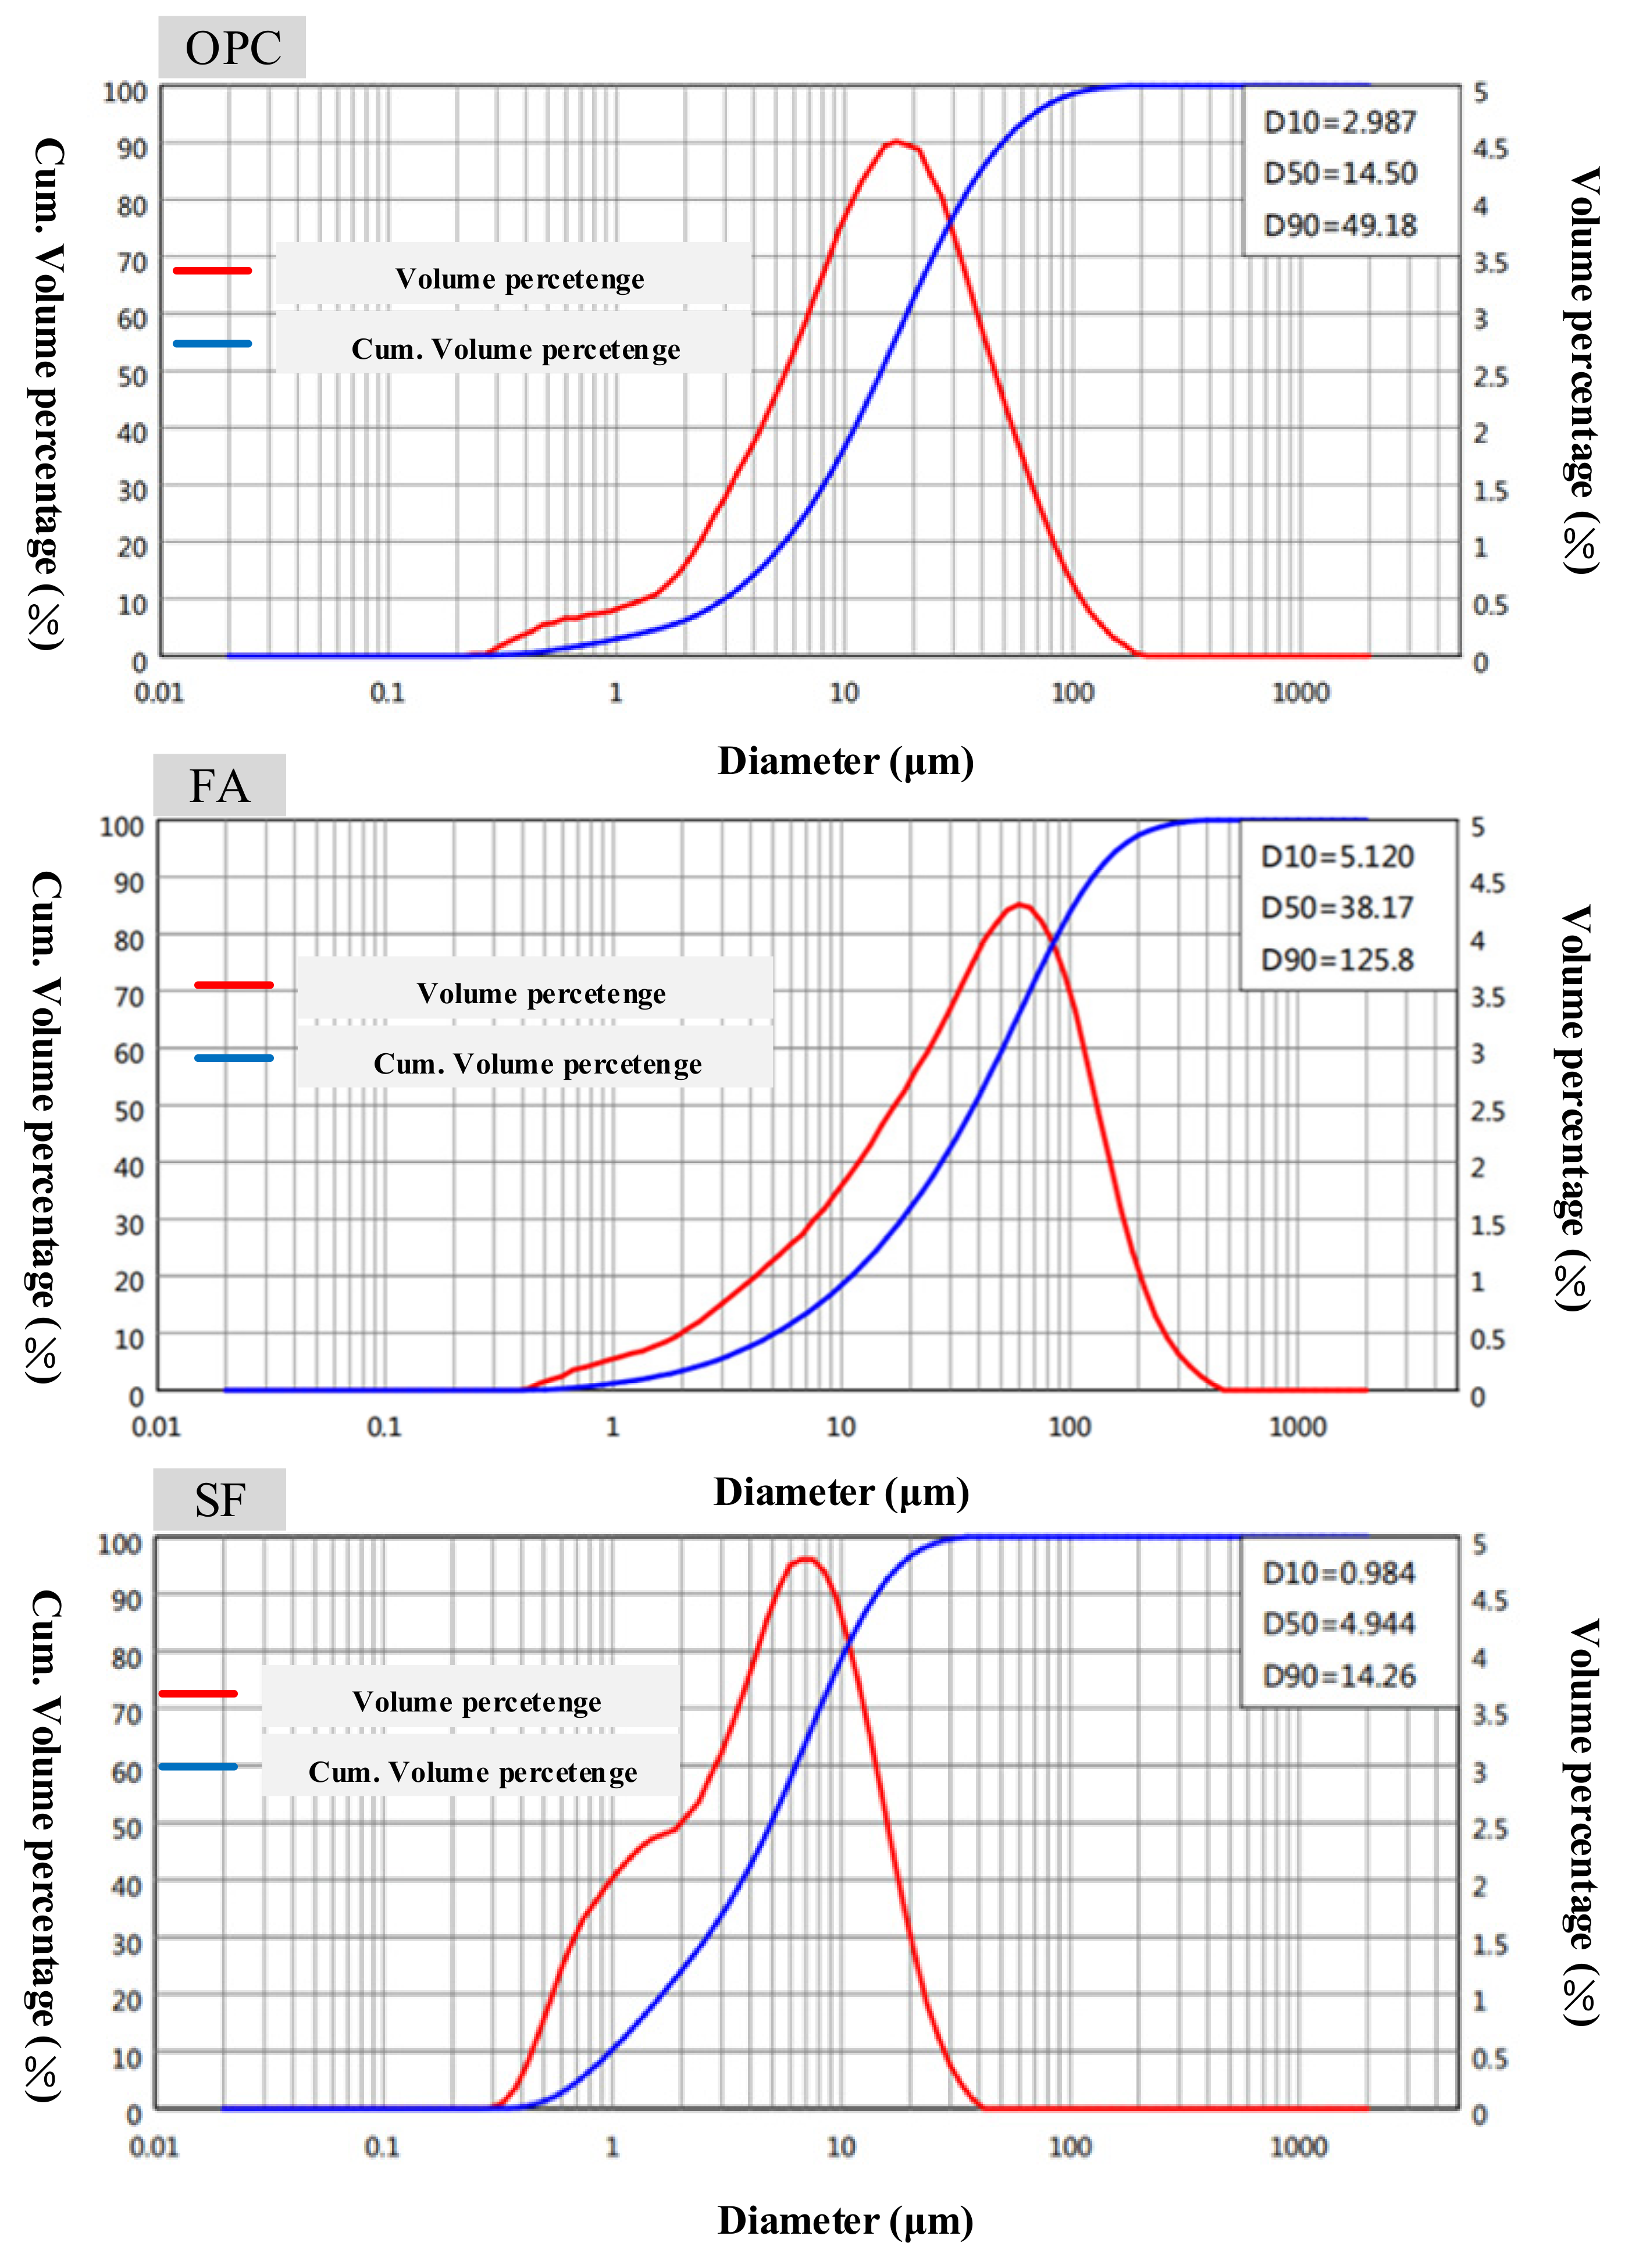
2.1. Materials
2.2. Experimental Program
2.3. Test Methods
2.3.1. Flow Spread
2.3.2. Rheological Properties
2.3.3. Bleeding Rate
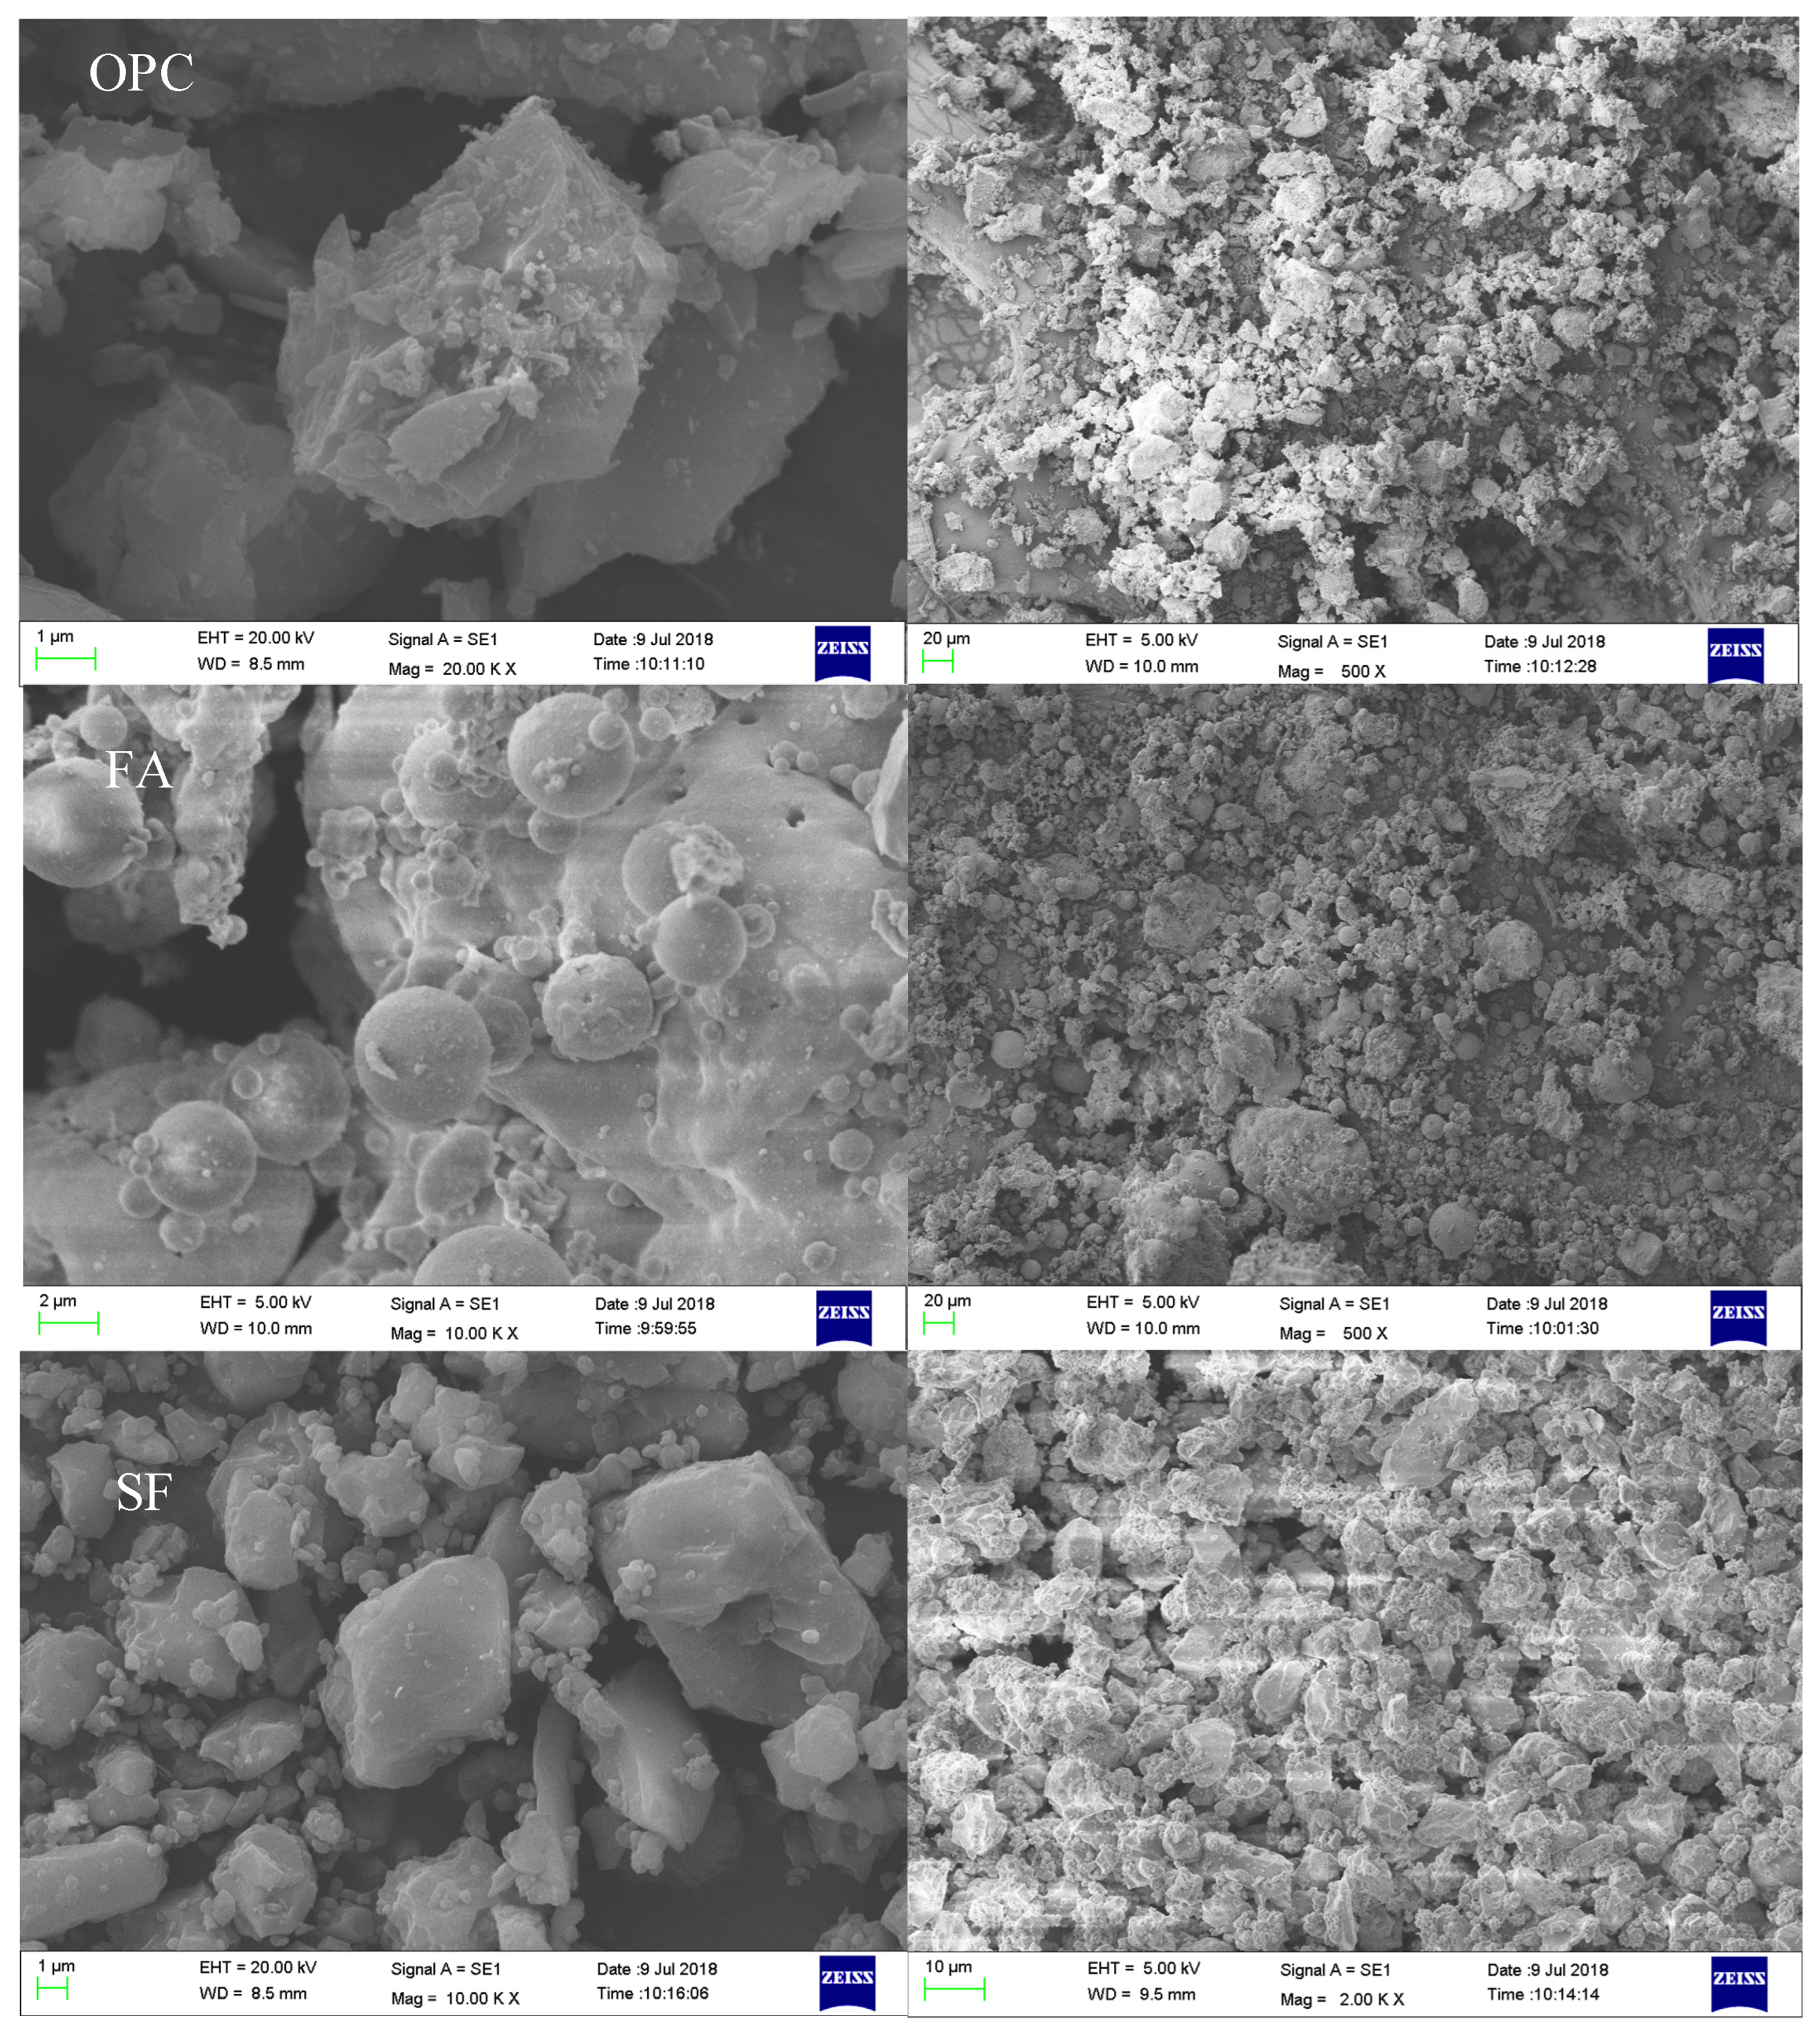
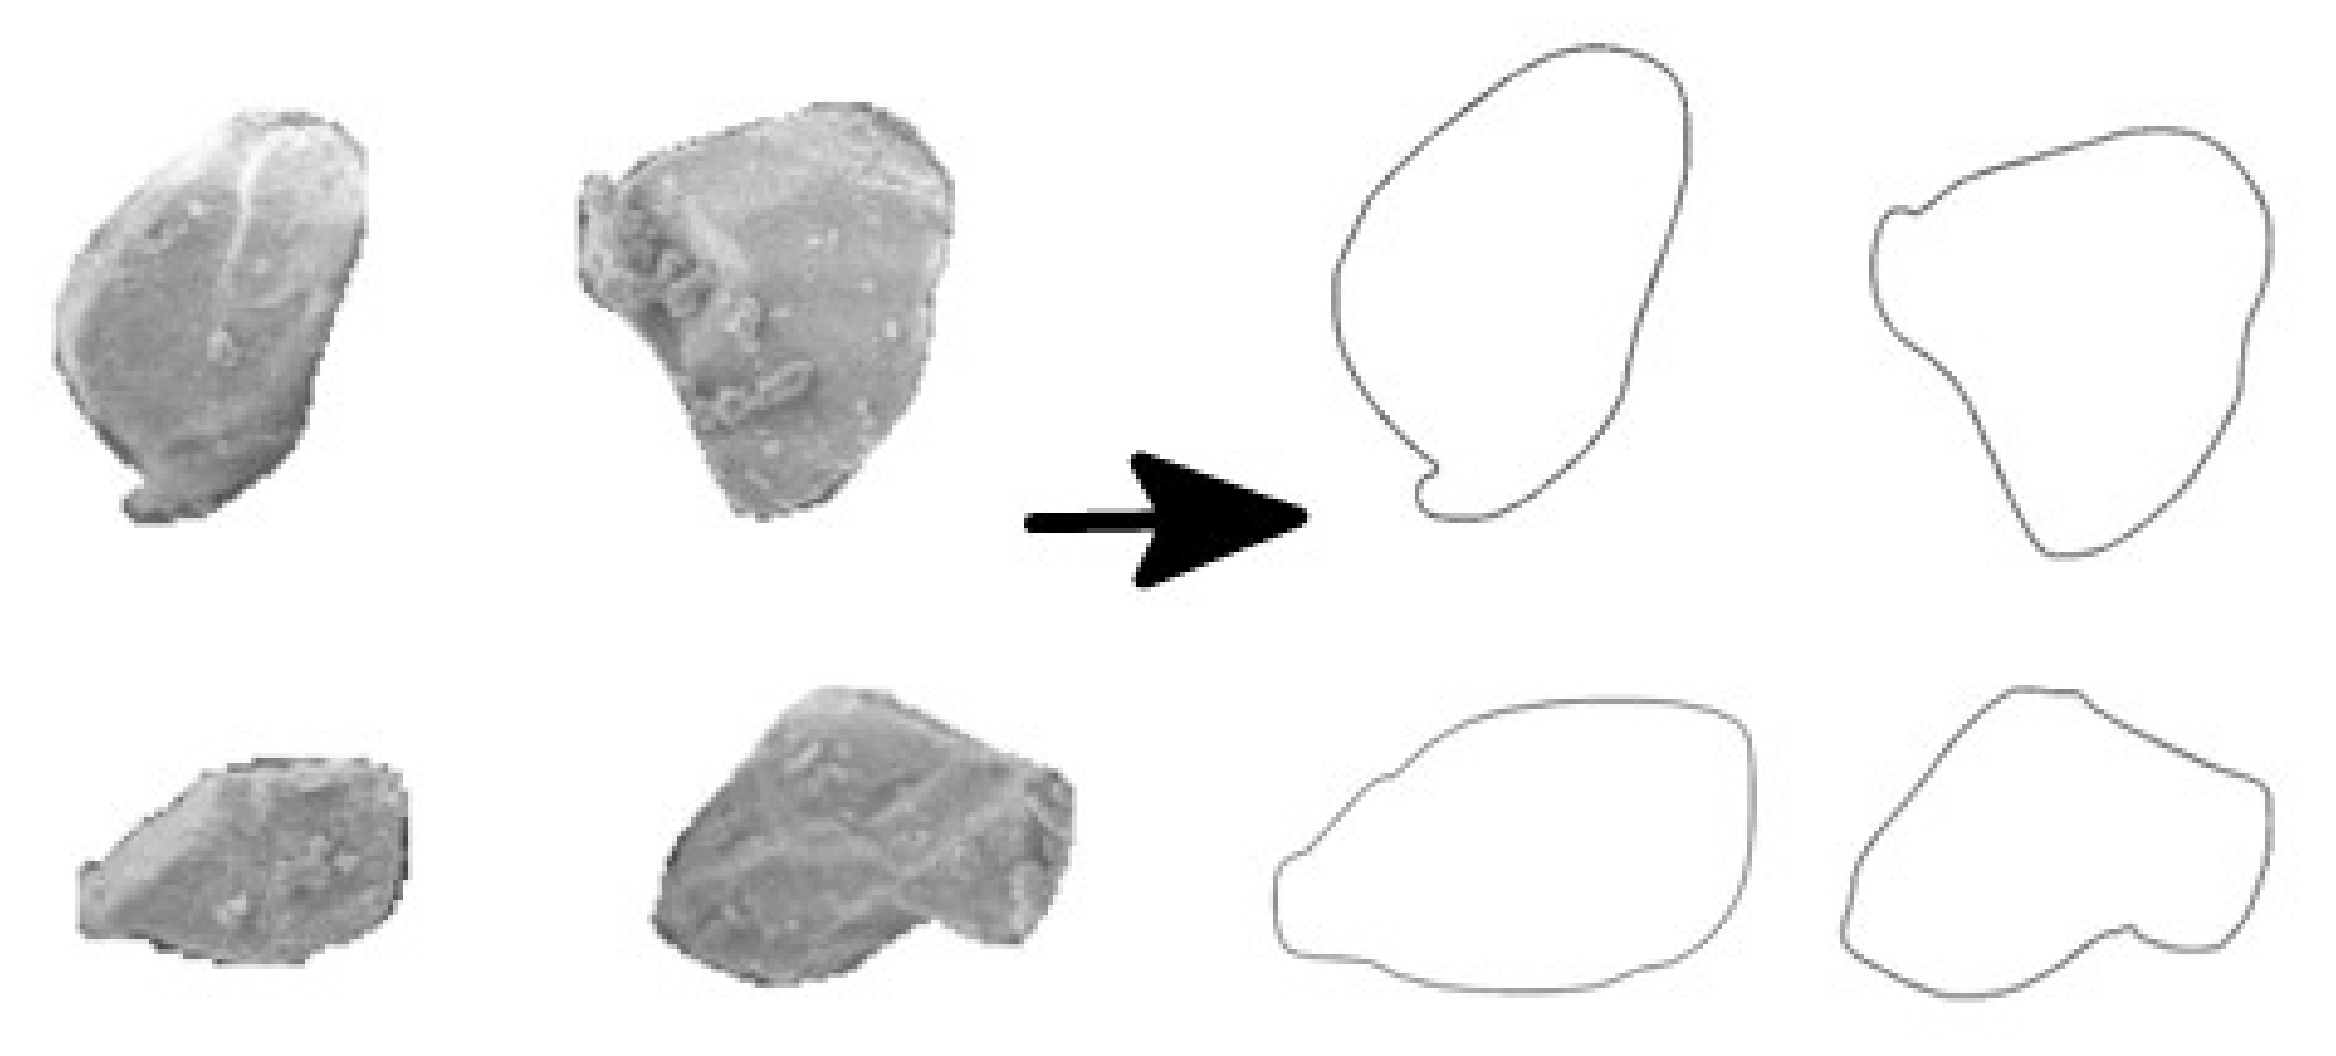
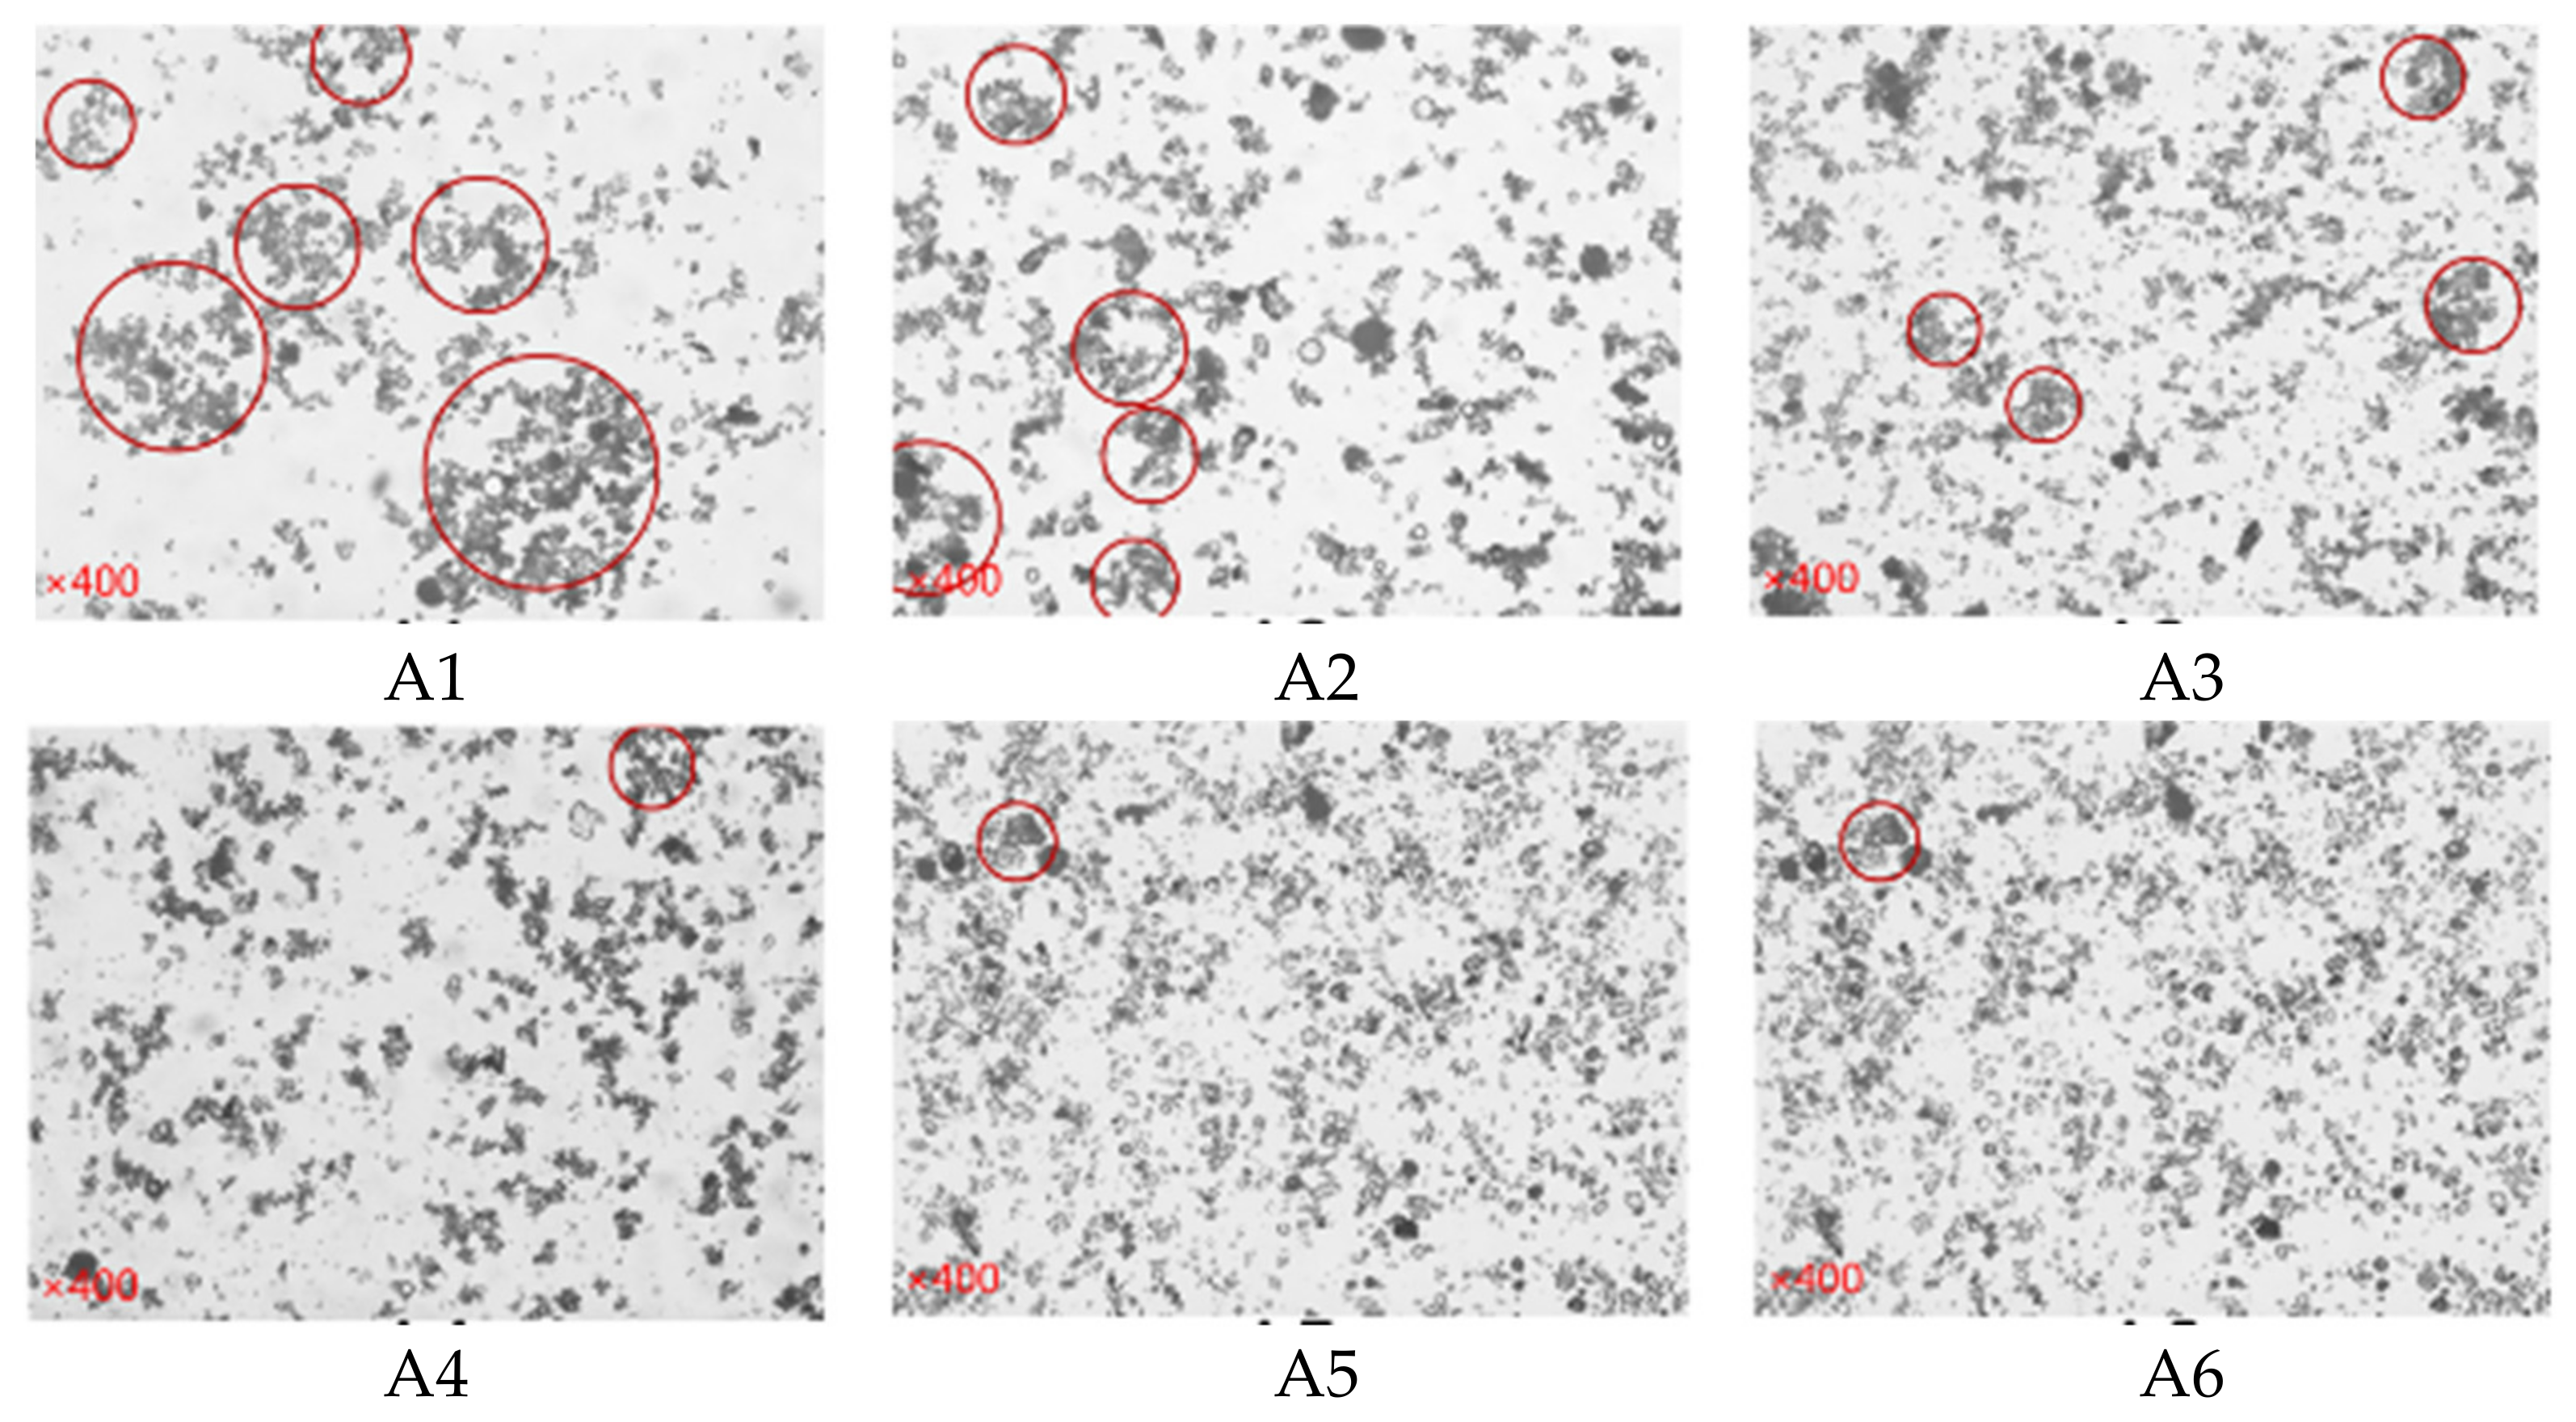
2.3.4. Observation of Microstructure
2.3.5. Heat of Hydration
2.3.6. Packing Density and Water Film Thickness
3. Results and Discussion
3.1. Fluidity
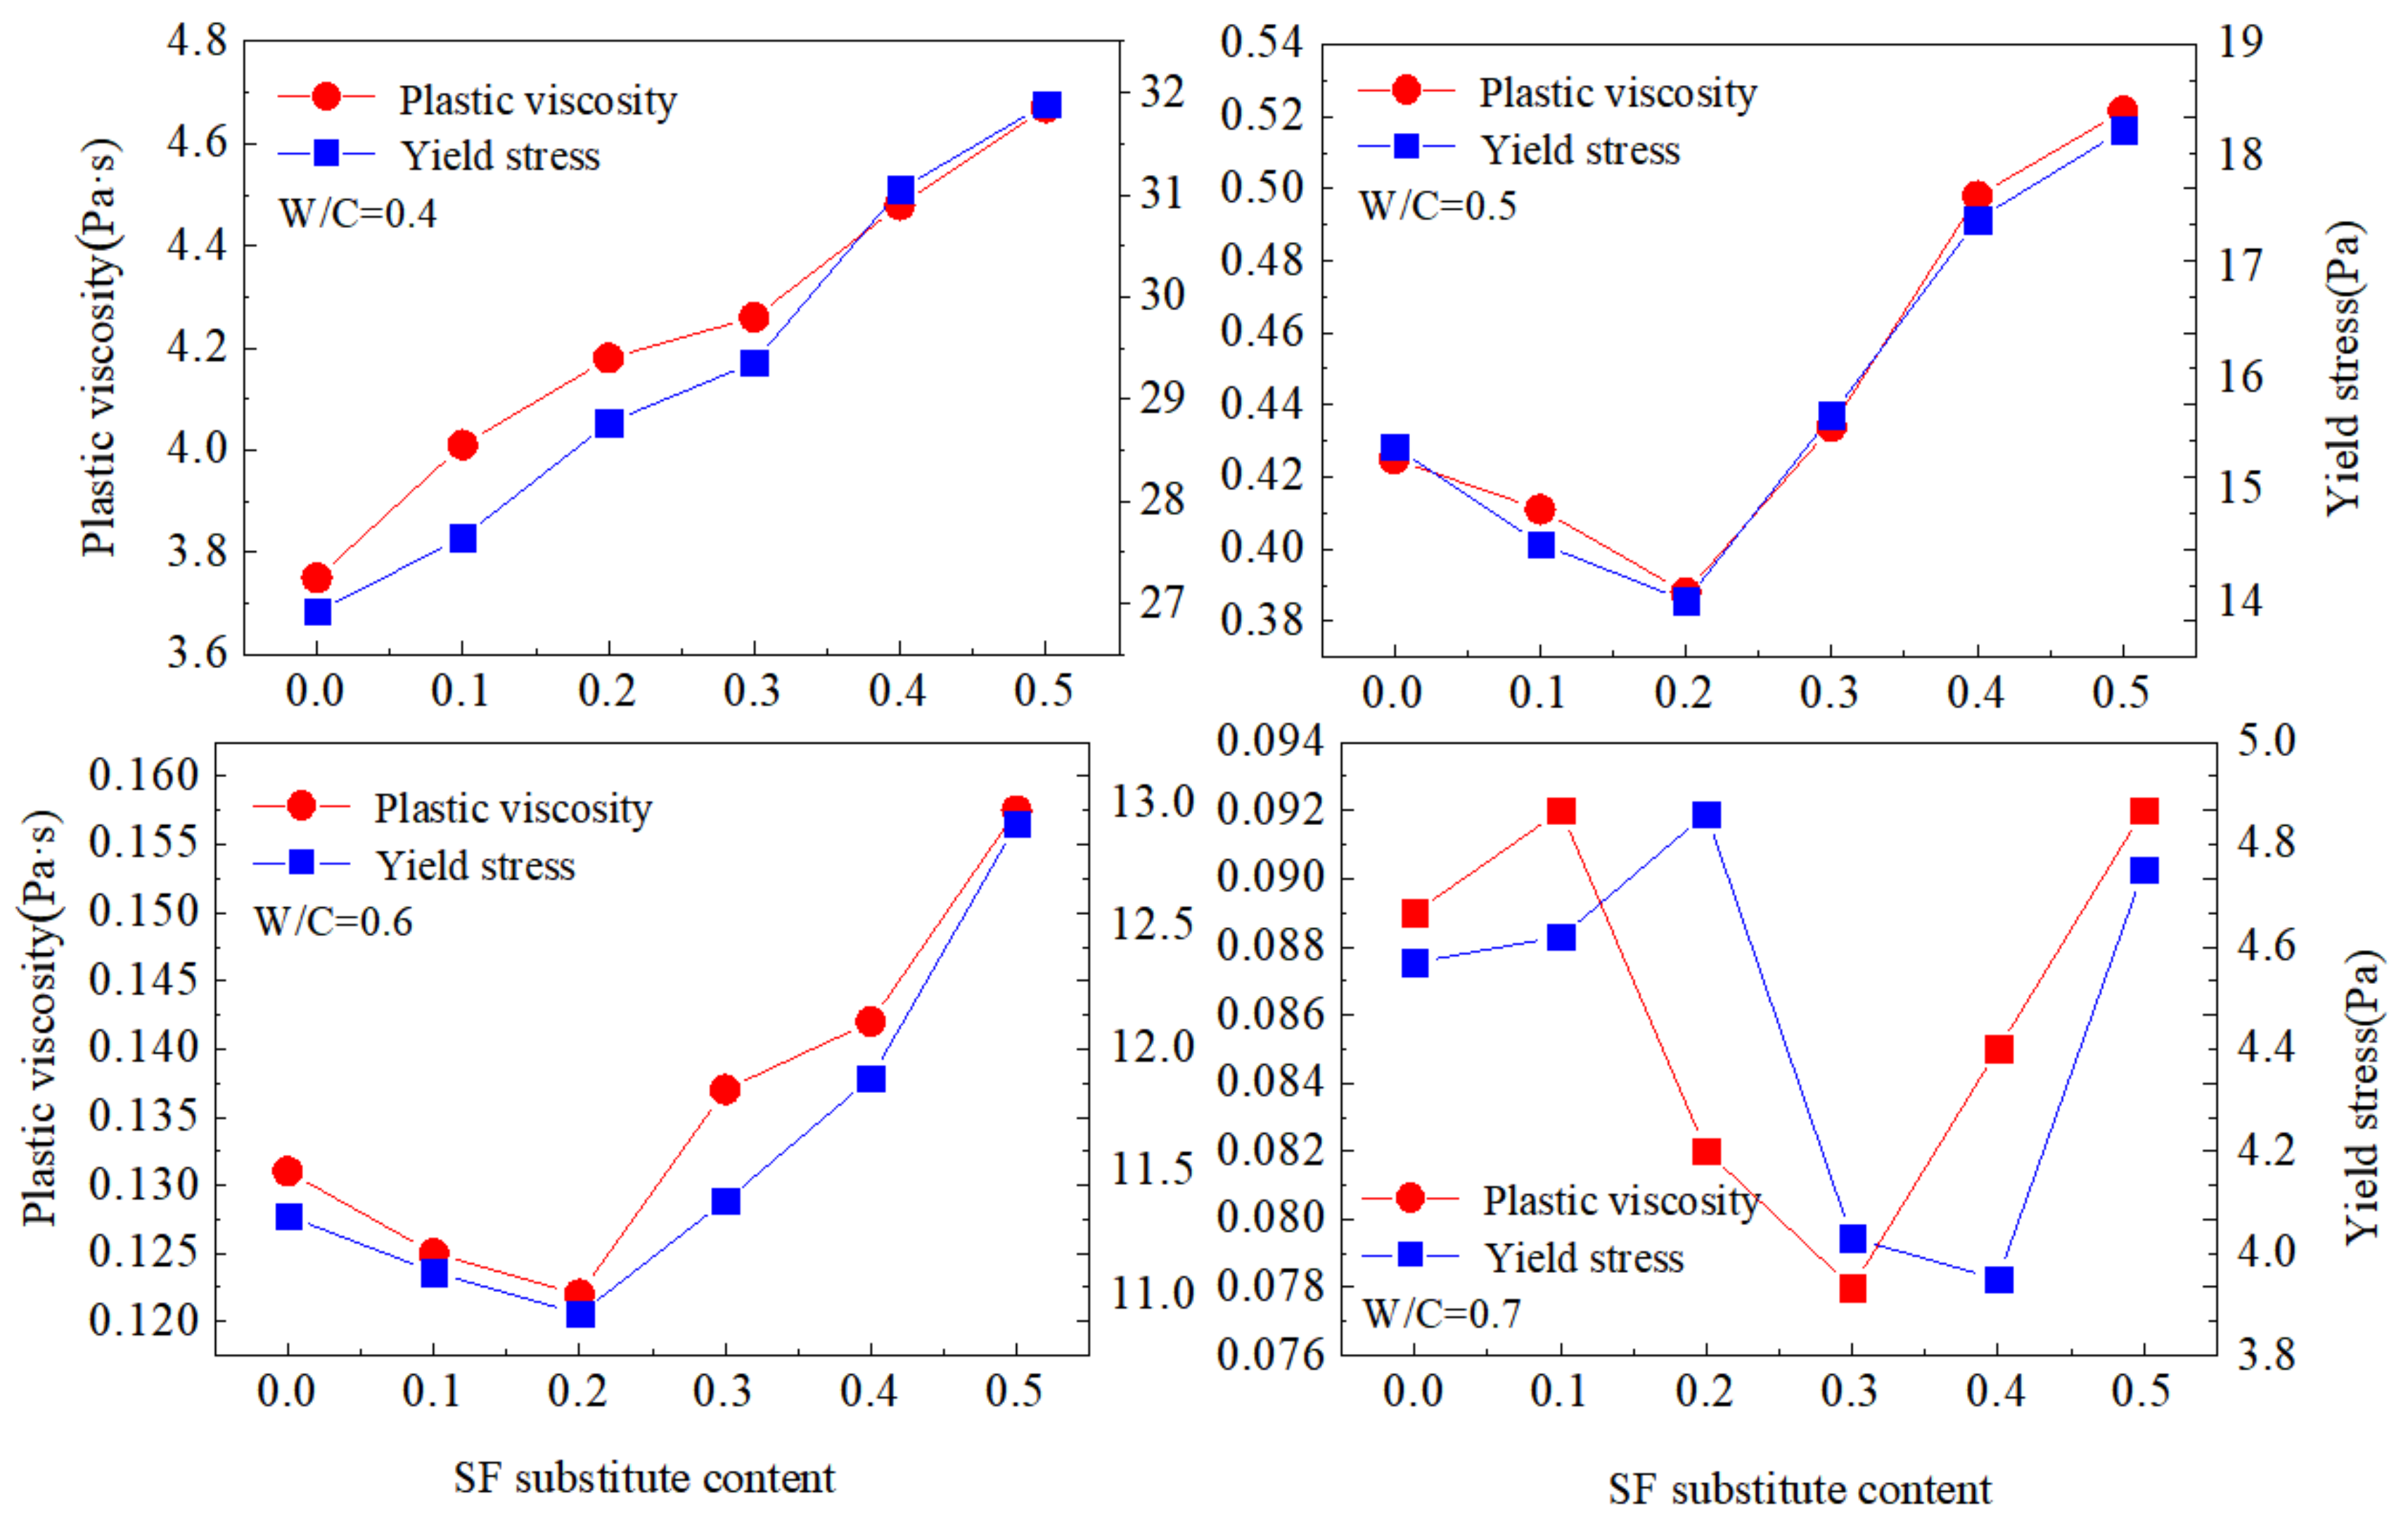
3.2. Rheological Properties
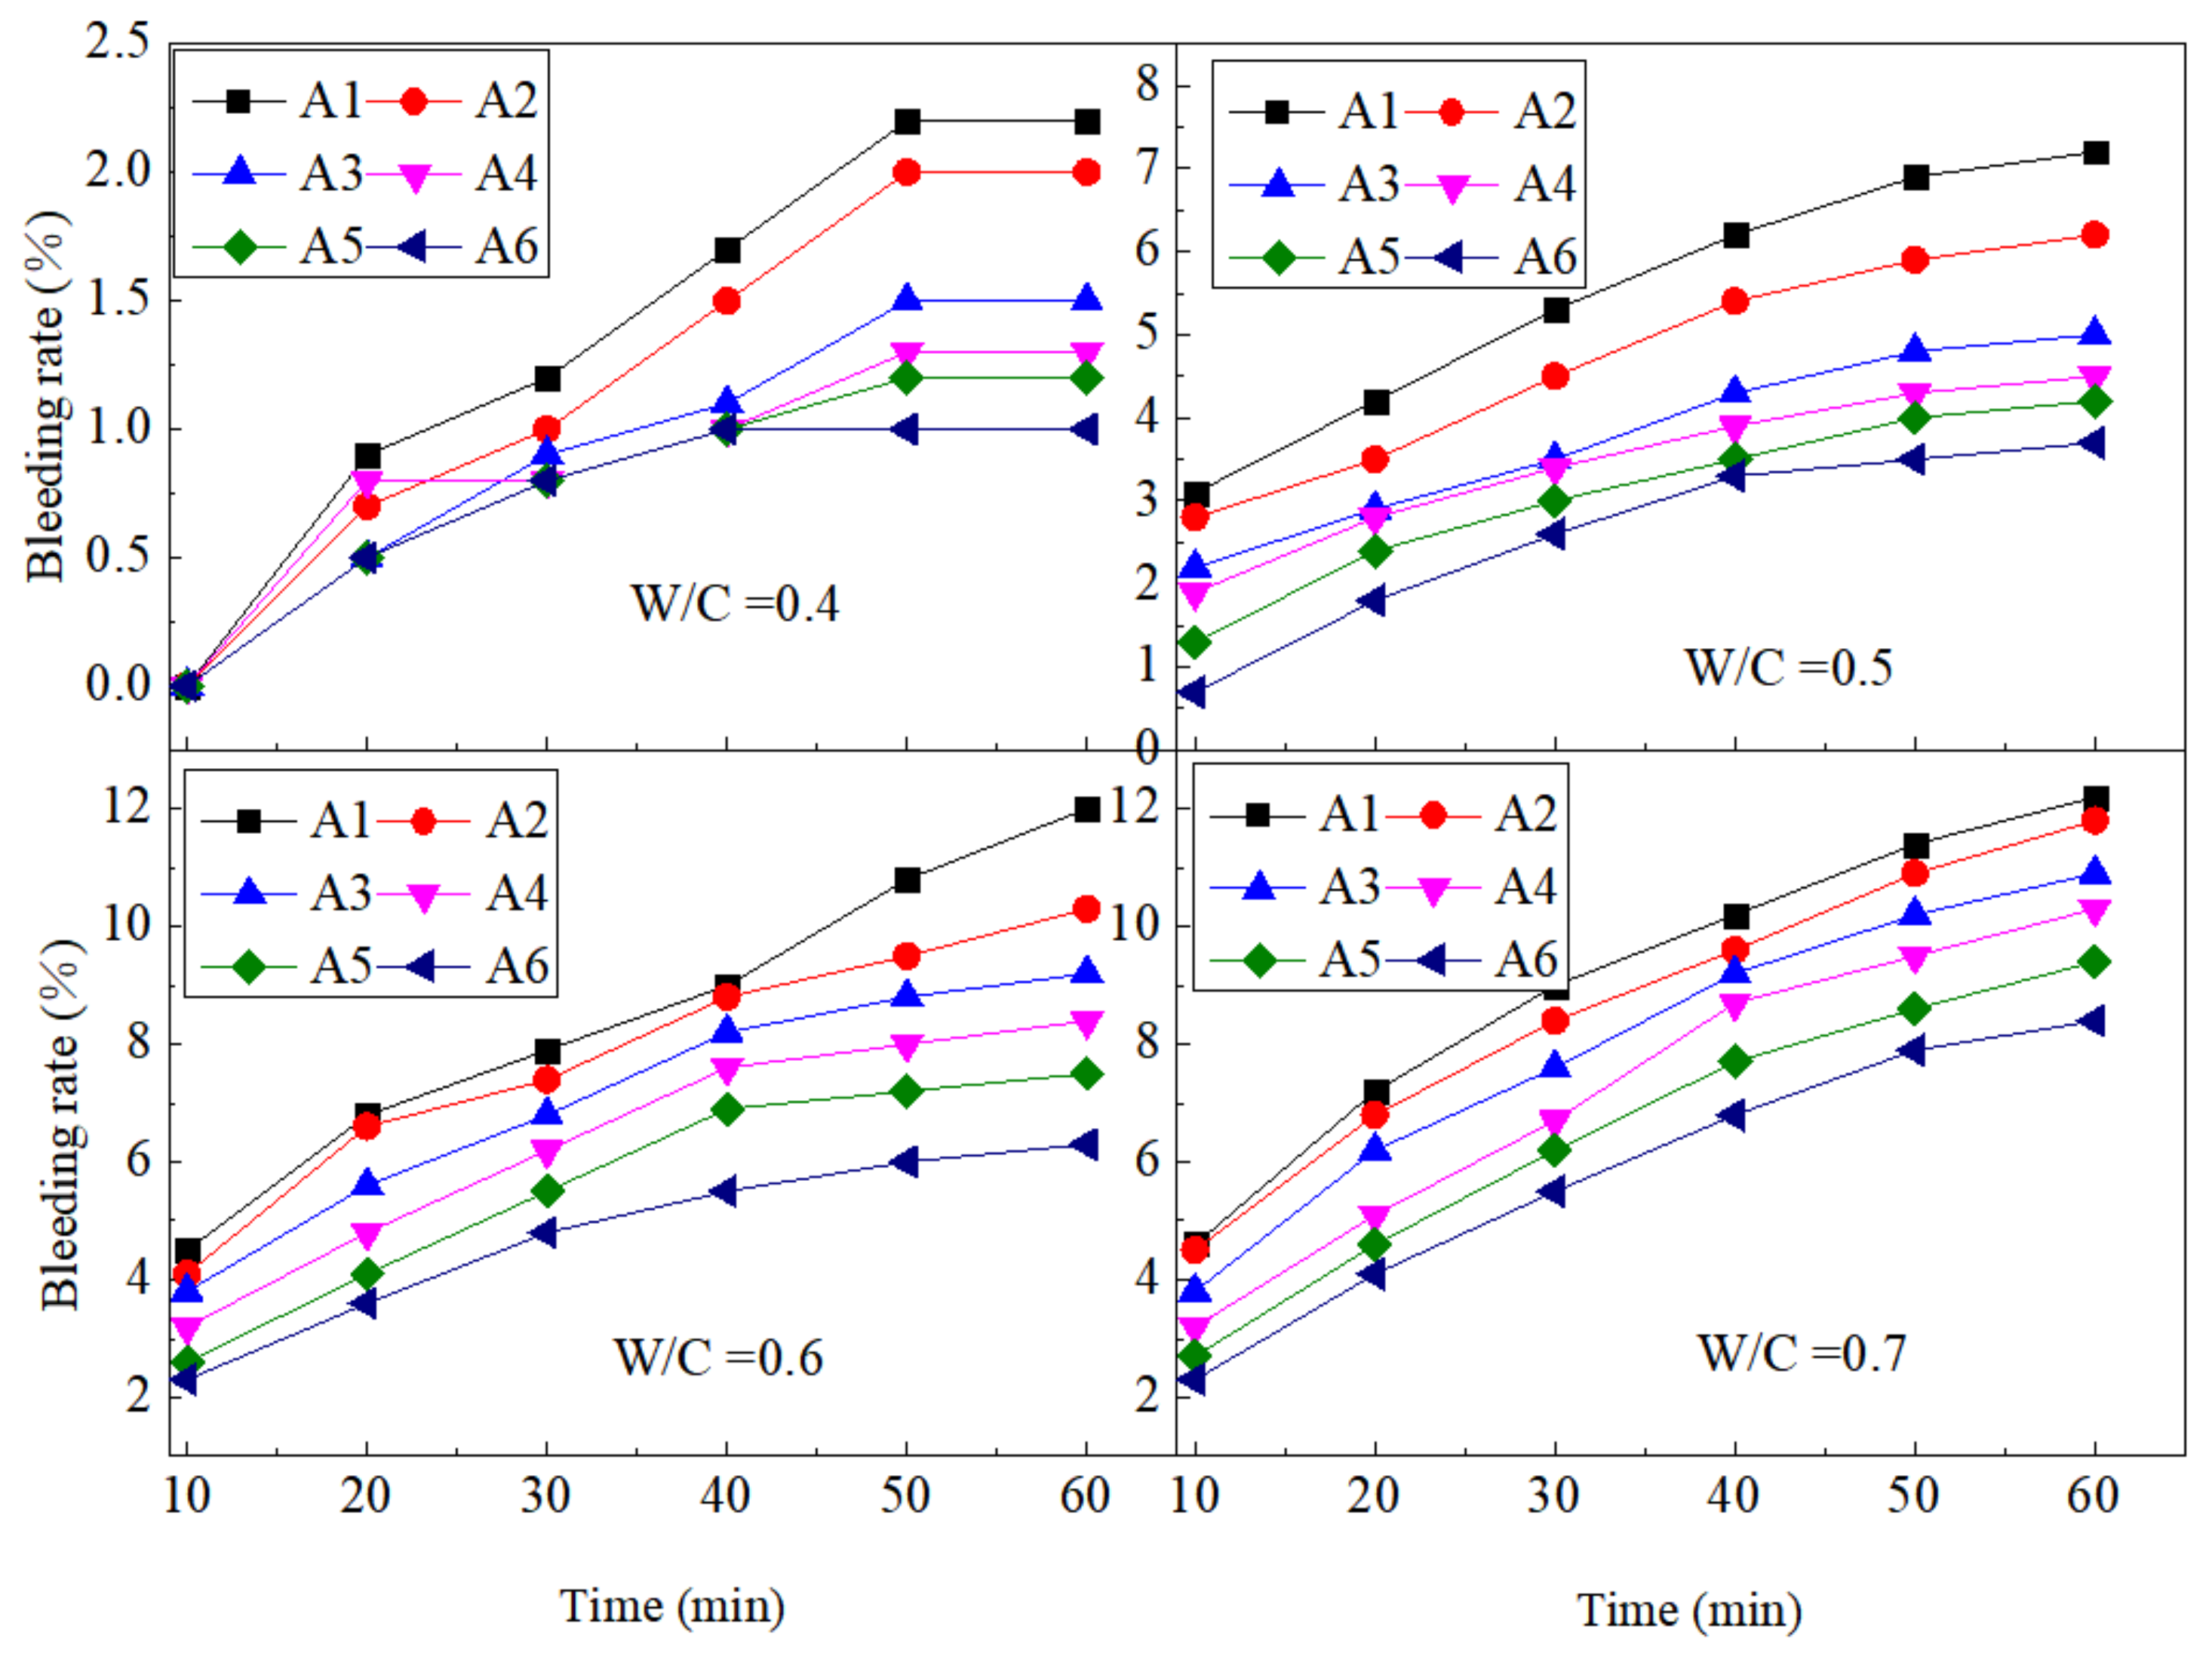
3.3. Bleeding Rate
3.4. Time-Varying Properties
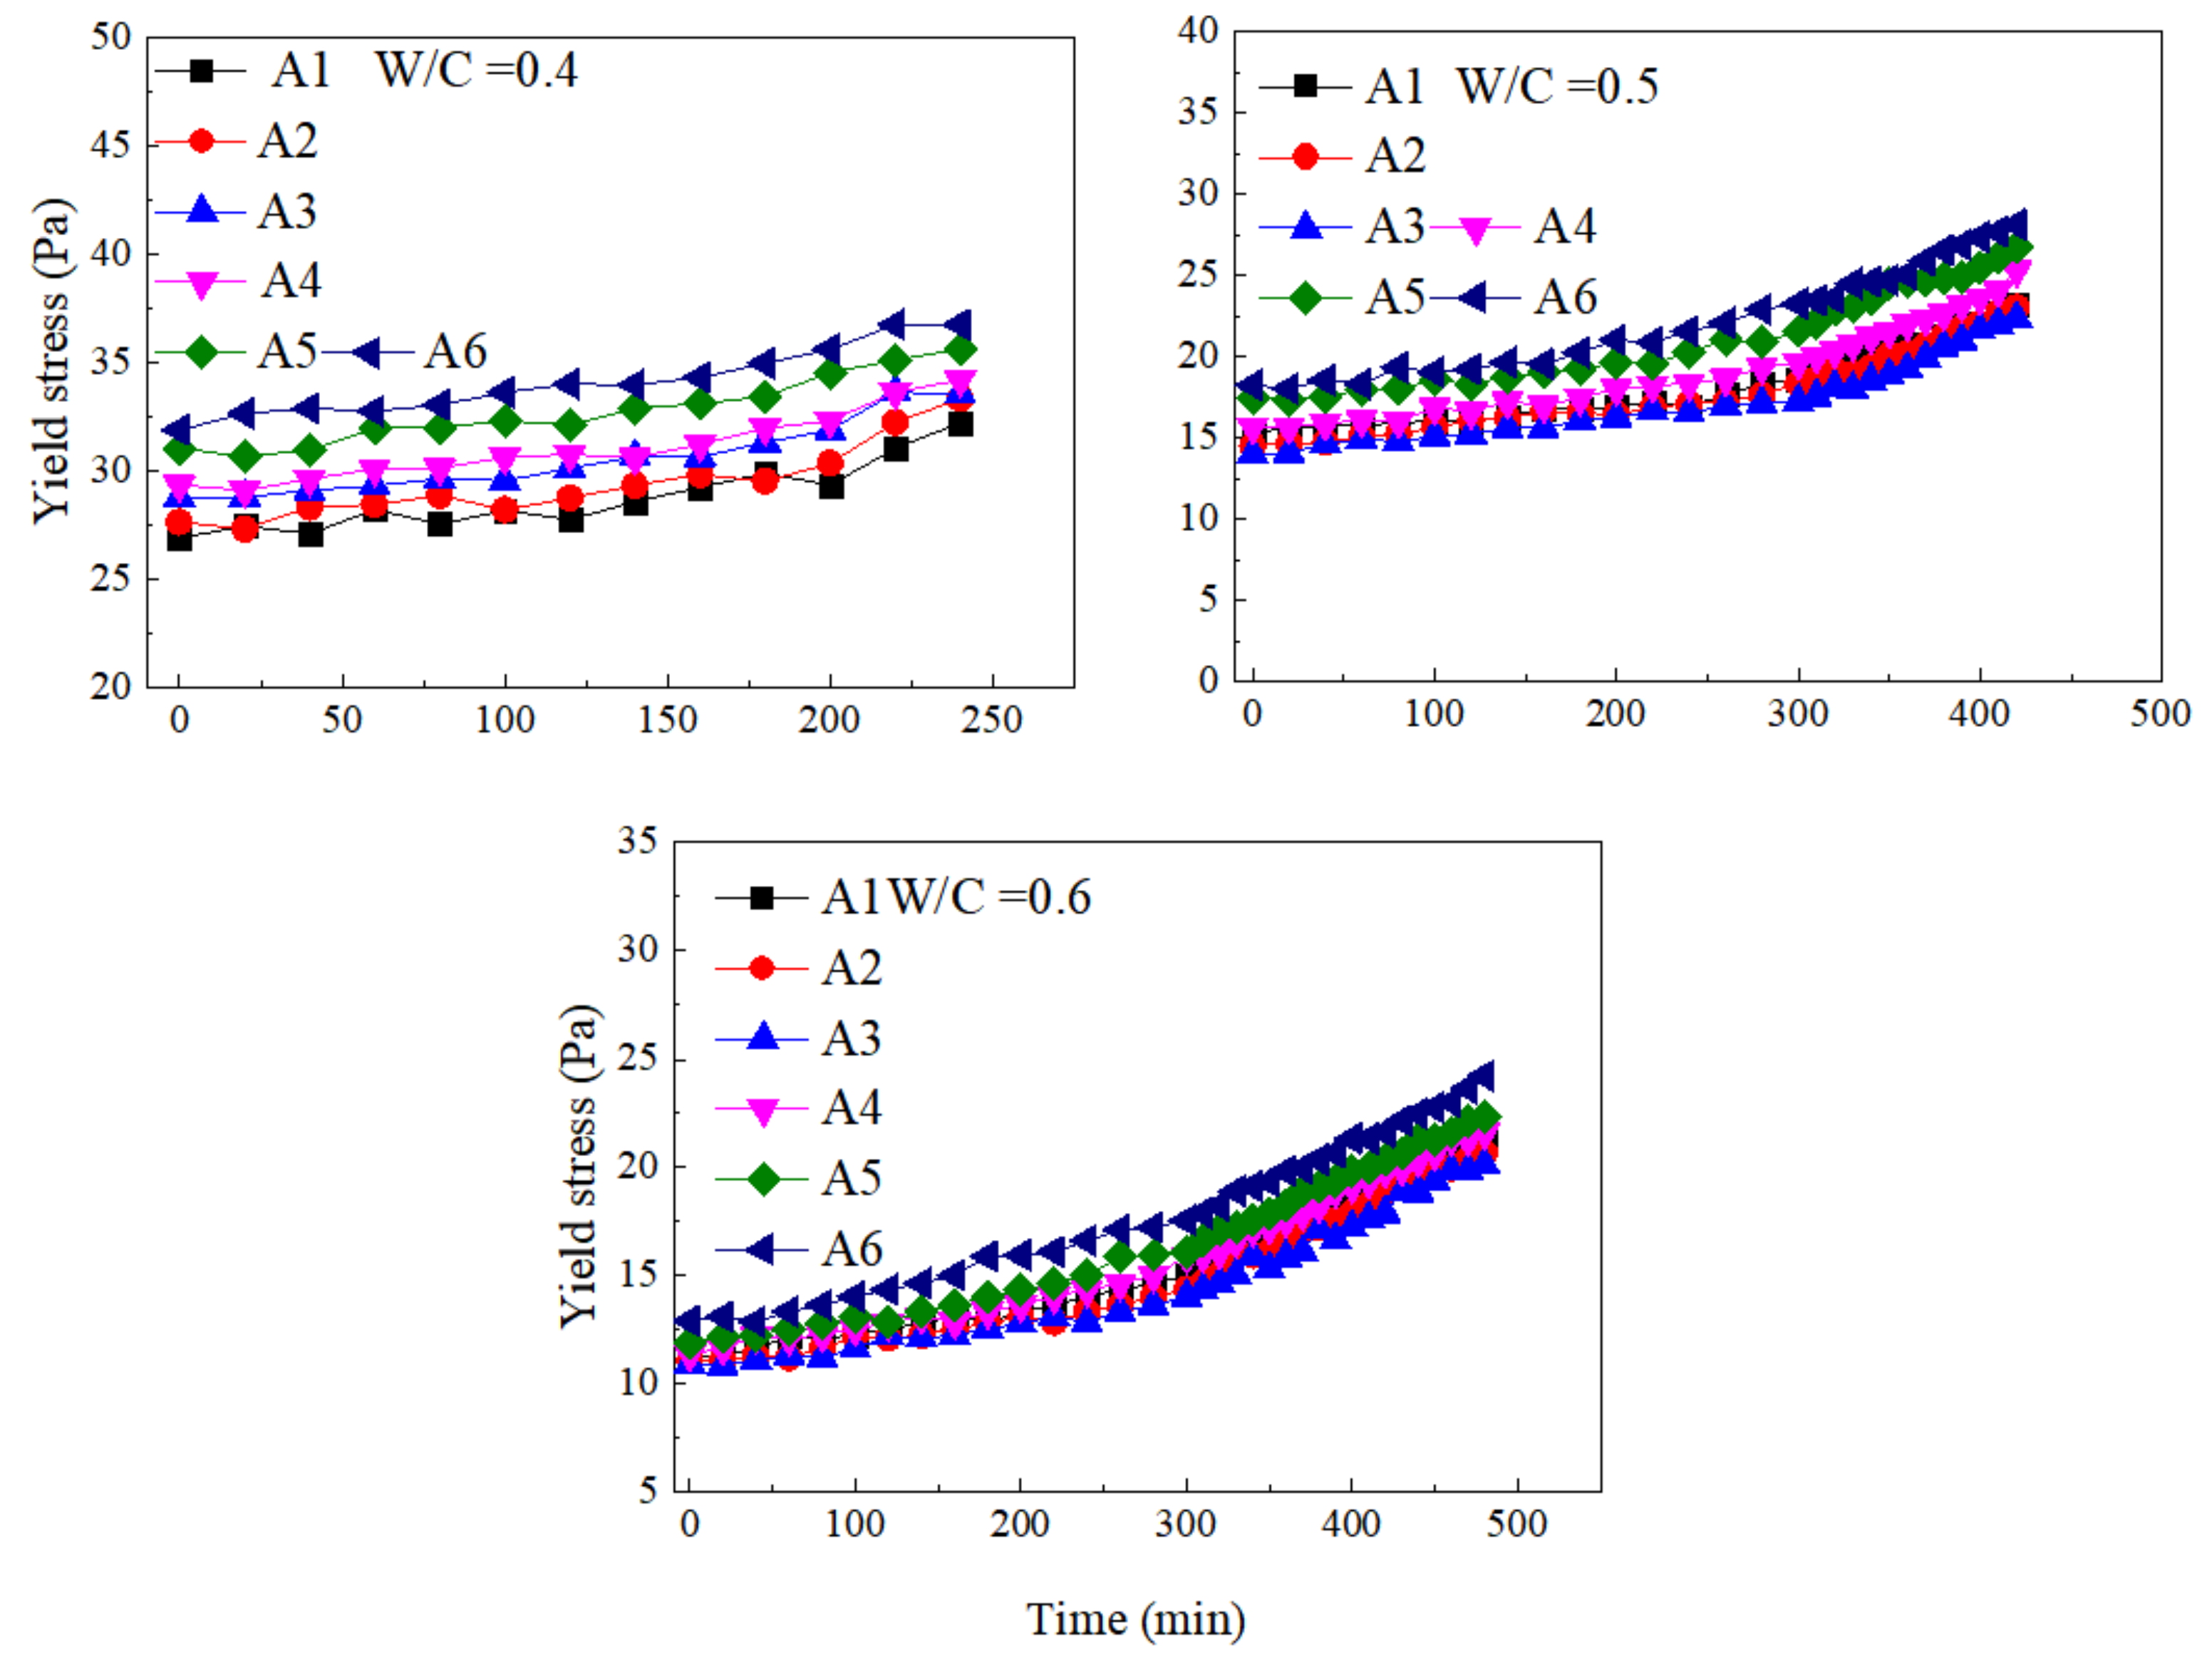
3.4.1. The Regularity of Yield Stress with Time
3.4.2. The Regularity of Plastic Viscosity with Time
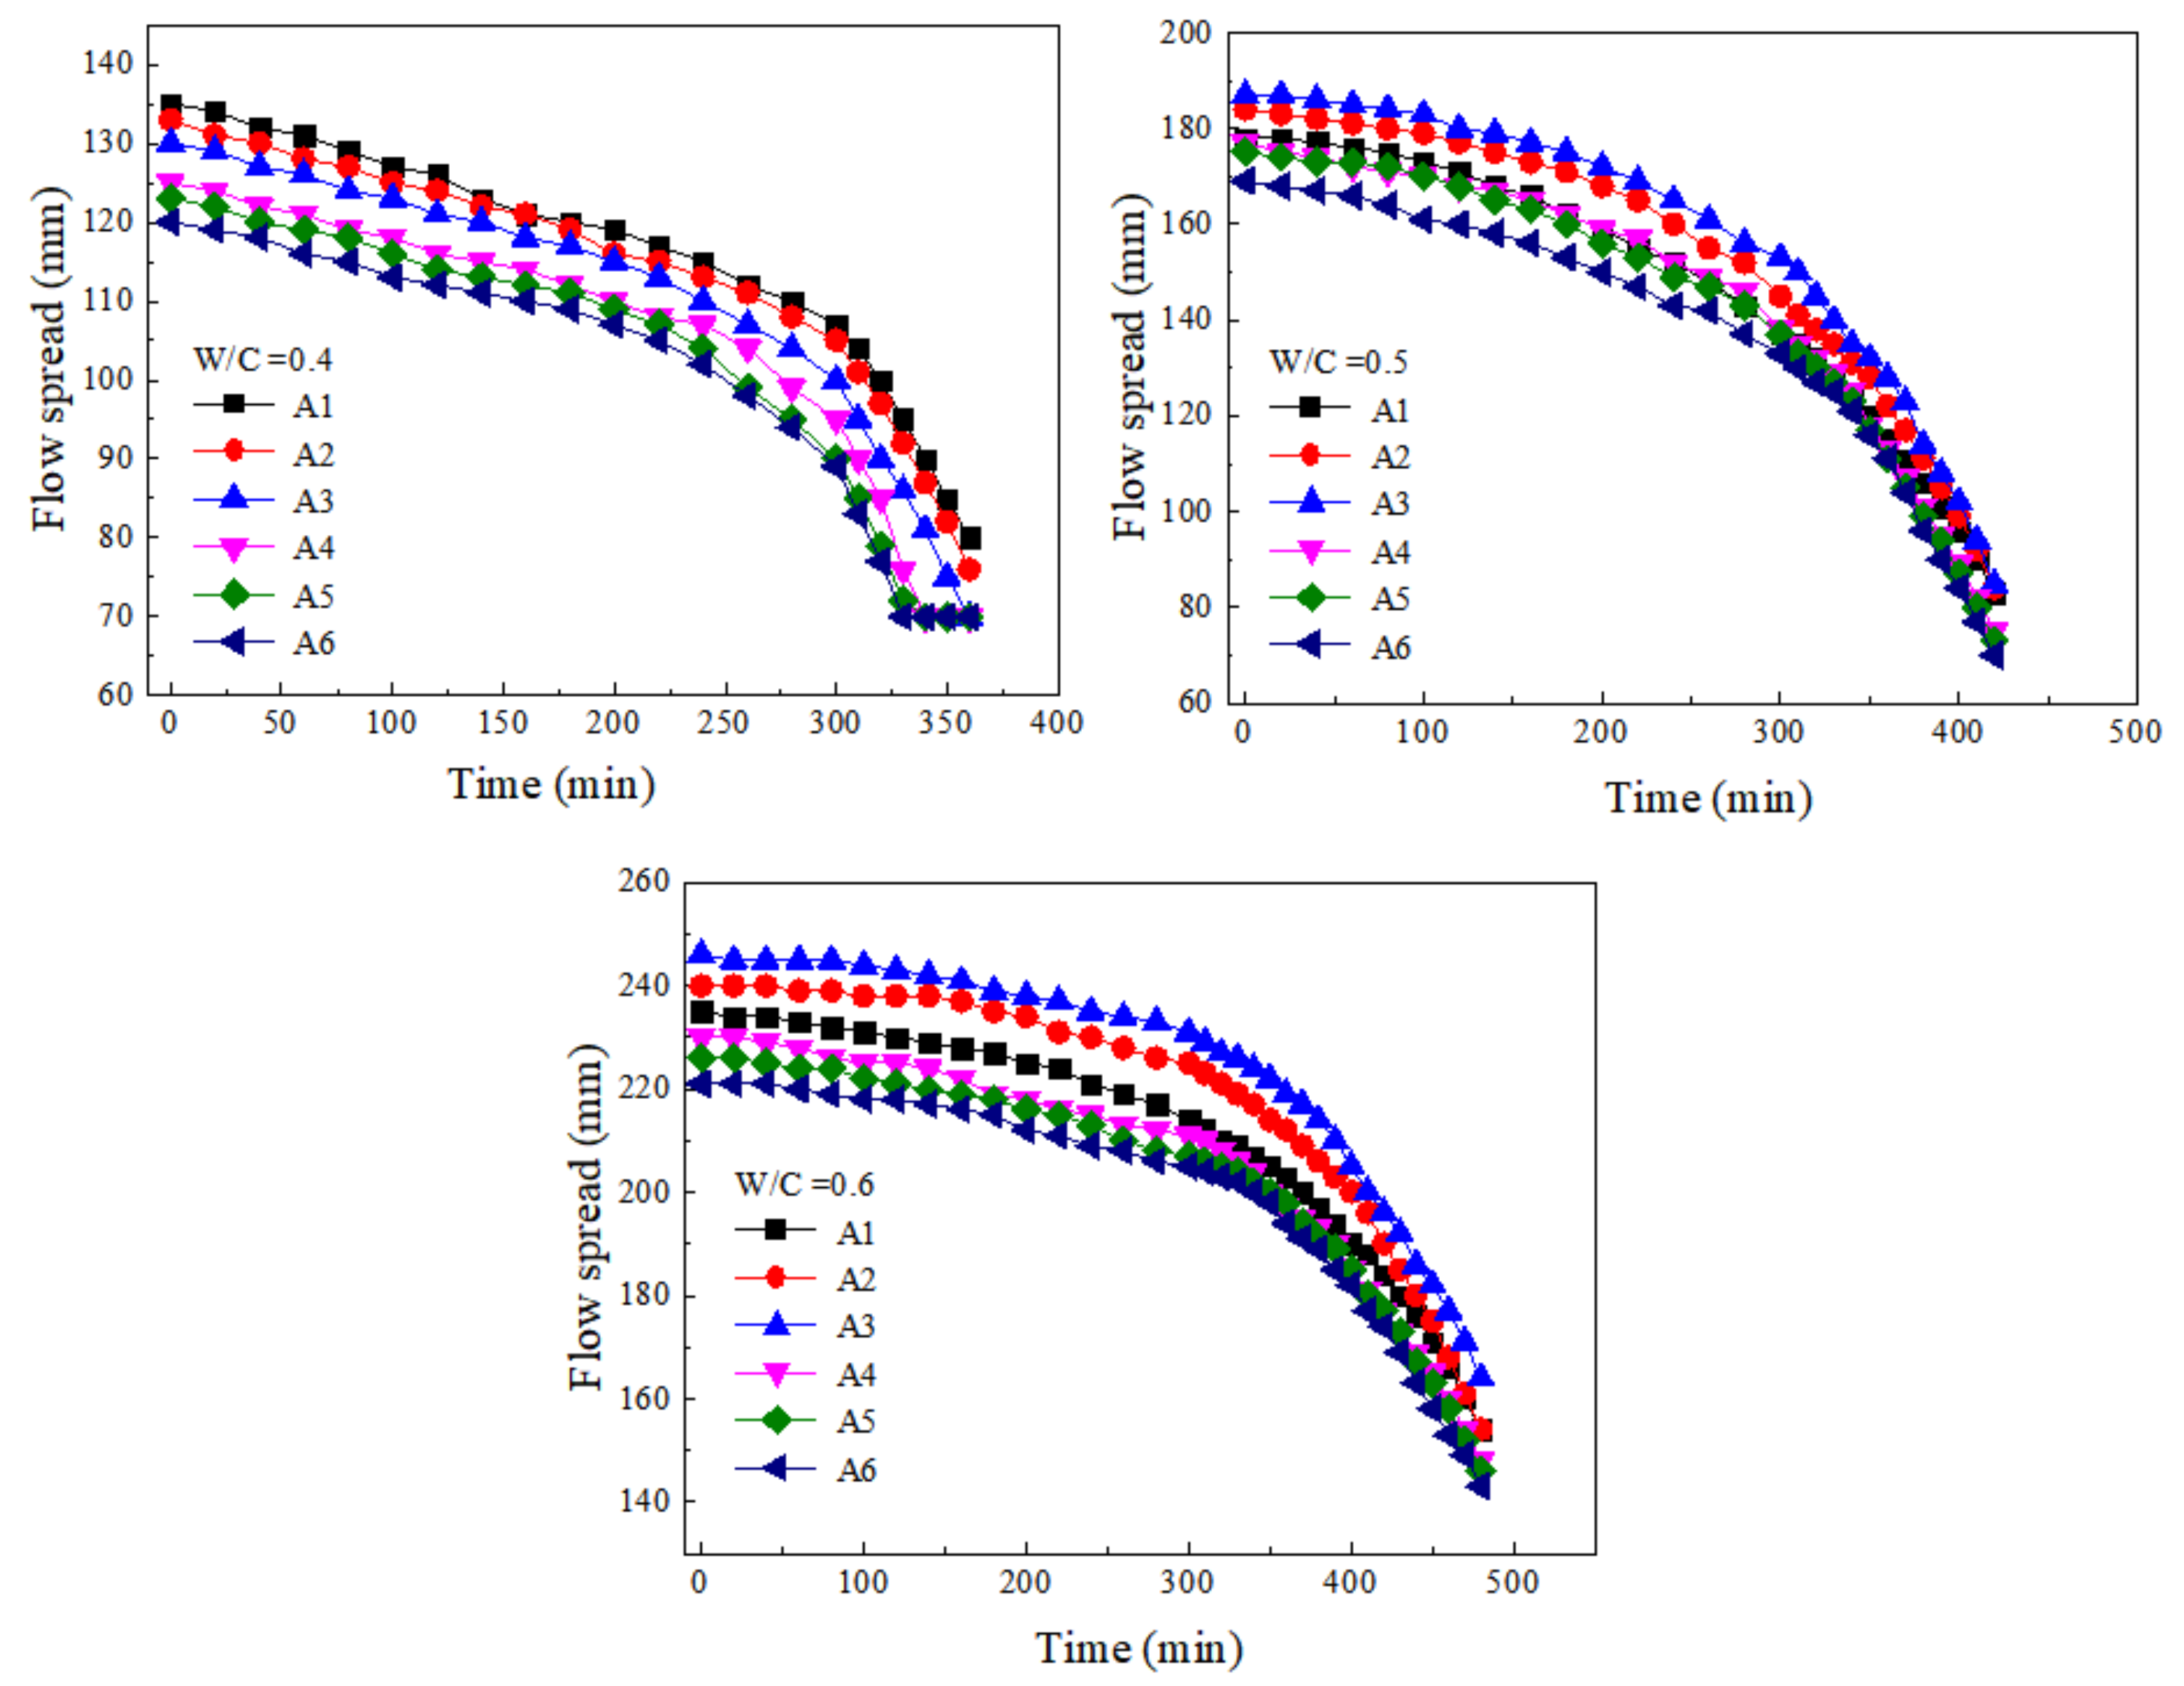
3.4.3. The Regularity of Flow Spread with Time
4. Mechanism Analysis
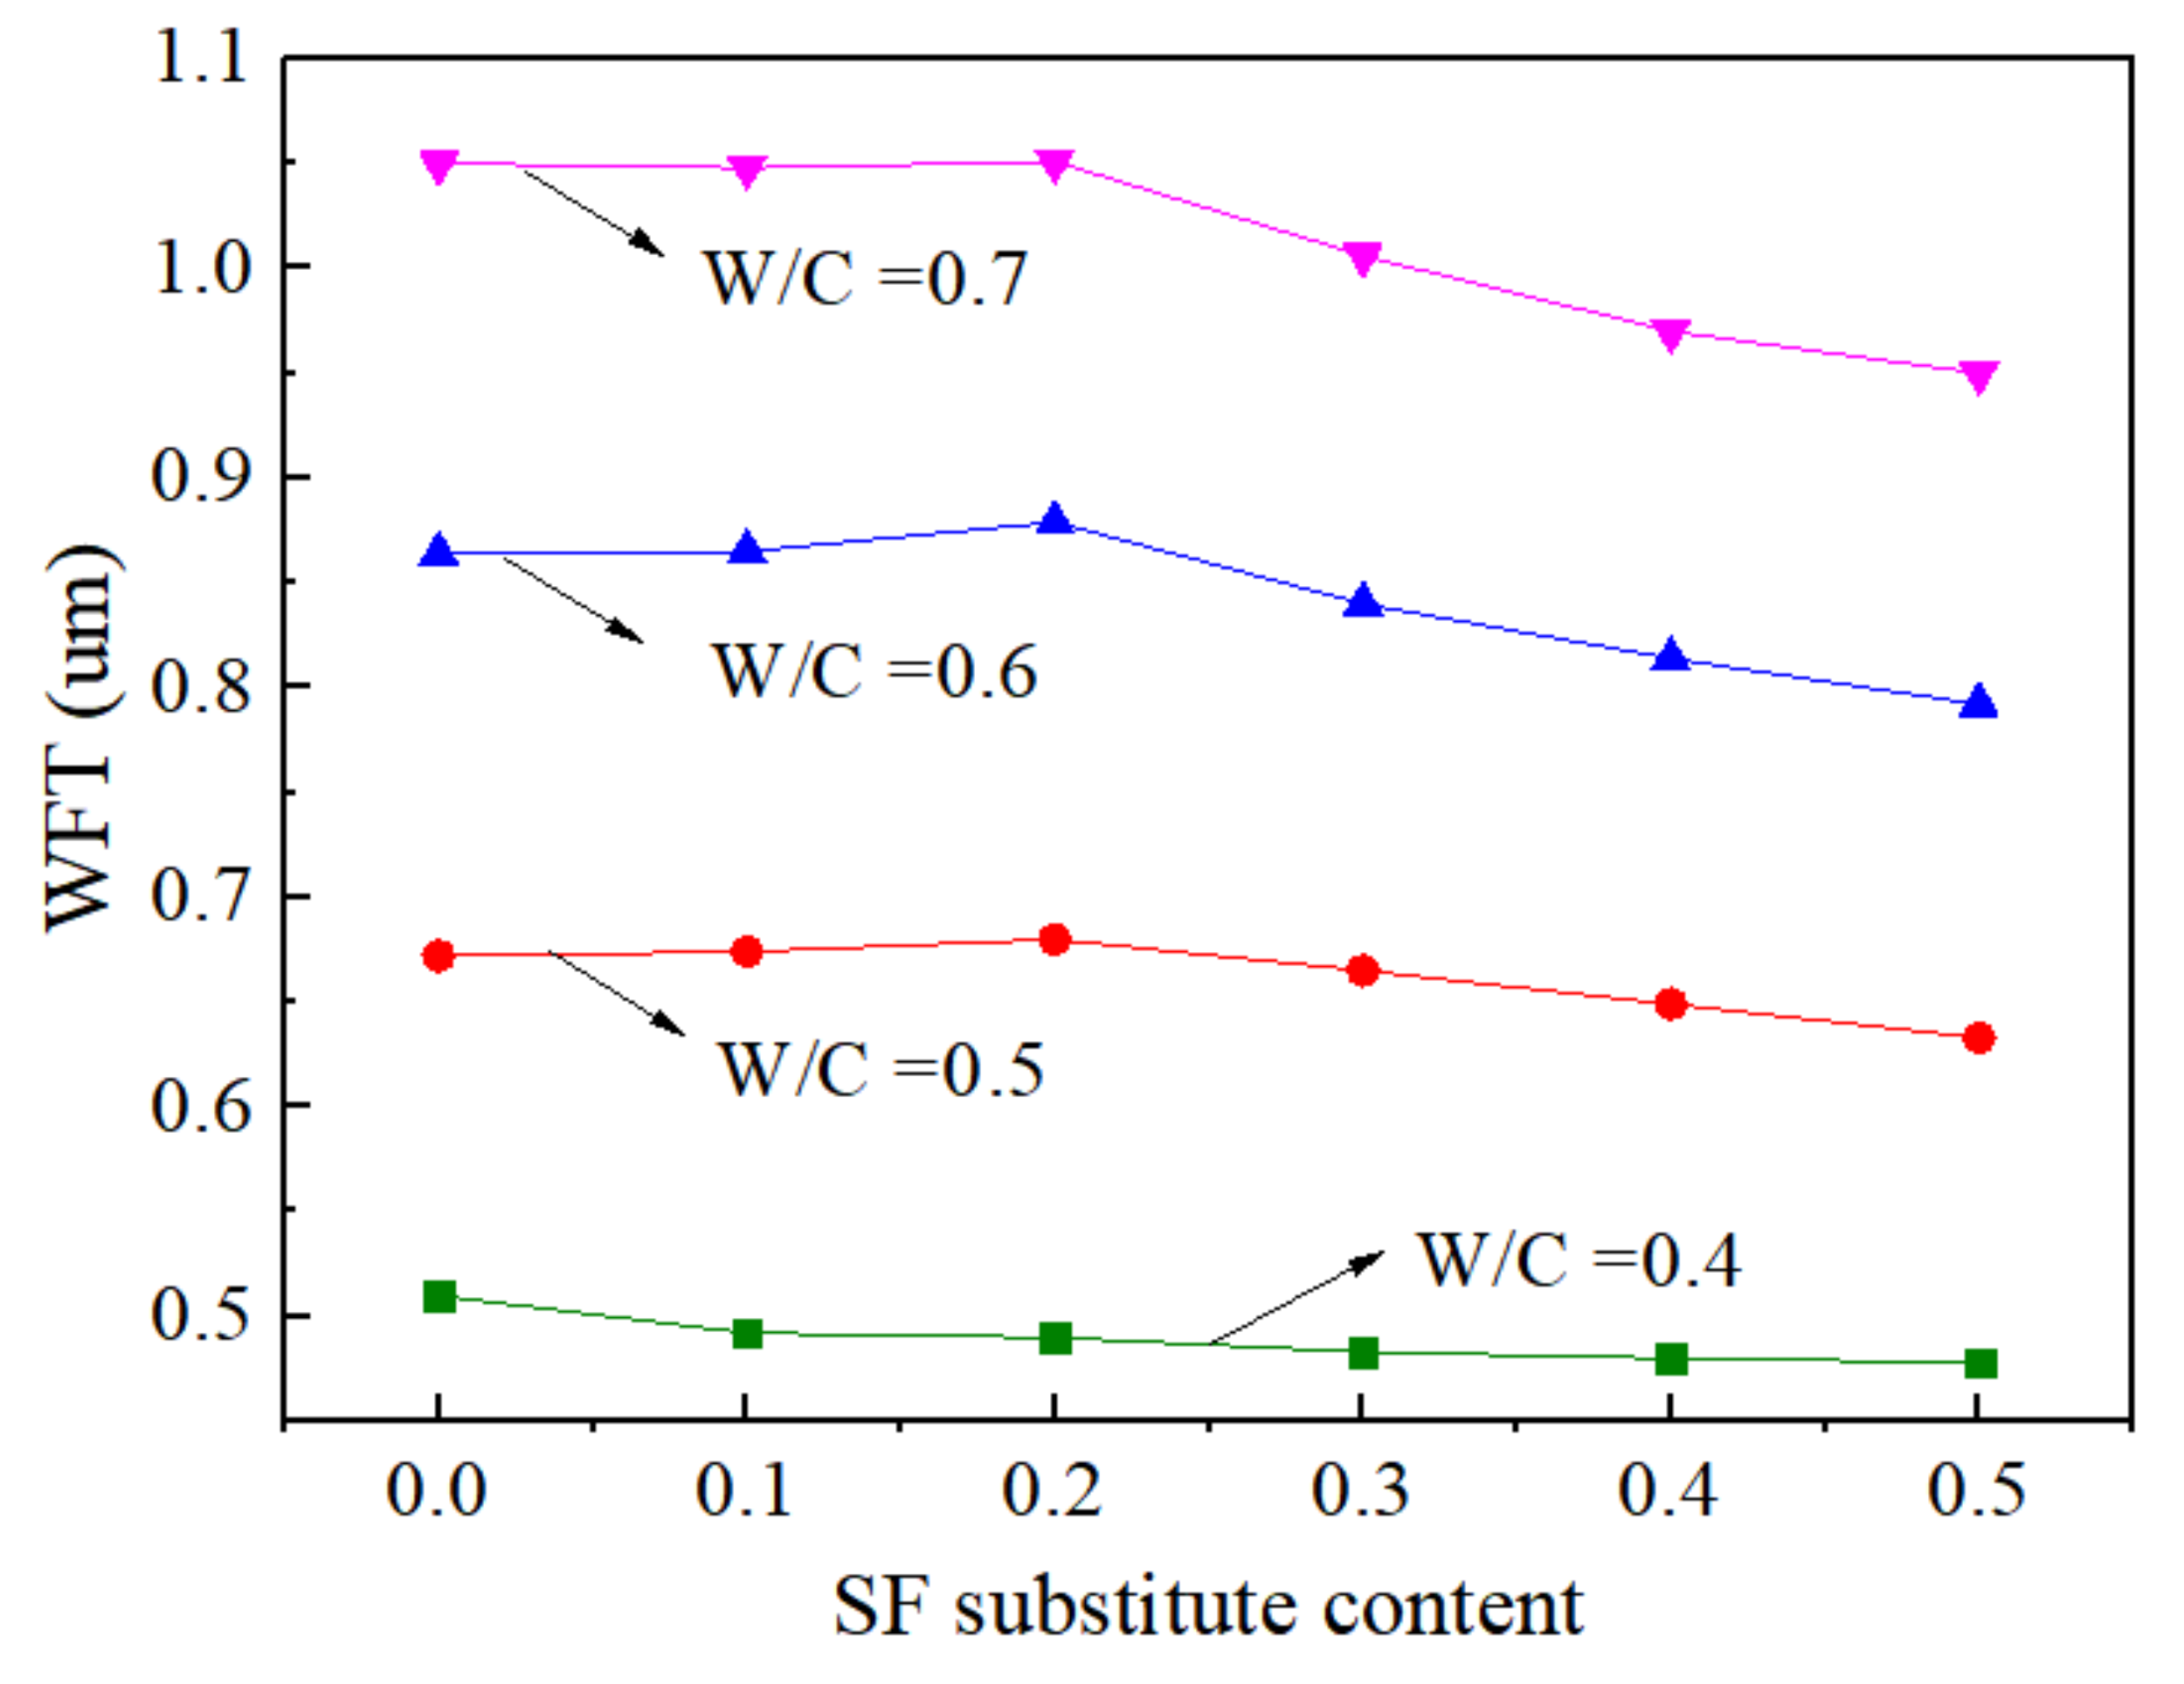
4.1. Water Film Thickness (WFT)
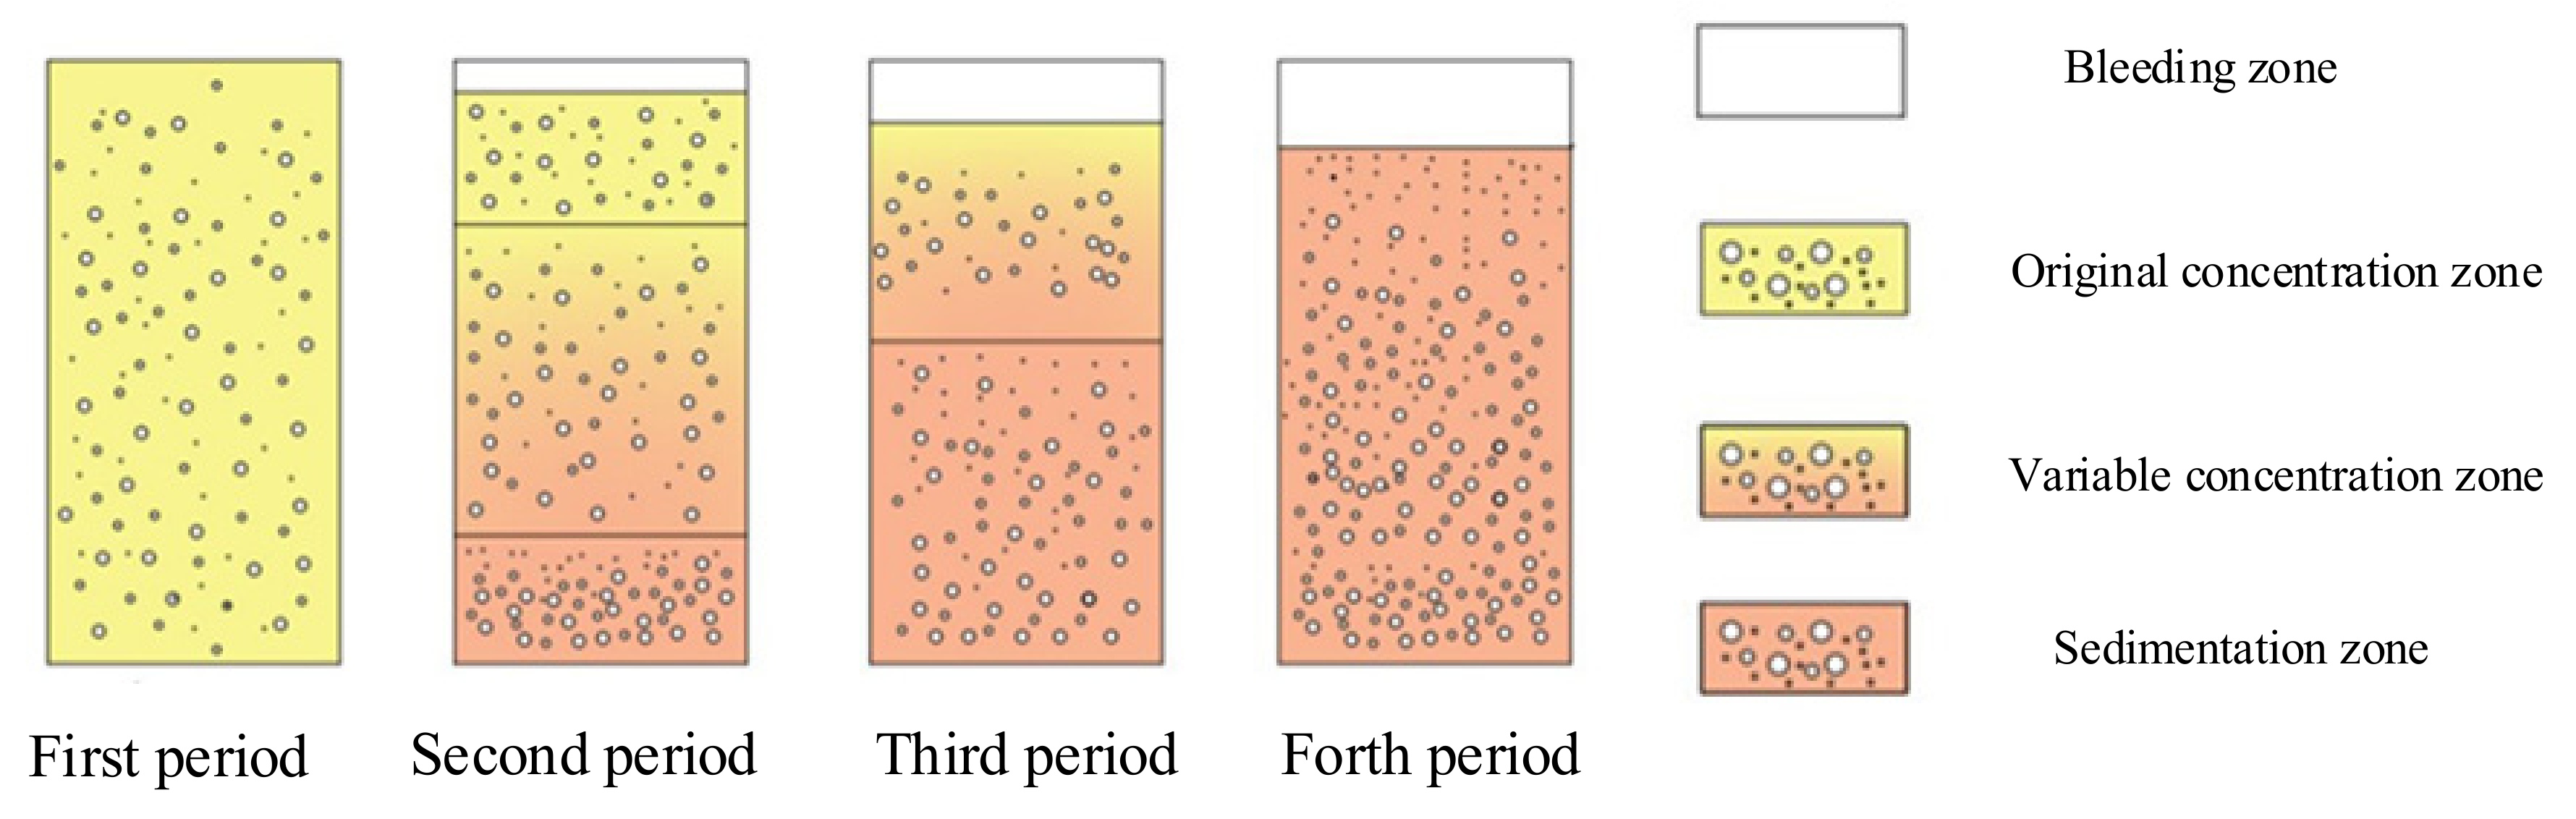
4.2. Bleeding Sedimentation Model
4.3. Microstructure
4.4. Heat of Hydration
5. Conclusions
- (1)
- The SF had different effects on the macro-fluidity and micro-rheological properties of cement paste under different w/c ratios. When the w/c ratio was 0.4, the addition of SF increased yield stress and plastic viscosity and decreased flow spread. The addition of SF increased the rheological parameters first and then decreased, and the corresponding fluidity first decreased and then increased at a w/c equal to 0.5 and 0.6. The effect of SF on rheological parameters was not significant, and the influence of SF on fluidity also had no obvious regularity when the w/c ratio was 0.7. The SF can effectively reduce the bleeding rate under different w/c ratios, which improved the stability of the cement paste.
- (2)
- The time-varying properties of cement paste containing SF had the following regularity: the yield stress–time curve exhibited a linear increase, and the function form was τ(t) = τ0 + k0t and τ(t) = τ1 + k1t. The plastic viscosity–time curve exhibited an exponential function increase, and the function form can be described as η(t) = η0eat. The fluidity–time curve can be regarded as a function composed of a linear function and a quadratic function, and the specific form was L(t) = L0 − k1t and L(t) = L0 − k1t − a1t2. The SF made the rheological parameters increase slowly and fluidity attenuation degree decreased at the initial stage, but the effect was significantly enhanced after entering the accelerated hydration period.
- (3)
- When the water–cement ratio was below a certain upper limit, WFT was an important factor affecting flow parameter and rheological parameters of cement paste. While WFT had no obvious correlation with flow parameter and rheological parameters at a w/c equal to 0.7.
- (4)
- The SF can effectively reduce the bleeding rate of cement paste. This was due to the low density and small particle size of SF, whose sedimentation rate was less than that of fly ash particles. In addition, the incorporation of SF effectively alleviated the internal particle agglomeration and flocculation.
- (5)
- An important reason for the time-varying changes of paste was that SF affected the hydration reaction. The hydration reaction of paste was slow during the induction period, and the rheological parameters and flow spread did not change significantly. After entering the acceleration period, due to the heterogeneous nucleation and dilution effect of SF, the hydration reaction was accelerated and more heat of hydration was released. The mass production of hydration products resulted in large changes in the rheology and fluidity of the paste.
- (6)
- The application of SF as a new type of mineral admixture in the field of grouting was promising and meaningful. The substitution of SF can reduce the amount of cement while meeting the properties required for grouting, which can save economic costs and protect the environment. In the future, the combined use of SF and superplasticizer can be further explored in the field of grouting.
Author Contributions
Funding
Institutional Review Board Statement
Informed Consent Statement
Data Availability Statement
Conflicts of Interest
References
- Abu-Khashaba, M.I.; Adam, I.; El-Ashaal, A. Investigating the possibility of constructing low cost roller compacted concrete dam. Alex. Eng. J. 2014, 53, 131–142. [Google Scholar] [CrossRef] [Green Version]
- Thang, N.C.; Tuan, N.V.; Yang, K.H.; Phung, Q.T. Effect of Zeolite on Shrinkage and Crack Resistance of High-Performance Cement-Based Concrete. Materials 2020, 13, 3773. [Google Scholar] [CrossRef]
- Khayat, K.H.; Meng, W.; Vallurupalli, K.; Teng, L. Rheological properties of ultra-high-performance concrete—An overview. Cem. Concr. Res. 2019, 124, 105828. [Google Scholar] [CrossRef]
- Sun, X.; Liu, H.; Tian, Z.; Ma, Y.; Wang, Z.; Fan, H. Feasibility and economic evaluation of grouting materials containing binary and ternary industrial waste. Constr. Build. Mater. 2021, 274, 122021. [Google Scholar] [CrossRef]
- Aziminezhad, M.; Mahdikhani, M.; Memarpour, M.M. RSM-based modeling and optimization of self-consolidating mortar to predict acceptable ranges of rheological properties. Constr. Build. Mater. 2018, 189, 1200–1213. [Google Scholar] [CrossRef]
- Lekkam, M.; Benmounah, A.; Kadri, E.-H.; Soualhi, H.; Kaci, A. Influence of saturated activated carbon on the rheological and mechanical properties of cementitious materials. Constr. Build. Mater. 2019, 198, 411–422. [Google Scholar] [CrossRef]
- Salhi, M.; Ghrici, M.; Bilir, T.; Uysal, M. Combined effect of temperature and time on the flow properties of self-compacting concrete. Constr. Build. Mater. 2020, 240, 117914. [Google Scholar] [CrossRef]
- Lehner, P.; Ghosh, P.; Konečný, P. Statistical analysis of time dependent variation of diffusion coefficient for various binary and ternary based concrete mixtures. Constr. Build. Mater. 2018, 183, 75–87. [Google Scholar] [CrossRef]
- Kermeli, K.; Edelenbosch, O.Y.; Crijns-Graus, W.; van Ruijven, B.J.; Mima, S.; van Vuuren, D.P.; Worrell, E. The scope for better industry representation in long-term energy models: Modeling the cement industry. Appl. Energy 2019, 240, 964–985. [Google Scholar] [CrossRef] [Green Version]
- Zhang, S.; Worrell, E.; Crijns-Graus, W. Evaluating co-benefits of energy efficiency and air pollution abatement in China’s cement industry. Appl. Energy 2015, 147, 192–213. [Google Scholar] [CrossRef]
- Tawfik, T.A.; Aly Metwally, K.; El-Beshlawy, S.A.; Al Saffar, D.M.; Tayeh, B.A.; Soltan Hassan, H. Exploitation of the nanowaste ceramic incorporated with nano silica to improve concrete properties. J. King Saud Univ. Eng. Sci. 2021, 33, 581–588. [Google Scholar] [CrossRef]
- Hamada, H.M.; Al-attar, A.A.; Yahaya, F.M.; Muthusamy, K.; Tayeh, B.A.; Humada, A.M. Effect of high-volume ultrafine palm oil fuel ash on the engineering and transport properties of concrete. Case Stud. Constr. Mater. 2020, 12, e00318. [Google Scholar] [CrossRef]
- Faried, A.S.; Mostafa, S.A.; Tayeh, B.A.; Tawfik, T.A. The effect of using nano rice husk ash of different burning degrees on ultra-high-performance concrete properties. Constr. Build. Mater. 2021, 290, 123279. [Google Scholar] [CrossRef]
- Tawfik, T.A.; AlSaffar, D.M.; Tayeh, B.A.; Metwally, K.A.; ElKattan, I.M. Role of expanded clay aggregate, metakaolin and silica fume on the of modified lightweight concrete properties. Geosystem Eng. 2021, 24, 145–156. [Google Scholar] [CrossRef]
- Alaloul, W.S.; Musarat, M.A.; Haruna, S.; Law, K.; Tayeh, B.A.; Rafiq, W.; Ayub, S. Mechanical Properties of Silica Fume Modified High-Volume Fly Ash Rubberized Self-Compacting Concrete. Sustainability 2021, 13, 5571. [Google Scholar] [CrossRef]
- Liao, W.; Kumar, A.; Khayat, K.; Ma, H. Multifunctional Lightweight Aggregate Containing Phase Change Material and Water for Damage Mitigation of Concrete. ES Mater. Manuf. 2019, 6, 49–61. [Google Scholar] [CrossRef]
- Liao, W.; Sun, X.; Kumar, A.; Sun, H.; Ma, H. Hydration of Binary Portland Cement Blends Containing Silica Fume: A Decoupling Method to Estimate Degrees of Hydration and Pozzolanic Reaction. Front. Mater. 2019, 6, 78. [Google Scholar] [CrossRef]
- Sahoo, S.; Parhi, P.K.; Chandra Panda, B. Durability properties of concrete with silica fume and rice husk ash. Clean. Eng. Technol. 2021, 2, 100067. [Google Scholar] [CrossRef]
- Shariati, M.; Shariati, A.; Trung, N.T.; Shoaei, P.; Ameri, F.; Bahrami, N.; Zamanabadi, S.N. Alkali-activated slag (AAS) paste: Correlation between durability and microstructural characteristics. Constr. Build. Mater. 2021, 267, 120886. [Google Scholar] [CrossRef]
- Dai, X.; Aydın, S.; Yardımcı, M.Y.; Lesage, K.; De Schutter, G. Rheology and microstructure of alkali-activated slag cements produced with silica fume activator. Cem. Concr. Compos. 2022, 125, 104303. [Google Scholar] [CrossRef]
- Liang, G.; Zhu, H.; Li, H.; Liu, T.; Guo, H. Comparative study on the effects of rice husk ash and silica fume on the freezing resistance of metakaolin-based geopolymer. Constr. Build. Mater. 2021, 293, 123486. [Google Scholar] [CrossRef]
- Rao, G.A. Investigations on the performance of silica fume-incorporated cement pastes and mortars. Cem. Concr. Res. 2003, 33, 1765–1770. [Google Scholar] [CrossRef]
- Kumar, A.; Kumar, R.; Das, V.; Jhatial, A.A.; Ali, T.H. Assessing the structural efficiency and durability of burnt clay bricks incorporating fly ash and silica fume as additives. Constr. Build. Mater. 2021, 310, 125233. [Google Scholar] [CrossRef]
- Zhang, S.; Cao, K.; Wang, C.; Wang, X.; Wang, J.; Sun, B. Effect of silica fume and waste marble powder on the mechanical and durability properties of cellular concrete. Constr. Build. Mater. 2020, 241, 117980. [Google Scholar] [CrossRef]
- Nili, M.; Ramezanianpour, A.A.; Sobhani, J. Evaluation of the effects of silica fume and air-entrainment on deicer salt scaling resistance of concrete pavements: Microstructural study and modeling. Constr. Build. Mater. 2021, 308, 124972. [Google Scholar] [CrossRef]
- Jeong, Y.; Kang, S.-H.; Kim, M.O.; Moon, J. Acceleration of cement hydration from supplementary cementitious materials: Performance comparison between silica fume and hydrophobic silica. Cem. Concr. Compos. 2020, 112, 103688. [Google Scholar] [CrossRef]
- Ni, C.; Wu, Q.; Yu, Z.; Shen, X. Hydration of Portland cement paste mixed with densified silica fume: From the point of view of fineness. Constr. Build. Mater. 2021, 272, 121906. [Google Scholar] [CrossRef]
- Wang, X.; Hou, P.; Yu, J.; Zhou, X.; Cheng, X. The effects of silica fume on C3A hydration. Constr. Build. Mater. 2020, 250, 118766. [Google Scholar] [CrossRef]
- Hajime Okamura, M.O. Self-Compacting Concrete. J. Adv. Concr. Technol. 2003, 1, 5–15. [Google Scholar] [CrossRef]
- Han, K.; Xiao, J.; Zhang, Z.; Wang, J.; Hu, X. Effect of particle size distribution on flocculation and its growth in cement-ground limestone suspensions. Constr. Build. Mater. 2020, 262, 120047. [Google Scholar] [CrossRef]
- Kwan, A.K.H.; Wong, H.H.C. Packing density of cementitious materials: Part 2—Packing and flow of OPC + PFA + CSF. Mater. Struct. 2007, 41, 773–784. [Google Scholar] [CrossRef]
- Wong, H.H.C.; Kwan, A.K.H. Packing density of cementitious materials: Part 1—Measurement using a wet packing method. Mater. Struct. 2007, 41, 689–701. [Google Scholar] [CrossRef]
- Wang, A.; Zhang, C.; Sun, W. Fly ash effects: I. The morphological effect of fly ash. Cem. Concr. Res. 2003, 33, 2023–2029. [Google Scholar] [CrossRef]
- Flatt, R.J.; Bowen, P. Yodel: A Yield Stress Model for Suspensions. J. Am. Ceram. Soc. 2006, 89, 1244–1256. [Google Scholar] [CrossRef]
- Kuder, K.G.; Ozyurt, N.; Mu, E.B.; Shah, S.P. Rheology of fiber-reinforced cementitious materials. Cem. Concr. Res. 2007, 37, 191–199. [Google Scholar] [CrossRef]
- Liu, H.; Tian, Z.; Sun, X.; Fan, H. Study on the Grouting Properties of Multi-Mineral Cement Paste. IOP Conf. Series: Earth Environ. Sci. 2021, 719, 022067. [Google Scholar] [CrossRef]
- Peng, Y.; Lauten, R.A.; Reknes, K.; Jacobsen, S. Bleeding and sedimentation of cement paste measured by hydrostatic pressure and Turbiscan. Cem. Concr. Compos. 2017, 76, 25–38. [Google Scholar] [CrossRef]
- Chen, J.J.; Fung, W.W.S.; Kwan, A.K.H. Effects of CSF on strength, rheology and cohesiveness of cement paste. Constr. Build. Mater. 2012, 35, 979–987. [Google Scholar] [CrossRef]
- Perrot, A.; Lecompte, T.; Khelifi, H.; Brumaud, C.; Hot, J.; Roussel, N. Yield stress and bleeding of fresh cement pastes. Cem. Concr. Res. 2012, 42, 937–944. [Google Scholar] [CrossRef]
- Liu, H.; Sun, X.; Du, H.; Lu, H.; Ma, Y.; Shen, W.; Tian, Z. Effects and threshold of water film thickness on multi-mineral cement paste. Cem. Concr. Compos. 2020, 112, 103677. [Google Scholar] [CrossRef]
- Lu, H. Cement Slurry Sedimentation Stability and Development and Application of Anti-Sedimentation Agent. Adv. Fine Petrochem. 2016, 17, 11–14. [Google Scholar]
- Yang, J. Analysis of shape factor of rockfill material. Yangtze River 2015, 46, 65–68. [Google Scholar]
- Fung, W.W.S.; Kwan, A.K.H. Role of water film thickness in rheology of CSF mortar. Cem. Concr. Compos. 2010, 32, 255–264. [Google Scholar] [CrossRef]


| Phase | Mass Percentage (%) | ||
|---|---|---|---|
| OPC | FA | SF | |
| SiO2 | 13.9 | 44.88 | 95.13 |
| Al2O3 | 3.052 | 39.71 | 0 |
| Fe2O3 | 4.801 | 3.69 | 0.71 |
| CaO | 72.374 | 5.48 | 2.16 |
| MgO | 1.075 | 0.60 | 0 |
| Na2O | 0.155 | 0.24 | 0.91 |
| SO3 | 2.628 | 0.55 | 0.03 |
| K2O | 0.970 | 1.70 | 0.02 |
| P2O5 | 0.228 | 0.52 | 0.14 |
| TiO2 | 0.350 | 2.42 | 0 |
| MnO | 0.300 | 0.01 | 0 |
| ZrO2 | 0.019 | 0.11 | 0.03 |
| SrO | 0.105 | 0.07 | 0.044 |
| Cl | 0.022 | 0.02 | 0.87 |
| Sample Code | Cement/% | Fly Ash/% | SF/% | w/c Ratio |
|---|---|---|---|---|
| A1 | 50 | 50 | 0 | 0.4/0.5/0.6/0.7 |
| A2 | 40 | 10 | ||
| A3 | 30 | 20 | ||
| A4 | 20 | 30 | ||
| A5 | 10 | 40 | ||
| A6 | 0 | 50 |
| w/c Ratio | Sample Code | Fitting Equation (First Period) | Fitting Equation (Second Period) |
|---|---|---|---|
| 0.4 | A1 | / | |
| A2 | / | ||
| A3 | / | ||
| A4 | / | ||
| A5 | / | ||
| A6 | / | ||
| 0.5 | A1 | ||
| A2 | |||
| A3 | |||
| A4 | |||
| A5 | |||
| A6 | |||
| 0.6 | A1 | ||
| A2 | |||
| A3 | |||
| A4 | |||
| A5 | |||
| A6 |
| w/c Ratio | Sample Code | Fitting Equation | R2 |
|---|---|---|---|
| 0.4 | A1 | 0.968 | |
| A2 | 0.9729 | ||
| A3 | 0.9651 | ||
| A4 | 0.948 | ||
| A5 | 0.9863 | ||
| A6 | 0.9649 | ||
| 0.5 | A1 | 0.9048 | |
| A2 | 0.9386 | ||
| A3 | 0.947 | ||
| A4 | 0.9124 | ||
| A5 | 0.9379 | ||
| A6 | 0.9526 | ||
| 0.6 | A1 | 0.9136 | |
| A2 | 0.945 | ||
| A3 | 0.9322 | ||
| A4 | 0.9848 | ||
| A5 | 0.9542 | ||
| A6 | 0.9858 |
| w/c Ratio | Sample Code | Fitting Equation (First Period) | Fitting Equation (Second Period) |
|---|---|---|---|
| 0.4 | A1 | / | |
| A2 | / | ||
| A3 | / | ||
| A4 | / | ||
| A5 | / | ||
| A6 | / | ||
| 0.5 | A1 | ||
| A2 | |||
| A3 | |||
| A4 | |||
| A5 | |||
| A6 | |||
| 0.6 | A1 | ||
| A2 | |||
| A3 | |||
| A4 | |||
| A5 | |||
| A6 |
Publisher’s Note: MDPI stays neutral with regard to jurisdictional claims in published maps and institutional affiliations. |
© 2021 by the authors. Licensee MDPI, Basel, Switzerland. This article is an open access article distributed under the terms and conditions of the Creative Commons Attribution (CC BY) license (https://creativecommons.org/licenses/by/4.0/).
Share and Cite
Liu, H.; Sun, X.; Wang, Y.; Lu, X.; Du, H.; Tian, Z. Study on the Influence of Silica Fume (SF) on the Rheology, Fluidity, Stability, Time-Varying Characteristics, and Mechanism of Cement Paste. Materials 2022, 15, 90. https://doi.org/10.3390/ma15010090
Liu H, Sun X, Wang Y, Lu X, Du H, Tian Z. Study on the Influence of Silica Fume (SF) on the Rheology, Fluidity, Stability, Time-Varying Characteristics, and Mechanism of Cement Paste. Materials. 2022; 15(1):90. https://doi.org/10.3390/ma15010090
Chicago/Turabian StyleLiu, Hengrui, Xiao Sun, Yao Wang, Xueying Lu, Hui Du, and Zhenghong Tian. 2022. "Study on the Influence of Silica Fume (SF) on the Rheology, Fluidity, Stability, Time-Varying Characteristics, and Mechanism of Cement Paste" Materials 15, no. 1: 90. https://doi.org/10.3390/ma15010090