
Investigation on Strain Hardening and Failure in Notched Tension Specimens of Cold Rolled Ti6Al4V Titanium Alloy


Abstract
:1. Introduction
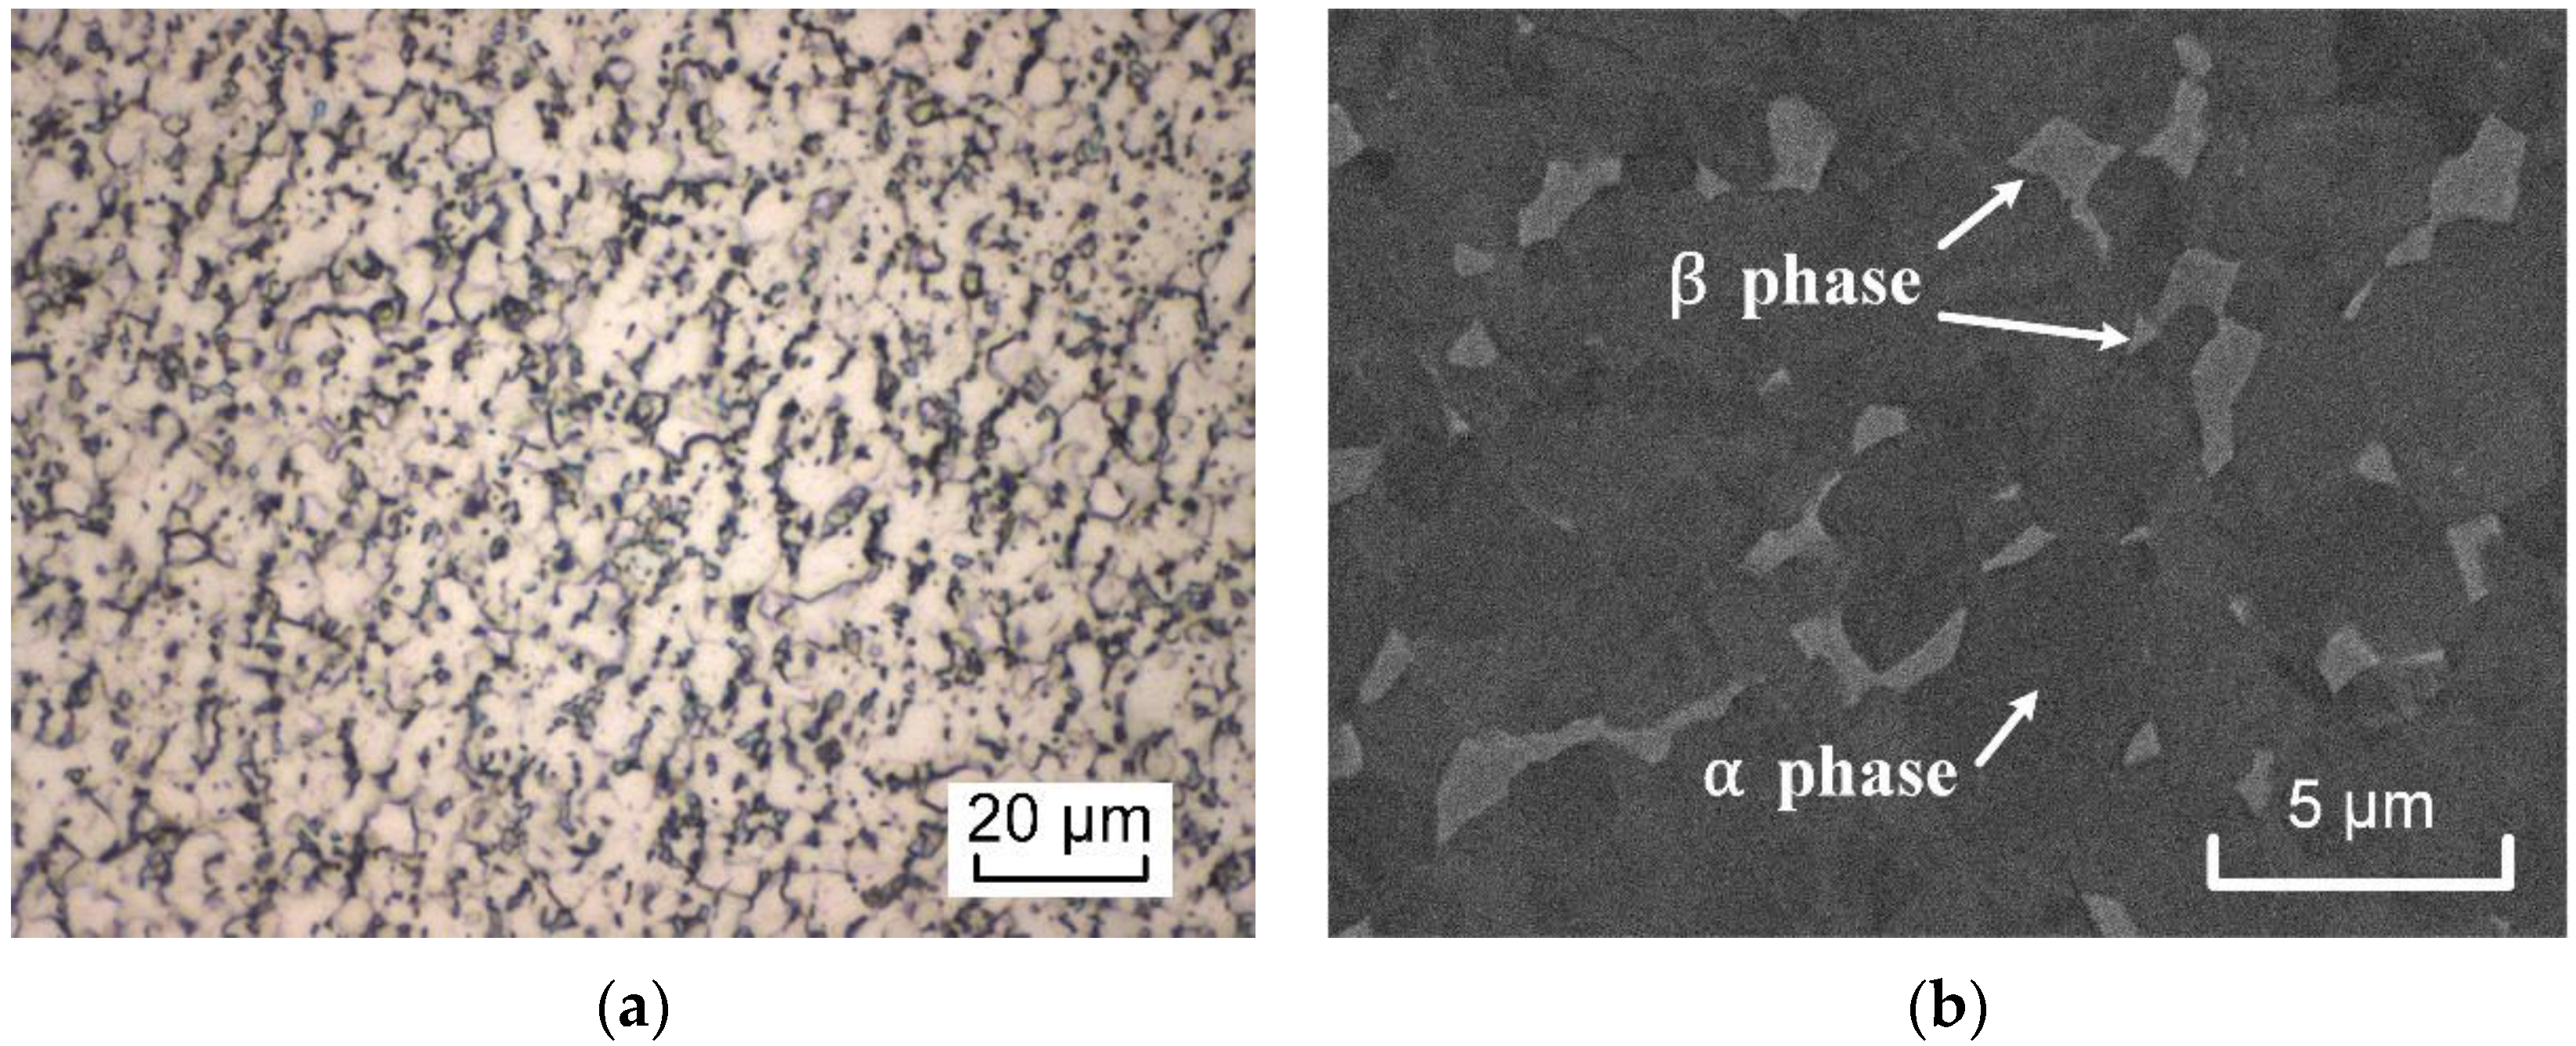
2. Materials and Methods
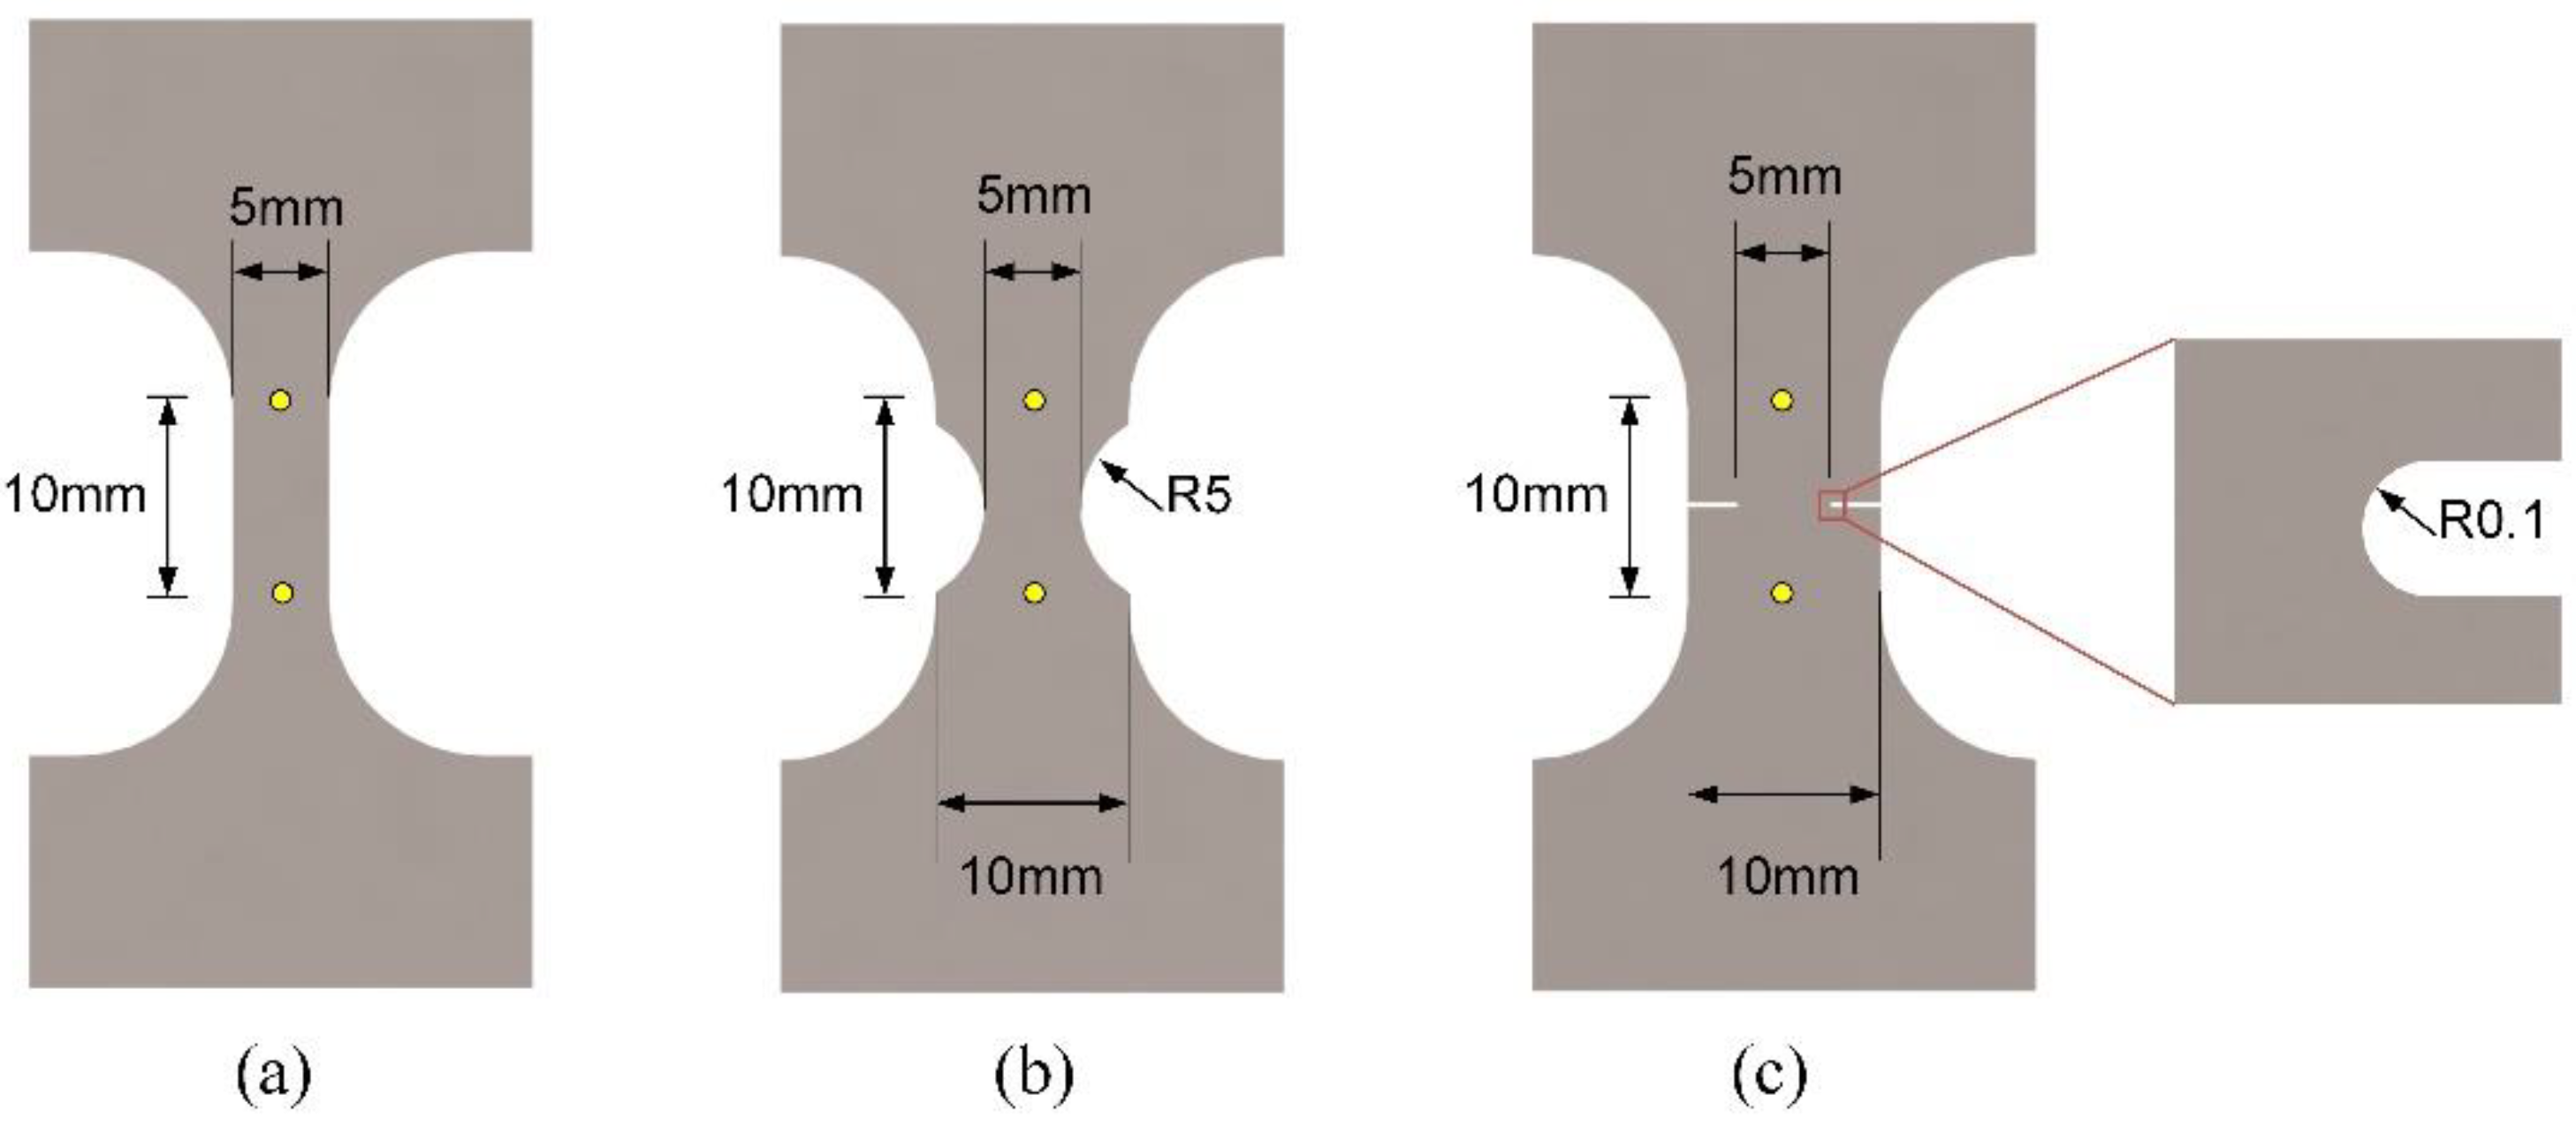
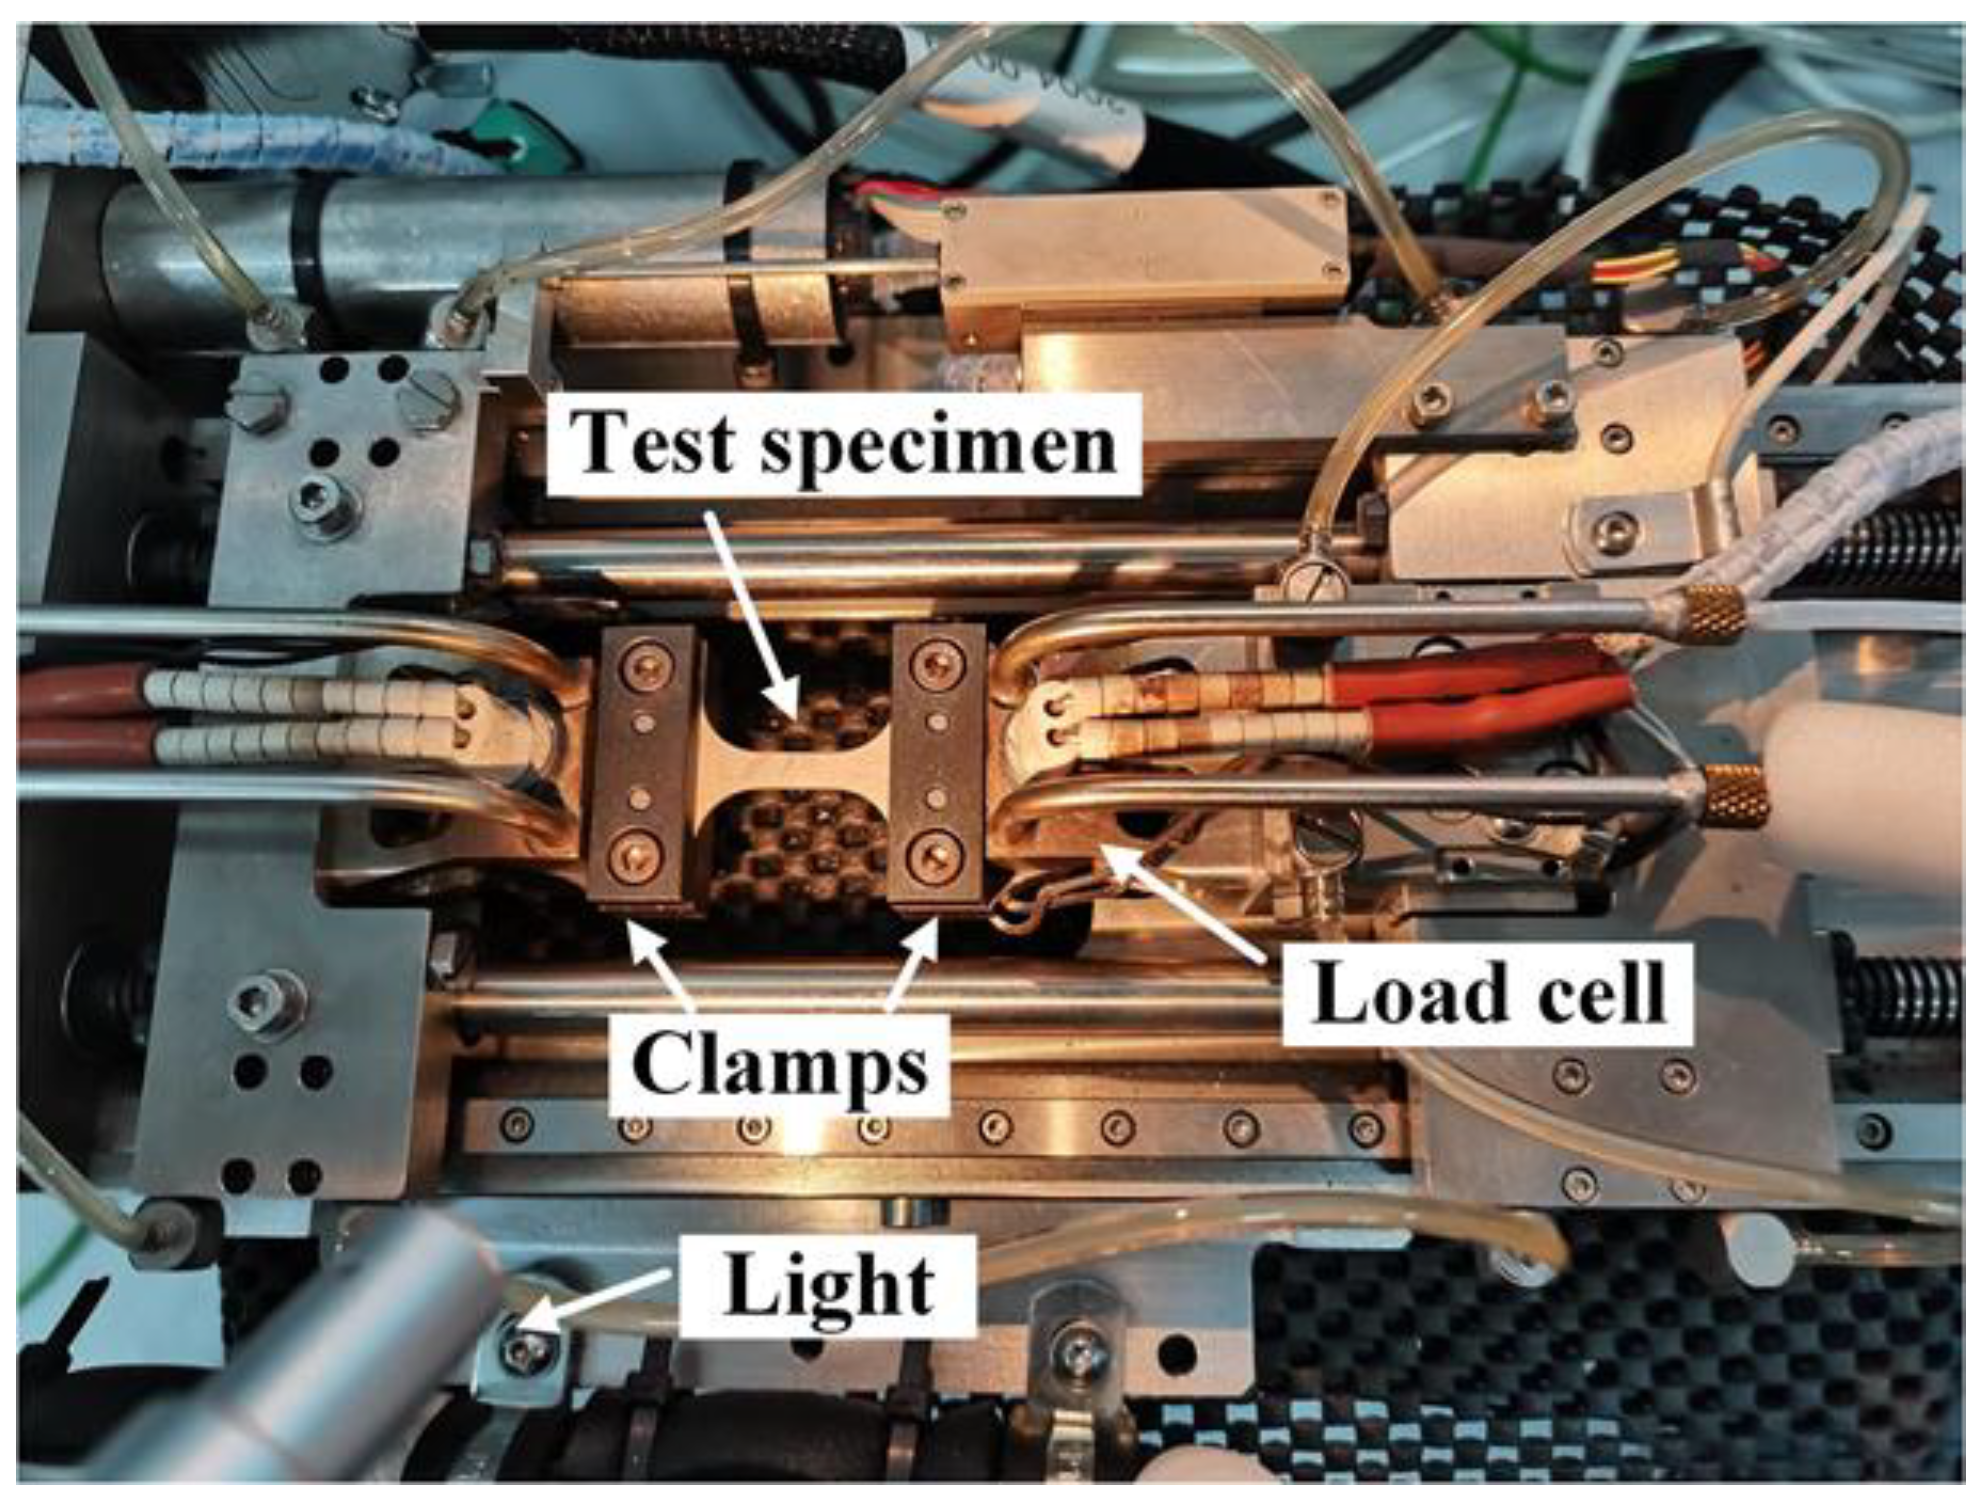
2.1. Experimental Specimen and Setup
2.2. Experimental Procedure
3. Results
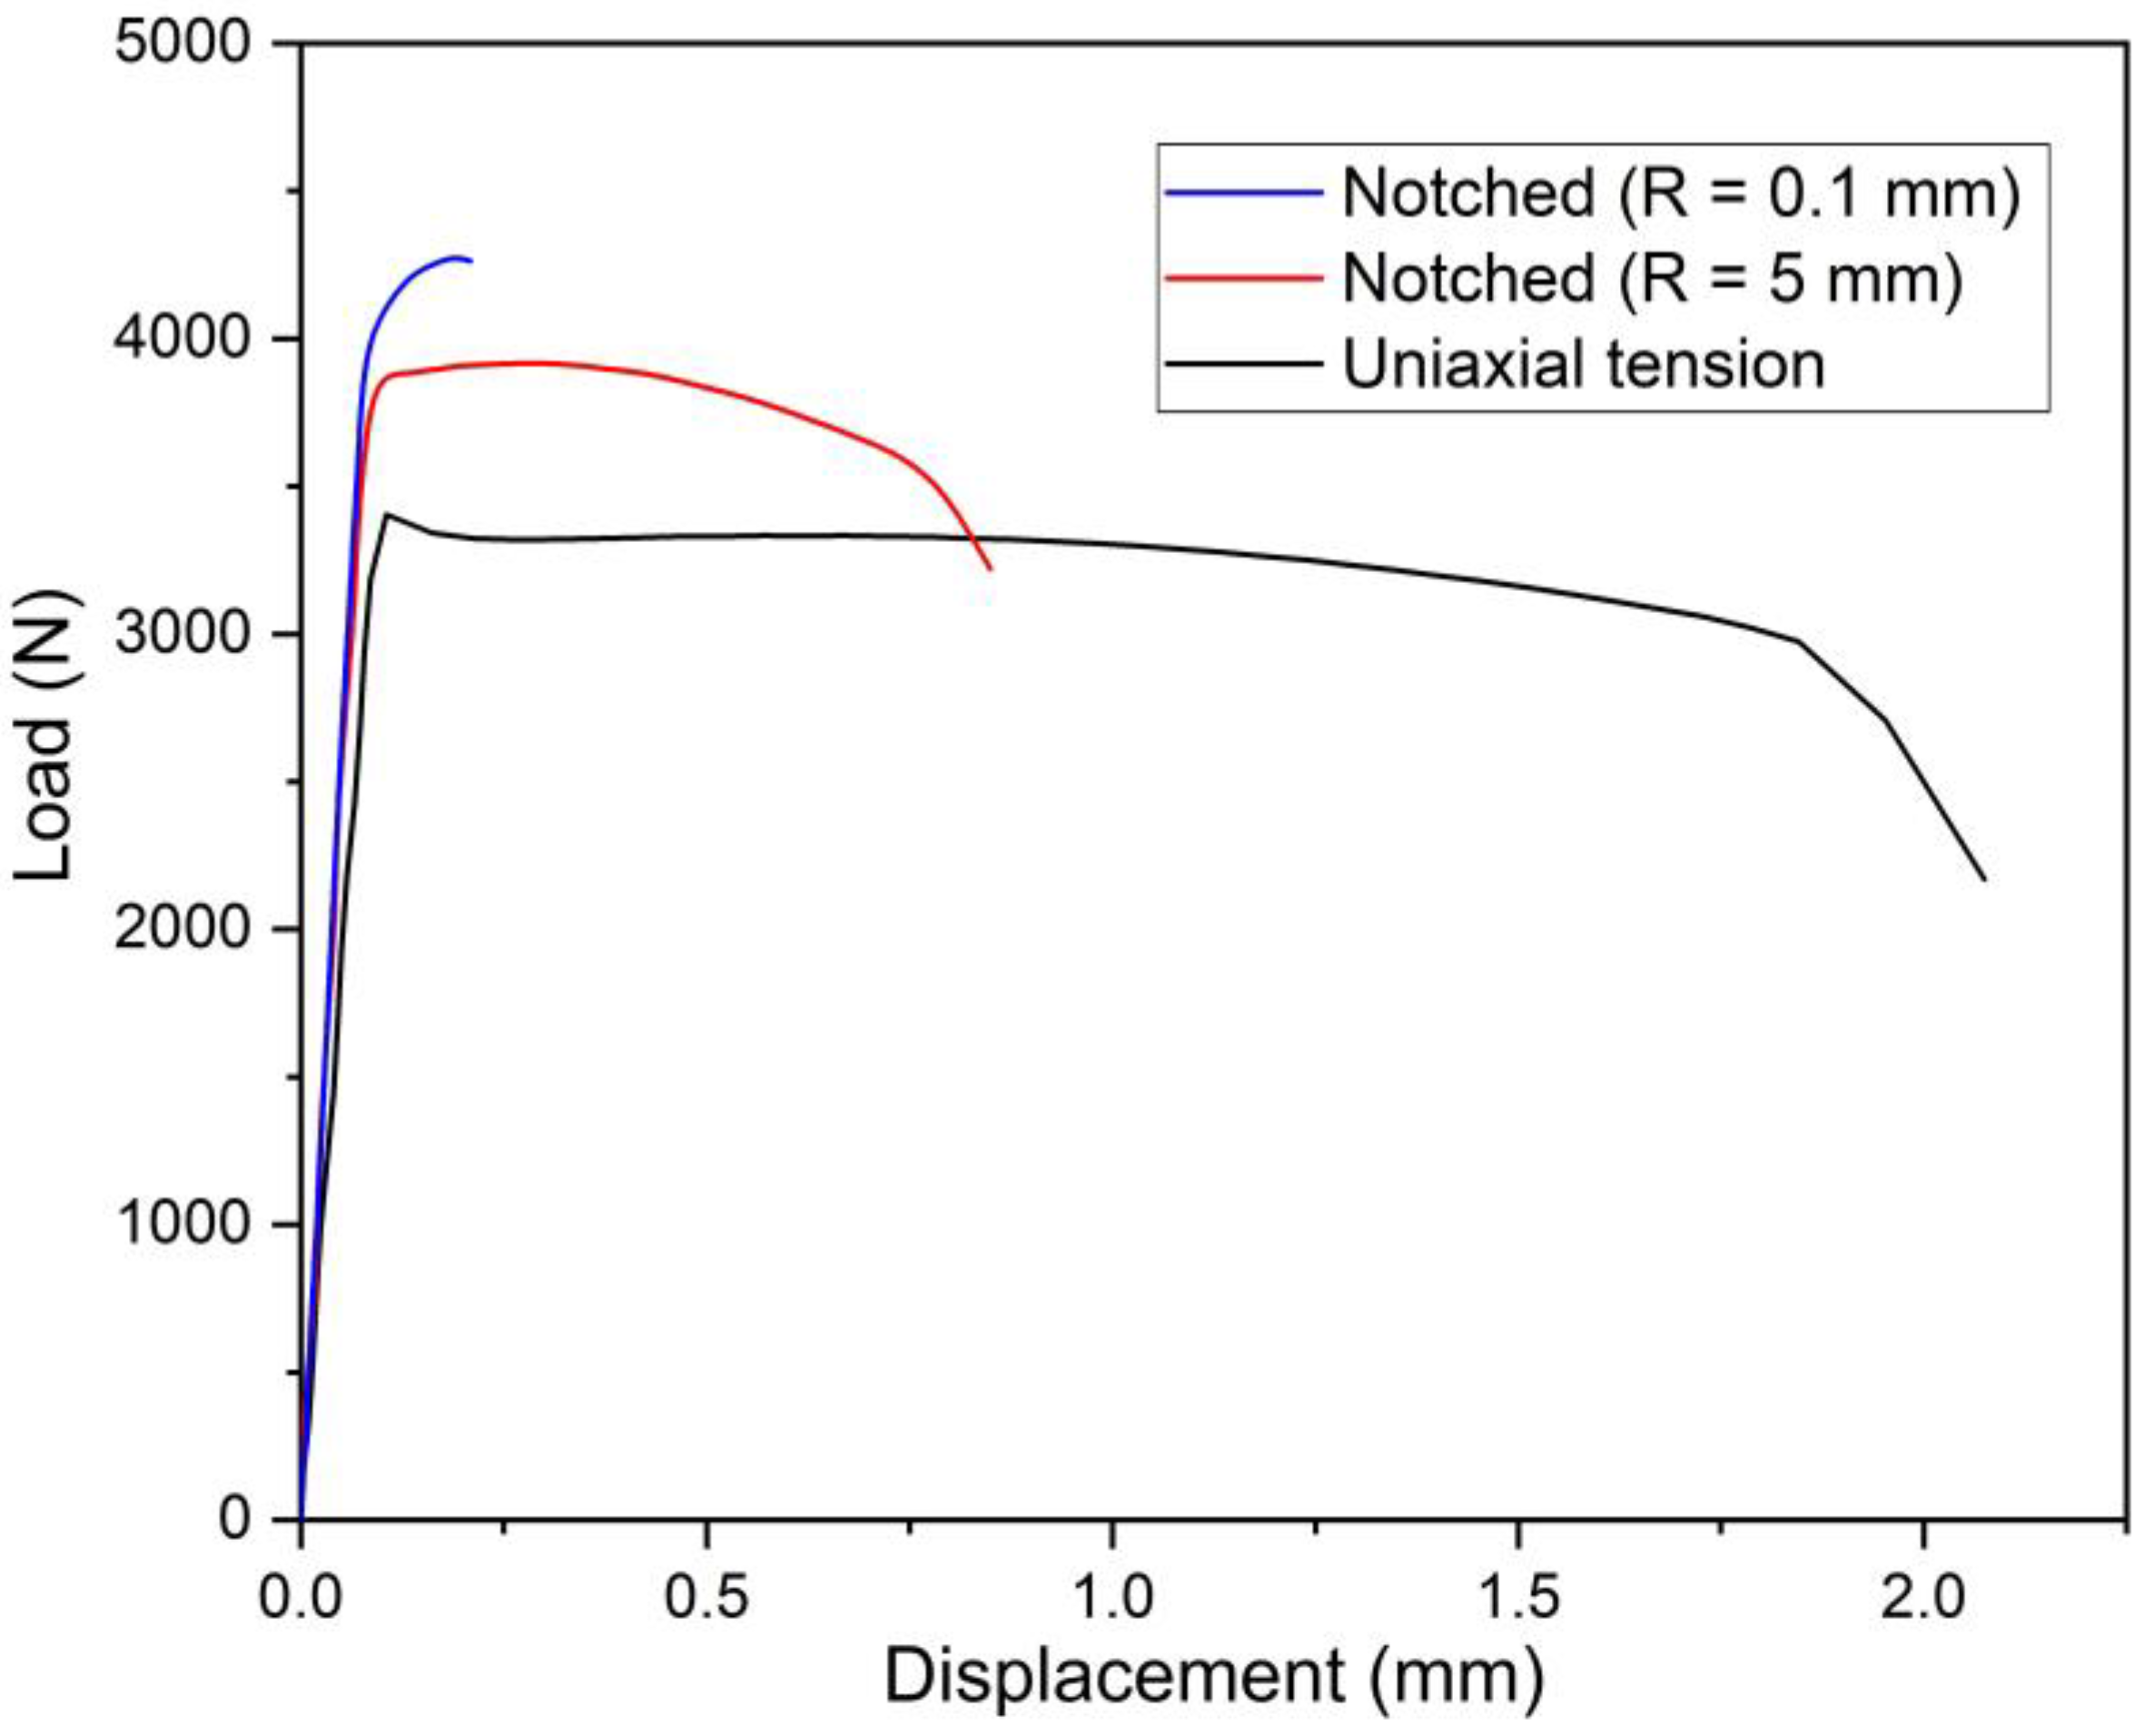
3.1. Loading Curves
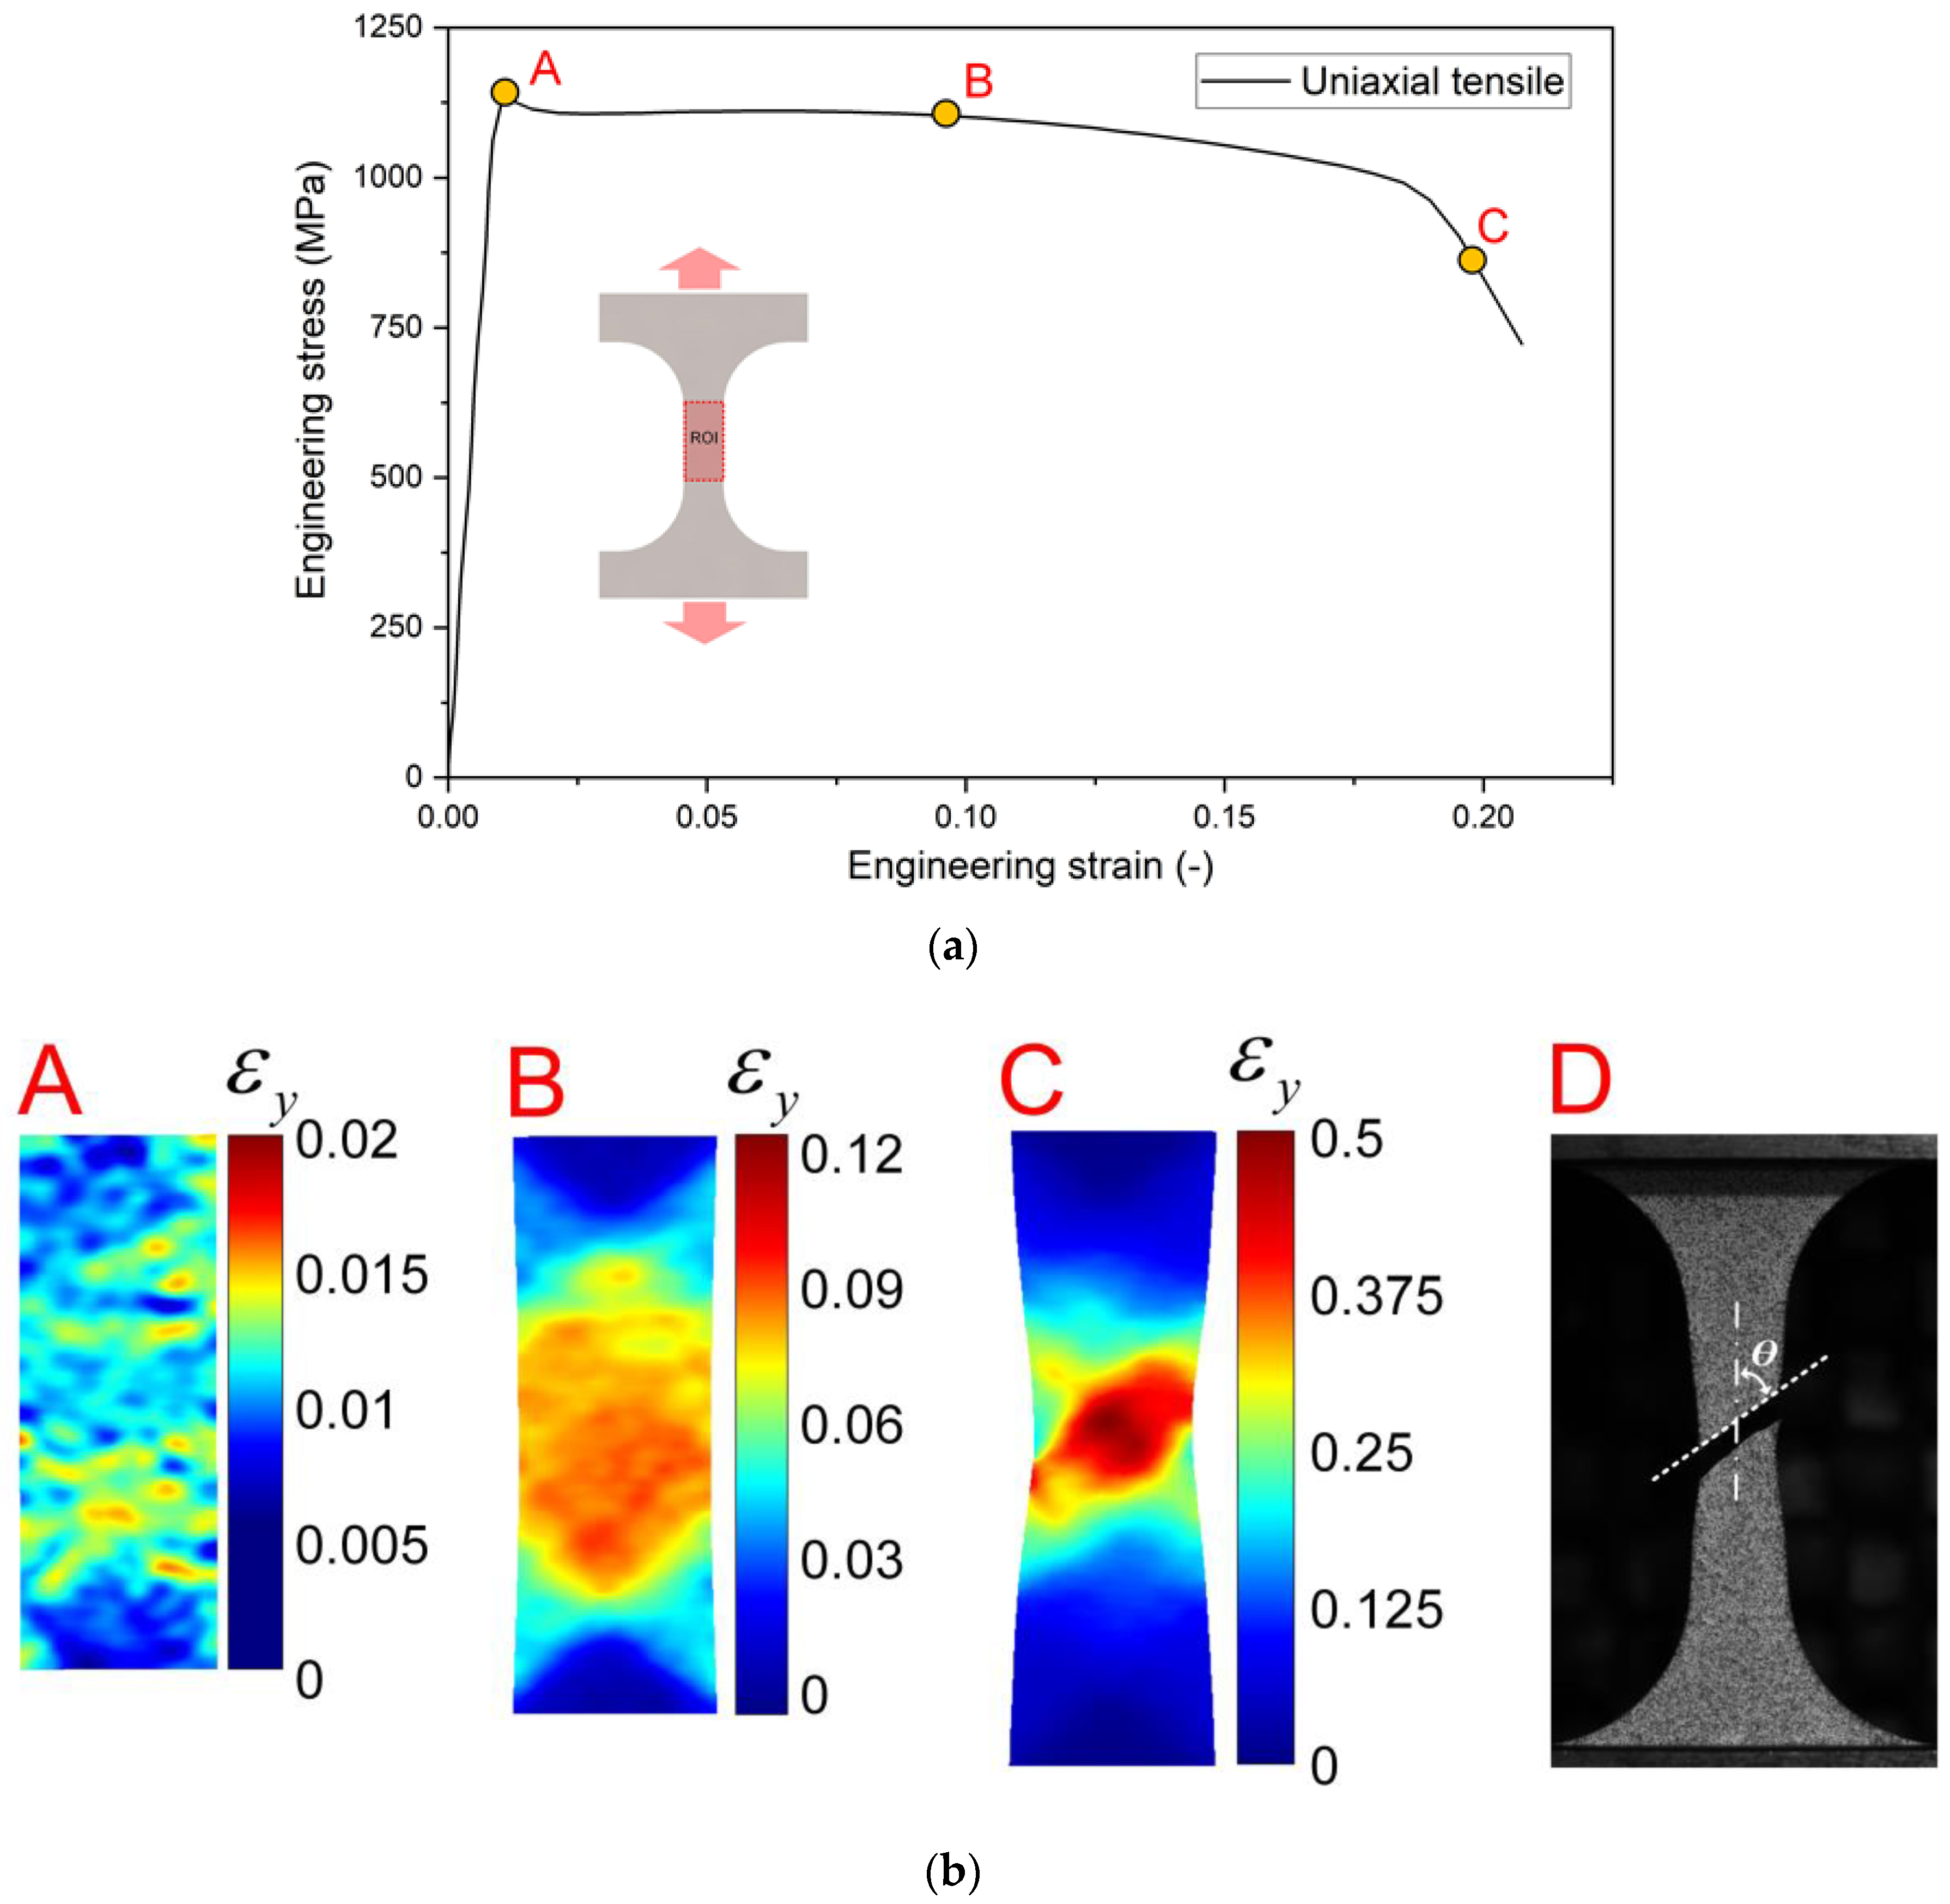
3.2. Uniaxial Tensile Test
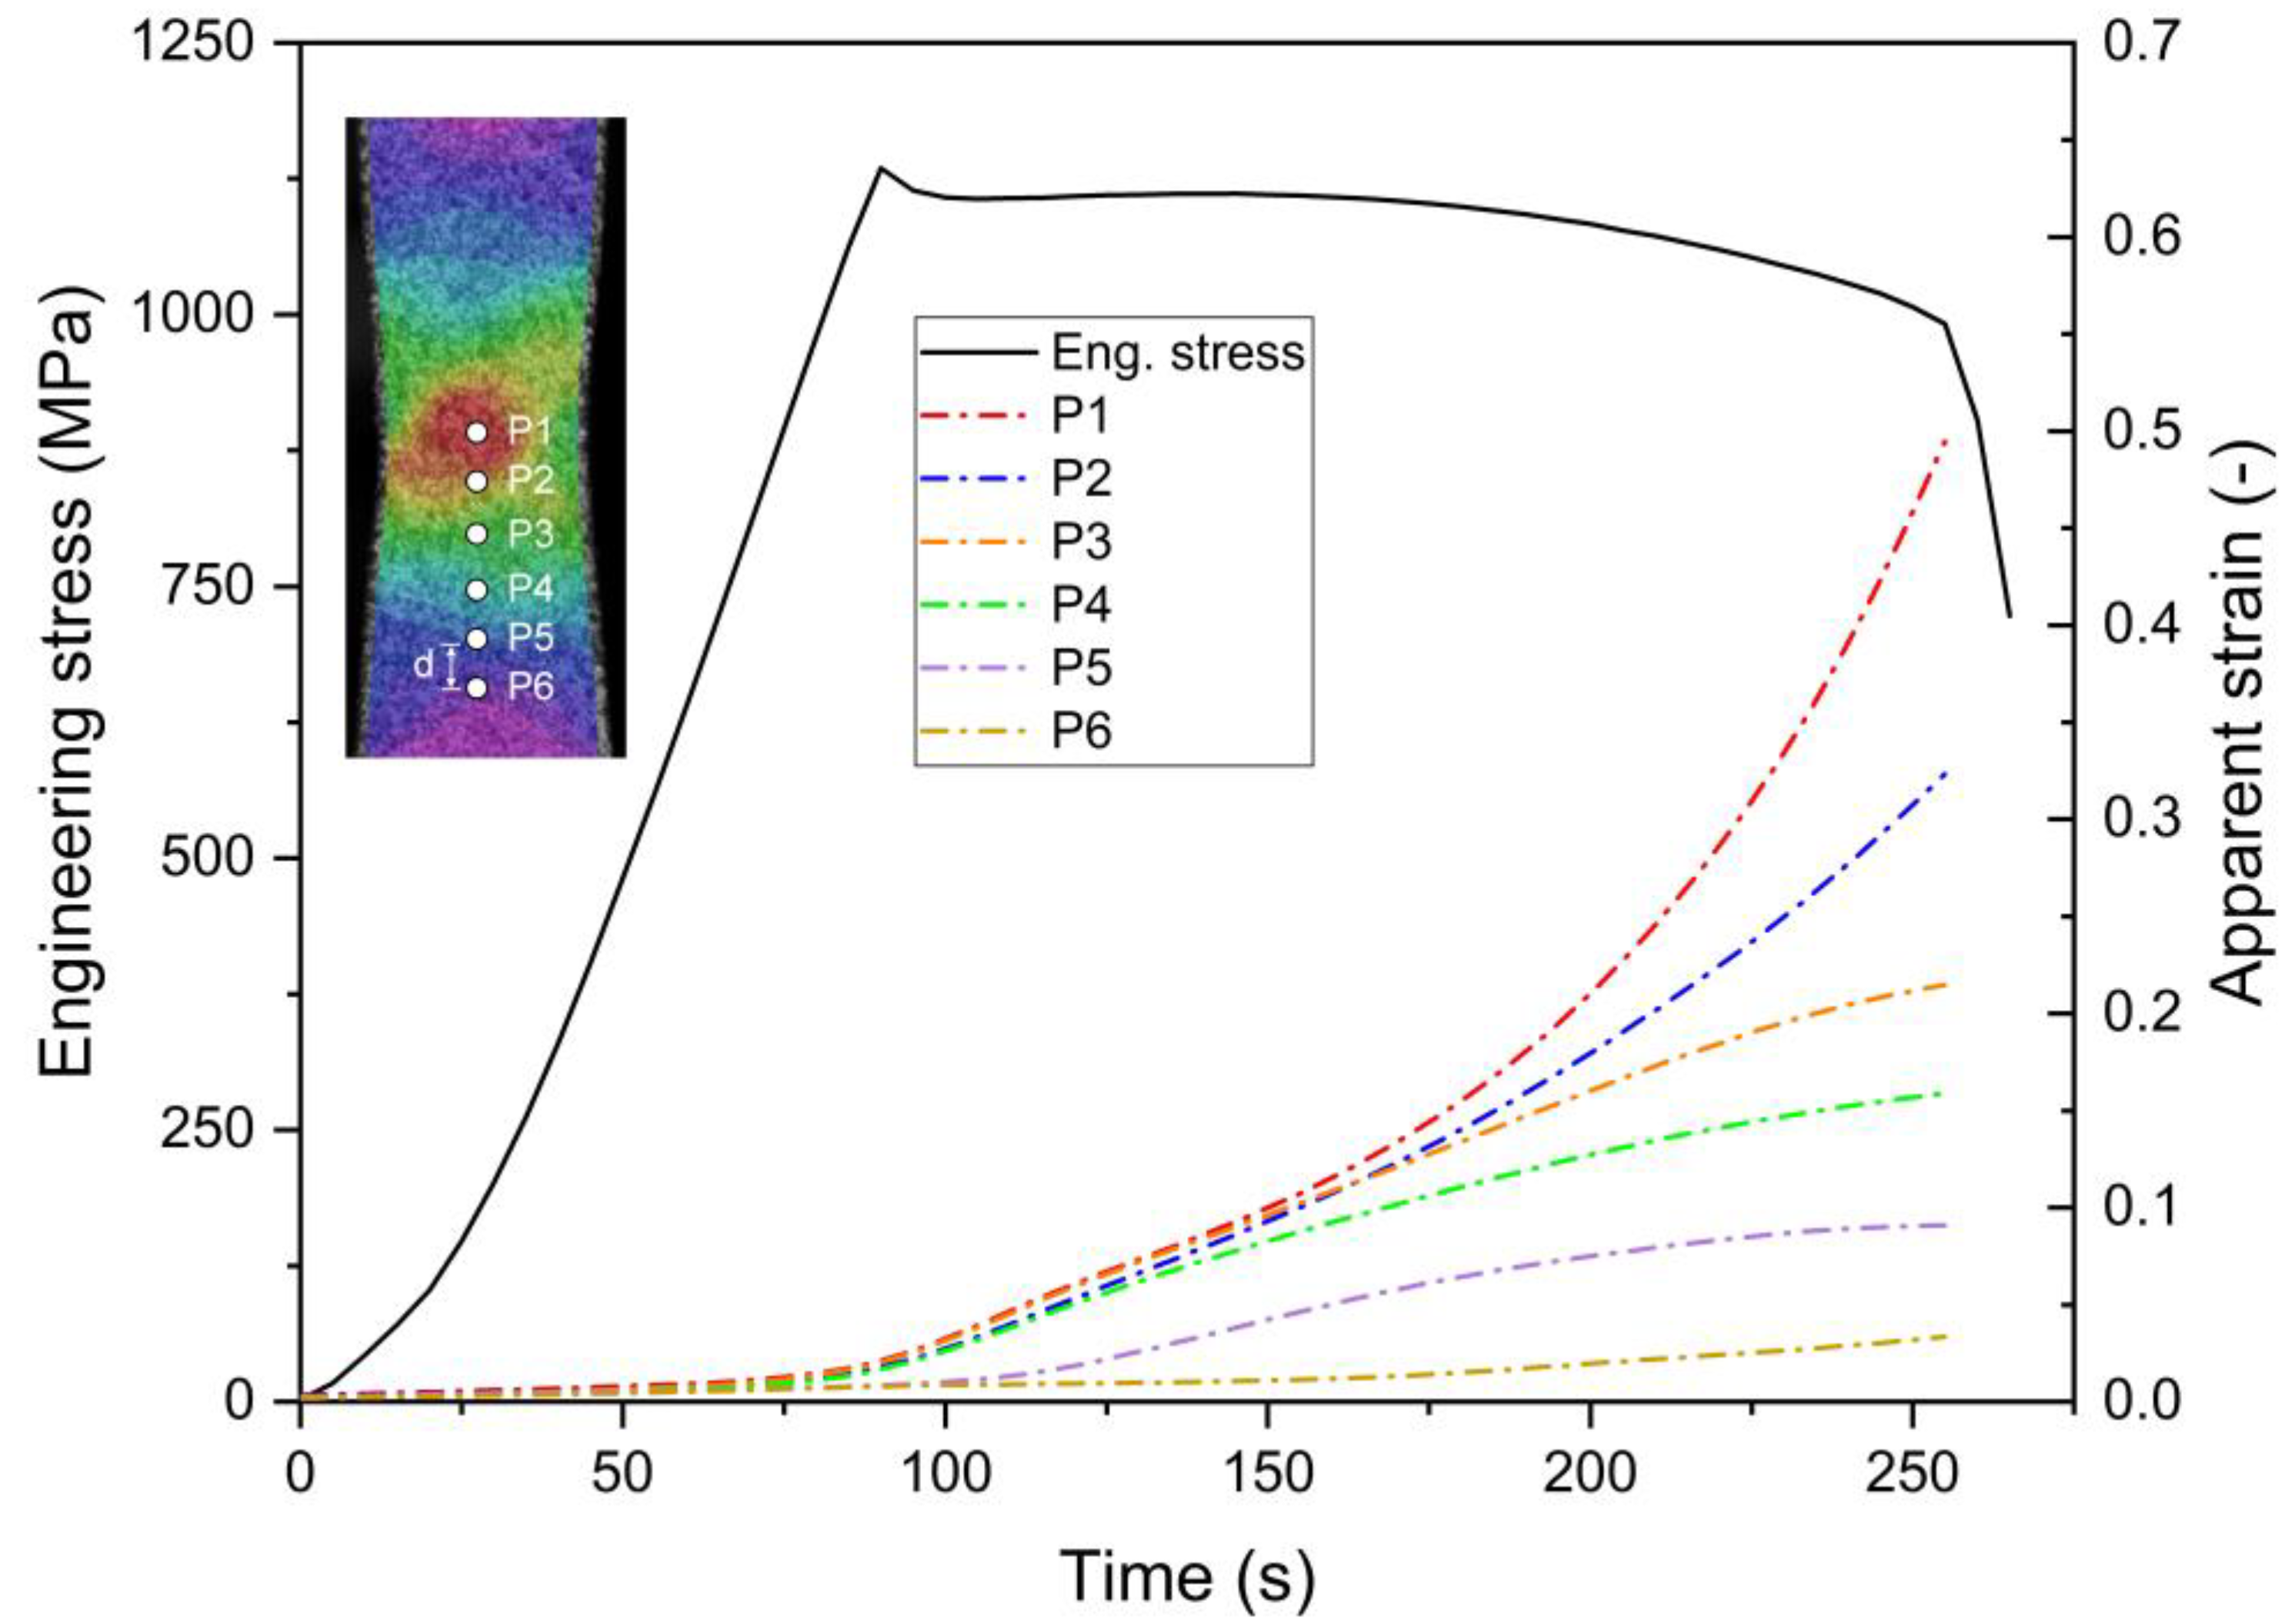
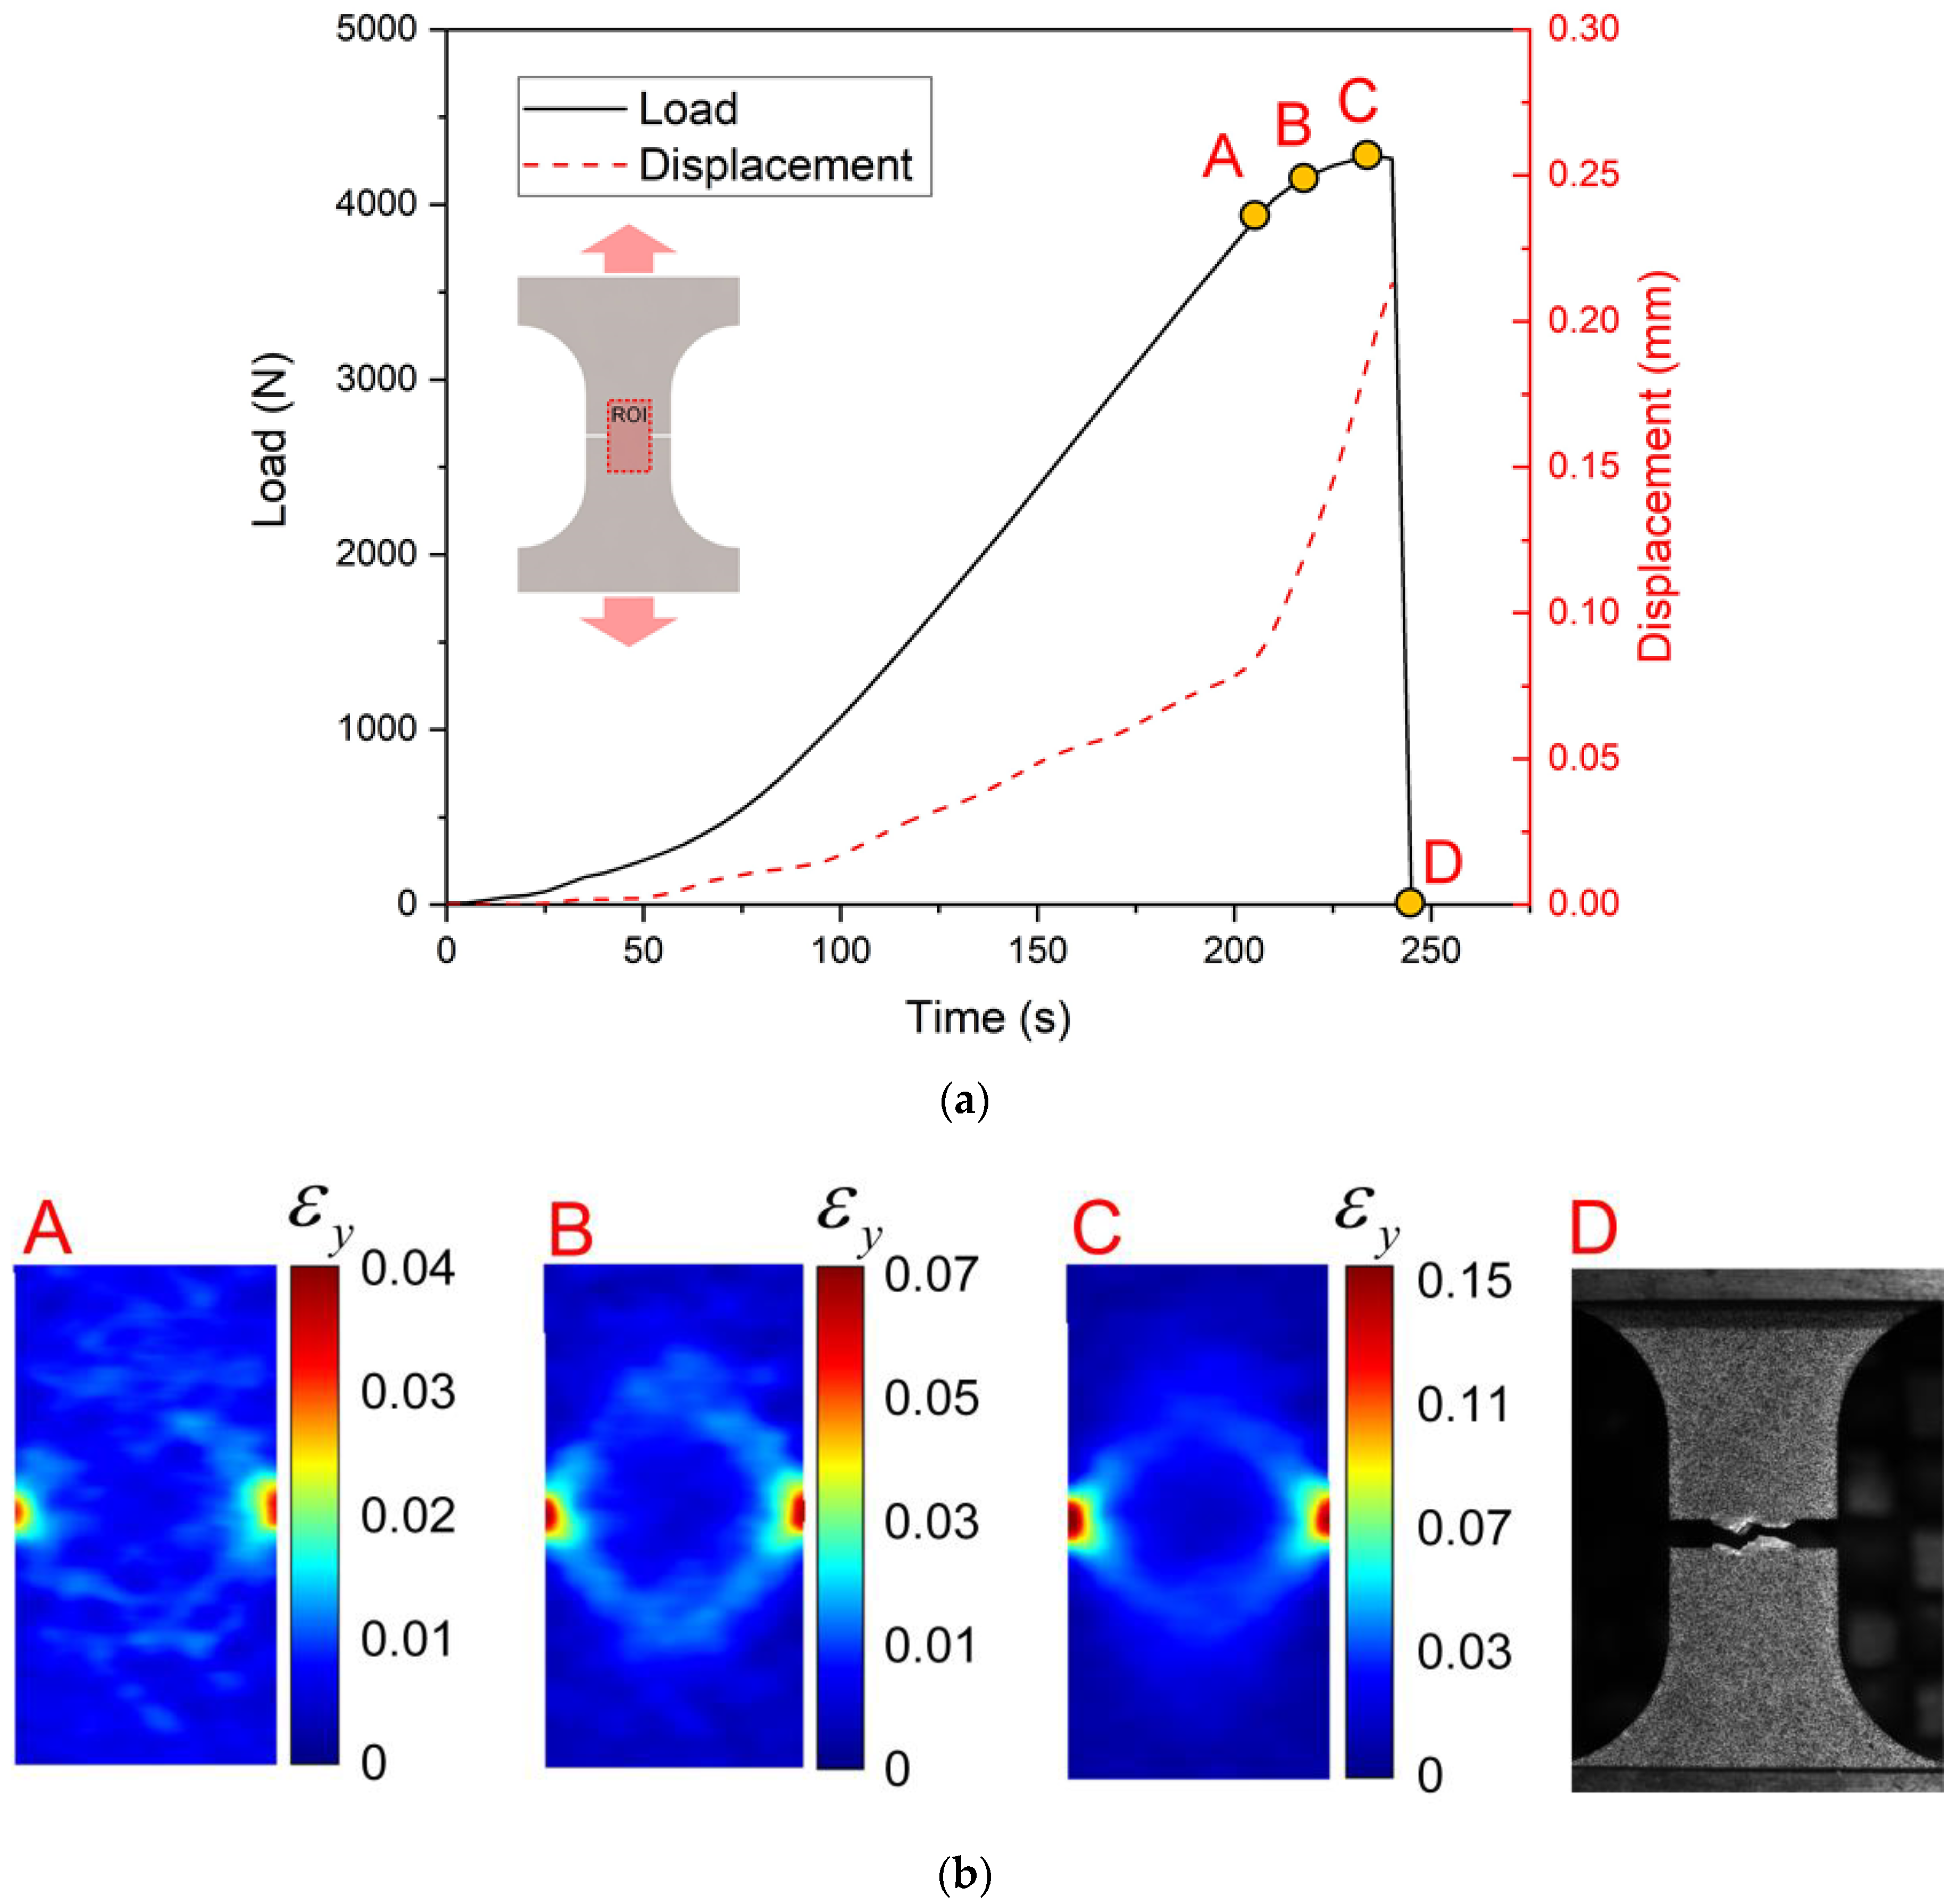
3.3. Notched Specimen Tests
4. Discussion
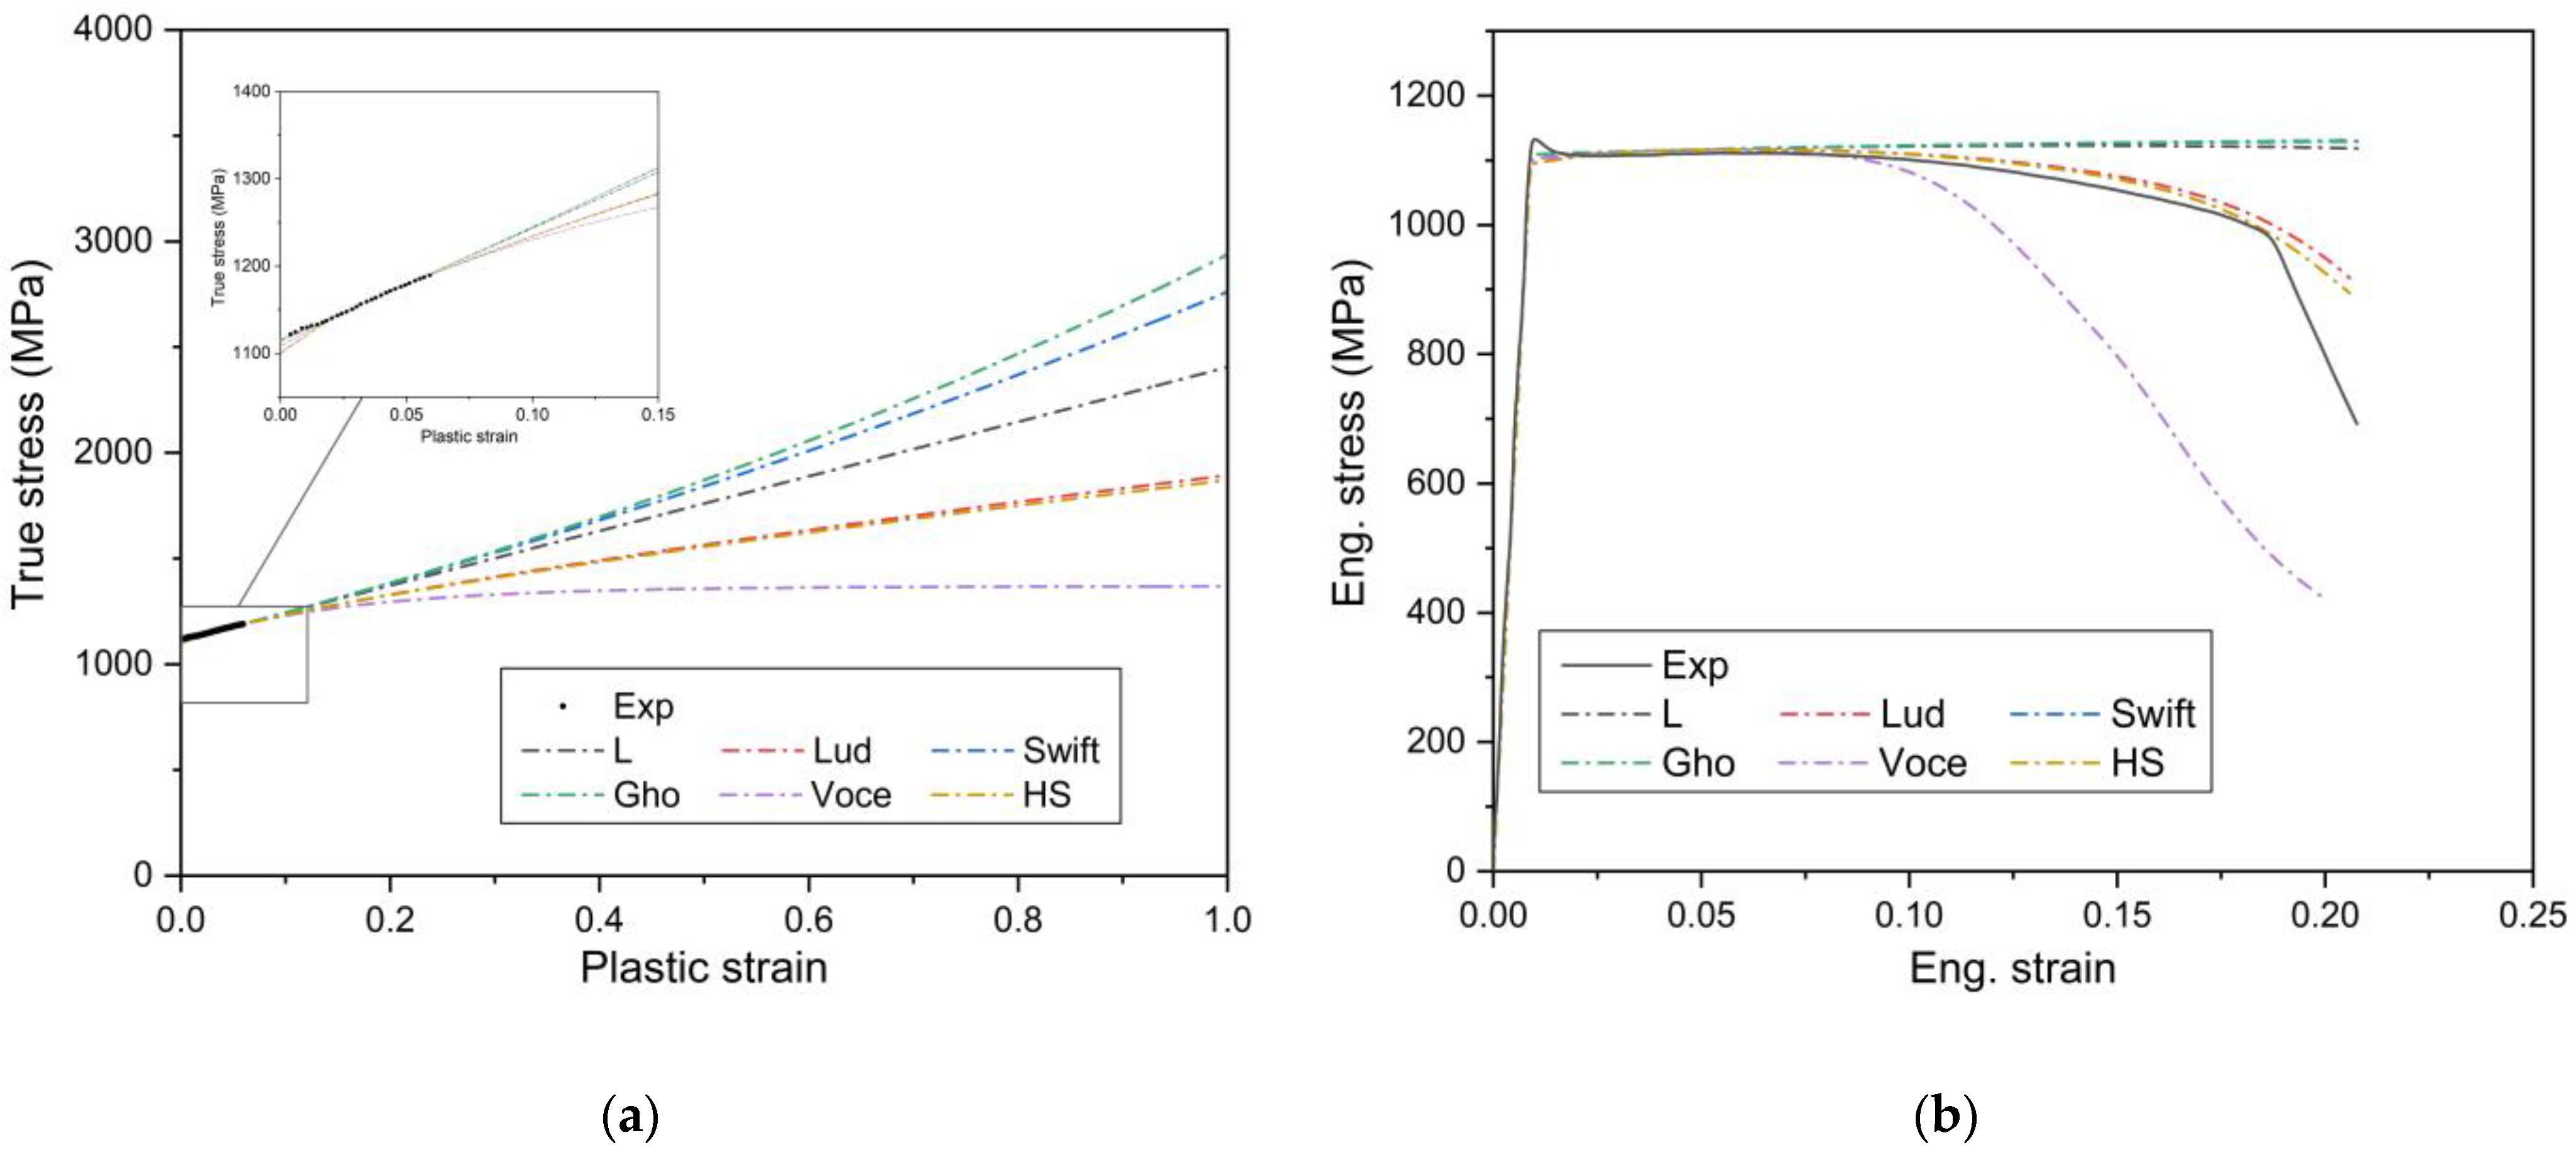
4.1. Strain Hardening Behavior
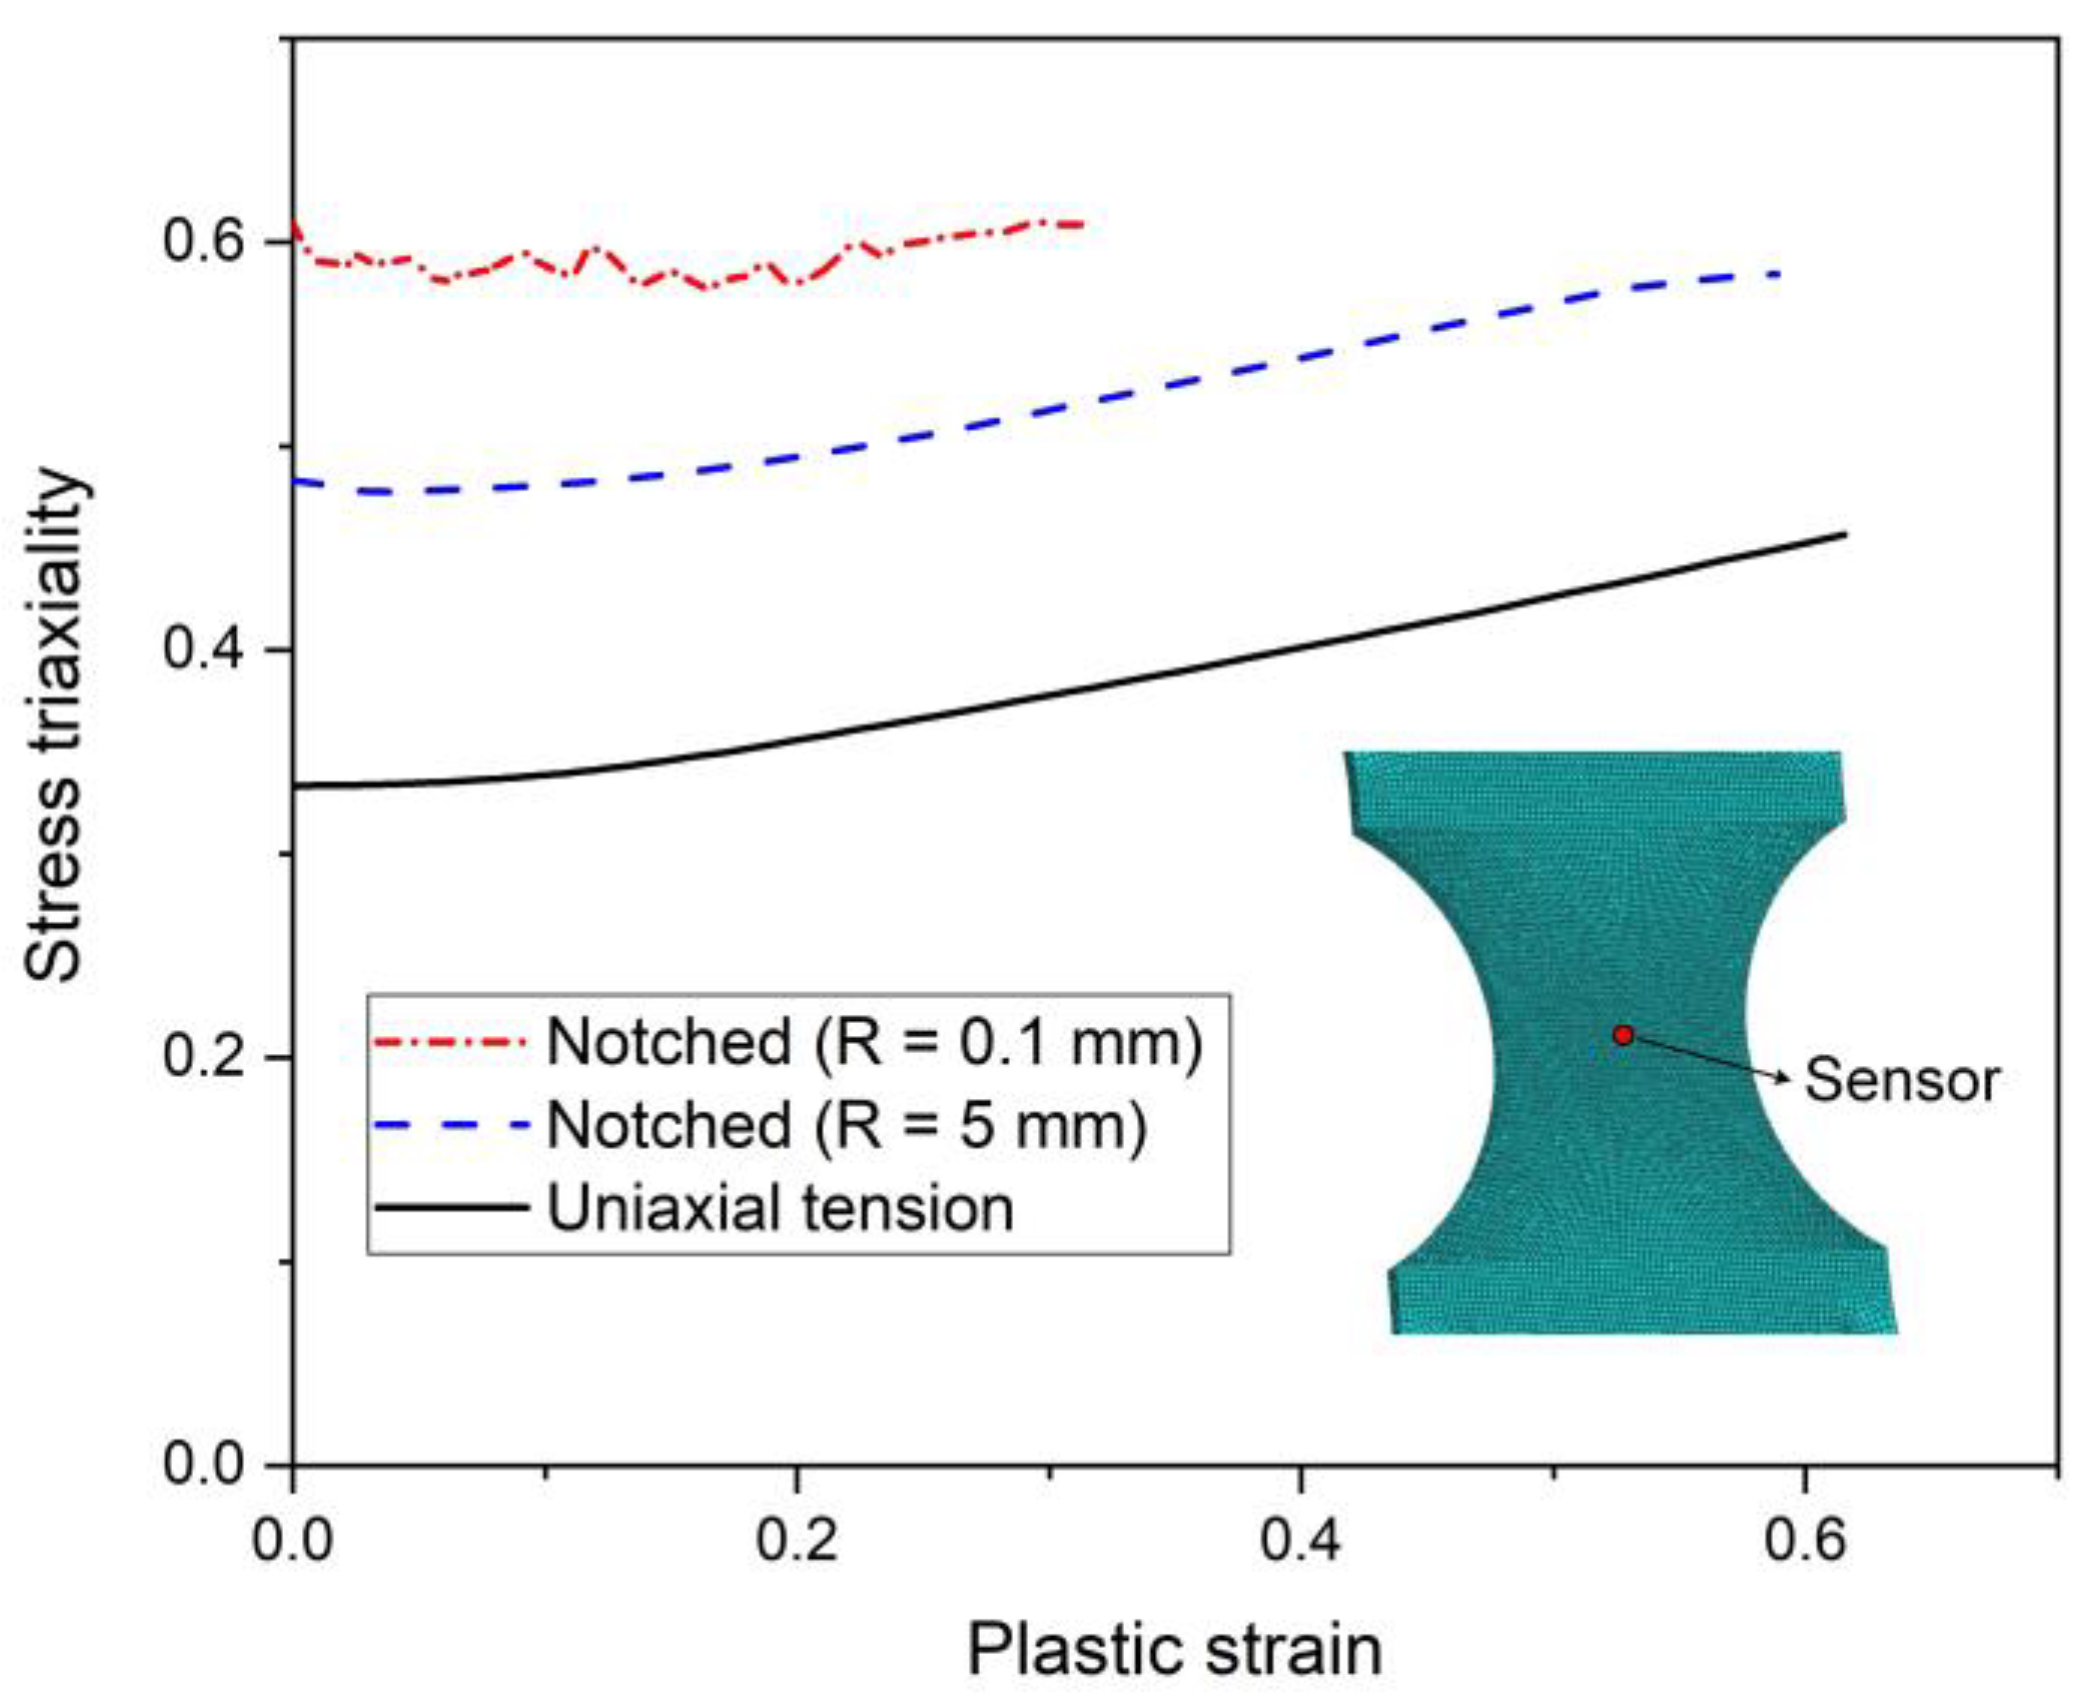
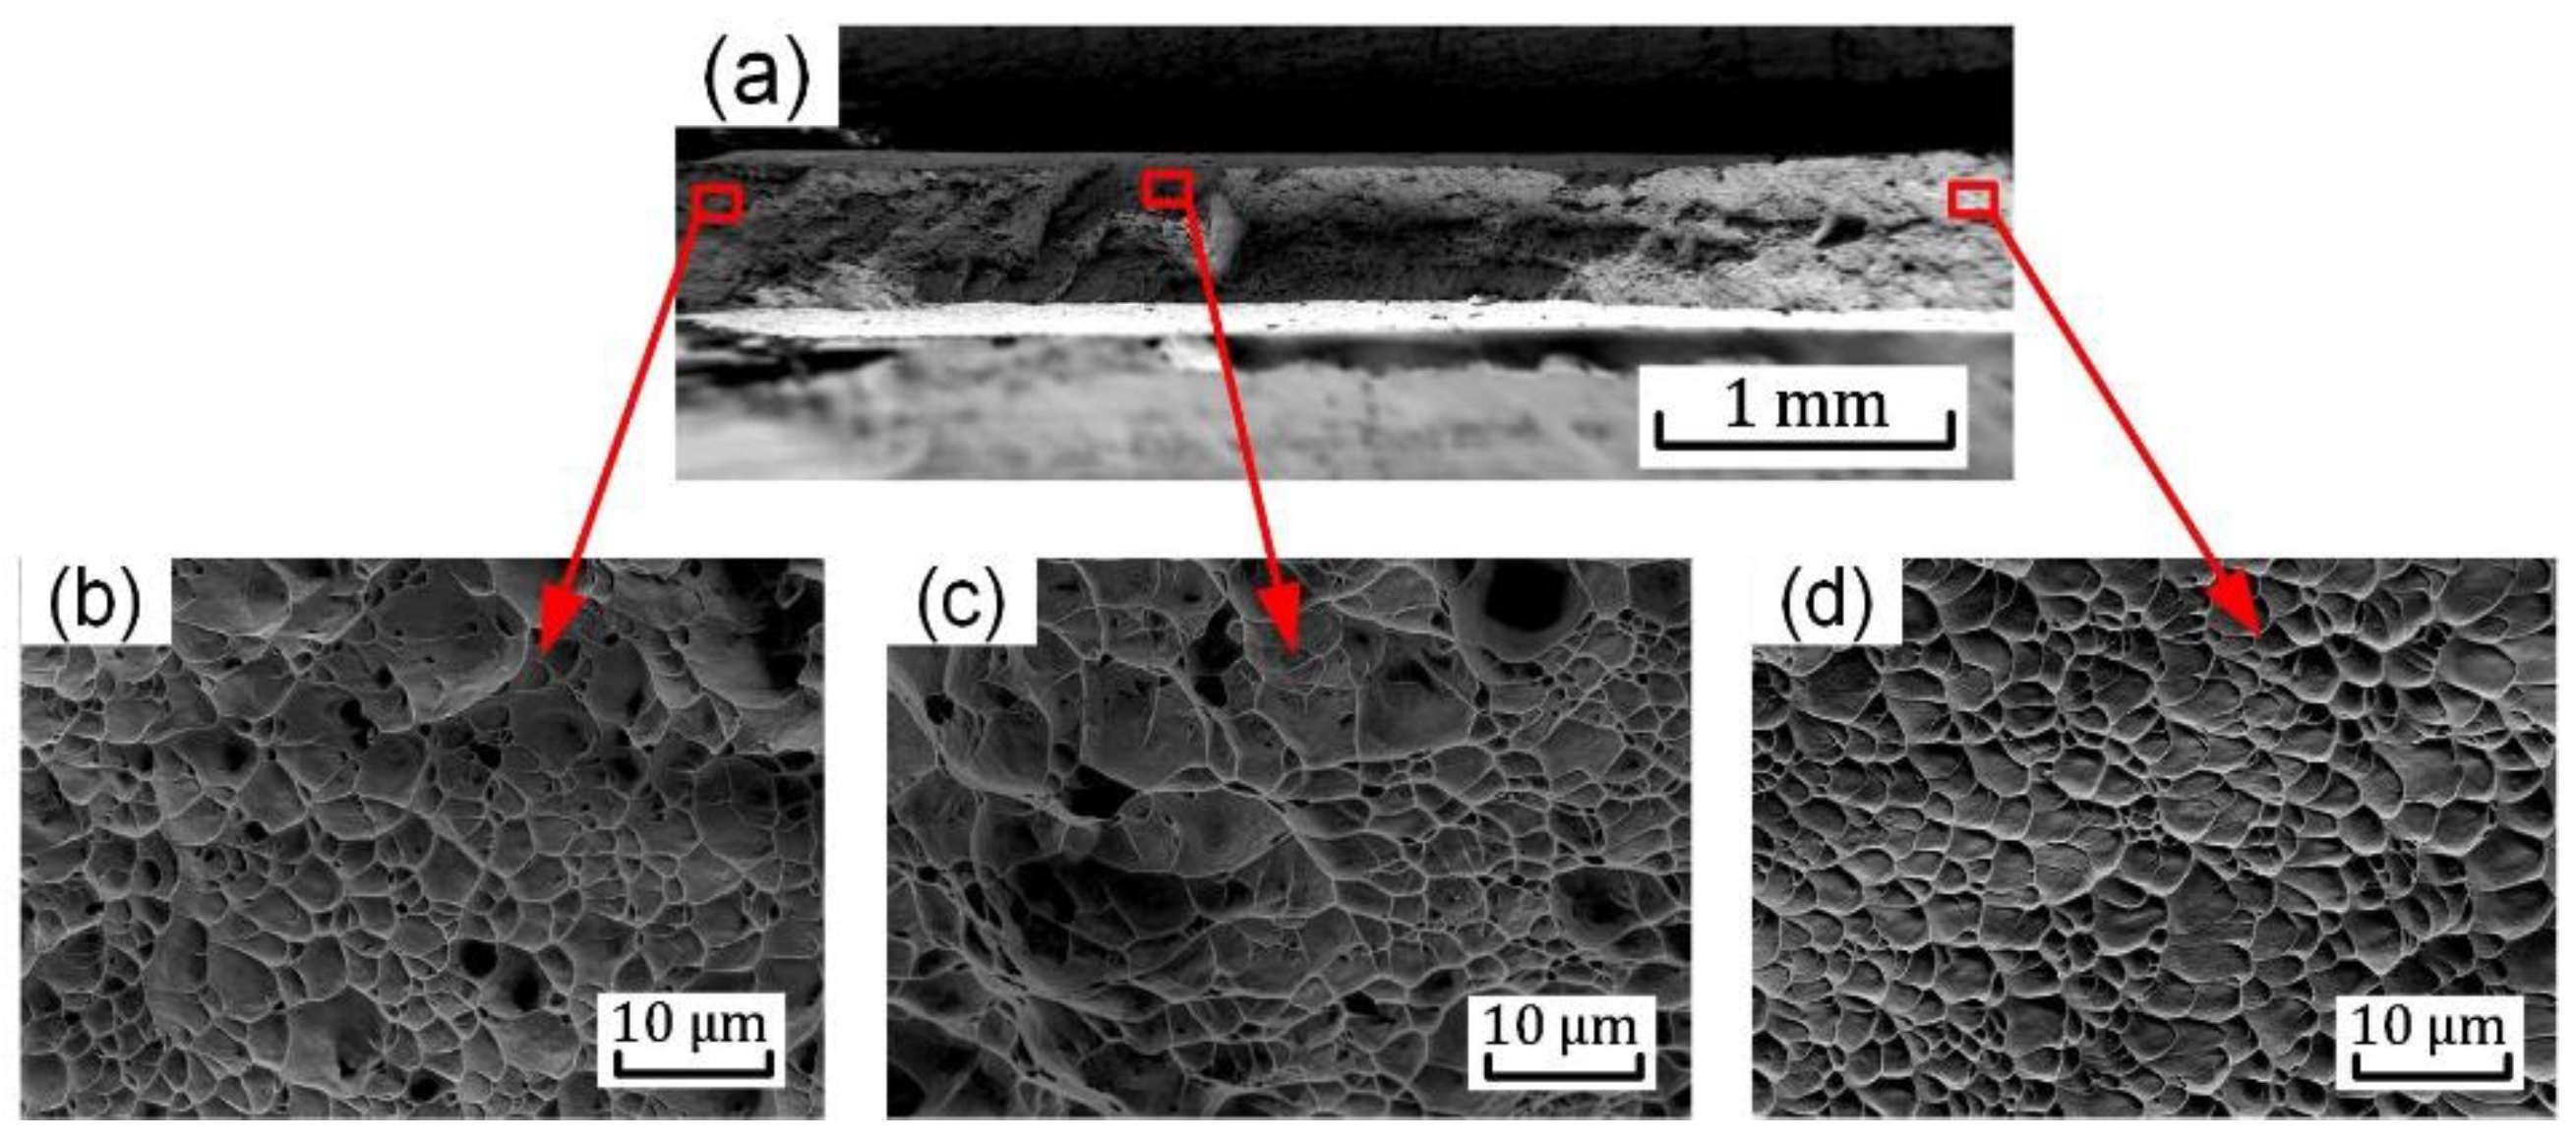
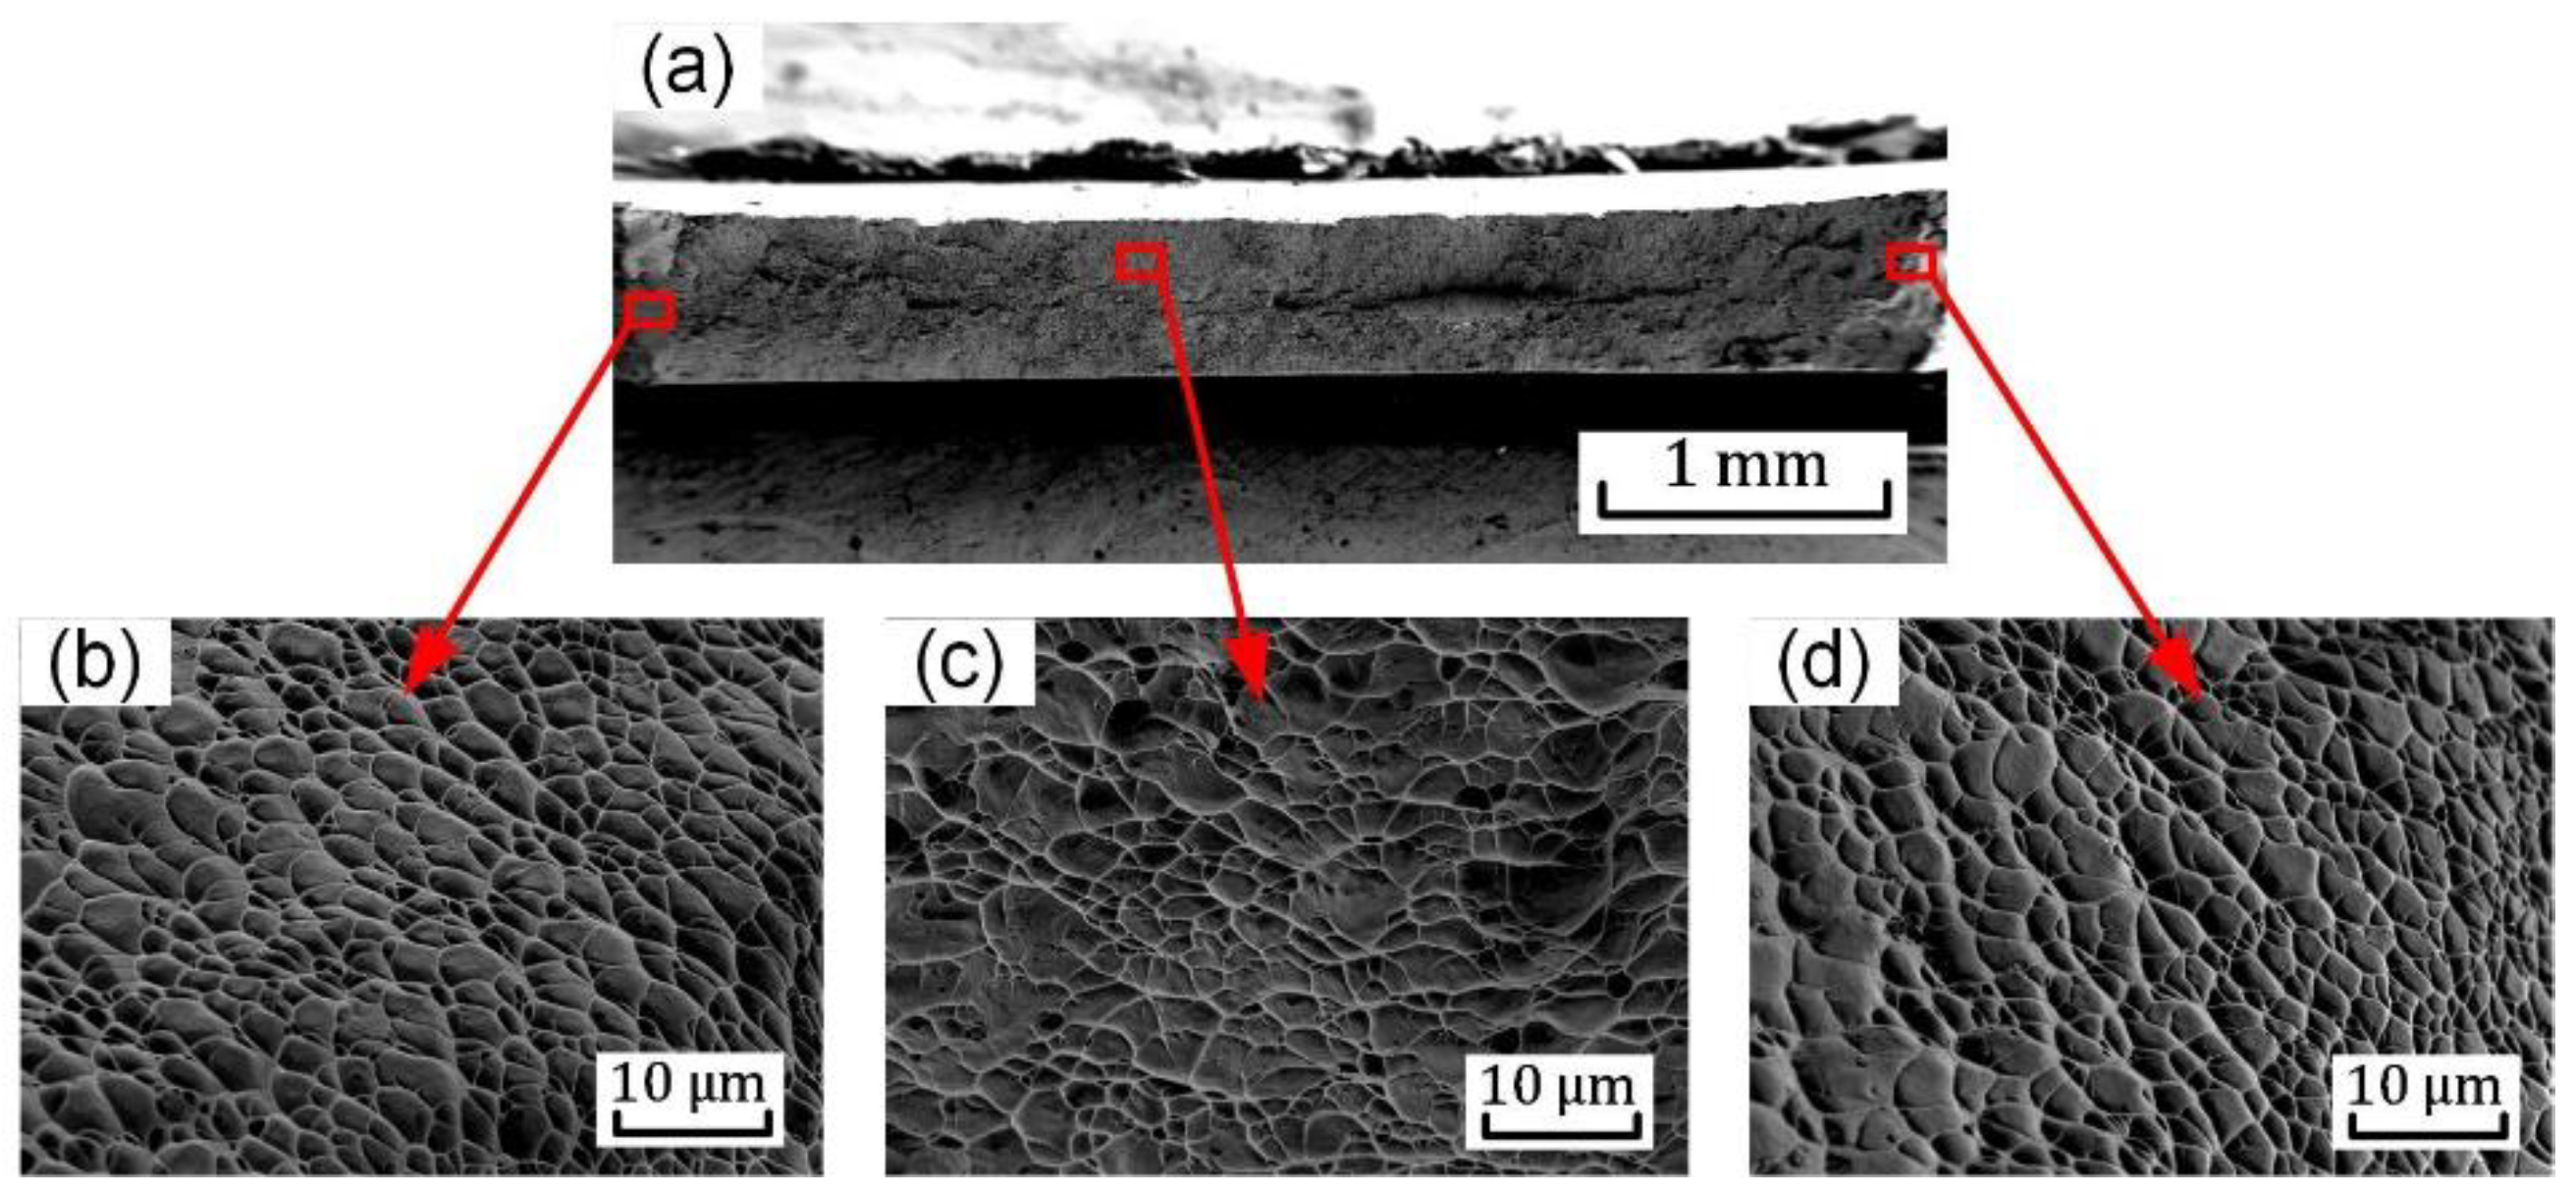
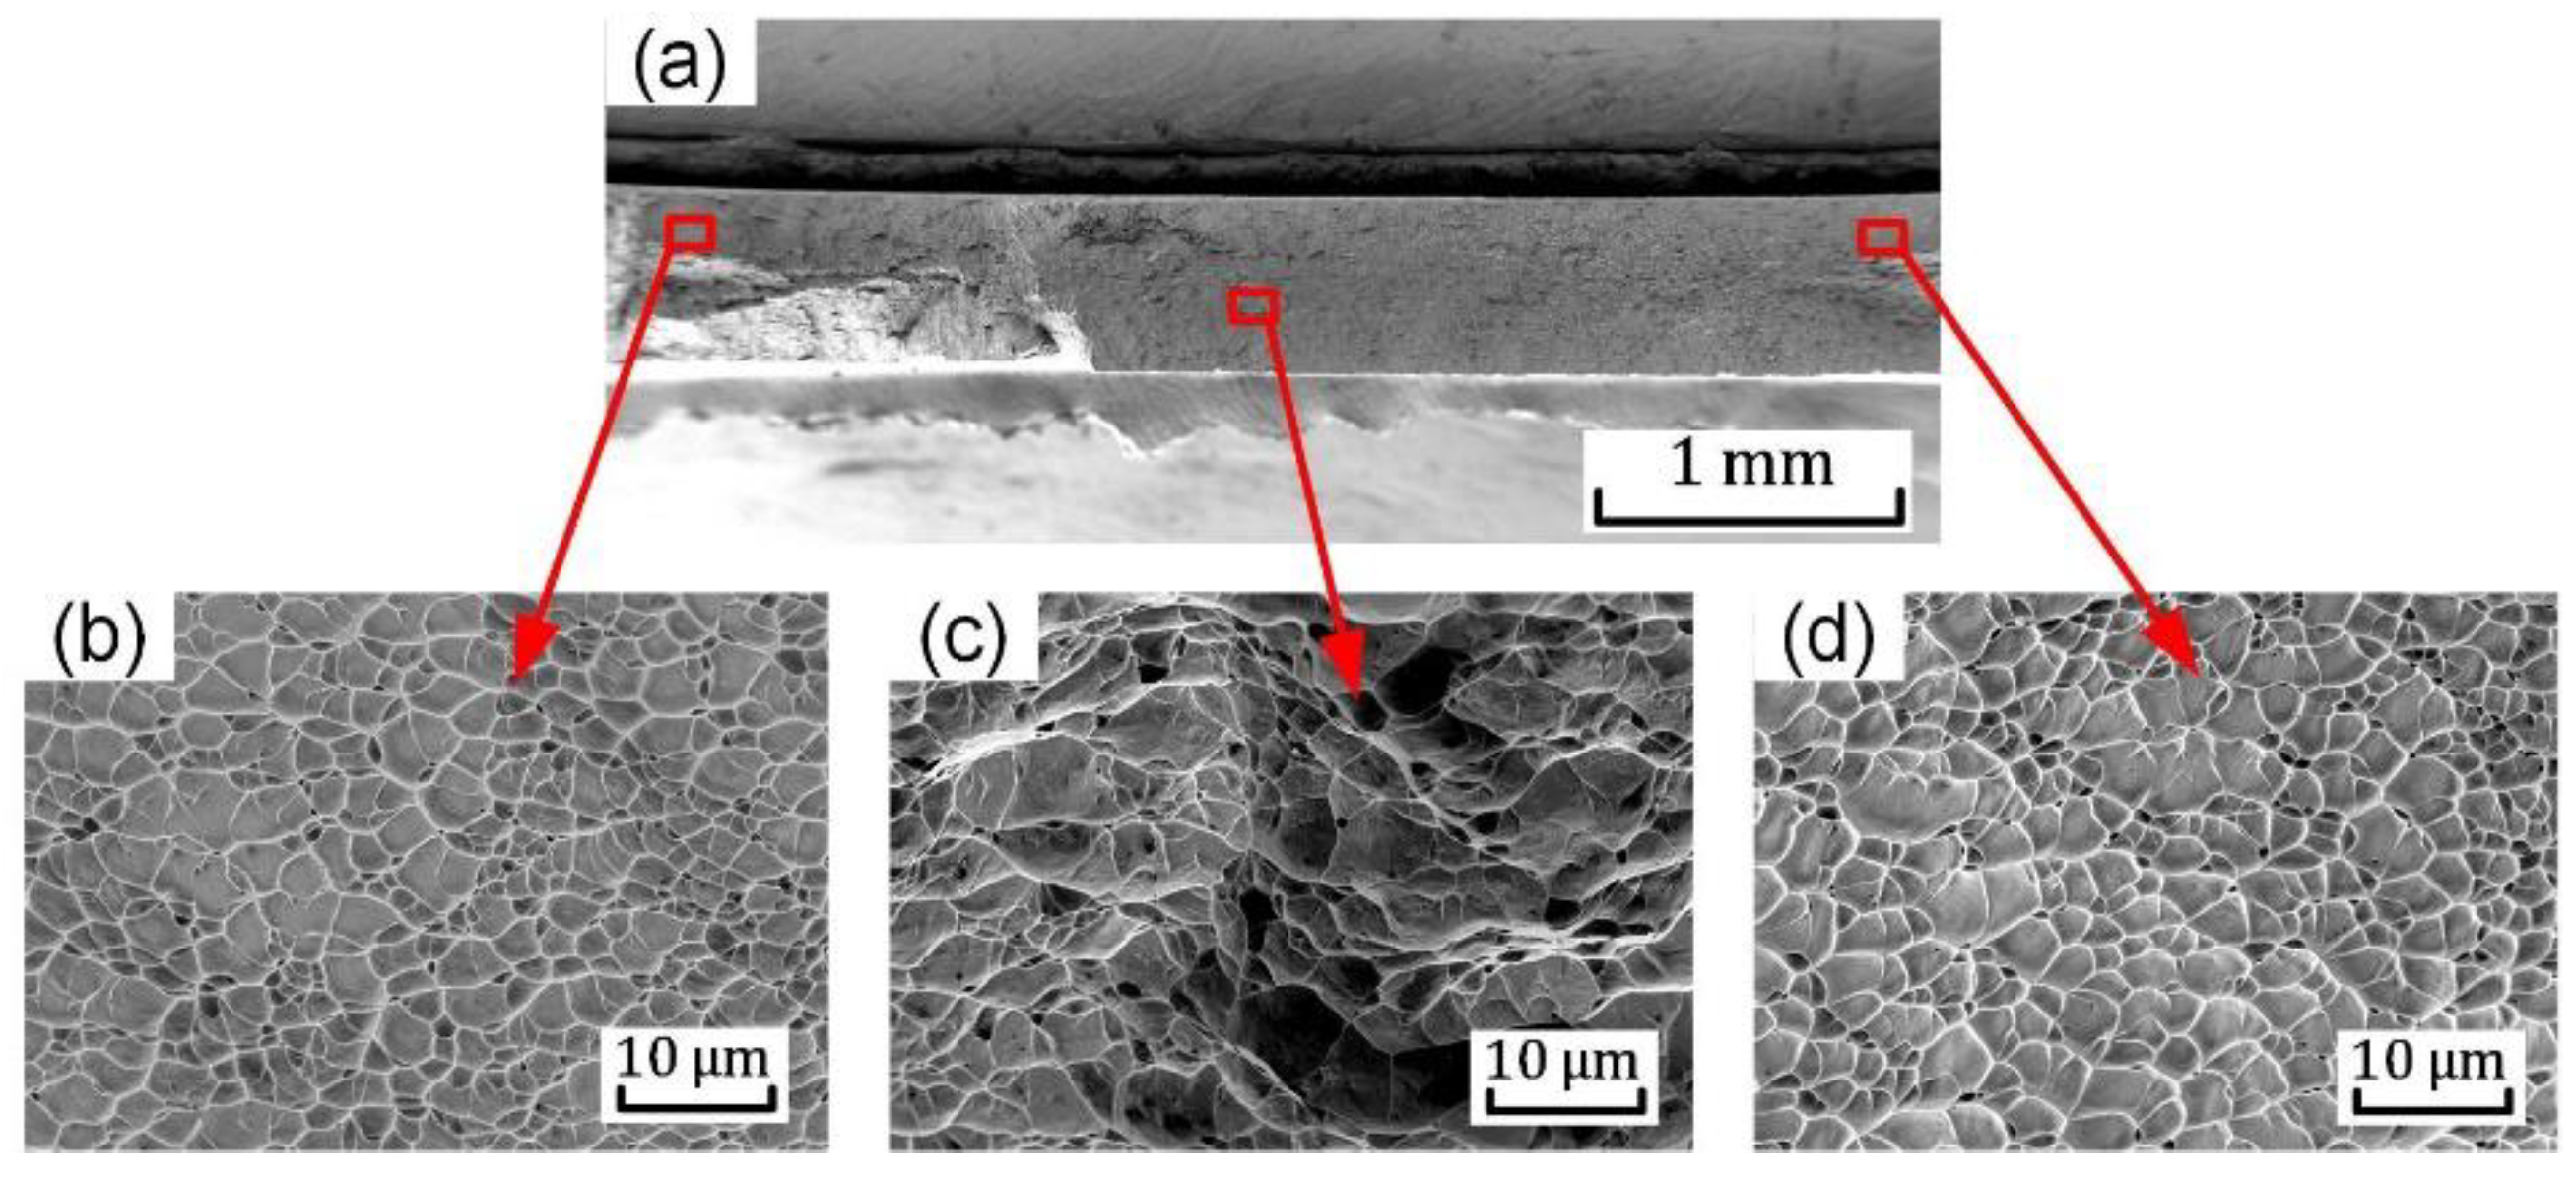
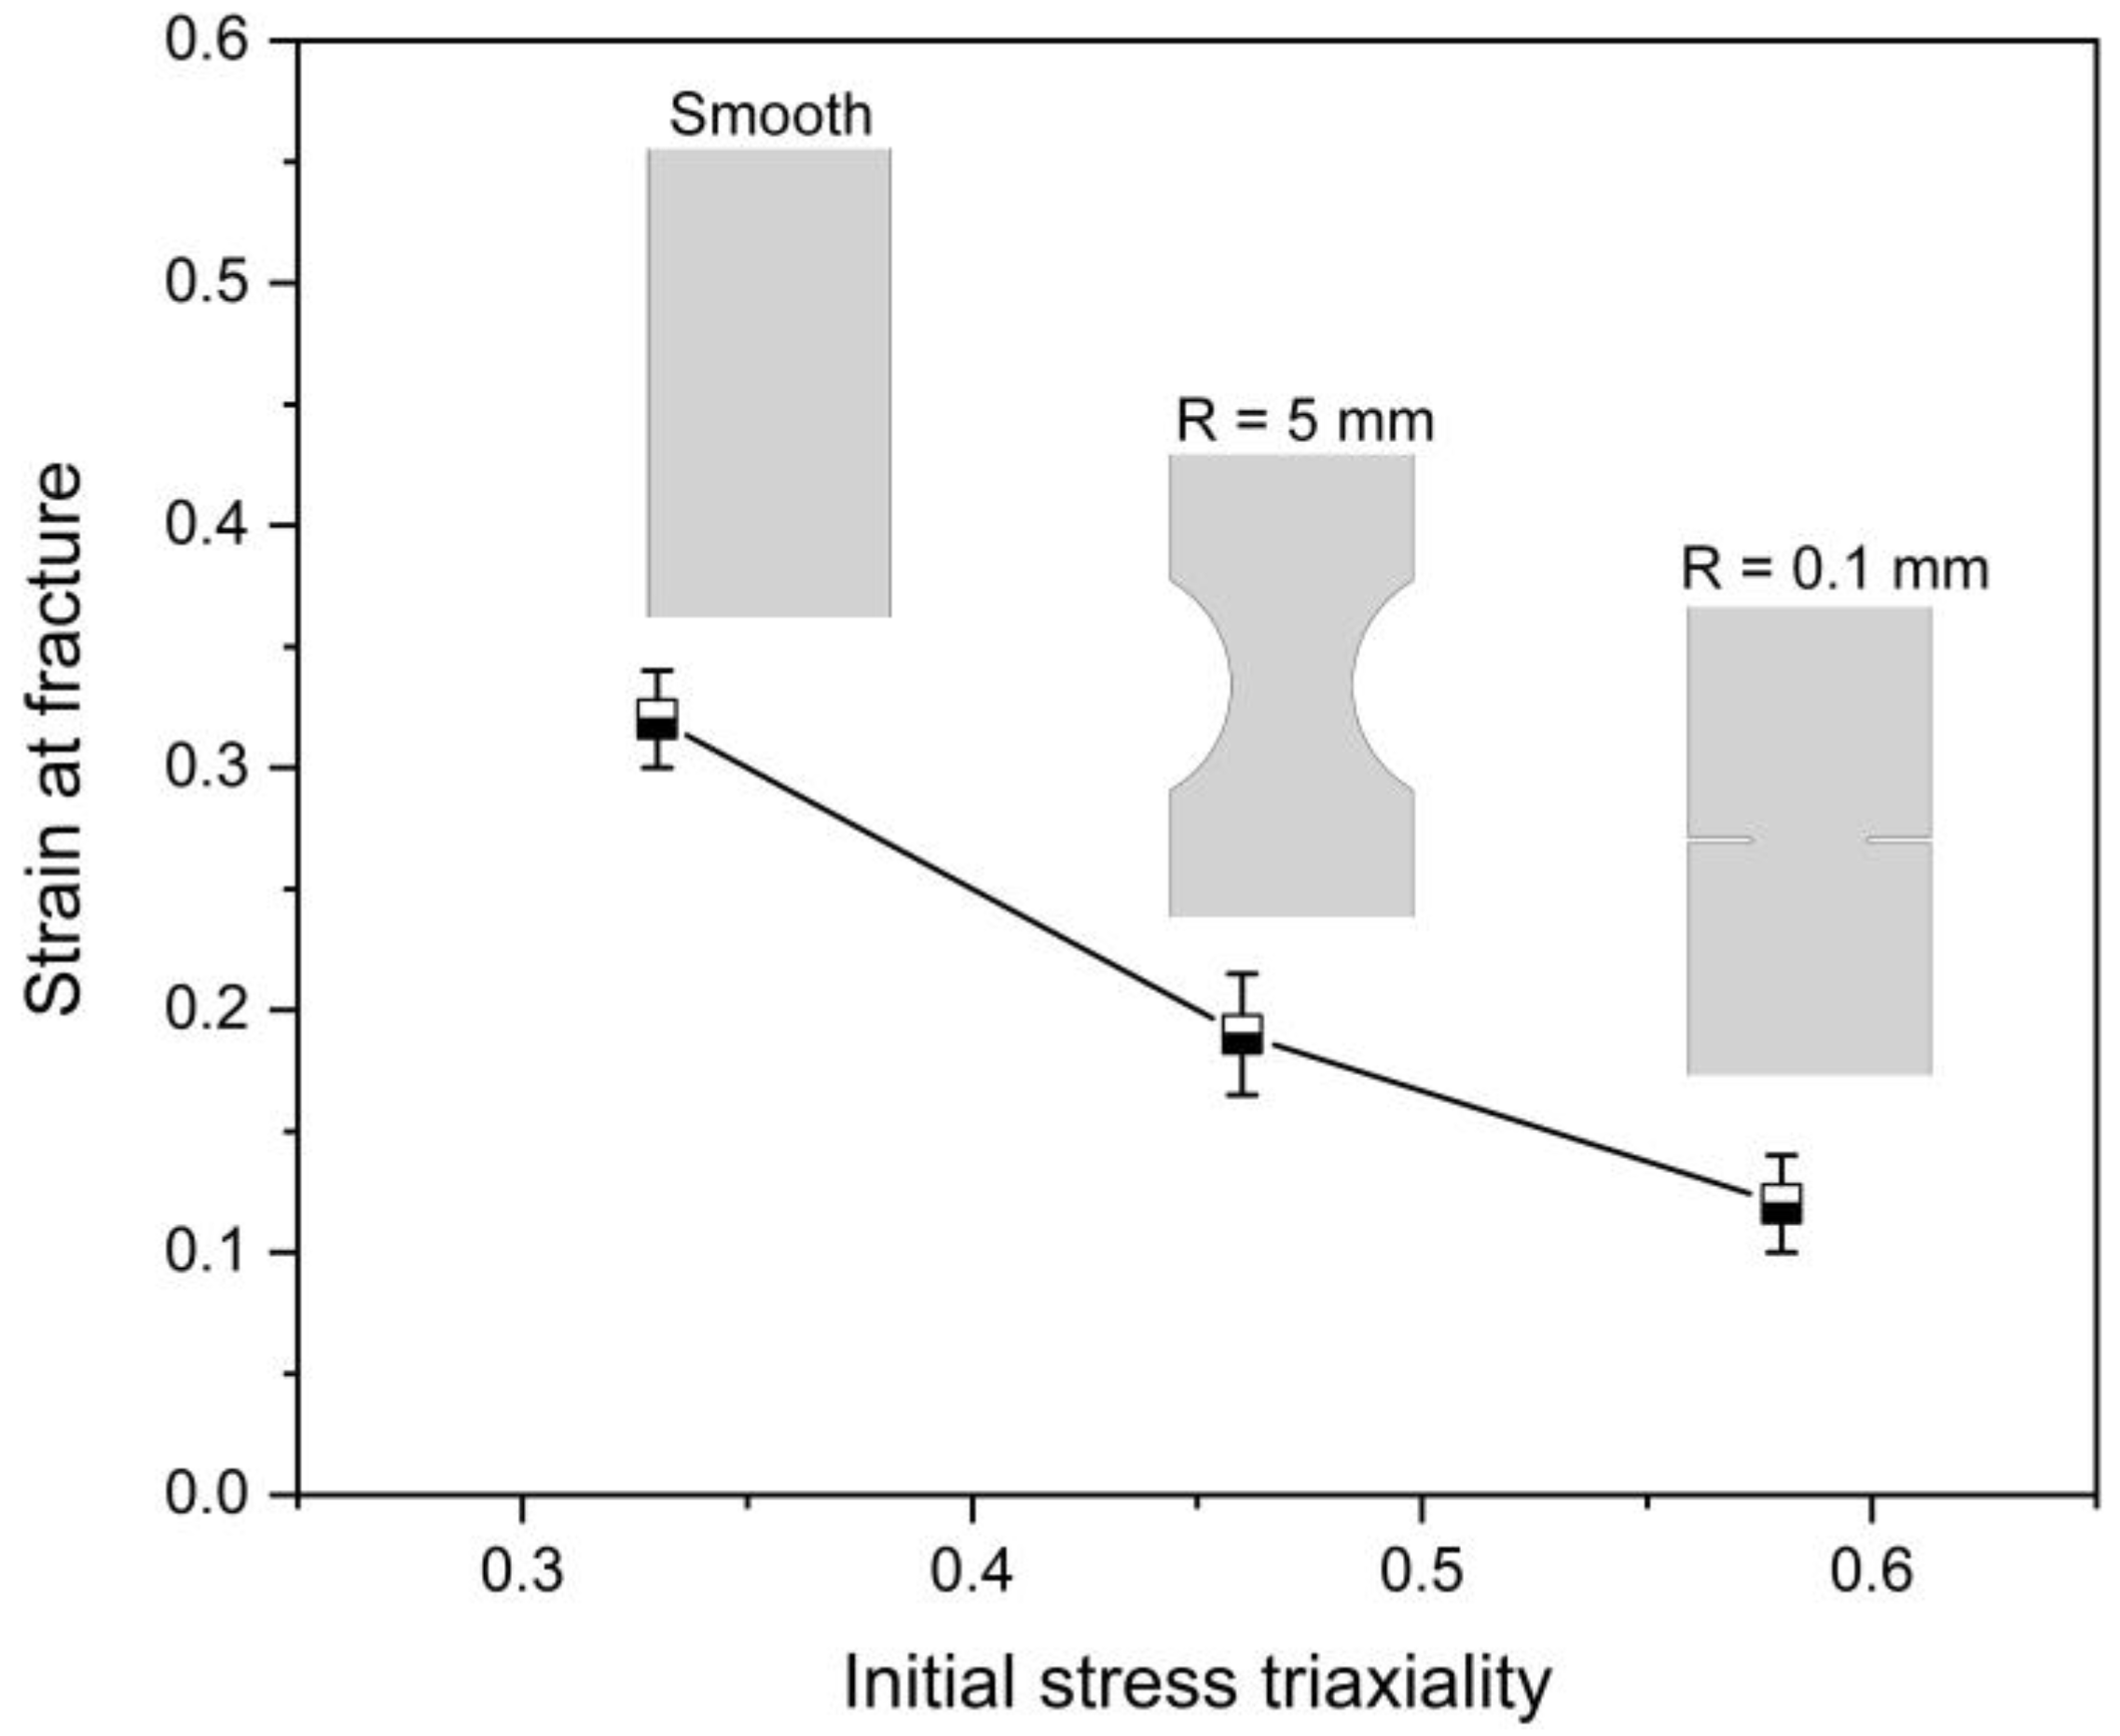
4.2. Influence of Stress Triaxiality on the Fracture Characteristics
5. Conclusions
Author Contributions
Funding
Institutional Review Board Statement
Informed Consent Statement
Data Availability Statement
Conflicts of Interest
References
- Gorji, M.B.; Tancogne-Dejean, T.; Mohr, D. Heterogeneous random medium plasticity and fracture model of additively-manufactured Ti-6Al-4V. Acta Mater. 2018, 148, 442–455. [Google Scholar] [CrossRef]
- Badr, O.M.; Barlat, F.; Rolfe, B.; Lee, M.-G.; Hodgson, P.; Weiss, M. Constitutive modelling of high strength titanium alloy Ti-6Al-4 V for sheet forming applications at room temperature. Int. J. Solids Struct. 2016, 80, 334–347. [Google Scholar] [CrossRef]
- Yi, S.-X.; Yang, Z.-J.; Xie, H.-X. Hot Deformation and Constitutive Modeling of TC21 Titanium Alloy. Materials 2022, 15, 1923. [Google Scholar] [CrossRef] [PubMed]
- Cazacu, O.; Plunkett, B.; Barlat, F. Orthotropic yield criterion for hexagonal closed packed metals. Int. J. Plast. 2006, 22, 1171–1194. [Google Scholar] [CrossRef]
- Wang, Q.; Bruschi, S.; Ghiotti, A.; Mu, Y. Modelling of fracture occurrence in Ti6Al4V sheets at elevated temperature ac-counting for anisotropic behaviour. Int. J. Mech. Sci. 2019, 150, 471–483. [Google Scholar] [CrossRef]
- Ran, C.; Chen, P.; Li, L.; Zhang, W.; Liu, Y.; Zhang, X. High-strain-rate plastic deformation and fracture behaviour of Ti-5Al-5Mo-5V-1Cr-1Fe titanium alloy at room temperature. Mech. Mater. 2018, 116, 3–10. [Google Scholar] [CrossRef]
- Bao, Y.; Wierzbicki, T. On fracture locus in the equivalent strain and stress triaxiality space. Int. J. Mech. Sci. 2004, 46, 81–98. [Google Scholar] [CrossRef]
- Wilson-Heid, A.; Furton, E.; Beese, A. Contrasting the Role of Pores on the Stress State Dependent Fracture Behavior of Additively Manufactured Low and High Ductility Metals. Materials 2021, 14, 3657. [Google Scholar] [CrossRef]
- Brünig, M.; Brenner, D.; Gerke, S. Stress state dependence of ductile damage and fracture behavior: Experiments and numerical simulations. Eng. Fract. Mech. 2015, 141, 152–169. [Google Scholar] [CrossRef]
- Barsoum, I.; Faleskog, J. Rupture mechanisms in combined tension and shear—Experiments. Int. J. Solids Struct. 2007, 44, 1768–1786. [Google Scholar] [CrossRef] [Green Version]
- Gao, X.; Zhang, T.; Hayden, M.; Roe, C. Effects of the stress state on plasticity and ductile failure of an aluminum 5083 alloy. Int. J. Plast. 2009, 25, 2366–2382. [Google Scholar] [CrossRef]
- Thomesen, S.; Hopperstad, O.S.; Myhr, O.R.; Børvik, T. Influence of stress state on plastic flow and ductile fracture of three 6000-series aluminium alloys. Mater. Sci. Eng. A 2020, 783, 139295. [Google Scholar] [CrossRef]
- Bai, Y.; Wierzbicki, T. A new model of metal plasticity and fracture with pressure and Lode dependence. Int. J. Plast. 2008, 24, 1071–1096. [Google Scholar] [CrossRef]
- Peirs, J.; Verleysen, P.; Degrieck, J. Novel Technique for Static and Dynamic Shear Testing of Ti6Al4V Sheet. Exp. Mech. 2012, 52, 729–741. [Google Scholar] [CrossRef] [Green Version]
- Bouvier, S.; Haddadi, H.; Levée, P.; Teodosiu, C. Simple shear tests: Experimental techniques and characterization of the plastic anisotropy of rolled sheets at large strains. J. Mater. Process. Technol. 2006, 172, 96–103. [Google Scholar] [CrossRef]
- Yin, Q.; Soyarslan, C.; Isik, K.; Tekkaya, A.E. A grooved in-plane torsion test for the investigation of shear fracture in sheet materials. Int. J. Solids Struct. 2015, 66, 121–132. [Google Scholar] [CrossRef]
- Dunand, M.; Mohr, D. Optimized butterfly specimen for the fracture testing of sheet materials under combined normal and shear loading. Eng. Fract. Mech. 2011, 78, 2919–2934. [Google Scholar] [CrossRef]
- Haltom, S.; Kyriakides, S.; Ravi-Chandar, K. Ductile failure under combined shear and tension. Int. J. Solids Struct. 2013, 50, 1507–1522. [Google Scholar] [CrossRef]
- Ha, J.; Baral, M.; Korkolis, Y.P. Ductile fracture of an aluminum sheet under proportional loading. J. Mech. Phys. Solids 2019, 132. [Google Scholar] [CrossRef]
- Deng, N.; Kuwabara, T.; Korkolis, Y.P. Cruciform Specimen Design and Verification for Constitutive Identification of Anisotropic Sheets. Exp. Mech. 2015, 55, 1005–1022. [Google Scholar] [CrossRef]
- Gerke, S.; Zistl, M.; Bhardwaj, A.; Brünig, M. Experiments with the X0-specimen on the effect of non-proportional loading paths on damage and fracture mechanisms in aluminum alloys. Int. J. Solids Struct. 2019, 163, 157–169. [Google Scholar] [CrossRef]
- Koc, P.; Štok, B. Computer-aided identification of the yield curve of a sheet metal after onset of necking. Comput. Mater. Sci. 2004, 31, 155–168. [Google Scholar] [CrossRef]
- Sung, J.H.; Kim, J.H.; Wagoner, R. A plastic constitutive equation incorporating strain, strain-rate, and temperature. Int. J. Plast. 2010, 26, 1746–1771. [Google Scholar] [CrossRef]
- Guo, J.; Zhan, M.; Fu, M.W.; Gao, P.F.; Ma, F. Extrapolation based constitutive modeling of flow stress of titanium alloy sheet under hot-working condition. Mater. Des. 2018, 154, 96–107. [Google Scholar] [CrossRef]
- Song, H.; Liu, C.; Zhang, H.; Yang, X.; Chen, Y.; Leen, S.B. Experimental investigation on damage evolution in pre-corroded aluminum alloy 7075-T7651 under fatigue loading. Mater. Sci. Eng. A 2021, 799, 140206. [Google Scholar] [CrossRef]
- Pan, B. Digital image correlation for surface deformation measurement: Historical developments, recent advances and future goals. Meas. Sci. Technol. 2018, 29, 082001. [Google Scholar] [CrossRef]
- Zhang, H.; Huang, G.; Song, H.; Kang, Y. Experimental investigation of deformation and failure mechanisms in rock under indentation by digital image correlation. Eng. Fract. Mech. 2012, 96, 667–675. [Google Scholar] [CrossRef]
- Sutton, M.A.; Orteu, J.-J.; Schreier, H. Image Correlation for Shape, Motion and Deformation Measurements; Springer: New York, NY, USA, 2009. [Google Scholar]
- Saboori, M.; Champliaud, H.; Gholipour, J.; Gakwaya, A.; Savoie, J.; Wanjara, P. Evaluating the flow stress of aerospace alloys for tube hydroforming process by free expansion testing. Int. J. Adv. Manuf. Technol. 2014, 72, 1275–1286. [Google Scholar] [CrossRef] [Green Version]
- Coppieters, S.; Kuwabara, T. Identification of Post-Necking Hardening Phenomena in Ductile Sheet Metal. Exp. Mech. 2014, 54, 1355–1371. [Google Scholar] [CrossRef] [Green Version]
- Zhang, H.; Coppieters, S.; Jiménez-Peña, C.; Debruyne, D. Inverse identification of the post-necking work hardening behaviour of thick HSS through full-field strain measurements during diffuse necking. Mech. Mater. 2019, 129, 361–374. [Google Scholar] [CrossRef]
- Aliprandi, P.; Giudice, F.; Guglielmino, E.; Sili, A. Tensile and Creep Properties Improvement of Ti-6Al-4V Alloy Specimens Produced by Electron Beam Powder Bed Fusion Additive Manufacturing. Metals 2019, 9, 1207. [Google Scholar] [CrossRef] [Green Version]
- Yang, X.; Li, Y.; Duan, M.-G.; Jiang, W.; Chen, D.; Li, B. An investigation of ductile fracture behavior of Ti6Al4V alloy fabricated by selective laser melting. J. Alloys Compd. 2022, 890, 161926. [Google Scholar] [CrossRef]
- Ludwik, P. Elemente der Technologischen Mechanik; Springer: Berlin/Heidelberg, Germany, 1909. [Google Scholar] [CrossRef]
- Swift, H. Plastic instability under plane stress. J. Mech. Phys. Solids 1952, 1, 1–18. [Google Scholar] [CrossRef]
- Ghosh, A. Tensile instability and necking in materials with strain hardening and strain-rate hardening. Acta Met. 1977, 25, 1413–1424. [Google Scholar] [CrossRef]
- Voce, E. The relationship between stress and strain for homogeneous deformation. J. Inst. Met. 1948, 74, 537–562. [Google Scholar]
- Hockett, J.E.; Sherby, O.D. Large strain deformation of polycrystalline metals at low homologous temperatures. J. Mech. Phys. Solids 1975, 23, 87–98. [Google Scholar] [CrossRef]


| Hardening Law | Abbreviation | Expression | Equation | Type |
|---|---|---|---|---|
| Linear | L | (4) | Linear | |
| Ludwik (1909) [34] | Lud | (5) | Power law | |
| Swift (1952) [35] | S | (6) | Power law | |
| Ghosh (1977) [36] | Gho | (7) | Power law | |
| Voce (1948) [37] | V | (8) | Saturation | |
| Hockett-Sherby (1975) [38] | HS | (9) | Saturation |
| Hardening Model | Variables | |||
|---|---|---|---|---|
| C1 | C2 | C3 | C4 | |
| L | 1114.505 | 1290.356 | - | - |
| Lud | 1101.109 | 792.622 | 0.774 | - |
| Swift | 301.709 | 1.859 | 2.107 | - |
| Gho | 19.209 | 3.165 | 3.525 | 0.223 |
| Voce | 1108.564 | 259.898 | 6.333 | - |
| HS | 1100.329 | 32,851.668 | 0.024 | 0.765 |
Publisher’s Note: MDPI stays neutral with regard to jurisdictional claims in published maps and institutional affiliations. |
© 2022 by the authors. Licensee MDPI, Basel, Switzerland. This article is an open access article distributed under the terms and conditions of the Creative Commons Attribution (CC BY) license (https://creativecommons.org/licenses/by/4.0/).
Share and Cite
Zhang, H.; Gao, T.; Chen, J.; Li, X.; Song, H.; Huang, G. Investigation on Strain Hardening and Failure in Notched Tension Specimens of Cold Rolled Ti6Al4V Titanium Alloy. Materials 2022, 15, 3429. https://doi.org/10.3390/ma15103429
Zhang H, Gao T, Chen J, Li X, Song H, Huang G. Investigation on Strain Hardening and Failure in Notched Tension Specimens of Cold Rolled Ti6Al4V Titanium Alloy. Materials. 2022; 15(10):3429. https://doi.org/10.3390/ma15103429
Chicago/Turabian StyleZhang, Hao, Tao Gao, Jian Chen, Xunpeng Li, Haipeng Song, and Ganyun Huang. 2022. "Investigation on Strain Hardening and Failure in Notched Tension Specimens of Cold Rolled Ti6Al4V Titanium Alloy" Materials 15, no. 10: 3429. https://doi.org/10.3390/ma15103429