
Filament Transport Control for Enhancing Mechanical Properties of Parts Realised by Fused Filament Fabrication


Abstract
:1. Introduction
2. Materials and Methods
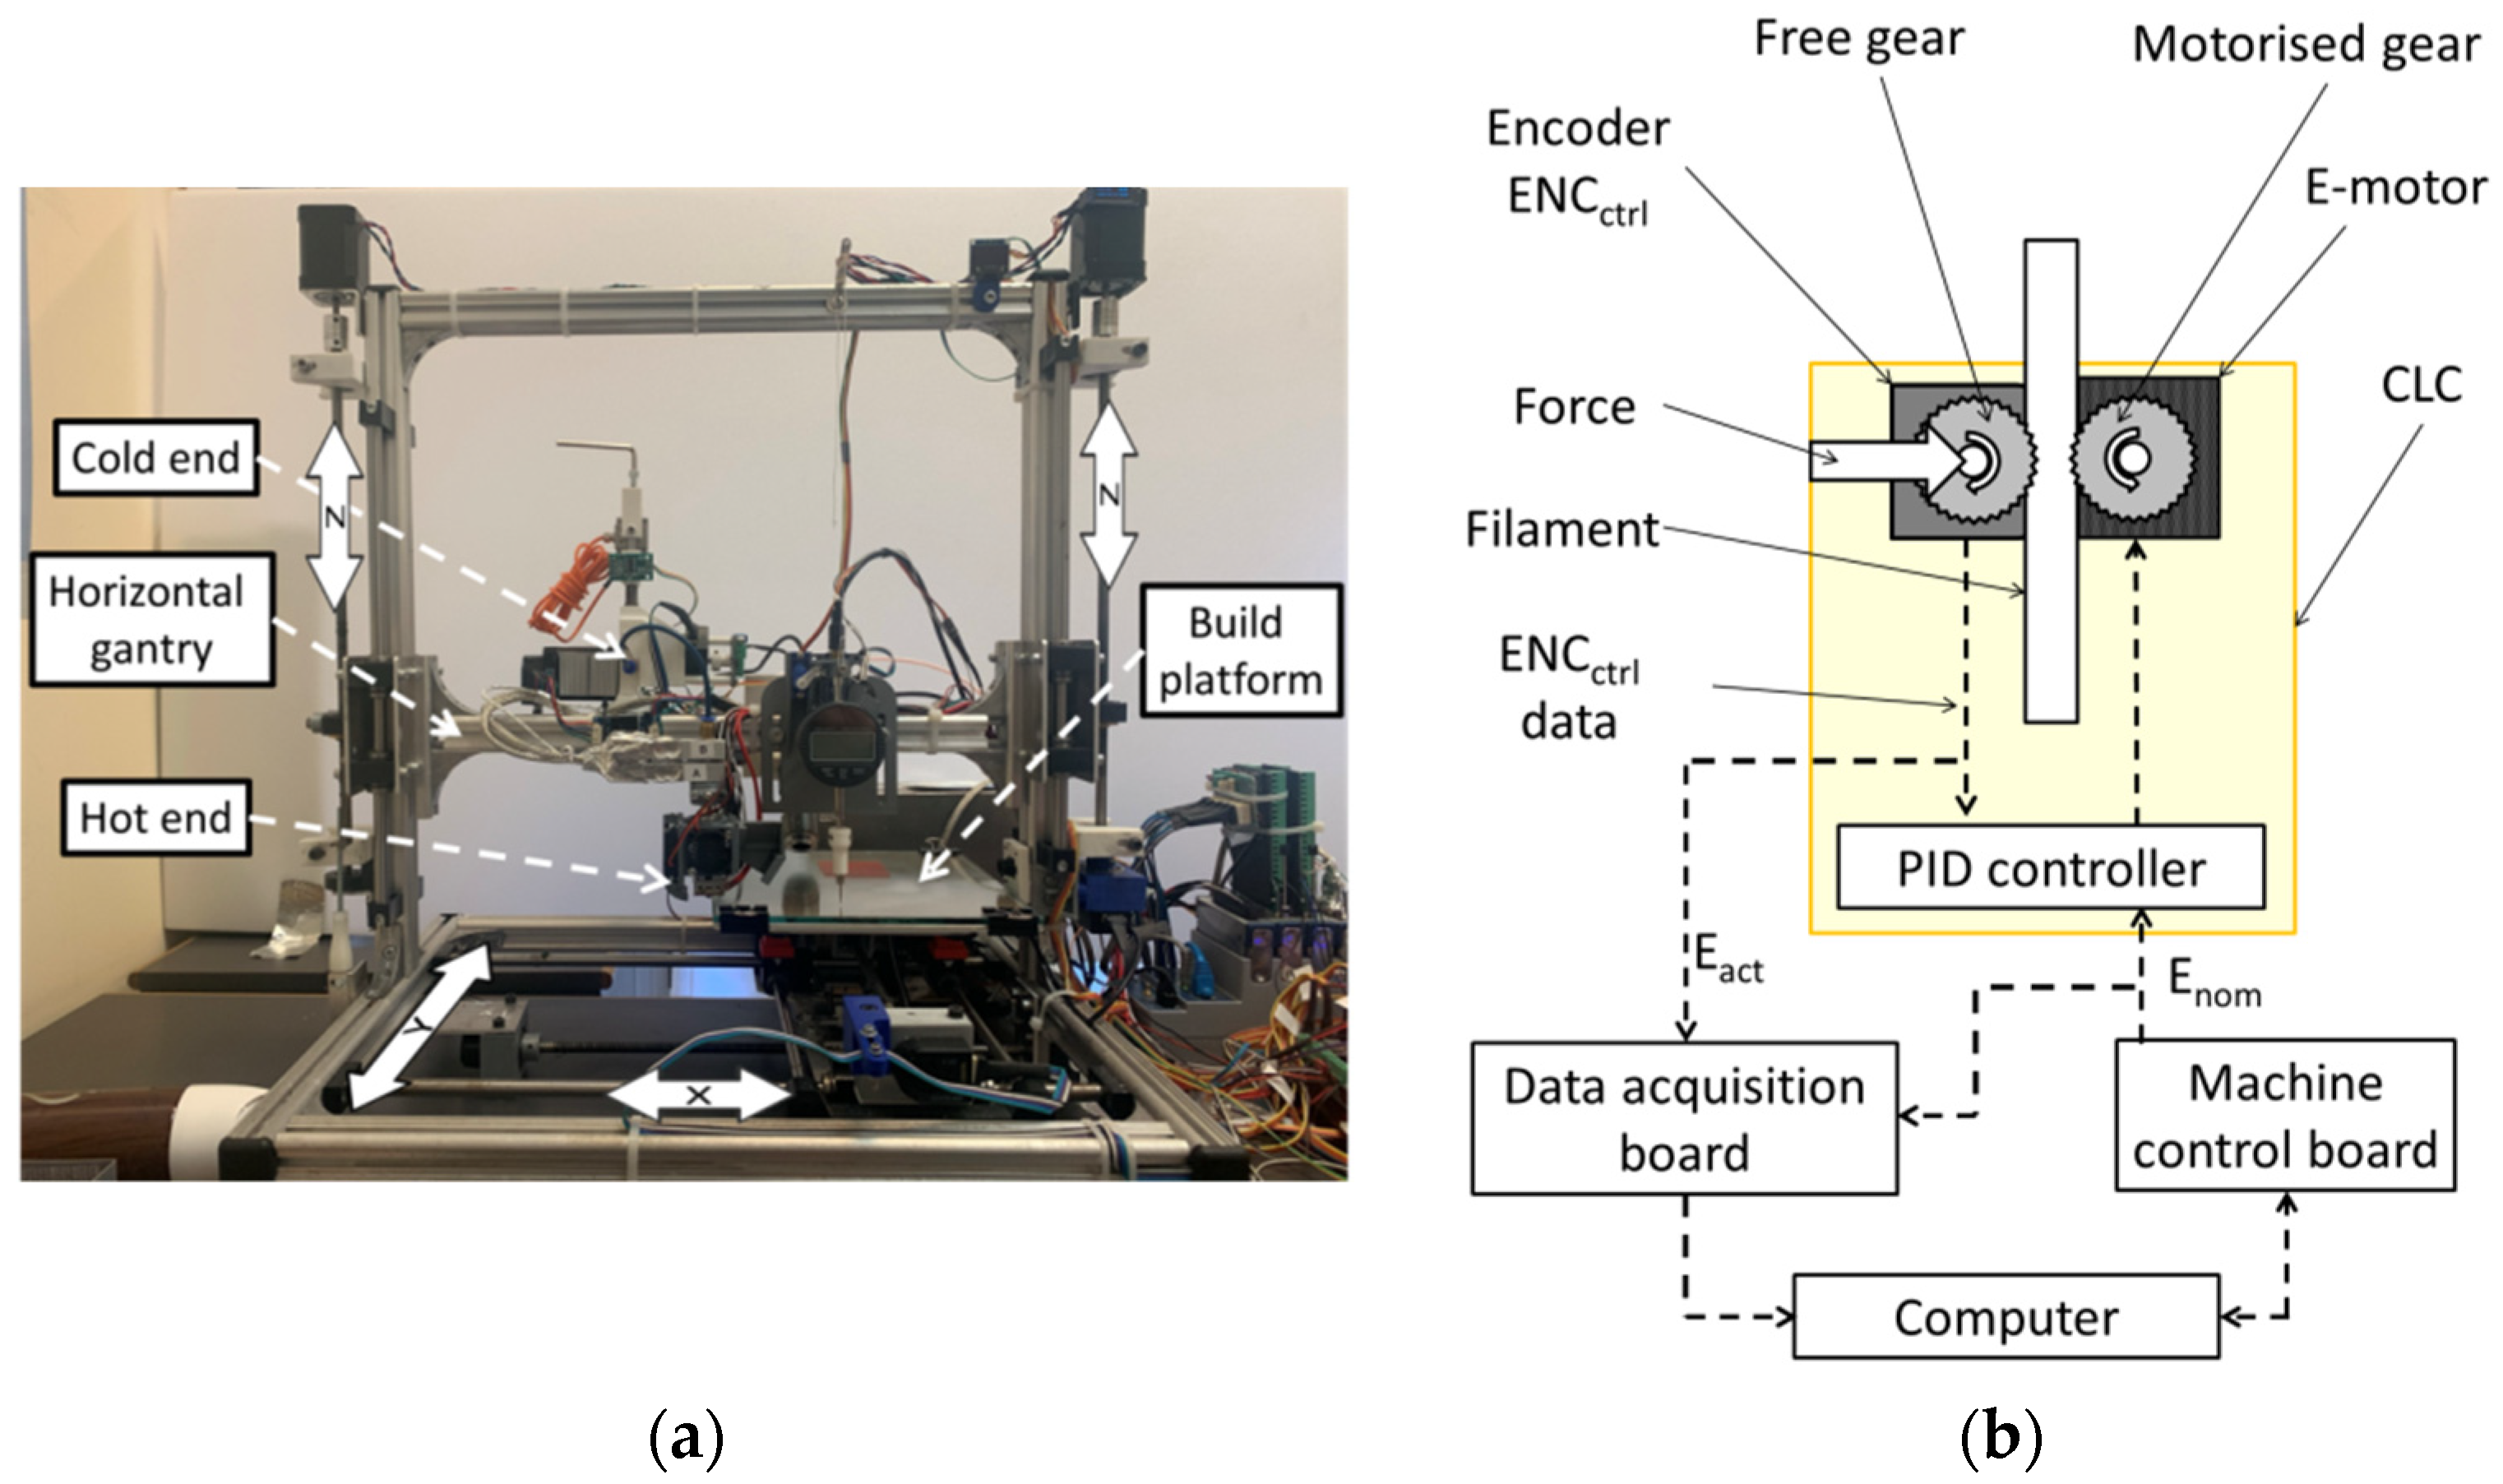
2.1. FFF Prototype Machine and Filament Transport Control
Filament Transport Control System
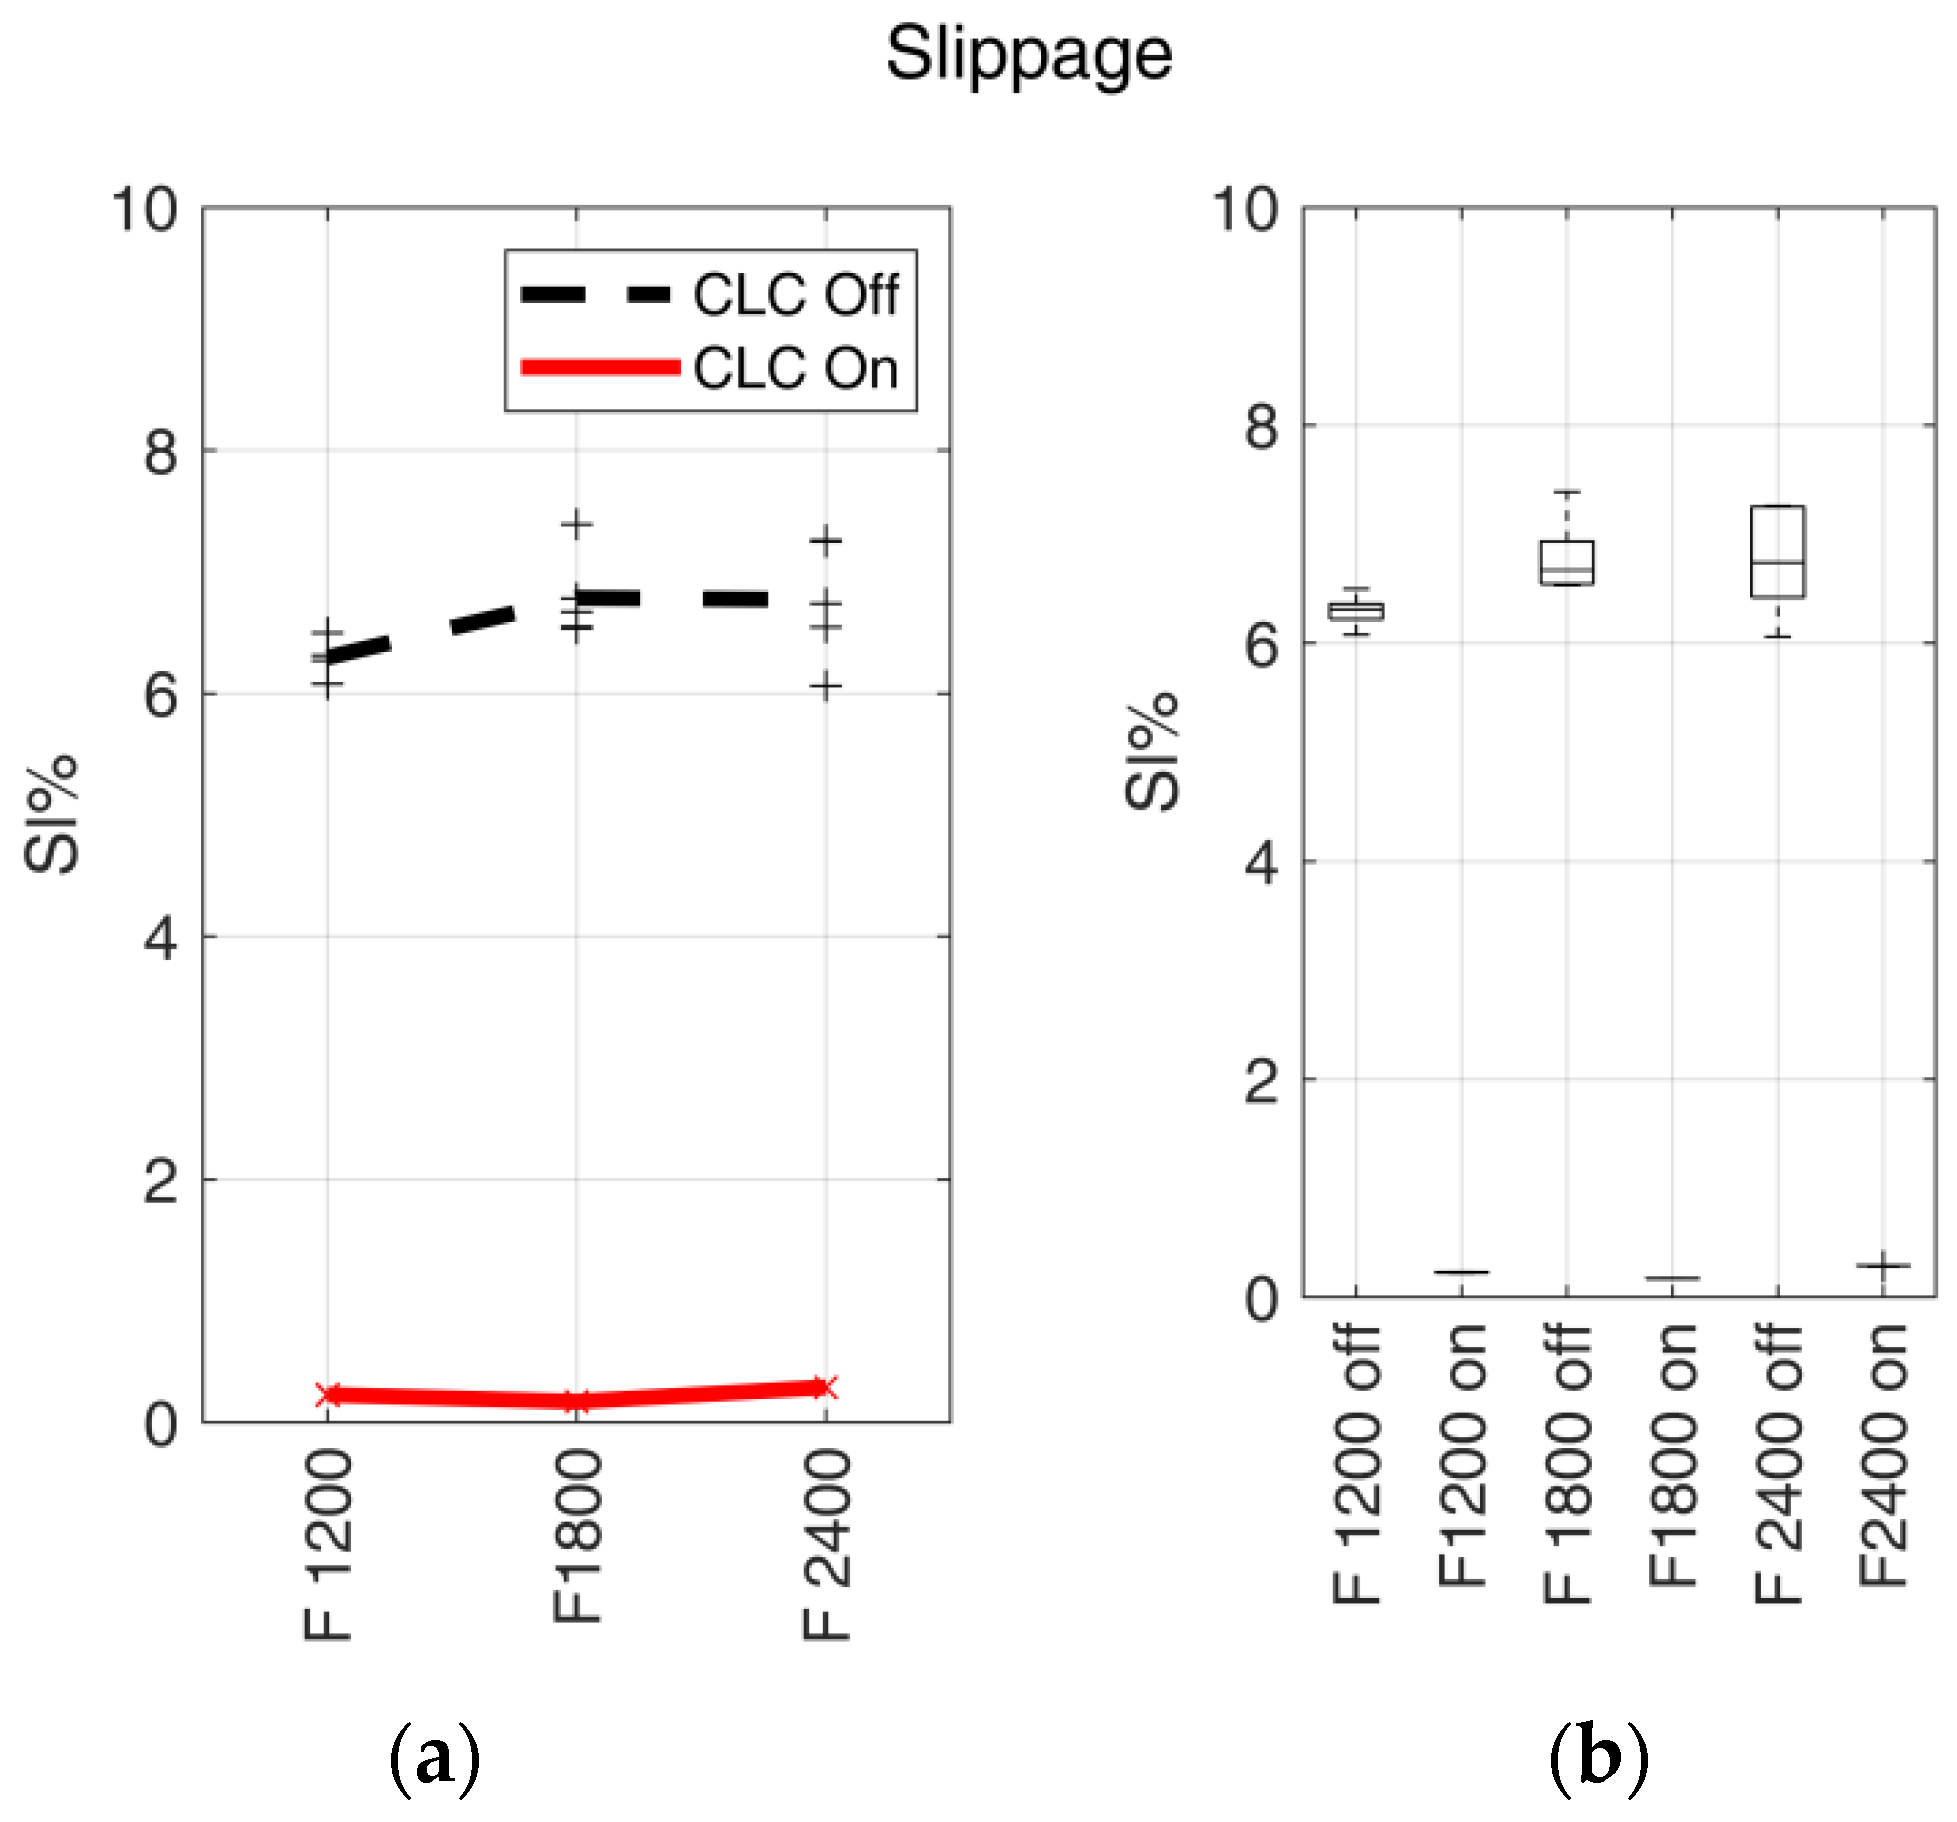
2.2. Slippage Definition
2.3. Sample Geometry
2.4. Material
2.5. Test Plan and Process Parameters
2.6. Sample Orientation and G-Code Preparation
2.7. Sample Manufacturing, Conditioning and Data Acquisition
2.8. Tensile Test Machine and Test Parameters
2.9. DMA and Test Parameters
2.10. Quantitative Assessment of Results
- : mean value of slippage (obtained from in-process data)
- : ultimate tensile strength (from tensile test)
- : elongation at break (from tensile test)
- : Young’s modulus, growth direction (from tensile test)
- : flexural Young’s modulus, perpendicular to growth direction (from DMA).
3. Results
3.1. Slippage
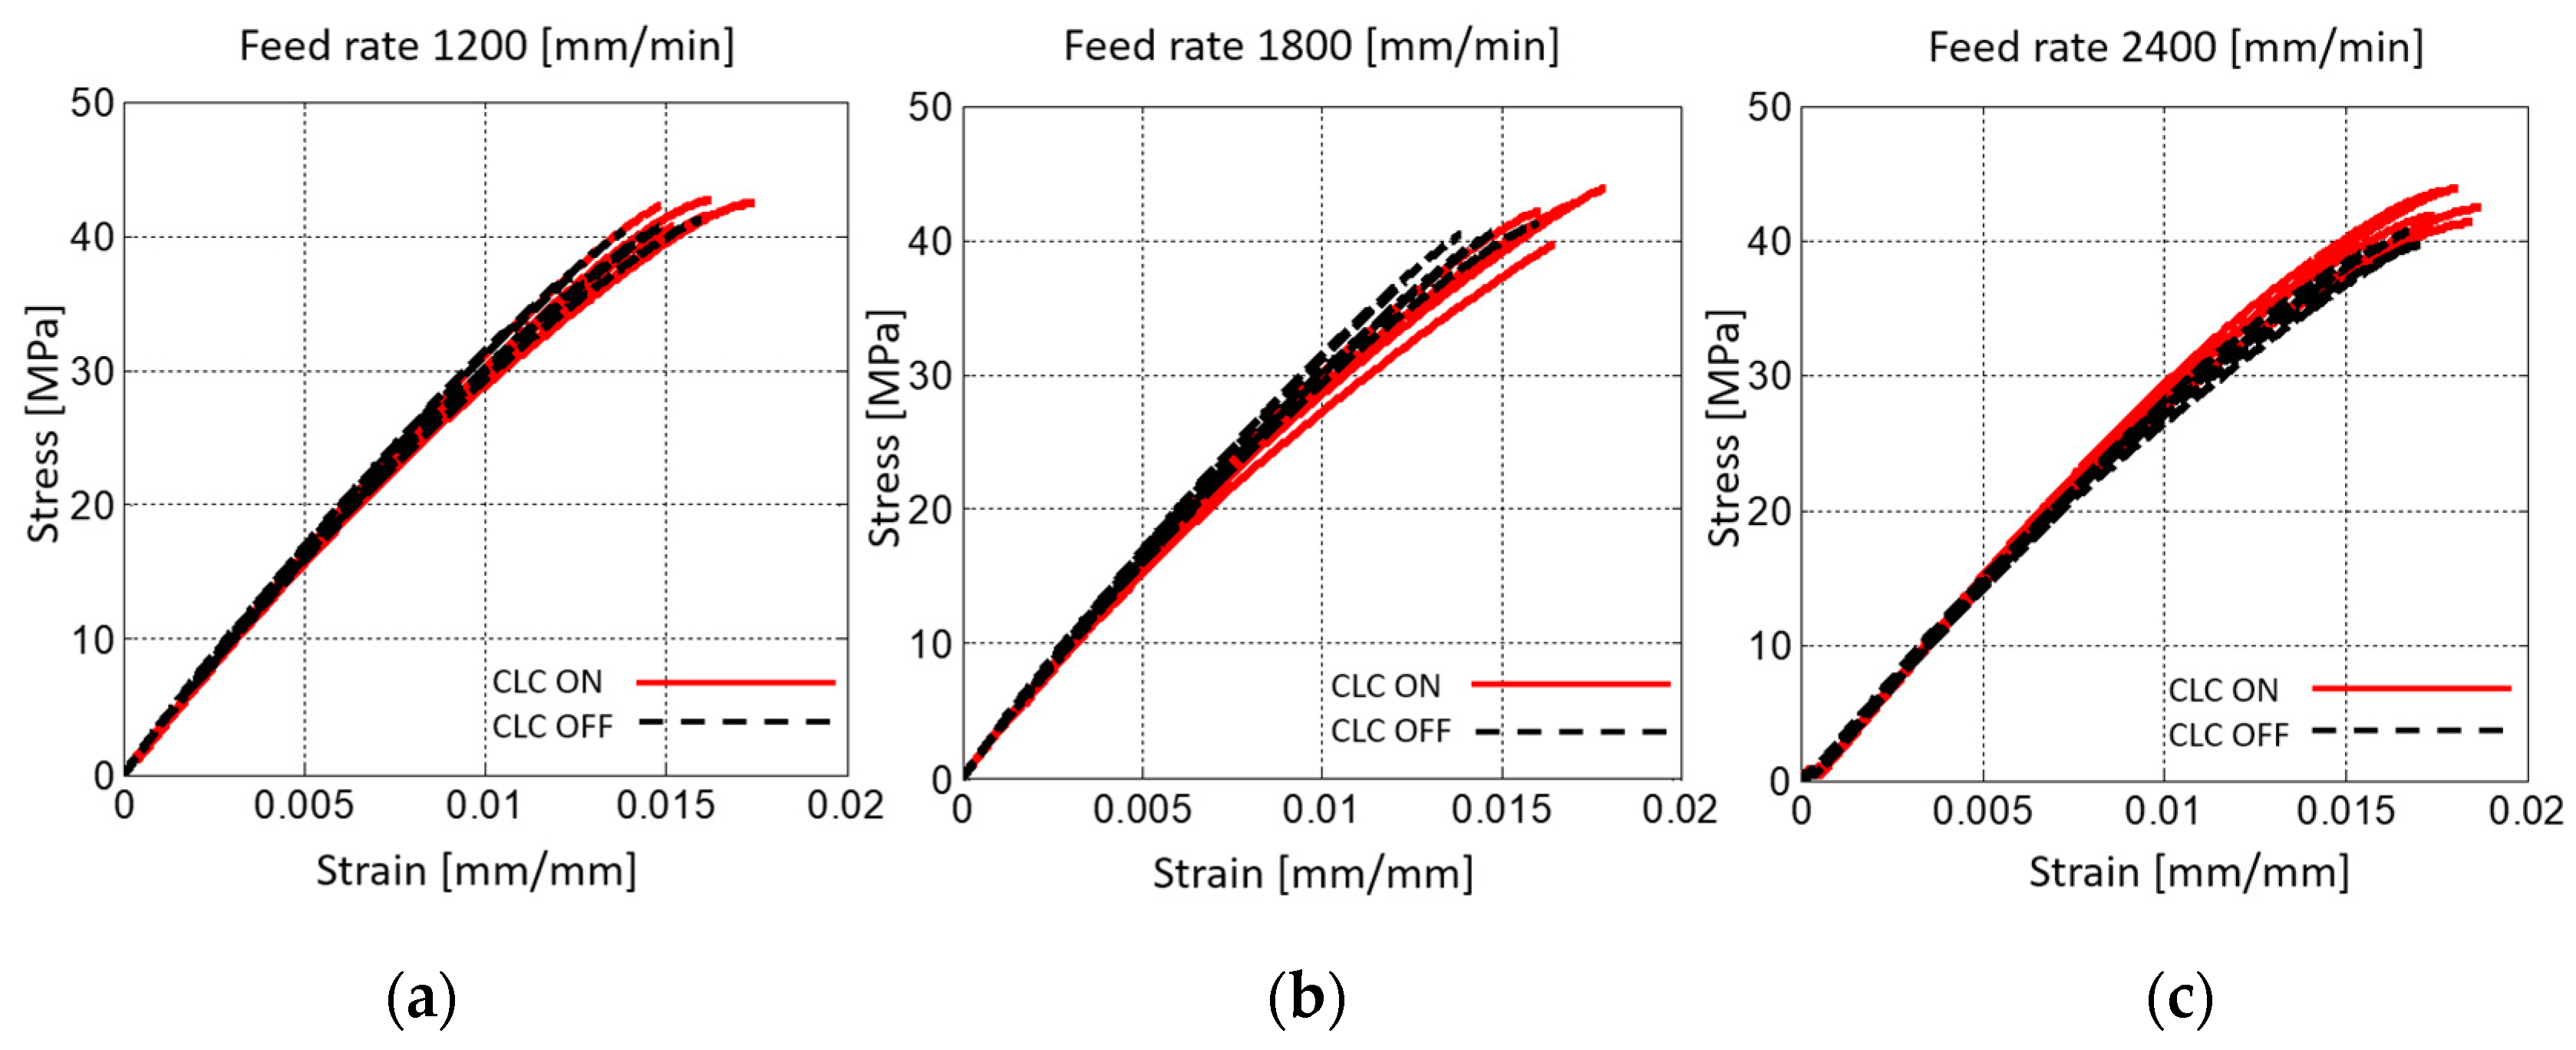
3.2. Tensile Test
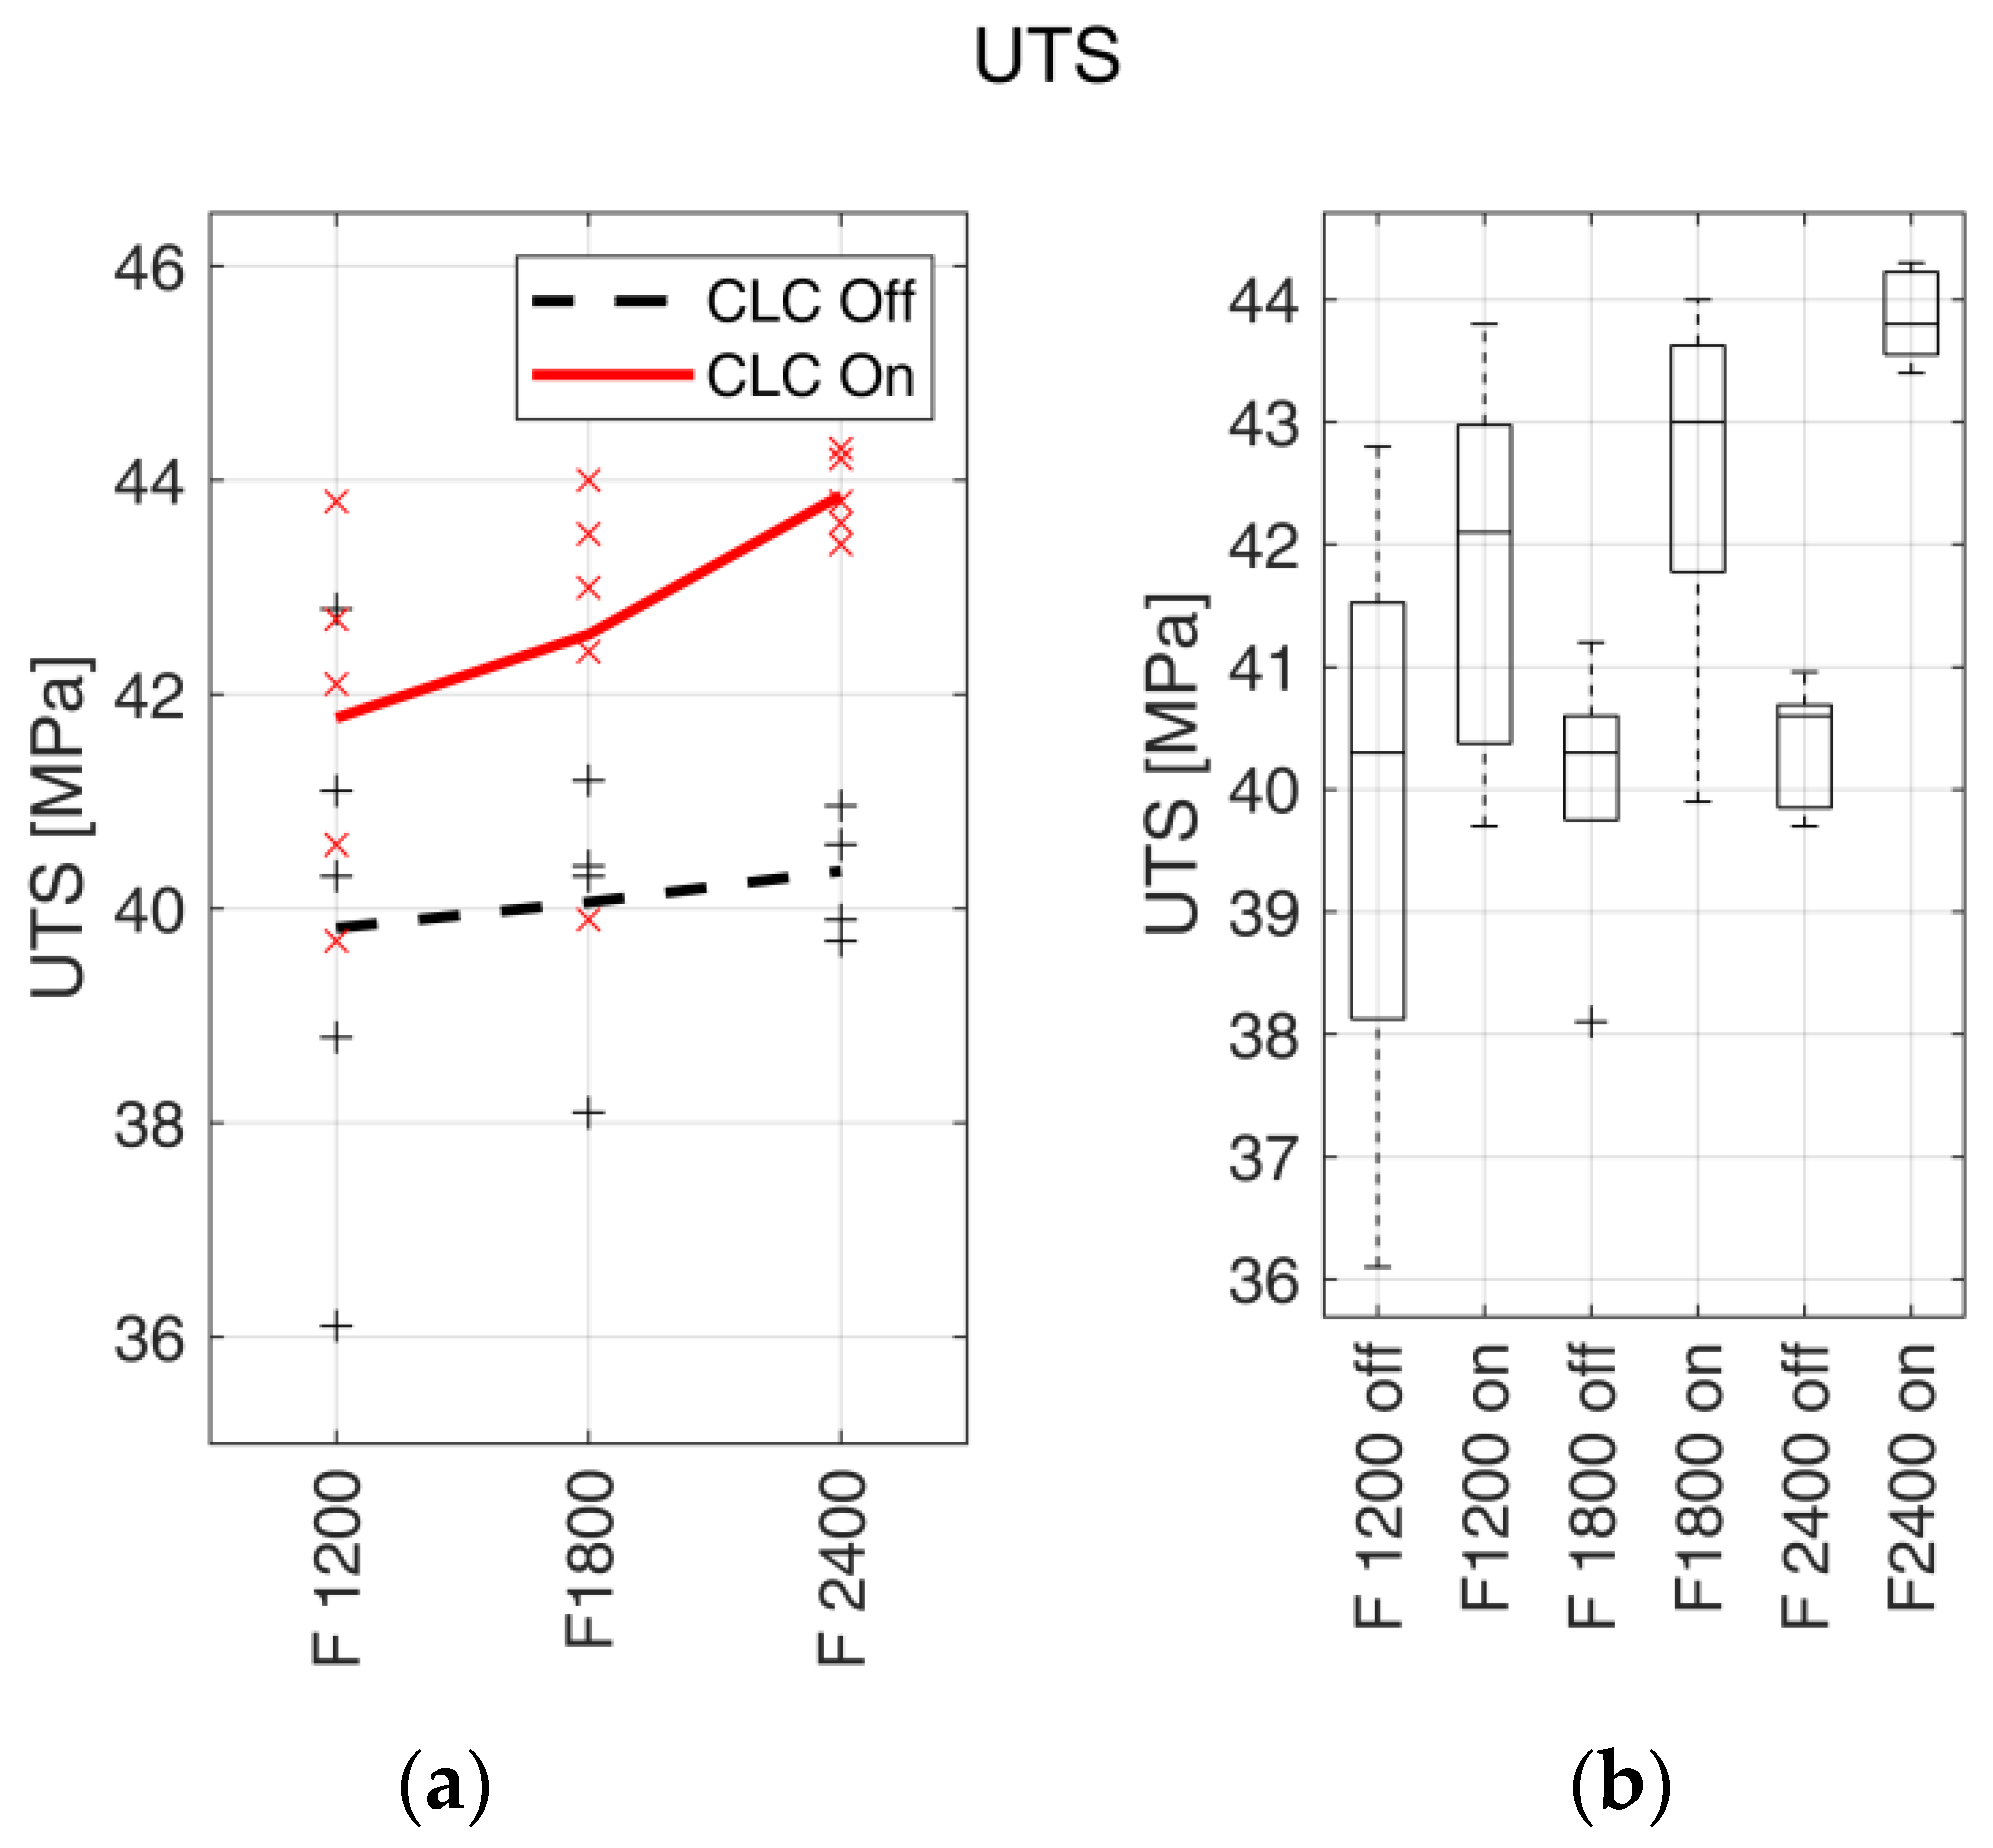
3.2.1. UTS
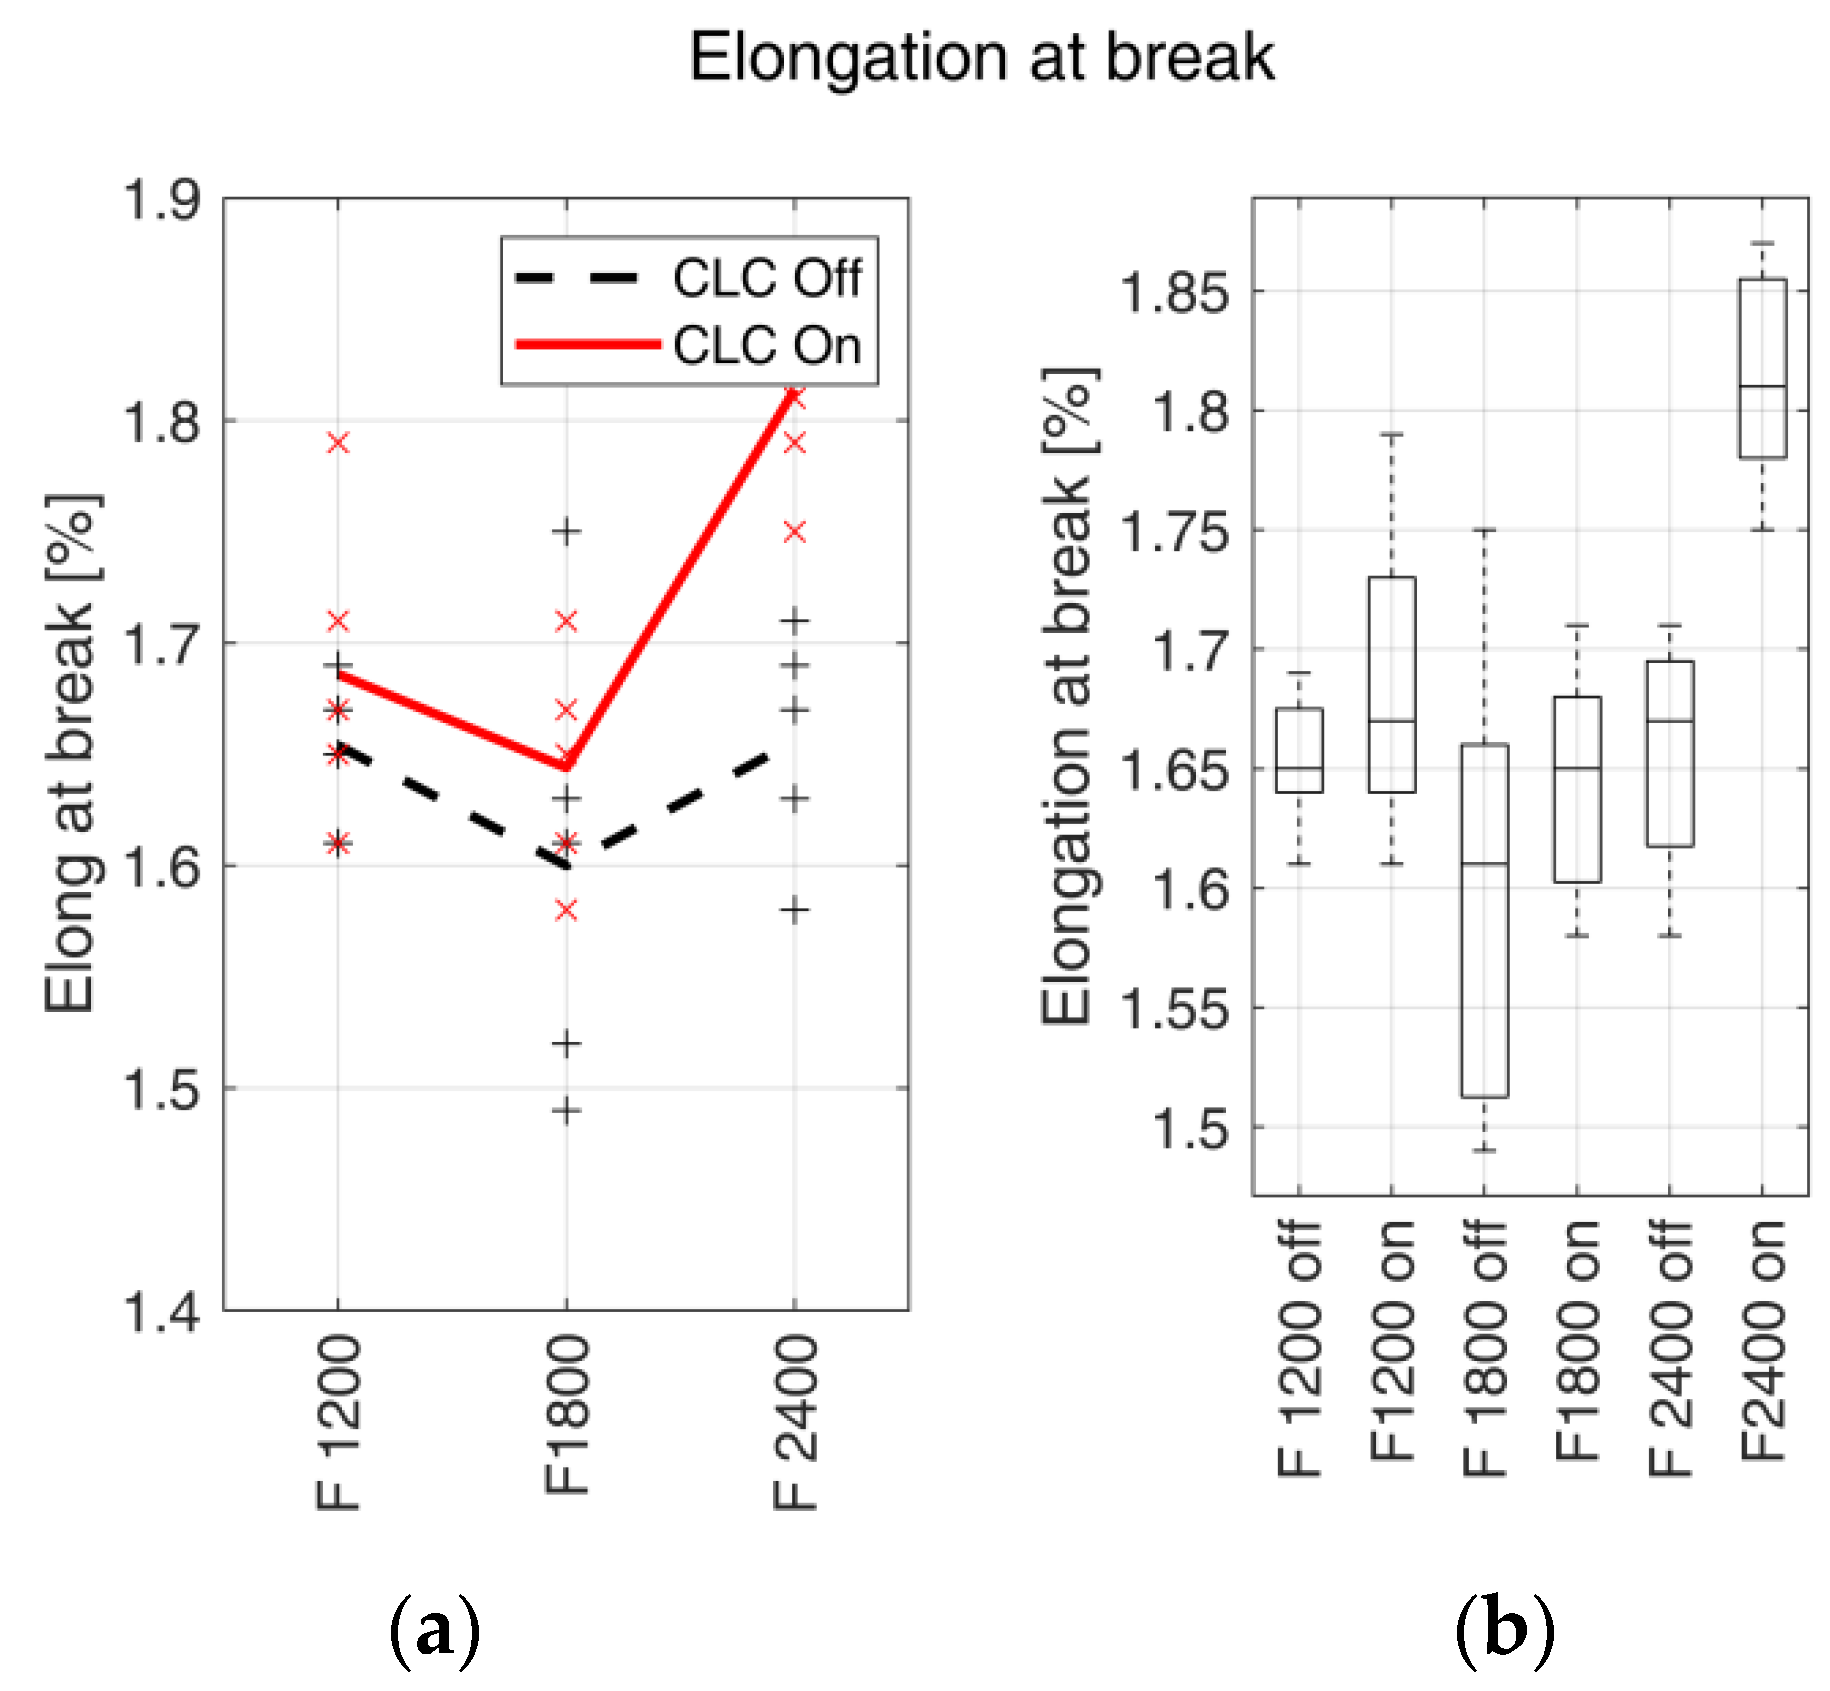
3.2.2. Elongation at Break
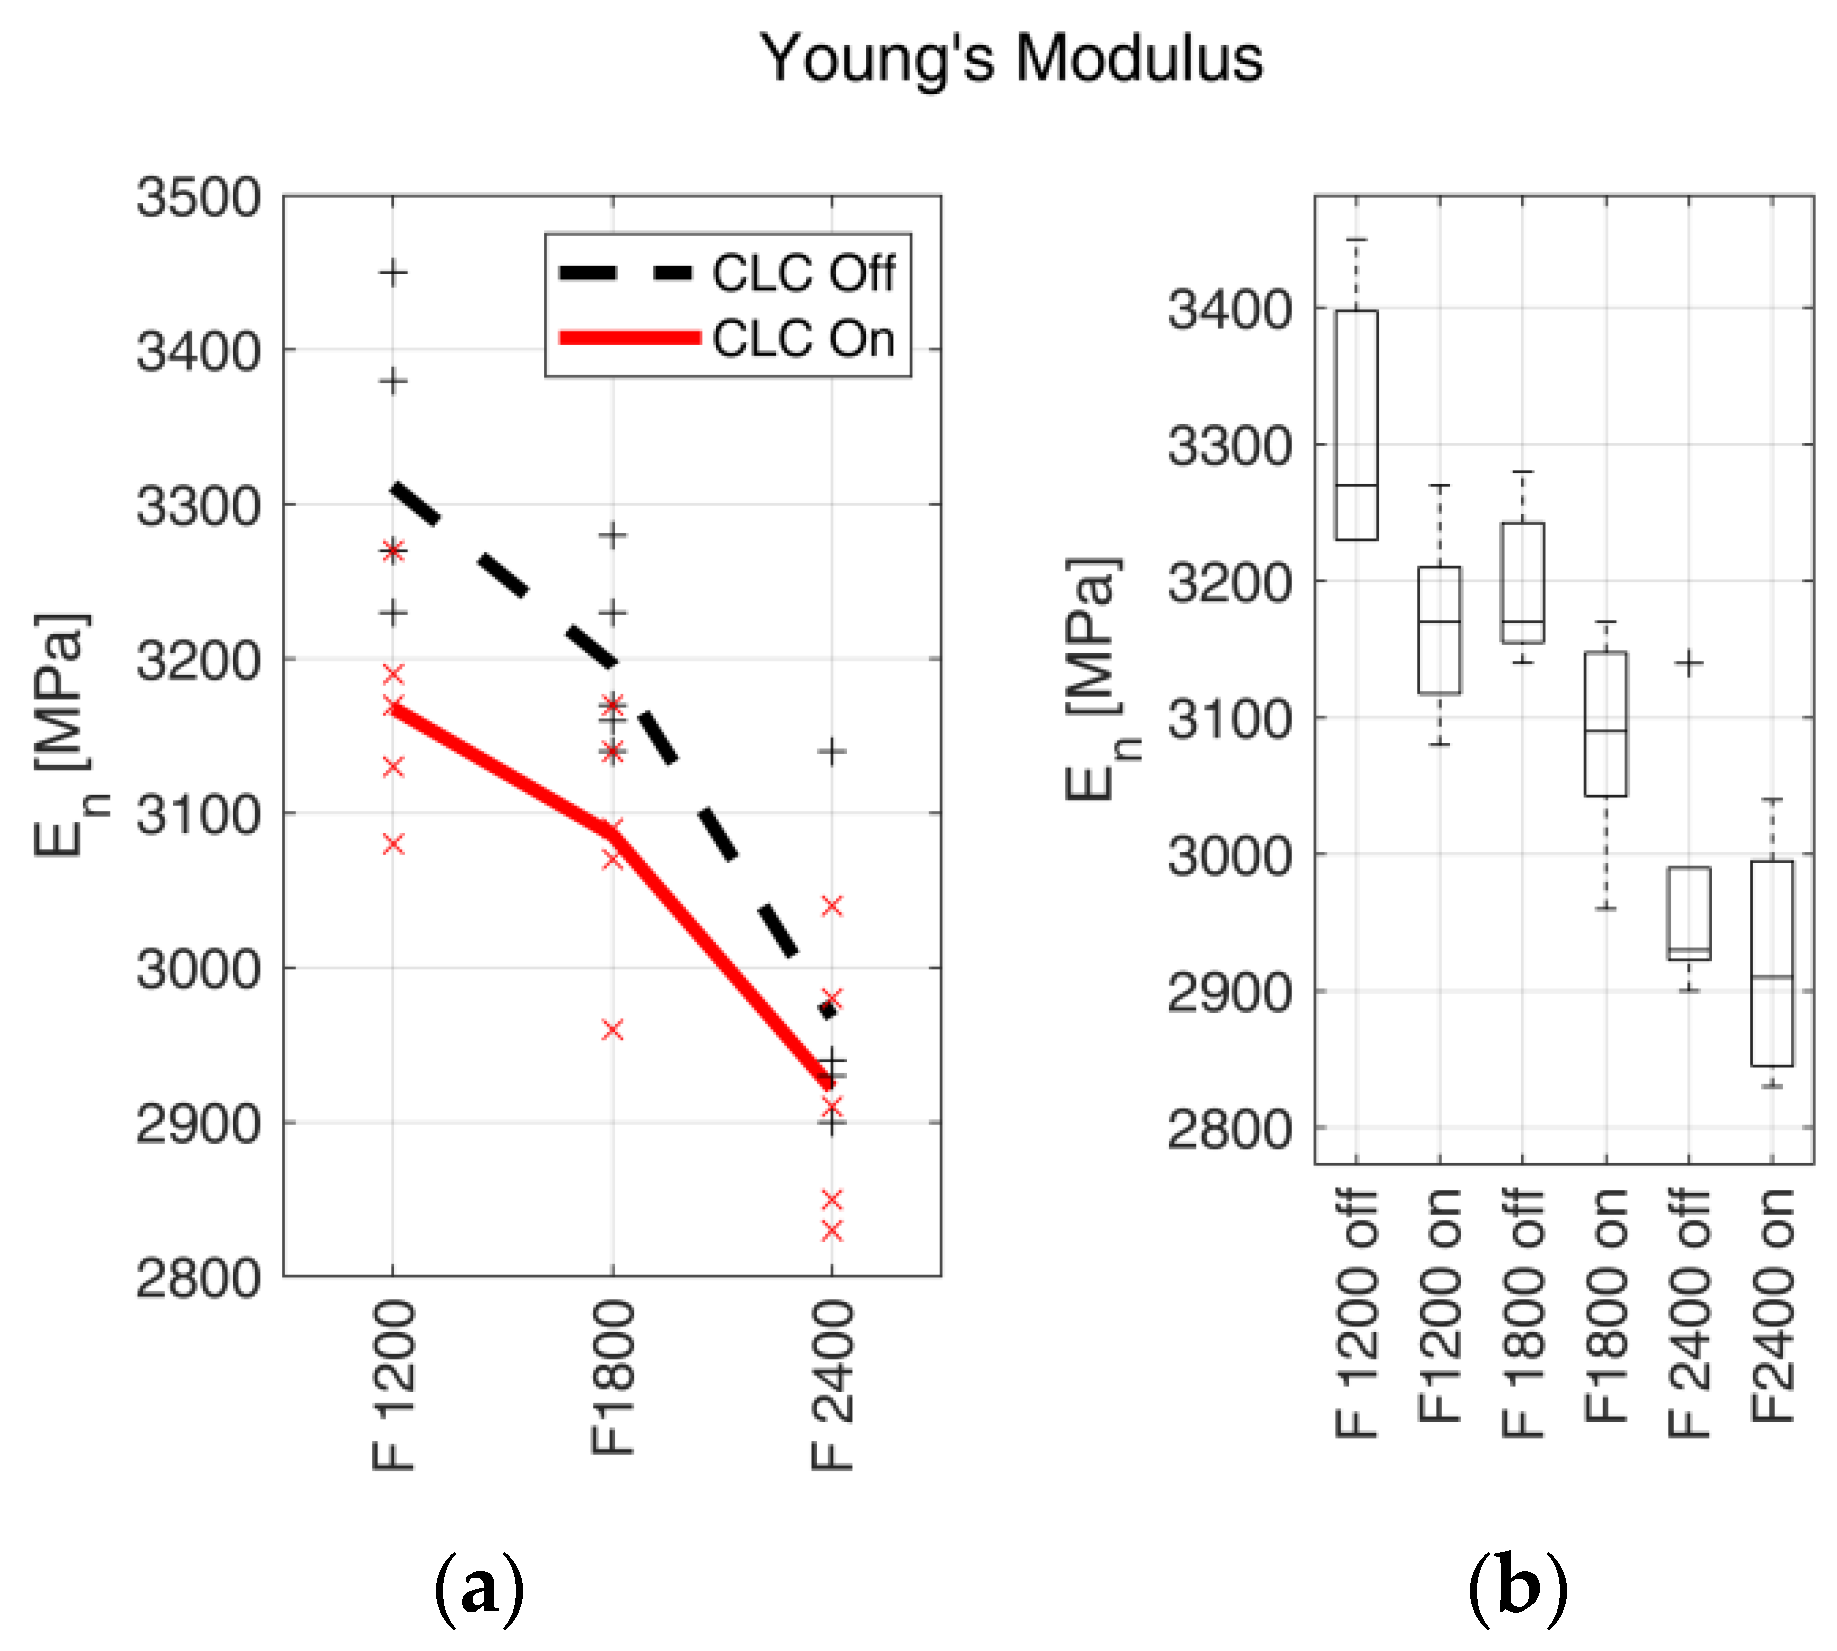
3.2.3. Young’s Modulus
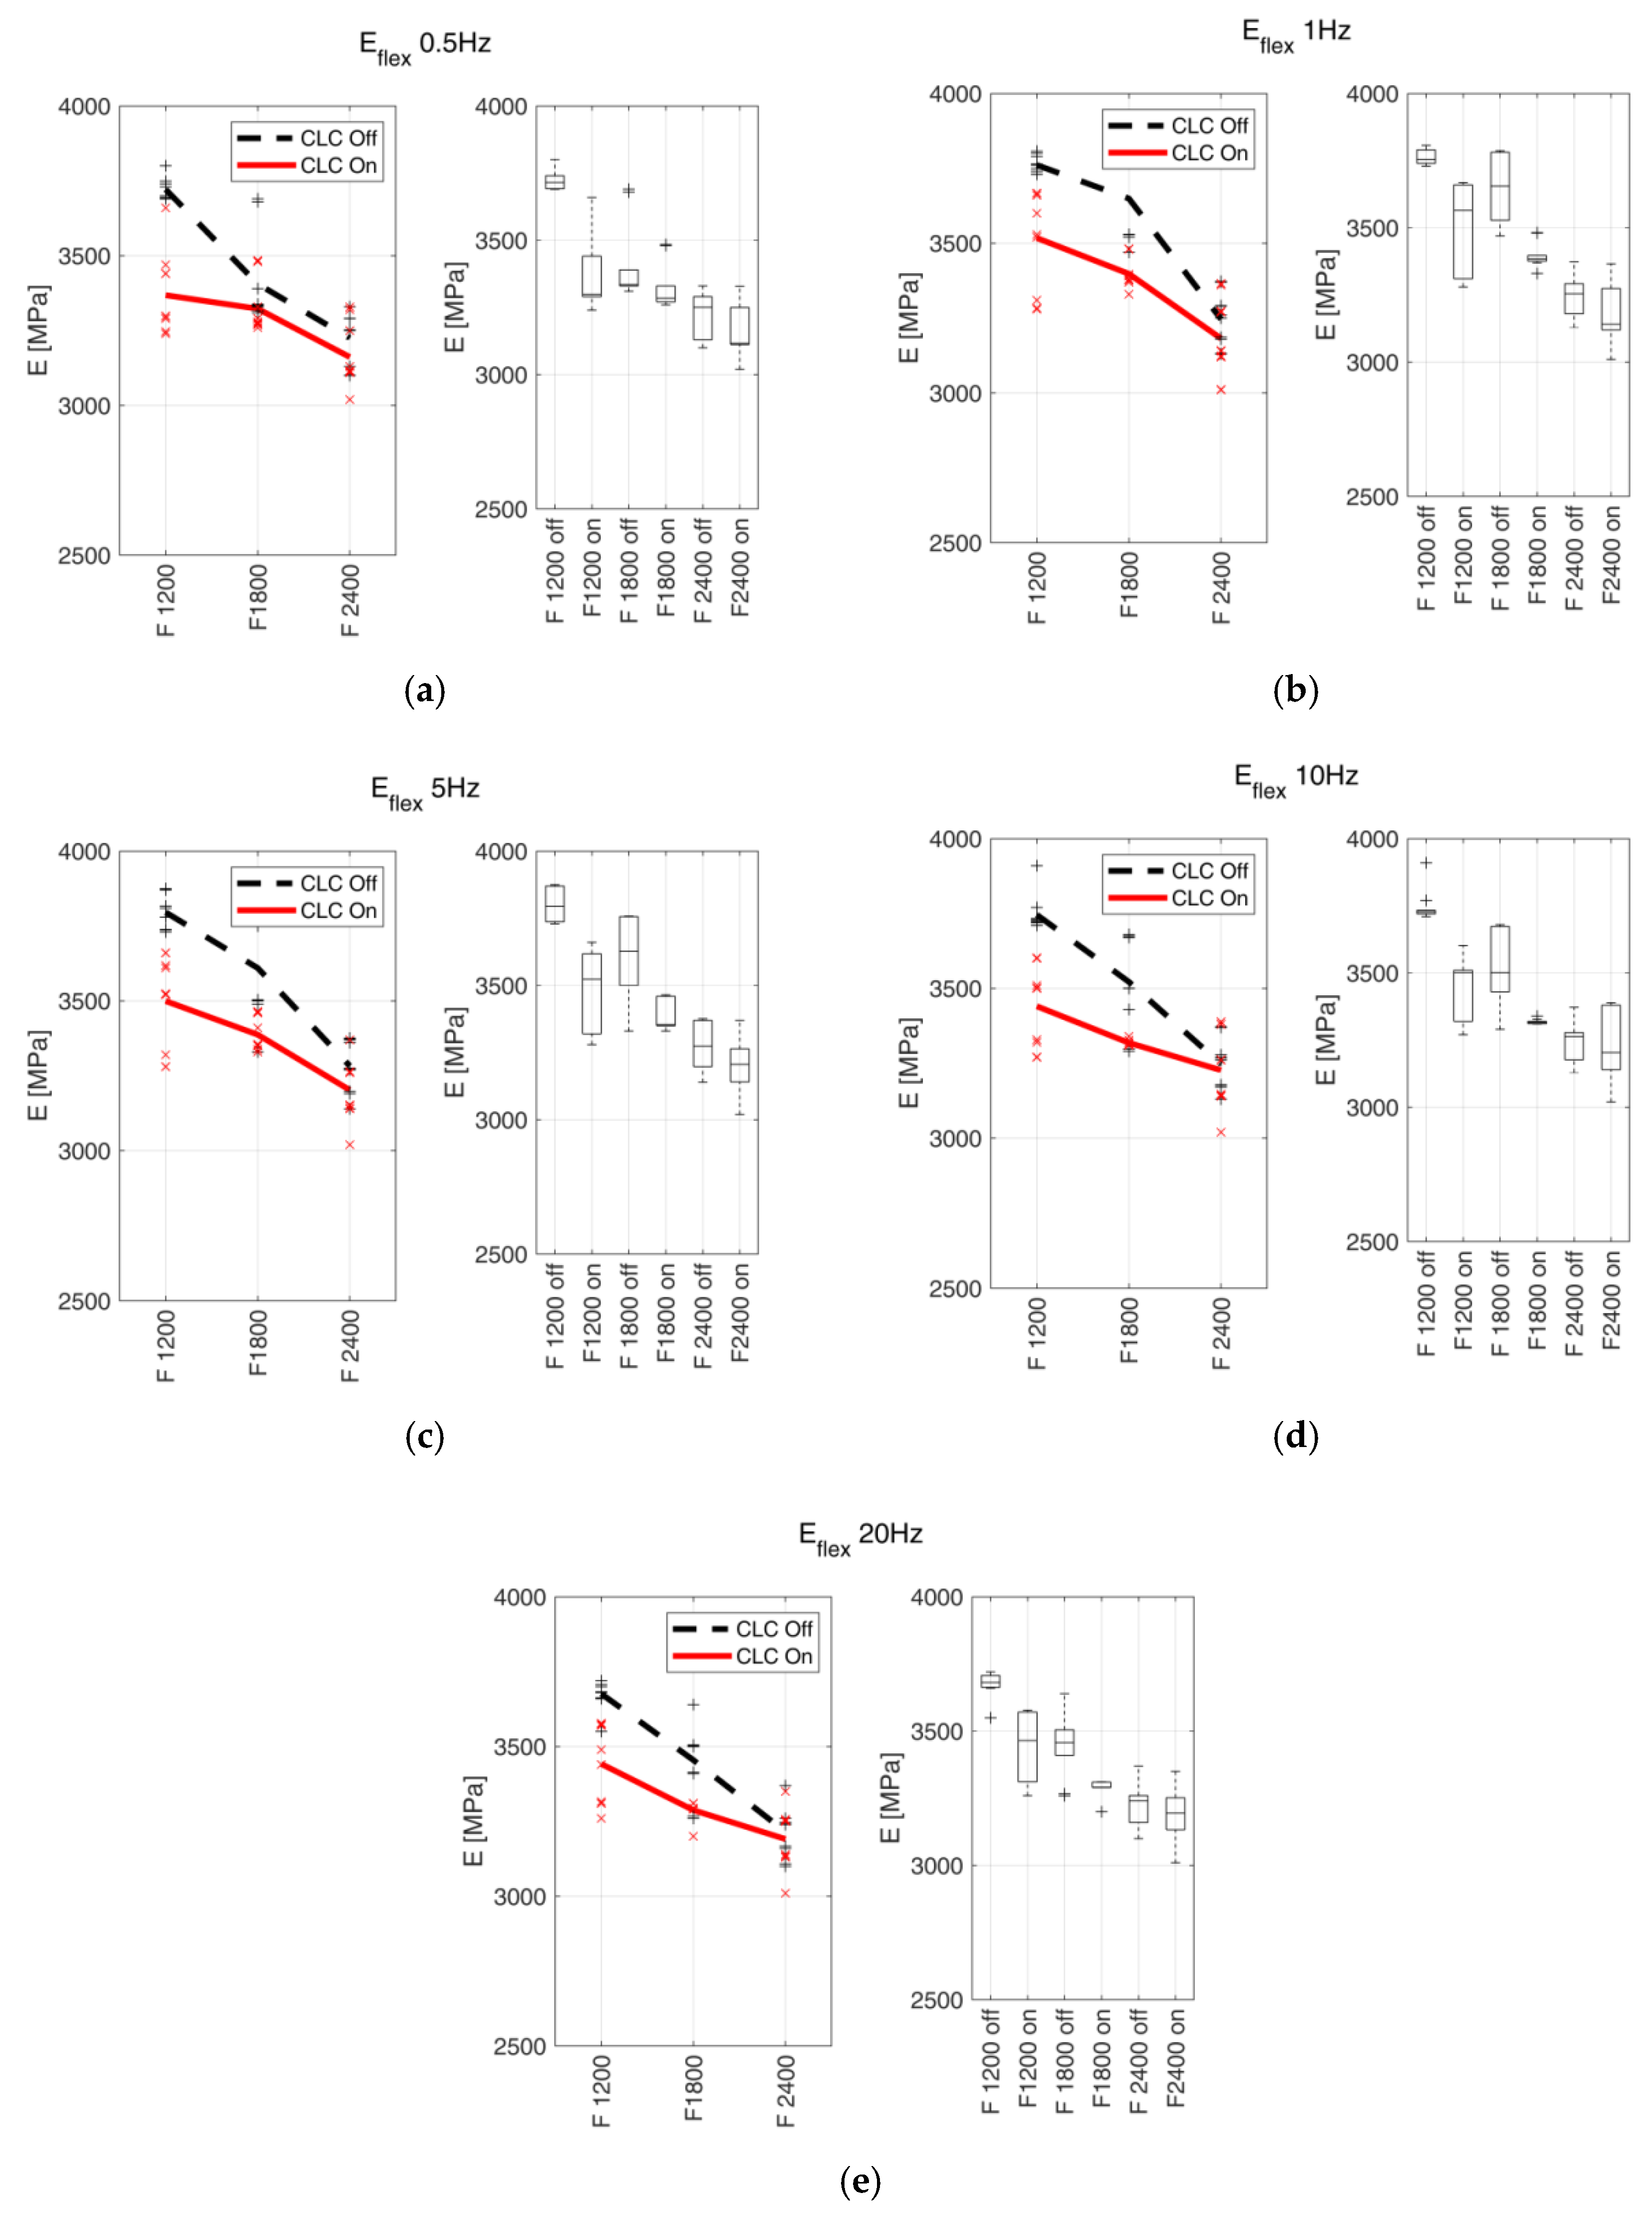
3.3. Dynamic Mechanical Analysis
4. Discussion
4.1. Slippage
4.2. Tensile Test
4.2.1. UTS
4.2.2. Elongation at Break
4.2.3. Elasticity
4.3. DMA
5. Conclusions
Author Contributions
Funding
Institutional Review Board Statement
Informed Consent Statement
Conflicts of Interest
References
- Vyavahare, S.; Teraiya, S.; Panghal, D.; Kumar, S. Fused deposition modelling: A review. Rapid Prototyp. J. 2020, 26, 176–201. [Google Scholar] [CrossRef]
- Gibson, I.; Rosen, D.W.; Stucker, B. Additive Manufacturing Technologies; Springer: Berlin/Heidelberg, Germany, 2014. [Google Scholar]
- Youssef, A.; Hollister, S.J.; Dalton, P.D. Additive manufacturing of polymer melts for implantable medical devices and scaffolds. Biofabrication 2017, 9, 012002. [Google Scholar] [CrossRef] [PubMed]
- Maurizi, M.; Slavič, J.; Cianetti, F.; Jerman, M.; Valentinčič, J.; Lebar, A.; Boltežar, M. Dynamic measurements using FDM 3D-printed embedded strain sensors. Sensors 2019, 19, 2661. [Google Scholar] [CrossRef] [PubMed] [Green Version]
- Jaksic, N.I.; Desai, P.D. Characterization of 3D-printed capacitors created by fused filament fabrication using electrically-conductive filament. Procedia Manuf. 2019, 38, 33–41. [Google Scholar] [CrossRef]
- Ghomi, E.R.; Eshkalak, S.K.; Singh, S.; Chinnappan, A.; Ramakrishna, S.; Narayan, R. Fused filament printing of specialized biomedical devices: A state-of-the art review of technological feasibilities with PEEK. Rapid Prototyp. J. 2021, 27, 592–616. [Google Scholar] [CrossRef]
- Koch, C.; van Hulle, L.; Rudolph, N. Investigation of mechanical anisotropy of the fused filament fabrication process via customized tool path generation. Addit. Manuf. 2017, 16, 138–145. [Google Scholar] [CrossRef]
- Li, H.; Wang, T.; Sun, J.; Yu, Z. The effect of process parameters in fused deposition modelling on bonding degree and mechanical properties. Rapid Prototyp. J. 2018, 24, 80–92. [Google Scholar] [CrossRef]
- Vanaei, H.R.; Raissi, K.; Deligant, M.; Shirinbayan, M.; Fitoussi, J.; Khelladi, S.; Tcharkhtchi, A. Toward the understanding of temperature effect on bonding strength, dimensions and geometry of 3D-printed parts. J. Mater. Sci. 2020, 55, 14677–14689. [Google Scholar] [CrossRef]
- Nienhaus, V.; Spiehl, D.; Dörsam, E. Investigations on roller-based filament drives. J. Manuf. Mater. Process. 2021, 5, 53. [Google Scholar] [CrossRef]
- Moretti, M.; Rossi, A.; Senin, N. In-process simulation of the extrusion to support optimisation and real-time monitoring in fused filament fabrication. Addit. Manuf. 2021, 38, 101817. [Google Scholar] [CrossRef]
- Moretti, M.; Rossi, A. Closed loop filament feed control in fused filament fabrication. 3D Print. Addit. Manuf. 2021. [Google Scholar] [CrossRef]
- Greeff, G.P.; Schilling, M. Closed loop control of slippage during filament transport in molten material extrusion. Addit. Manuf. 2017, 14, 31–38. [Google Scholar] [CrossRef]
- Dey, A.; Eagle, I.N.R.; Yodo, N. A review on filament materials for fused filament fabrication. J. Manuf. Mater. Process. 2021, 5, 69. [Google Scholar] [CrossRef]
- Khan, S.; Joshi, K.; Deshmukh, S. A comprehensive review on effect of printing parameters on mechanical properties of FDM printed parts. Mater. Today Proc. 2022, 50, 2119–2127. [Google Scholar] [CrossRef]
- Harris, M.; Potgieter, J.; Archer, R.; Arif, K.M. Effect of material and process specific factors on the strength of printed parts in fused filament fabrication: A review of recent developments. Materials 2019, 12, 1664. [Google Scholar] [CrossRef] [Green Version]
- Corapi, D.; Morettini, G.; Pascoletti, G.; Zitelli, C. Characterization of a polylactic acid (PLA) produced by Fused Deposition Modeling (FDM) technology. Procedia Struct. Integr. 2019, 24, 289–295. [Google Scholar] [CrossRef]
- Sun, Q.; Rizvi, G.M.; Bellehumeur, C.T.; Gu, P. Effect of processing conditions on the bonding quality of FDM polymer filaments. Rapid Prototyp. J. 2008, 14, 72–80. [Google Scholar] [CrossRef]
- Coogan, T.J.; Kazmer, D.O. Modeling of interlayer contact and contact pressure during fused filament fabrication. J. Rheol. 2019, 63, 655–672. [Google Scholar] [CrossRef]
- Chacón, J.M.; Caminero, M.A.; García-Plaza, E.; Núñez, P.J. Additive manufacturing of PLA structures using fused deposition modelling: Effect of process parameters on mechanical properties and their optimal selection. Mater. Des. 2017, 124, 143–157. [Google Scholar] [CrossRef]
- Durgun, I.; Ertan, R. Experimental investigation of FDM process for improvement of mechanical properties and production cost. Rapid Prototyp. J. 2014, 20, 228–235. [Google Scholar] [CrossRef]
- Gordelier, T.J.; Thies, P.R.; Turner, L.; Johanning, L. Optimising the FDM additive manufacturing process to achieve maximum tensile strength: A state-of-the-art review. Rapid Prototyp. J. 2019, 25, 953–971. [Google Scholar] [CrossRef]
- Pollard, D.; Ward, C.; Herrmann, G.; Etches, J. Filament Temperature Dynamics in Fused Deposition Modelling and Outlook for Control. Procedia Manuf. 2017, 11, 536–544. [Google Scholar] [CrossRef]
- Kuznetsov, V.E.; Solonin, A.N.; Tavitov, A.; Urzhumtsev, O.; Vakulik, A. Increasing strength of FFF three-dimensional printed parts by influencing on temperature-related parameters of the process. Rapid Prototyp. J. 2020, 26, 107–121. [Google Scholar] [CrossRef]
- Prajapati, H.; Salvi, S.S.; Ravoori, D.; Qasaimeh, M.; Adnan, A.; Jain, A. Improved print quality in fused filament fabrication through localized dispensing of hot air around the deposited filament. Addit. Manuf. 2021, 40, 101917. [Google Scholar] [CrossRef]
- Du, J.; Wei, Z.; Wang, X.; Wang, J.; Chen, Z. An improved fused deposition modeling process for forming large-size thin-walled parts. J. Mater. Process. Technol. 2016, 234, 332–341. [Google Scholar] [CrossRef]
- Zekavat, A.R.; Jansson, A.; Larsson, J.; Pejryd, L. Investigating the effect of fabrication temperature on mechanical properties of fused deposition modeling parts using X-ray computed tomography. Int. J. Adv. Manuf. Technol. 2019, 100, 287–296. [Google Scholar] [CrossRef] [Green Version]
- Duddleston, L.J.L.; Woznick, K.; Koch, C.; Capote, G.M.; Rudolph, N.; Osswald, T.A. Extrudate mass flow rate analysis in Fused Filament Fabrication (FFF): A cursory investigation of the effects of printer parameters. Annu. Tech. Conf.—ANTEC Conf. Proc. 2017, 2017, 43–48. [Google Scholar]
- Go, J.; Schiffres, S.N.; Stevens, A.G.; Hart, A.J. Rate limits of additive manufacturing by fused filament fabrication and guidelines for high-throughput system design. Addit. Manuf. 2017, 16, 1–11. [Google Scholar] [CrossRef]
- Singh, S.; Singh, G.; Prakash, C.; Ramakrishna, S. Current status and future directions of fused filament fabrication. J. Manuf. Process. 2020, 55, 288–306. [Google Scholar] [CrossRef]
- Santana, L.; Ahrens, C.H.; Da Costa Sabino Netto, A.; Bonin, C. Evaluating the deposition quality of parts produced by an open-source 3D printer. Rapid Prototyp. J. 2017, 23, 796–803. [Google Scholar] [CrossRef]
- Loh, G.H.; Pei, E.; Gonzalez-Gutierrez, J.; Monzón, M. An overview of material extrusion troubleshooting. Appl. Sci. 2020, 10, 4776. [Google Scholar] [CrossRef]
- Kazmer, D.O.; Colon, A.R.; Peterson, A.M.; Kim, S.K. Concurrent characterization of compressibility and viscosity in extrusion-based additive manufacturing of acrylonitrile butadiene styrene with fault diagnoses. Addit. Manuf. 2021, 46, 102106. [Google Scholar] [CrossRef]
- Moretti, M.; Bianchi, F.; Senin, N. Towards the development of a smart Fused Filament Fabrication system using multi-sensor data fusion for in-process monitoring. Rapid Prototyp. J. 2020, 26, 1249–1261. [Google Scholar] [CrossRef]
- ASTM. ASTM D638-14: Standard Test Method for Tensile Properties of Plastics. 2014. Available online: https://www.astm.org/Standards/D638 (accessed on 15 March 2022).
- Kevin, N.M.; Menard, P. Dynamic Mechanical Analysis; CRC Press: Boca Raton, FL, USA, 2020. [Google Scholar]
- Meijer, B. Megatronics v3.2 Datasheet, 2018. 2018. Available online: https://reprapworld.com/datasheets/datasheetmegatronicsv32.pdf (accessed on 8 May 2020).
- Repetier. Software Repetier Host. 2018. Available online: https://www.repetier.com/ (accessed on 8 May 2020).
- National Instruments. Labview. Available online: https://www.ni.com/en-us/shop/labview/labview-details.html (accessed on 15 March 2022).
- Fabbrix. Fabbrix Materials. 2019. Available online: https://www.fabbrix.com/fabbrix-materials (accessed on 20 May 2021).
- Ertay, D.S.; Yuen, A.; Altintas, Y. Synchronized material deposition rate control with path velocity on fused filament fabrication machines. Addit. Manuf. 2018, 19, 205–213. [Google Scholar] [CrossRef] [Green Version]
- Ultimaker. Ultimaker Cura. 2019. Available online: https://ultimaker.com/software/ultimaker-cura (accessed on 8 May 2020).
- Instron. Instron, Mechanical Testing. 2021. Available online: https://instron.com/en/ (accessed on 15 March 2022).
- Mettler Toledo, Dynamic Mechanical Analyzer (DMA) DMA/SDTA 1+. Available online: https://www.mt.com/ch/en/home/products/Laboratory_Analytics_Browse/TA_Family_Browse/DMA/dmasdta1.html (accessed on 15 March 2022).
- Morettini, G.; Palmieri, M.; Capponi, L.; Landi, L. Experimental determination of mechanical properties of PLA FDM 3d-printed structures for dynamic analysis simulation. Prog. Addit. Manuf. 2021. [Google Scholar]
- Palmieri, M.; Zucca, G.; Morettini, G.; Landi, L.; Cianetti, F. Vibration Fatigue of FDM 3D Printed Structures: The Use of Frequency Domain Approach. Materials 2022, 15, 854. [Google Scholar] [CrossRef]
- Tian, X.; Liu, T.; Yang, C.; Wang, Q.; Li, D. Interface and performance of 3D printed continuous carbon fiber reinforced PLA composites. Compos. Part A Appl. Sci. Manuf. 2016, 88, 198–205. [Google Scholar] [CrossRef]
- Wang, S.; Ma, Y.; Deng, Z.; Zhang, S.; Cai, J. Effects of fused deposition modeling process parameters on tensile, dynamic mechanical properties of 3D printed polylactic acid materials. Polym. Test. 2020, 86, 106483. [Google Scholar] [CrossRef]
- Naveed, N. Investigating the material properties and microstructural changes of fused filament fabricated PLA and tough-PLA parts. Polymers 2021, 13, 1487. [Google Scholar] [CrossRef]
- Quintana, J.L.C.; Redmann, A.; Capote, G.A.M.; Pérez-Irizarry, A.; Bechara, A.; Osswald, T.A.; Lakes, R. Viscoelastic properties of fused filament fabrication parts. Addit. Manuf. 2019, 28, 704–710. [Google Scholar] [CrossRef]


| Filament Specifications and Print Settings | |
|---|---|
| Diameter | 1.75 ± 0.05 mm |
| Maximum roundness deviation | 2% |
| Print temperature (T) | 200–215 °C |
| Fabrication feed rate (F) | 40–80 mm/s |
| Test ID | Temperature (°C) | F (mm/min) | Layer Height (mm) | Flow Control (ON/OFF) | Number of Samples STR | Number of Samples SDMA |
|---|---|---|---|---|---|---|
| 1 | 210 | 1200 | 0.2 | OFF | 5 | 10 |
| 2 | 210 | 1200 | 0.2 | ON | 5 | 10 |
| 3 | 210 | 1800 | 0.2 | OFF | 5 | 10 |
| 4 | 210 | 1800 | 0.2 | ON | 5 | 10 |
| 5 | 210 | 2400 | 0.2 | OFF | 5 | 10 |
| 6 | 210 | 2400 | 0.2 | ON | 5 | 10 |
| Sample # | 1 | 2 | 3 | 4 | 5 |
|---|---|---|---|---|---|
| Frequency (Hz) | 0.5 | 1 | 5 | 10 | 20 |
| Temperature (°C) | 25 | 25 | 25 | 25 | 25 |
| Span (mm) | 50 | 50 | 50 | 50 | 50 |
| Constant amplitude (mm) | 0.1 | 0.1 | 0.1 | 0.1 | 0.1 |
| Sample Number | CLC off | CLC on | ||
|---|---|---|---|---|
| Fabrication Feed rate (mm/min) | 1200 | 1 | 6.3128 ± 0.159 | 0.2298 ± 0.0038 |
| 2 | 6.078 ± 0.173 | 0.2336 ± 0.0036 | ||
| 3 | 6.499 ± 0.141 | 0.2283 ± 0.0045 | ||
| 4 | 6.3163 ± 0.161 | 0.2246 ± 0.0032 | ||
| 5 | 6.27 ± 0.175 | 0.2347 ± 0.0047 | ||
| 1800 | 1 | 6.6691 ± 0.315 | 0.1718 ± 0.0017 | |
| 2 | 6.5481 ± 0.296 | 0.1746 ± 0.0026 | ||
| 3 | 6.5327 ± 0.358 | 0.1716 ± 0.0013 | ||
| 4 | 6.7829 ± 0.327 | 0.1722 ± 0.0019 | ||
| 5 | 7.39 ± 0.368 | 0.1761 ± 0.0022 | ||
| 2400 | 1 | 6.060 ± 0.496 | 0.2867 ± 0.0028 | |
| 2 | 6.7412 ± 0.538 | 0.293 ± 0.0032 | ||
| 3 | 6.5426 ± 0.621 | 0.2929 ± 0.0032 | ||
| 4 | 7.26 ± 0.687 | 0.2935 ± 0.0021 | ||
| 5 | 7.25 ± 0.602 | 0.2921 ± 0.0029 |
| CLC off | CLC on | Var (%) | p-Value | ||
|---|---|---|---|---|---|
| Fabrication Feed rate (mm/min) | 1200 | 6.2952 ± 0.1505 | 0.2302 ± 0.0041 | −96.34 | 2.6 × 10⁻¹³ |
| 1800 | 6.7846 ± 0.3533 | 0.1733 ± 0.002 | −97.45 | 1.17 × 10⁻¹⁰ | |
| 2400 | 6.7708 ± 0.5067 | 0.2916 ± 0.0028 | −95.69 | 2.42 × 10⁻⁹ |
| UTS (MPa) | CLC off | CLC on | Var (%) | p-Value | |
|---|---|---|---|---|---|
| Fabrication feed rate (mm/min) | 1200 | 39.82 ± 2.5310 | 41.78 ± 1.6392 | 4.97 | 0.1821 |
| 1800 | 40.06 ± 1.1589 | 42.56 ± 1.601 | 6.24 | 0.0222 | |
| 2400 | 40.35 ± 0.5294 | 43.86 ± 0.3847 | 8.70 | 2.16 × 10⁻⁶ |
| CLC off | CLC on | Var (%) | p-Value | ||
|---|---|---|---|---|---|
| Fabrication feed rate (mm/min) | 1200 | 1.6540 ± 0.0297 | 1.6860 ± 0.0684 | 1.93 | 0.3653 |
| 1800 | 1.6002 ± 0.1025 | 1.6444 ± 0.0518 | 2.74 | 0.4147 | |
| 2400 | 1.6560 ± 0.0518 | 1.8514 ± 0.0477 | 11.8 | 1 × 10⁻³ |
| EN (MPa) | CLC off | CLC on | Var (%) | p-Value | |
|---|---|---|---|---|---|
| Fabrication feed rate (mm/min) | 1200 | 3312 ± 98.59 | 3168 ± 70.85 | −4.35 | 0.0292 |
| 1800 | 3196 ± 57.70 | 3086 ± 80.81 | −3.44 | 0.0383 | |
| 2400 | 2968 ± 97.31 | 2922 ± 88.14 | −1.55 | 0.4560 |
| Fabrication Feed Rate (mm/min) | CLC off | CLC on | Var % | p-Value |
|---|---|---|---|---|
| Eflex (MPa)@0.5 Hz | ||||
| 1200 | 3721 ± 35.62 | 3368 ± 132.44 | −9.48 | 1.9 × 10⁻⁷ |
| 1800 | 3406 ± 148.67 | 3323 ± 86.14 | −2.44 | 0.1454 |
| 2400 | 3224 ± 83.22 | 3161 ± 101.99 | −1.95 | 0.1475 |
| Eflex (MPa)@1 Hz | ||||
| 1200 | 3761 ± 28.64 | 3517 ± 165.57 | −6.49 | 2.3 × 10⁻⁴ |
| 1800 | 3649 ± 142.09 | 3398 ± 47.73 | −6.88 | 4.86 × 10⁻⁵ |
| 2400 | 3246 ± 88.30 | 3182 ± 129.44 | −1.97 | 0.2094 |
| Eflex (MPa)@5 Hz | ||||
| 1200 | 3796 ± 61.17 | 3499 ± 141.94 | −7.82 | 2 × 10⁻⁵ |
| 1800 | 3610 ± 160.49 | 3387 ± 55.92 | −6.18 | 6.18 × 10⁻⁴ |
| 2400 | 3283 ± 86.21 | 3202 ± 99.13 | −2.46 | 0.0691 |
| Eflex (MPa)@10 Hz | ||||
| 1200 | 3746 ± 60.01 | 3441 ± 129.99 | −8.14 | 2.53 × 10⁻⁶ |
| 1800 | 3522 ± 151.51 | 3183 ± 9.44 | −9.62 | 4.96 × 10⁻⁴ |
| 2400 | 3247 ± 83.06 | 3227 ± 128.88 | −6.16 | 0.6789 |
| Eflex (MPa)@20 Hz | ||||
| 1200 | 3676 ± 49.2 | 3442 ± 131.27 | −6.37 | 5.06 × 10⁻⁵ |
| 1800 | 3455 ± 130.97 | 3288 ± 32.15 | −4.83 | 1 × 10⁻³ |
| 2400 | 3215 ± 81.92 | 3191 ± 97.45 | −7.46 | 0.555 |
Publisher’s Note: MDPI stays neutral with regard to jurisdictional claims in published maps and institutional affiliations. |
© 2022 by the authors. Licensee MDPI, Basel, Switzerland. This article is an open access article distributed under the terms and conditions of the Creative Commons Attribution (CC BY) license (https://creativecommons.org/licenses/by/4.0/).
Share and Cite
Rossi, A.; Morettini, G.; Moretti, M.; Capponi, L. Filament Transport Control for Enhancing Mechanical Properties of Parts Realised by Fused Filament Fabrication. Materials 2022, 15, 3530. https://doi.org/10.3390/ma15103530
Rossi A, Morettini G, Moretti M, Capponi L. Filament Transport Control for Enhancing Mechanical Properties of Parts Realised by Fused Filament Fabrication. Materials. 2022; 15(10):3530. https://doi.org/10.3390/ma15103530
Chicago/Turabian StyleRossi, Arianna, Giulia Morettini, Michele Moretti, and Lorenzo Capponi. 2022. "Filament Transport Control for Enhancing Mechanical Properties of Parts Realised by Fused Filament Fabrication" Materials 15, no. 10: 3530. https://doi.org/10.3390/ma15103530