
Infill Density Influence on Mechanical and Thermal Properties of Short Carbon Fiber-Reinforced Polyamide Composites Manufactured by FFF Process

 , , ,
, , ,
Abstract
:
1. Introduction
2. Materials and Methods
3. Results and Discussions
3.1. Mechanical Properties
3.1.1. Tensile Strength of Carbon Fiber PAHT Composite
3.1.2. Flexural Strength of the Carbon Fiber PAHT Composite
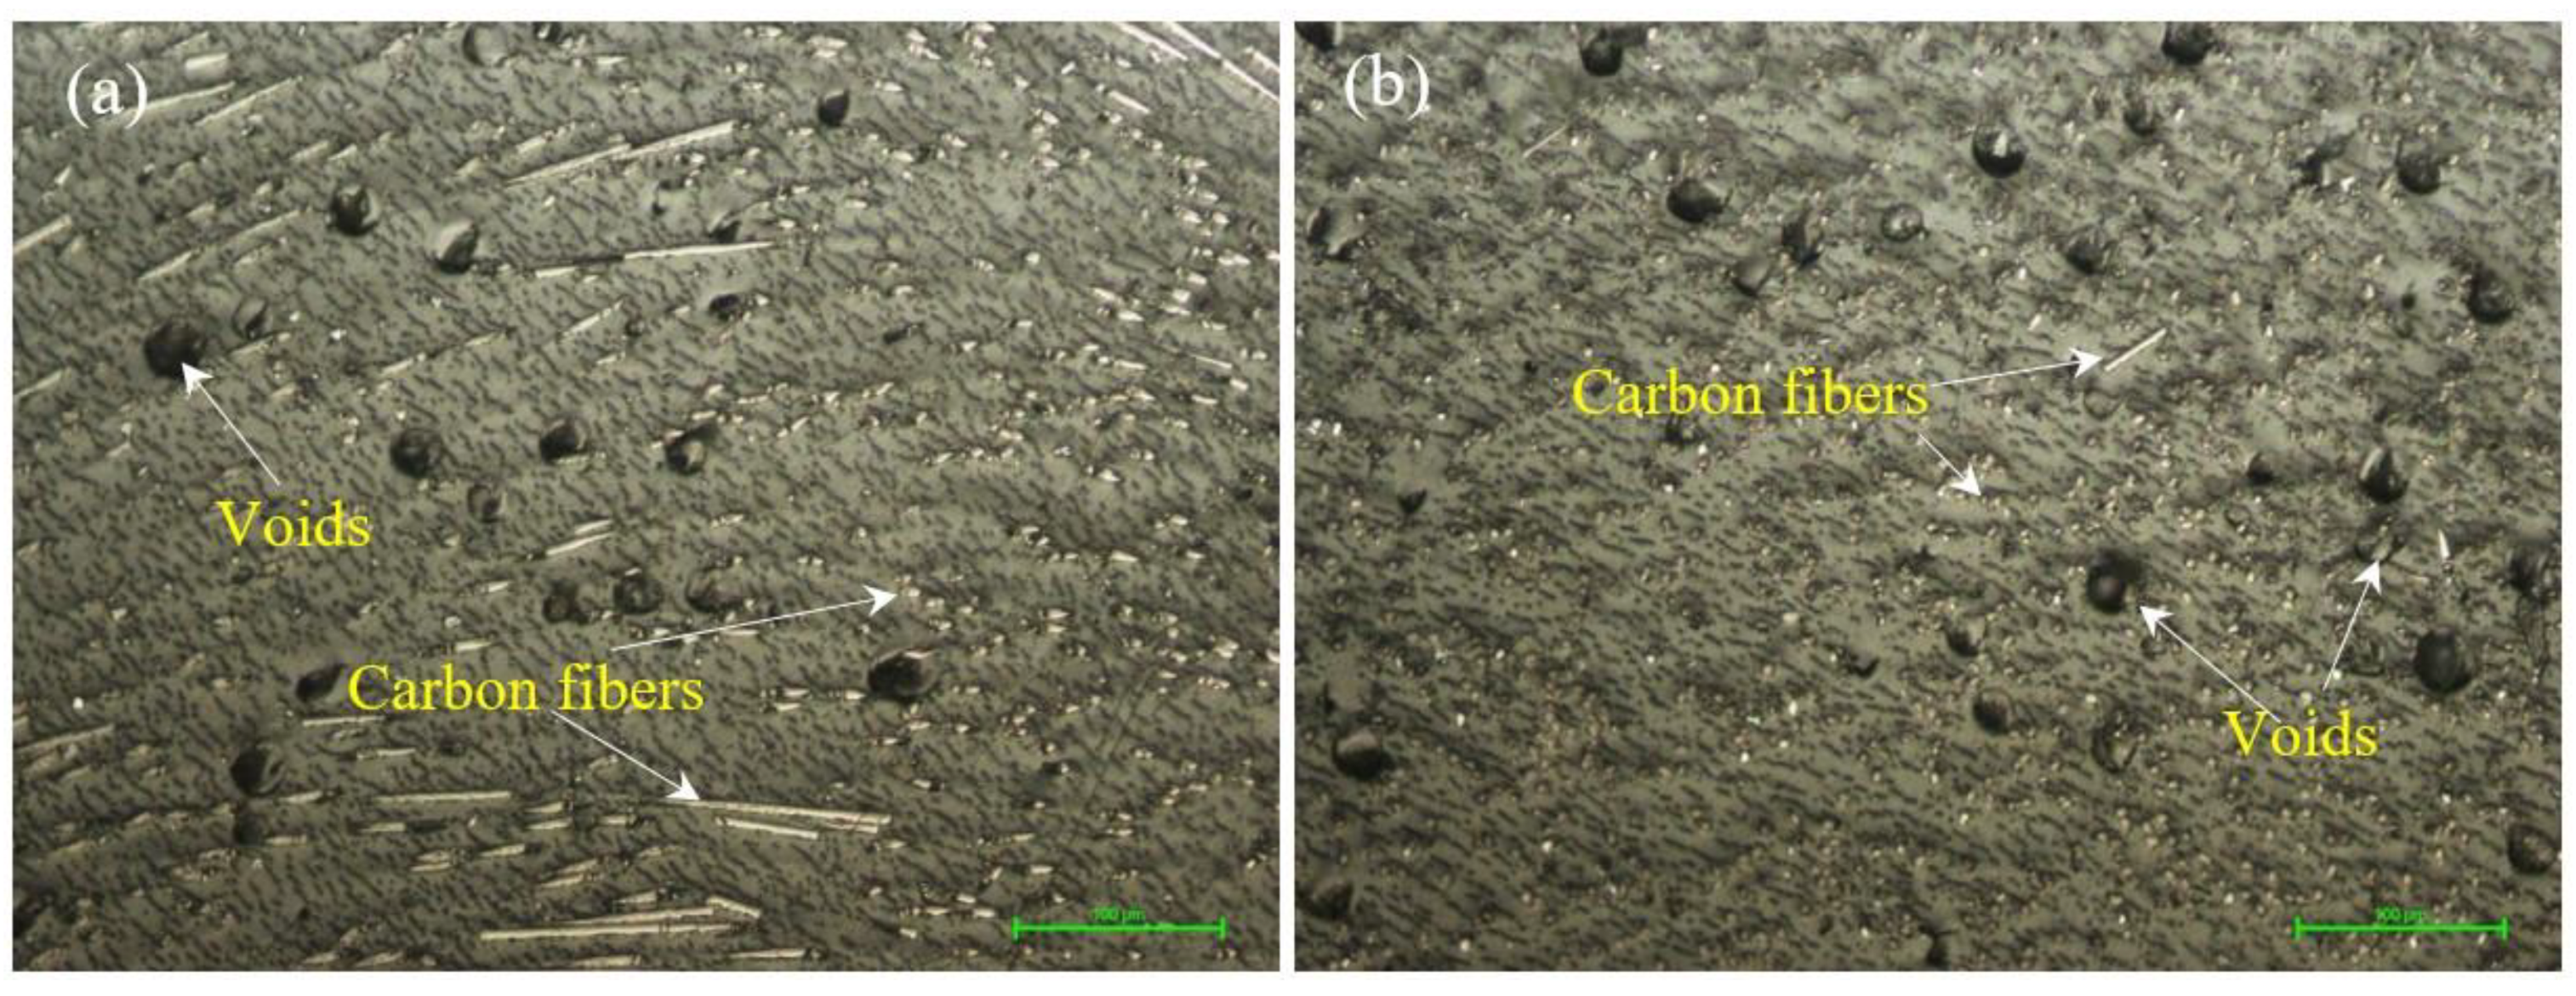
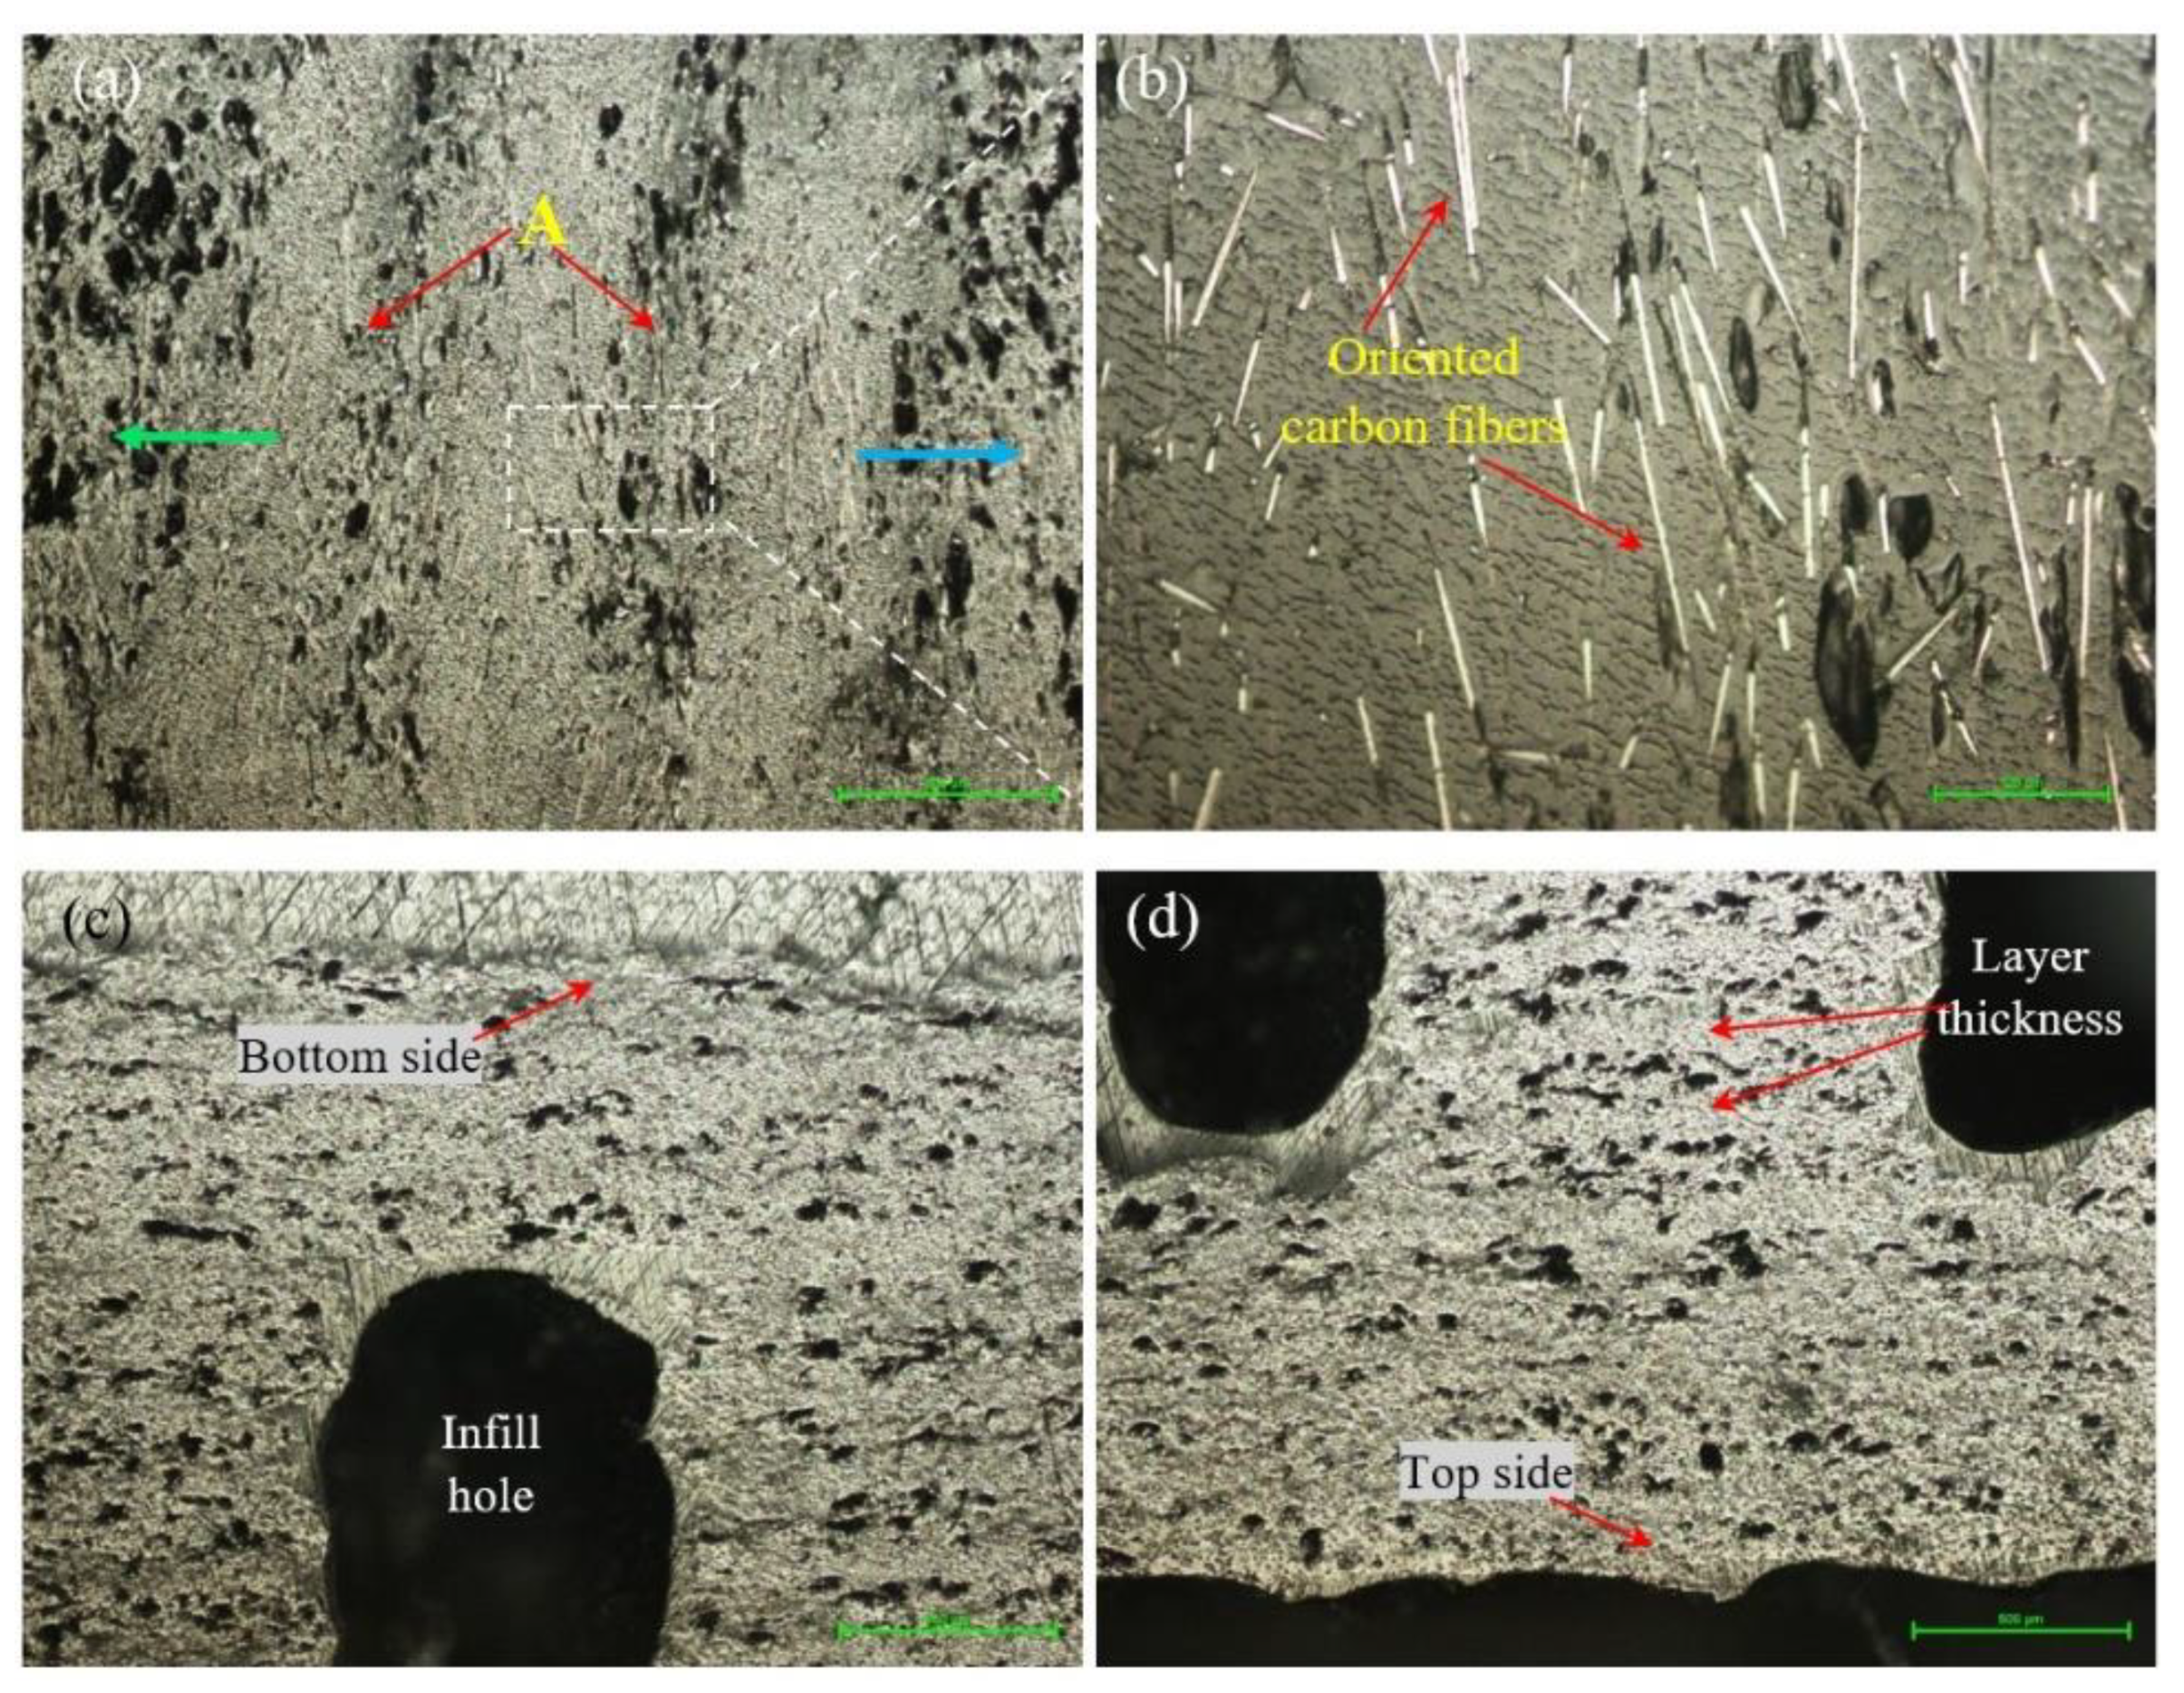
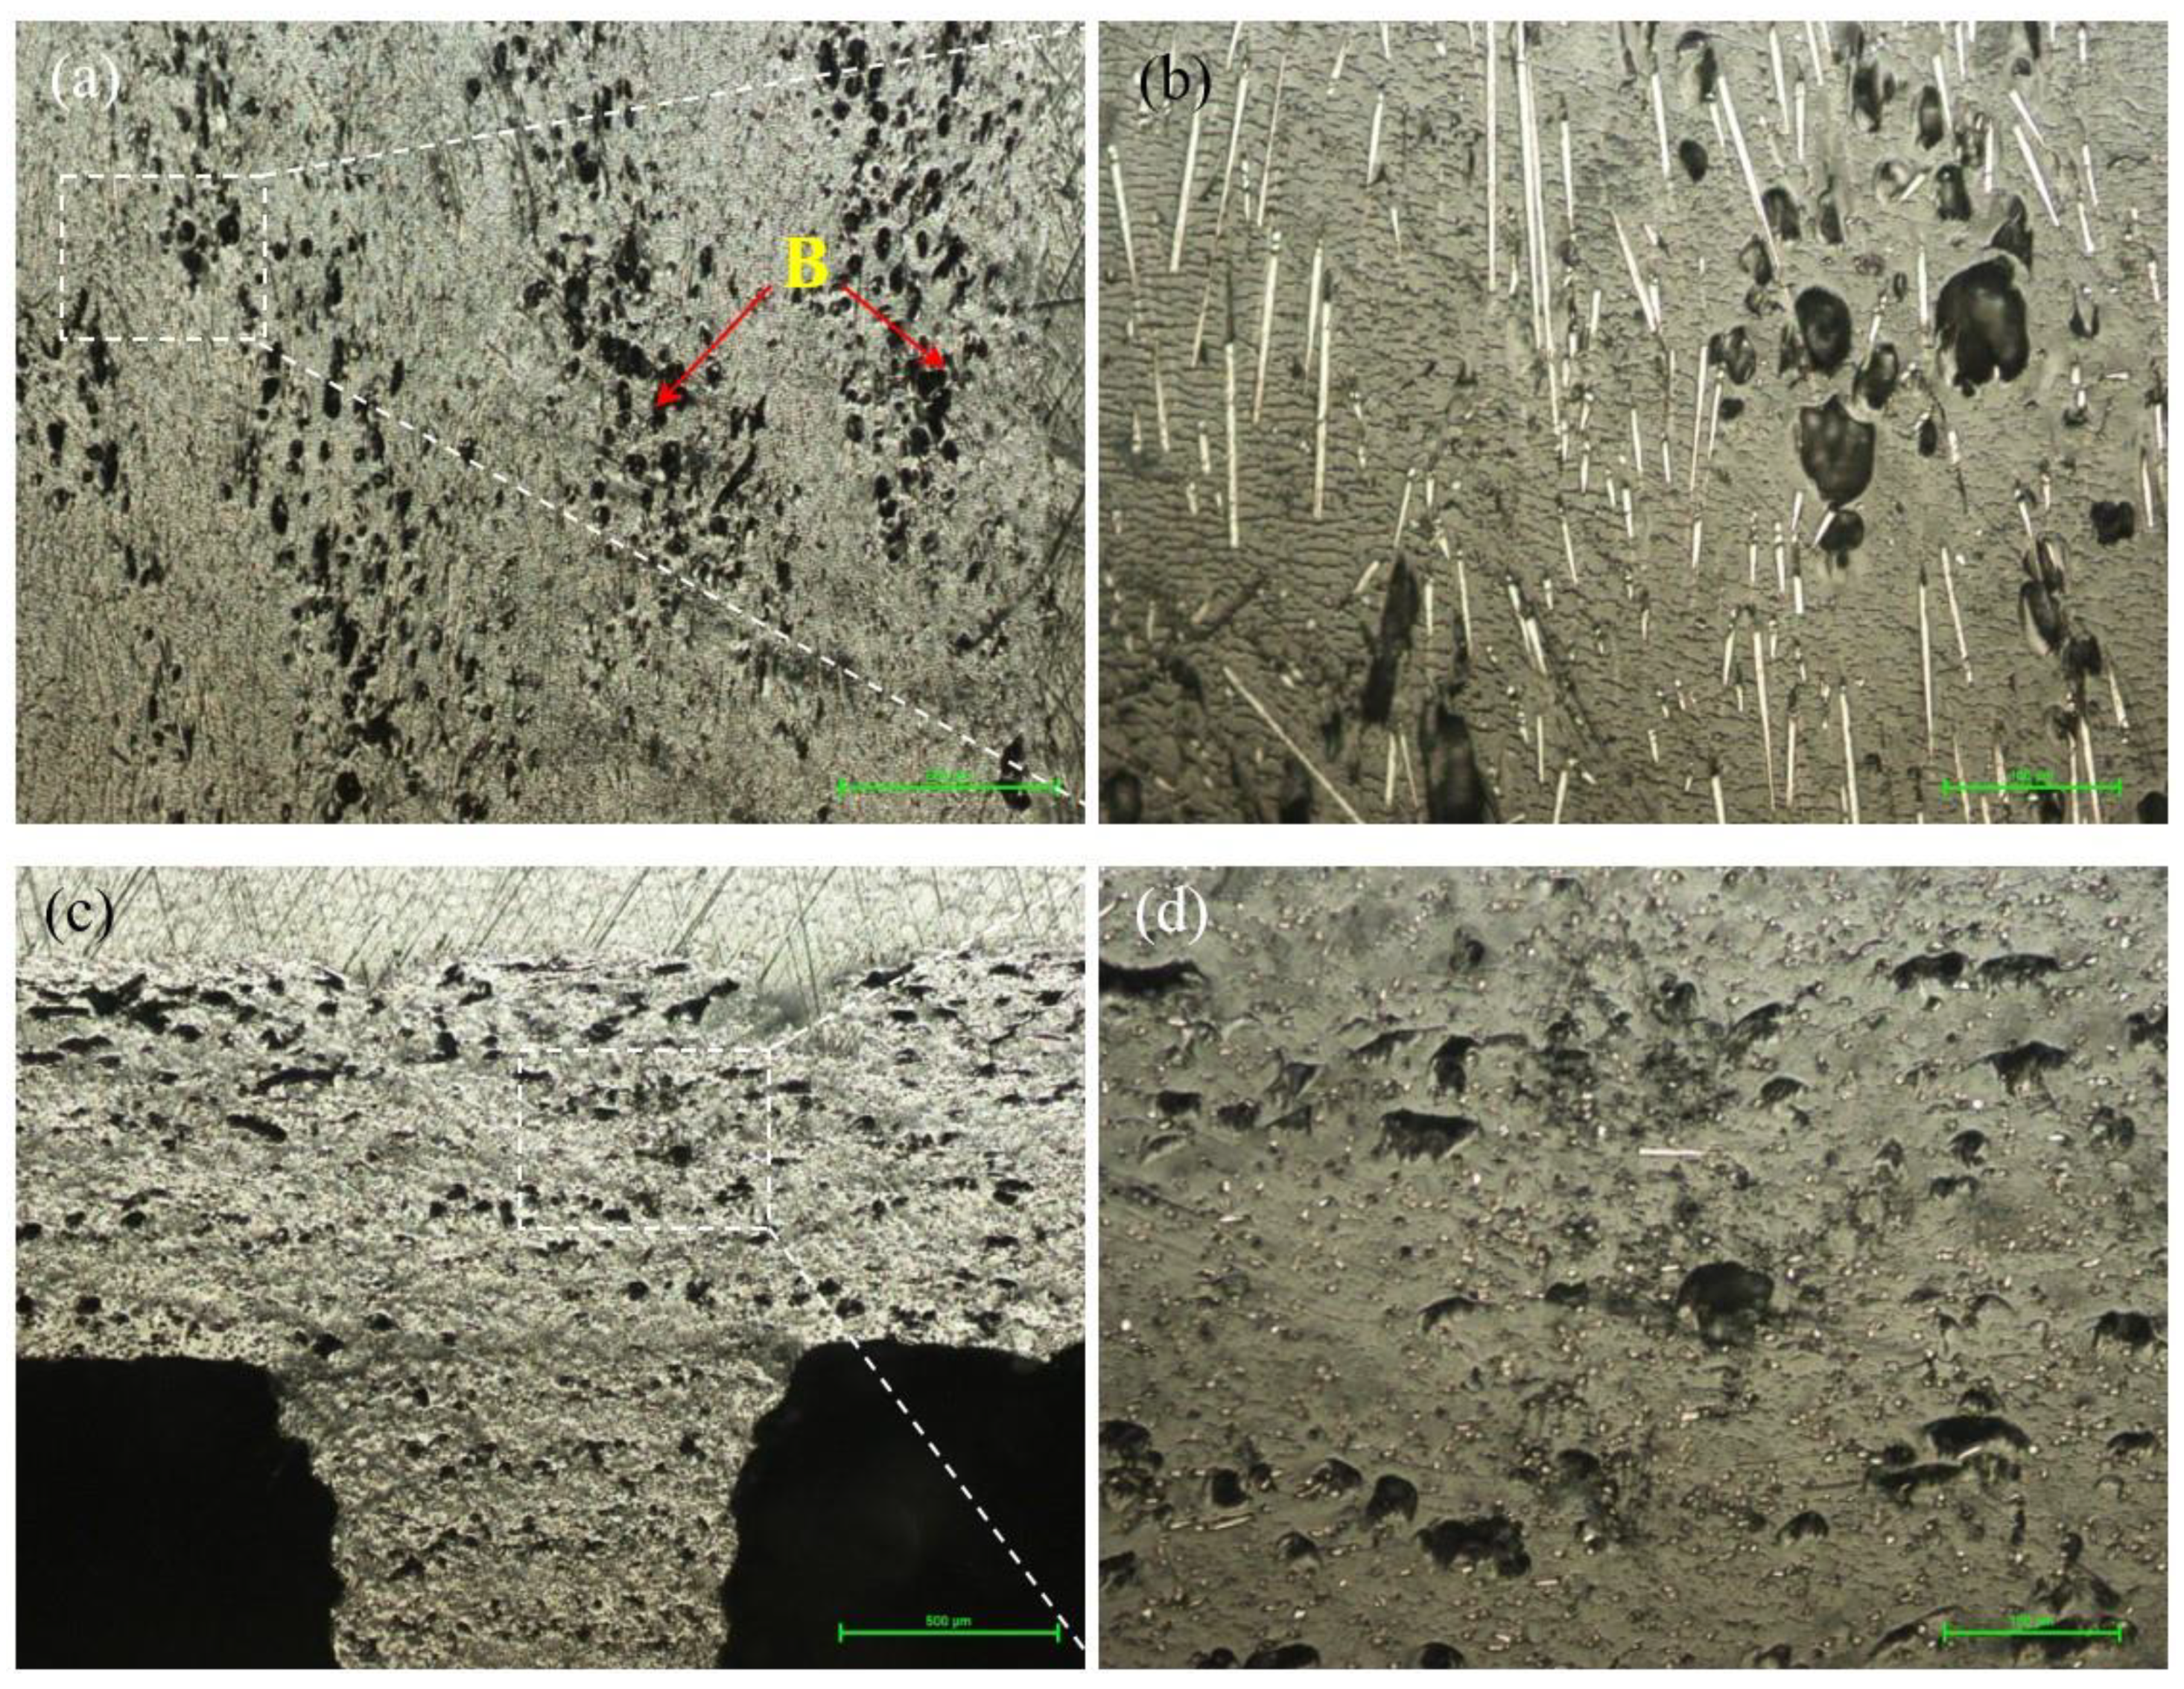
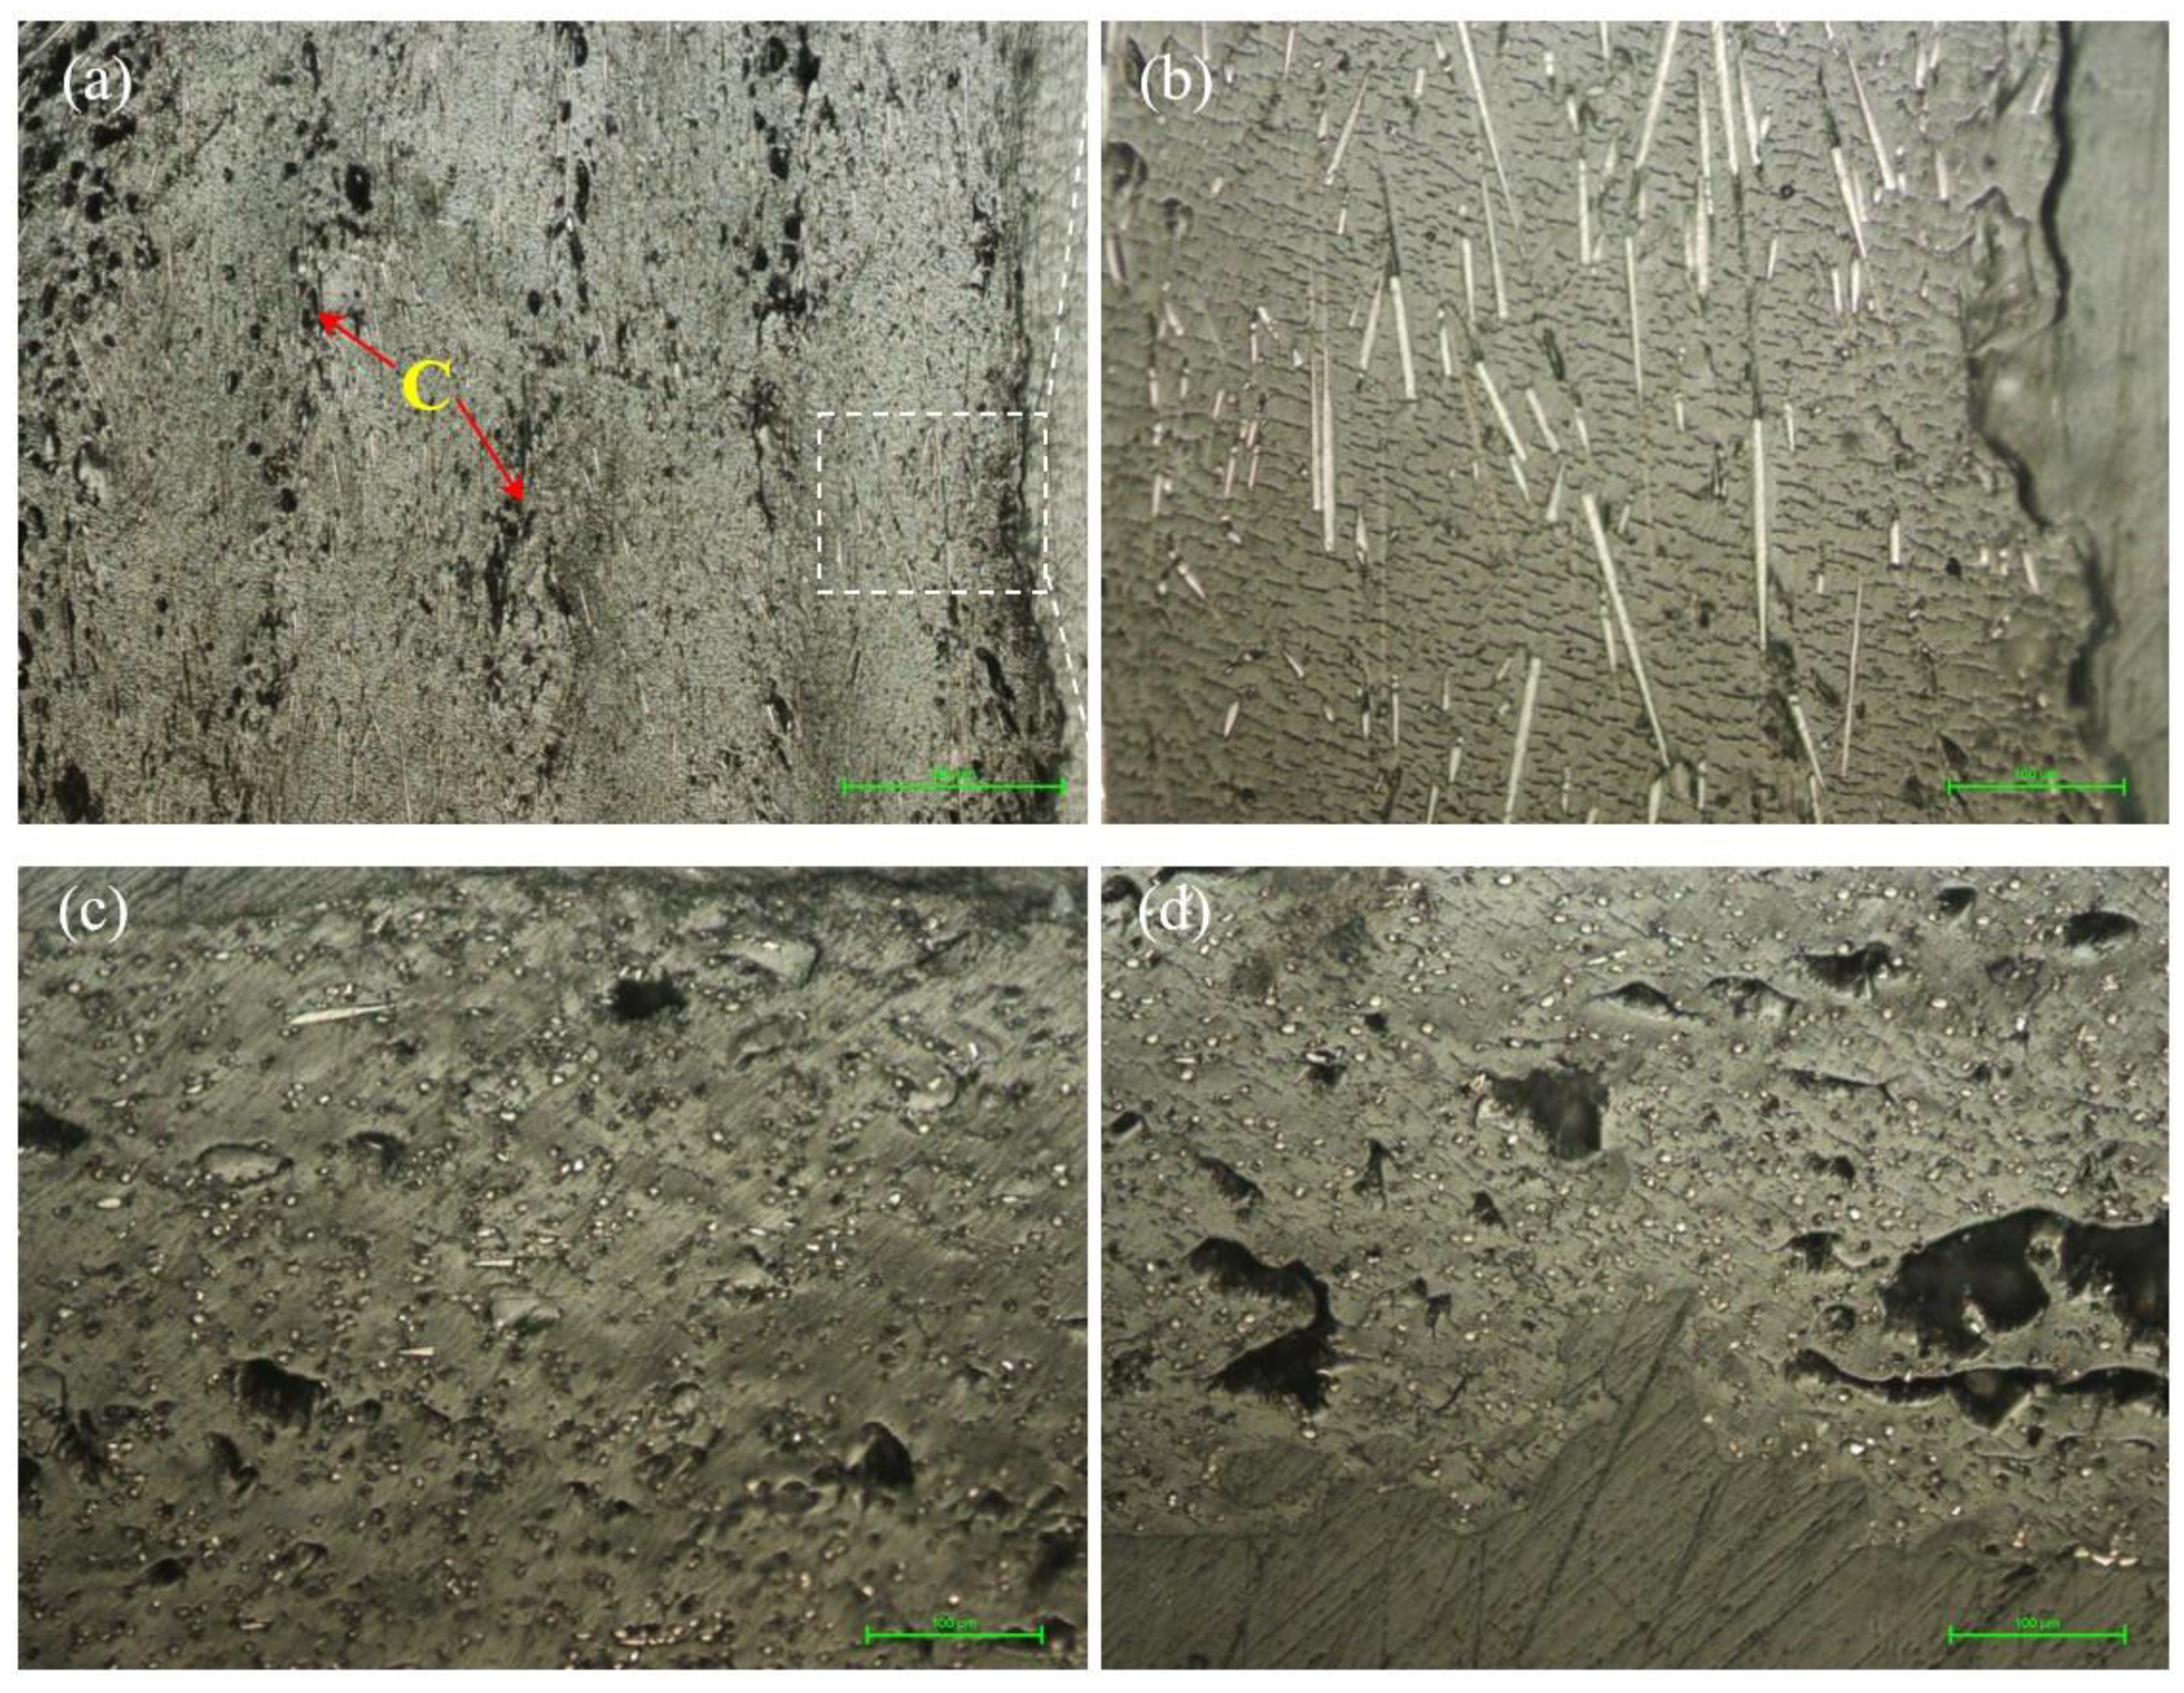
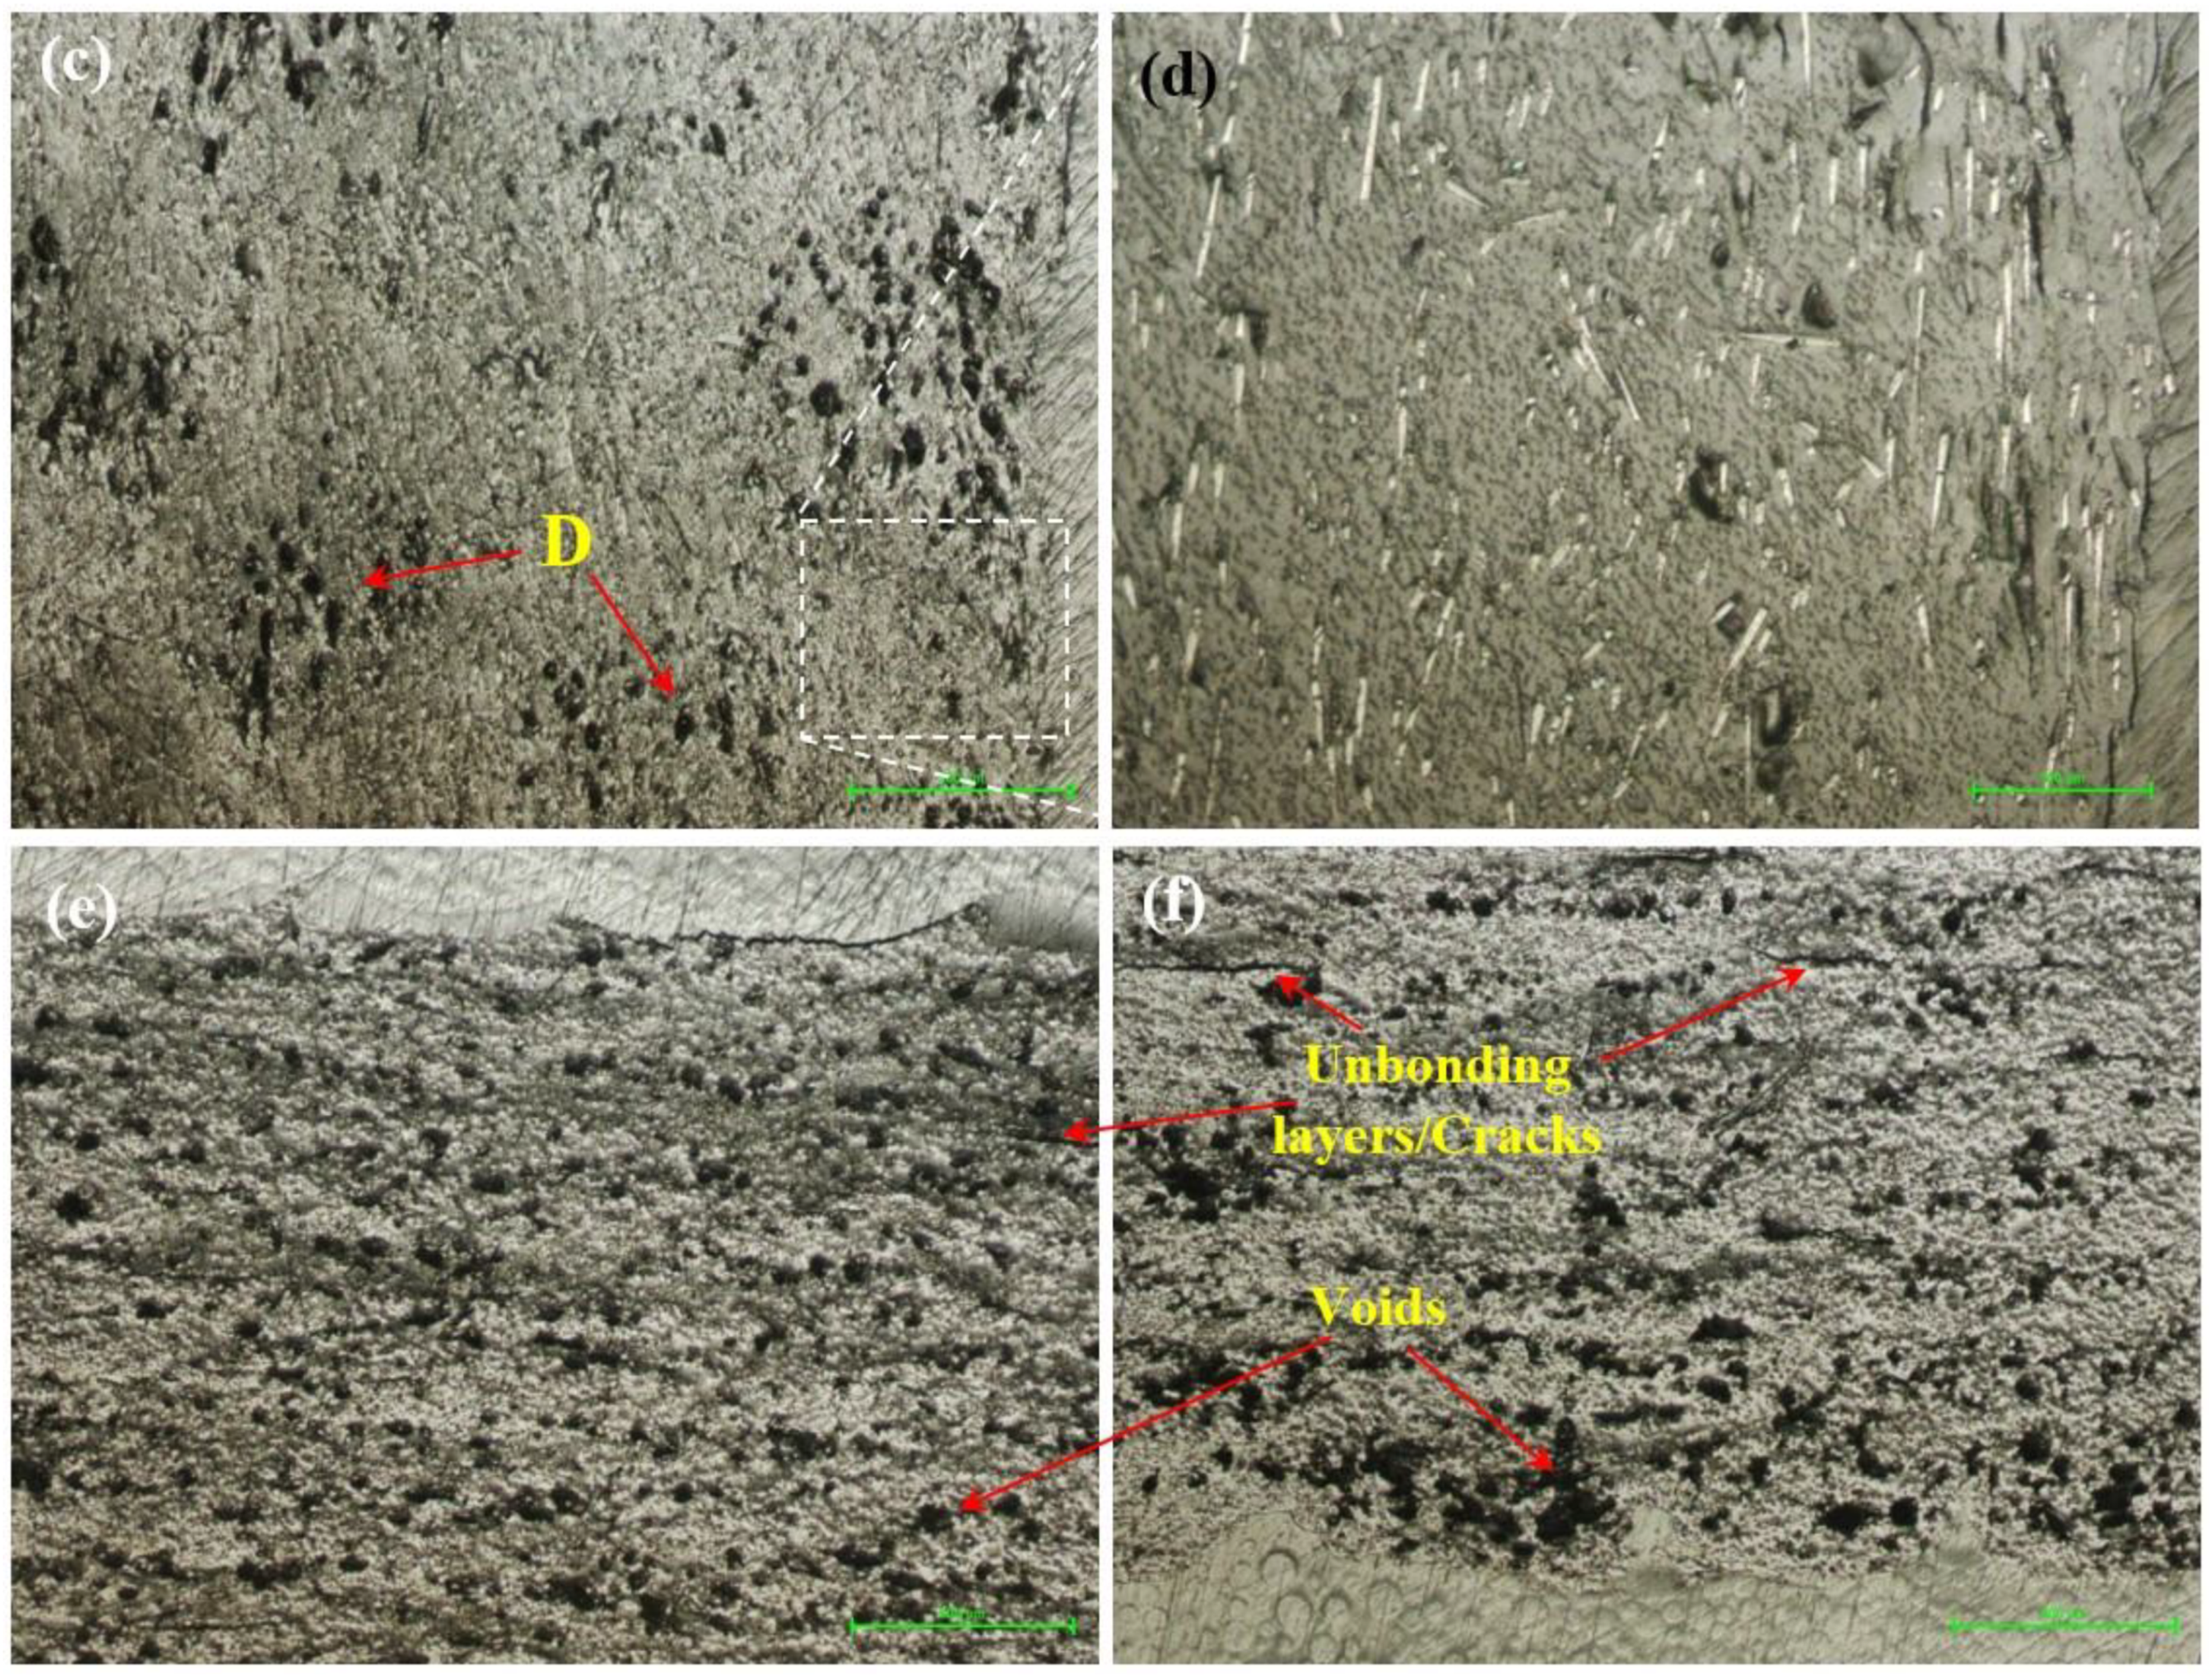
3.1.3. Microstructural Characteristics of the Carbon Fiber PAHT Composite
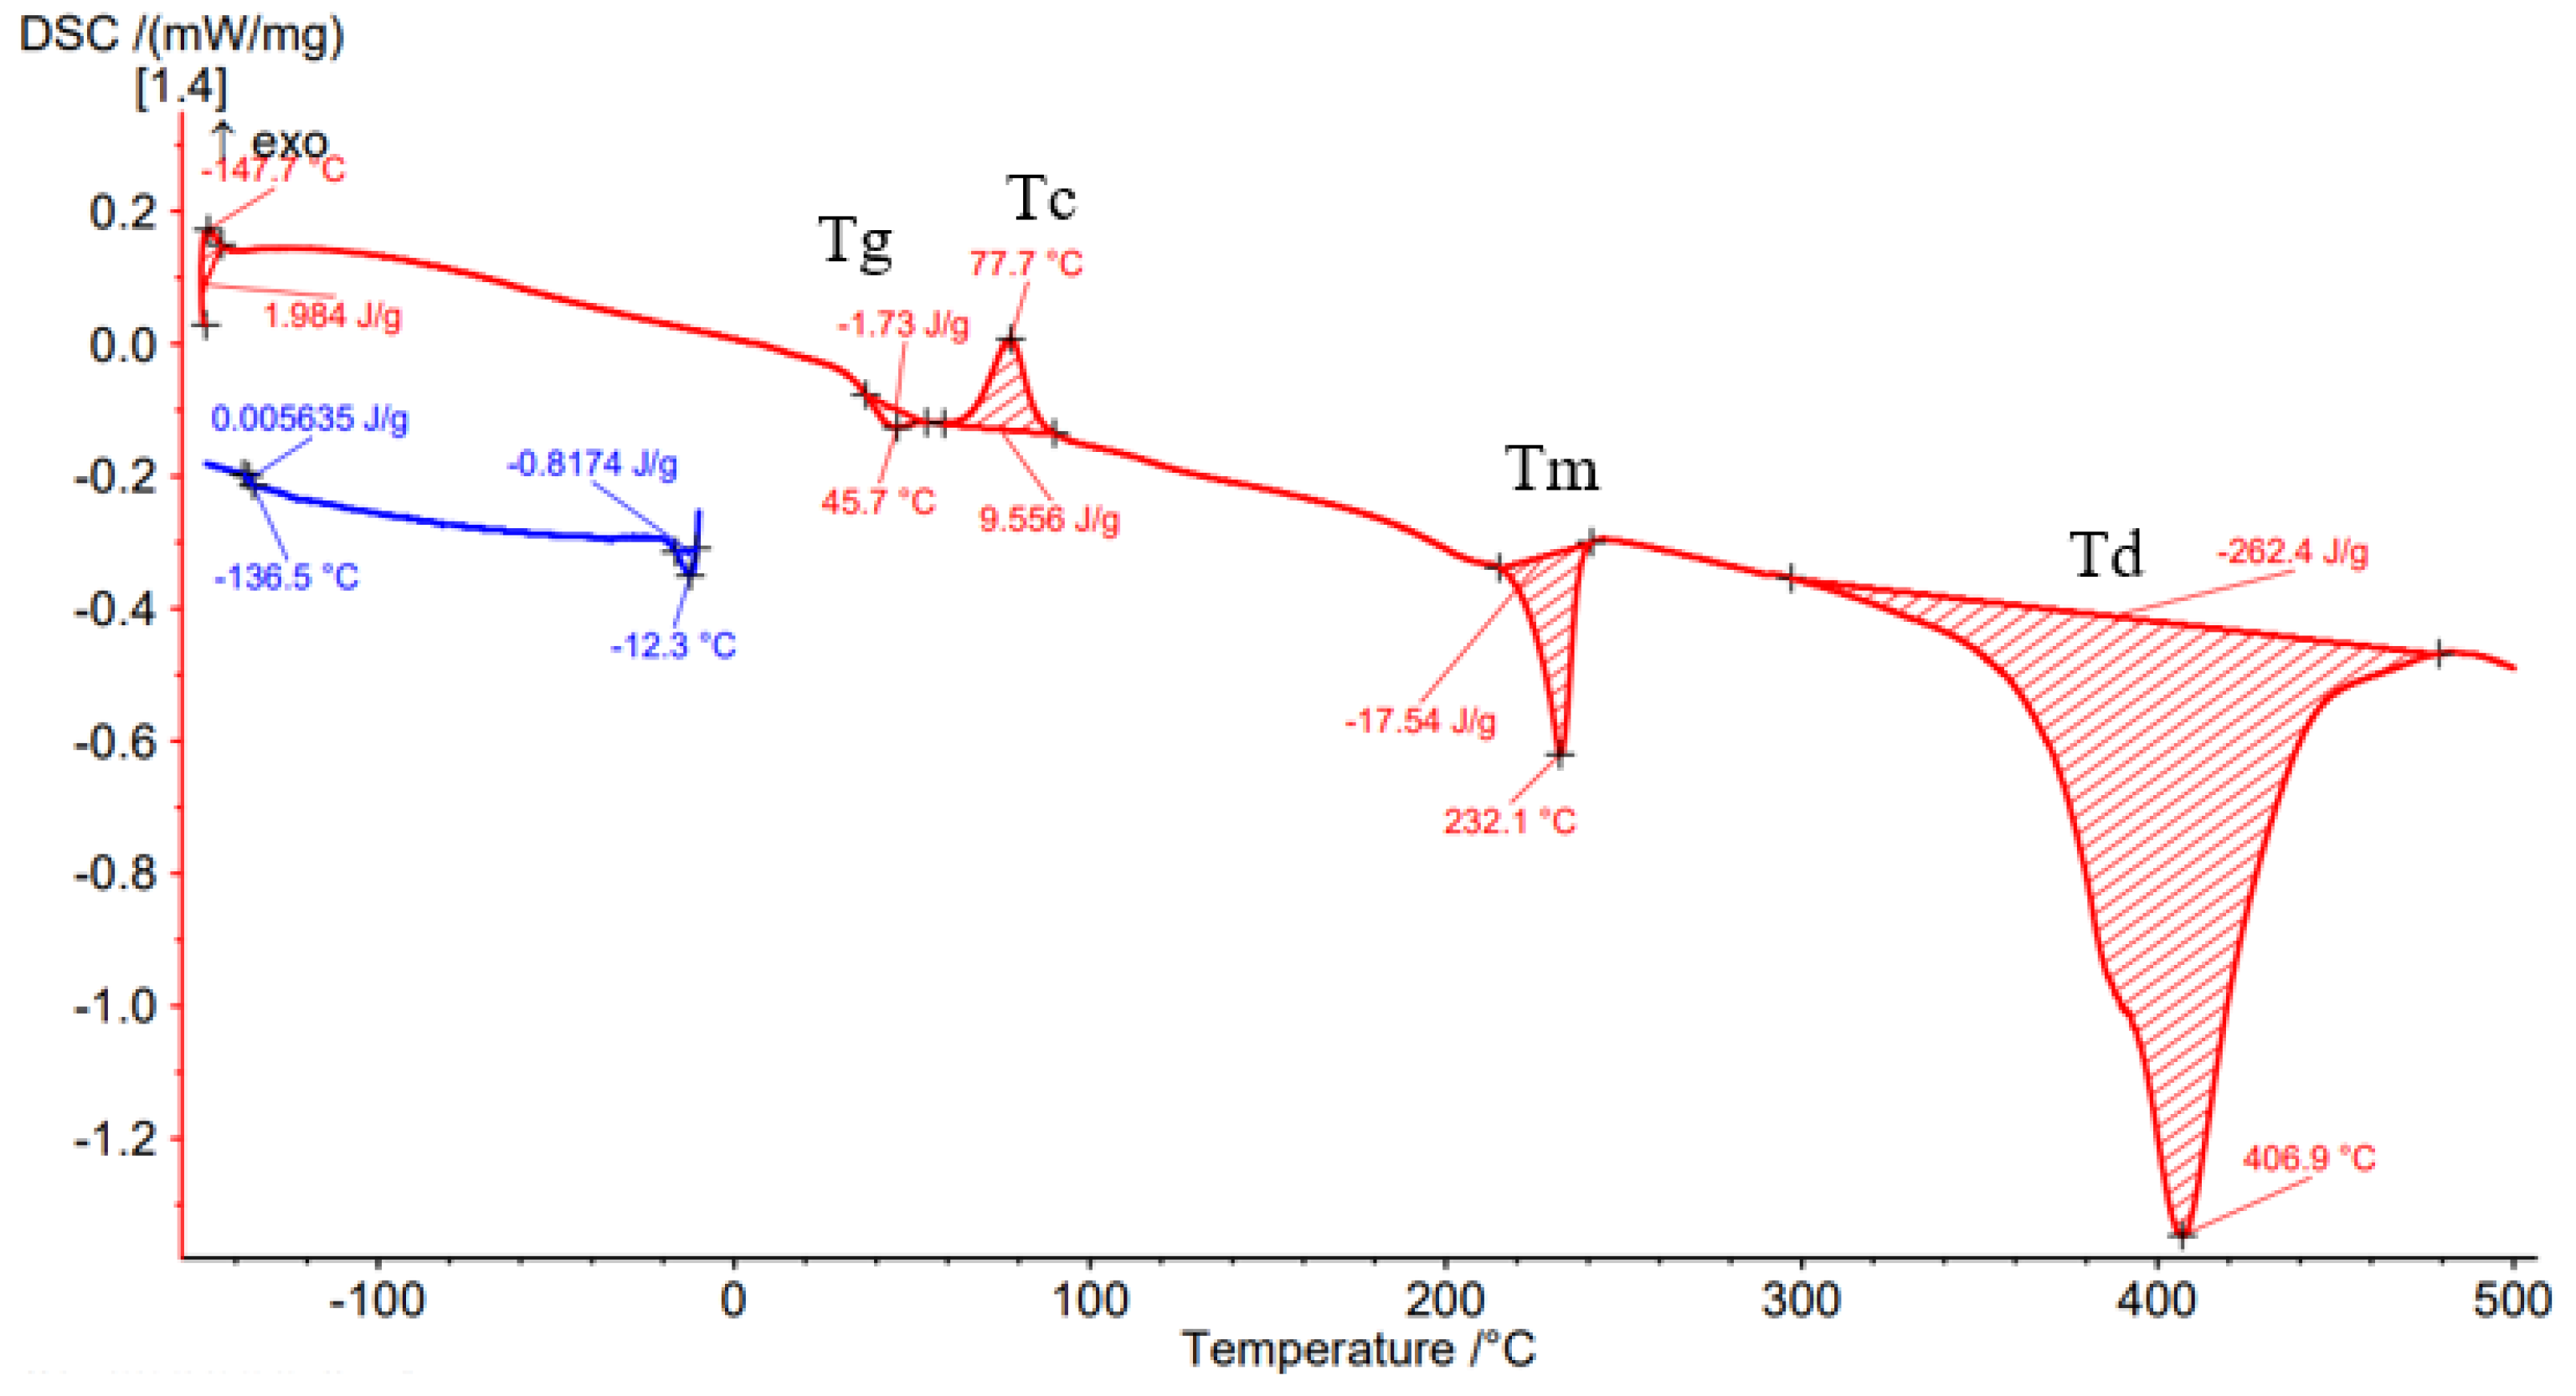
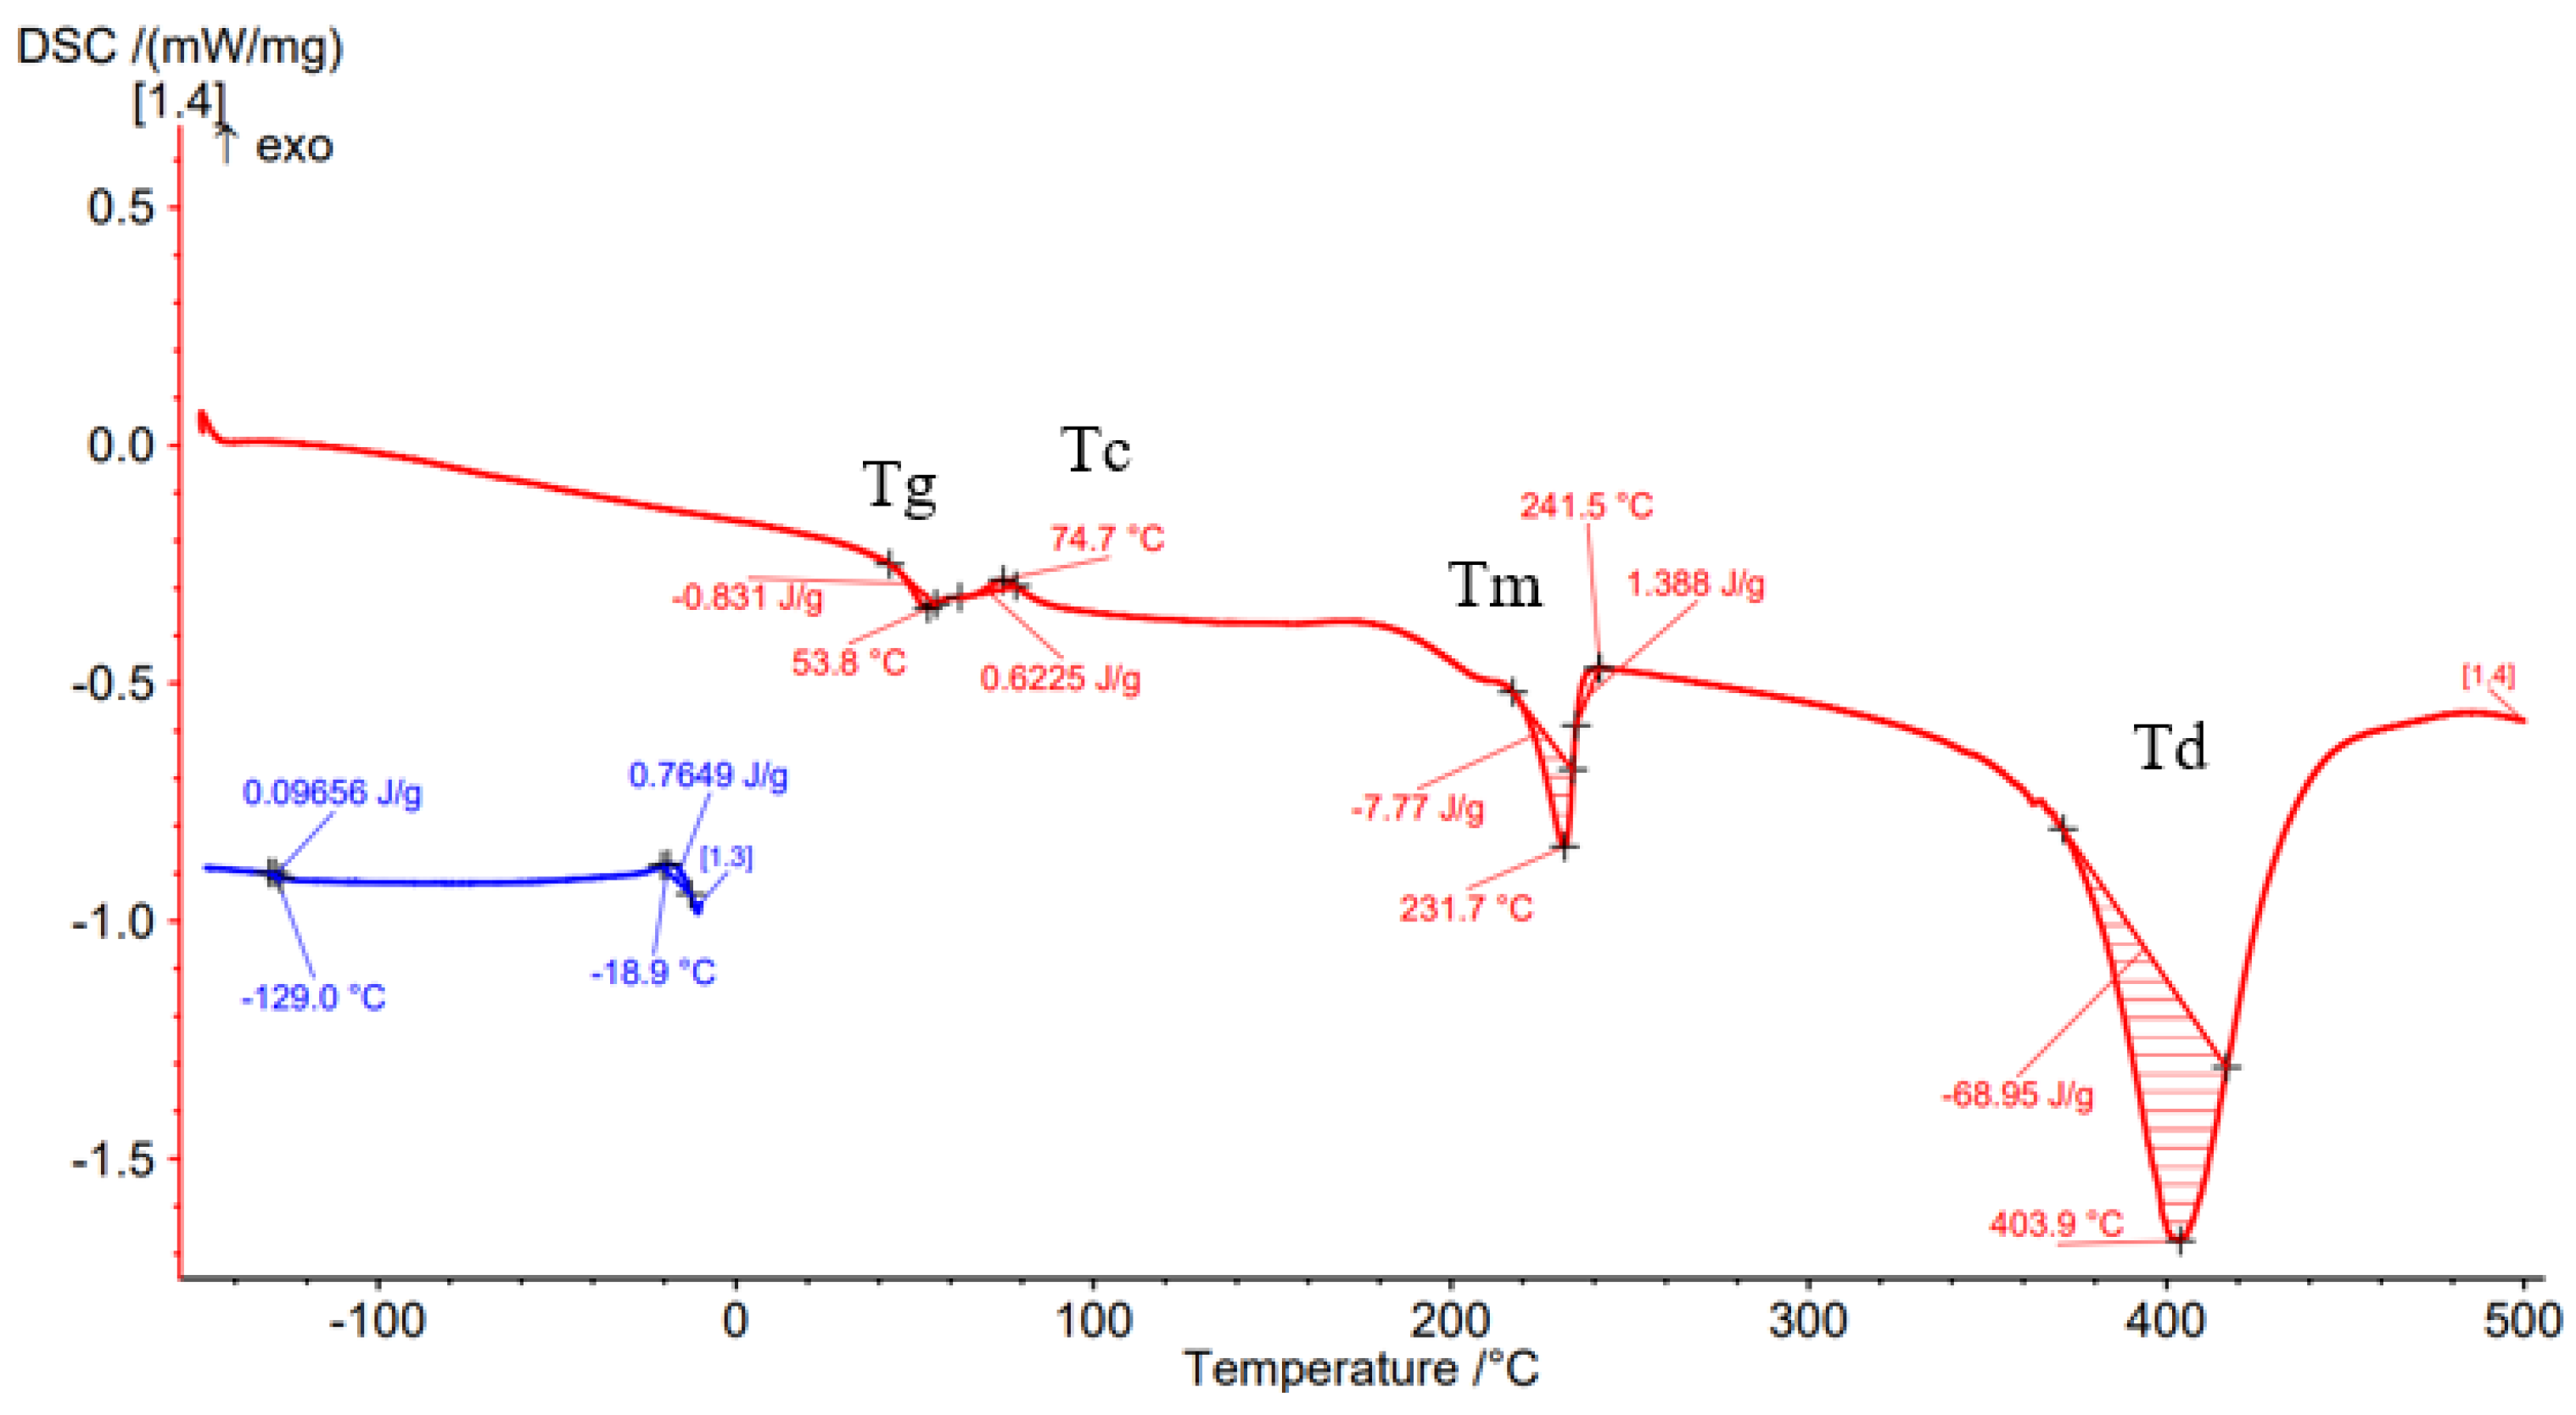
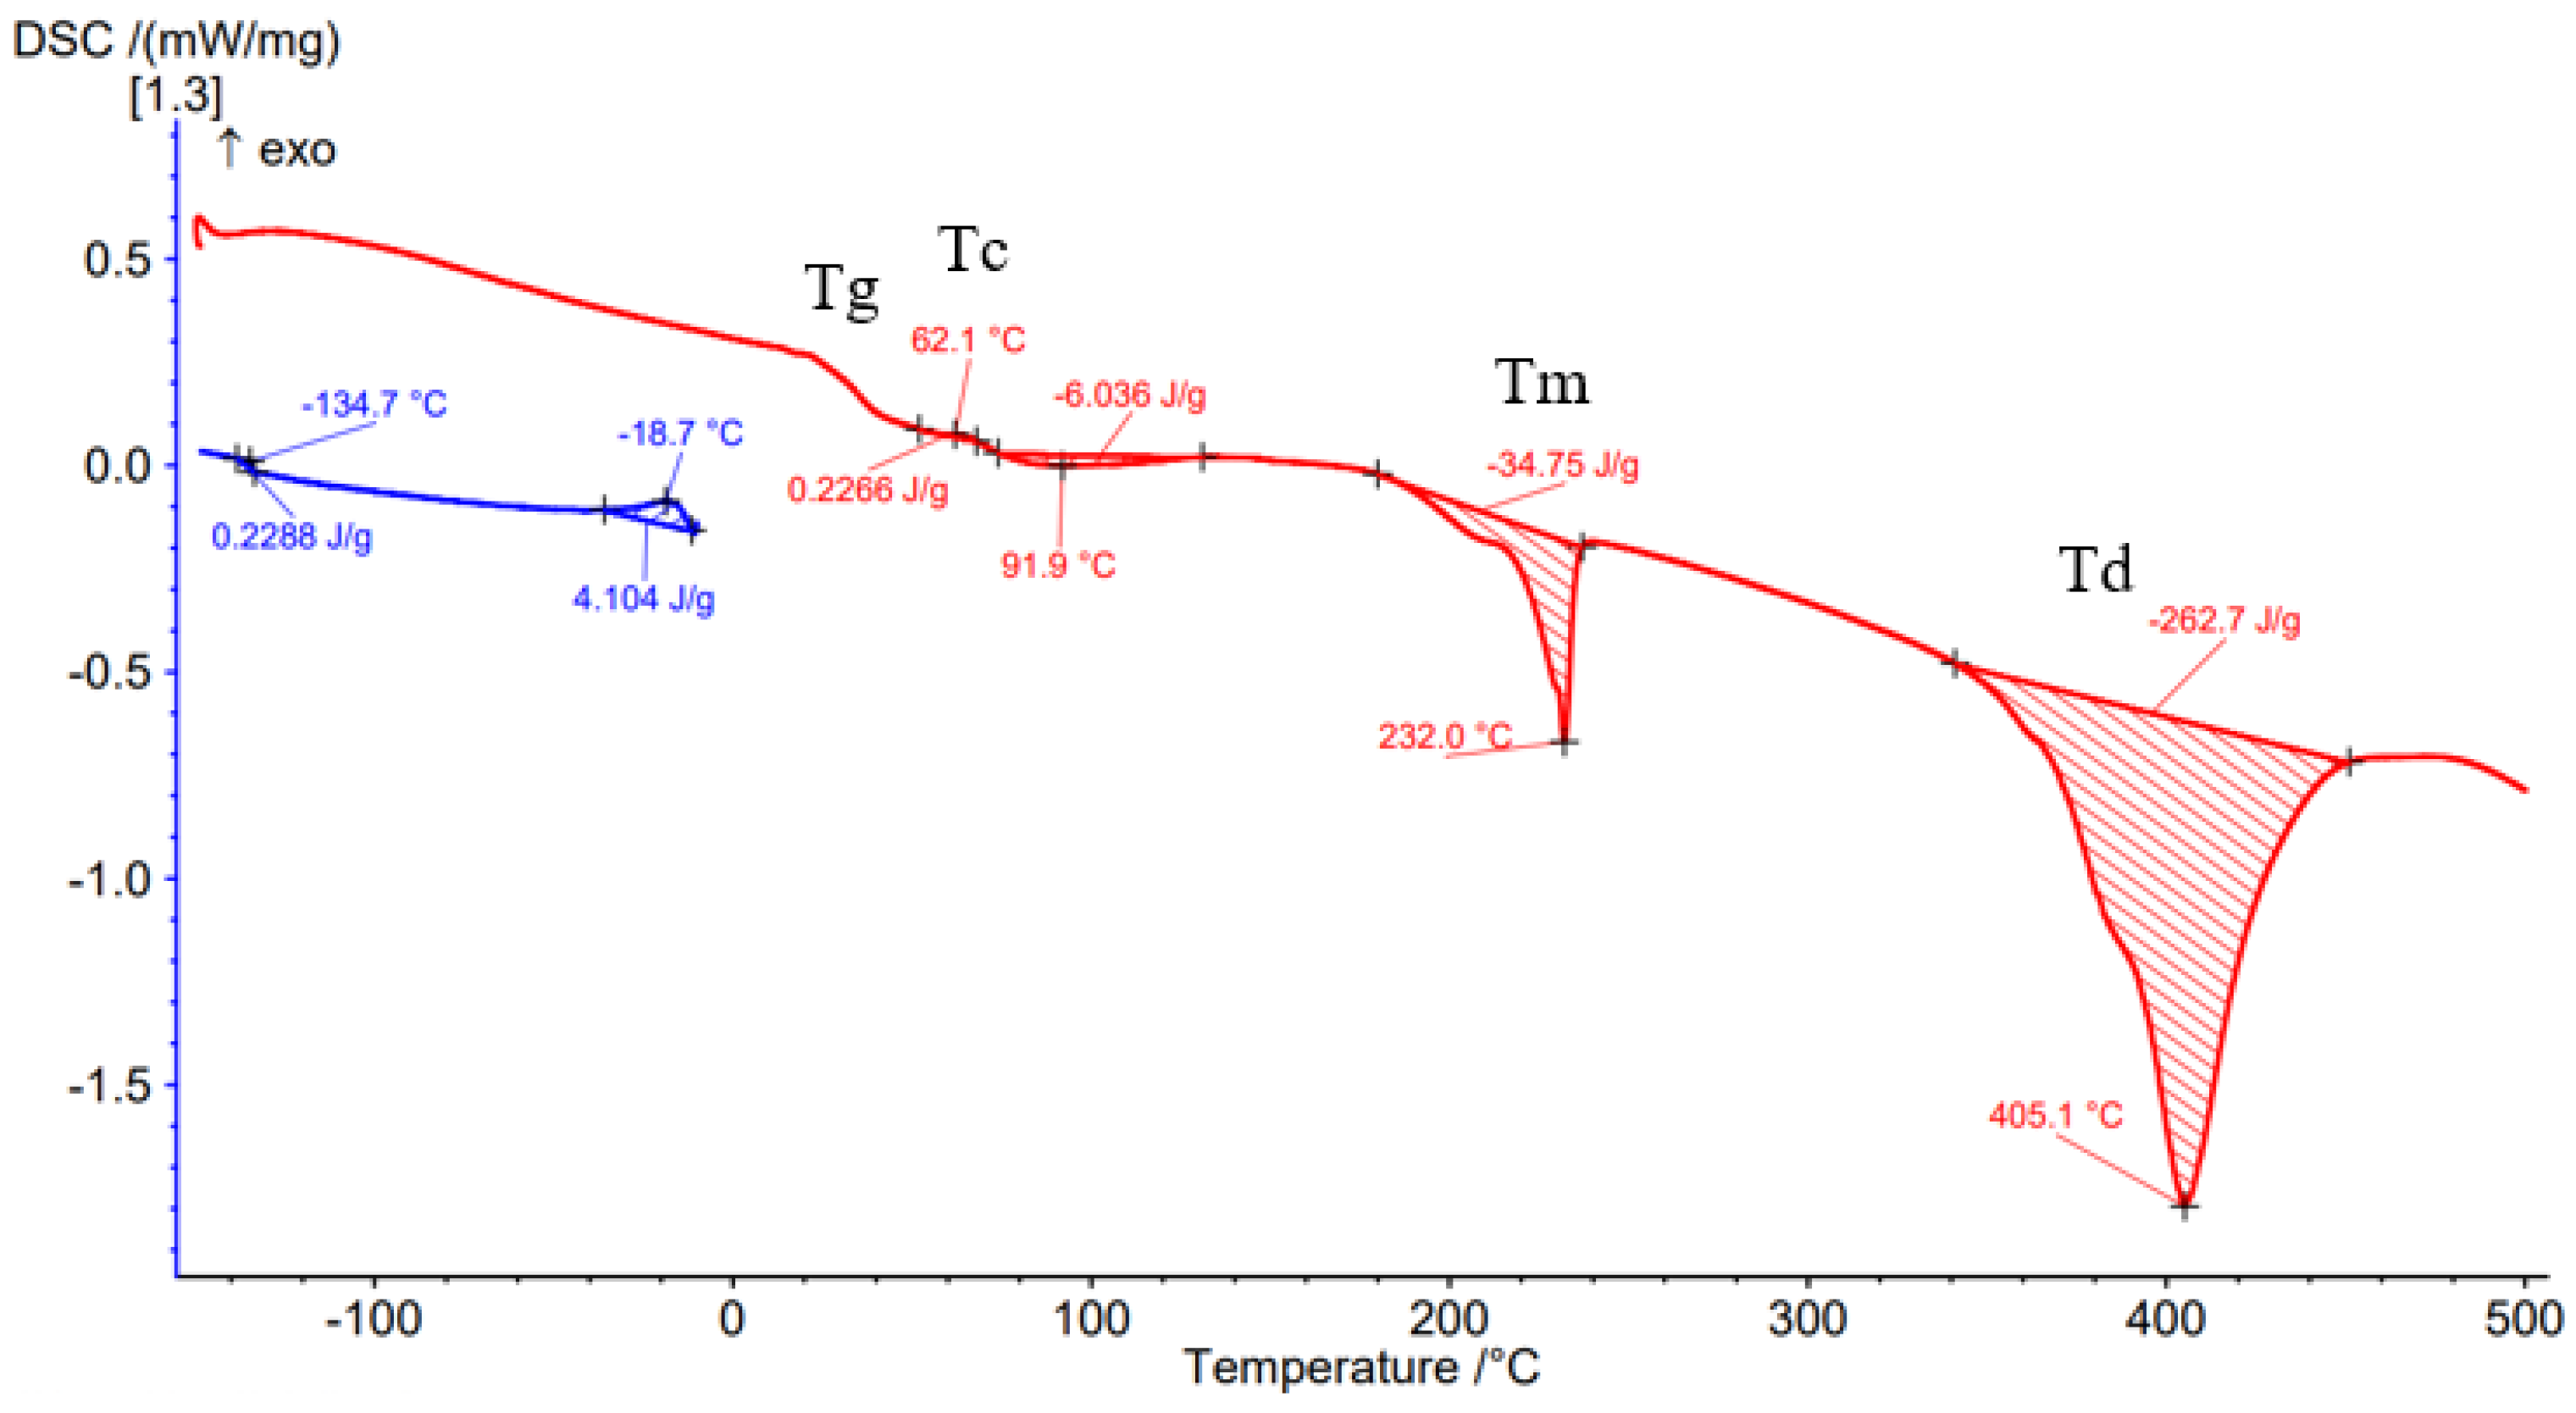
3.1.4. Thermal Behavior of Carbon Fiber PAHT Composite
4. Conclusions
- The results of three-point flexural and tensile tests showed that the infill density percentage has a major influence on mechanical properties. As the infill density increases, so does the tensile and flexural strength.
- It was found that for the samples with 25% and 50% infill densities, the differences between the maximum tensile and flexural strengths are small, 7 MPa and 5.4 MPa, respectively. It is well known that reducing infill densities results in lower printing costs and times. Therefore, if the conditions of use of the components made of PAHT CF15 allow, using a 25% infill density in the FFF process could be seen as an option.
- The microstructure analysis showed that after the printing process, the carbon fibers in all the PAHT CF15 samples are preferentially aligned along the printing direction, and it does not eliminate the voids present in the filament material. It was also found that the content of voids between successive deposition beads is higher the lower the infill density. The presence of a high volume of voids (defects) in the structure of the material leads to a decrease in the mechanical properties of the components manufactured by FFF. Therefore, it is necessary to reduce or eliminate voids by adopting in situ post-processing techniques or changing the printing parameters.
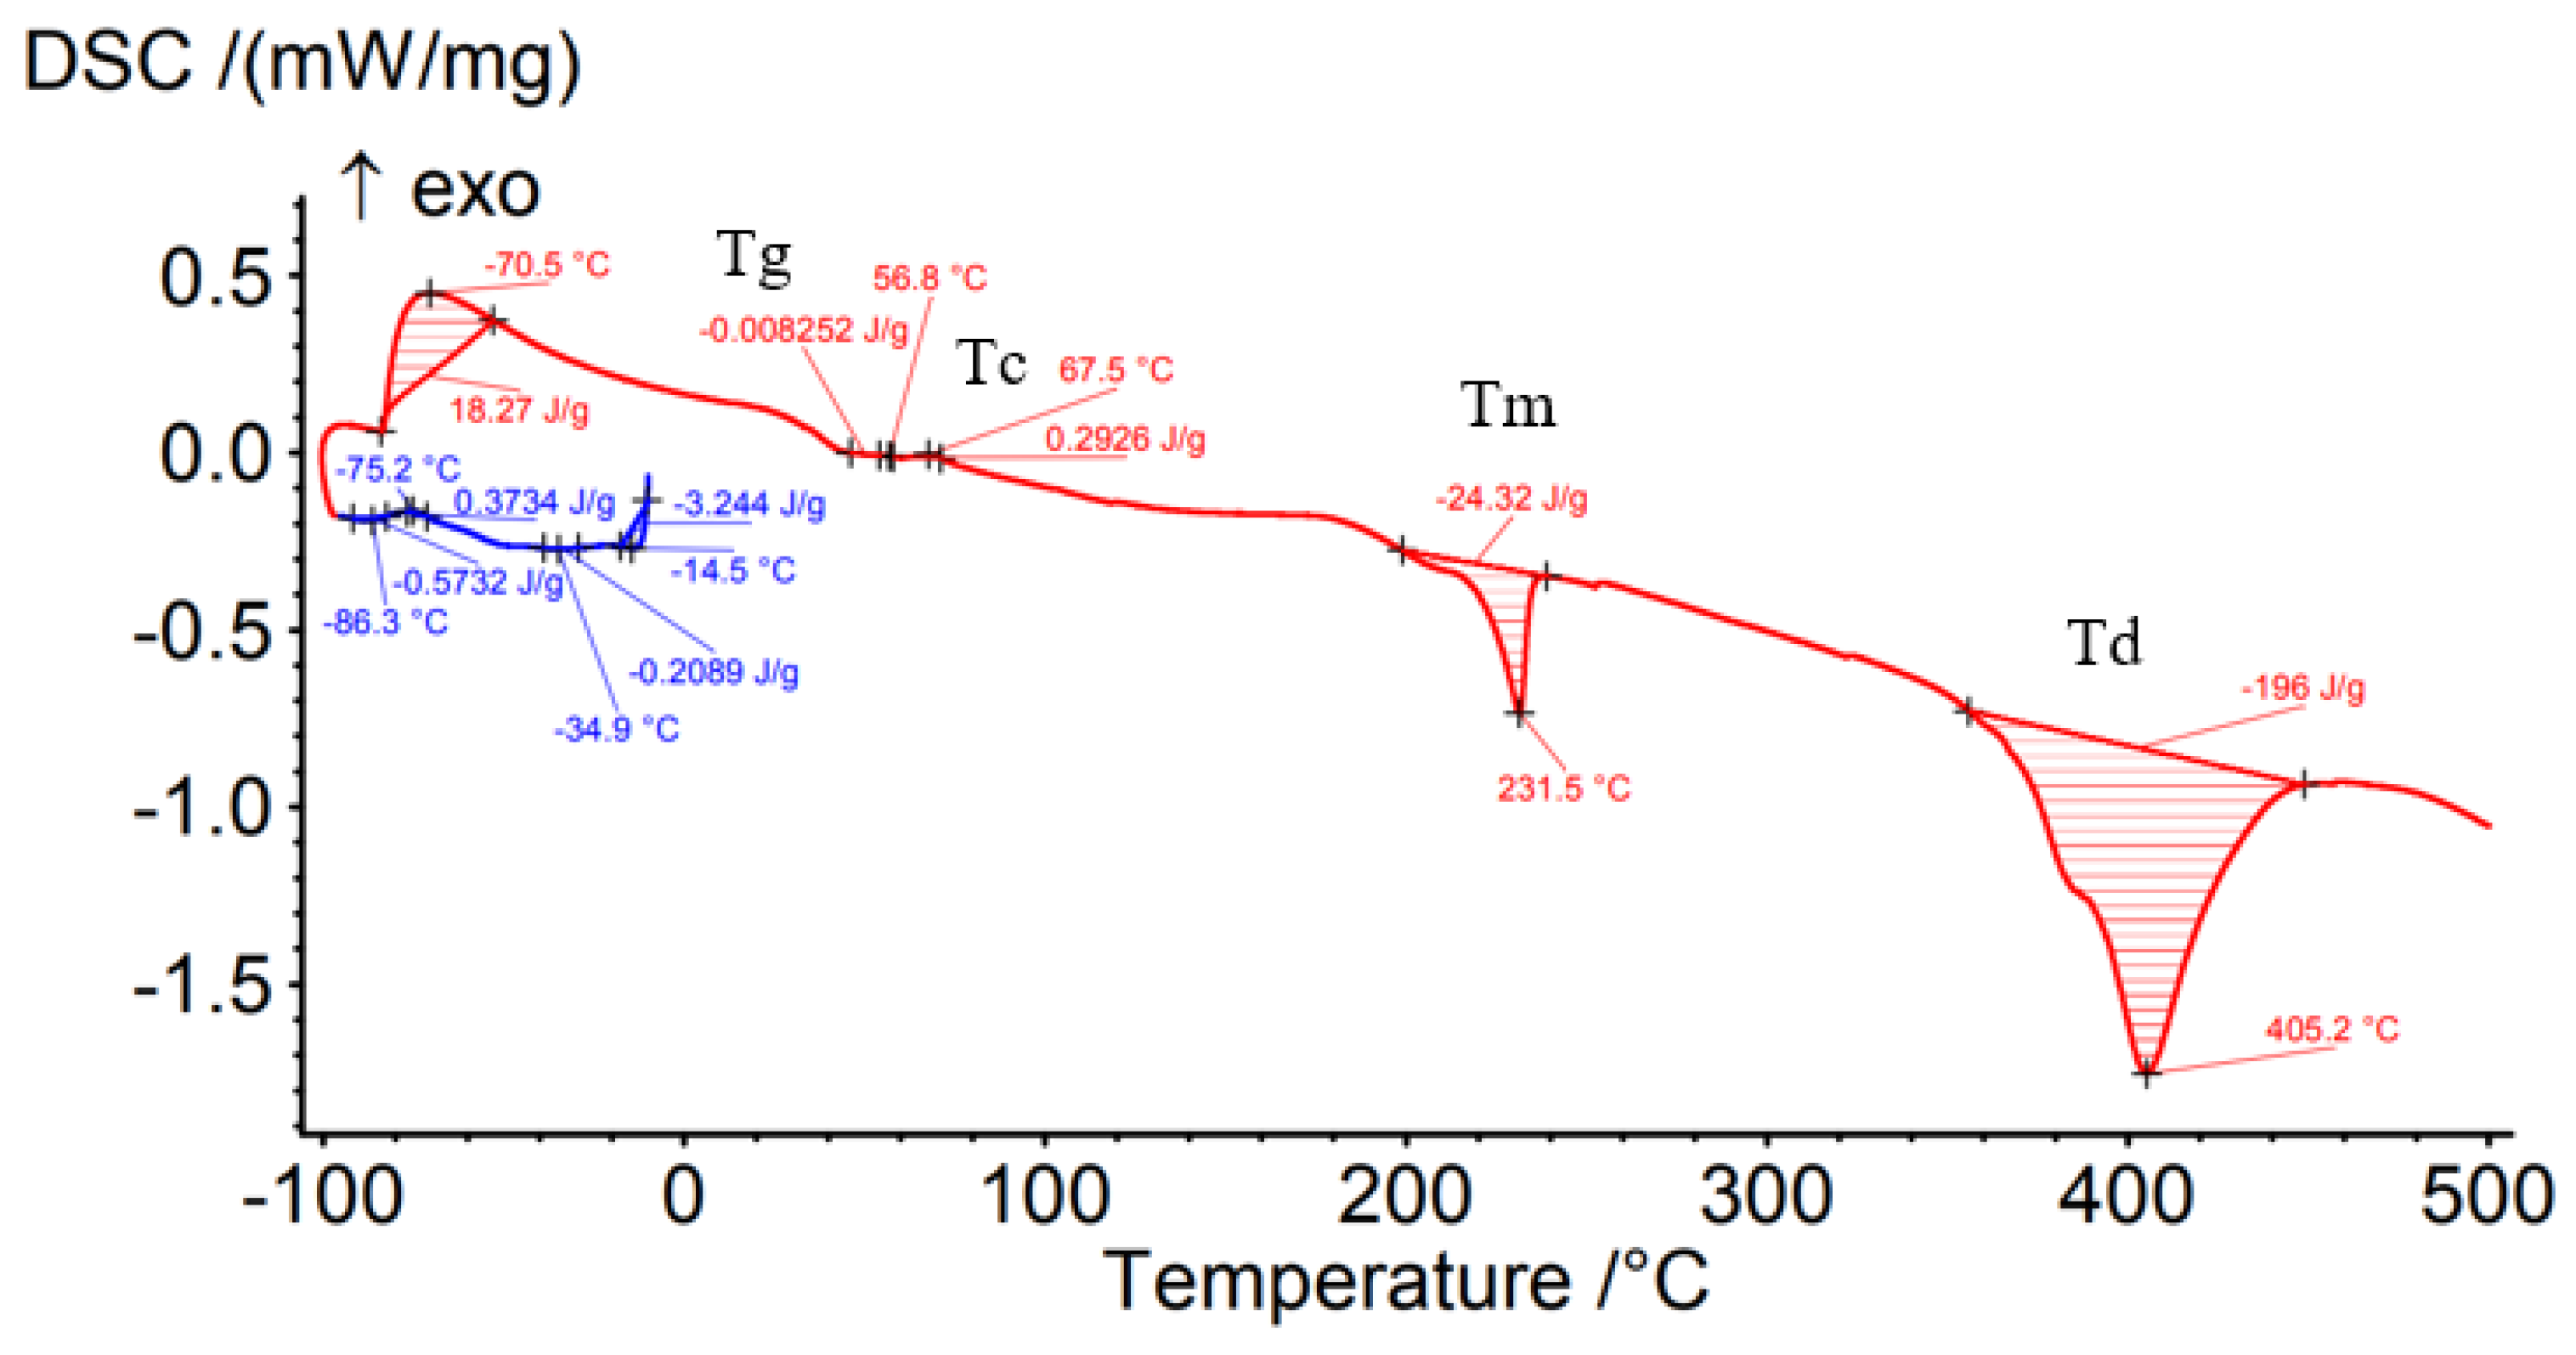
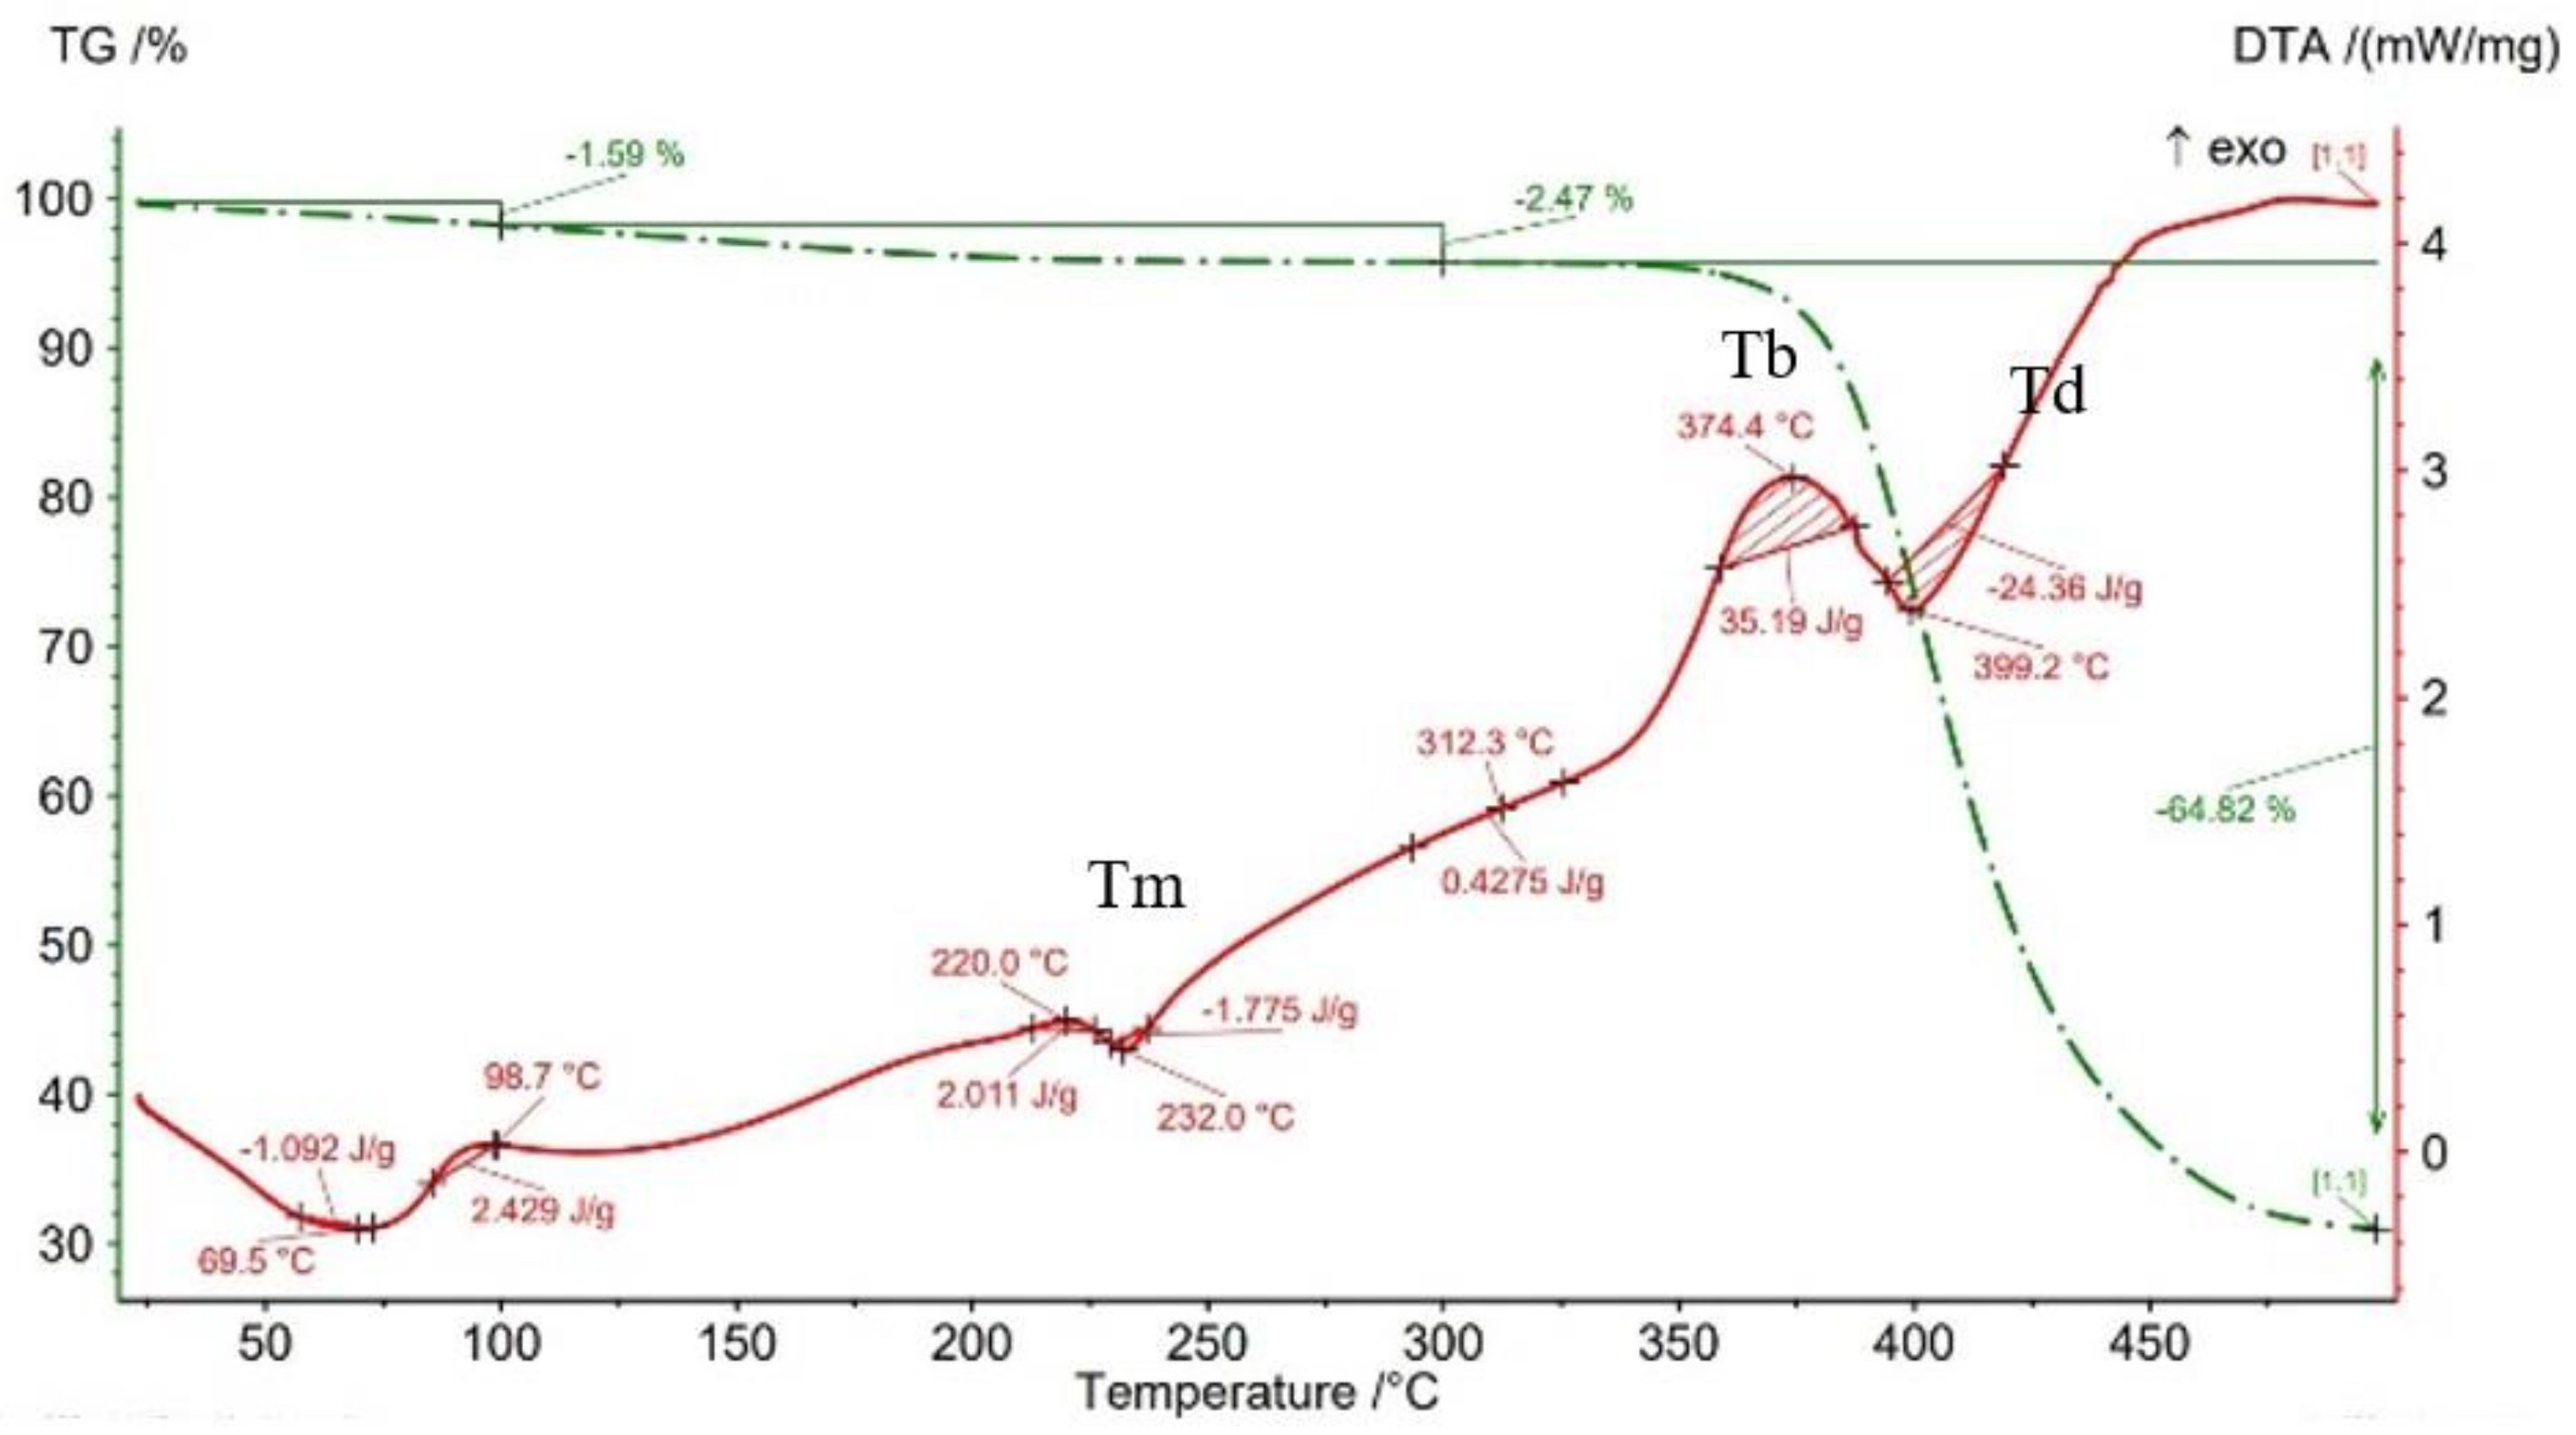
- DSC analyses indicated that both the PACH CF15 filament and the printed samples show glass transition, cold crystallization, and melting and degradation peaks. It was found that the infill density percentage influences the glass transition temperature (Tg); therefore, the increase in ID determines the decrease in the transition temperature from the glassy to the rubbery phase (Figure 8, Figure 9, Figure 10, Figure 11 and Figure 12, Table 5). The highest value of Tg, 49.6 °C, was recorded for samples with an ID of 25%, while for those with an ID of 100%, Tg is 32.9 °C.
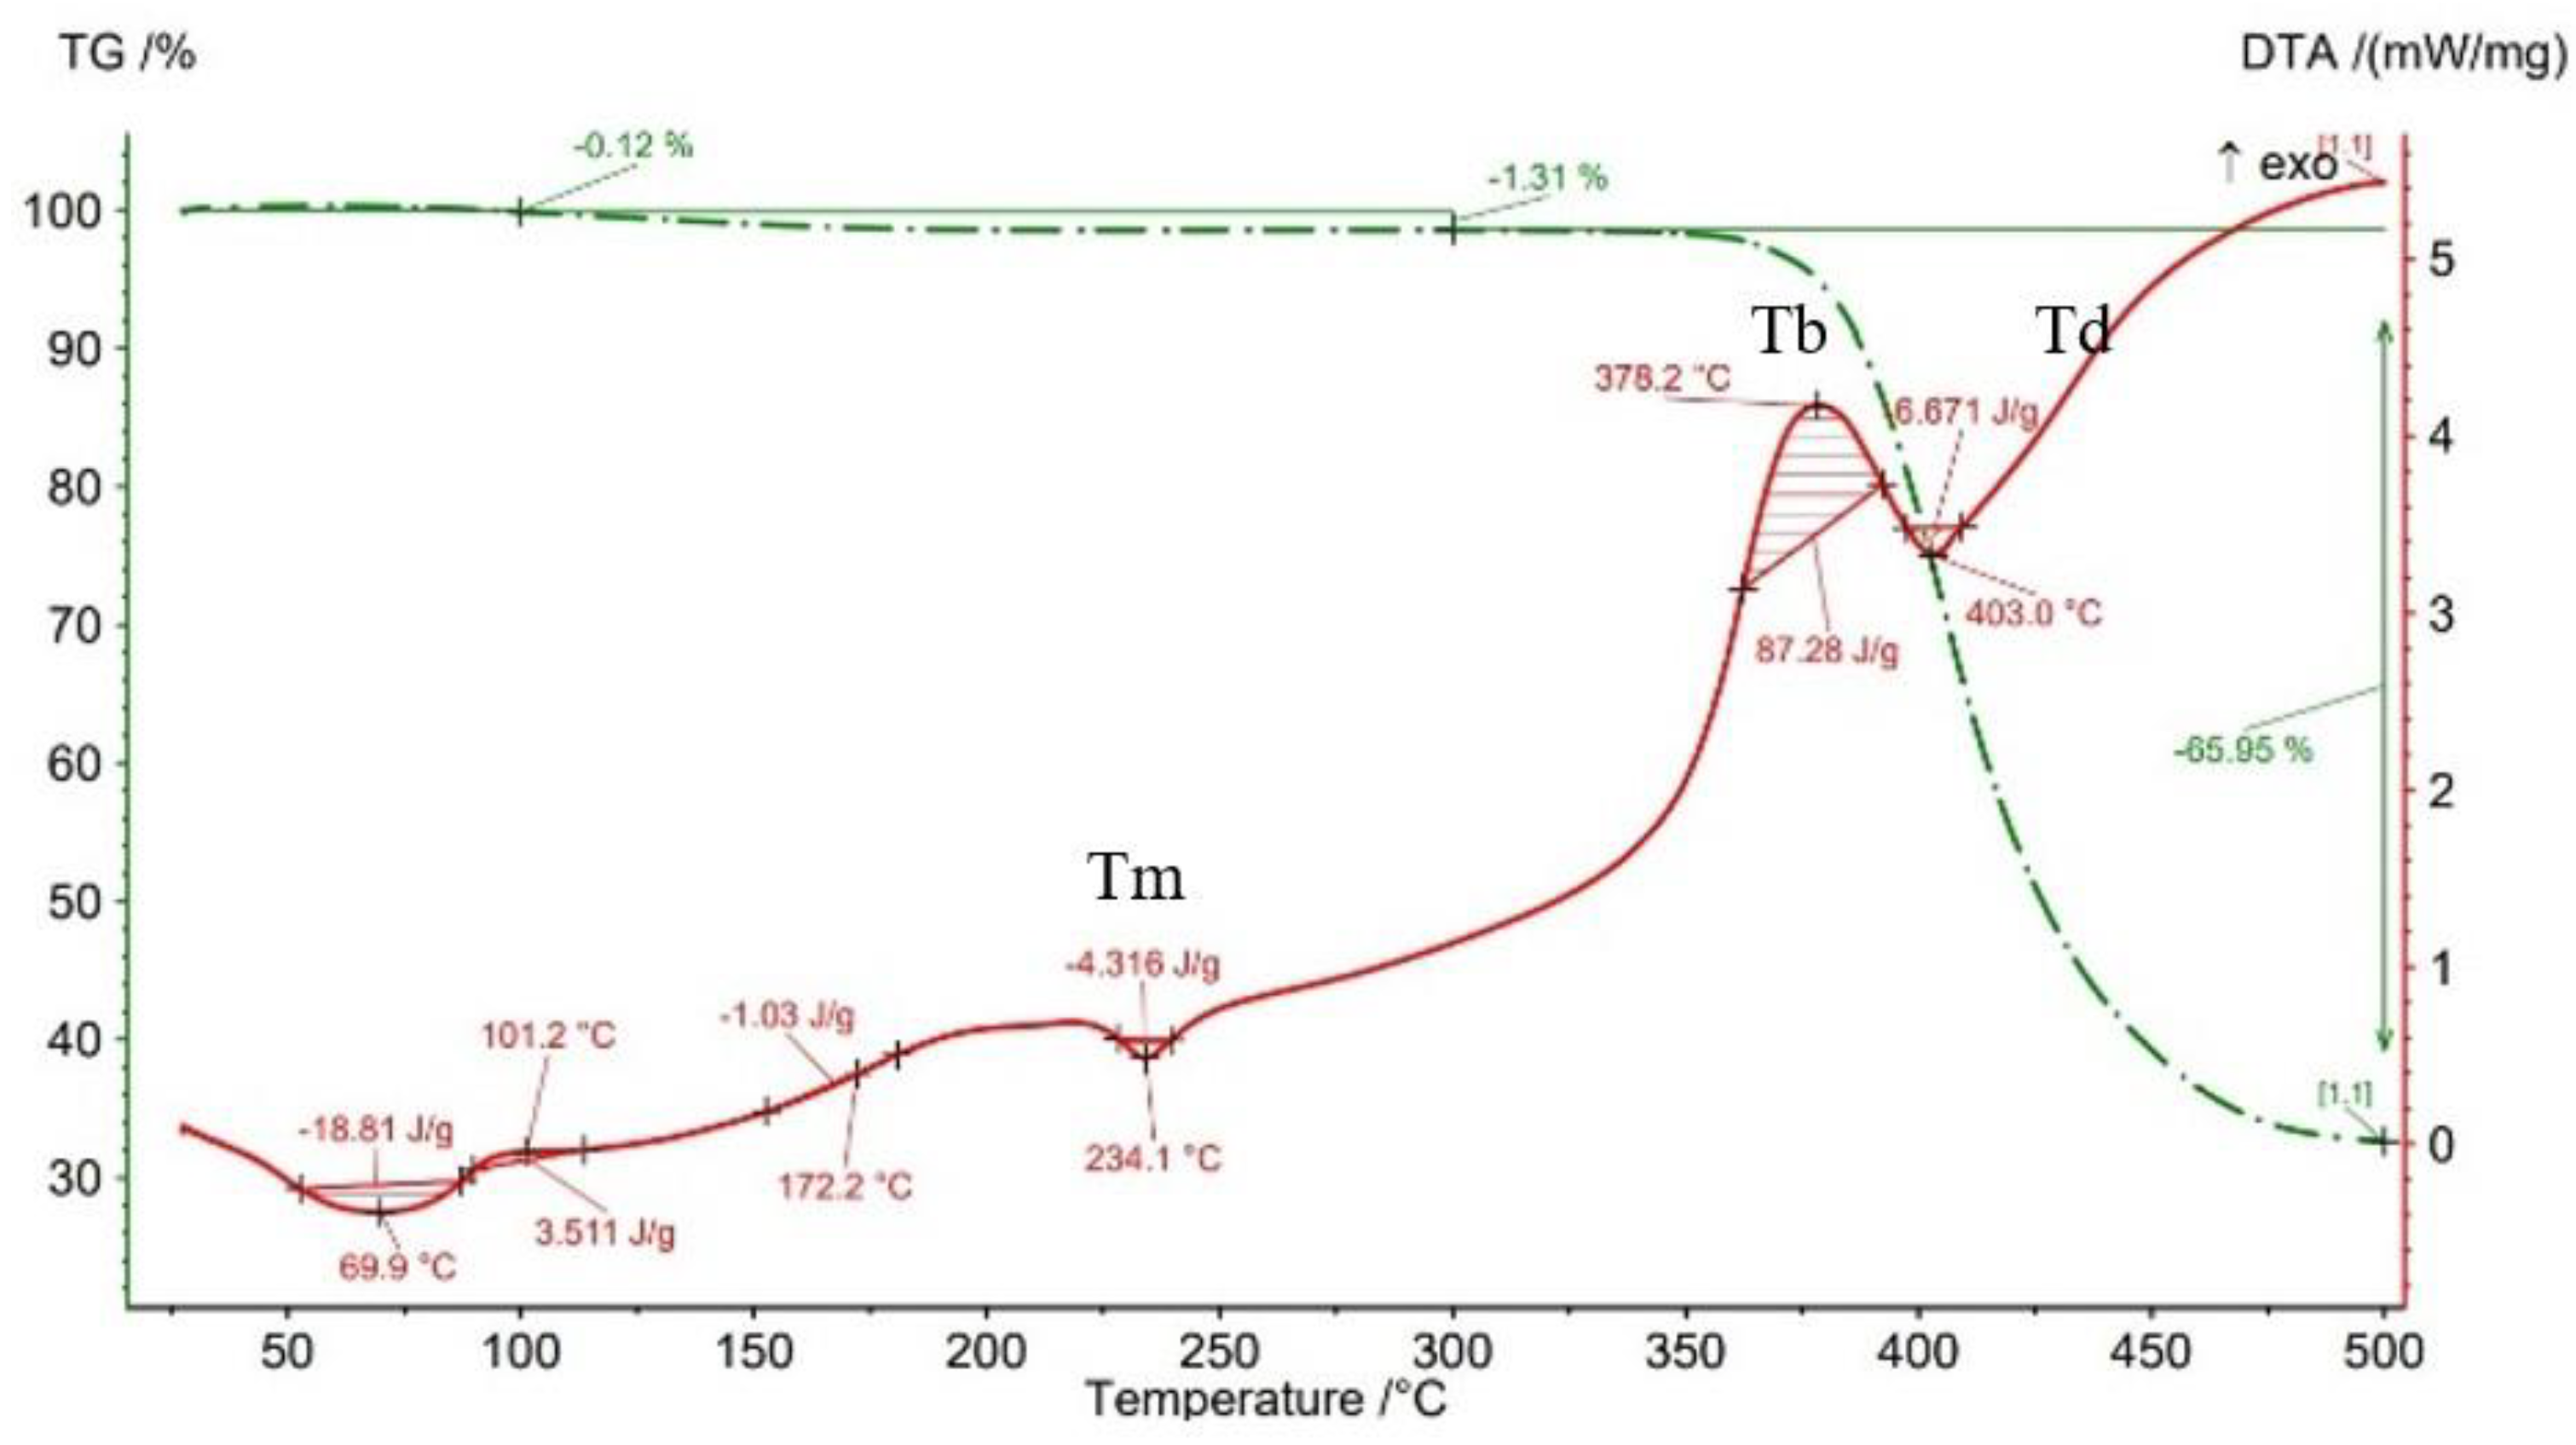
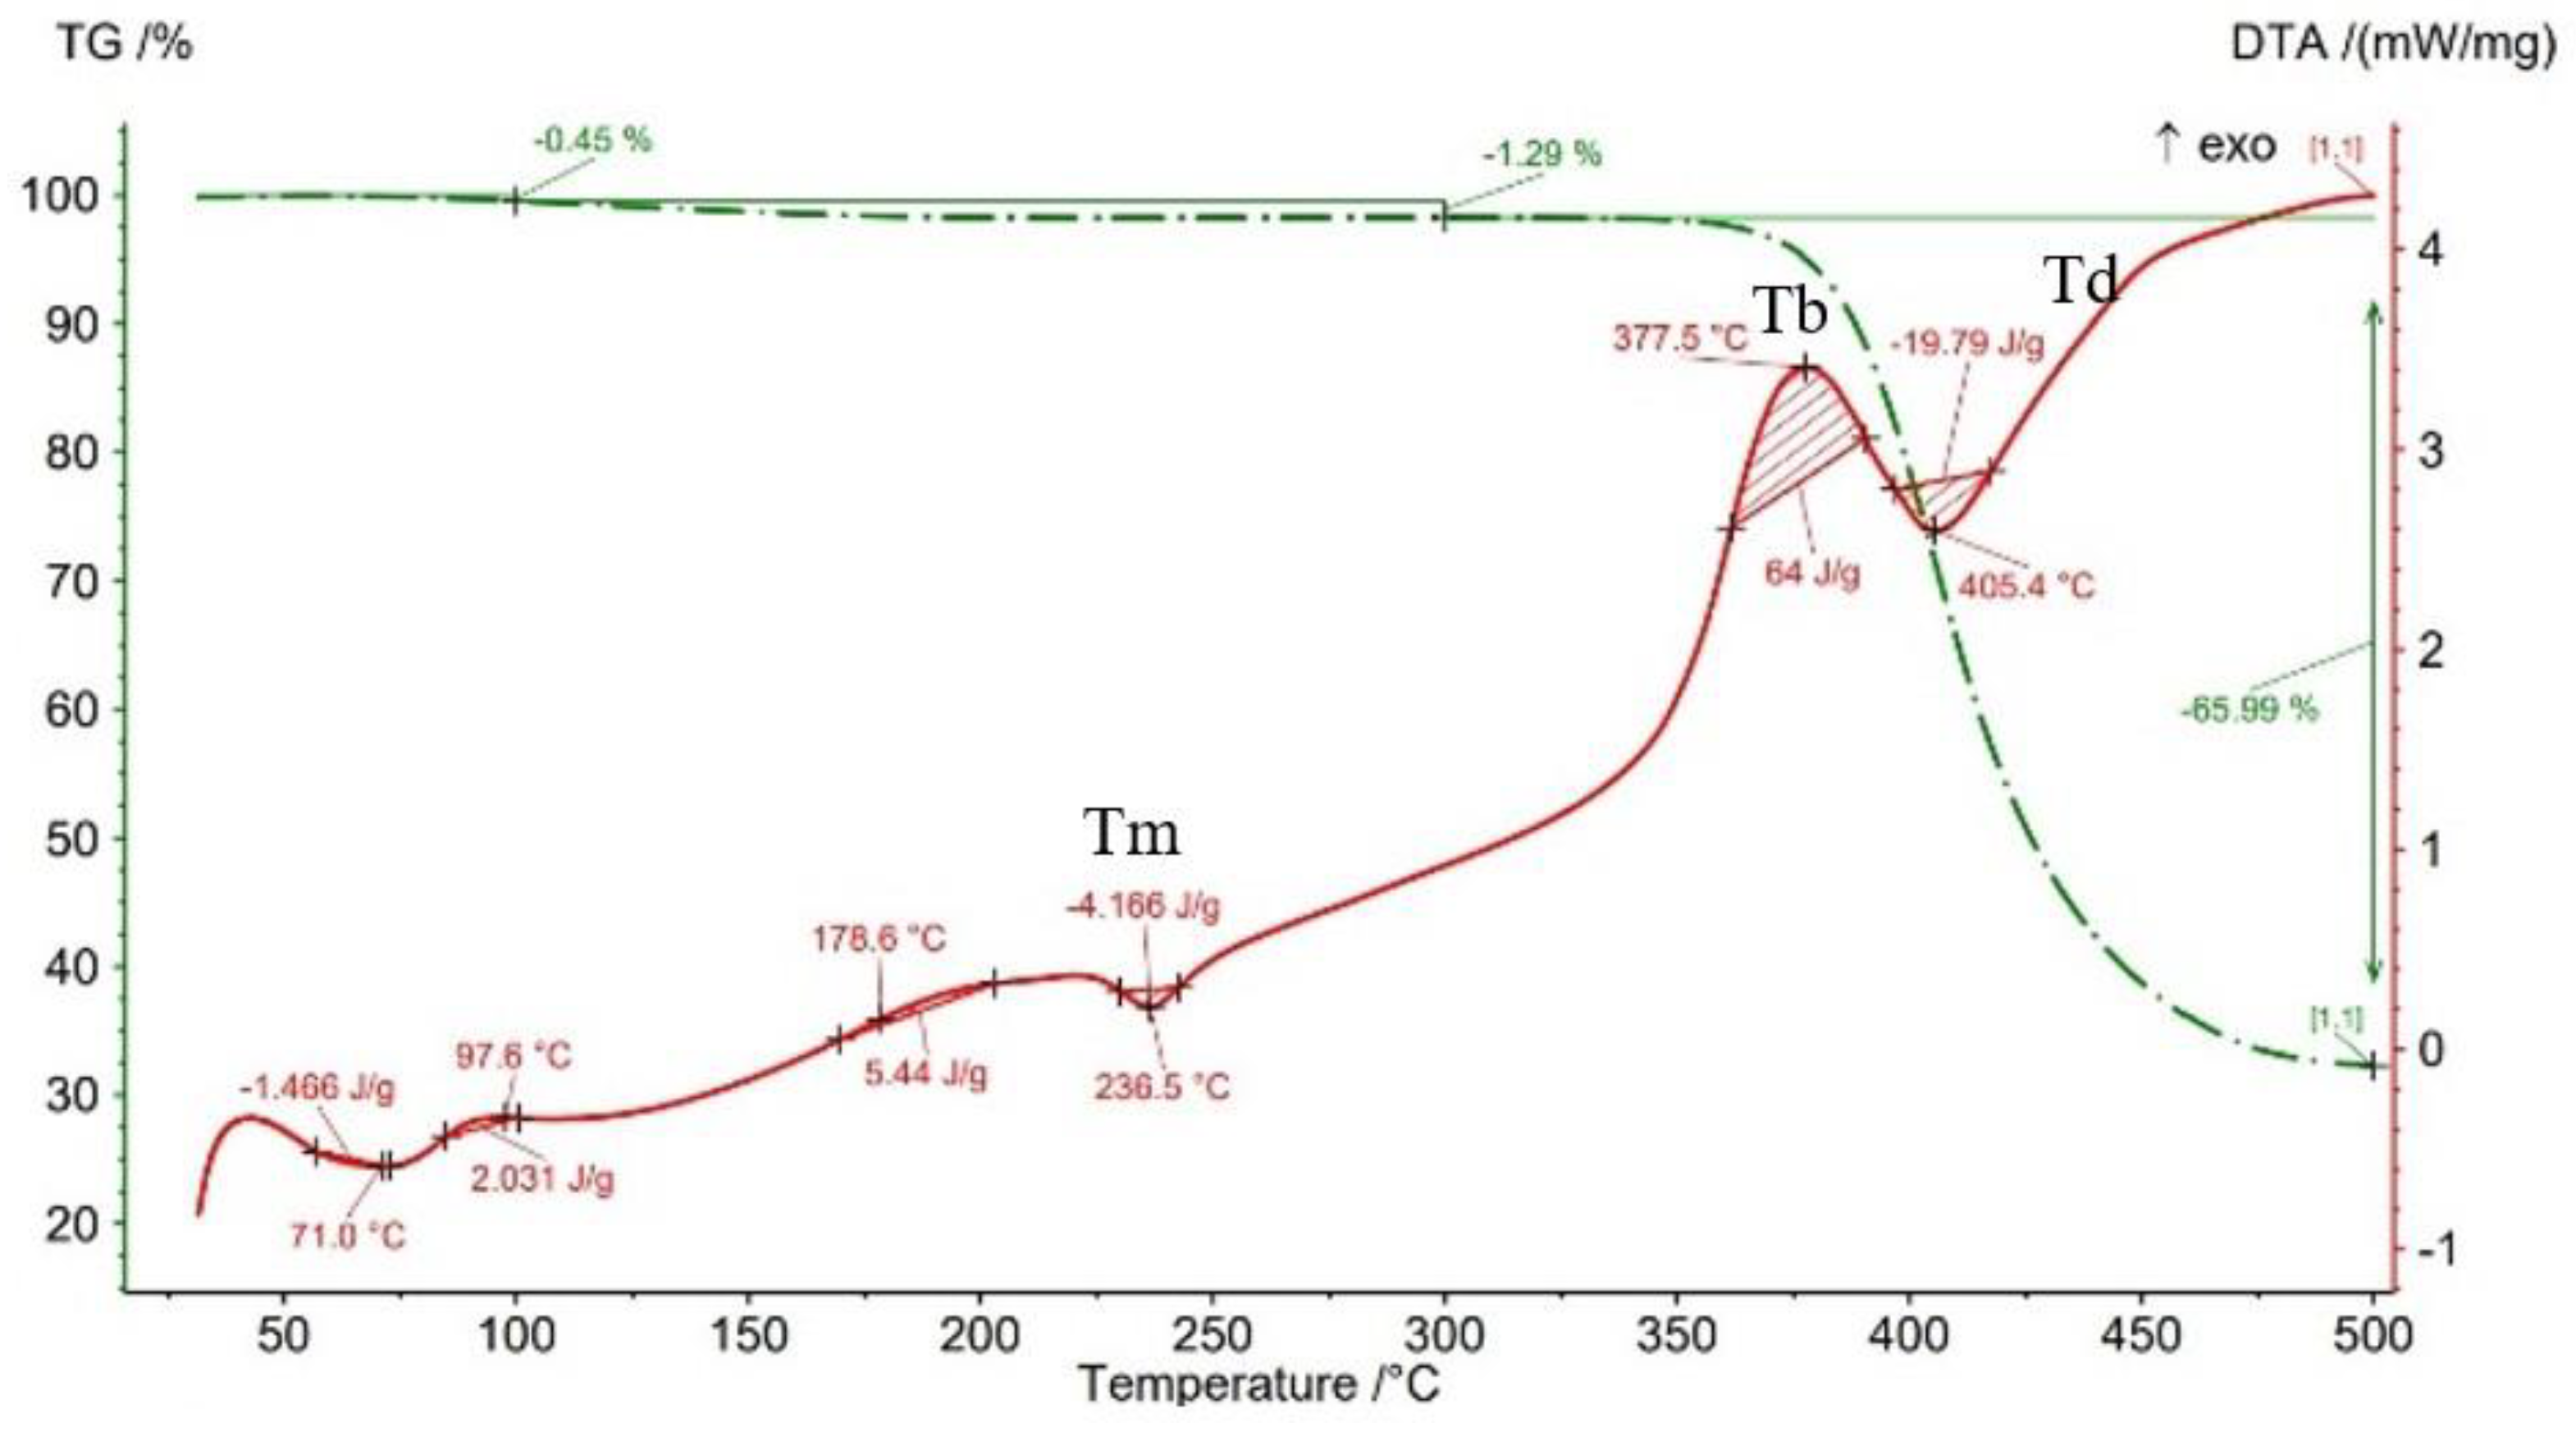
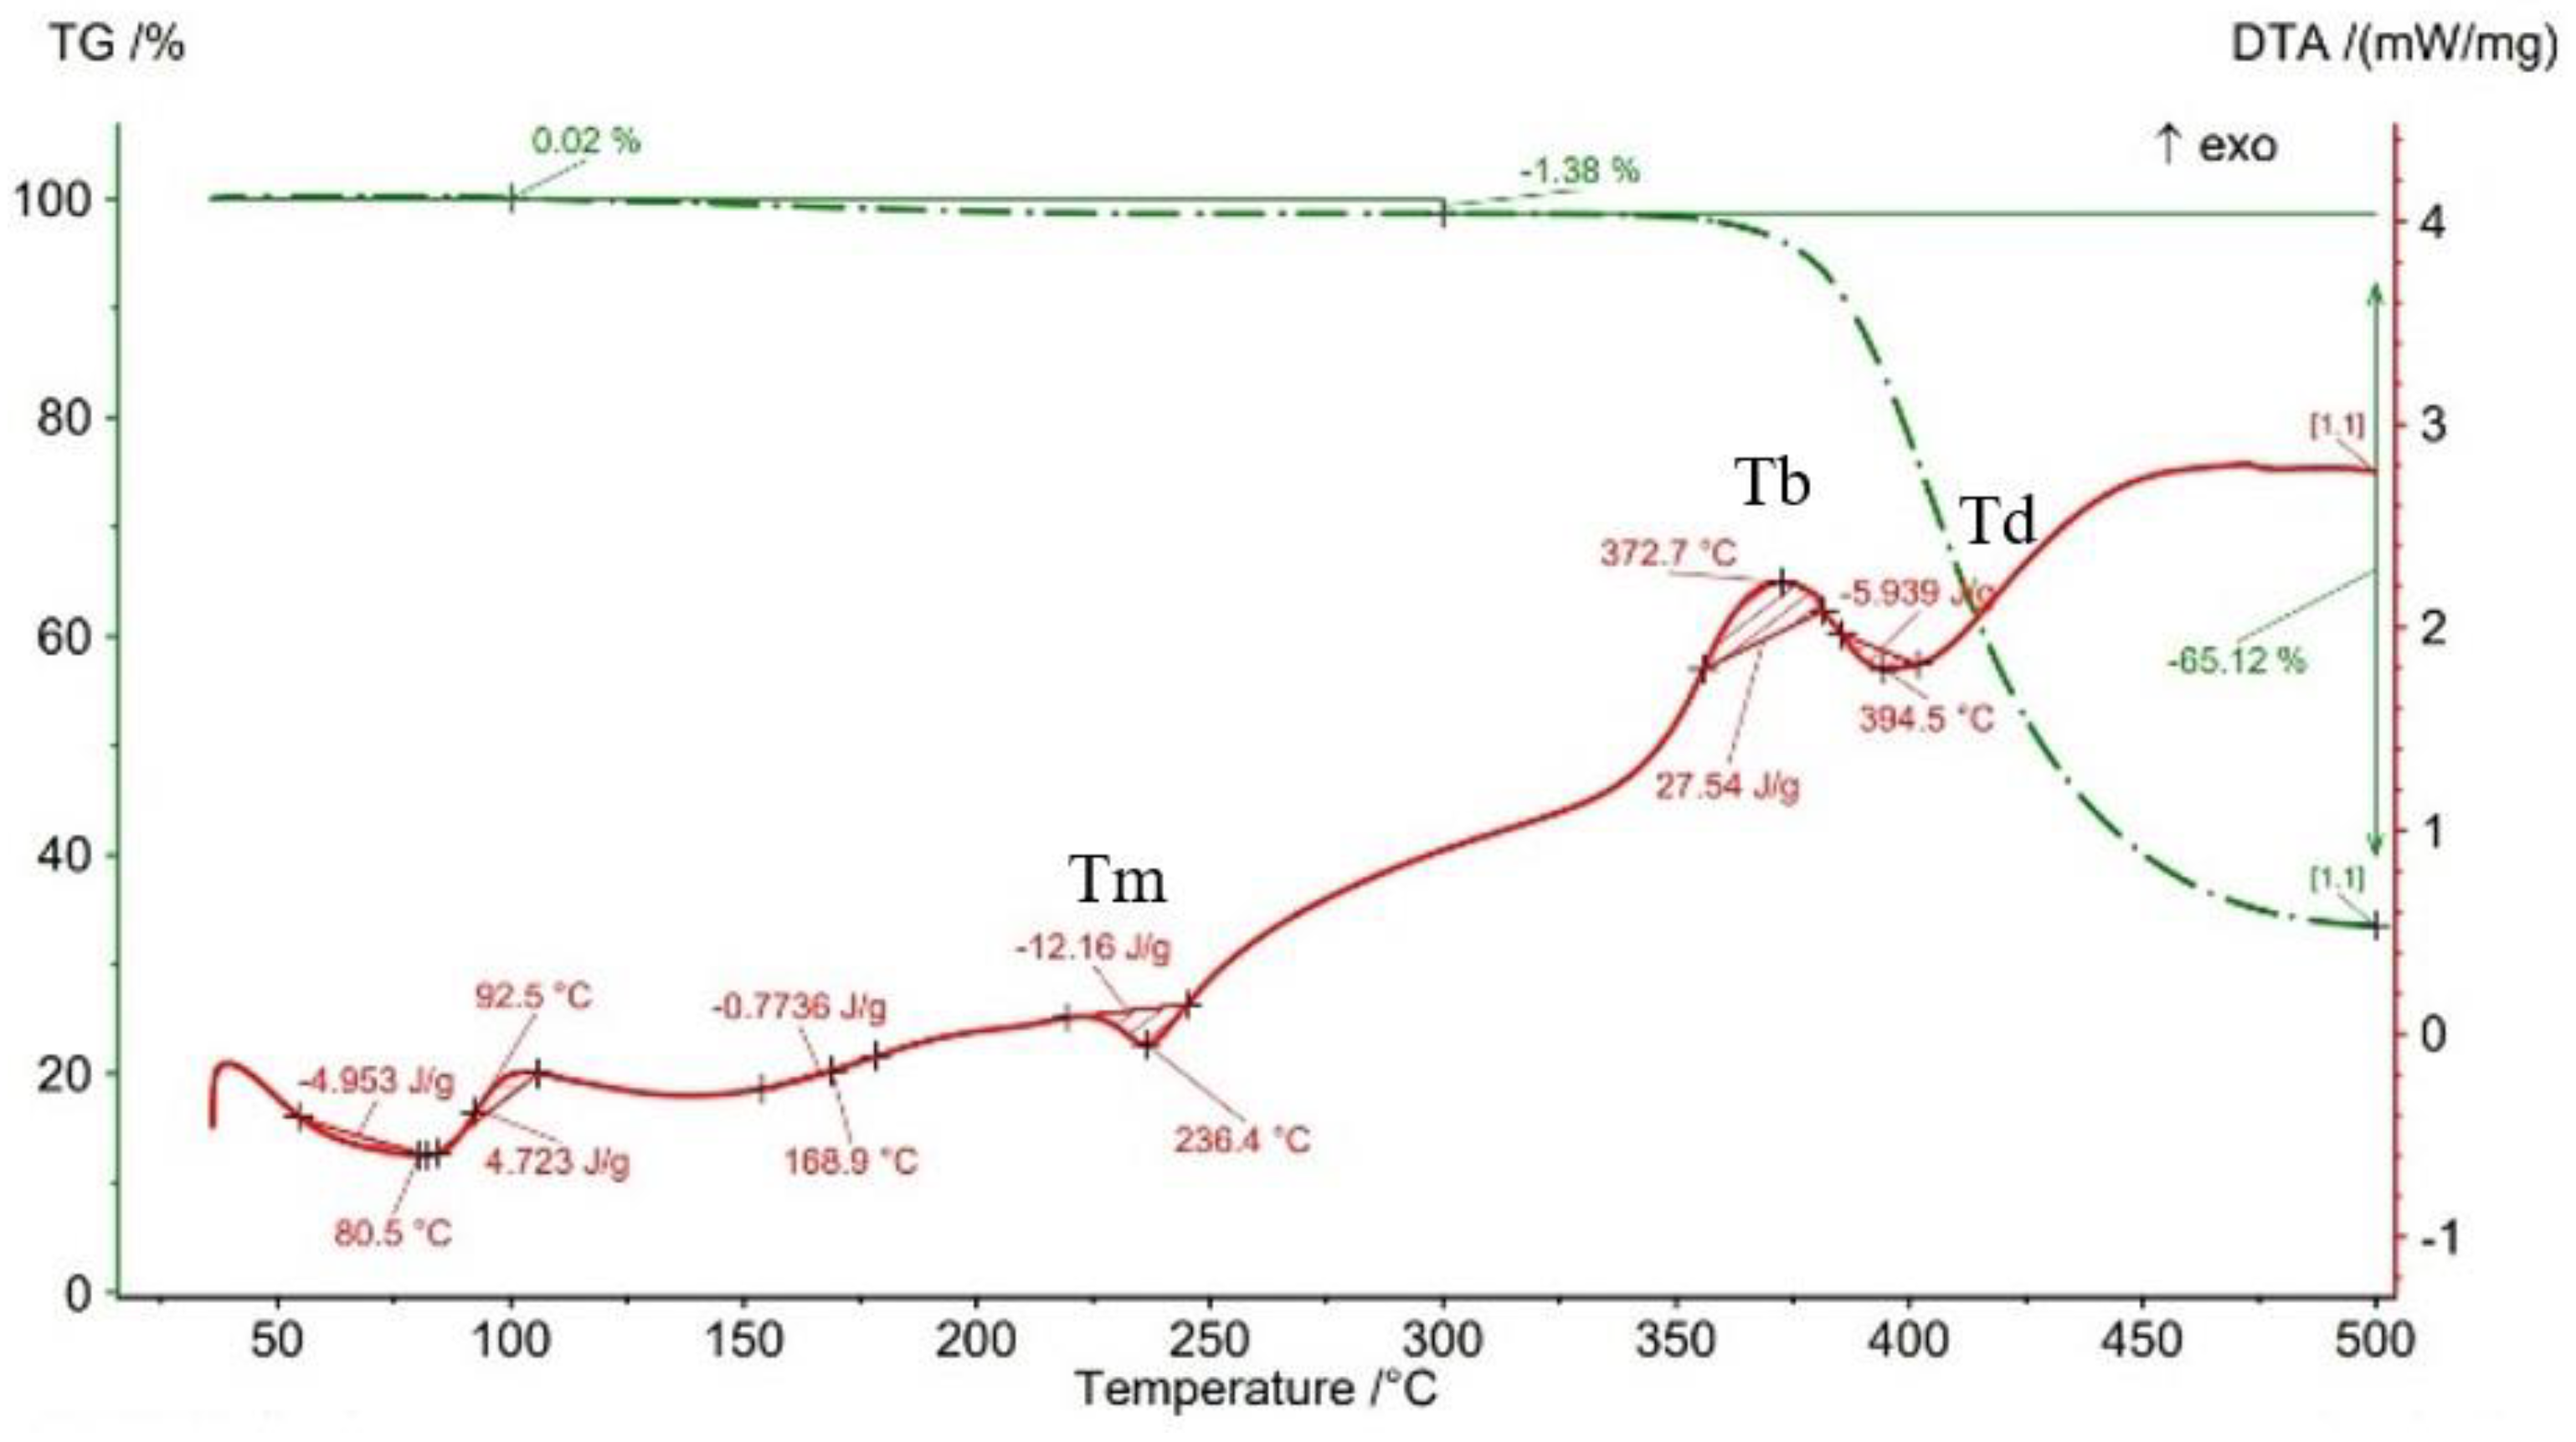
- The results of the TGA analysis of the PAHT CF5 filament showed that exceeding the temperature of 345.75 °C (thermal stability limit) determines the beginning of the accentuated degradation process of the material with significant mass loss (Table 6, Figure 13, Figure 14, Figure 15, Figure 16 and Figure 17). In the case of samples manufactured with the four infill densities, the thermal stability limit is close to the filament, namely at 344.75 °C (in the case of specimens with IDs of 75% and 100%). It was found that the increase in the percentage of ID causes a decrease in the thermal degradation temperature (onset temperature). Samples with IDs of 75% and 100% recorded a temperature of 344.75 °C and those with IDs of 25 and 50%, 348.5 °C and 349.6 °C, respectively (Figure 13, Figure 14, Figure 15, Figure 16 and Figure 17).
Author Contributions
Funding
Institutional Review Board Statement
Informed Consent Statement
Data Availability Statement
Acknowledgments
Conflicts of Interest
References
- Zhang, X.; Fan, W.; Liu, T. Fused deposition modeling 3D printing of polyamide-based composites and its applications. Compos. Commun. 2020, 21, 100413. [Google Scholar] [CrossRef]
- Shanmugam, V.; Rajendran, D.J.J.; Babu, K.; Rajendran, S.; Veerasimman, A.; Marimuthu, U.; Singh, S.; Das, O.; Neisiany, R.E.; Hedenqvist, M.S.; et al. The mechanical testing and performance analysis of polymer-fibre composites prepared through the additive manufacturing. Polym. Test. 2021, 93, 106925. [Google Scholar] [CrossRef]
- Fidan, I.; Imeri, A.; Gupta, A.; Hasanov, S.; Nasirov, A.; Elliott, A.; Alifui-Segbaya, F.; Nanami, N. The trends and challenges of fiber reinforced additive manufacturing. Int. J. Adv. Manuf. Technol. 2019, 102, 1801–1818. [Google Scholar] [CrossRef]
- Wu, D.; Yao, Z.; Sun, X.; Liu, X.; Liu, L.; Zhang, R.; Wang, C. Mussel-tailored carbon fiber/carbon nanotubes interface for elevated interfacial properties of carbon fiber/epoxy composites. Chem. Eng. J. 2022, 429, 132449. [Google Scholar] [CrossRef]
- Jahangir, H.; Esfahani, M.R. Experimental analysis on tensile strengthening properties of steel and glass fiber reinforced inorganic matrix composites. Sci. Iran. 2021, 28, 1152–1166. [Google Scholar]
- Liao, G.; Li, Z.; Cheng, Y.; Xu, D.; Zhu, D.; Jiang, S.; Guo, J.; Chen, X.; Xu, G.; Zhu, Y. Properties of oriented carbon fibre/polyamide 12 composite parts fabricated by fused deposition modeling. Mater. Des. 2018, 139, 283–292. [Google Scholar] [CrossRef]
- Van de Werken, N.; Tekinalp, H.; Khanbolouki, P.; Ozcan, S.; Williams, A.; Tehrani, M. Additively manufactured carbon fiber-reinforced composites: State of the art and perspective. Addit. Manuf. 2020, 31, 100962. [Google Scholar] [CrossRef]
- Liberati, A.C.; Che, H.; Aghasibeig, M.; Yu, K.R.; Vo, P.; Yue, S. On the importance of secondary component properties for cold spray metallization of carbon fiber reinforced polymers. J. Therm. Spray Technol. 2022, 31, 159–175. [Google Scholar] [CrossRef]
- Li, Y.; Gao, S.; Dong, R.; Ding, X.; Duan, X. Additive manufacturing of PLA and CF/PLA binding layer specimens via fused deposition modeling. J. Mater. Eng. Perform. 2018, 27, 492–500. [Google Scholar] [CrossRef]
- Tian, X.; Liu, T.; Yang, C.; Wang, Q.; Li, D. Interface and performance of 3D printed continuous carbon fiber reinforced PLA composites. Compos. Part A Appl. Sci. Manuf. 2016, 88, 198–205. [Google Scholar] [CrossRef]
- Tekinalp, H.L.; Kunc, V.; Velez-Garcia, G.M.; Duty, C.E.; Love, L.J.; Naskar, A.K.; Blue, C.A.; Ozcan, S. Highly oriented carbon fibre-polymer composites via additive manufacturing. Compos. Sci. Technol. 2014, 105, 144–150. [Google Scholar] [CrossRef] [Green Version]
- Ning, F.; Cong, W.; Hu, Y.; Wang, H. Additive manufacturing of carbon fibre reinforced plastic composites using fused deposition modeling: Effects of process parameters on tensile properties. J. Compos. Mater. 2017, 51, 451–462. [Google Scholar] [CrossRef]
- Ramesh, M.; Panneerselvam, K. Mechanical investigation and optimization of parameter selection for Nylon material processed by FDM. Mater. Today Proc. 2021, 46, 9303–9307. [Google Scholar] [CrossRef]
- Naranjo-Lozada, J.; Ahuett-Garza, H.; Orta-Castañón, P.; Verbeeten, W.M.H.; Sáiz-González, D. Tensile properties and failure behavior of chopped and continuous carbon fiber composites produced by additive manufacturing. Addit. Manuf. 2019, 26, 227–241. [Google Scholar] [CrossRef]
- Pop, M.A.; Zaharia, S.M.; Chicos, L.A.; Lancea, C.; Stamate, V.M.; Buican, G.R.; Pascariu, I.S. Effect of the infill patterns on the mechanical properties of the carbon fiber 3D printed parts. In Proceedings of the 25th Edition of Innovative Manufacturing Engineering & Energy International Conference—IMANEE, Iasi, Romania, 21–23 October 2021. [Google Scholar]
- Gavali, V.C.; Kubade, P.R.; Kulkarni, H.B. Property enhancement of carbon fibre reinforced polymer composites prepared by fused deposition modeling. Mater. Today Proc. 2020, 23, 221–229. [Google Scholar] [CrossRef]
- Dul, S.; Fambri, L.; Pegoretti, A. High-performance polyamide/carbon fiber composites for fused filament fabrication: Mechanical and functional performances. J. Mater. Eng. Perform. 2021, 30, 5066–5085. [Google Scholar] [CrossRef]
- Yang, D.; Zhang, H.; Wu, J.; McCarthy, E. Fibre flow and void formation in 3D printing of short-fibre reinforced thermoplastic composites: An experimental benchmark exercise. Addit. Manuf. 2021, 37, 101686. [Google Scholar] [CrossRef]
- Porter, J.H.; Cain, T.M.; Fox, S.L.; Harvey, P.S. Influence of infill properties on flexural rigidity of 3D-printed structural members. Virtual Phys. Prototyp. 2019, 14, 148–159. [Google Scholar] [CrossRef]
- Mishra, P.; Senthil, P.; Adarsh, S.; Anoop, M.S. An investigation to study the combined effect of different infill pattern and infill density on the impact strength of 3D printed polylactic acid parts. Compos. Commun. 2020, 24, 100605. [Google Scholar] [CrossRef]
- Tanveer, M.Q.; Haleem, A.; Suhaib, M. Effect of variable infill density on mechanical behaviour of 3-D printed PLA specimen: An experimental investigation. SN Appl. Sci. 2019, 1, 1701. [Google Scholar] [CrossRef] [Green Version]
- Aloyaydi, B.A.; Sivasankaran, S.; Ammar, H.R. Influence of infill density on microstructure and flexural behavior of 3D printed PLA thermoplastic parts processed by fusion deposition modeling. AIMS Mater. Sci. 2019, 6, 1033–1048. [Google Scholar] [CrossRef]
- Terekhina, S.; Skornyakov, I.; Tarasova, T.; Egorov, S. Effects of the Infill Density on the Mechanical Properties of Nylon Specimens Made by Filament Fused Fabrication. Technologies 2019, 7, 57. [Google Scholar] [CrossRef] [Green Version]
- Belei, C.; Joeressen, J.; Amancio-Filho, S.T. Fused-Filament Fabrication of Short Carbon Fiber-Reinforced Polyamide: Parameter Optimization for Improved Performance under Uniaxial Tensile Loading. Polymers 2022, 14, 1292. [Google Scholar] [CrossRef] [PubMed]
- Maszybrocka, J.; Dworak, M.; Nowakowska, G.; Osak, P.; Łosiewicz, B. The Influence of the Gradient Infill of PLA Samples Produced with the FDM Technique on Their Mechanical Properties. Materials 2022, 15, 1304. [Google Scholar] [CrossRef]
- Kaur, M.; Yun, T.G.; Han, S.M.; Thomas, E.L.; Kim, W.S. 3D printed stretching dominated micro-trusses. Mater. Des. 2017, 134, 272–280. [Google Scholar] [CrossRef]
- Toro, E.; Coello, J.; Martínez-Martínez, A.; Eguía, V. Analysis of the influence of the variables of the Fused Deposition Modeling (FDM) process on the mechanical properties of a carbon fiber-reinforced polyamide. Procedia Manuf. 2019, 41, 731–738. [Google Scholar] [CrossRef]
- Billah, K.M.; Lorenzana, F.; Martinez, N.L.; Chacon, S.; Wicker, R.B.; Espalin, D. Thermal analysis of thermoplastic materials filled with chopped fiber for large area 3d printing. In Proceedings of the Solid Freeform Fabrication 2019: Proceedings of the 30th Annual International Solid Freeform Fabrication Symposium—An Additive Manufacturing Conference, Austin, TX, USA, 12–14 August 2019. [Google Scholar]
- Goh, G.D.; Agarwala, S.; Goh, G.L.; Dikshit, V.; Sing, S.L.; Yeong, W.Y. Additive manufacturing in unmanned aerial vehicles (UAVs): Challenges and potential. Aerosp. Sci. Technol. 2017, 63, 140–151. [Google Scholar] [CrossRef]
- ASTM D638; Standard Test Method for Tensile Properties of Plastics. ASTM International: West Conshohocken, PA, USA, 2014.
- ASTM D790; Standard Test Methods for Flexural Properties of Unreinforced and Reinforced Plastics and Electrical Insulating Materials. ASTM International: West Conshohocken, PA, USA, 2003.
- Ultrafuse PAHT CF15, Technical Data Sheet. Available online: https://www.ultrafusefff.com/wp-content/uploads/2019/06/Innofil3D_PAHT_PET_CF15_Factsheet-online.pdf (accessed on 9 October 2021).
- Start Your Creation. Available online: https://www.ultrafusefff.com/product-category/innopro/paht-cf/ (accessed on 9 October 2021).
- ASTM D3418-21; Standard Test Method for Transition Temperatures and Enthalpies of Fusion and Crystallization of Polymers by Differential Scanning Calorimetry. ASTM International: West Conshohocken, PA, USA, 2021.
- ASTM E1131-20; Standard Test Method for Compositional Analysis by Thermogravimetry. ASTM International: West Conshohocken, PA, USA, 2020.
- Gonabadi, H.; Yadav, A.; Bull, S.J. The effect of processing parameters on the mechanical characteristics of PLA produced by a 3D FFF printer. Int. J. Adv. Manuf. Technol. 2020, 111, 695–709. [Google Scholar] [CrossRef]
- Alvarez, K.L.; Aizpun, M. Investigating the influence of infill percentage on the mechanical properties of fused deposition modelled ABS parts. Ing. Investig. 2016, 36, 110–116. [Google Scholar] [CrossRef] [Green Version]
- Sommacal, S.; Matschinski, A.; Drechsler, K.; Compston, P. Characterisation of void and fiber distribution in 3D printed carbon-fiber/PEEK using X-ray computed tomography. Compos. Part A Appl. Sci. Manuf. 2021, 149, 106487. [Google Scholar] [CrossRef]
- Wolszczak, P.; Lygas, K.; Paszko, M.; Wach, R.A. Heat distribution in material during fused deposition modelling. Rapid Prototyp. J. 2018, 24, 615–622. [Google Scholar] [CrossRef]
- Tao, Y.; Kong, F.; Li, Z.; Zhang, J.; Zhao, X.; Yin, Q.; Xing, D.; Li, P. A review on voids of 3D printed parts by fused filament fabrication. J. Mater. Res. Technol. 2021, 15, 4860–4879. [Google Scholar] [CrossRef]
- Peng, X.; Zhang, M.; Guo, Z.; Sang, L.; Hou, W. Investigation of processing parameters on tensile performance for FDM-printed carbon fiber reinforced polyamide 6 composites. Compos. Commun. 2020, 22, 100478. [Google Scholar] [CrossRef]
- Dillon, B.; Doran, P.; Fuenmayor, E.; Healy, A.V.; Gately, N.M.; Major, I.; Lyons, J.G. The influence of low shear microbore extrusion on the properties of high molecular weight Poly (L-Lactic Acid) for medical tubing applications. Polymers 2019, 11, 710. [Google Scholar] [CrossRef] [Green Version]
- Griffini, G.; Invernizzi, M.; Levi, M.; Natale, G.; Postiglione, G.; Turri, S. 3D-printable CFR polymer composites with dual-cure sequential IPNs. Polymer 2016, 1, 174–179. [Google Scholar] [CrossRef]
- Parodi, E. Structure Properties Relations for Polyamide 6. Ph.D. Thesis, Technische Universiteit Eindhoven, Eindhoven, The Netherlands, 2017. Available online: https://research.tue.nl/files/78550432/20171026_Parodi.pdf (accessed on 22 December 2021).


| Parameter | Value | Unit |
|---|---|---|
| Filament diameter | 2.85 | [mm] |
| Layer height | 0.2 | [mm] |
| Infill density | 25; 50; 75; 100 | [%] |
| Print speed | 50 | [mm/s] |
| Extrusion temperature | 260 | [°C] |
| Building plate temperature | 90 | [°C] |
| Nozzle diameter | 0.6 | [mm] |
| Number of lower and upper layers | 8 | |
| Number of shell contours | 4 | |
| Infill pattern | Triangle (0°/60° with respect to load direction) |
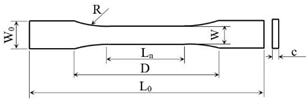 | Length Overall L0 [mm] | Distance between Grips D [mm] | Length of Narrow Section Ln [mm] | Radius of Fillet R [mm] | Width W0 [mm] | Width of Narrow Section W [mm] | Thickness c [mm] |
| 165 | 115 | 57 | 76 | 19 | 13 | 4 |
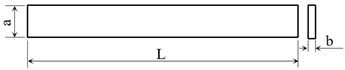 | Length L [mm] | Width a [mm] | Thickness b [mm] |
| 200 | 20 | 4 |
| Mechanical and Physical Properties | Unit | Ultrafuse PAHT CF15 | Testing Method | |
|---|---|---|---|---|
| Dry Specimen | Conditioned Specimen | |||
| Tensile strength | [MPa] | 103.2 | 62.9 | ISO 527 |
| Elongation at Break | [%] | 1.8 | 2.9 | ISO 527 |
| Young’s Modulus | [MPa] | 8386 | 5052 | ISO 527 |
| Flexural Strength | [MPa] | 160.7 | 125.1 | ISO 178 |
| Flexural Modulus | [MPa] | 8258 | 6063 | ISO 178 |
| Flexural Strain at Break | [%] | 2.4 | No break | ISO 178 |
| Melting temperature | [°C] | 234 | ISO 11357-3 | |
| Glass Transition | [°C] | 70 | ISO 11357-2 | |
| Samples | Glass Transition Temperature Tg [°C] | Crystallization Temperature Tc [°C] | Melting Temperature Tm [°C] | Full Degradation Temperature Td [°C] |
|---|---|---|---|---|
| Filament PAHT CF15 | 38.5 | 77.7 | 232.1 | 406.9 |
| Sample 25% ID | 49.6 | 74.7 | 231.7 | 403.9 |
| Sample 50% ID | 34.6 | 62.1 | 232.0 | 405.1 |
| Sample 75% ID | 33.6 | 77.0 | 232.0 | 406.4 |
| Sample 100% ID | 32.9 | 67.5 | 231.5 | 405.2 |
| Samples | Softening Temperature Ts | Melting Temperature Tm | Burning Temperature Tb | Full Degradation Temperature Td | Mass Change 20–100 °C | Mass Change 100–300 °C | Mass Change 300–500 °C |
|---|---|---|---|---|---|---|---|
| [°C] | [°C] | [°C] | [°C] | [%] | [%] | [%] | |
| Filament PAHT CF15 | … | 233.5 | 376.2 | 409.2 | +0.20 | −1.01 | −67.52 |
| Sample 25% ID | 172.2 | 234.1 | 378.2 | 403.0 | −0.12 | −1.31 | −65.95 |
| Sample 50% ID | 178.6 | 236.5 | 377.5 | 405.4 | −0.45 | −1.29 | −65.99 |
| Sample 75% ID | 168.9 | 236.4 | 372.7 | 394.5 | +0.02 | −1.38 | −65.12 |
| Sample 100% ID | 220.0 | 232.0 | 374.4 | 399.2 | −1.59 | −2.47 | −64.82 |
Publisher’s Note: MDPI stays neutral with regard to jurisdictional claims in published maps and institutional affiliations. |
© 2022 by the authors. Licensee MDPI, Basel, Switzerland. This article is an open access article distributed under the terms and conditions of the Creative Commons Attribution (CC BY) license (https://creativecommons.org/licenses/by/4.0/).
Share and Cite
Chicos, L.-A.; Pop, M.A.; Zaharia, S.-M.; Lancea, C.; Buican, G.R.; Pascariu, I.S.; Stamate, V.-M. Infill Density Influence on Mechanical and Thermal Properties of Short Carbon Fiber-Reinforced Polyamide Composites Manufactured by FFF Process. Materials 2022, 15, 3706. https://doi.org/10.3390/ma15103706
Chicos L-A, Pop MA, Zaharia S-M, Lancea C, Buican GR, Pascariu IS, Stamate V-M. Infill Density Influence on Mechanical and Thermal Properties of Short Carbon Fiber-Reinforced Polyamide Composites Manufactured by FFF Process. Materials. 2022; 15(10):3706. https://doi.org/10.3390/ma15103706
Chicago/Turabian StyleChicos, Lucia-Antoneta, Mihai Alin Pop, Sebastian-Marian Zaharia, Camil Lancea, George Razvan Buican, Ionut Stelian Pascariu, and Valentin-Marian Stamate. 2022. "Infill Density Influence on Mechanical and Thermal Properties of Short Carbon Fiber-Reinforced Polyamide Composites Manufactured by FFF Process" Materials 15, no. 10: 3706. https://doi.org/10.3390/ma15103706