1. Introduction
Developments in concrete technology nowadays allow the application of concrete compositions with ever-higher compressive strengths, which enable the construction of more filigree and slender structures. These structures are exposed to a higher extent to fatigue-relevant loads compared to massive structures due to their lower ratio of deadweight to non-static loads. For those structures, the fatigue resistance of the concrete becomes decisive for the design. At the same time, there has been a great demand in recent decades for types of structures for which fatigue-related stresses are characteristic, such as wind turbines or slender bridges made of high-strength or ultra-high-strength concrete. Thus, the research in recent decades has been more focused on the fatigue behaviour of concretes, e.g., [
1,
2,
3,
4].
The compressive fatigue resistance of plain concrete is described by the number of cycles to failure that the concrete can bear at a specified stress level [
5] and expressed as so-called S/N-curves in standards and guidelines, e.g., [
6,
7]. For many decades, the influence of the concrete’s compressive strength on the fatigue resistance has been discussed in the literature, with controversial results and a consensus is still lacking. It should be mentioned that due to the typical scatter of fatigue test results and the resulting number of retry tests, the number of influences or, rather, variations of parameters in a special investigation is generally limited. Concurrently, the comparability between results of different investigations is often limited because of different fatigue loadings investigated and boundary conditions. With respect to the influence of compressive strength, the investigations in [
8,
9] showed that high-strength concretes resist lower numbers of cycles to failure than concrete compositions with lower compressive strengths. On the contrary, other investigations showed that the compressive strength has no influence on the fatigue resistance or that it is negligible [
1,
10,
11]. In [
12], even higher numbers of cycles to failure were determined for the higher strength concrete included. Overall, fewer investigations are documented in which concretes with different compressive strengths were investigated comparatively. As ultra-high-strength concretes came up recently, there are only a few fatigue investigations on plain ultra-high-strength concretes documented in the literature up to now [
12,
13,
14].
However, comparatively little research has been focussed on the concrete’s fatigue behaviour, especially on that of ultra-high-strength concrete, described by damage indicators, such as, e.g., the development of strain and stiffness in order to obtain more knowledge concerning the underlying damage mechanisms [
1,
2,
3,
15,
16,
17]. The developments of strain at the maximum and minimum peak stresses under compressive fatigue loading show typical s-shaped curves (
Figure 1). For normal-strength concretes, the transitions from phase I to II and from II to III are located at about 5 to 20% and 80 to 95%, respectively, of the relative number of cycles to failure
N/Nf [
1,
3,
4,
18,
19,
20,
21,
22]. For high-strength concretes (HPC) and ultra-high-strength concretes (UHPC), phase I and III are generally shorter and less pronounced [
8,
11,
13,
23].
The stiffness of concrete within the fatigue process is usually described by the secant modulus in the decreasing branch of the hysteresis loop [
15,
19,
22,
24]. Similar to the developments of strain, the development of stiffness per load cycle shows an s-shaped curve. The evaluation of the results documented in the literature indicates that the reduction of stiffness until fatigue failure is lower for concretes with higher compressive strengths [
16,
19]. A comparison of the gradient of stiffness in phase II with respect to the numbers of cycles to failure
Nf in a double-logarithmic scale was conducted in [
23], based on our own results and those documented in the literature [
13,
15,
25] to evaluate possible differences between concretes with different concrete strengths. Here, differences were partially determined, but could not be clearly assigned to the influence of concrete strength due to possible influences of different testing laboratories.
Overall, there is still a lack of knowledge concerning possible differences of the fatigue resistance and fatigue behaviour of high-strength and ultra-high-strength concrete, which leads to uncertainties concerning their treatment in the fatigue design rules. As a result, the currently valid design rules for compressive fatigue loading in the standards and guidelines, such as Eurocode 2 [
7] or Model Code 2010 [
6], consider concretes to be more sensitive to fatigue loading with increasing compressive strength [
26,
27,
28]. Therefore, a strength-dependent reduction factor is included, which reduces the applicable fatigue resistance to an extent that can lead to an uneconomic usage of those concretes and even to a hindrance of the realisation of innovative concrete constructions.
Within the Priority Programme SPP 2020 ‘Cyclic Deterioration of High-Performance Concrete in an Experimental-Virtual Lab’, the fatigue behaviour and damage mechanisms of high-performance concretes under fatigue loading are investigated in the framework of 14 participating projects at different universities, each with a special focus in this research field. In order to ensure a certain level of comparability, one high-strength and one ultra-high-strength concrete composition are used as reference compositions in the investigations conducted by the different participating projects. Furthermore, the compressive fatigue behaviour of the reference high-strength and ultra-high-strength concrete are investigated comparatively by the so-called ‘central project’ for the purpose of a basic characterisation to be used as a reference in the different research projects.
In this paper, the results of investigations in the compressive fatigue behaviour of the reference high-strength and ultra-high-strength concretes are presented comparatively. The numbers of cycles to failure and the damage indicators strain and stiffness are analysed with respect to the influence of the compressive strength. The fatigue investigations were carried out at two test laboratories in the framework of the SPP 2020 in order to superiorly evaluate the validity of the concrete-related differences identified in the number of cycles to failure and damage indicators.
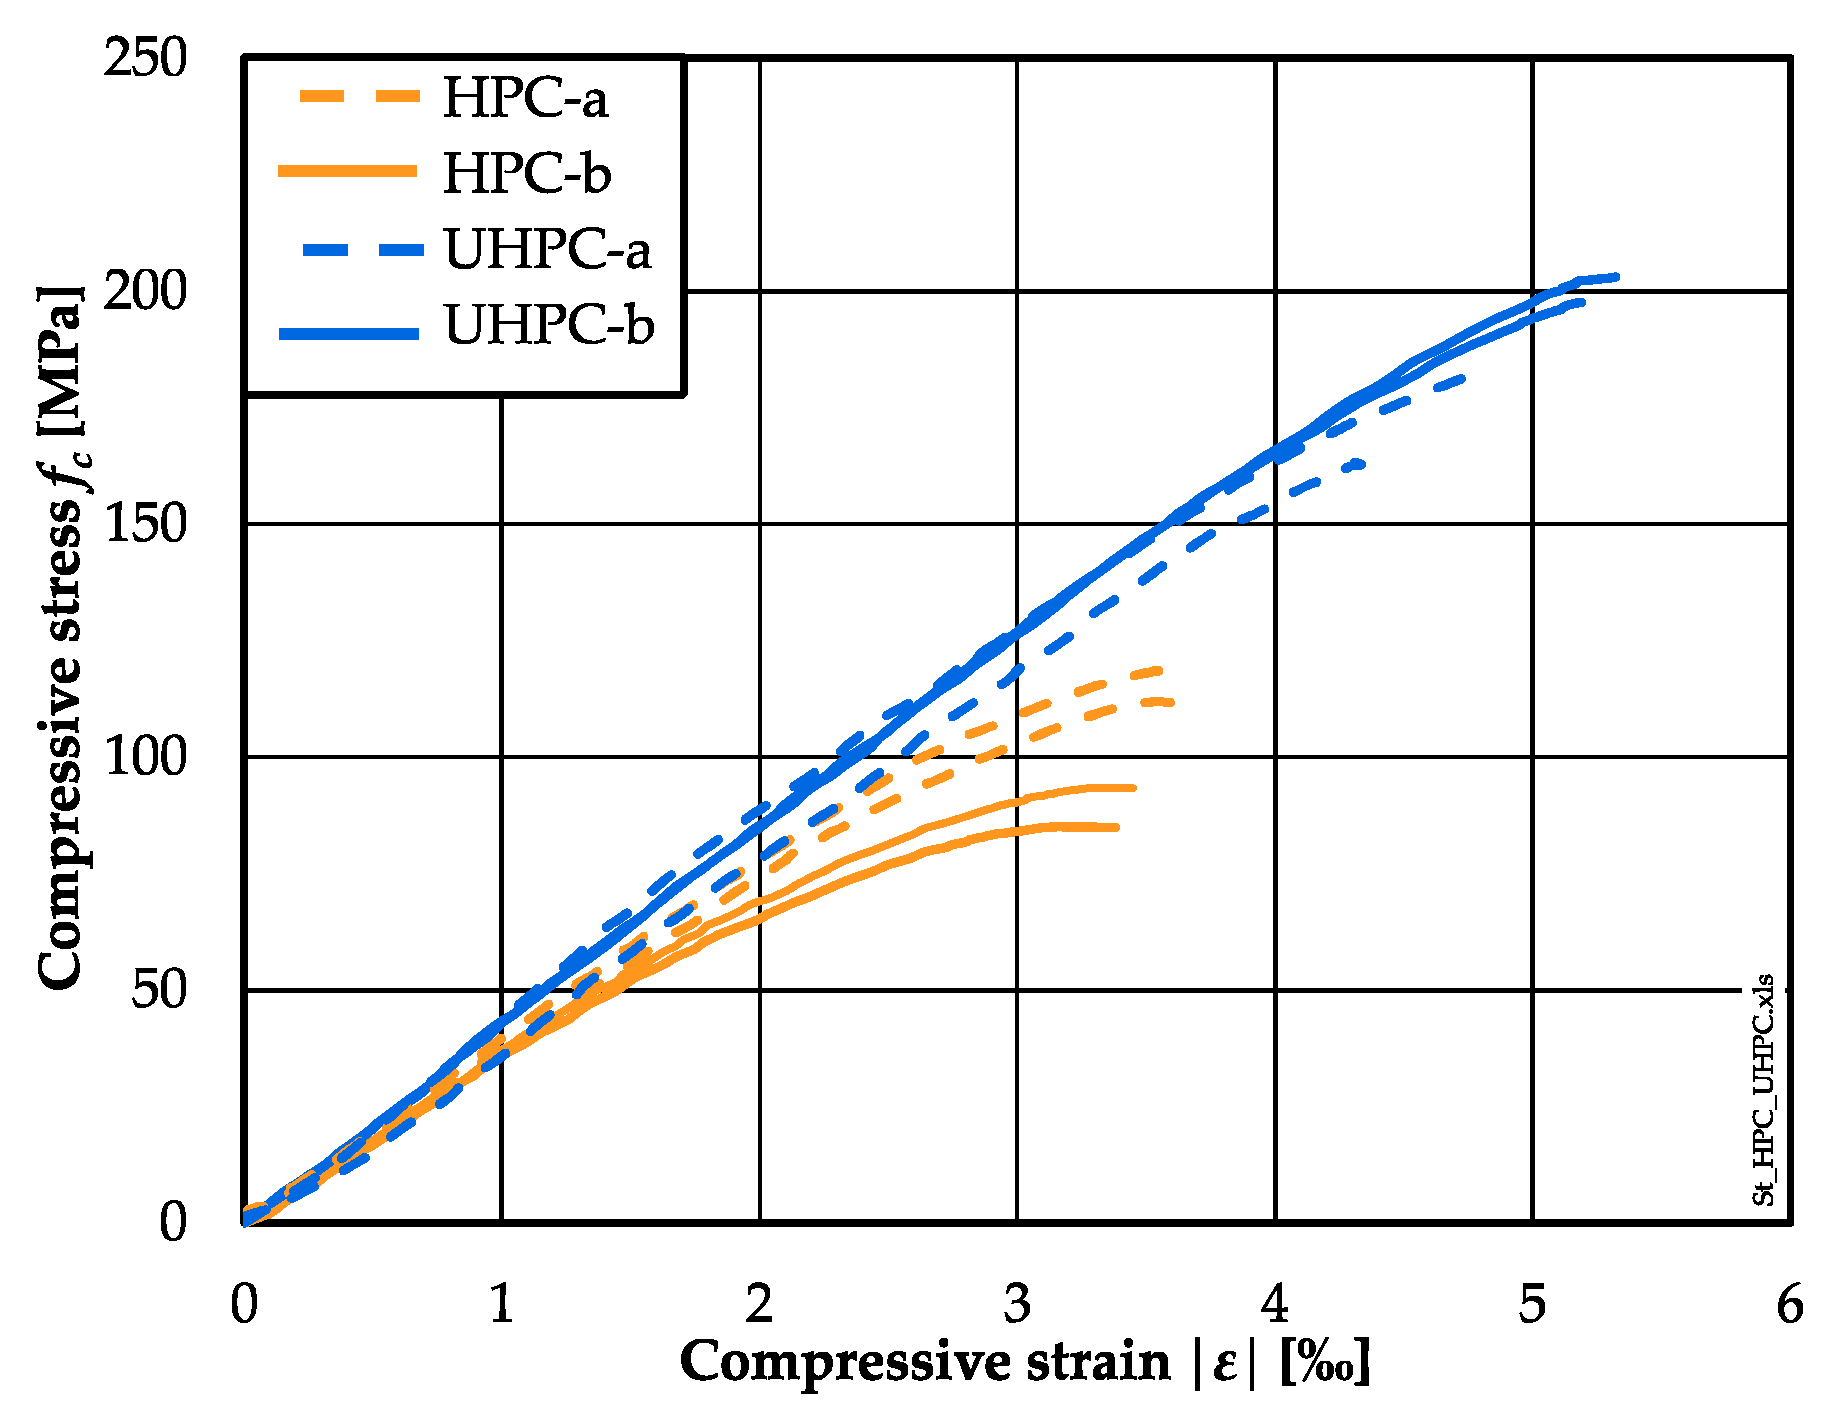
However, since the fatigue behaviour of concrete cannot be considered detached from its behaviour under monotonically increasing loading, it is also presented and the fatigue behaviour is discussed considering the ’static’ material’s behaviour. The overall objective of the investigations presented here is to contribute to the decrease in the lack of knowledge and the previously described discussion in the literature concerning the influence of the compressive strength of concretes on their fatigue resistance.
2. Materials and Methods
2.1. Concrete Composition
The investigations were conducted on one high-strength concrete and one ultra-high-strength concrete, which are the reference concretes within the SPP 2020. The UHPC composition was developed based on the M3Q composition previously used in the SPP 1182 [
29]. The composition of both reference concretes are given in
Table 1.
The grain size distributions of the quartz sand, sand and basalt aggregate are shown in
Figure A1. The physical properties and the grain size distribution of the cement and the fine aggregates are shown in
Table A1. The chemical properties of the cement are given in
Table A2. Both superplasticisers used are on a PCE basis, while the stabiliser used modifies the viscosity.
As a complimentary investigation, the 28-day compressive strengths for the different batches produced were determined continuously by seven laboratories participating in the SPP 2020 since the start of the SPP 2020 in 2017. The tests of the cubic specimens were carried out in accordance with the guidelines given in DIN EN 12390-3:2019 [
30]. The results were saved in a central database and a statistical analysis was performed. The edge length of the cubic specimens was either 100 or 150 mm. The storage conditions were either under water until testing according to DIN EN 12390-2:2009 [
31] (marked as ‘wet’) or in standard climate conditions (20 °C/65% R.H.; marked as ‘dry’), due to the adaption of the lasted update to DIN EN 12390-2:2019 [
32]. The number of results for each specimen size and loading condition are listed in
Table A3 in the
Appendix A. Due to the different sizes and storage conditions, a conversion of compressive strength according to DIN 1045-2:2008 [
33] was taken into consideration. However, a general applicability of given conversion factors is questionable and, furthermore, they are not necessarily applicable for UHPC. Therefore, it was decided to consider the compressive strengths without conversion.
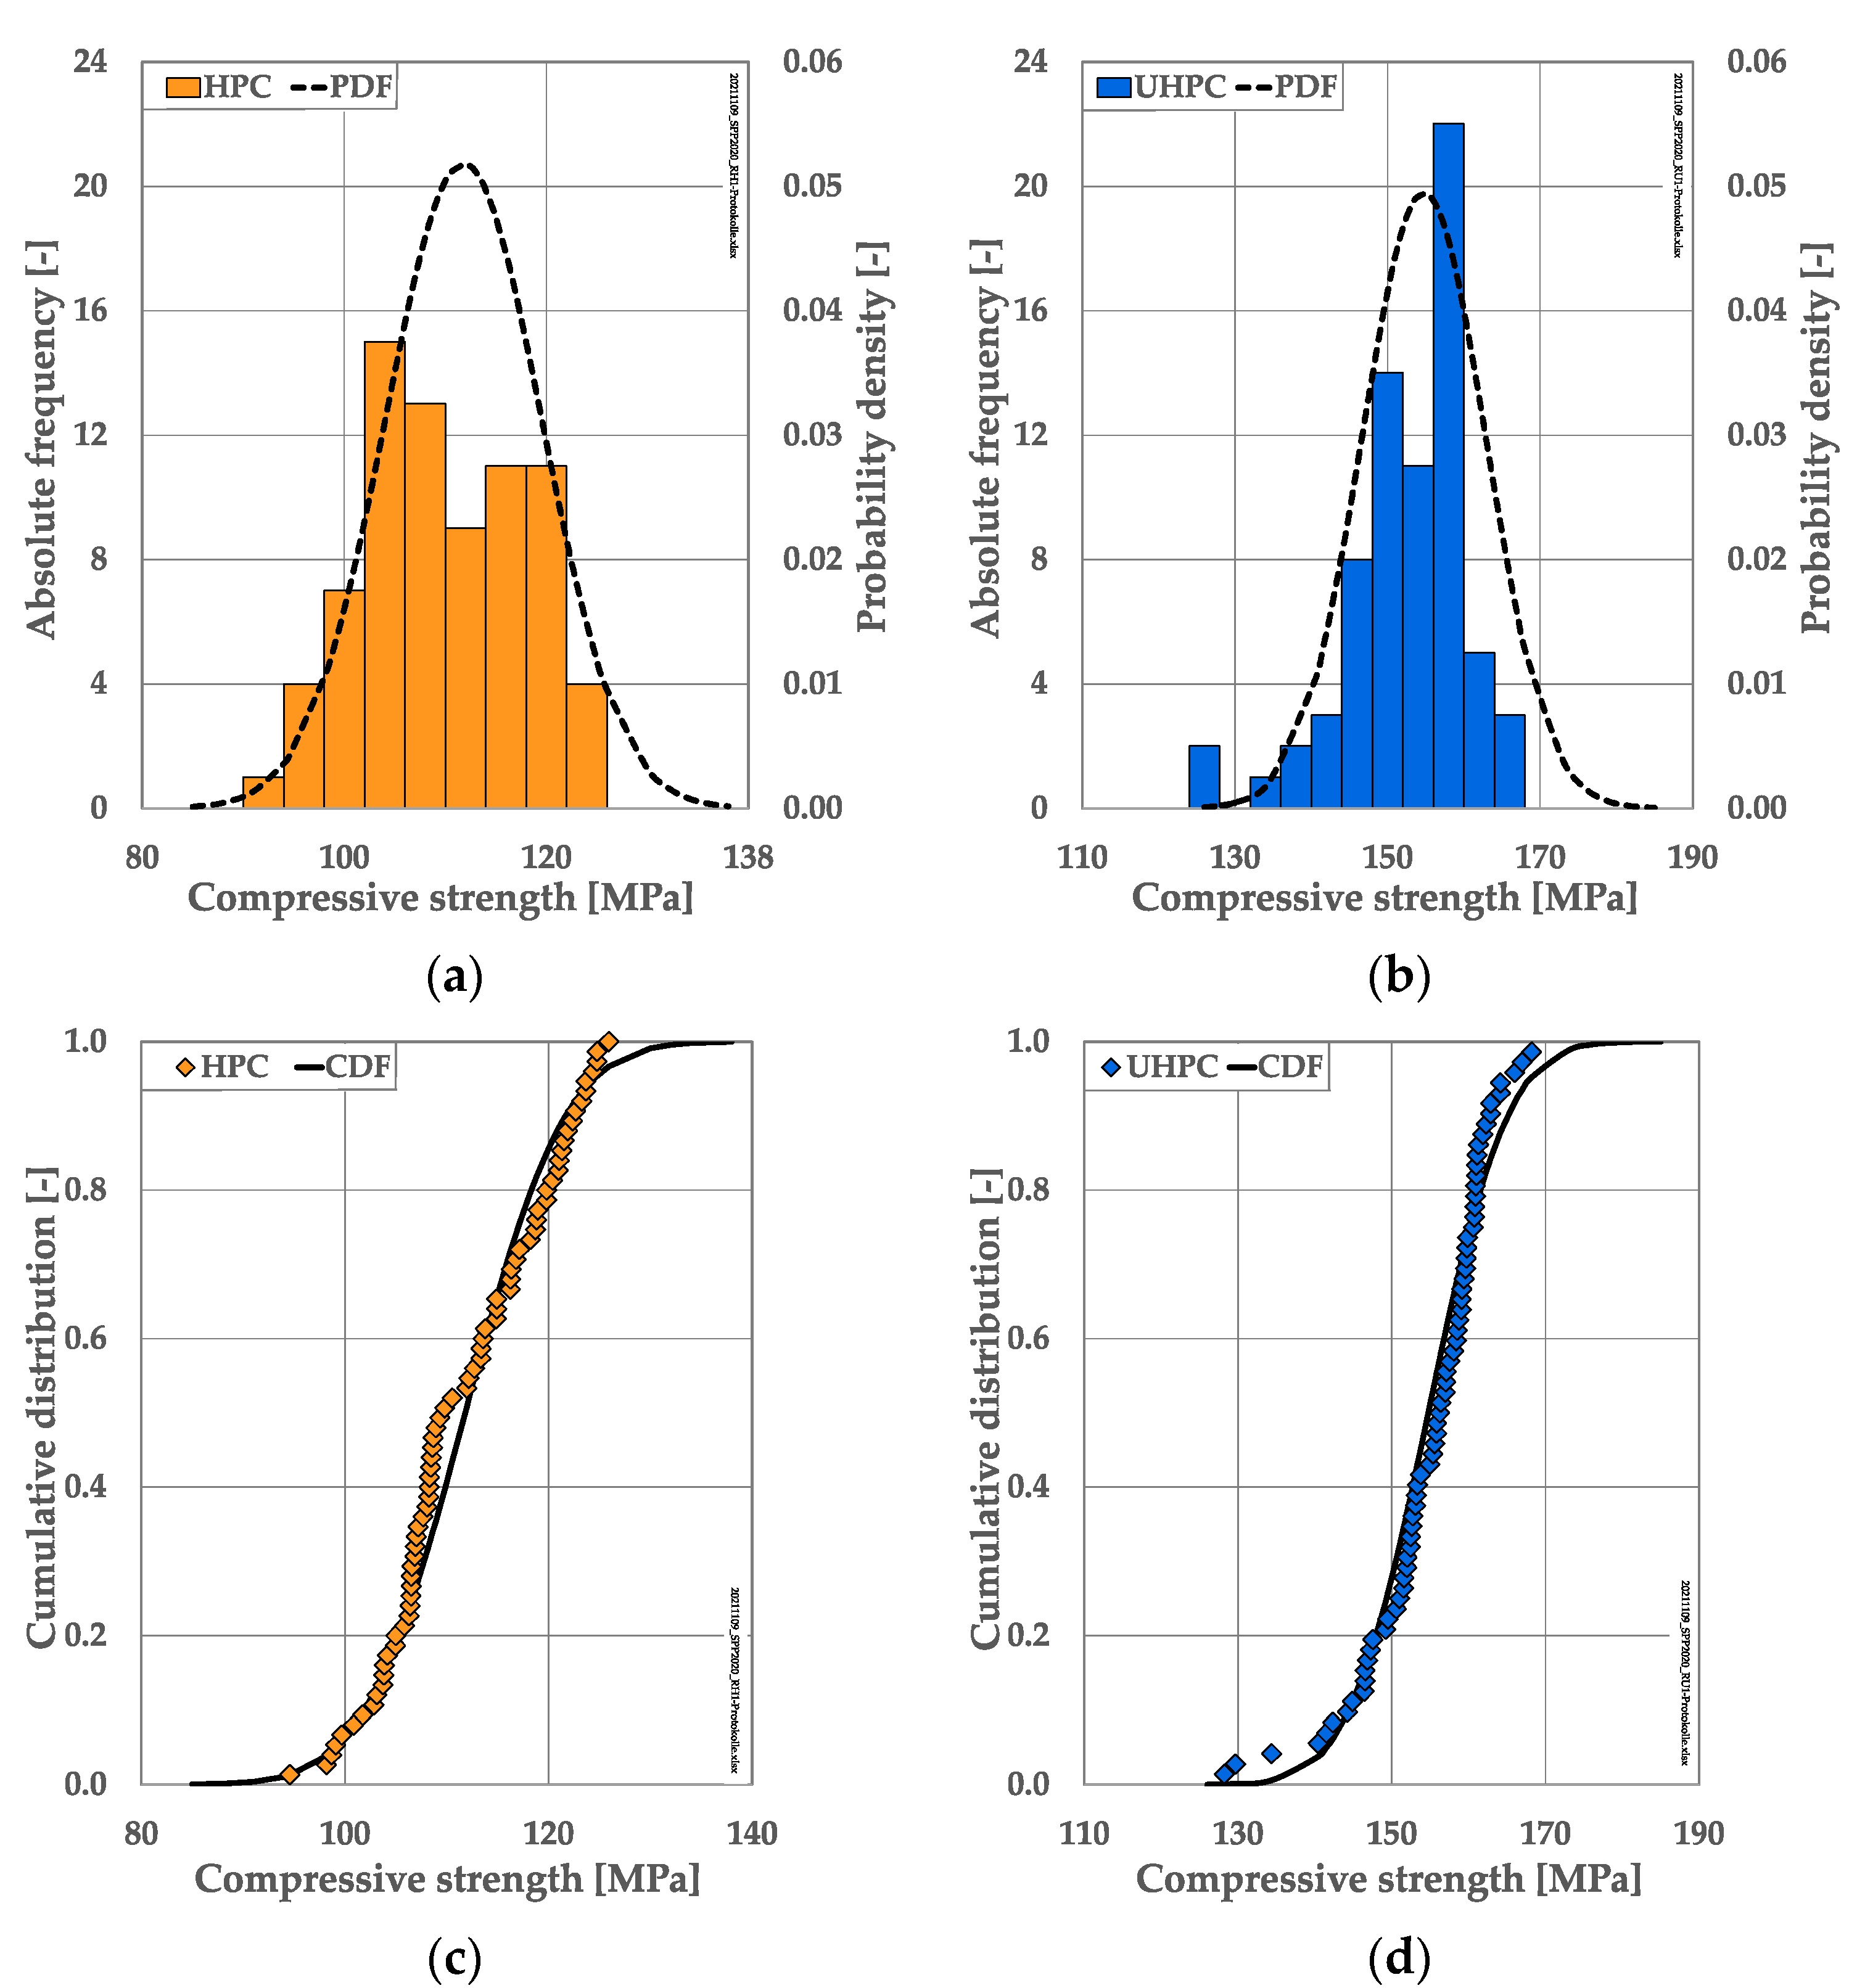
The frequency distribution and cumulative distribution of the compressive strength are shown in
Figure A2 in the
Appendix A. The compressive strength is approximately normally distributed for both concretes. The characteristic concrete compressive strength was calculated (Equation (1)) as 5%-fractile, in accordance with DIN EN 1990 [
34].
where
fck is the characteristic compressive strength,
fcm is the mean compressive strength,
kn is the 5%-fractile factor according to [
34] and
σx is the standard deviation. The mean compressive strength with its standard deviation and the characteristic compressive strength calculated are shown in
Table 2 for both concrete types.
Based on this analysis, the HPC was classified as C80/95 according to DIN EN 206:2021 [
35] and the UHPC as C130/140 according to the draft of the DAfStb guideline [
36]. It is possible that these classifications could be changed due to the inclusion of future results determined in the ongoing SPP 2020. It should be noted that the conversion of the compressive strengths according to [
33] would not have led to different concrete strength classifications.
2.2. Specimens for the Fatigue Investigations
For the fatigue investigations, cylindrical specimens were prepared with a final height of h = 180 mm and a diameter of d = 60 mm. The HPC specimens were produced at the Institute of Building Materials Science, Leibniz University Hannover (IfB) and those of the UHPC were produced at the Institute of Concrete Structures, Technical University of Dresden (IMB). Two batches (HPC-a, HPC-b, respectively, UHPC-a, UHPC-b) were produced for each concrete. The production at those two laboratories was scheduled considering the expertise in the production of the respective concretes and the availability of the components of the concrete composition.
All specimens were cast in cylindrical formworks with a height of about 250 mm, compacted using a vibrating table. The formwork was removed after 48 h and the specimens were stored under standard climate conditions (20 °C/65% R.H.) until testing. The specimens were prepared by sawing a few centimetres off the top and bottom to remove areas where the concrete may have been disturbed due to the production process. Additionally, the test surfaces of the specimens were ground parallel and polished to achieve a uniform stress distribution. The final height of the specimens ready to be tested was
h = 180 mm. The test specimens were sent in shockproof boxes [
37] to the testing laboratories.
2.3. Fatigue Test Programme and Experimental Set-Up
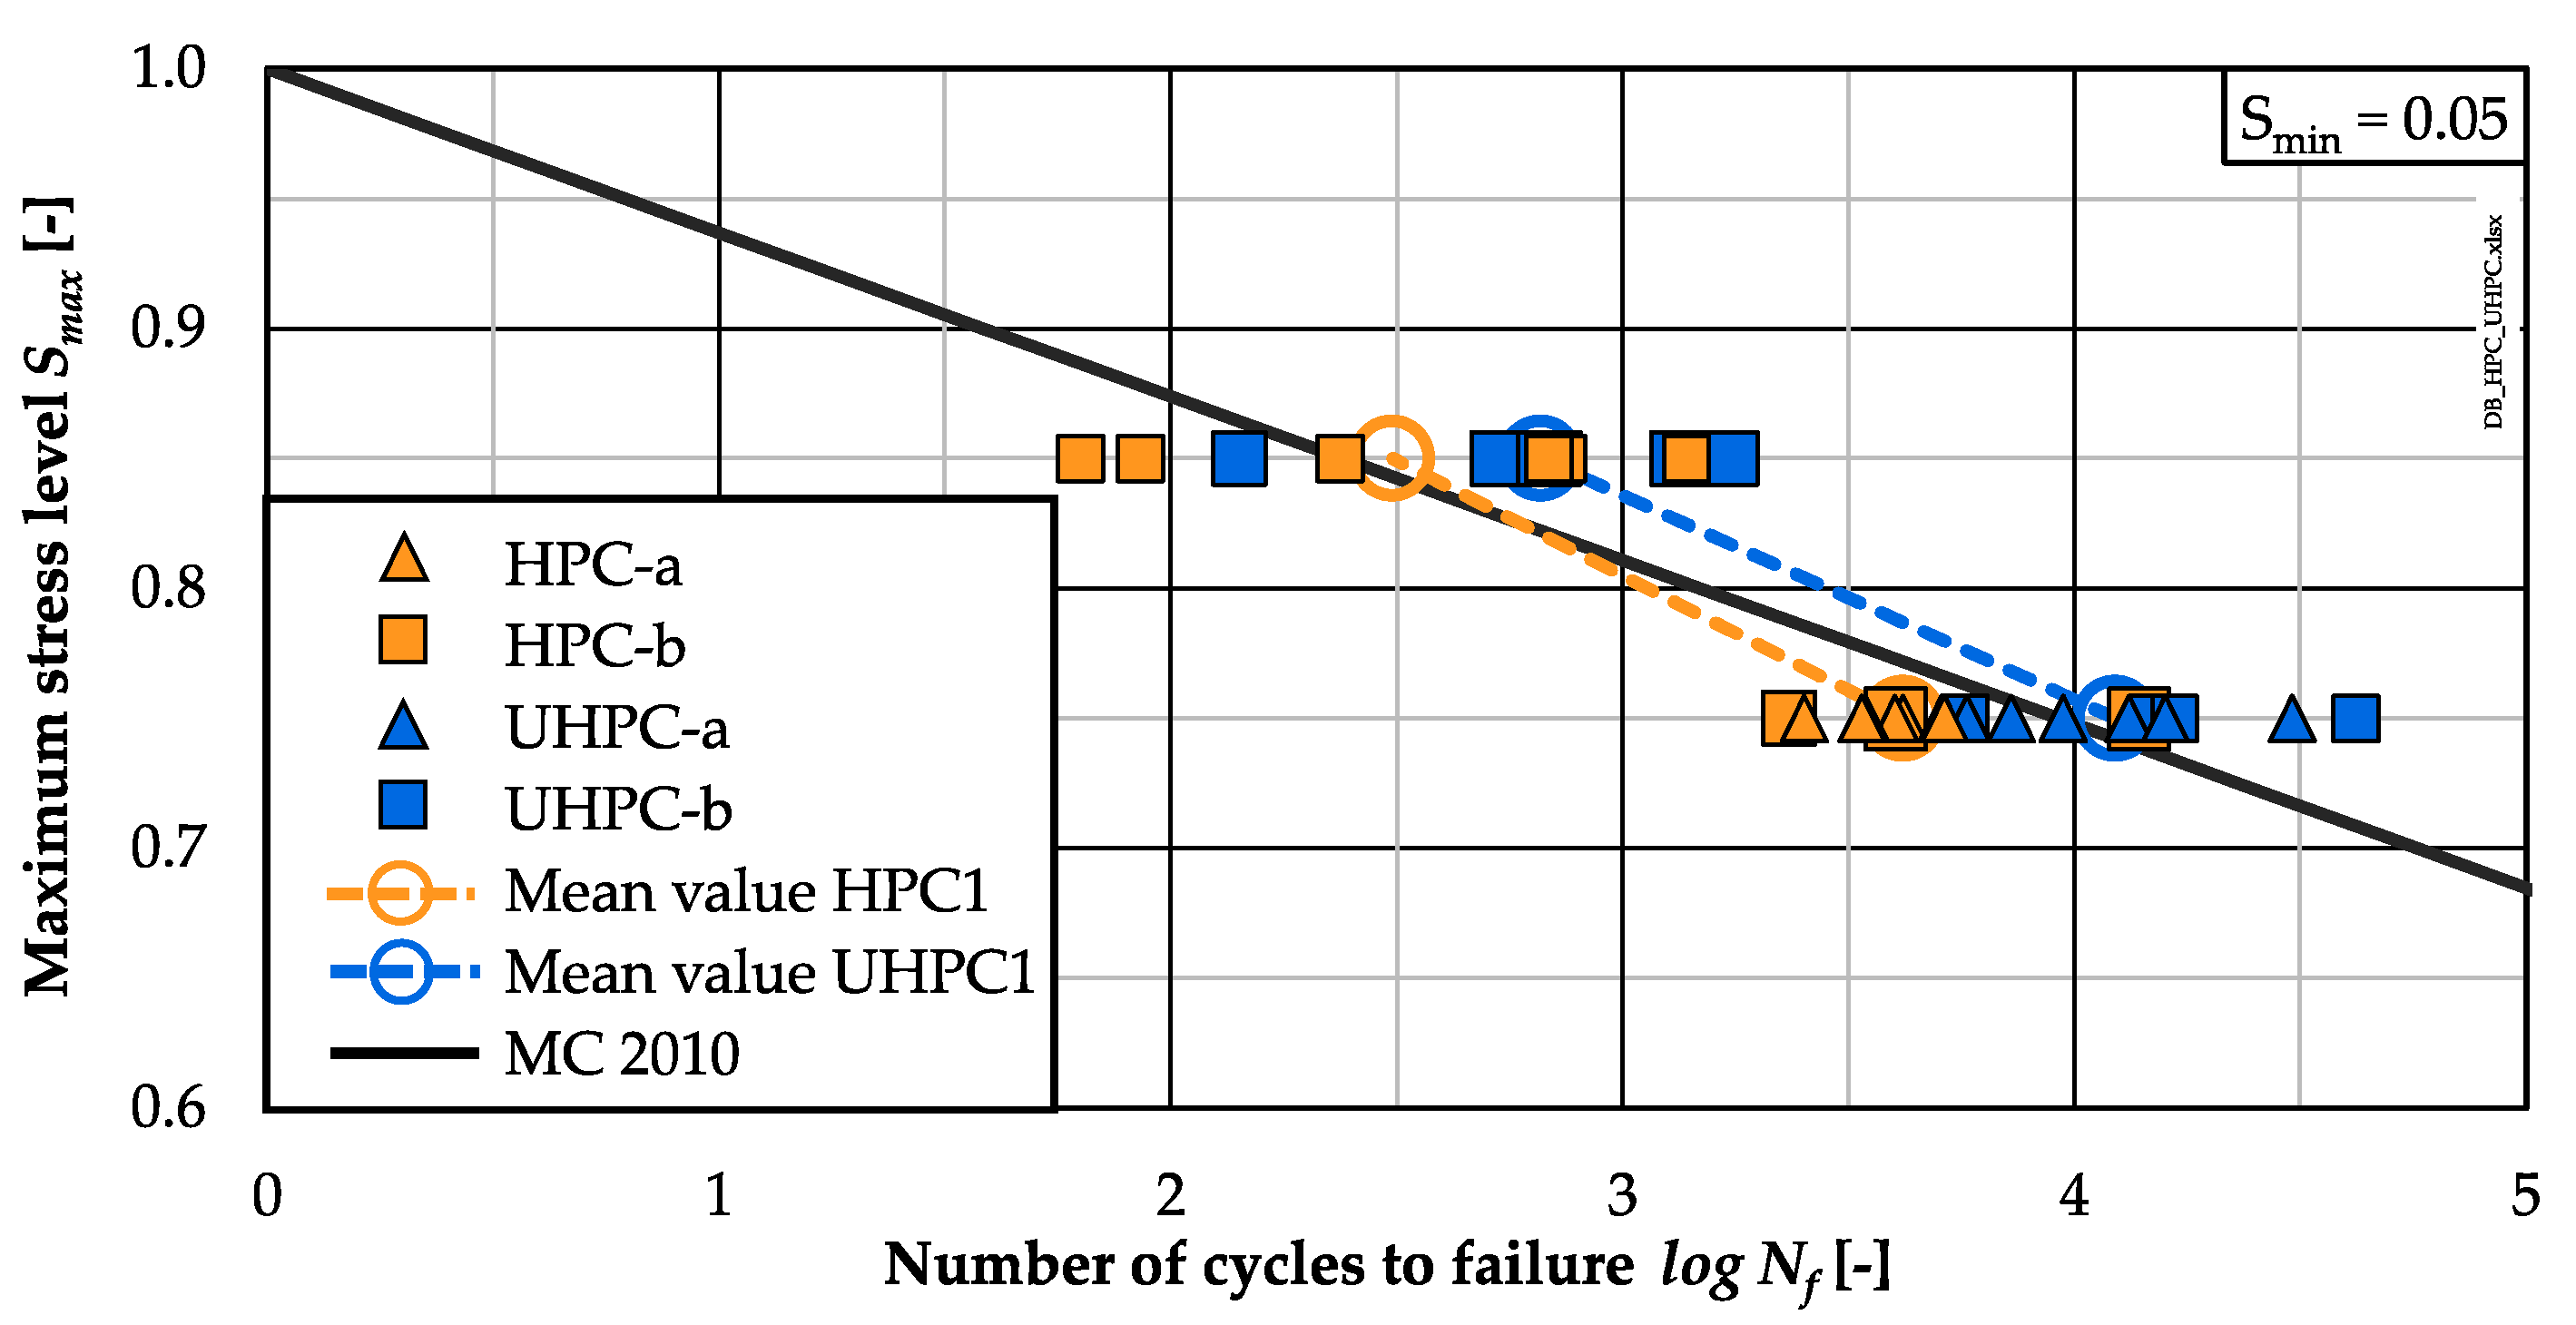
The fatigue tests on both concretes were conducted under uniaxial compressive cyclic loading with constant maximum and minimum stress levels for each test. The minimum stress level was
Smin = 0.05 for all fatigue tests. The maximum stress levels were
Smax = 0.85 and
Smax = 0.75. The load frequency applied was
ft = 1.0 Hz in all tests. The fatigue tests at
Smax = 0.75 were conducted at the IfB, while the fatigue tests at
Smax = 0.85 were conducted at the Materials Testing Institute, University Stuttgart (MPA). This procedure was chosen to achieve a comparability of the results between HPC and UHPC for each stress level (no influence of laboratory). Investigations at
Smax = 0.75 were additionally carried out at the MPA to investigate the stress level effect without laboratory influence. The number of fatigue tests conducted at each laboratory is summarised in
Table 3, regarding concrete type, batch and stress level. The fatigue tests at the IfB were conducted at a specimen age between 79 and 97 days, whereas those at the MPA were conducted at a specimen age between 213 and 249 days, due to delays in the test scheduling.
The fatigue reference compressive strengths fcm,ref of the concrete specimens were tested just before conducting the fatigue investigations, using at least five specimens from the same batch and having the same geometry of the specimens used in the fatigue investigations (cylinder d/h = 60/180 mm). The tests were conducted force-controlled with a stress velocity of 0.5 MPa/s, using the same testing machine as for the fatigue tests. The resulting mean compressive strength of each concrete and batch was used as fatigue reference compressive strength fcm,ref for the fatigue tests to determine the compressive fatigue stresses required based on the stress level investigated (Smin = σmin/fcm,ref; Smax = σmax/fcm,ref).
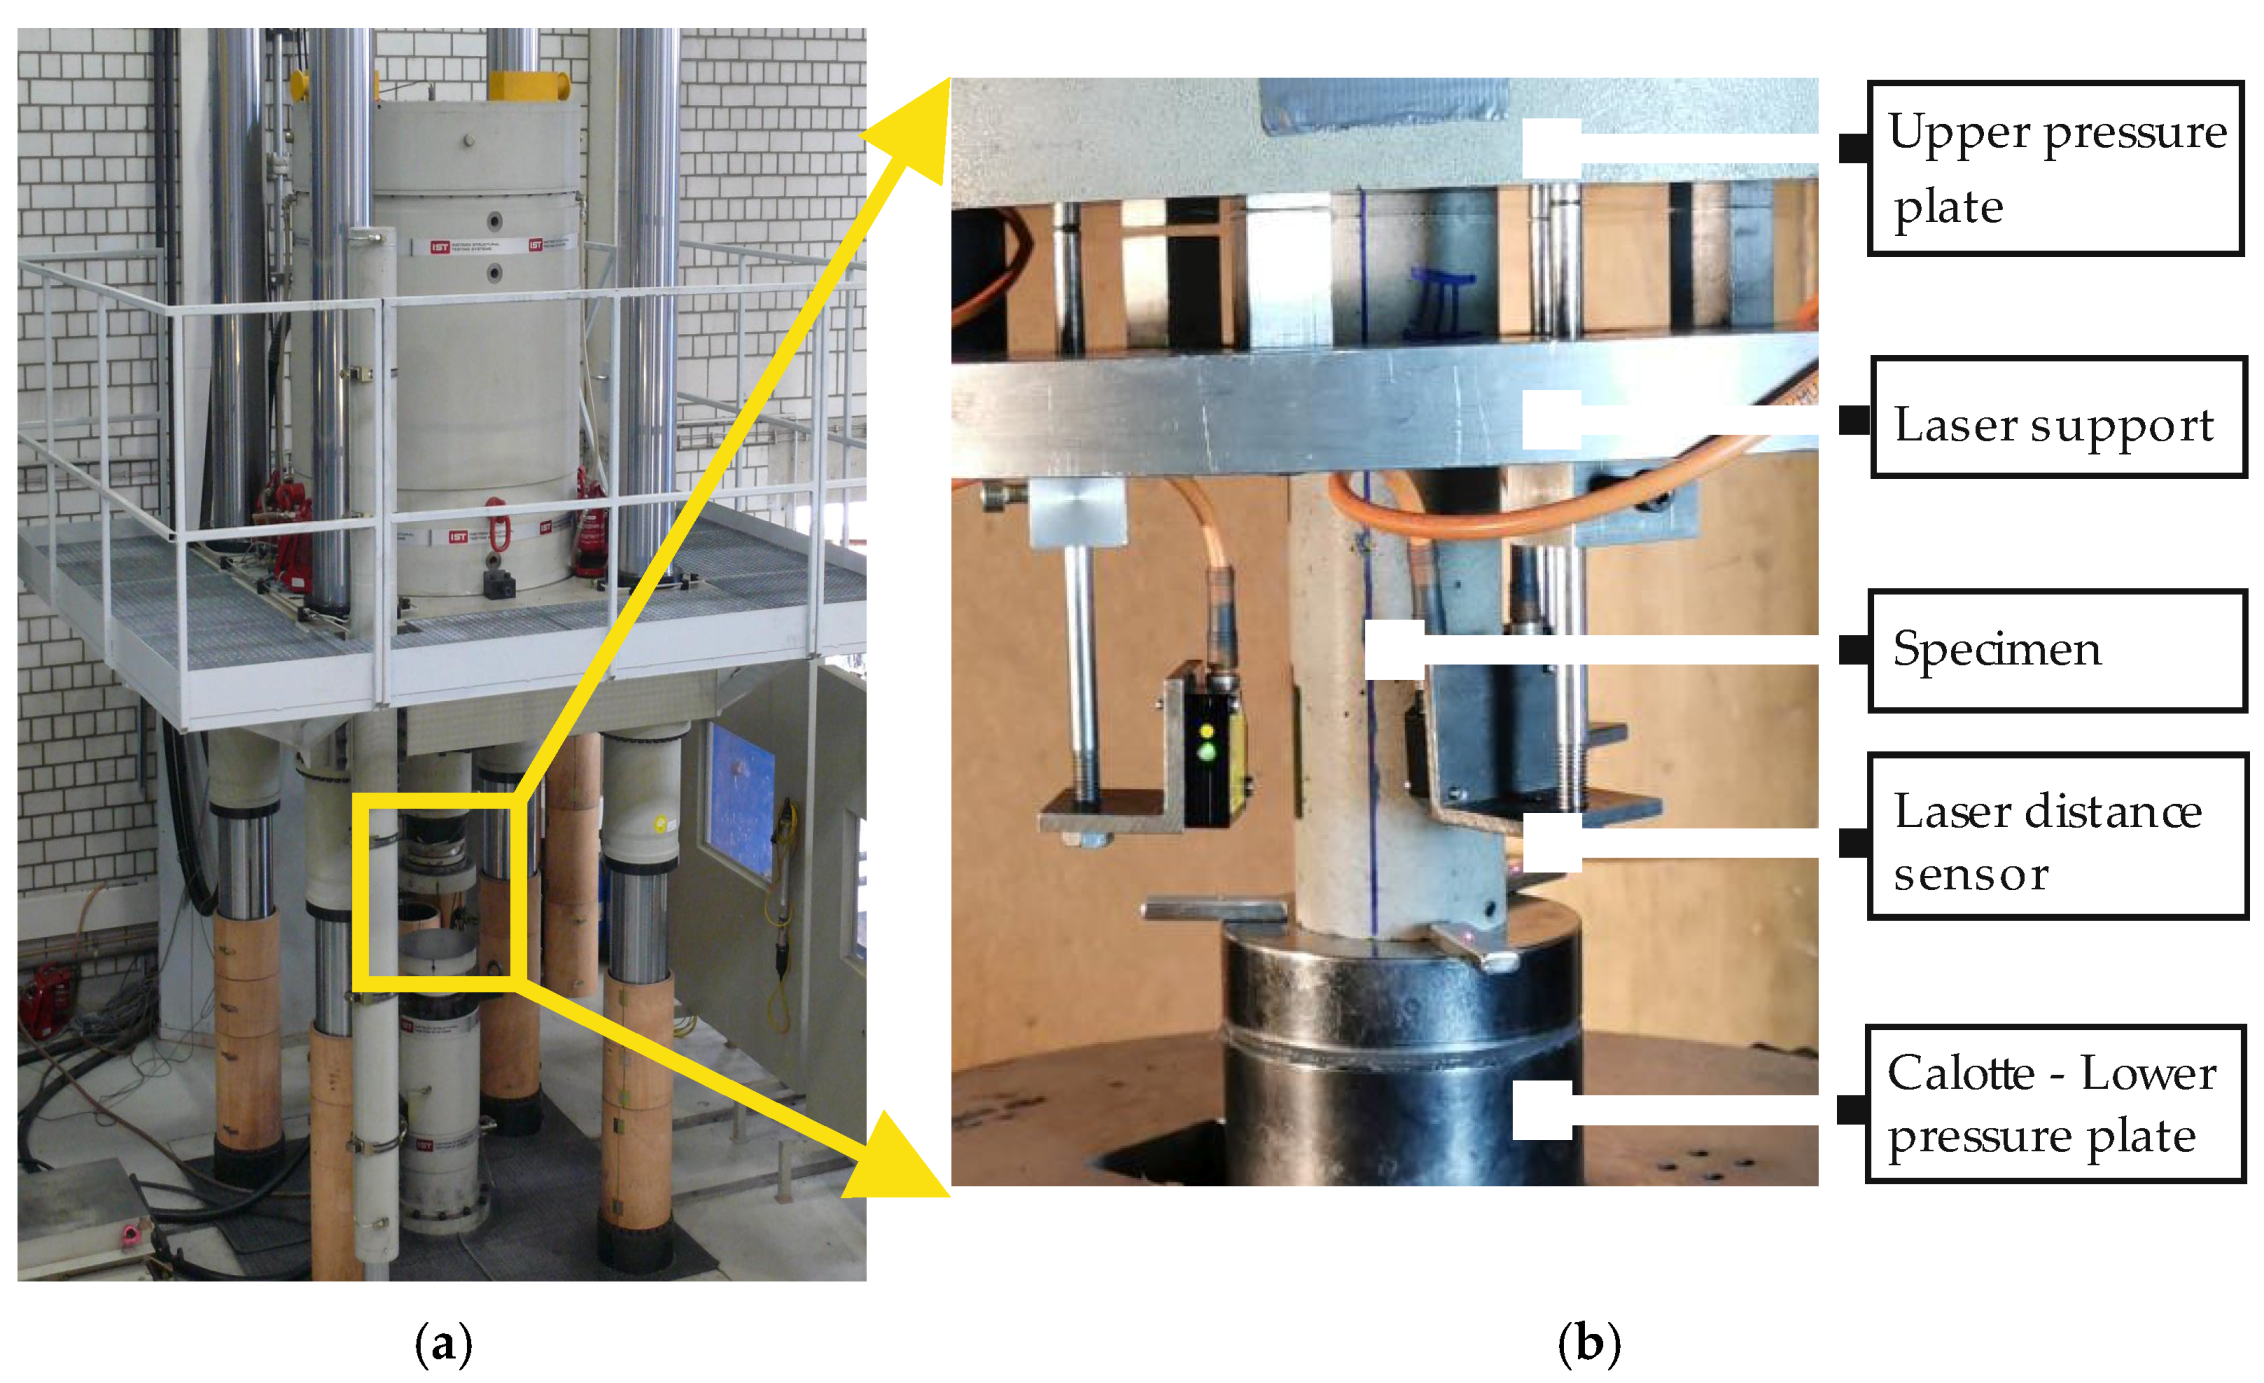
The fatigue tests were carried out using servo-hydraulic testing machines with 1 MN actuators, exemplarily shown in
Figure 2a. The axial deformations were measured continuously in all tests using three laser distance sensors positioned on the circumference of the specimen at 0°, 120° and 240° (
Figure 2b). The axial force and the displacement of the actuator were also recorded. In addition, the temperature on the specimen’s surface was measured at mid-height and 1 cm above/below the upper and lower pressure plates. Furthermore, the ambient temperature in the testing chamber was recorded. The fatigue failure occurred in a rather sudden and explosive way and, thus, crack pattern could not be analysed.
2.4. Analysis Methods
The fatigue resistance of the plain HPC and UHPC was analysed by evaluating the numbers of cycles to failure obtained from the tests. Statistical analyses were applied regarding the influence of the two batches of each concrete and the influence of the two concrete compositions on the numbers of cycles to failure.
In addition, the maximum and minimum strains at peak stresses of the sinusoidal load curve and the stiffness were analysed as damage indicators. The maximum and minimum strains were obtained from the three laser distance sensors and averaged per specimen. In the analyses of the strains, the temperature increase due to cyclic loading was considered using a thermal expansion coefficient of αT = 1.0 × 10⁻⁵ K−1. This approach is considered sufficient due to the low temperature increase observed during the tests (max. 9 K for the HPC and 13 K for the UHPC).
The total growths of maximum and minimum strain (
∆εmax0.0–1.0, ∆εmin0.0–1.0) up to failure and the gradients of strain development in phase II (
grad εmax0.2–0.8,
grad εmin0.2–0.8) were analysed as parameters (cf.
Table 4). Hereby, the gradients were determined between fixed values of
N/Nf = 0.20 and 0.80 from a linear regression analysis.
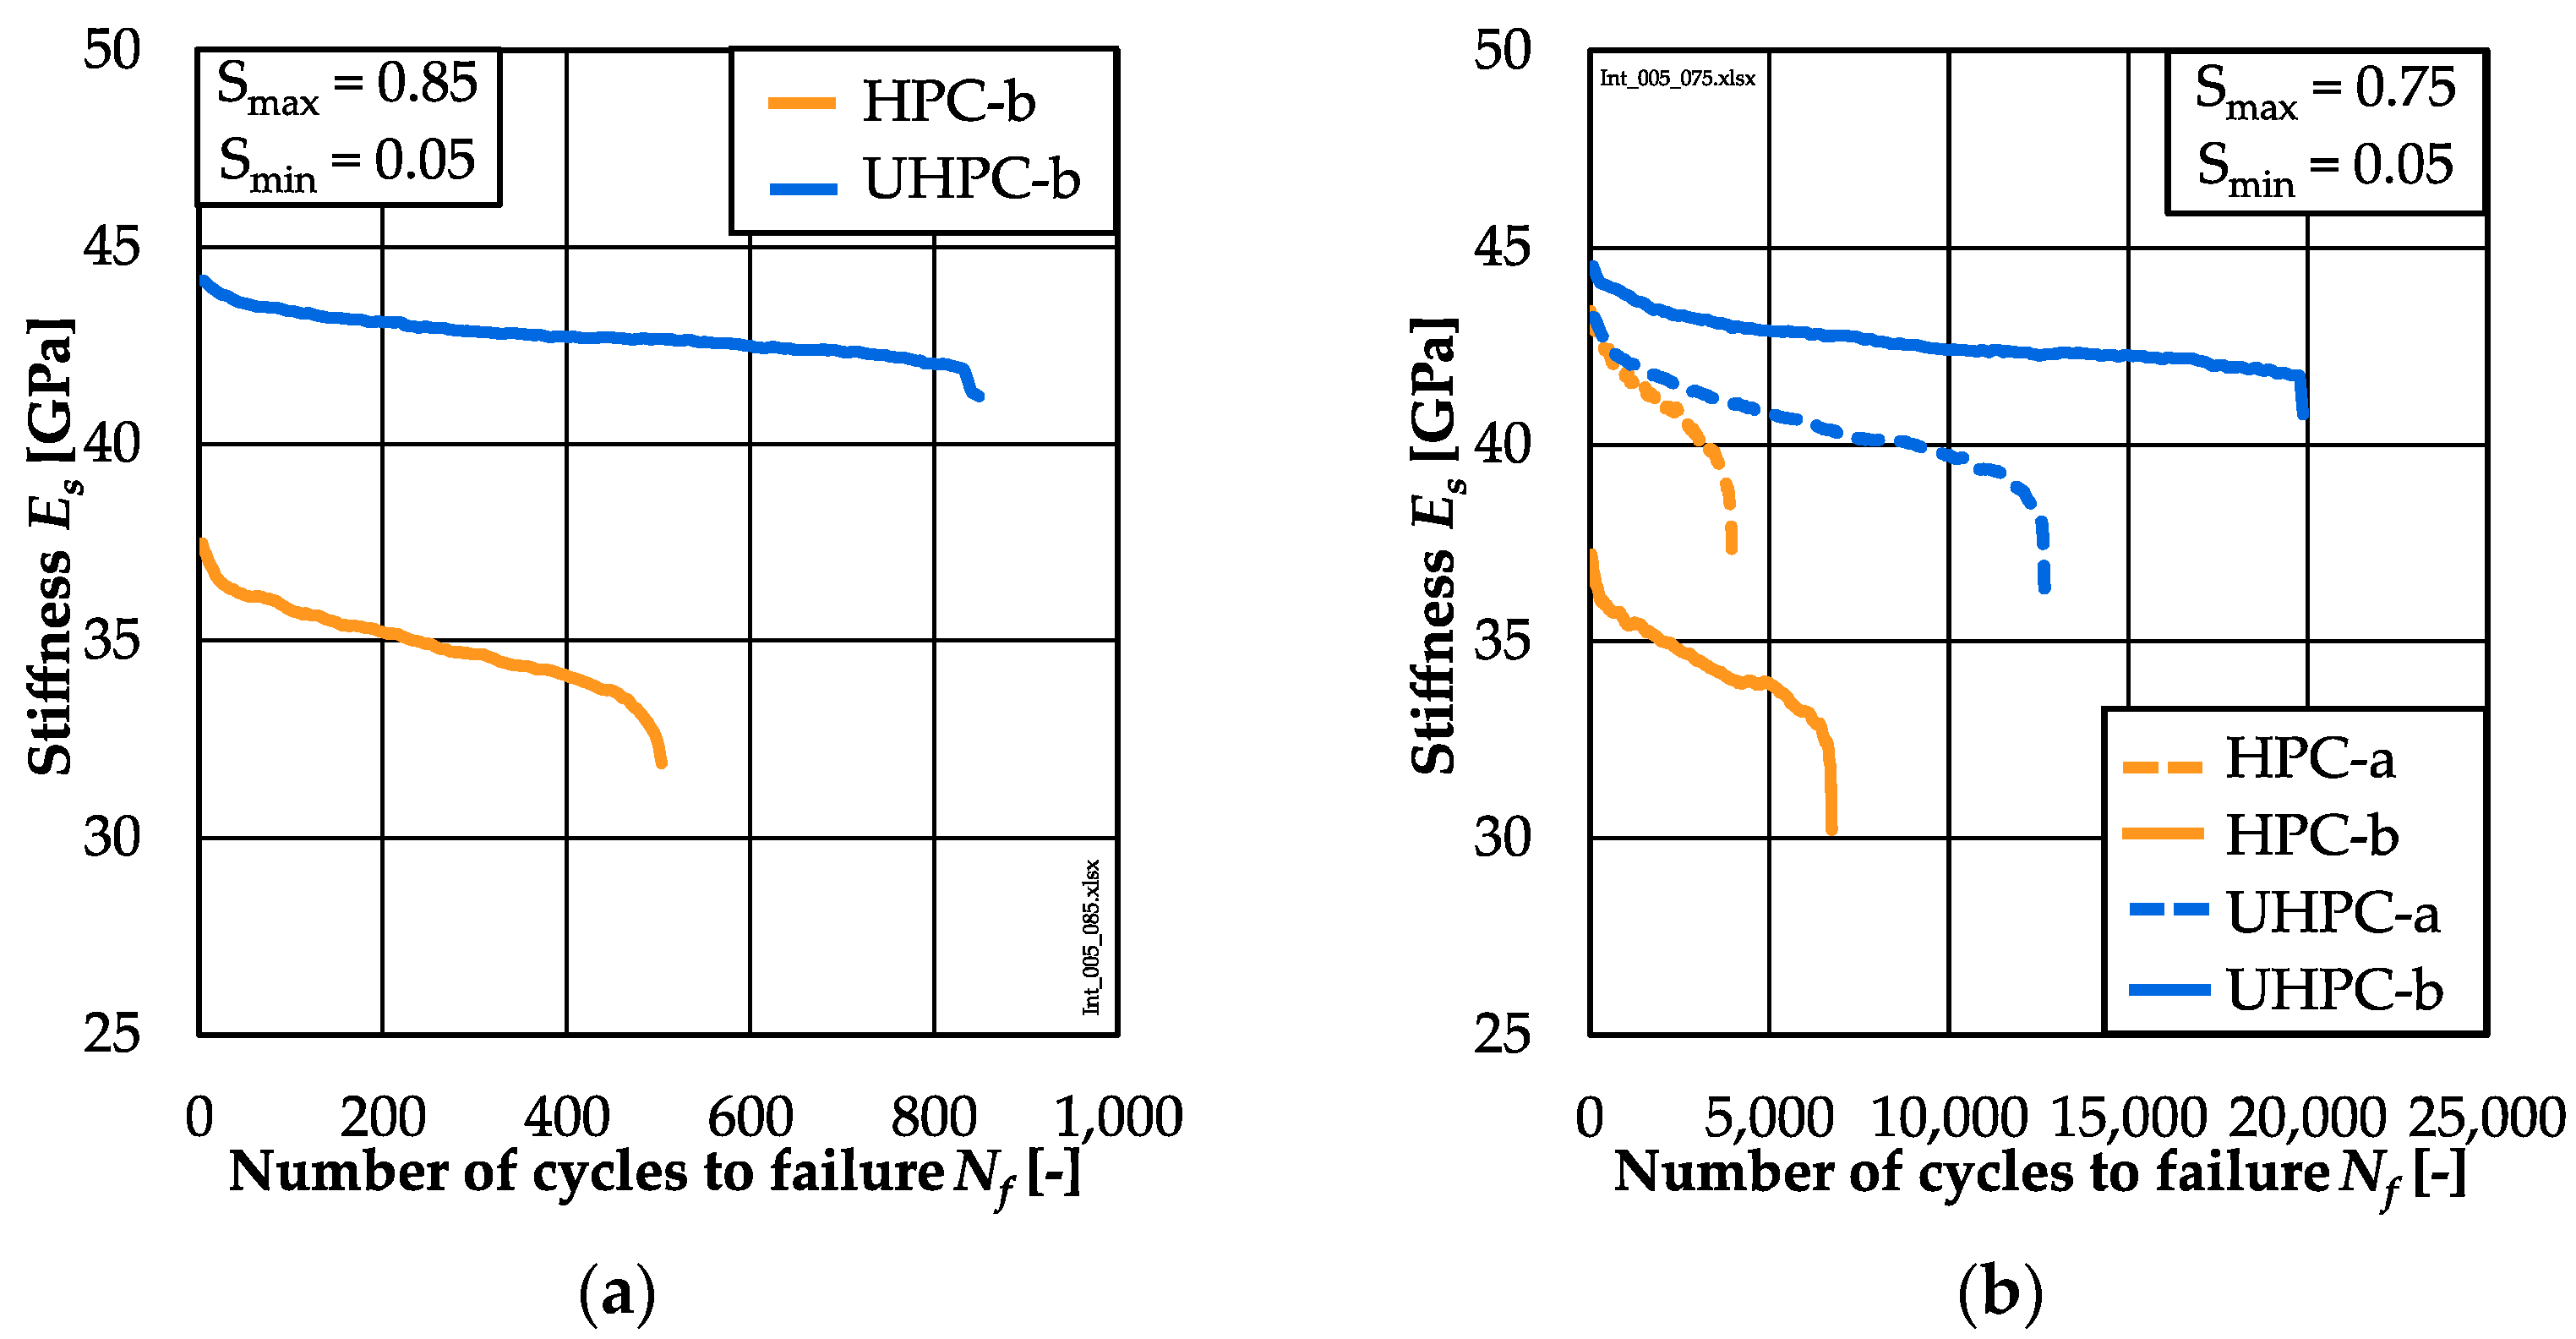
The stiffness (Es) during the cyclic loading was calculated for each cycle as the secant modulus in the decreasing branch of the hysteresis loop. The gradient of the stiffness development in phase II (grad Es0.2–0.8) was determined corresponding to the approach for the gradient of strain. The reduction of stiffness up to failure was analysed as percentile value with respect to the initial stiffness at the beginning of the fatigue loading (∆Es0.0–1.0).
The strain and stiffness developments were determined for each fatigue test, leading to a large number of individual curves. Therefore, averaged curves of the damage indicators were determined for each concrete batch and stress level for the graphical presentation. These curves were determined for identical test conditions by averaging the development of the individual damage indicator as a function of the relative number of load cycles,
N/Nf, and then multiplying this averaged curve by the mean value of the numbers of cycles to failure,
Nf. As a result of this procedure, the slopes of the curves are distorted. Hence, the depicted curves reflect the relative (higher/lower), but not the absolute relationships between the curves for the varying types of concretes investigated. Therefore, the mean values of the parameters, which were calculated based on the individual developments, are additionally given in
Table A4 (
Appendix A). They were used in the quantitative analyses.
4. Discussion
All tests were performed at two different laboratories with specimens stored and tested in the same conditions. Significant differences in the fatigue reference compressive strength
fcm,ref of both batches of each concrete were determined (cf.
Section 3.1). No significant difference concerning the mean numbers of cycles to failure of the two batches of each concrete could be determined at the lower stress level
Smax = 0.75 (cf.
Section 3.2). Thus, the usage of the fatigue reference compressive strength for the determination of the fatigue stresses based on the stress levels equalised the batch influence with respect to the numbers of cycles to failure, although the tests were conducted at different laboratories. This was achieved by determining the fatigue reference compressive strength directly before carrying out the fatigue tests and by keeping the storage and testing conditions constant.
Considering the influence of the concrete type, the mean number of cycles to failure was significantly higher for the UHPC at
Smax = 0.75 (cf.
Section 3.2). Thus, the influence of the type of concrete was not equalised by the usage of the fatigue reference compressive strength at this stress level, contrary to the batch influence. A higher mean number of cycles to failure of the UHPC was also found at the higher stress level S
max = 0.85, but the difference was not significant. Altogether, the differences in the number of cycles to failure can be reliably related to the different materials’ fatigue behaviour based on the previous considerations.
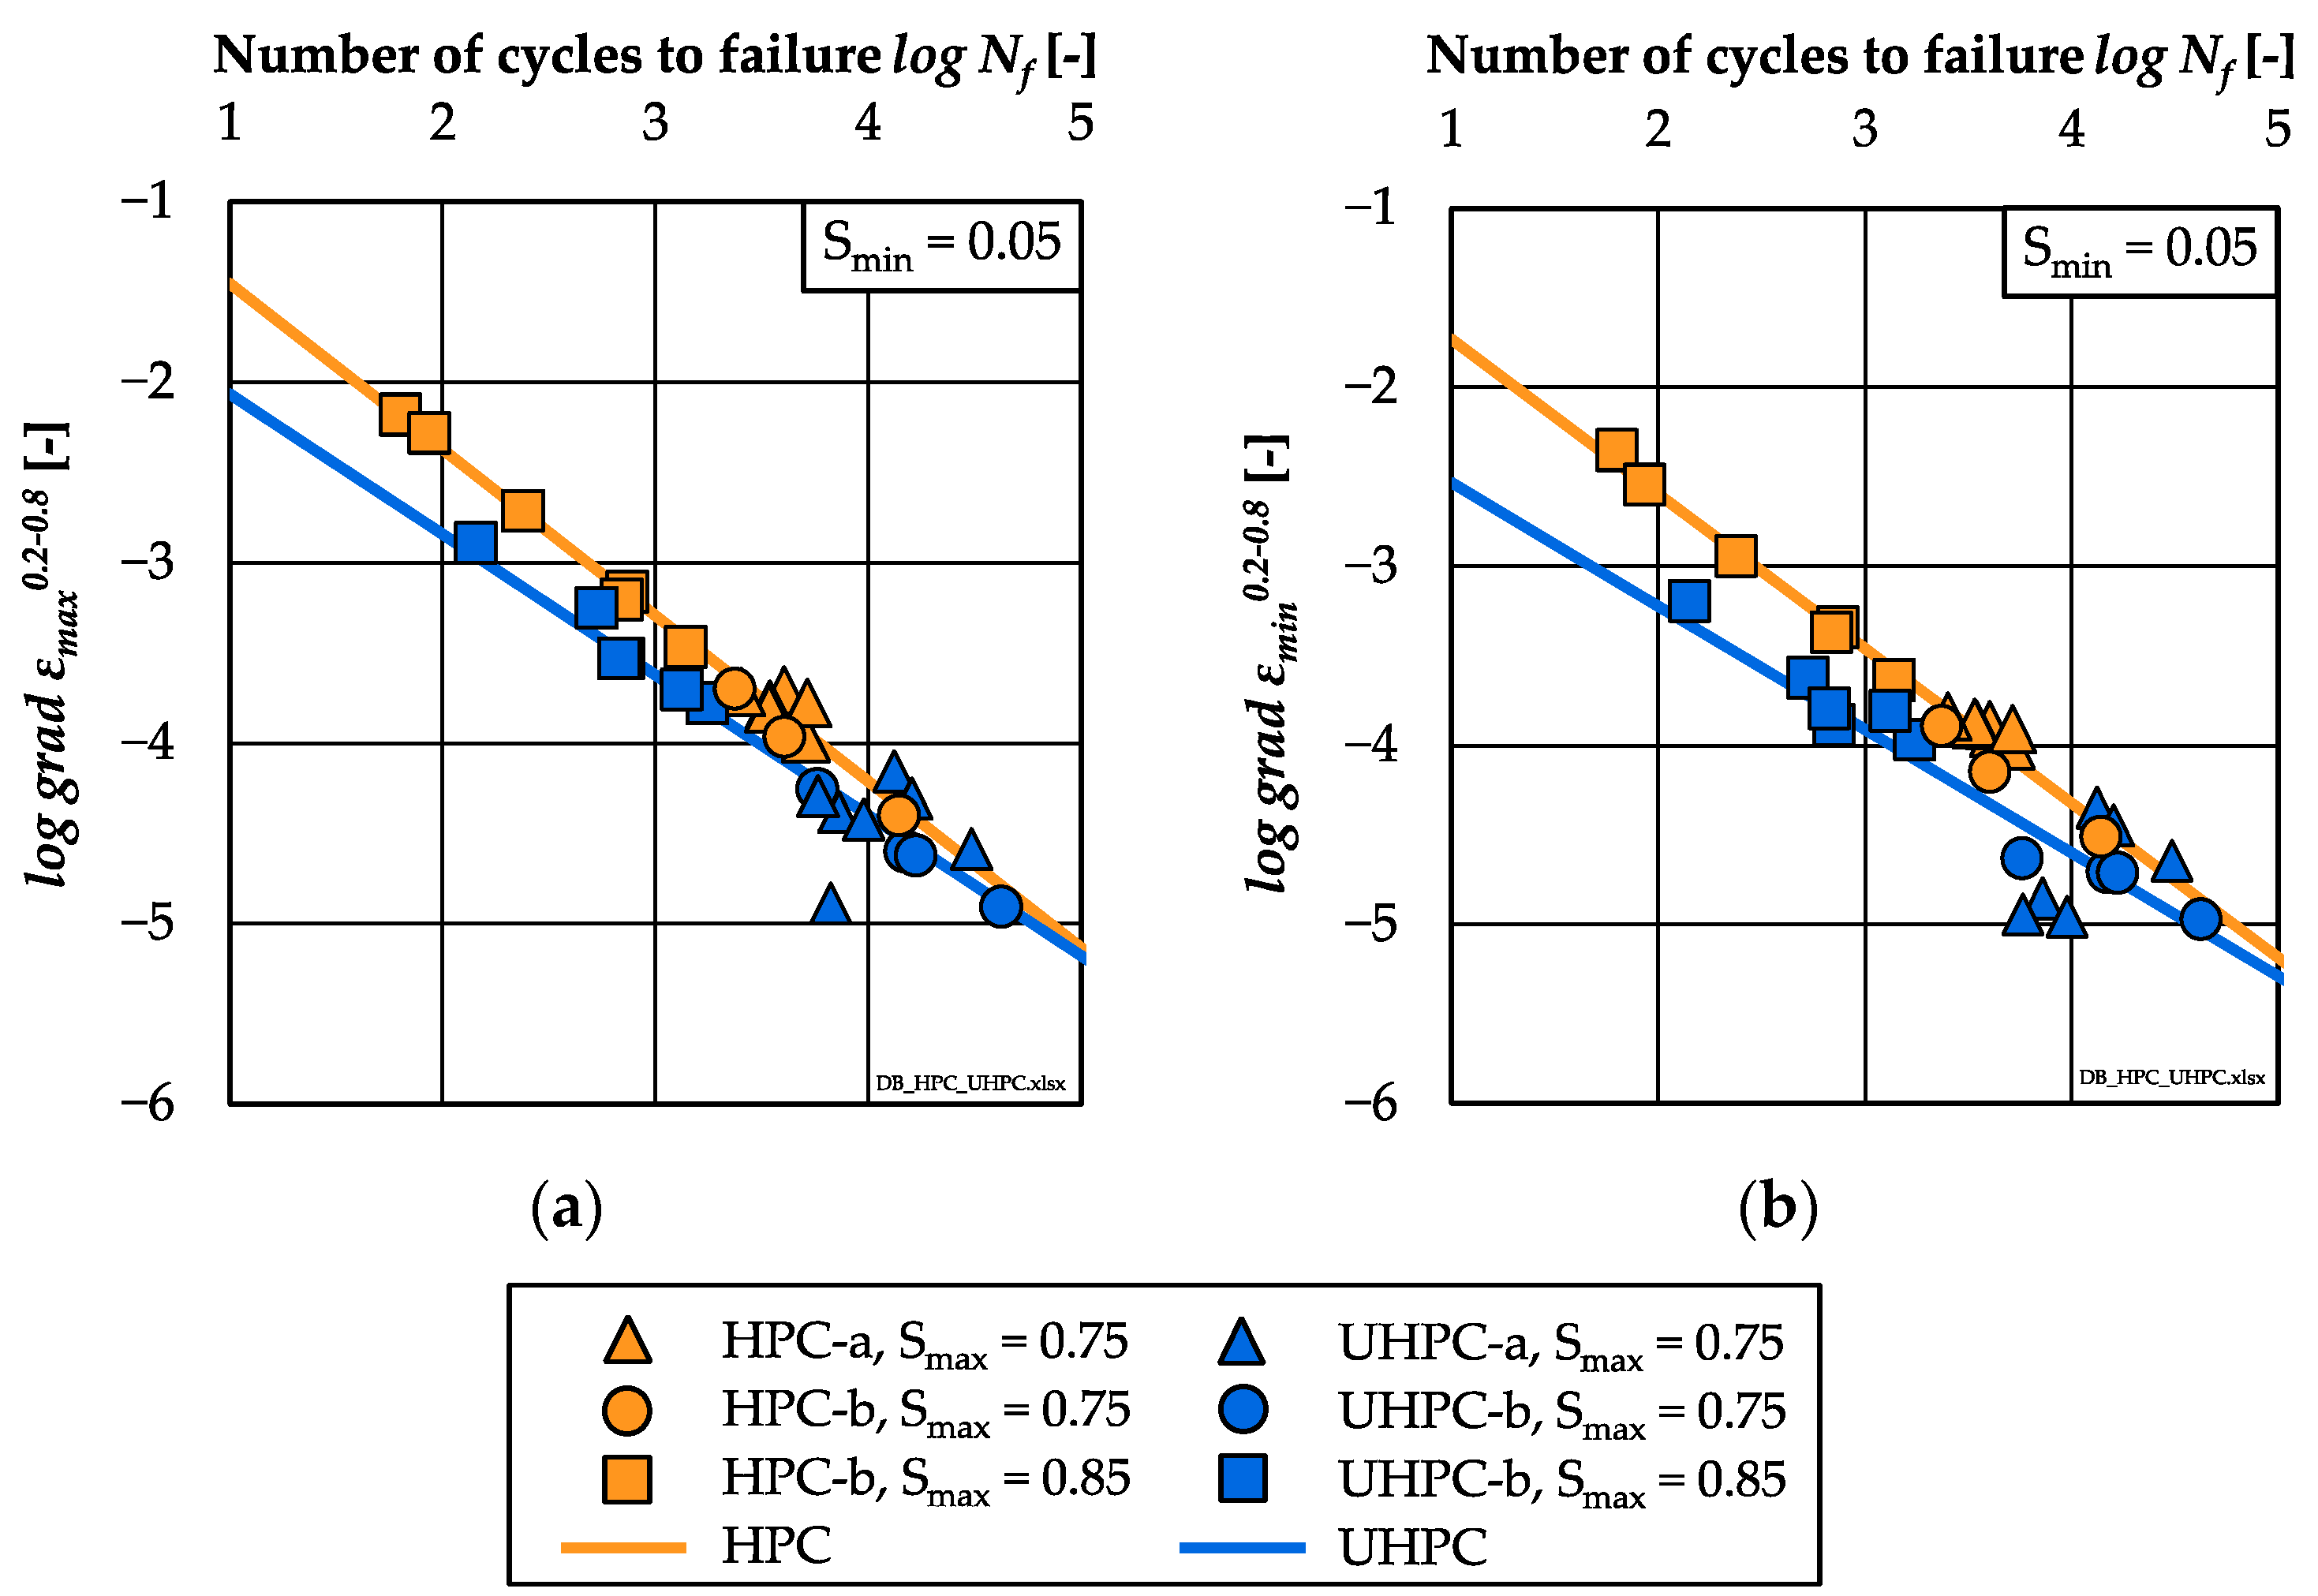
In addition to the numbers of cycles to failure, the damage indicators strain and stiffness were investigated comparatively for the HPC and UHPC. The analyses of the strain developments showed that the HPC exhibited a higher total growth of the maximum and minimum strain than the UHPC, although fewer numbers of cycles were suffered until failure. This correlates to the steeper gradient of strain in phase II of the HPC (cf.
Section 3.3). In
Figure 7a,b, the single values of the gradients of the maximum and minimum strain in phase II (
grad εmax0.2–0.8,
grad εmin0.2–0.8) are displayed with respect to the numbers of cycles to failure in double-logarithmic graphs.
Linear relations between the logarithmic gradients of, respectively, the maximum and minimum strain and the logarithmic numbers of cycles to failure were found for both concretes. The regression lines can be expressed by the following equations (Equations (2)–(5)):
| HPC: | | R² = 0.98 | (2) |
| HPC: | | R² = 0.98 | (3) |
| UHPC: | | R² = 0.88 | (4) |
| UHPC: | | R² = 0.80 | (5) |
The gradients of strain decrease with decreasing stress levels. Furthermore, the gradients of the minimum strain of both concretes are flatter than the gradients of the maximum strain. Both findings confirm the results of [
2]. Furthermore, the regression lines of the UHPC are located below the regression lines of the HPC, which corresponds to the findings in [
13,
15,
16]. This means that smaller gradients of strain or, rather, increases of strain per load cycle are reached by the UHPC for the same number of cycles to failure.
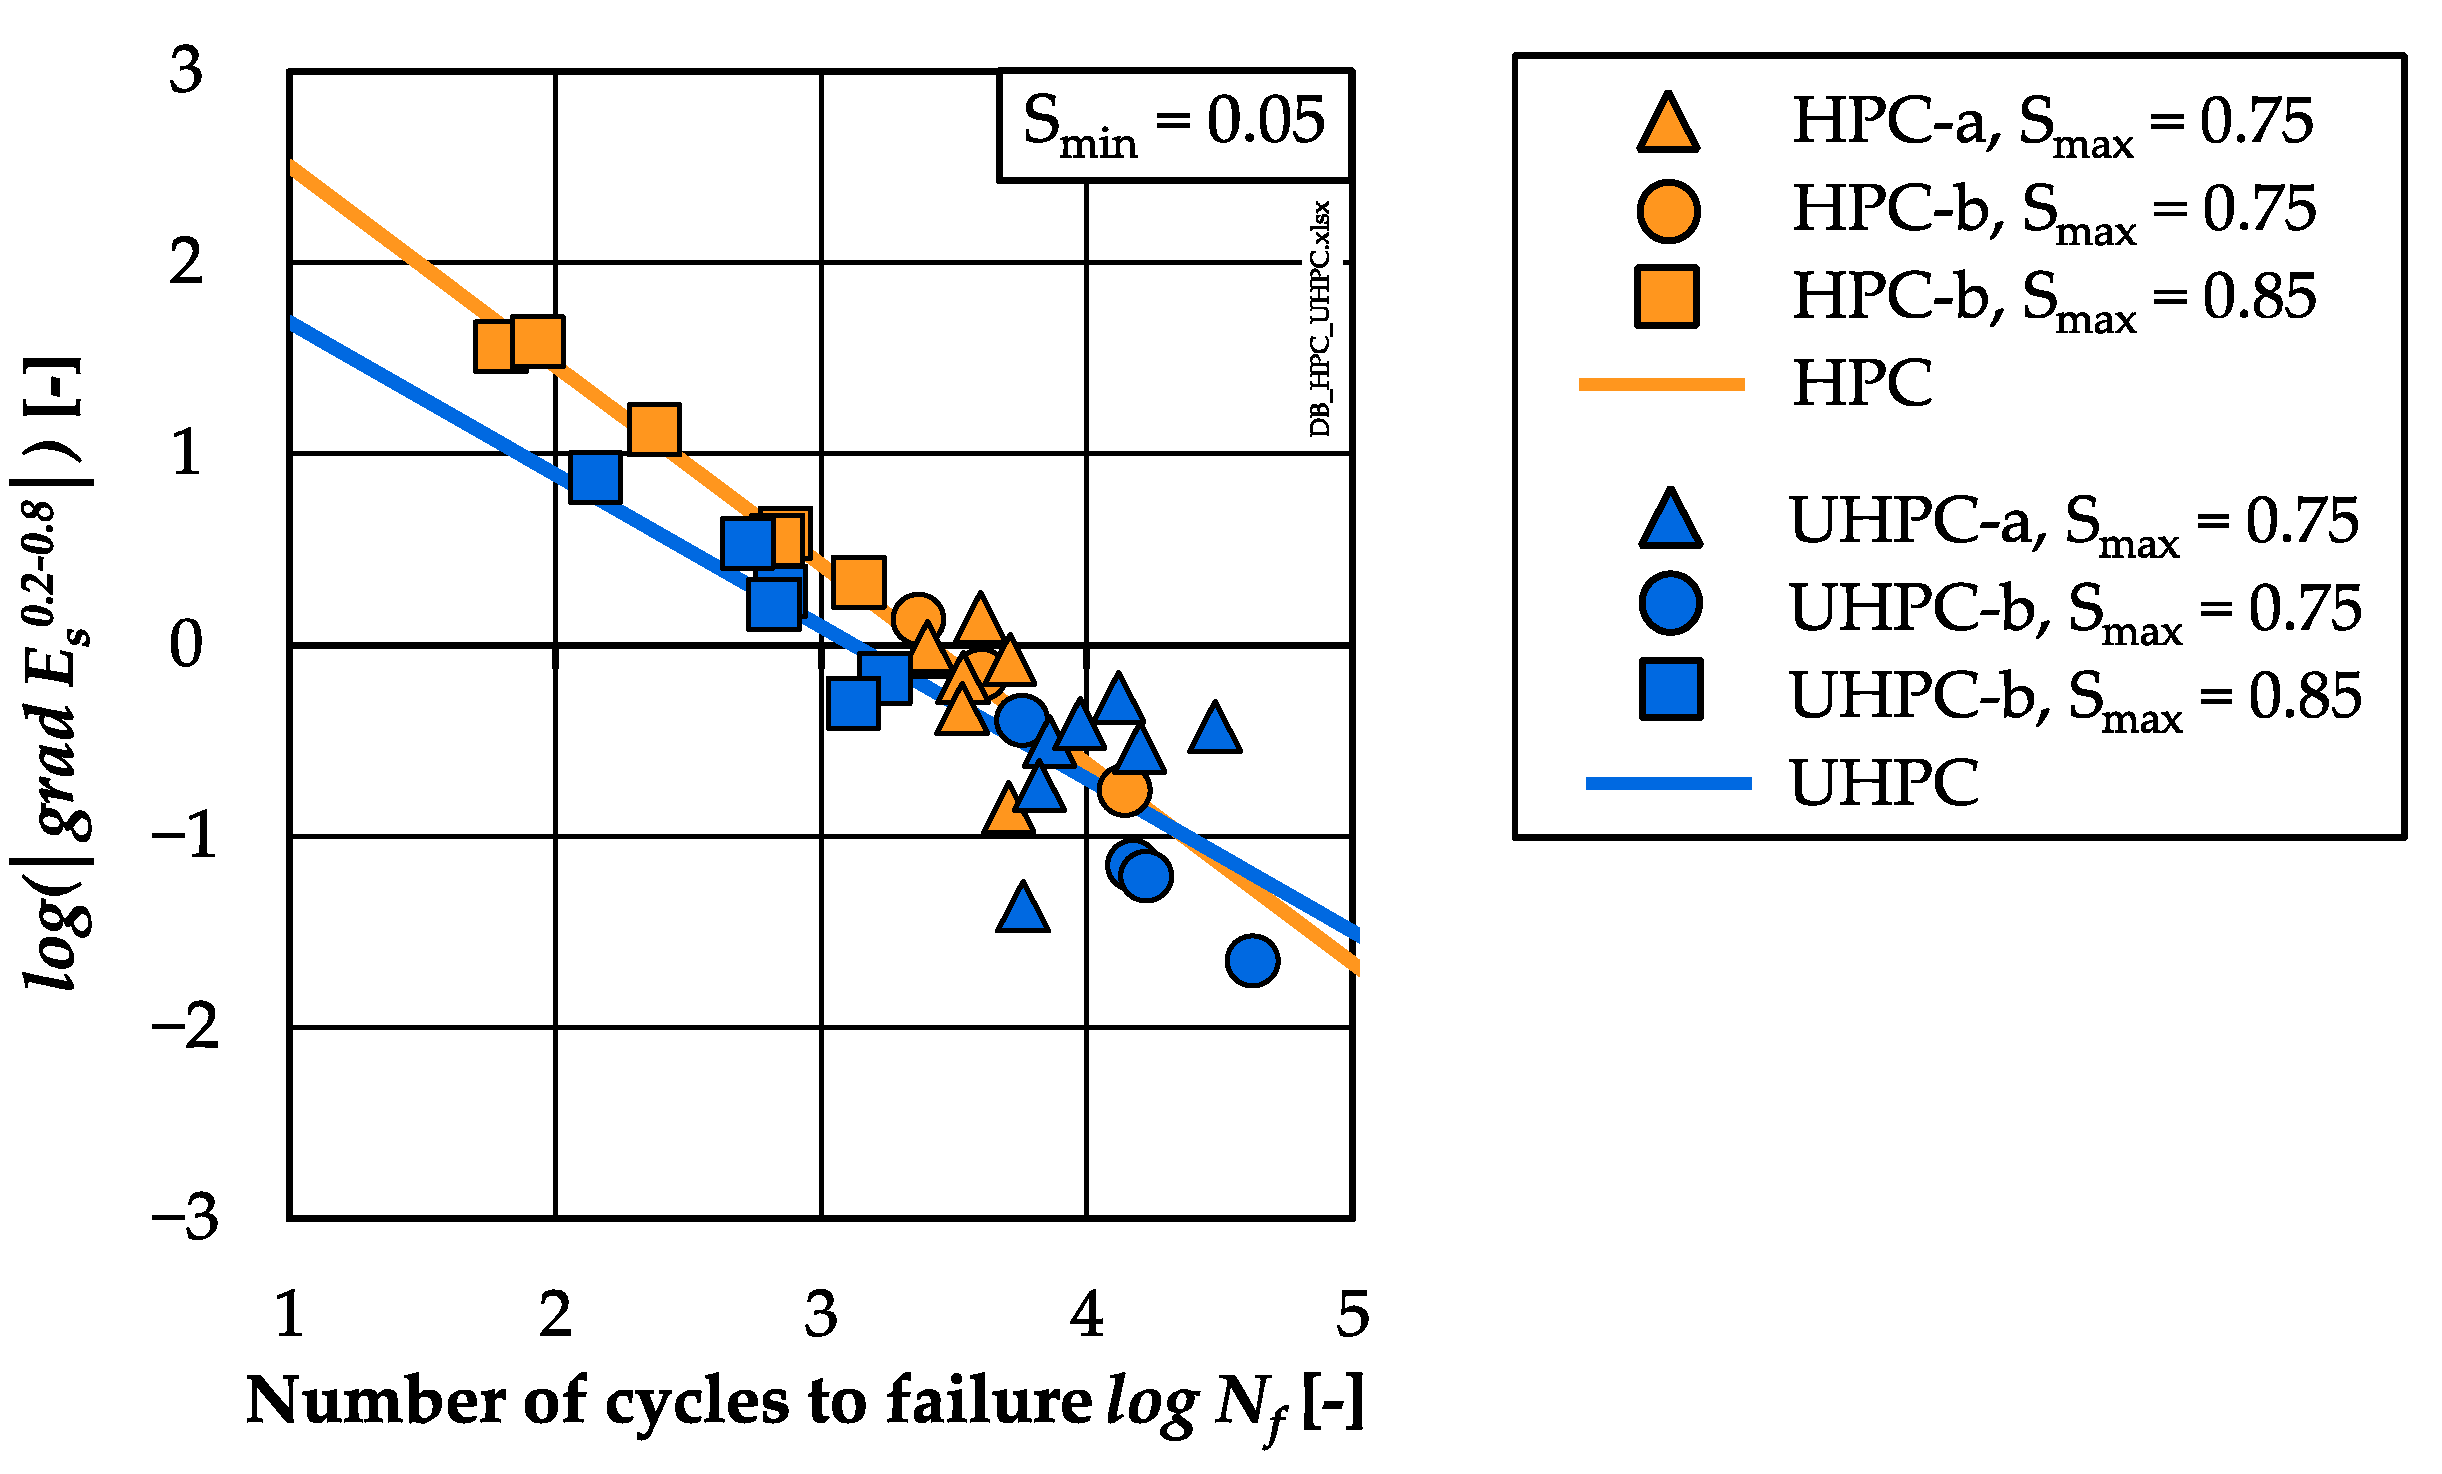
The analyses of the stiffness developments showed a higher percentile reduction of stiffness of the HPC compared to the UHPC, although fewer numbers of cycles were suffered until failure (cf.
Section 3.4). Similar to the strain development, the gradient of stiffness in phase II (
grad Es0.2–0.8) of the HPC was steeper than that of the UHPC. In
Figure 8, the single values of the gradients of stiffness are presented comparatively with respect to the numbers of cycles to failure in double-logarithmic graphs. Linear relations between the logarithmic gradients of stiffness and the logarithmic numbers of cycles to failure were found for both concretes (Equations (6) and (7)), the same as for the gradients of strain:
| HPC: | | R² = 0.93 | (6) |
| UHPC: | | R² = 0.69 | (7) |
It is visible that the gradients of stiffness decrease with decreasing stress levels, which corresponds to results of [
2,
15,
17]. It is noticeable that the results of the UHPC specimens of batch UHPC-a show a larger scattering (stress level
Smax = 0.75). Here, both regressions lines cross each other. In the range of lower
log Nf ≈ 4, the regression line of the UHPC is located below that of the HPC. Thus, flatter gradients of stiffness or, rather, a lower stiffness reduction per load cycle are observable for the UHPC compared to the HPC for the same number of cycles to failure, which correlates to the findings from [
16]. Without the high scattering of batch UHPC-a, this statement might have been drawn also for
log Nf > 4. The differences between the regression lines with respect to gradients of strain and stiffness in phase II (
Figure 7 and
Figure 8) reveal a different material-dependent fatigue behaviour of both concretes.
According to [
8,
9] and to the design approach of standards and guidelines (e.g., [
6,
7]), a lower fatigue resistance of the UHPC compared to the HPC was expected. However, the UHPC investigated showed a higher fatigue resistance than the HPC. Thus, the results confirm observations documented in [
12]. However, the fatigue tests conducted in the investigation presented in this paper were limited and, thus, further investigations are necessary to enable a broader view.
5. Conclusions
The compressive fatigue resistance of a high-strength concrete and an ultra-high-strength concrete, which are the reference concretes in the Priority Programme SPP 2020, were investigated comparatively considering the numbers of cycles to failure and the damage indicators strain and stiffness. The main objective of this study was to contribute to a decrease in the lack of knowledge concerning the influence of compressive strength on the fatigue resistance of concretes. The fatigue investigations were conducted at two stress levels, Smax = 0.85 and 0.75, with the same minimum stress level, Smin = 0.05. The loading frequency was kept constant at ft = 1.0 Hz. The fatigue results were also discussed with respect to the stress–strain curves due to monotonically increasing loading. The experimental investigations were conducted at two laboratories for the purpose of the evaluation of the validity of the concrete-related differences identified in the numbers of cycles to failure and damage indicators, thus reaching more reliable conclusions. The main findings can be summarised as follows:
The UHPC reached higher mean numbers of cycles to failure than the HPC at both stress levels investigated. Furthermore, the difference in mean numbers of cycles to failure was statistically significant (ANOVA, p-value << 0.05) at the lower level. Thus, a negative influence of the higher compressive strength of the UHPC on the numbers of cycles to failure was not observed in the investigations presented.
The damage indicators showed a smaller total growth of strains and a smaller percentile reduction of stiffness of the UHPC compared to the HPC. Furthermore, the gradients of strain and stiffness in phase II, i.e., the increase in strain and decrease in stiffness per load cycle, respectively, of the UHPC were smaller than those of the HPC. In summary, the UHPC showed a less pronounced damage evolution compared to the HPC. Furthermore, the damage indicators reveal a different material-dependent fatigue behaviour.
A batch influence on the results of the reference compressive strength for both concretes was identified. For each concrete, this batch influence was not found in the numbers of cycles to failure. Thus, the batch influence was equalised due to the determination of the tested fatigue stresses, based on the respective reference compressive strength of the batch.
Overall, a higher fatigue sensitivity could not be found for the UHPC compared to the HPC investigated. Thus, this result contradicts the results from [
8,
9] and confirms the results of [
12]. It also contradicts the current approach of the design standards and guidelines [
6,
7], which consider the compressive fatigue sensitivity of concretes to increase with the increasing compressive strength. The observed trend here should be systematically investigated on a broader database of results.


