
Evaluation of Boride Layers on C70W2 Steel Using a New Approach to Characterization of Boride Layers


Abstract
:1. Introduction
2. Materials and Methods
3. Results
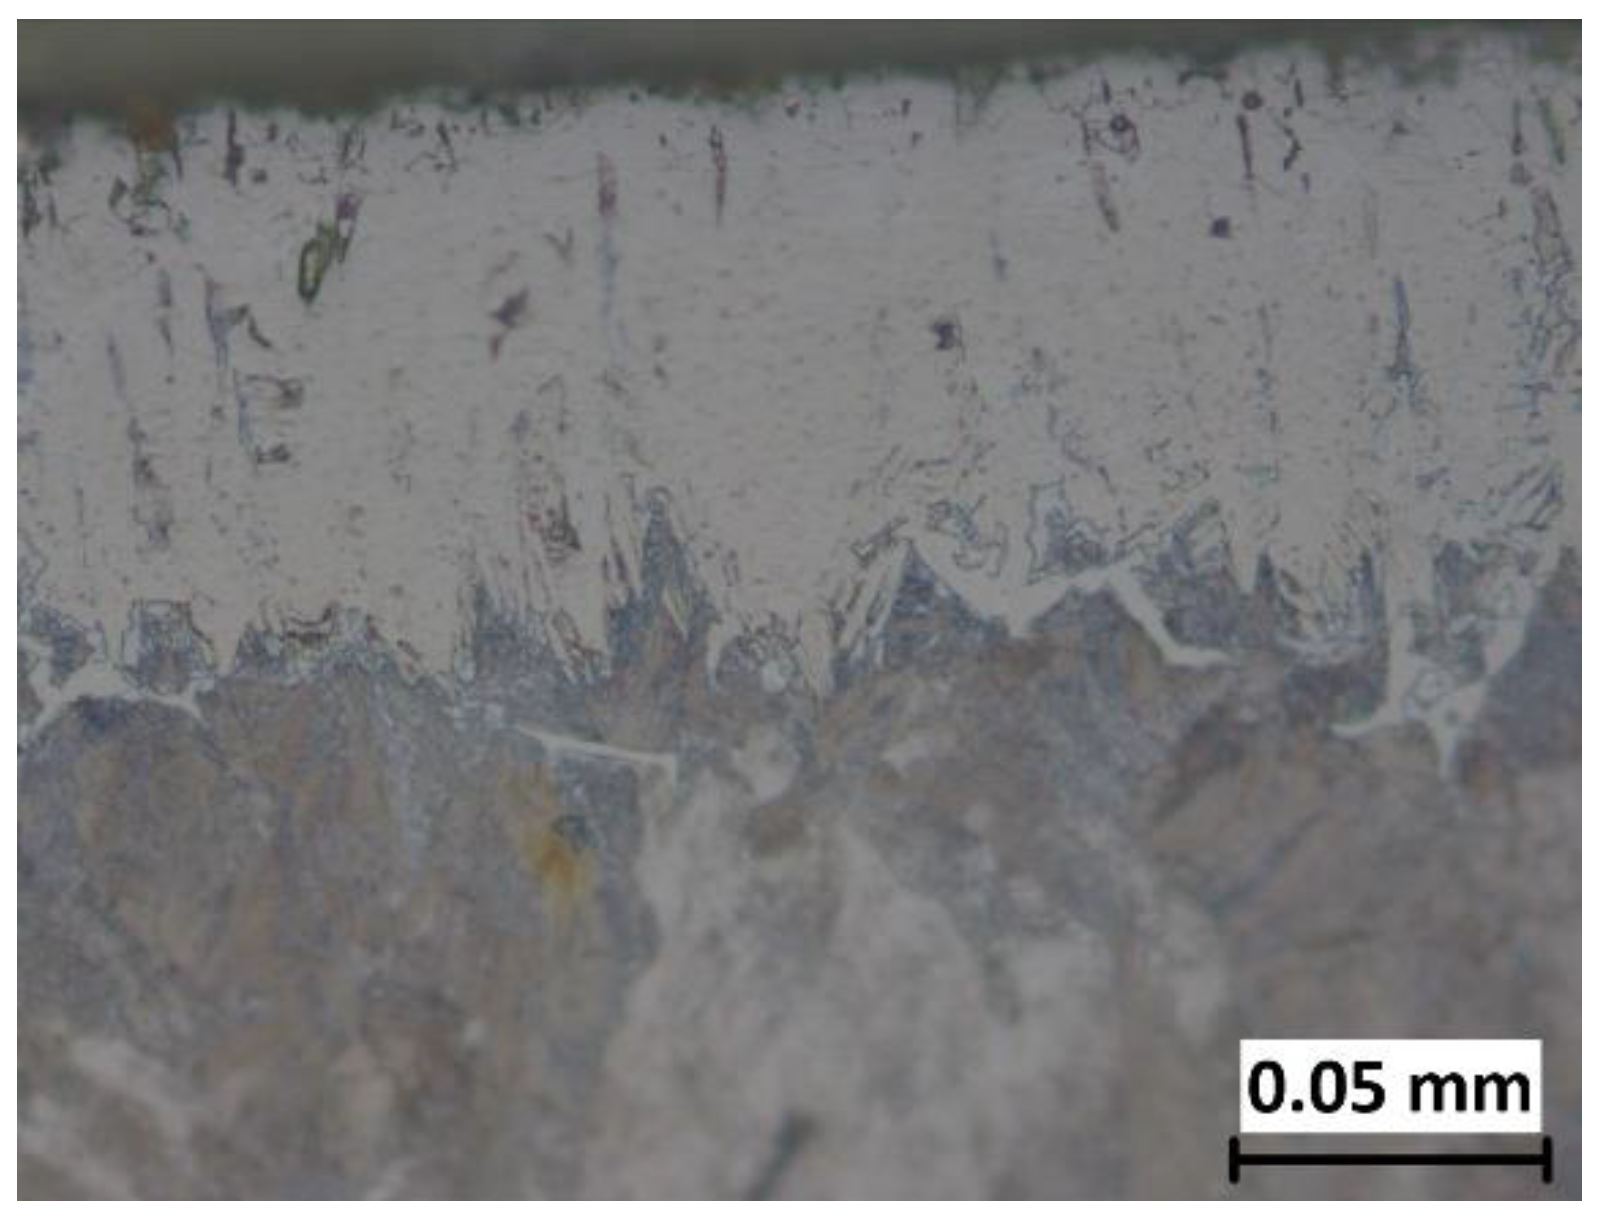
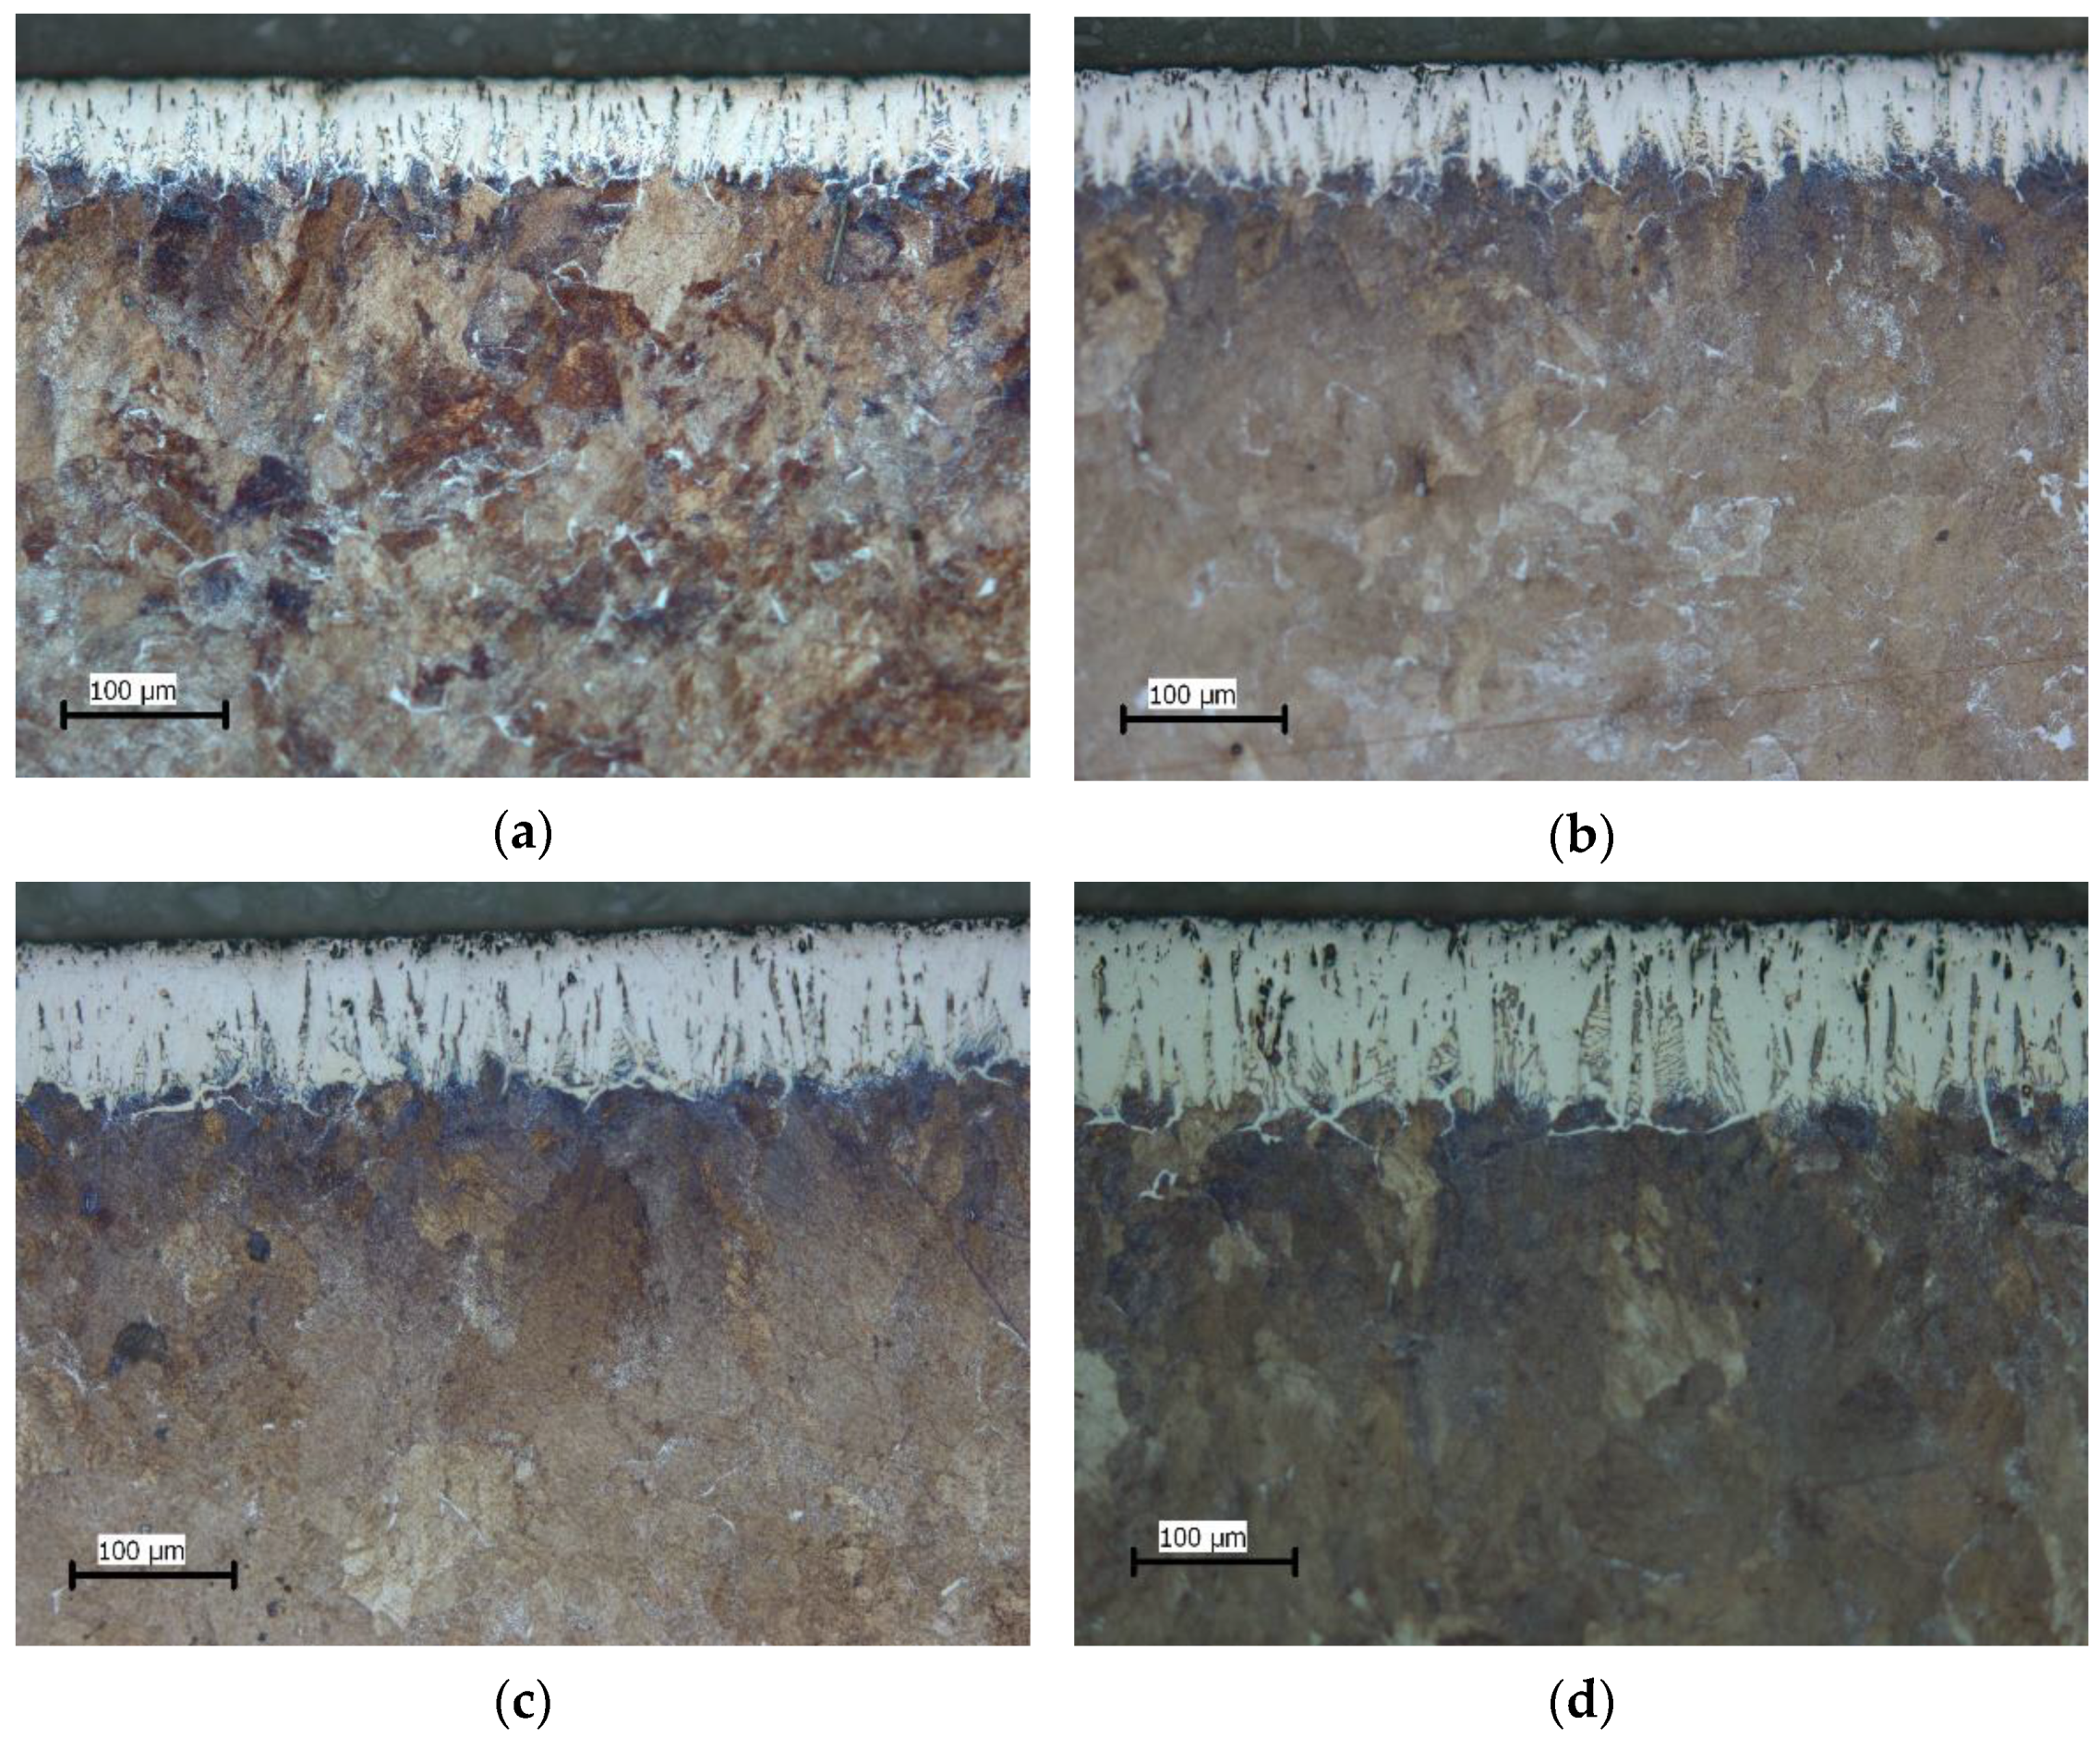
3.1. Microstructure
3.2. Statistical Analysis
4. Discussion
4.1. Characterization of Boride Layers Obtained on C70W2
4.2. Advantages of a New Approach to the Characterization of Boride Layers
5. Conclusions
- -
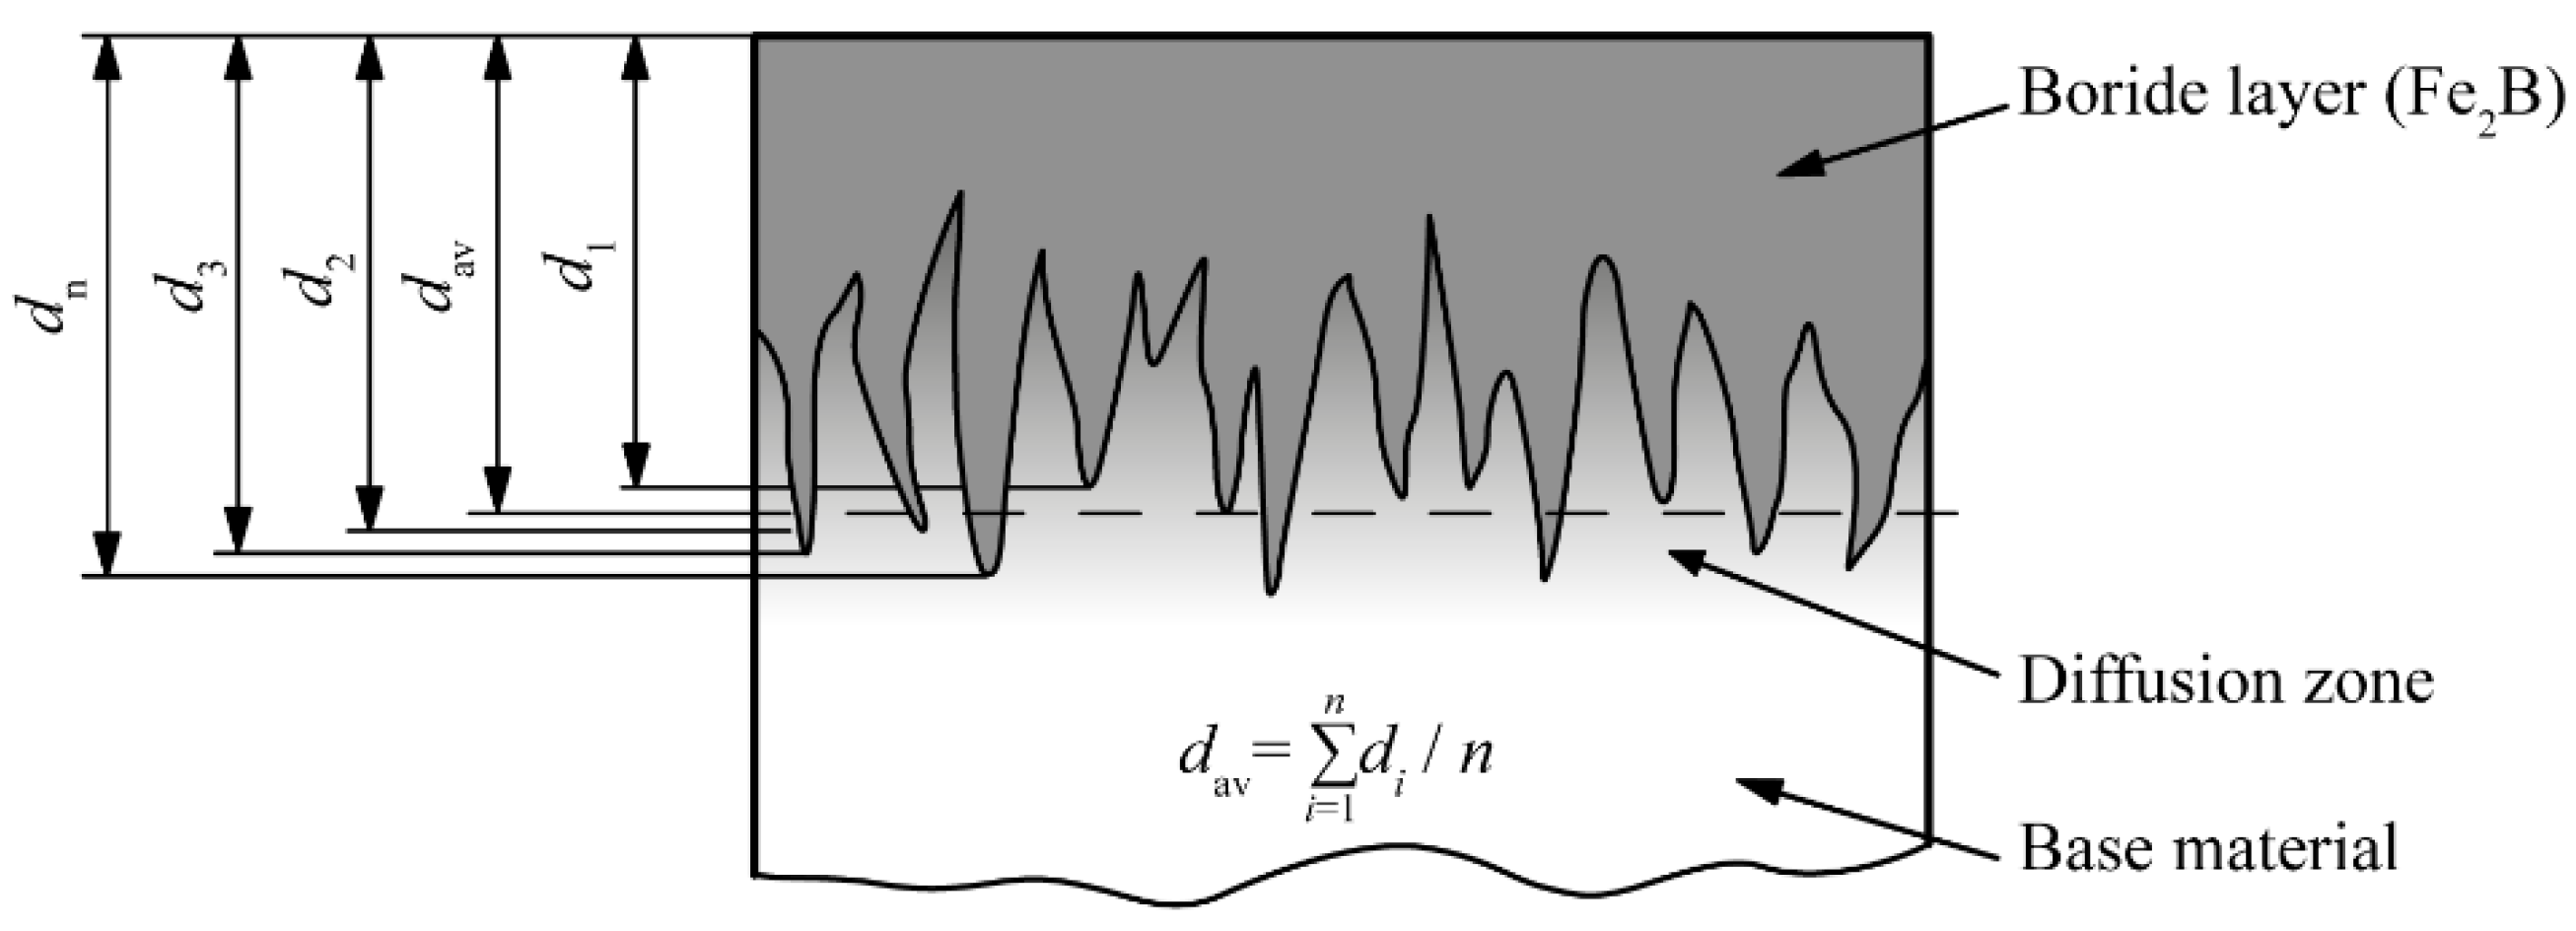
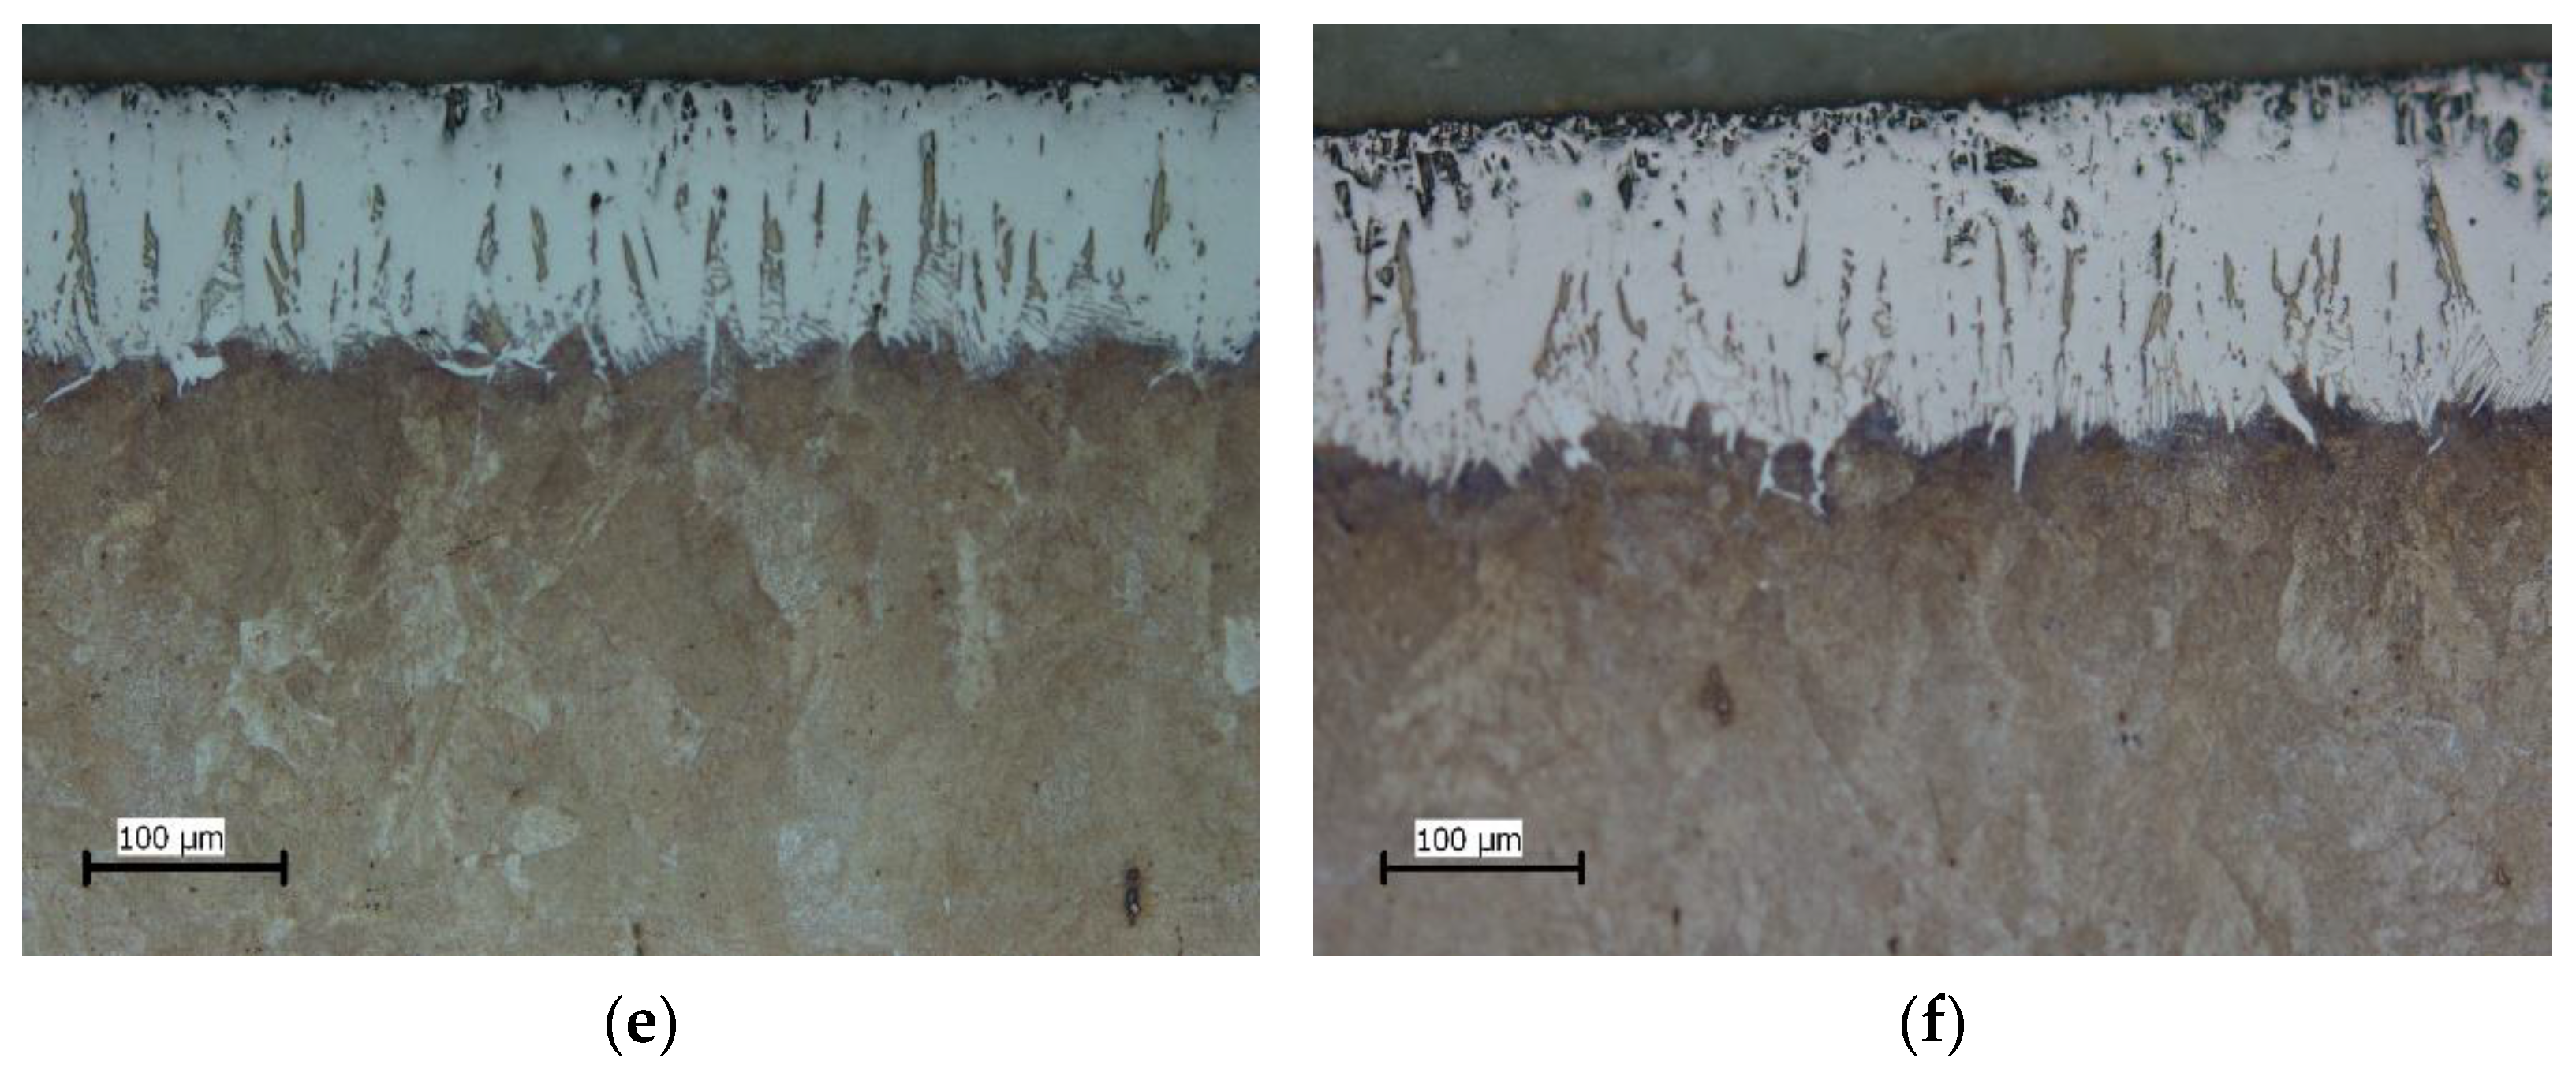
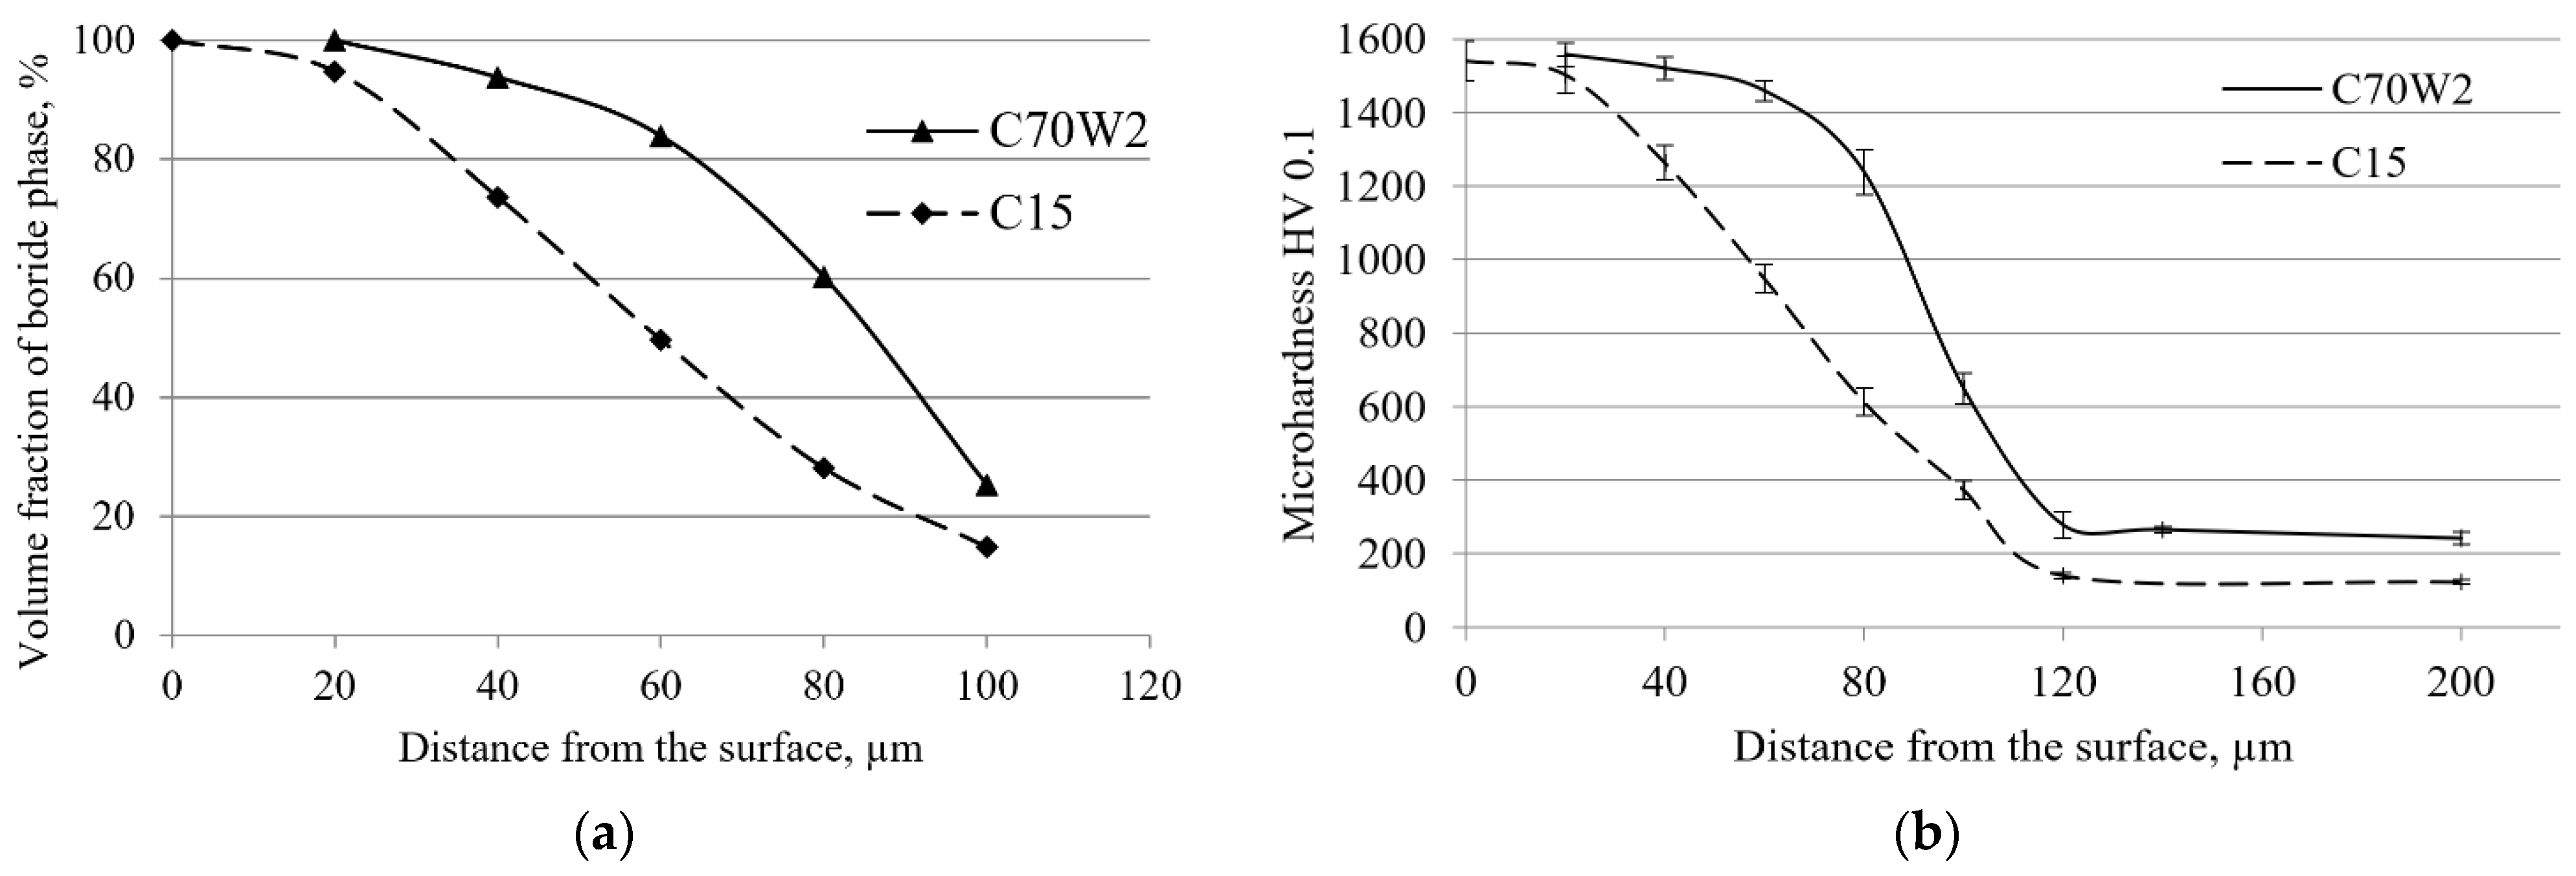
- The metallographic analysis showed that boride layers with less-pronounced toothness were formed on the surface of the C70W2 steel than is the case with low-carbon steels.
- -
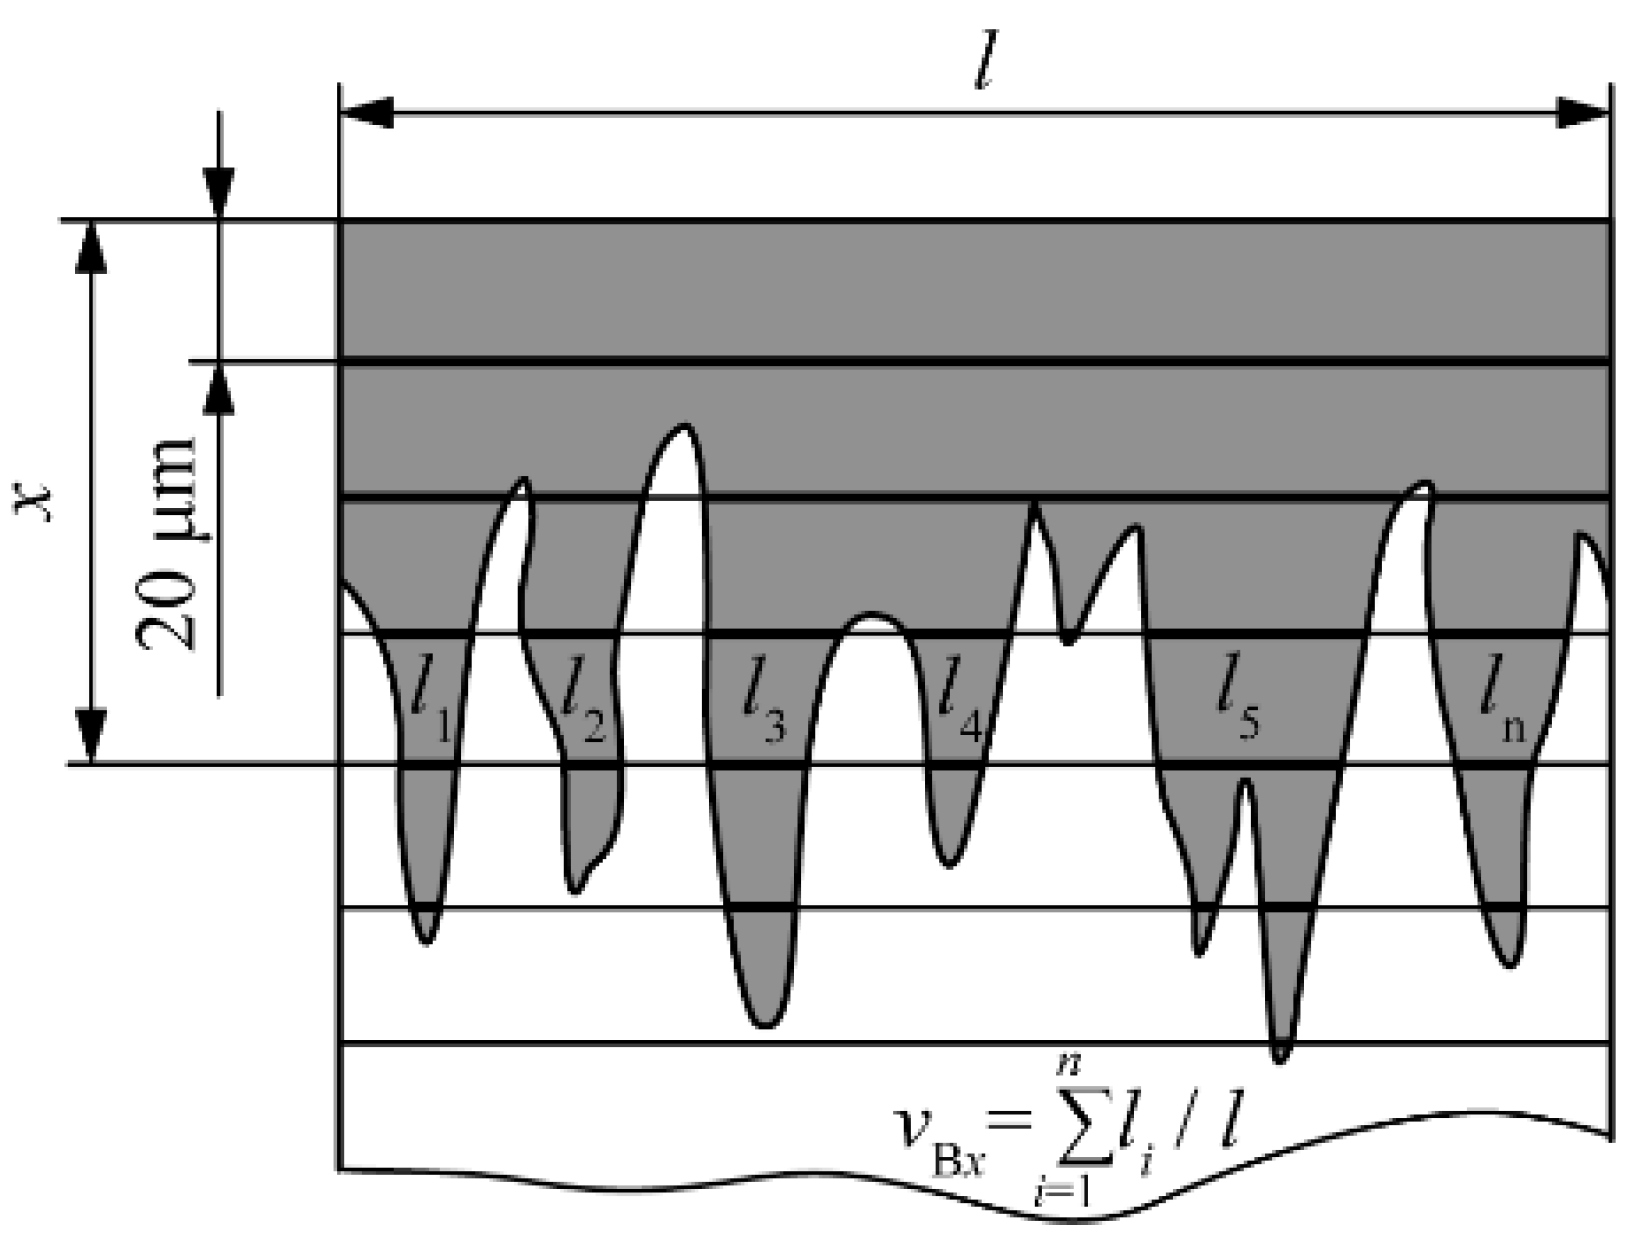
- Analysis of the volume fraction of the boride phase in the cross-section of the sample showed that with increasing temperature and duration, the boride phase was found at greater depths, i.e., thicker layers were formed. It was also found that the effect of boronizing temperature on the volume fractions is greater than the effect of duration. The volume fraction curves confirmed the diffusion character of boronizing, i.e., the diffusion of boron slows down over time.
- -
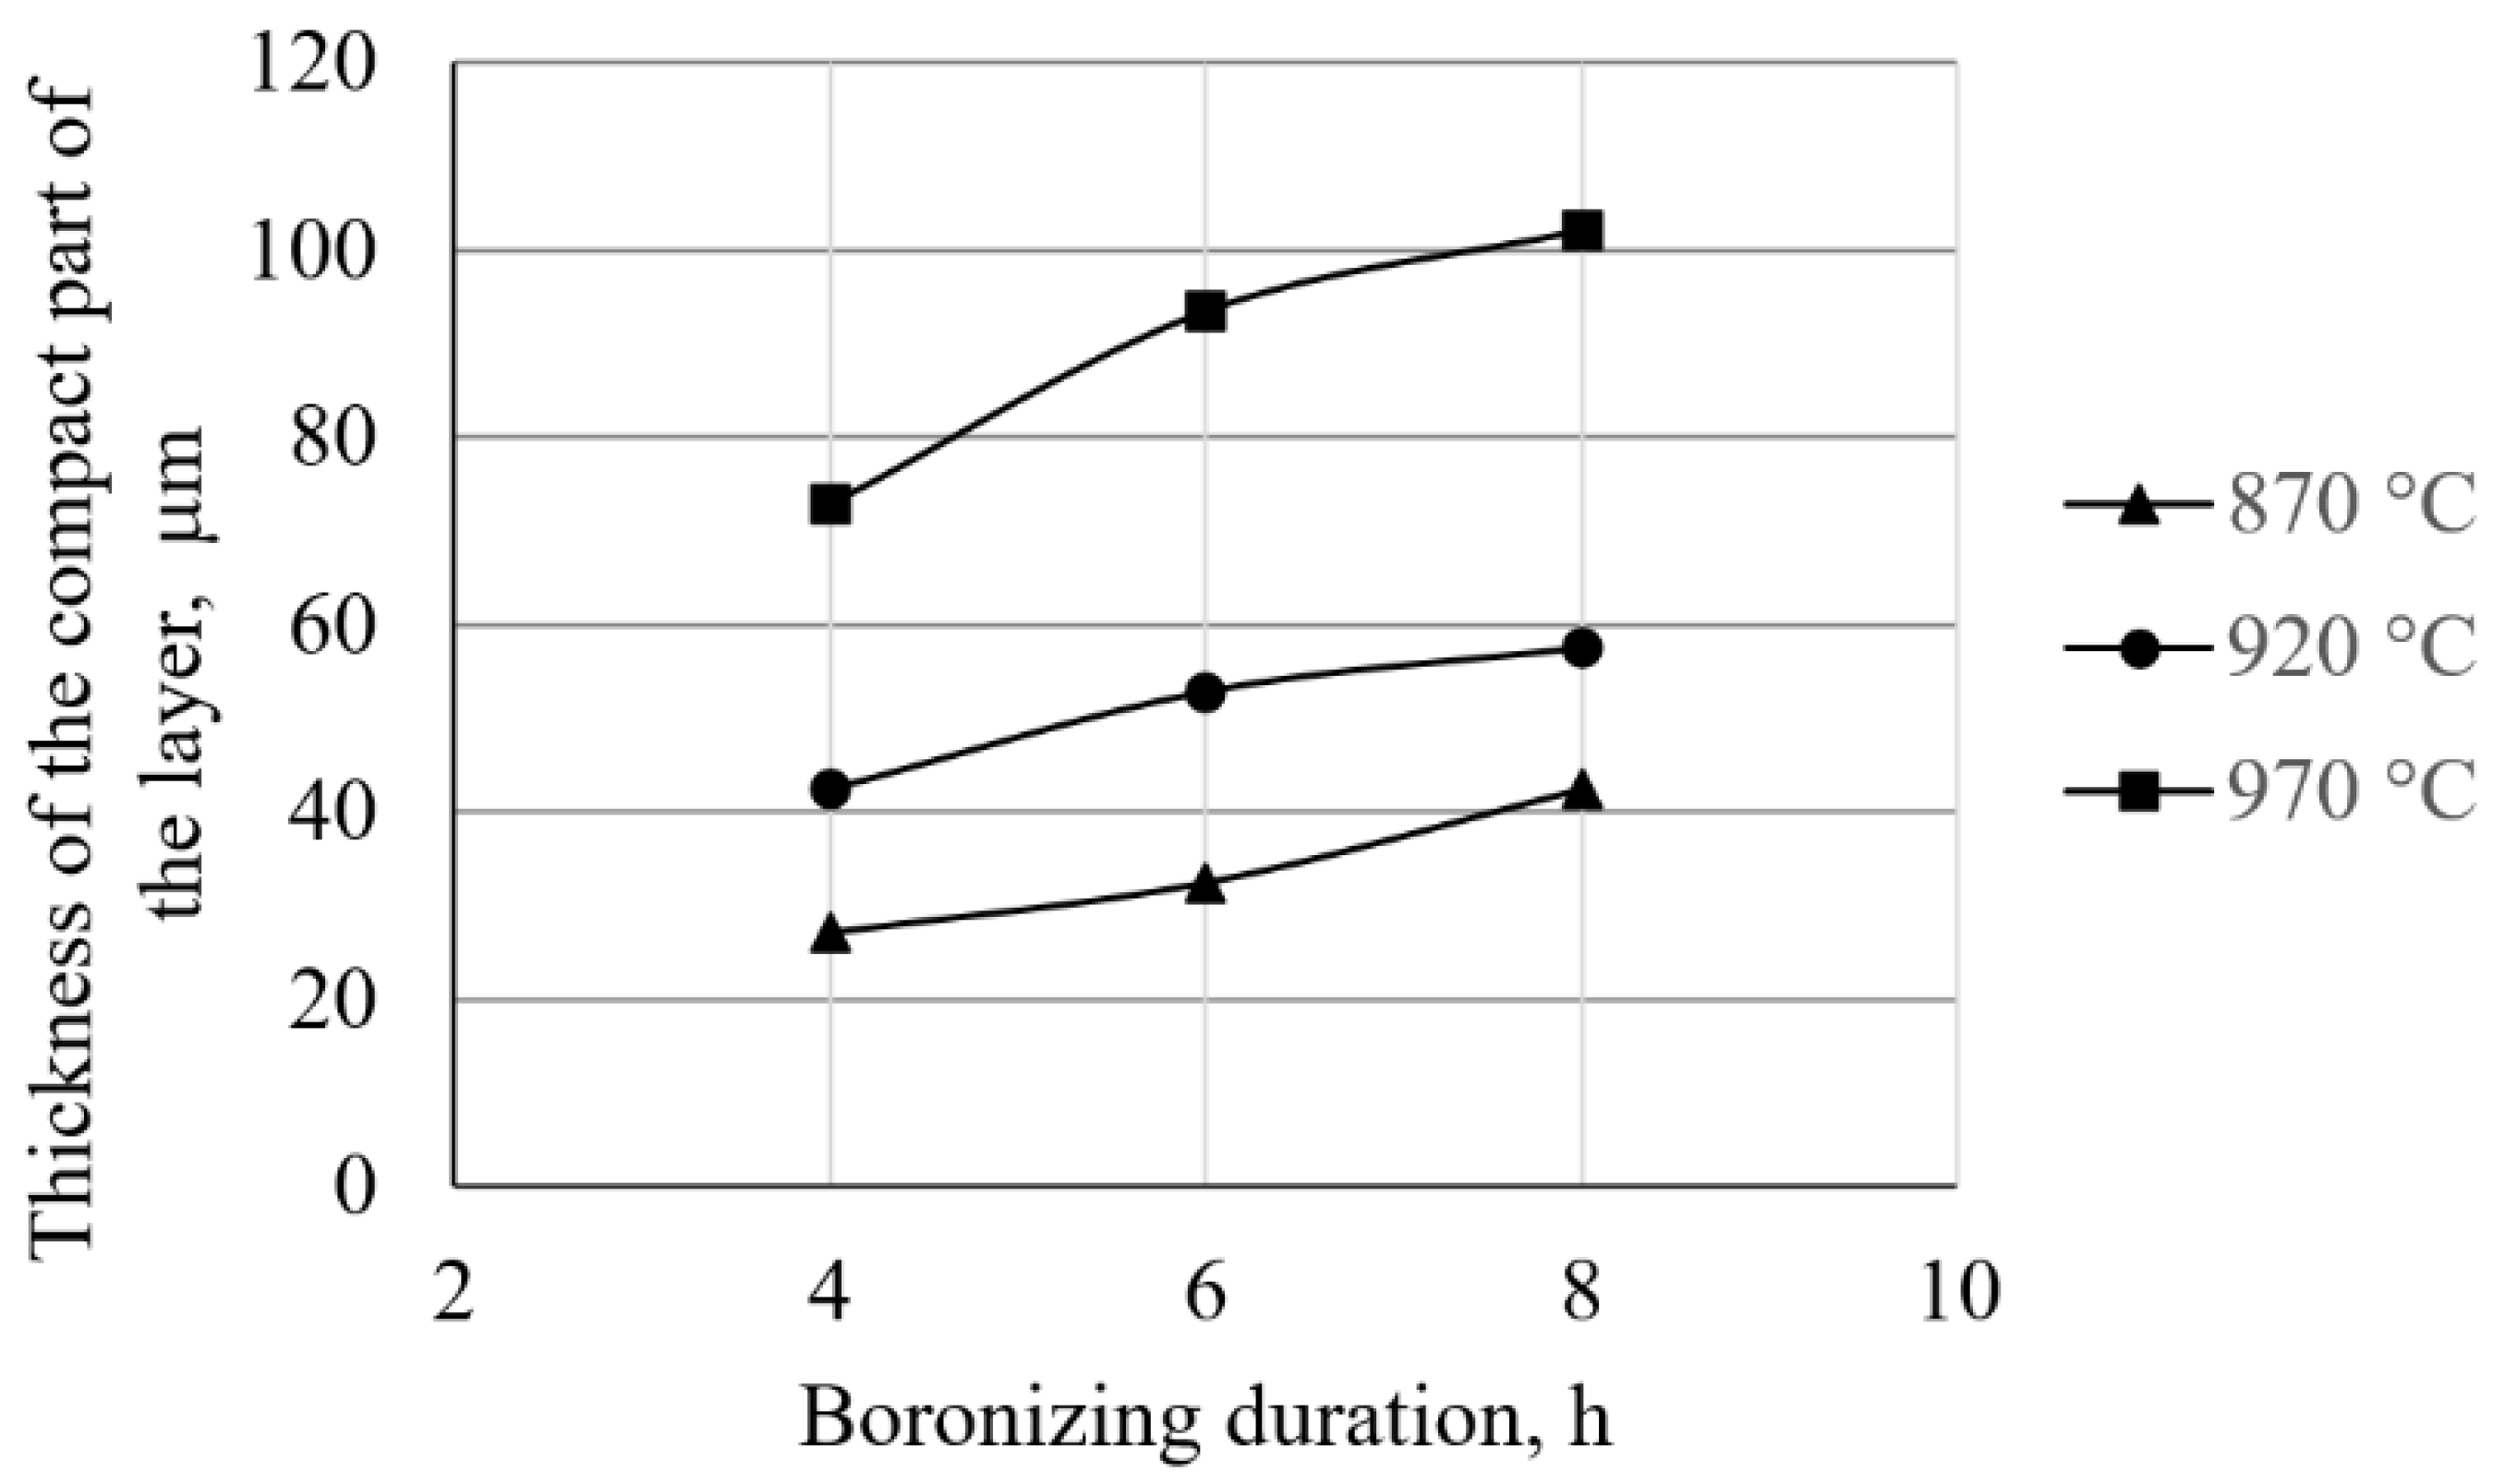
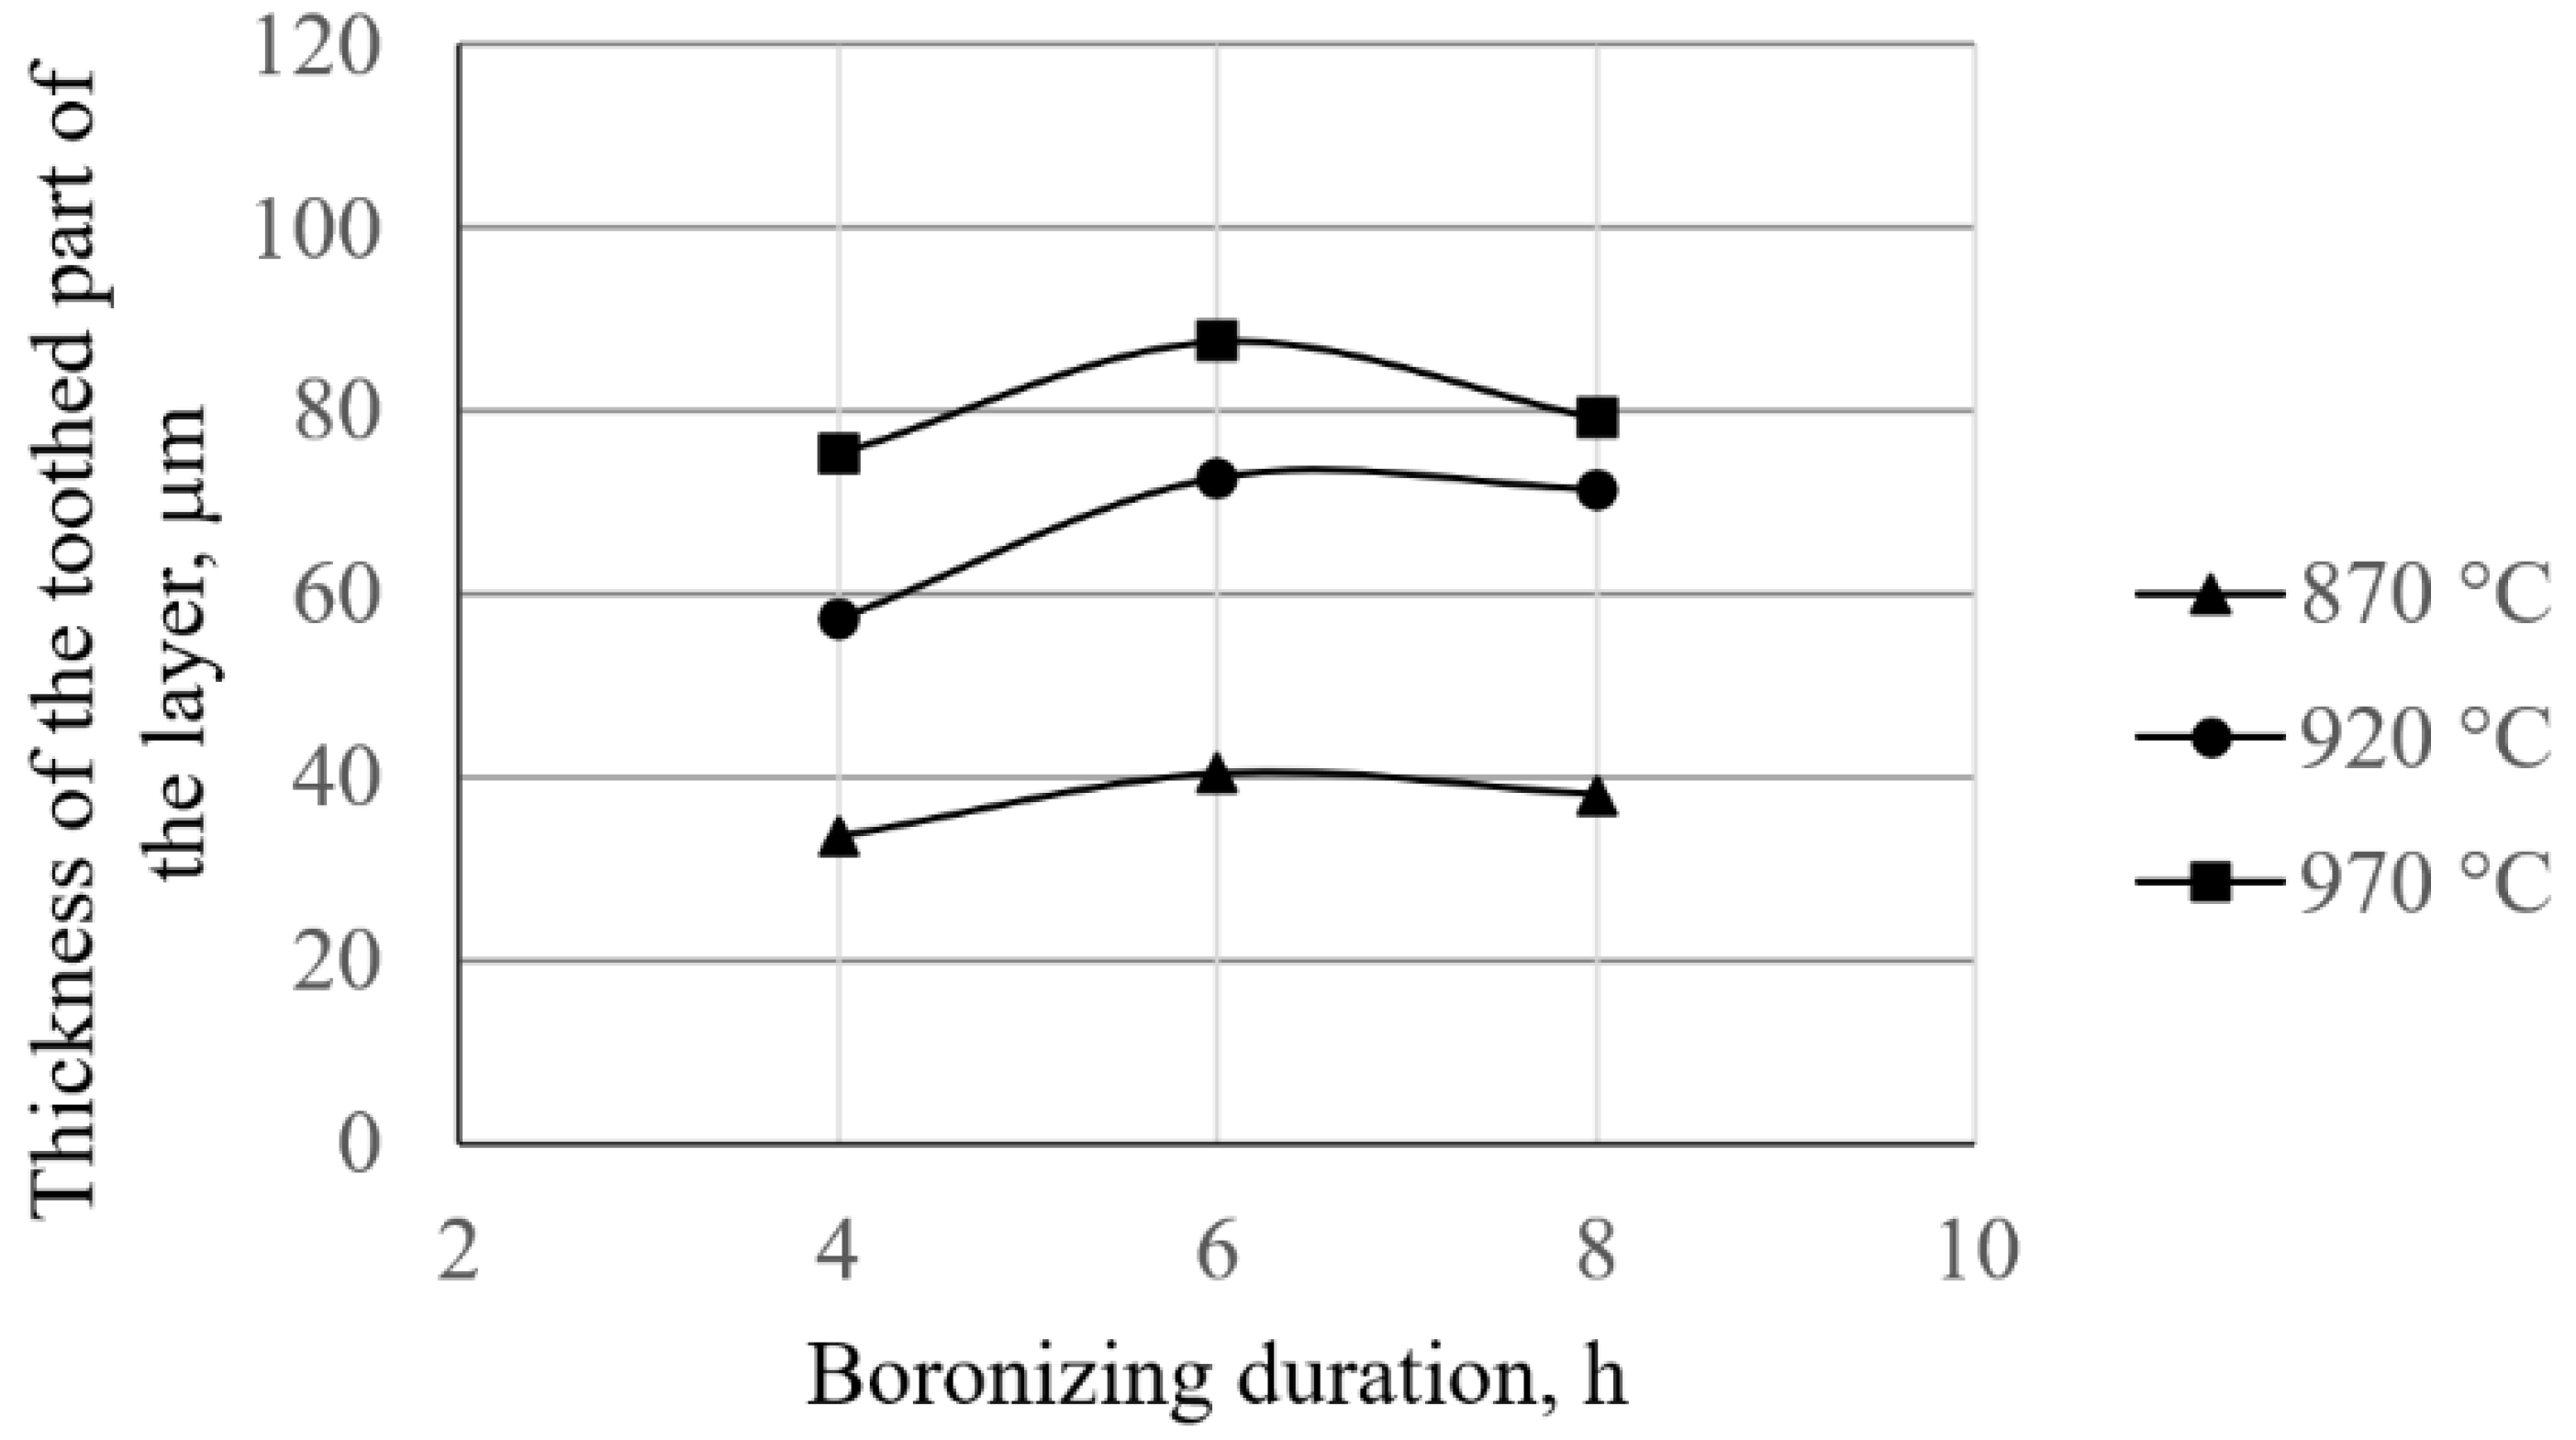
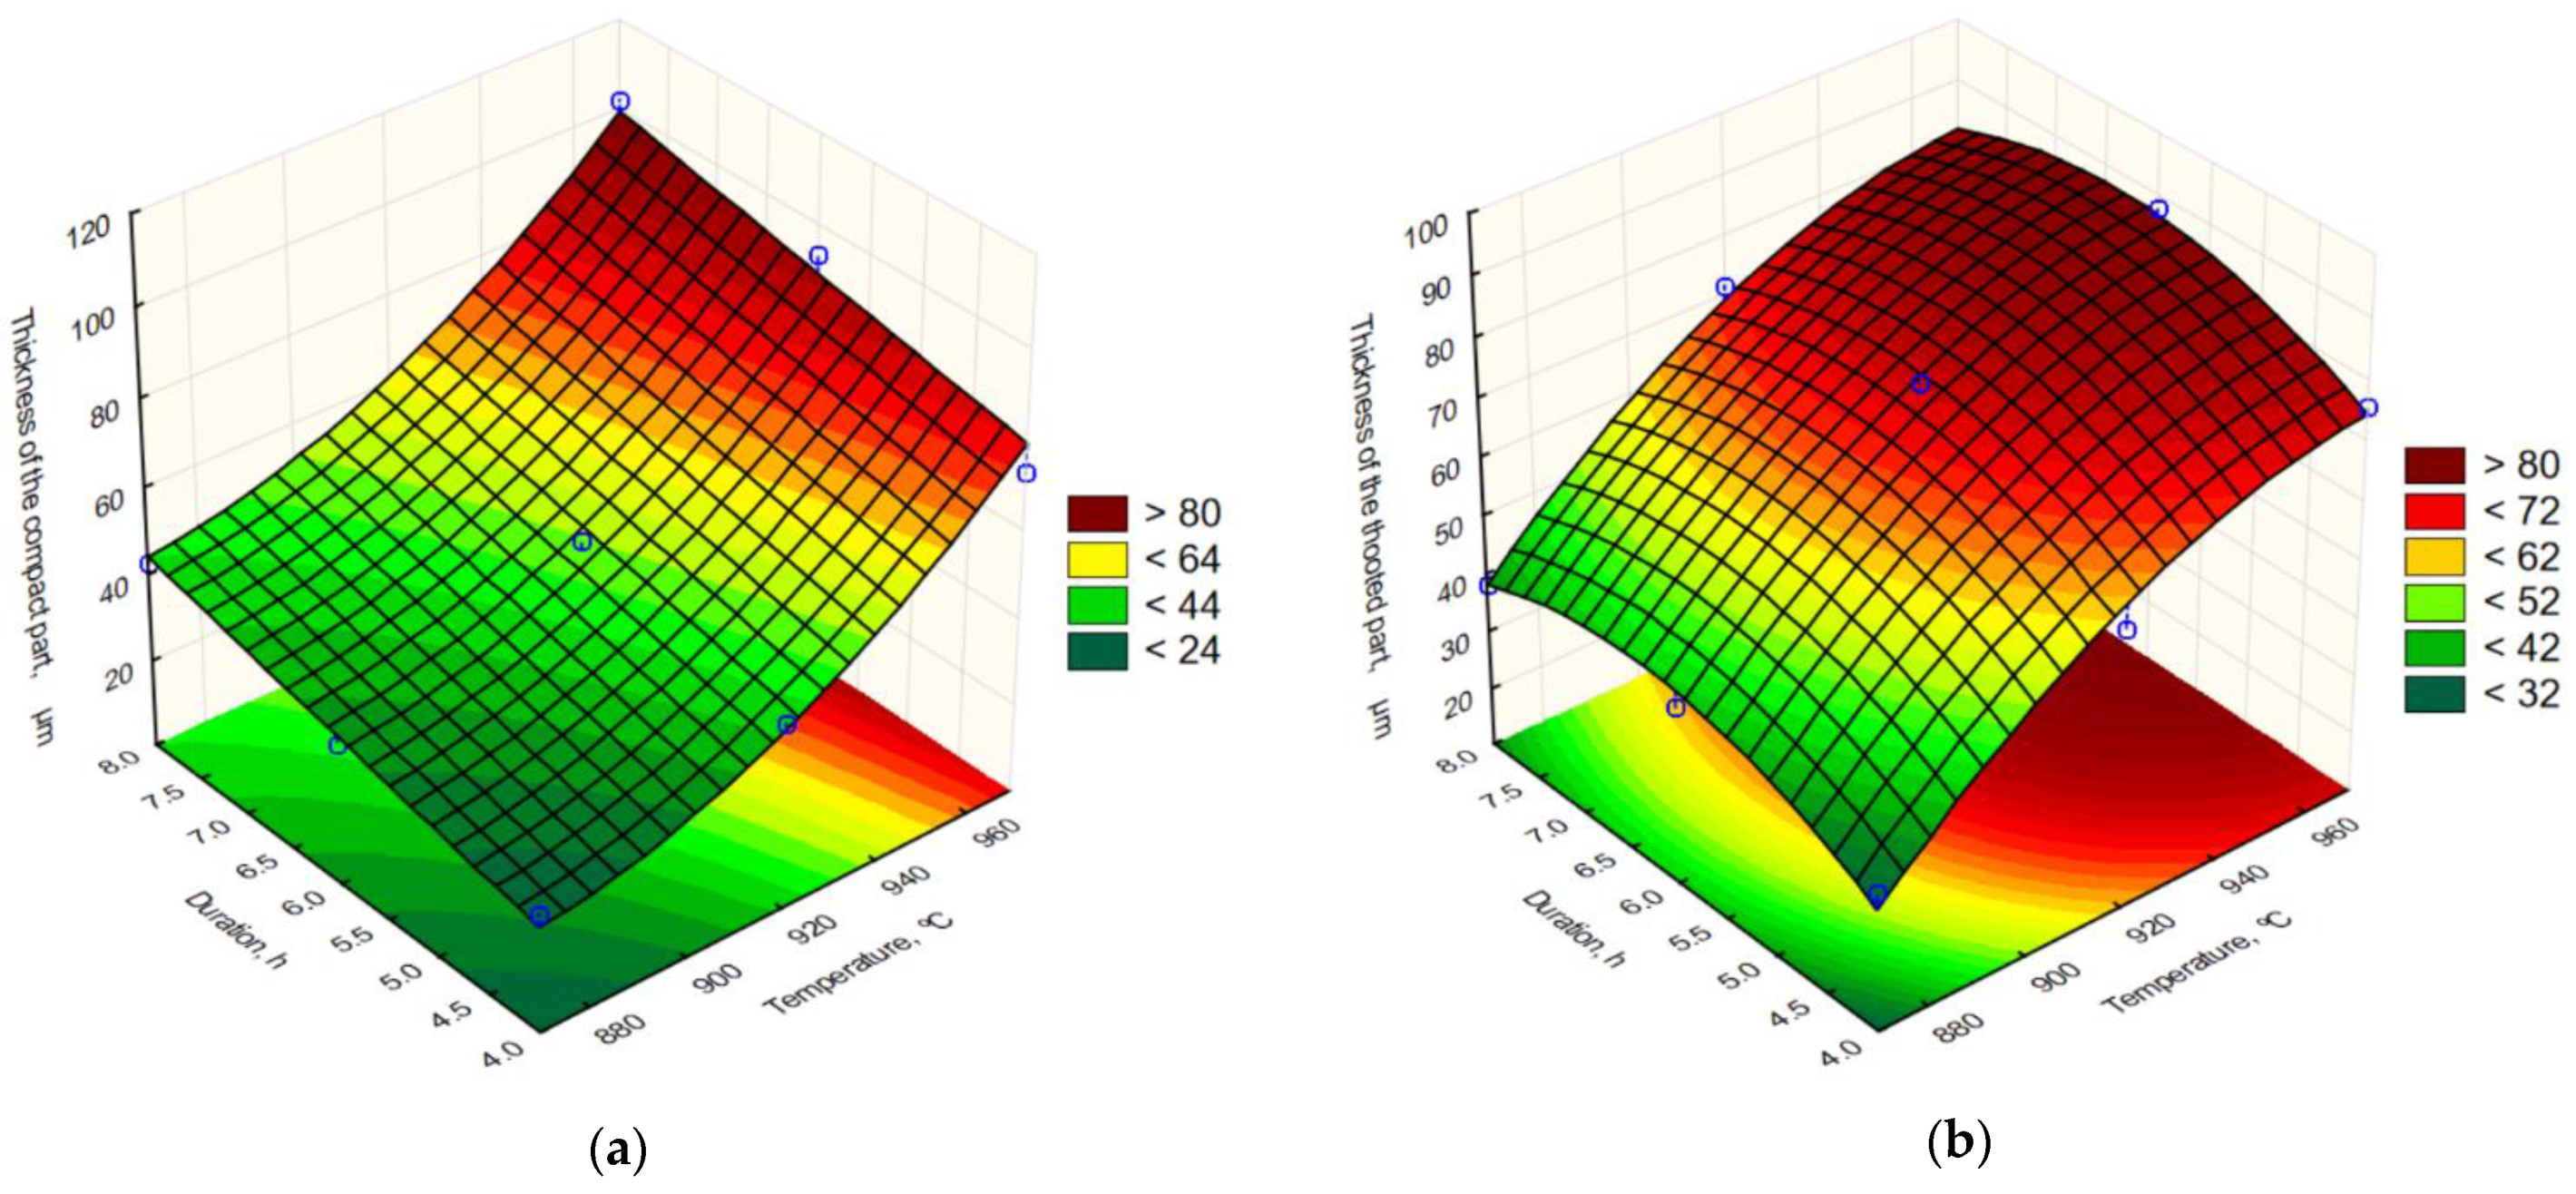
- Based on the volume fractions, the layers are divided into compact and toothed parts. The study showed that the boronizing parameters affect the layer morphology. Higher temperatures resulted in greater thicknesses of the compact and toothed parts. On the other hand, it was found that the duration of boronizing has a different effect on the morphology of the layer compared to the temperature. Increasing the boronizing duration resulted in greater thicknesses of the compact part, while the toothness first increased and then began to decrease. The maximum thickness of the toothed part was reached by boronizing for 6 h. This phenomenon means that thicker but less-toothed layers are formed with longer boronizing.
- -
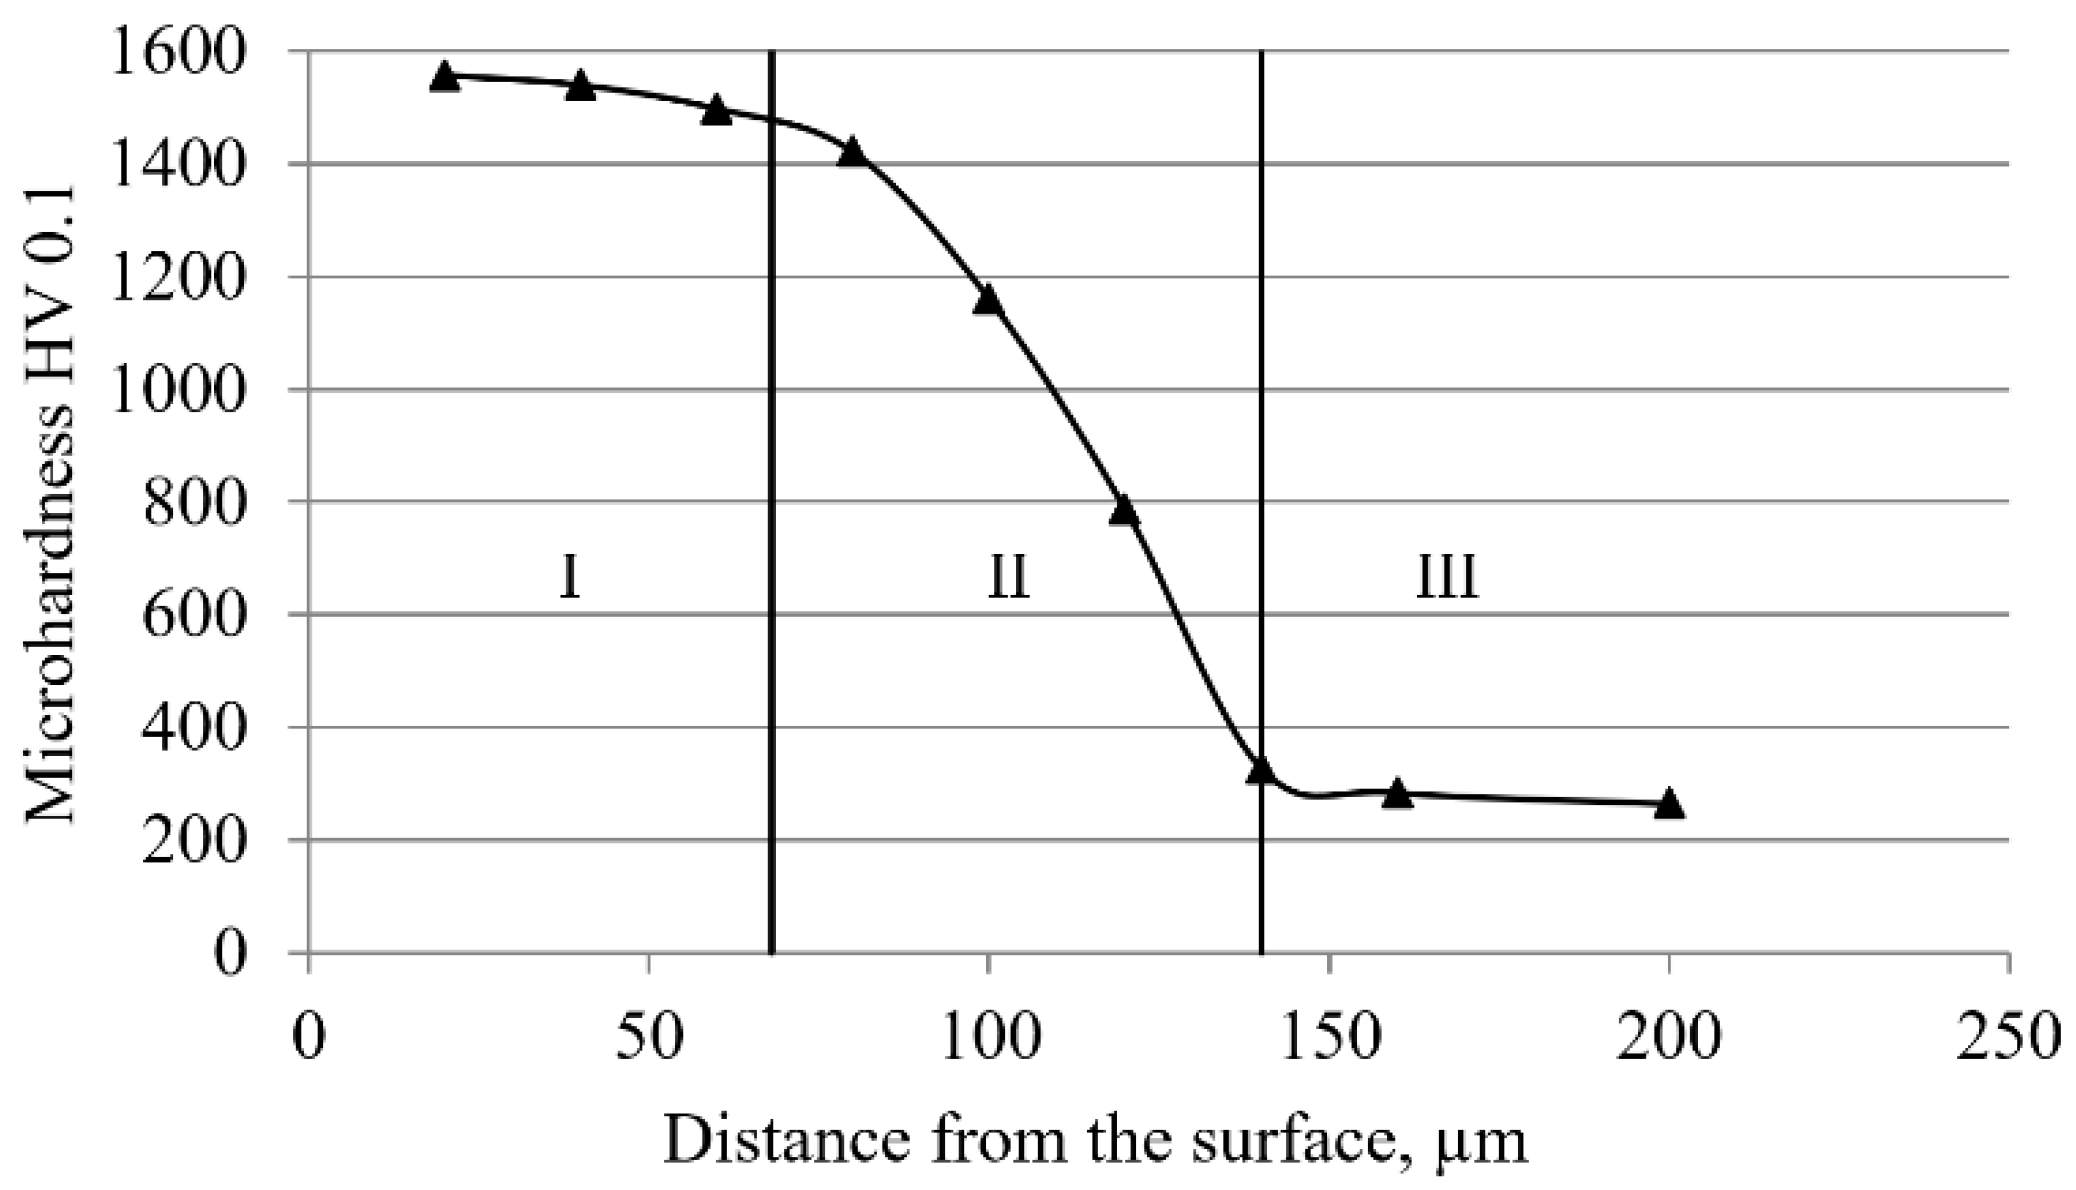
- Based on the volume fraction and the hardness of the boride phase and the base material, the cross-sectional hardness was determined. It was found that the hardness of the base material in the diffusion zone is higher compared to the core due to the higher amount of carbon directly below the boride layer. The highest hardness (approximately 1554 HV) was achieved on the sample surface due to the high share of the boride phase. As the distance from the surface increases, the hardness decreases, primarily due to the lower share of the boride phase, but also due to the decreasing hardness of the base material, which approaches the hardness values in the core as the distance from the surface increases.
- -
- At the distance corresponding to the average thickness of the boride layer, there is 22–38% of the boride phase, and the achieved hardness at these depths is 570–840 HV. The difference between the surface hardness and hardness at the depth corresponding to the average layer thickness is even greater in layers with more pronounced saw-tooth morphology.
- -
- Based on the surface hardness, it is possible to divide the layer into three areas. Area I is the area with extremely high hardness (due to the large share of boride phase), and this area corresponds to the compact part of the layer. Area II is the area where there is a significant drop in hardness (primarily due to the lower share of boride phase), and this area corresponds to the toothed part of the layer. Area III is the area of the base material.
- -
- The statistical analysis showed that there is a functional relationship between the boronizing parameters and the observed properties of the boride layer (volume fraction of boride phase, thickness of the compact part of the layer, and thickness of the toothed part of the layer). The results showed that the boronizing temperature has a stronger effect on the observed properties than the boronizing duration.
- -
- As a result of the regression analysis, three regression equations (for the prediction of the volume fraction of the boride phase at the considered depth, the thickness of the compact part, and the thickness of the toothed part of the boride layer on C70W2 steel as a function of the boronizing temperature and duration) were estimated.
- -
- The effective layer thickness can be determined based on the depth at which the desired share of boride phase is obtained.
- -
- Based on the volume fraction of the boride phase, it is possible to divide the layer into the compact and toothed parts, and on this basis, monitor the influence of the parameters on the layer morphology.
- -
- It is possible to accurately determine the changes in the cross-sectional hardness, which opens the possibility of defining the effective layer thickness as the depth at which the desired hardness is achieved.
Author Contributions
Funding
Institutional Review Board Statement
Informed Consent Statement
Data Availability Statement
Conflicts of Interest
References
- Mebarek, B.; Keddam, M. A fuzzy neural network approach for modeling the growth kinetics of FeB and Fe2B layers during the boronizing process. Mater. Tech. 2018, 106, 603. [Google Scholar] [CrossRef]
- Jurci, P.; Hudáková, M. Characterization of Microstructure and Fracture Performance of Boronized H11 Grade Hot-Work Tool Steel. Mater. Perform. Charact. 2020, 9, 20190086. [Google Scholar] [CrossRef]
- Carrera-Espinoza, R.; Figueroa-López, U.; Martínez-Trinidad, J.; Campos-Silva, I.; Hernández-Sánchez, E.; Motallebzadehd, A. Tribological behavior of borided AISI 1018 steel under linear reciprocating sliding conditions. Wear 2016, 362–363, 1–7. [Google Scholar] [CrossRef]
- Kaouka, A.; Allaoui, O.; Keddam, M. Growth kinetics of the boride layers formed on SAE 1035 steel. Mater. Tech. 2013, 101, 705. [Google Scholar] [CrossRef]
- Kayali, Y. Investigation of diffusion kinetics of borided AISI P20 steel in microwave furnace. Vacuum 2015, 121, 129–134. [Google Scholar] [CrossRef]
- Günen, A. Properties and high temperature dry sliding wear behavior of boronized Inconel 718. Metall. Mater. Trans. A 2019, 51, 927–939. [Google Scholar] [CrossRef]
- Karakaş, M.S.; Günen, A.; Kanca, E.; Yilmaz, E. Boride layer growth kinetics of AISI H13 steel borided with nano-sized powders. Arch. Metall. Mater. 2018, 63, 159–165. [Google Scholar] [CrossRef]
- Campos, I.; Ramírez Sandoval, G.; Figueroa, U.; Martínez, J.; Morales, O. Evaluation of boron mobility on the phases FeB, Fe2B and diffusion zone in AISI 1045 and M2 steels. Appl. Surf. Sci. 2007, 253, 3469–3475. [Google Scholar] [CrossRef]
- Velázquez-Altamirano, J.C.; Torres-Avila, I.P.; Teran-Méndez, G.; Capula-Colindres, S.I.; Cabrera-Sierra, R.; Carrera-Espinoza, R.; Hernández-Sánchez, E. A stochastic model and investigation into the probability distribution of the thickness of boride layers formed on low-carbon steel. Coatings 2019, 9, 756. [Google Scholar] [CrossRef] [Green Version]
- Allaoui, O.; Bouaouadja, N.; Saindernan, G. Characterization of boronized layers on a XC38 steel. Surf. Coat. Technol. 2006, 201, 3475–3482. [Google Scholar] [CrossRef]
- Ruiz-Trabolsi, P.A.; Velázquez, J.C.; Orozco-Álvarez, C.; Carrera-Espinoza, R.; Yescas-Hernández, J.A.; González-Arévalo, N.E.; Hernández-Sánchez, E. Kinetics of the boride layers obtained on AISI 1018 steel by considering the amount of matter involved. Coatings 2021, 11, 259. [Google Scholar] [CrossRef]
- Kartal, G.; Eryilmaz, O.L.; Krumdick, G.; Erdemir, A.; Timura, S. Kinetics of electrochemical boriding of low carbon steel. Appl. Surf. Sci. 2011, 257, 6928–6934. [Google Scholar] [CrossRef]
- Yang, H.; Wu, X.; Cao, G.; Yang, Z. Enhanced boronizing kinetics and high temperature wear resistance of H13 steel with boriding treatment assisted by air blast shot peening. Surf. Coat. Technol. 2016, 307, 506–516. [Google Scholar] [CrossRef]
- Genel, K. Boriding kinetics of H13 steel. Vacuum 2006, 80, 451–457. [Google Scholar] [CrossRef]
- Yu, L.G.; Chen, X.J.; Khor, K.A.; Sundararajan, G. FeB/Fe2B phase transformation during SPS pack-boriding: Boride layer growth kinetics. Acta Mater. 2005, 53, 2361–2368. [Google Scholar] [CrossRef]
- Kul, M.; Danacı, I.; Gezer, Ş.; Karaca, B. Effect of boronizing composition on hardness of boronized AISI 1045 steel. Mater. Lett. 2020, 279, 128510. [Google Scholar] [CrossRef]
- Tabur, M.; Izciler, M.; Gul, F.; Karacan, I. Abrasive wear behavior of boronized AISI 8620 steel. Wear 2009, 266, 1106–1112. [Google Scholar] [CrossRef]
- Hernández-Sánchez, E.; Velázquez, J.C. Kinetics of growth of iron boride layers on a low-carbon steel surface. In Laboratory Unit Operations and Experimental Methods in Chemical Engineering; Basha, O.M., Badie, M., Eds.; IntechOpen: London, UK, 2018; p. 60493. [Google Scholar] [CrossRef] [Green Version]
- Campos-Silvaa, I.; Balankin, A.S.; Sierra, A.H.; López-Perrusquia, N.; Escobar-Galindo, R.; Morales-Matamoros, D. Characterization of rough interfaces obtained by boriding. Appl. Surf. Sci. 2008, 255, 2596–2602. [Google Scholar] [CrossRef]
- Li, C.; Shen, B.; Li, G.; Yang, C. Effect of boronizing temperature and time on microstructure and abrasion wear resistance of Cr12Mn2V2 high chromium cast iron. Surf. Coat. Technol. 2008, 202, 5882–5886. [Google Scholar] [CrossRef]
- Keddam, M. Computer simulation of monolayer growth kinetics of Fe2B phase during the paste-boriding process: Influence of the paste thickness. Appl. Surf. Sci. 2006, 253, 757–761. [Google Scholar] [CrossRef]
- Jain, V.; Sundararajan, G. Influence of the pack thickness of the boronizing mixture on the boriding of steel. Surf. Coat. Technol. 2002, 149, 21–26. [Google Scholar] [CrossRef]
- Campos, I.; Torres, R.; Ramírez, G.; Ganem, R.; Martínez, J. Growth kinetics of iron boride layers: Dimensional analysis. Appl. Surf. Sci. 2006, 252, 8662–8667. [Google Scholar] [CrossRef]
- Ortiz-Domínguez, M.; Flores-Rentería, M.Á.; Keddam, M.; Elias-Espinosa, M.; Damián-Mejía, O.; Aldana-González, J.I.; Zuno-Silva, J.; Medina-Moreno, S.A.; González-Reyes, J.G. Simulation of growth kinetics of Fe2B layers formed on gray cast iron during the powder-pack boriding. Mater. Tehnol. 2014, 48, 905–916. [Google Scholar]
- Panda, J.N.; Wong, B.C.; Medvedovski, E.; Egberts, P. Enhancement of tribo-corrosion performance of carbon steel through boronizing and BN-based coatings. Tribol. Int. 2021, 153, 106666. [Google Scholar] [CrossRef]
- Matijević, B. Toplinsko difuzijski proces boriranja čelika. Master’s Thesis, Faculty of Mechanical Engineering and Naval Architecture in Zagreb, Zagreb, Croatia, 1992. [Google Scholar]
- Béjar, M.A.; Moreno, E. Abrasive wear resistance of boronized carbon and low-alloy steels. J. Mater. Process. Technol. 2006, 173, 352–358. [Google Scholar] [CrossRef]
- Novosel, M.; Cajner, F.; Krumes, D. Alatni materijali. Strojarski fakultet u Slavonskom Brodu: Slavonski Brod, Croatia, 1996; pp. 105–127. [Google Scholar]
- Pauše, Ž. Uvod u Matematičku statistiku; Školska Knjiga: Zagreb, Croatia, 1993; pp. 178–342. [Google Scholar]
- Milinović, A.; Krumes, D.; Marković, R. An investigation of boride layers growth kinetics on carbon steels. Teh. Vjesn. 2012, 19, 27–31. [Google Scholar]
- TIBCO Software Inc. Data ScienceWorkbench, Version 14. 2020. Available online: http://tibco.com (accessed on 11 March 2022).
- Milinović, A.; Marušić, V.; Samardžić, I. Research into boride layers: Growth kinetics on C45 carbon steel. Metalurgija 2016, 55, 671–674. [Google Scholar]
- Atık, E.; Yunker, U.; Merıç, C. The effects of conventional heat treatment and boronizing on abrasive wear and corrosion of SAE 1010, SAE 1040, D2 and 304 steels. Tribol. Int. 2003, 36, 155–161. [Google Scholar] [CrossRef]
- Balusamy, T.; Sankara Narayanan, T.S.N.; Ravichandran, K.; Song Park, I.; Lee, M.H. Pack boronizing of AISI H11 tool steel: Role of surface mechanical attrition treatment. Vacuum 2013, 97, 36–43. [Google Scholar] [CrossRef]
- Erdoğan, A. Investigation of high temperature dry sliding behavior of borided H13 hot work tool steel with nanoboron powder. Surf. Coat. Technol. 2019, 357, 886–895. [Google Scholar] [CrossRef]
- Meric, C.; Sahin, S.; Backir, B.; Koksal, N.S. Investigation of the boronizing effect on the abrasive wear behavior in cast irons. Mater. Des. 2006, 27, 751–757. [Google Scholar] [CrossRef]
- Gök, M.S.; Küçük, Y.; Erdoğan, A.; Öge, M.; Kancad, E.; Günen, A. Dry sliding wear behavior of borided hot-work tool steel at elevated temperatures. Surf. Coat. Technol. 2017, 328, 54–62. [Google Scholar] [CrossRef]
- Yoon, J.H.; Jee, Y.K.; Lee, S.Y. Plasma paste boronizing treatment of the stainless steel AISI 304. Surf. Coat. Technol. 1999, 112, 71–75. [Google Scholar] [CrossRef]
- Chen, T.; Koyama, S.; Yu, L. Improvement of mechanical, tribological, and fricative reduction properties of pure titanium by boriding. Appl. Sci. 2021, 11, 4862. [Google Scholar] [CrossRef]
- Delai, O.; Xia, C.; Shiqiang, L. Growth kinetics of the FeB/Fe2B boride layer on the surface of 4Cr5MoSiV1 steel: Experiments and modelling. J. Mater. Res. Technol. 2021, 11, 1272–1280. [Google Scholar] [CrossRef]
- Milinović, A.; Krumes, D.; Kladarić, I. Research of boride layers growth kinetics on C15 carbon steel. Int. J. Microstruct. Mater. Prop. 2014, 9, 38–49. [Google Scholar] [CrossRef]


| Steel | C | Si | Mn | P | S | Cu |
|---|---|---|---|---|---|---|
| C70W2 | 0.72 | 0.211 | 0.286 | 0.014 | 0.017 | - |
| Distance from the Surface, µm | ϑ = 870 °C | ϑ = 920 °C | ϑ = 970 °C | ||||||
|---|---|---|---|---|---|---|---|---|---|
| t = 4 h | t = 6 h | t = 8 h | t = 4 h | t = 6 h | t = 8 h | t = 4 h | t = 6 h | t = 8 h | |
| 0 | 100.0 | 100 | 100.0 | 100.0 | 100.0 | 100.0 | 100.0 | 100.0 | 100.0 |
| 20 | 98.4 | 99.2 | 99.9 | 100.0 | 100.0 | 100.0 | 100.0 | 100.0 | 100.0 |
| 40 | 81.3 | 90.2 | 93.3 | 93.8 | 97.1 | 99.6 | 100.0 | 100.0 | 100.0 |
| 60 | 38.4 | 55.1 | 79.5 | 84.0 | 91.2 | 92.6 | 96.2 | 100.0 | 100.0 |
| 80 | 0 | 6.3 | 36.6 | 60.3 | 80.5 | 83.2 | 88.9 | 92.7 | 94.5 |
| 100 | 0 | 2.1 | 25.2 | 60.9 | 65.1 | 83.2 | 88.9 | 91.0 | |
| 120 | 0 | 0 | 35.3 | 35.7 | 65.7 | 85.1 | 85.3 | ||
| 140 | 3.5 | 6.3 | 38.6 | 74.9 | 83.2 | ||||
| 160 | 0 | 0 | 1.9 | 52.5 | 66.7 | ||||
| 180 | 0 | 24.0 | 33.1 | ||||||
| 200 | 0.8 | 2.9 | |||||||
| 220 | 0 | 0 | |||||||
| Boronizing Temperature, °C | Boronizing Duration, h | Experiment Design State | Thickness of the Compact Part of the Layer, μm | Average Boride Layer Thickness, μm [30] | Thickness of the Toothed Part of the Layer, μm |
|---|---|---|---|---|---|
| 870 | 4 | 1 | 27 | 61 ± 9 | 34 |
| 6 | 2 | 32 | 73 ± 9 | 40 | |
| 8 | 3 | 43 | 81 ± 10 | 38 | |
| 920 | 4 | 4 | 42 | 100 ± 8 | 57 |
| 6 | 5 | 53 | 129 ± 9 | 76 | |
| 8 | 6 | 58 | 129 ± 11 | 71 | |
| 970 | 4 | 7 | 73 | 148 ± 9 | 75 |
| 6 | 8 | 93 | 181 ± 12 | 88 | |
| 8 | 9 | 102 | 181 ± 10 | 79 |
| Distance from the Surface, µm | ϑ = 870 °C | ϑ = 920 °C | ϑ = 970 °C | ||||||
|---|---|---|---|---|---|---|---|---|---|
| t = 4 h | t = 6 h | t = 8 h | t = 4 h | t = 6 h | t = 8 h | t = 4 h | t = 6 h | t = 8 h | |
| 20 | 946 | ||||||||
| 40 | 858 | 904 | 1094 | 956 | 968 | ||||
| 60 | 421 | 620 | 897 | 941 | 882 | 938 | 922 | ||
| 80 | 279 | 312 | 501 | 753 | 857 | 819 | 829 | 944 | 933 |
| 100 | 272 | 285 | 293 | 343 | 546 | 469 | 764 | 833 | 863 |
| 120 | 254 | 283 | 277 | 278 | 364 | 321 | 591 | 736 | 812 |
| 140 | 265 | 271 | 266 | 283 | 285 | 339 | 678 | 808 | |
| 160 | 268 | 285 | 285 | 263 | 273 | 513 | 644 | ||
| 180 | 267 | 335 | 397 | ||||||
| 200 | 255 | 290 | 300 | ||||||
| Core | 254 | 250 | 241 | 242 | 265 | 235 | 248 | 253 | 254 |
| Distance from the Surface, µm | ϑ = 870 °C | ϑ = 920 °C | ϑ = 970 °C | ||||||
|---|---|---|---|---|---|---|---|---|---|
| t = 4 h | t = 6 h | t = 8 h | t = 4 h | t = 6 h | t = 8 h | t = 4 h | t = 6 h | t = 8 h | |
| 20 | 1547 | 1545 | 1557 | 1557 | 1557 | ||||
| 40 | 1427 | 1494 | 1526 | 1520 | 1540 | 1552 | 1557 | ||
| 60 | 857 | 1136 | 1422 | 1459 | 1498 | 1512 | 1533 | 1557 | 1557 |
| 80 | 279 | 391 | 888 | 1238 | 1421 | 1433 | 1477 | 1513 | 1512 |
| 100 | 272 | 285 | 319 | 649 | 1161 | 1178 | 1424 | 1477 | 1481 |
| 120 | 283 | 277 | 278 | 788 | 762 | 1226 | 1435 | 1446 | |
| 140 | 265 | 271 | 266 | 328 | 365 | 809 | 1337 | 1369 | |
| 160 | 268 | 285 | 263 | 298 | 1061 | 1123 | |||
| 180 | 267 | 628 | 676 | ||||||
| 200 | 290 | 300 | |||||||
| Core | 254 | 250 | 241 | 242 | 265 | 235 | 248 | 253 | 254 |
| Effect | Sum of Squares SS | Degrees of Freedom df | Mean Square MS | F-Value | p-Value |
|---|---|---|---|---|---|
| Intercept | 1180.448 | 1 | 1180.448 | 20.277 | 0.000046 |
| (1) Temperature | 1238.853 | 1 | 1238.853 | 21.281 | 0.000032 |
| Temperature2 | 1250.232 | 1 | 1250.232 | 21.476 | 0.000030 |
| (2) Duration | 696.147 | 1 | 696.147 | 11.958 | 0.001183 |
| Duration2 | 374.437 | 1 | 374.437 | 6.432 | 0.014669 |
| (3) Distance from the surface | 8599.073 | 1 | 8599.073 | 147.711 | 0.000000 |
| Distance from the surface2 | 5605.214 | 1 | 5605.214 | 96.284 | 0.000000 |
| (1) × (2) | 520.616 | 1 | 520.616 | 8.943 | 0.004463 |
| (1) × (3) | 7643.142 | 1 | 7643.142 | 131.291 | 0.000000 |
| (2) × (3) | 2045.926 | 1 | 2045.926 | 35.144 | 0.000000 |
| Error | 2677.912 | 46 | 58.215 |
| Factor | Sum of Squares SS | Degrees of Freedom df | Mean Square MS | F-Value | p-Value | Eta Squared |
|---|---|---|---|---|---|---|
| (1) Temperature L + Q | 4840.170 | 2 | 2420.085 | 124.9680 | 0.000054 | 0.874 |
| (2) Duration L | 598.494 | 1 | 598.494 | 30.9049 | 0.002590 | 0.108 |
| Error | 96.828 | 5 | 19.366 | 0.017 | ||
| Total | 5535.491 | 8 |
| Effect | Sum of Squares SS | Degrees of Freedom df | Mean Square MS | F-Value | p-Value |
|---|---|---|---|---|---|
| Intercept | 175.655 | 1 | 175.6551 | 9.0705 | 0.029697 |
| (1) Temperature | 201.919 | 1 | 201.9190 | 10.42667 | 0.023231 |
| Temperature2 | 233.369 | 1 | 233.3692 | 12.0507 | 0.017822 |
| (3) Duration | 598.494 | 1 | 598.4937 | 30.9049 | 0.002590 |
| Error | 96.828 | 5 |
| Sum of Squares SS | Degrees of Freedom df | Mean Square MS | F-Value | p-Value | Eta Squared | |
|---|---|---|---|---|---|---|
| (1) Temperature L + Q | 2989.536 | 2 | 1494.768 | 120.0107 | 0.000269 | 0.913 |
| (2) Duration L + Q | 236.729 | 2 | 118.365 | 9.5032 | 0.030229 | 0.072 |
| Error | 49.821 | 4 | 12.455 | 0.015 | ||
| Total | 3276.087 | 8 |
| Effect | Sum of Squares SS | Degrees of Freedom df | Mean Square MS | F-Value | p-Value |
|---|---|---|---|---|---|
| Intercept | 212.061 | 1 | 212.061 | 17.0258 | 0.014538 |
| (1) Temperature | 186.121 | 1 | 186.121 | 14.9431 | 0.018060 |
| Temperature2 | 164.105 | 1 | 164.105 | 13.1755 | 0.022164 |
| (3) Duration | 174.550 | 1 | 174.550 | 14.0142 | 0.020059 |
| Duration2 | 153.654 | 1 | 153.654 | 12.3364 | 0.024620 |
| Error | 49.821 | 4 | 12.455 |
| Distance from the Surface, µm | ϑ = 870 °C | ϑ = 920 °C | ϑ = 970 °C | ||||||
|---|---|---|---|---|---|---|---|---|---|
| t = 4 h | t = 6 h | t = 8 h | t = 4 h | t = 6 h | t = 8 h | t = 4 h | t = 6 h | t = 8 h | |
| 0 | 100.0 | 100.0 | 100.0 | 100.0 | 100.0 | 100.0 | 100.0 | 100.0 | 100.0 |
| 20 | 87.2 | 94.7 | 95.0 | 95.9 | 100.0 | 100.0 | 100.0 | 100.0 | 100.0 |
| 40 | 55.9 | 73.6 | 77.0 | 83.1 | 92.0 | 96.4 | 97.9 | 100.0 | 100.0 |
| 60 | 28.2 | 49.6 | 56.8 | 64.1 | 81.9 | 81.8 | 85.9 | 96.0 | 99.1 |
| 80 | 5.5 | 28.1 | 38.0 | 44.6 | 70.3 | 72.5 | 73.8 | 87.3 | 91.1 |
| 100 | 0 | 14.8 | 19.9 | 21.3 | 56.9 | 60.4 | 63.5 | 76.8 | 80.4 |
| 120 | 0 | 0 | 9.3 | 44.2 | 46.0 | 53.0 | 74.6 | 76.4 | |
| 140 | 0 | 31.1 | 34.3 | 36.6 | 65.2 | 67.9 | |||
| 160 | 9.9 | 16.0 | 21.9 | 50.3 | 57.9 | ||||
| 180 | 0 | 0 | 4.6 | 34.3 | 42.9 | ||||
| 200 | 0 | 18.5 | 27.9 | ||||||
| 220 | 5.7 | 15.2 | |||||||
| 240 | 0 | 3.6 | |||||||
| 260 | 0 | ||||||||
| dav, µm | 70 | 98 | 104 | 118 | 157 | 158 | 173 | 211 | 239 |
| Distance from the Surface, µm | ϑ = 870 °C | ϑ = 920 °C | ϑ = 970 °C | ||||||
|---|---|---|---|---|---|---|---|---|---|
| t = 4 h | t = 6 h | t = 8 h | t = 4 h | t = 6 h | t = 8 h | t = 4 h | t = 6 h | t = 8 h | |
| 20 | 764 | 824 | 873 | 876 | |||||
| 40 | 448 | 490 | 690 | 721 | 856 | 935 | 946 | ||
| 60 | 204 | 364 | 442 | 496 | 680 | 820 | 625 | 925 | 863 |
| 80 | 160 | 250 | 216 | 321 | 500 | 488 | 495 | 699 | 728 |
| 100 | 143 | 171 | 150 | 172 | 371 | 300 | 331 | 625 | 626 |
| 120 | 136 | 140 | 132 | 246 | 239 | 257 | 476 | 459 | |
| 140 | 140 | 202 | 184 | 207 | 422 | 391 | |||
| 160 | 131 | 159 | 129 | 155 | 294 | 273 | |||
| 180 | 132 | 238 | 242 | ||||||
| 200 | 187 | 196 | |||||||
| 220 | 155 | ||||||||
| Distance from the Surface, µm | ϑ = 870 °C | ϑ = 920 °C | ϑ = 970 °C | ||||||
|---|---|---|---|---|---|---|---|---|---|
| t = 4 h | t = 6 h | t = 8 h | t = 4 h | t = 6 h | t = 8 h | t = 4 h | t = 6 h | t = 8 h | |
| 0 | 1541 | 1541 | 1541 | 1541 | |||||
| 20 | 1441 | 1503 | 1508 | 1513 | 1541 | 1541 | 1541 | ||
| 40 | 1059 | 1263 | 1345 | 1402 | 1486 | 1519 | 1528 | 1541 | 1541 |
| 60 | 581 | 948 | 1067 | 1165 | 1384 | 1410 | 1412 | 1516 | 1535 |
| 80 | 236 | 613 | 719 | 865 | 1232 | 1252 | 1266 | 1434 | 1468 |
| 100 | 143 | 374 | 427 | 463 | 1037 | 1049 | 1099 | 1329 | 1362 |
| 120 | 136 | 140 | 132 | 254 | 819 | 838 | 938 | 1271 | 1285 |
| 140 | 619 | 649 | 695 | 1151 | 1172 | ||||
| 160 | 296 | 355 | 459 | 921 | 1007 | ||||
| 180 | 130 | 129 | 197 | 685 | 799 | ||||
| 200 | 437 | 571 | |||||||
| 220 | 211 | 366 | |||||||
| 240 | 177 | ||||||||
| Core | 128 | 123 | 126 | 123 | 126 | 125 | 126 | 129 | 126 |
Publisher’s Note: MDPI stays neutral with regard to jurisdictional claims in published maps and institutional affiliations. |
© 2022 by the authors. Licensee MDPI, Basel, Switzerland. This article is an open access article distributed under the terms and conditions of the Creative Commons Attribution (CC BY) license (https://creativecommons.org/licenses/by/4.0/).
Share and Cite
Milinović, A.; Stojšić, J.; Kladarić, I.; Matijević, B. Evaluation of Boride Layers on C70W2 Steel Using a New Approach to Characterization of Boride Layers. Materials 2022, 15, 3891. https://doi.org/10.3390/ma15113891
Milinović A, Stojšić J, Kladarić I, Matijević B. Evaluation of Boride Layers on C70W2 Steel Using a New Approach to Characterization of Boride Layers. Materials. 2022; 15(11):3891. https://doi.org/10.3390/ma15113891
Chicago/Turabian StyleMilinović, Andrijana, Josip Stojšić, Ivica Kladarić, and Božidar Matijević. 2022. "Evaluation of Boride Layers on C70W2 Steel Using a New Approach to Characterization of Boride Layers" Materials 15, no. 11: 3891. https://doi.org/10.3390/ma15113891