
Influence of Surface Roughness on Biodegradability and Cytocompatibility of High-Purity Magnesium


 ,
,  and
and 
Abstract
:1. Introduction
2. Materials and Methods
2.1. Specimen Preparation
2.2. Surface Characterization
2.3. Immersion Test

| Composition | Concentration |
|---|---|
| Sodium chloride | 0.40 g/L |
| Potassium chloride | 0.40 g/L |
| Calcium chloride dehydrate | 0.79 g/L |
| Sodium dihydrogen phosphate dihydrate | 0.78 g/L |
| Urea | 1.00 g/L |
| Sodium sulfide | 0.05 g/L |
2.4. Cytotoxicity Test
2.4.1. Cell Culture
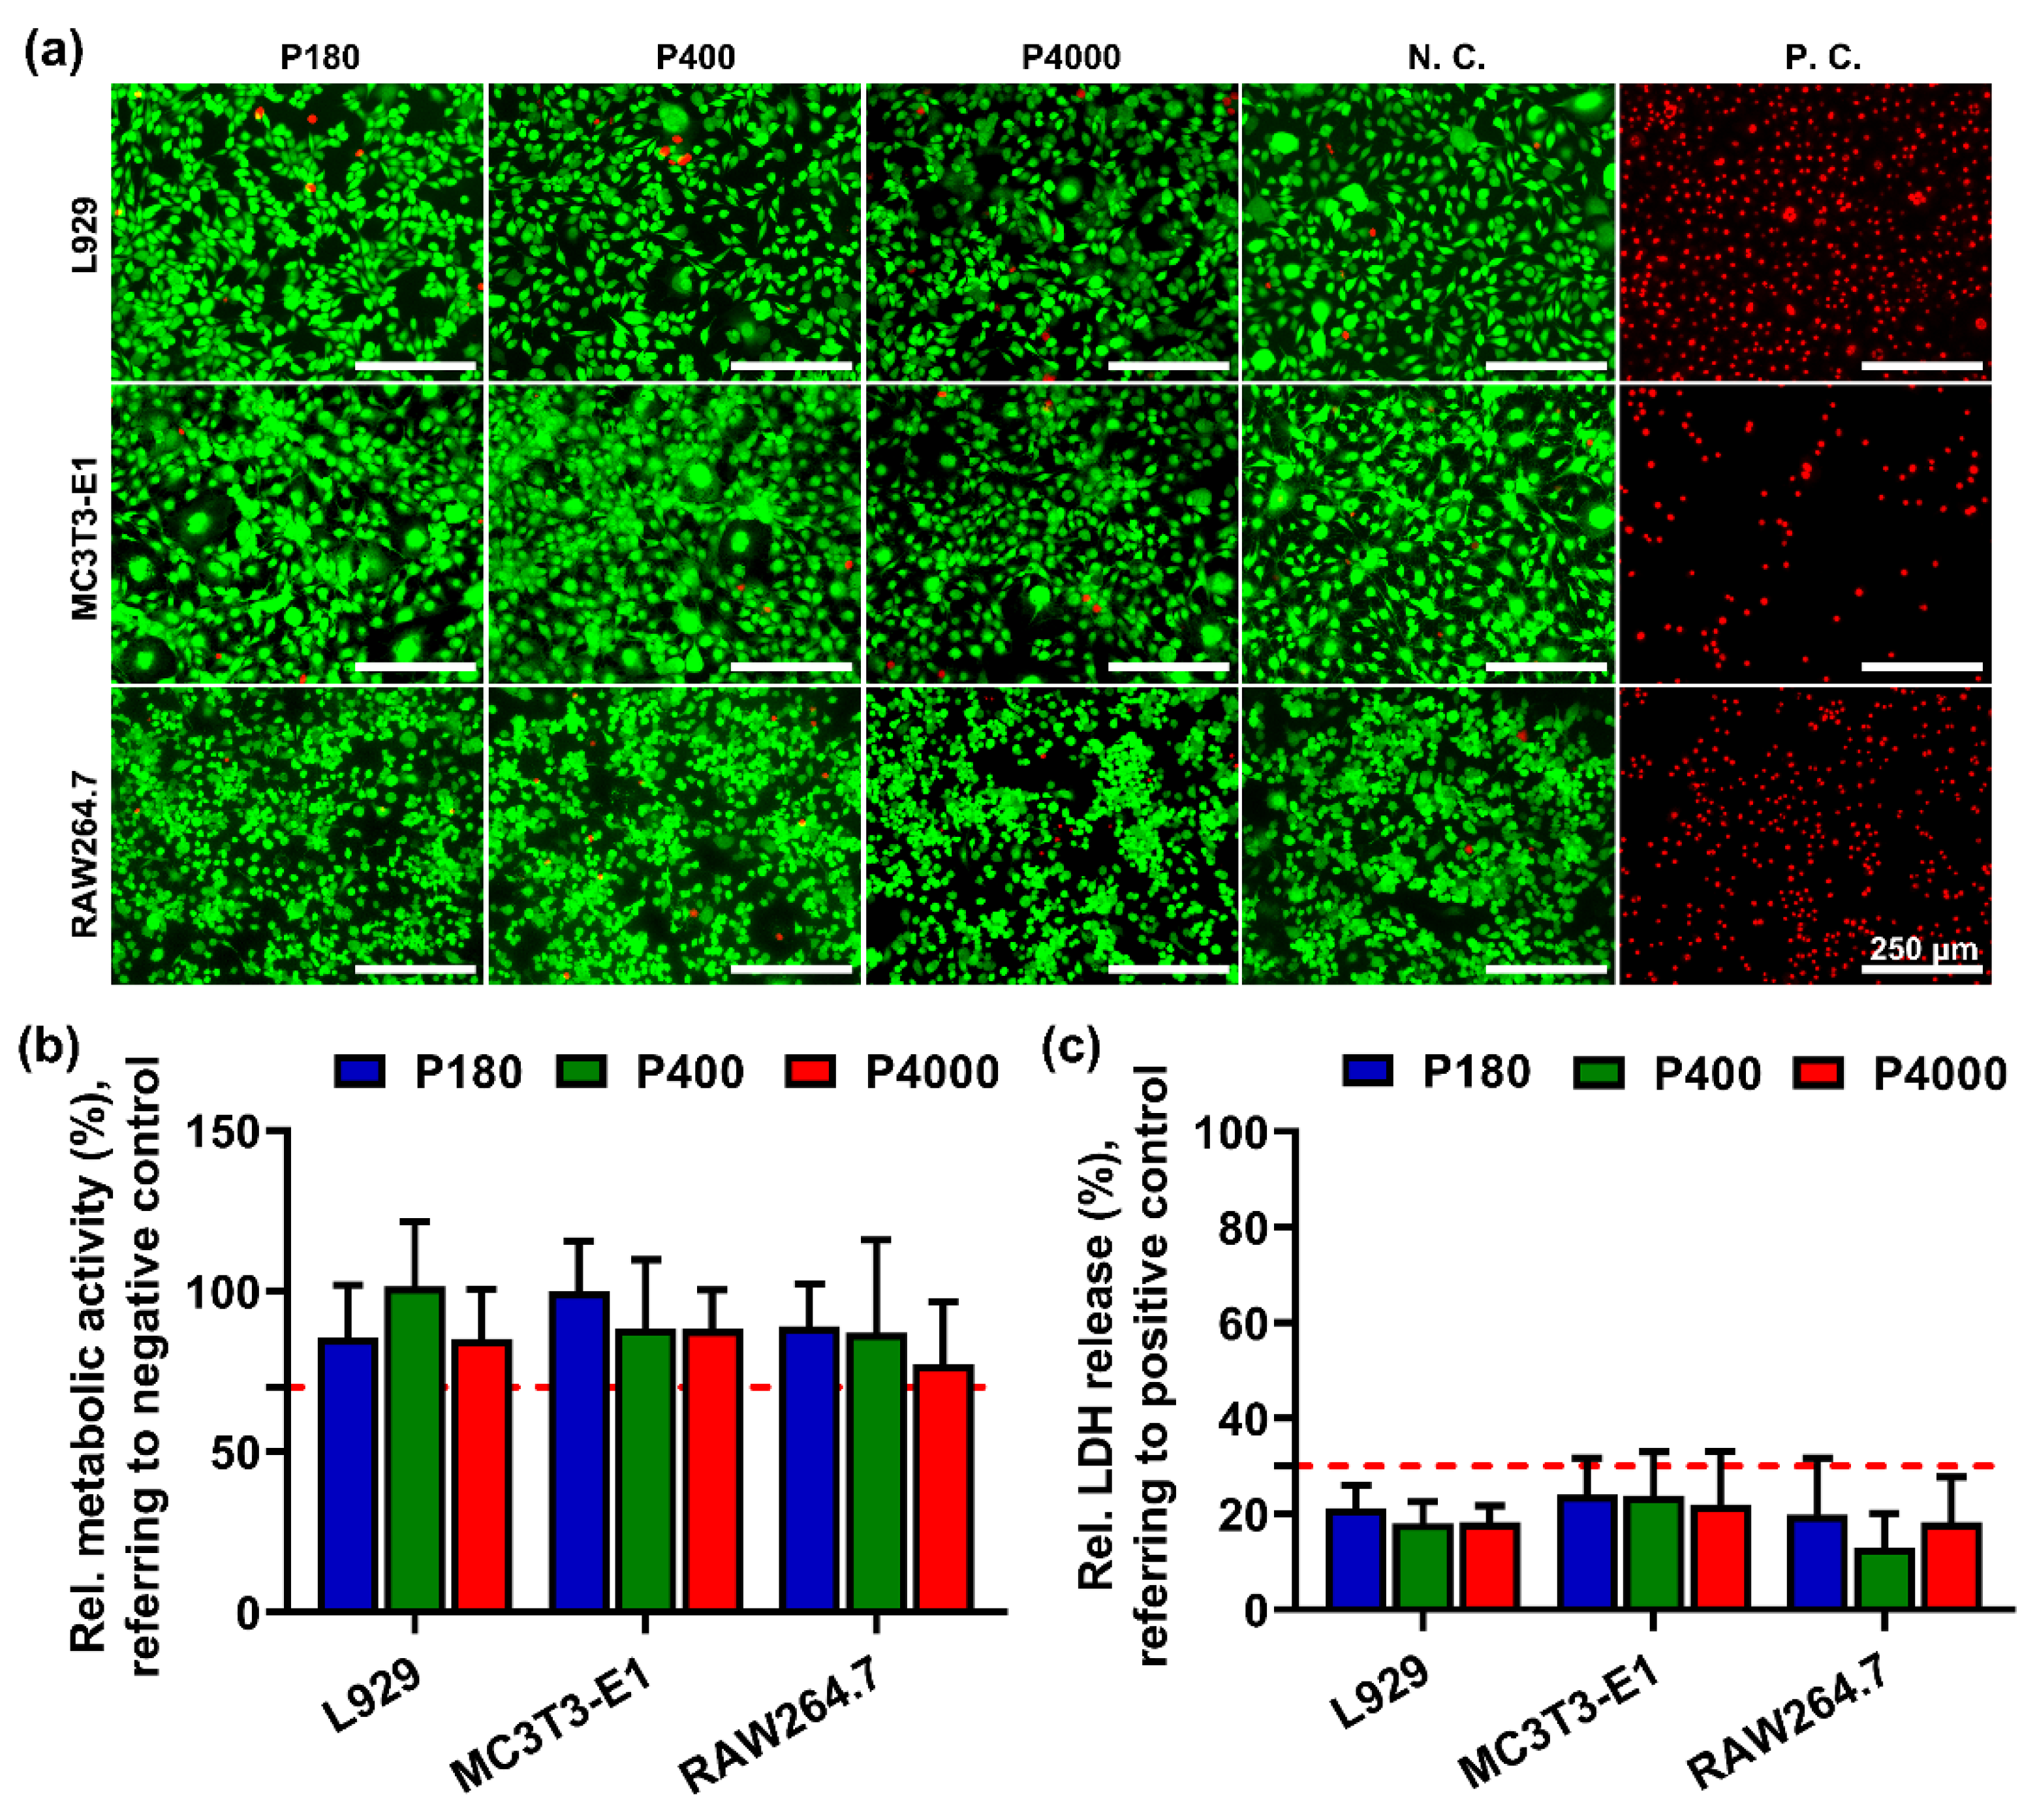
2.4.2. Extract Test
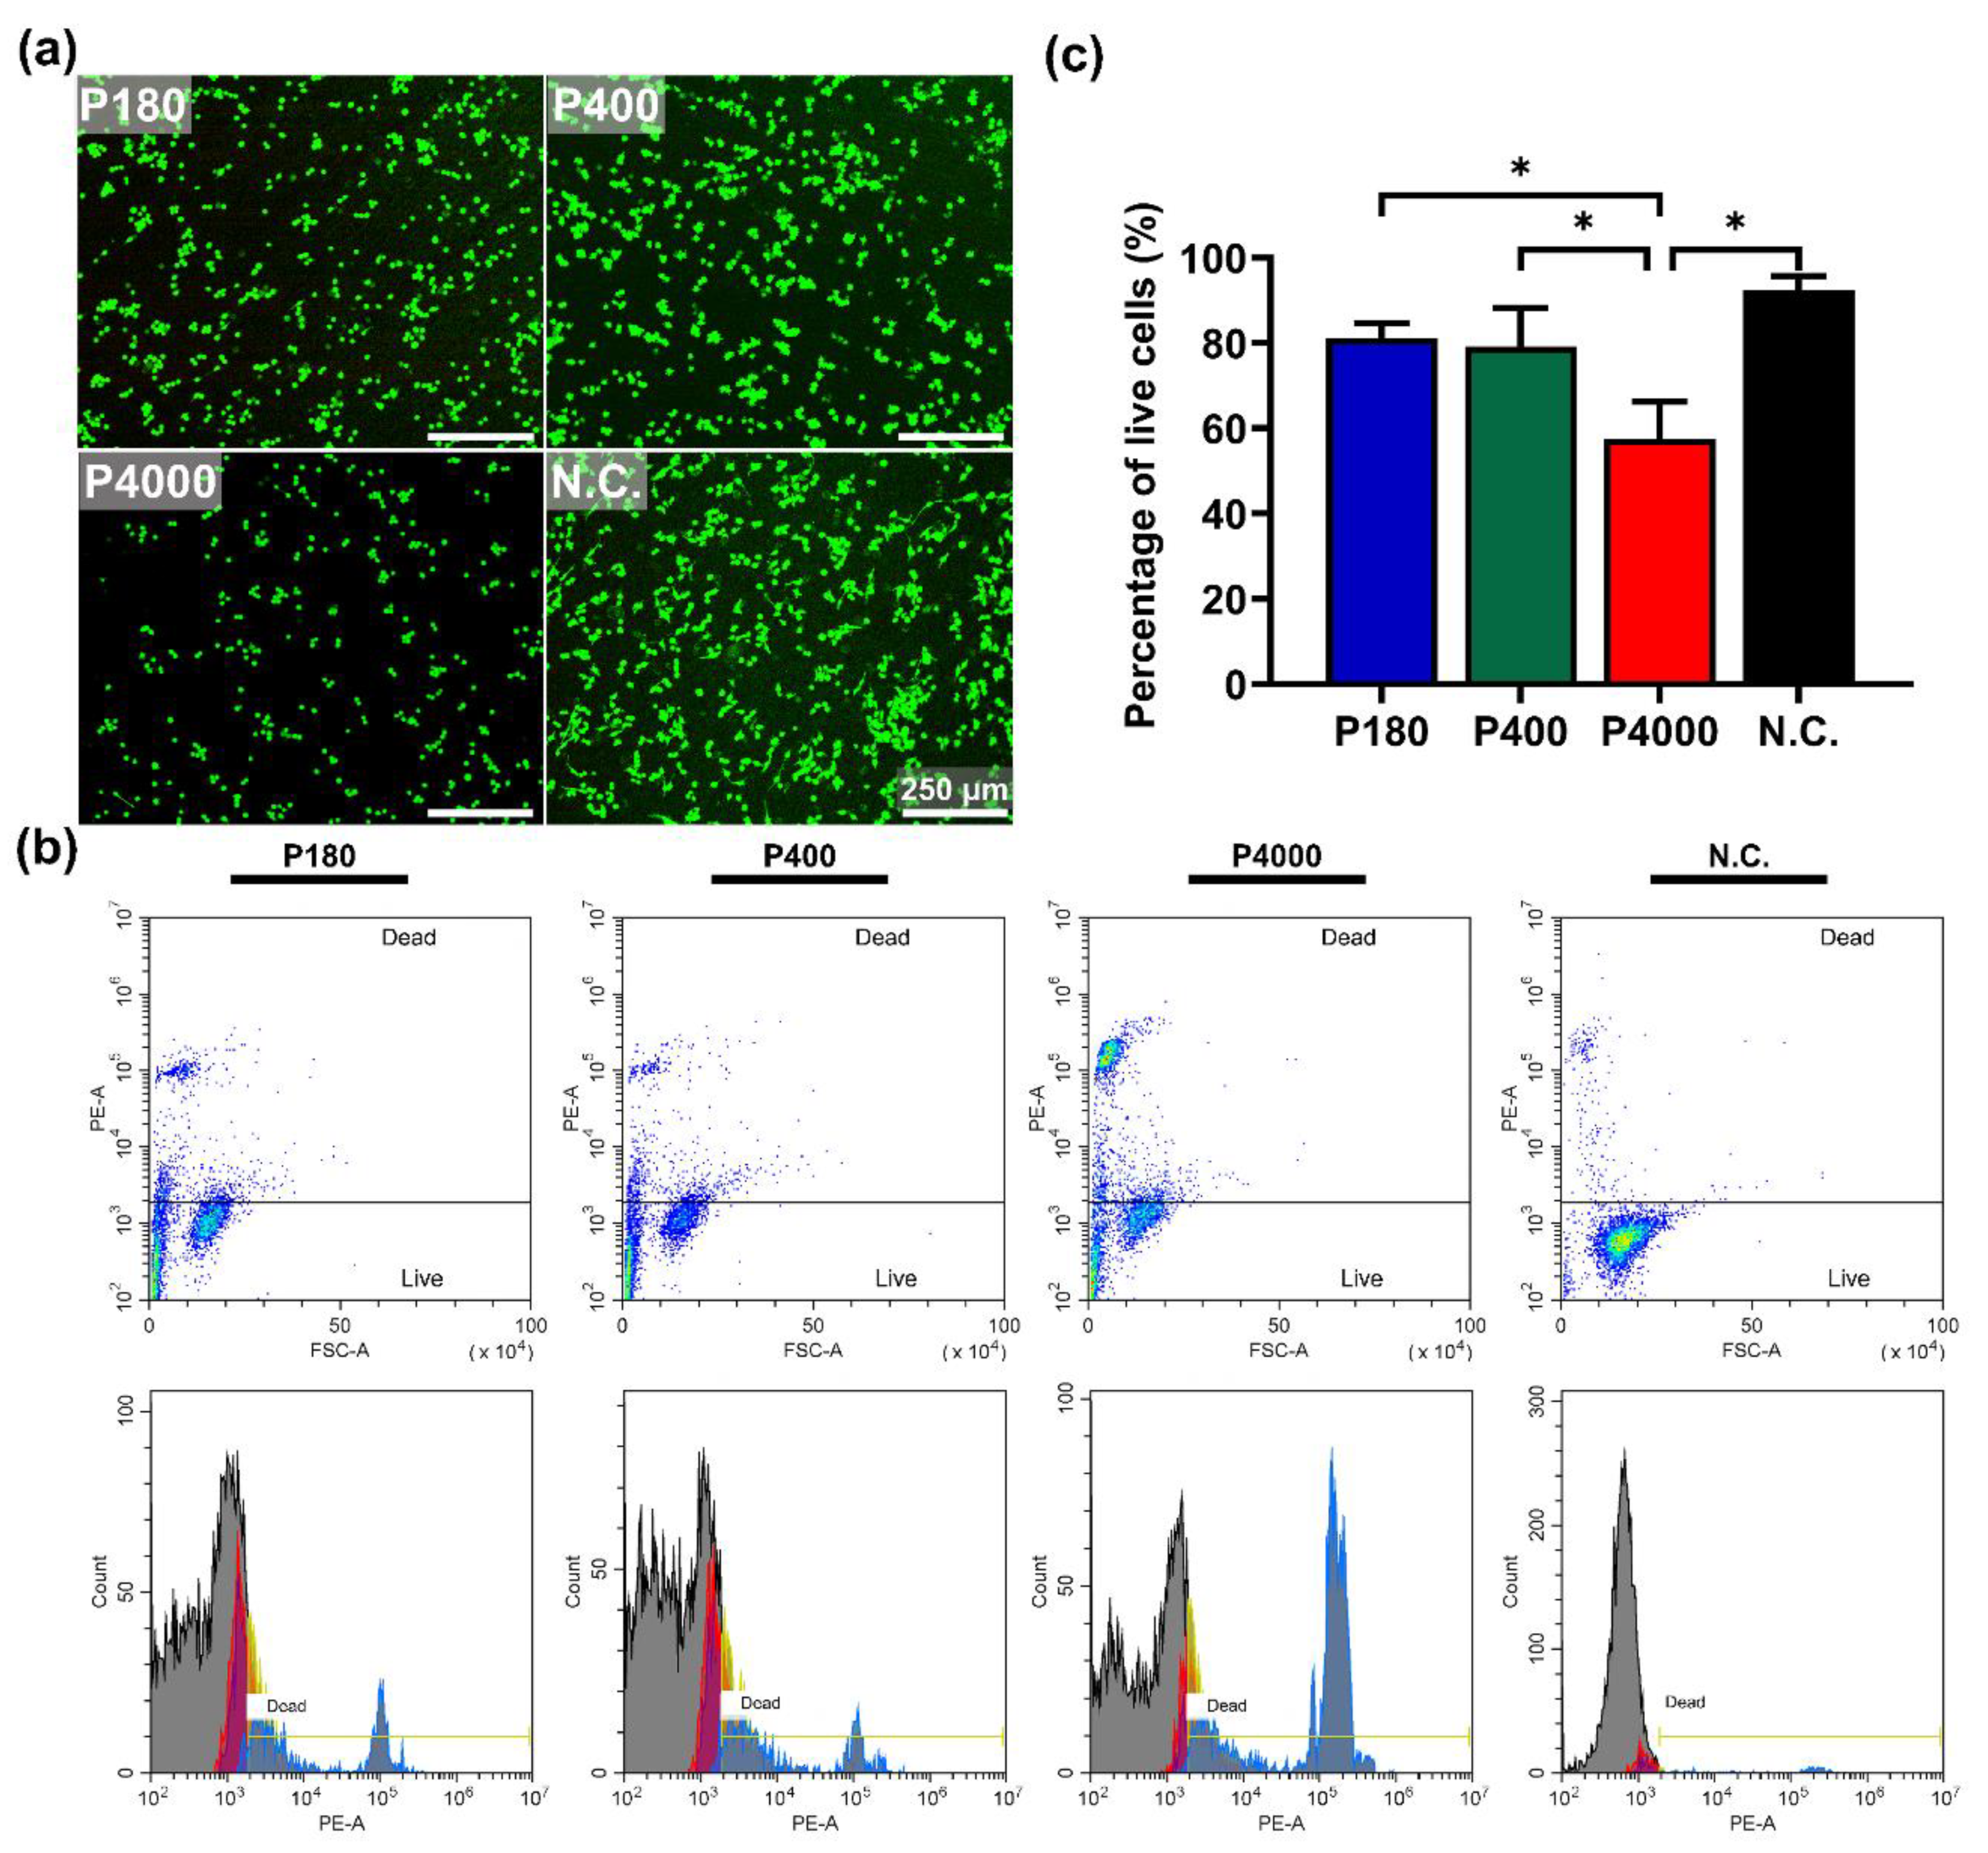
2.4.3. Direct Contact Test
2.5. Statistical Analysis
3. Results
3.1. Surface Morphology and Roughness

3.2. In Vitro Degradation Behavior
3.3. Cytocompatibility Evaluation
4. Discussion
4.1. Biodegradability Influenced by Surface Roughness
4.2. Cytocompatibility Affected by Surface Roughness
5. Conclusions
- With increasing surface roughness, the degradation rate of the Mg specimen in the DMEM with FBS was significantly increased. However, no marked increase was observed in the degradation rate when Mg was immersed in the artificial saliva.
- The degradation mode and the products of high-purity Mg were not obviously affected by the surface roughness.
- The extract test revealed that Mg extracts derived from different surface roughness did not exhibit any cytotoxic effect on the L929 fibroblast, the MC3T3-E1 preosteoblast, and the RAW264 macrophage.
- The direct contact test demonstrated that the surface roughness of high-purity Mg with the Sa value > 1.0 μm had the potential to improve cell attachment.
Author Contributions
Funding
Institutional Review Board Statement
Informed Consent Statement
Data Availability Statement
Acknowledgments
Conflicts of Interest
References
- Smith, B.T.; Shum, J.; Wong, M.; Mikos, A.G.; Young, S. Bone Tissue Engineering Challenges in Oral & Maxillofacial Surgery. In Engineering Mineralized and Load Bearing Tissues; Bertassoni, L.E., Coelho, P.G., Eds.; Springer International Publishing: Cham, Switzerland, 2015; pp. 57–78. [Google Scholar] [CrossRef]
- Louis, P.J. Vertical Ridge Augmentation Using Titanium Mesh. Oral Maxillofac. Surg. Clin. N. Am. 2010, 22, 353–368. [Google Scholar] [CrossRef] [PubMed]
- Trento, G.S.; Carvalho, P.H.A.; Macedo, D.V.; Gabrielli, M.A.C.; Monnazzi, M.S.; Pereira-Filho, V.A. Titanium mesh associated with rhBMP-2 in alveolar ridge reconstruction. Int. J. Oral Maxillofac. Surg. 2019, 48, 546–553. [Google Scholar] [CrossRef] [PubMed]
- Jones, J.R. Review of bioactive glass: From Hench to hybrids. Acta Biomater. 2013, 9, 4457–4486. [Google Scholar] [CrossRef] [PubMed]
- Ward, B.B.; Brown, S.E.; Krebsbach, P.H. Bioengineering strategies for regeneration of craniofacial bone: A review of emerging technologies. Oral Dis. 2010, 16, 709–716. [Google Scholar] [CrossRef] [PubMed] [Green Version]
- Bellucci, D.; Sola, A.; Gazzarri, M.; Chiellini, F.; Cannillo, V. A new hydroxyapatite-based biocomposite for bone replacement. Mater. Sci. Eng. C 2013, 33, 1091–1101. [Google Scholar] [CrossRef]
- Wu, L.; Ding, J. In vitro degradation of three-dimensional porous poly(d,l-lactide-co-glycolide) scaffolds for tissue engineering. Biomaterials 2004, 25, 5821–5830. [Google Scholar] [CrossRef]
- Rakhmatia, Y.D.; Ayukawa, Y.; Furuhashi, A.; Koyano, K. Current barrier membranes: Titanium mesh and other membranes for guided bone regeneration in dental applications. J. Prosthodont. Res. 2013, 57, 3–14. [Google Scholar] [CrossRef] [Green Version]
- Zheng, Y.F.; Gu, X.N.; Witte, F. Biodegradable metals. Mater. Sci. Eng. R. 2014, 77, 1–34. [Google Scholar] [CrossRef]
- Han, H.-S.; Loffredo, S.; Jun, I.; Edwards, J.; Kim, Y.-C.; Seok, H.-K.; Witte, F.; Mantovani, D.; Glyn-Jones, S. Current status and outlook on the clinical translation of biodegradable metals. Mater. Today 2019, 23, 57–71. [Google Scholar] [CrossRef]
- Liu, Y.; Zheng, Y.; Chen, X.-H.; Yang, J.-A.; Pan, H.; Chen, D.; Wang, L.; Zhang, J.; Zhu, D.; Wu, S.; et al. Fundamental Theory of Biodegradable Metals—Definition, Criteria, and Design. Adv. Funct. Mater. 2019, 29, 1805402. [Google Scholar] [CrossRef]
- He, L.Y.; Zhang, X.M.; Liu, B.; Tian, Y.; Ma, W.H. Effect of magnesium ion on human osteoblast activity. Braz. J. Med. Biol. Res. 2016, 49, e5257. [Google Scholar] [CrossRef]
- Jin, L.; Wu, J.; Yuan, G.; Chen, T. In vitro study of the inflammatory cells response to biodegradable Mg-based alloy extract. PLoS ONE 2018, 13, e0193276. [Google Scholar] [CrossRef]
- Zhao, D.; Witte, F.; Lu, F.; Wang, J.; Li, J.; Qin, L. Current status on clinical applications of magnesium-based orthopaedic implants: A review from clinical translational perspective. Biomaterials 2017, 112, 287–302. [Google Scholar] [CrossRef]
- Huang, S.; Wang, B.; Zhang, X.; Lu, F.; Wang, Z.; Tian, S.; Li, D.; Yang, J.; Cao, F.; Cheng, L.; et al. High-purity weight-bearing magnesium screw: Translational application in the healing of femoral neck fracture. Biomaterials 2020, 238, 119829. [Google Scholar] [CrossRef]
- Wu, S.; Jang, Y.-S.; Kim, Y.-K.; Kim, S.-Y.; Ko, S.-O.; Lee, M.-H. Surface Modification of Pure Magnesium Mesh for Guided Bone Regeneration: In Vivo Evaluation of Rat Calvarial Defect. Materials 2019, 12, 2684. [Google Scholar] [CrossRef] [Green Version]
- Lee, J.-W.; Han, H.-S.; Han, K.-J.; Park, J.; Jeon, H.; Ok, M.-R.; Seok, H.-K.; Ahn, J.-P.; Lee, K.E.; Lee, D.-H.; et al. Mantovani D. Long-term clinical study and multiscale analysis of in vivo biodegradation mechanism of Mg alloy. Proc. Natl. Acad. Sci. USA 2016, 113, 716–721. [Google Scholar] [CrossRef] [Green Version]
- Rendenbach, C.; Fischer, H.; Kopp, A.; Schmidt-Bleek, K.; Kreiker, H.; Stumpp, S.; Thiele, M.; Duda, G.; Hanken, H.; Beck-Broichsitter, B.; et al. Improved in vivo osseointegration and degradation behavior of PEO surface-modified WE43 magnesium plates and screws after 6 and 12 months. Mater. Sci. Eng. C 2021, 129, 112380. [Google Scholar] [CrossRef]
- Kačarević, Ž.P.; Rider, P.; Elad, A.; Tadic, D.; Rothamel, D.; Sauer, G.; Bornert, F.; Windisch, P.; Hangyási, D.B.; Molnar, B.; et al. Biodegradable magnesium fixation screw for barrier membranes used in guided bone regeneration. Bioact. Mater. 2022, 14, 15–30. [Google Scholar] [CrossRef]
- Yu, Z.; Chen, J.; Yan, H.; Xia, W.; Su, B.; Gong, X.; Guo, H. Degradation, stress corrosion cracking behavior and cytocompatibility of high strain rate rolled Mg-Zn-Sr alloys. Mater. Lett. 2020, 260, 126920. [Google Scholar] [CrossRef]
- Wang, H.; Kumazawa, T.; Zhang, Y.; Wang, H.; Ju, D. In vivo degradation behaviour and bone response of a new Mg-rare earth alloy immobilized in a rat femoral model. Mater. Today Commun. 2021, 26, 101727. [Google Scholar] [CrossRef]
- Hiromoto, S.; Nozoe, E.; Hanada, K.; Yoshimura, T.; Shima, K.; Kibe, T.; Nakamura, N.; Doi, K. In vivo degradation and bone formation behaviors of hydroxyapatite-coated Mg alloys in rat femur. Mater. Sci. Eng. C 2021, 122, 111942. [Google Scholar] [CrossRef]
- Rajan, S.T.; Das, M.; Arockiarajan, A. In vitro biocompatibility and degradation assessment of tantalum oxide coated Mg alloy as biodegradable implants. J. Alloys Compd. 2022, 905, 164272. [Google Scholar] [CrossRef]
- Zhou, K.; Li, Y.; Zhang, L.; Jin, L.; Yuan, F.; Tan, J.; Yuan, G.; Pei, J. Nano-micrometer surface roughness gradients reveal topographical influences on differentiating responses of vascular cells on biodegradable magnesium. Bioact. Mater. 2021, 6, 262–272. [Google Scholar] [CrossRef]
- Li, P.; Qian, J.; Zhang, W.; Schille, C.; Schweizer, E.; Heiss, A.; Klotz, U.E.; Scheideler, L.; Wan, G.; Geis-Gerstorfer, J. Improved biodegradability of zinc and its alloys by sandblasting treatment. Surf. Coat. Technol. 2021, 405, 126678. [Google Scholar] [CrossRef]
- Zhang, H.; Han, J.; Sun, Y.; Huang, Y.; Zhou, M. MC3T3-E1 cell response to stainless steel 316L with different surface treatments. Mater. Sci. Eng. C 2015, 56, 22–29. [Google Scholar] [CrossRef] [PubMed]
- Istrate, B.; Munteanu, C.; Matei, M.N.; Oprisan, B.; Chicet, D.; Earar, K. Influence of ZrO2-Y2O3 and ZrO2-CaO coatings on microstructural and mechanical properties on Mg-1,3Ca- 5,5Zr biodegradable alloy. IOP Conf. Ser. Mater. Sci. Eng. 2016, 133, 012010. [Google Scholar] [CrossRef]
- Winzer, N.; Atrens, A.; Song, G.; Ghali, E.; Dietzel, W.; Kainer, K.U.; Hort, N.; Blawert, C. A Critical Review of the Stress Corrosion Cracking (SCC) of Magnesium Alloys. Adv. Eng. Mater. 2005, 7, 659–693. [Google Scholar] [CrossRef]
- Istrate, B.; Munteanu, C.; Geanta, V.; Baltatu, S.; Focsaneanu, S.; Earar, K. Microstructural analysis of biodegradable Mg-0.9Ca-1.2Zr alloy. IOP Conf. Ser. Mater. Sci. Eng. 2016, 147, 012033. [Google Scholar] [CrossRef] [Green Version]
- Alvarez, R.B.; Martin, H.J.; Horstemeyer, M.F.; Chandler, M.Q.; Williams, N.; Wang, P.T.; Ruiz, A. Corrosion relationships as a function of time and surface roughness on a structural AE44 magnesium alloy. Corros. Sci. 2010, 52, 1635–1648. [Google Scholar] [CrossRef]
- Walter, R.; Kannan, M.B.; He, Y.; Sandham, A. Effect of surface roughness on the in vitro degradation behaviour of a biodegradable magnesium-based alloy. Appl. Surf. Sci. 2013, 279, 343–348. [Google Scholar] [CrossRef]
- Nguyen, T.L.; Blanquet, A.; Staiger, M.P.; Dias, G.J.; Woodfield, T.B.F. On the role of surface roughness in the corrosion of pure magnesium in vitro. J. Biomed. Mater. Res. B 2012, 100, 1310–1318. [Google Scholar] [CrossRef]
- Gawlik, M.M.; Wiese, B.; Desharnais, V.; Ebel, T.; Willumeit-Römer, R. The Effect of Surface Treatments on the Degradation of Biomedical Mg Alloys—A Review Paper. Materials 2018, 11, 2561. [Google Scholar] [CrossRef] [Green Version]
- Bao, M.; Xie, J.; Huck, W.T.S. Recent Advances in Engineering the Stem Cell Microniche in 3D. Adv. Sci. 2018, 5, 1800448. [Google Scholar] [CrossRef]
- Eyckmans, J.; Boudou, T.; Yu, X.; Chen, C.S. A hitchhiker’s guide to mechanobiology. Dev. Cell 2011, 21, 35–47. [Google Scholar] [CrossRef] [Green Version]
- Zareidoost, A.; Yousefpour, M.; Ghaseme, B.; Amanzadeh, A. The relationship of surface roughness and cell response of chemical surface modification of titanium. J. Mater. Sci. Mater. Med. 2012, 23, 1479–1488. [Google Scholar] [CrossRef]
- Khang, D.; Choi, J.; Im, Y.-M.; Kim, Y.-J.; Jang, J.-H.; Kang, S.S.; Nam, T.-H.; Song, J.; Park, J.-W. Role of subnano-, nano- and submicron-surface features on osteoblast differentiation of bone marrow mesenchymal stem cells. Biomaterials 2012, 33, 5997–6007. [Google Scholar] [CrossRef]
- Istrate, B.; Munteanu, C.; Lupescu, S.; Chelariu, R.; Vlad, M.D.; Vizureanu, P. Electrochemical Analysis and In Vitro Assay of Mg-0.5Ca-xY Biodegradable Alloys. Materials 2020, 13, 3082. [Google Scholar] [CrossRef]
- Gu, X.; Zheng, Y.; Cheng, Y.; Zhong, S.; Xi, T. In vitro corrosion and biocompatibility of binary magnesium alloys. Biomaterials 2009, 30, 484–498. [Google Scholar] [CrossRef]
- Wang, J.; Witte, F.; Xi, T.; Zheng, Y.; Yang, K.; Yang, Y.; Zhao, D.; Meng, J.; Li, Y.; Li, W.; et al. Recommendation for modifying current cytotoxicity testing standards for biodegradable magnesium-based materials. Acta Biomater. 2015, 21, 237–249. [Google Scholar] [CrossRef]
- Zhao, D.; Huang, S.; Lu, F.; Wang, B.; Yang, L.; Qin, L.; Yang, K.; Li, Y.; Li, W.; Wang, W.; et al. Vascularized bone grafting fixed by biodegradable magnesium screw for treating osteonecrosis of the femoral head. Biomaterials 2016, 81, 84–92. [Google Scholar] [CrossRef]
- Rosa, M.B.; Albrektsson, T.; Francischone, C.E.; Schwartz Filho, H.O.; Wennerberg, A. The influence of surface treatment on the implant roughness pattern. J. Appl. Oral Sci. 2012, 20, 550–555. [Google Scholar] [CrossRef] [Green Version]
- Cockerill, I.; Su, Y.; Lee, J.H.; Berman, D.; Young, M.L.; Zheng, Y.; Zhu, D. Micro-/Nanotopography on Bioresorbable Zinc Dictates Cytocompatibility, Bone Cell Differentiation, and Macrophage Polarization. Nano Lett. 2020, 20, 4594–4602. [Google Scholar] [CrossRef]
- Schubert, A.; Wassmann, T.; Holtappels, M.; Kurbad, O.; Krohn, S.; Bürgers, R. Predictability of Microbial Adhesion to Dental Materials by Roughness Parameters. Coatings 2019, 9, 456. [Google Scholar] [CrossRef] [Green Version]
- ISO 25178-2:2012; Geometrical Product Specifications (GPS)—Surface Texture: Areal, Part 2: Terms, Definitions and Surface Texture Parameters. International Organization for Standardization: Geneva, Switzerland, 2012.
- Wennerberg, A.; Albrektsson, T. Suggested guidelines for the topographic evaluation of implant surfaces. Int. J. Oral Maxillofac. Implant. 2000, 15, 331–344. [Google Scholar]
- ISO 10993-12:2012; Biological Evaluation of Medical Devices—Part 12: Sample Preparartion and Reference Materials. International Organization for Standardization: Geneva, Switzerland, 2012.
- Li, P.; Schille, C.; Schweizer, E.; Kimmerle-Müller, E.; Rupp, F.; Heiss, A.; Legner, C.; Klotz, U.E.; Geis-Gerstorfer, J.; Scheideler, L. Selection of extraction medium influences cytotoxicity of zinc and its alloys. Acta Biomater. 2019, 98, 235–245. [Google Scholar] [CrossRef]
- Hou, R.-Q.; Scharnagl, N.; Feyerabend, F.; Willumeit-Römer, R. Exploring the effects of organic molecules on the degradation of magnesium under cell culture conditions. Corros. Sci. 2018, 132, 35–45. [Google Scholar] [CrossRef]
- ASTM G1-03:2017; Standard Practice for Preparing Cleaning and Valuating Corrosion Test Specimens. American Section of the Internationl for Testing Materials: West Conshohocken, PA, USA, 2017.
- ISO 10993-5:2009; Biological Evaluation of Medical Devices—Part 5: Tests for In Vitro Cytotoxicity. International Organization for Standardization: Geneva, Switzerland, 2009.
- Fu, J.; Su, Y.; Qin, Y.-X.; Zheng, Y.; Wang, Y.; Zhu, D. Evolution of metallic cardiovascular stent materials: A comparative study among stainless steel, magnesium and zinc. Biomaterials 2020, 230, 119641. [Google Scholar] [CrossRef]
- Xin, Y.; Hu, T.; Chu, P.K. In vitro studies of biomedical magnesium alloys in a simulated physiological environment: A review. Acta Biomater. 2011, 7, 1452–1459. [Google Scholar] [CrossRef]
- Hou, R.; Willumeit-Römer, R.; Garamus, V.M.; Frant, M.; Koll, J.; Feyerabend, F. Adsorption of Proteins on Degradable Magnesium—Which Factors are Relevant? ACS Appl. Mater. Interfaces 2018, 10, 42175–42185. [Google Scholar] [CrossRef]
- Hou, R.-Q.; Scharnagl, N.; Willumeit-Römer, R.; Feyerabend, F. Different effects of single protein vs. protein mixtures on magnesium degradation under cell culture conditions. Acta Biomater. 2019, 98, 256–268. [Google Scholar] [CrossRef]
- Gonzalez, J.; Hou, R.Q.; Nidadavolu, E.P.; Willumeit-Römer, R.; Feyerabend, F. Magnesium degradation under physiological conditions–Best practice. Bioact. Mater. 2018, 3, 174–185. [Google Scholar] [CrossRef] [PubMed]
- Zeng, R.-C.; Li, X.-T.; Liu, L.-J.; Li, S.-Q.; Zhang, F. In vitro degradation of pure Mg for esophageal stent in artificial saliva. J. Mater. Sci. Technol. 2016, 32, 437–444. [Google Scholar] [CrossRef]
- Shadanbaz, S.; Dias, G.J. Calcium phosphate coatings on magnesium alloys for biomedical applications: A review. Acta Biomater. 2012, 8, 20–30. [Google Scholar] [CrossRef] [PubMed]
- Mitchell, J.; Crow, N.; Nieto, A. Effect of surface roughness on pitting corrosion of AZ31 Mg alloy. Metals 2020, 10, 651. [Google Scholar] [CrossRef]
- Walter, R.; Kannan, M.B. Influence of surface roughness on the corrosion behaviour of magnesium alloy. Mater. Des. 2011, 32, 2350–2354. [Google Scholar] [CrossRef]
- Qiao, Z.; Shi, Z.; Hort, N.; Abidin, N.I.Z.; Atrens, A. Corrosion behaviour of a nominally high purity Mg ingot produced by permanent mould direct chill casting. Corros. Sci. 2012, 61, 185–207. [Google Scholar] [CrossRef]
- Li, P.; Schille, C.; Schweizer, E.; Kimmerle-Müller, E.; Rupp, F.; Han, X.; Heiss, A.; Richter, A.; Legner, C.; Klotz, U.E. Evaluation of a Zn–2Ag–1.8 Au–0.2 V alloy for absorbable biocompatible materials. Materials 2019, 13, 56. [Google Scholar] [CrossRef] [Green Version]
- Zhen, Z.; Liu, X.; Huang, T.; Xi, T.; Zheng, Y. Hemolysis and cytotoxicity mechanisms of biodegradable magnesium and its alloys. Mater. Sci. Eng. C 2015, 46, 202–206. [Google Scholar] [CrossRef]
- Li, P.; Dai, J.; Schweizer, E.; Rupp, F.; Heiss, A.; Richter, A.; Klotz, U.E.; Geis-Gerstorfer, J.; Scheideler, L.; Alexander, D. Response of human periosteal cells to degradation products of zinc and its alloy. Mater. Sci. Eng. C 2020, 108, 110208. [Google Scholar] [CrossRef]
- Zhou, H.; Liang, B.; Jiang, H.; Deng, Z.; Yu, K. Magnesium-based biomaterials as emerging agents for bone repair and regeneration: From mechanism to application. J. Magnesium Alloys 2021, 9, 779–804. [Google Scholar] [CrossRef]
- Lorenz, C.; Brunner, J.G.; Kollmannsberger, P.; Jaafar, L.; Fabry, B.; Virtanen, S. Effect of surface pre-treatments on biocompatibility of magnesium. Acta Biomater. 2009, 5, 2783–2789. [Google Scholar] [CrossRef]
- Willumeit, R.; Möhring, A.; Feyerabend, F. Optimization of cell adhesion on mg based implant materials by pre-incubation under cell culture conditions. Int. J. Mol. Sci. 2014, 15, 7639–7650. [Google Scholar] [CrossRef] [Green Version]
- Willumeit-Römer, R. The Interface Between Degradable Mg and Tissue. JOM 2019, 71, 1447–1455. [Google Scholar] [CrossRef] [Green Version]
- Zhu, P.; Chen, J.; Li, P.; Xu, S. Limitation of Water-Soluble Tetrazolium Salt for the Cytocompatibility Evaluation of Zinc-Based Metals. Materials 2021, 14, 6247. [Google Scholar] [CrossRef]
- Han, X.; Yang, D.; Yang, C.; Spintzyk, S.; Scheideler, L.; Li, P.; Li, D.; Geis-Gerstorfer, J.; Rupp, F. Carbon fiber reinforced PEEK composites based on 3D-printing technology for orthopedic and dental applications. J. Clin. Med. 2019, 8, 240. [Google Scholar] [CrossRef] [Green Version]
- Rupp, F.; Liang, L.; Geis-Gerstorfer, J.; Scheideler, L.; Hüttig, F. Surface characteristics of dental implants: A review. Dent. Mater. 2018, 34, 40–57. [Google Scholar] [CrossRef]
- Ahmad Agha, N.; Willumeit-Römer, R.; Laipple, D.; Luthringer, B.; Feyerabend, F. The degradation interface of magnesium based alloys in direct contact with human primary osteoblast cells. PLoS ONE 2016, 11, e0157874. [Google Scholar] [CrossRef]


| Sample | Mg Ion Concentration (μg/mL) * | pH Value |
|---|---|---|
| Control | 19.2 1 | 7.56 ± 0.06 |
| P180 | 242.8 ± 29.5 | 8.02 ± 0.03 |
| P400 | 284.8 ± 26.8 | 8.09 ± 0.06 |
| P4000 | 262.8 ± 69.1 | 8.10 ± 0.04 |
Publisher’s Note: MDPI stays neutral with regard to jurisdictional claims in published maps and institutional affiliations. |
© 2022 by the authors. Licensee MDPI, Basel, Switzerland. This article is an open access article distributed under the terms and conditions of the Creative Commons Attribution (CC BY) license (https://creativecommons.org/licenses/by/4.0/).
Share and Cite
Chen, J.; Dai, J.; Qian, J.; Li, W.; Li, R.; Pang, D.; Wan, G.; Li, P.; Xu, S. Influence of Surface Roughness on Biodegradability and Cytocompatibility of High-Purity Magnesium. Materials 2022, 15, 3991. https://doi.org/10.3390/ma15113991
Chen J, Dai J, Qian J, Li W, Li R, Pang D, Wan G, Li P, Xu S. Influence of Surface Roughness on Biodegradability and Cytocompatibility of High-Purity Magnesium. Materials. 2022; 15(11):3991. https://doi.org/10.3390/ma15113991
Chicago/Turabian StyleChen, Jiahao, Jingtao Dai, Junyu Qian, Weirong Li, Ronghui Li, Dong Pang, Guojiang Wan, Ping Li, and Shulan Xu. 2022. "Influence of Surface Roughness on Biodegradability and Cytocompatibility of High-Purity Magnesium" Materials 15, no. 11: 3991. https://doi.org/10.3390/ma15113991
APA StyleChen, J., Dai, J., Qian, J., Li, W., Li, R., Pang, D., Wan, G., Li, P., & Xu, S. (2022). Influence of Surface Roughness on Biodegradability and Cytocompatibility of High-Purity Magnesium. Materials, 15(11), 3991. https://doi.org/10.3390/ma15113991