1. Introduction
Titanium alloys have a wide application field in various branches of industry (e.g., aviation, mechanical engineering and biomedicine) due to the fact of their low density, low Young’s modulus, high plasticity, good biocompatibility and excellent corrosion resistance [
1,
2,
3]. Ti–Nb and Ti–Mo alloys are promising for application as metallic biomaterials (in particular, as orthopedic implants), because Nb and Mo are nontoxic, nonallergenic and possess a low Young’s modulus similar to natural bone [
4,
5,
6,
7,
8]. However, these alloys are seldom used due to the fact of their lower strength in comparison with widely applied biocompatible Ti alloys, such as Ti–6Al–7Nb, Ti–5Al–2.5Fe, or Ti–6Al–4V, which possess restricted biocompatibility and relatively high Young’s modulus [
1,
9]. Using the methods of severe plastic deformation (SPD), it is possible to improve the strength of materials due to the refinement of the microstructure [
10,
11] and to reduce the Young’s modulus due to the phase transformations caused by SPD [
4]. For example, the high-temperature deformation of Grade-2 purity titanium by the equal-channel angular pressing (ECAP) increases its yield strength from 330 to 652 MPa due to the decrease in grain size to a few dozens of nanometers together with an increase in dislocation density [
11]. The high-pressure torsion (HPT) of commercially pure titanium (Grade 4) increases the ultimate tensile strength up to 1600 MPa due to the decrease in grain size [
12]. For comparison, the strength of titanium alloys with elements nontoxic to the human body, namely, Ti
15Mo
7Zr
5Ta and Ti
20Mo
7Zr
5Ta, obtained by an arc melting method, are approximately 710 and 1410 MPa, respectively. However, the elongation of these alloys only reached 4.7% [
13].
Many properties of Ti-based alloys are connected with allotropic transformations. Titanium alloys possess two stable phases, namely, a low-temperature α-phase, with a hexagonal close-packed (hcp) structure, and a high-temperature β-phase, with a body-centered cubic (bcc) structure, as well as three metastable phases (i.e., an α′-martensite with a hexagonal closely packed lattice, an α″-martensite with orthorhombic structure and a ω-phase with a hexagonal structure) [
14]. The α′- and α″-martensite phases form by quenching of the β-phase and depend on the chemical composition of the alloys. The ω-phase can be obtained as a result of slow quenching of the β-phase (ω
athermal), during isothermal aging of the β-phase (ω
isothermal) or under high-pressure treatment of the β/α-phases, and can be retained after pressure release [
4,
15,
16]. In Ti-based alloys, the high-pressure ω-phase forms more easily from the β-phase during SPD and also from the α-phase at hydrostatic pressures between 2 and 12 GPa [
17,
18,
19], depending on the experimental technique, pressure environment and alloying additions. For example, it was found that even a 0.1 rotation of HPT deformation under 7 GPa and a rotation rate of 1 rpm of the Ti-4wt.%Fe alloy in the β-state led to the formation of 90% of the ω-phase [
20]. On the other hand, an increase in the pressure from 3 to 6 GPa over five revolutions and a rotation rate of 1 rpm of commercial purity α-Ti caused an increase in the volume fraction of the ω-phase from 10 to 70%. In addition, an increase in the number of HPT revolutions from ½ to 1 and then to 5 and 10 at a pressure of 6 GPa and a rotation rate of 1 rpm also increased the volume fraction of the ω-phase from 55 to 65, 70 and 90%, respectively [
17].
The SPD-induced α→ω and β→ω are martensitic transformations (diffusionless), being promoted by shear strain and alloying of Ti with β-stabilizers (e.g., Fe, Co, Nb, Ni, Mo and V). The solubility of β-stabilizers is minimal in the α-phase and quite high (up to 20 wt.%) in the β-phase. The following question arises: How does the addition of various β-phase stabilizers influence the nature of the α→ω and β→ω phase transformations? The formation of the ω-phase in Ti is related to their specific electronic structure, which is characterized by the relationship that exists between the occupied narrow
d bands and the broad
sp bands. Under the applied pressure, the
sp bands rise faster in energy, causing electrons to be transferred to the
d bands [
21]. This process is known as the
s-d transition, and it governs the structural properties of transition metals. As β-stabilizers are mostly
d-electron rich transition elements, this type of alloying gives rise to
d-electron concentration and can, therefore, provide an additional driving force for the α→ω transformation. In other words, alloying with β-phase stabilizers can be considered as the pressure equivalent for the α→ω phase transformation. Hennig [
22] concluded from ab initio calculations employing the density functional theory that alloying with β-stabilizer elements should lead to a decrease in the onset pressure of the α→ω transformation. However, there are no systematic experimental investigations confirming this prediction. Furthermore, the alloying of Ti with β-stabilizers with different solubilities in Ti offers new possibilities for the experimental studies of the α→ω phase transformation.
There are some works dedicated to HPT-induced α→ω [
17,
23,
24,
25], β→ω [
20,
26] and α′→ω [
27] transformations and the thermal stability of the SPD-induced ω-phase [
17,
27,
28,
29] in pure Ti [
17,
23,
24] as well as in Ti–Fe [
20,
28,
30] and Ti–Co [
25,
29] alloys. However, there is a lack of systematic studies on the influence of microstructural morphology (i.e., the shape and size of grains) and phase composition on the formation of the ω-phase, especially in Ti–Nb and Ti–Mo alloys subjected to HPT deformation. The novelty of this paper is that it answers the question: How does the amount of the alloying component, different combinations of phase composition (α, β or α′) and the grain size of the initial microstructure affect ω-phase formation, and what is the ω-phase’s thermal stability dependent on? The transformation to the ω-phase at high pressures and shear deformation raises a number of scientific and engineering issues mainly because the ω-phase is fairly brittle compared to the α-phase, which may significantly limit the use of Ti in high-pressure applications [
31]. Hence, knowledge on ω-phase thermal stability is needed to determine the conditions for the thermo-mechanical treatment of Ti alloys in order to modify their mechanical properties. Thus, the microstructure, phase transformations (such as α→ω, β→ω and α′→ω) and thermal stability of the HPT-induced ω-phase in deformed Ti–2wt.% Nb, Ti–20wt.% Nb, Ti–2wt.% Mo and Ti–18wt.% Mo alloys were studied in the current work.
3. Results and Discussion
Figure 2a,b show SEM micrographs of the coarse-grained initial microstructures of the Ti–3wt.% Nb and Ti–20wt.% Nb alloys after annealing at 600 and 520 °C, respectively.
Figure 2a shows the microstructure within one grain, while
Figure 2b shows the boundaries of the triple junction of grains. Observation of the microstructure with an optical microscope showed that the grains were round in shape, and their sizes ranged from 0.5 to 1.5 mm. A small amount of uniformly distributed β-phase precipitates could be observed inside the α-phase grain in the case of the Ti–3wt.% Nb alloy (
Figure 2a). Since the β-phase grains were enriched in niobium, they had a bright contrast in comparison to the dark α-matrix in the micrographs taken in the BSE mode. In the case of the second alloy, a huge amount of thin (up to 500 nm thick) lamellar precipitates of the β-phase was observed inside the grains of the α-phase (
Figure 2b). TEM studies confirmed the presence of the α- and β-phases in the alloys. Examples TEM images of Ti–20wt.% Nb alloy are presented in
Figure 2c–e. Selected area electron diffraction (SAED) patterns (
Figure 2d,e) were obtained from two different phases marked with white circles in the bright-field image (
Figure 2c). The SAED in
Figure 2e corresponds to the dark elongated grain of the β-phase, while the SAED in
Figure 2e to the α-phase matrix. The EDS microchemical analysis showed enrichment of the α-phase into niobium up to 3wt.% in the case of the Ti–3wt.% Nb alloy and up to 10wt.% in the case of the Ti–20wt.% Nb alloy. According to synchrotron X-ray diffraction analysis (
Figure 3), which is described below, the amount of the β-phase was approximately 10% and 40% in the Ti–3wt.% Nb and Ti–20wt.% Nb alloys, respectively (
Table 2).
Figure 3 shows synchrotron X-ray diffraction patterns of the examined alloys before and after SPD. Peaks of the α- and β-phases were observed in the initial state of both alloys, wherein only three small peaks of the β-phase were observed in the Ti–3wt.% Nb alloy, and four peaks of this phase appeared in the Ti–20wt.% Nb alloy. After the HPT process, the peaks of the α- and β-phases broadened, which indicates a strong grain refinement of the microstructure and internal stresses in the crystal lattices from the high density of the crystal defects induced by HPT. Peaks of the ω-phase were also observed after HPT, some of which overlapped with the β-phase peaks, but there were some ω-phase peaks (e.g., (00.1), (11.1), (00.2) and (11.2)) that did not overlap with other peaks in the initial state. Since the peaks of the α-phase were significantly reduced in intensity, and some of them disappeared completely after HPT, it can be assumed that the α-phase partially transformed into the ω-phase. Since all peaks of the β-phase observed in the initial state overlapped with the ω-phase peaks after SPD, it is difficult to draw an unambiguous conclusion about the complete β→ω phase transformation.
TEM studies of the microstructures of the alloys after HPT (
Figure 4) showed strong grain refinement up to 50–100 nm. The bright-field (BF) images did not reveal any noticeable differences between the microstructure of the Ti–3wt.% Nb (
Figure 4a) and Ti–20wt.% Nb alloys (
Figure 4d). On the other hand, the dark-field (DF) image of the Ti–3wt.% Nb alloy (
Figure 4b) showed more grains in comparison to the Ti–20wt.% Nb alloy (
Figure 4e). This is likely attributed to the fact that for the Ti–3wt.% Nb, the obtained result came from reflexes belonging to two rings of the SAED pattern in the objective aperture (
Figure 4c), while for the case of the Ti–20wt.% Nb alloy, reflexes from only one ring were studied (
Figure 4f). It is interesting that all rings of the SAED patterns of the deformed alloys fit well with the ω-phase (
Figure 4c,f). However, there were some single reflexes (dots) between the recognized rings. Due to the low number of these reflections, the program for determining ring diffraction patterns could not recognize them. It is possible that these single reflections could belong to the α- or β-phases. However, the high-resolution transmission electron microscopy (HRTEM) studies of the thin foils showed the nanograins only in the α- and ω-phases (
Figure 4g–i). The HRTEM observations allowed for observation of the separate grains. The columns of atoms were visible when the grain was properly oriented in relation to the electron beam.
Figure 4g shows two groups of grains. The measured distances, d
hkl, and the angles between them in the fast Fourier transforms of the selected grains showed that they belonged to the α- and ω-phases. This implies that the α-phase was present in this sample. A detailed description of the morphology of the α- and ω-phase grains of both examined alloys after HPT can be found in previous works [
35,
36]. Therefore, it can be concluded that during HPT, the α-phase partially transforms into the ω-phase. Concerning the β-phase, it was found that even a 0.1 plunger rotation during HPT deformation of the Ti–4wt.% Fe alloy in the β-state led to the formation of 90% of the ω-phase [
20]. Since the β-phase grains were not detected by the TEM studies of the Ti–3wt.% Nb and Ti–20wt.% Nb alloys, it was concluded that the β-phase completely transformed into the ω-phase during the HPT treatment. Based on synchrotron X-ray diffraction analysis (
Figure 3), the volume fraction of the ω-phase was calculated, which amounted to approximately 80% and 86% for the Ti–3wt.% Nb and Ti–20wt.% Nb alloys, respectively (
Table 2).
Since the entire β-phase was transformed into the ω-phase, it was easy to calculate (based on the total amount of the ω-phase) the amount of the α-phase that was transformed into the ω-phase. It turned out that this amount was 70% for the Ti–3wt.% Nb alloy and only 46% for the Ti–20wt.% Nb alloy (
Table 2). It can be assumed that the more niobium in the initial α-phase (as is observed in the Ti–20wt.% Nb alloy), the more difficult the α→ω phase transformation. This can be explained by an unfavorable change in the lattice parameters, namely, a high content of the alloying element significantly reduces the lattice parameters of the α-phase [
35], which makes it difficult for the α→ω phase transformation along certain crystallographic planes during shear deformation induced by HPT. Similar results were also obtained in the Ti–4wt.% Co alloy subjected to HPT under the same conditions [
29]. HPT of the Ti–4wt.% Co alloy resulted in a strong grain refinement of the microstructure and a partial α→ω phase transformation. It was found that HPT-induced α→ω phase transformation depended on the cobalt content in the initial α-phase and the morphology of the microstructure. The lower cobalt content and smaller grain size of the α-phase led to a higher amount of ω-phase induced by HPT [
29].
The thermal stability of the metastable ω-phase was studied by in situ high-temperature XRD measurements. The in situ XRD maps of the examined alloys after HPT are presented in
Figure 5. As can be seen, only the (11.0) + (10.1) doublet of ω-phase peaks can be distinguished in the 32–42° range of 2θ angles on the maps of both alloys before their heating. However, the (10.0) and (10.1) peaks of the α-phase are clearly visible in this range of 2θ angles on the standard XRD curves in
Figure 3. The absence of the α-phase peaks in the 32–42° range of 2θ angles in the in situ XRD map is related to the different durations of the XRD measurements. For the in situ method, there is not enough time to register the many X-ray counts compared to the standard method.
Heating of the Ti–3wt.% Nb alloy above 200 °C resulted in a significant decrease in the intensity of the ω-phase (11.0 + 10.1) doublet of peaks and, simultaneously, in the appearance of well-defined α-phase peaks (10.0), (00.2) and (10.1). This means that the decomposition of the ω-phase into the α-phase ended at a temperature of 270 °C. In the case of the Ti–20wt.% Nb alloy (
Figure 5b–d), the decomposition of the ω-phase began at 280 °C and ended at 370 °C, which is clearly seen on the lateral projection of the XRD in situ map (
Figure 5c). A distinctive feature of ω-phase decomposition in this alloy is the appearance of the α- and β-phases. The intensity of the β-phase peak (110) first increases during heating to 630 °C and then decreases, while the intensity of this peak does not exceed the intensity of the α-phase peak (10.1) (
Figure 5d). It should be noted that when both alloys were heated above 600–650 °C, the α-phase peaks shifted slightly to the left side (towards the lower diffraction angles), which is associated with an increase in the lattice parameters of the α-phase. Since the ω-phase is enriched in niobium as an alloying element (by analogy with the ω-phase enriched in iron in Ti–Fe alloys [
17,
30]), it was assumed that the α-phase arising after the decomposition of the ω-phase was also enriched in niobium. Therefore, a slight shift in the α-phase peaks towards lower diffraction angles at heating to the highest temperatures can be associated with the appearance of the new α-phase with lower niobium content as well as the increase in the lattice parameters due to the thermal expansion.
Comparing the decomposition temperatures of the ω-phase of both examined alloys, it can be seen that the thermal stability of the ω-phase in the Ti–20wt.% Nb alloy was slightly higher (
Table 2). Perhaps this was due to the higher content of the alloying component in the ω-phase of this alloy. Since the ω-phase is formed in a diffusionless way, this means that its chemical composition will coincide with the chemical composition of the phase from which it formed. In the Ti–20wt.% Nb alloy, the amount of the β-phase converted to the ω-phase was higher. In addition, the β- and α-phases in this alloy were more enriched in niobium than these phases in the Ti–3wt.% Nb alloy (
Table 2). For example, the β-phase in the Ti–20wt.% Nb alloy contained 50wt.% Nb, but in the Ti–3wt.% Nb alloy only 15wt.% Nb. This means that the ω-phase in the Ti–20wt.% Nb alloy was more enriched in niobium.
The microstructures of the Ti–2wt.% Mo and Ti–18wt.% Mo alloys after annealing at 1000 °C are shown in
Figure 6. According to the equilibrium diagram, both alloys must contain a β-solid solution. However, the microstructure of the Ti–2wt.% Mo alloy showed the thin plates inside large grains (
Figure 6a). The TEM study of the thin foil showed that the morphology of the plates was close to martensite, which was confirmed by the SAED patterns (
Figure 7a,b). It is possible that the cooling rate of the sample after annealing was not high enough to maintain the β-phase, which decomposed to α′-martensite with hexagonal close-packed (hcp) unit cells. The microstructure of the Ti–18wt.% Mo alloy consisted only of large elongated grains of the β-phase (
Figure 6b and
Figure 7c,d). In spite of the same cooling rate, α′-martensite was not present, since according to the Ti-Mo system, it can only appear at an Mo content of up to 2–3 at.% [
14].
The SEM micrographs of both alloys after HPT are shown in
Figure 8. It can be seen that the microstructure of the Ti–2wt.% Mo alloy was less homogeneous compared to the Ti–18wt.% Mo alloy: martensite plates are visible within the surrounding matrix (
Figure 8a). The detailed studies using TEM showed a strong refinement of the microstructure containing a mixture of α′- and ω-phase nanograins (
Figure 9e) and a single grain of the α′-martensite with a high dislocation density. It is possible that some plates of the α′-martensite in the initial state were unfavorably oriented for the activation of the slip systems responsible for the phase transformation, and the increased dislocation density in these plates after HPT was insufficient to initiate the α′→ω phase transformation.
The microstructure of the Ti–18wt.% Mo alloy after HPT was not homogeneous, with the presence of fine-grained (
Figure 10a–c) and coarse-grained (
Figure 10d,e) regions. However, even fine-grained areas seemed to be coarser compared to the Ti–2wt.% Mo alloy. This was evidenced by a smaller number of SAED reflexes (
Figure 10c), taken from the region of the same size as in the case of the Ti–2wt.% Mo alloy. Most of the SAED reflexes in
Figure 10c belong to the ω-phase, but there were also a few reflexes that coincided with the β- and ω-phases simultaneously. In the SAED pattern taken from the coarser-grained area in
Figure 10d, an overlap of at least two crystal lattices can be seen, one of which fits well with the β-phase (
Figure 10e).
Synchrotron XRD analysis (
Figure 11) confirmed that the initial states of the Ti–2wt.% Mo and Ti–18wt.% Mo alloys were α′-martensite and β-solid solution, respectively. After deformation, a significant broadening of all peaks and the appearance of ω-phase peaks are observed. The presence of the high-pressure ω-phase in both alloys indicates the partial α′→ω and β→ω phase transformations occurred. The amount of ω-phase reached about 65.6% in the Ti–2wt.% Mo, and only 47.6% in the Ti–18wt.% Mo alloys.
When analyzing the phase composition of the deformed Ti–18wt.% Mo alloy, the following question may arise: Why did the β-phase, which has a large dimensional and structural correspondence with the ω-phase in this alloy, not transform completely into the ω-phase (as in the case of the Ti–20wt.% Nb alloy)? It can be assumed that this was due to the morphology of the initial microstructures of both alloys. The Ti–20wt.% Nb is a two-phase alloy and contains small plates of α- and β-phases in the initial state, while the Ti–20wt.% Nb alloy is a coarse-grained single-β-phase solid solution. It is known that, for a phase transformation, the original phase must overcome a certain energy barrier associated with the accumulation of stresses in the microstructure [
25]. It is possible that a two-phase microstructure (or a single-phase microstructure with a fine grain size) piles up deformation more easily compared to a single-phase coarse-grained structure due to the presence of a large fraction of interphase boundaries (grain boundaries), which are obstacles for the movement of dislocations. Therefore, it is possible that the small α- or β-plates overcome the critical shear stresses necessary for the phase transformations and transform into the ω-phase faster in comparison to the single-phase coarse-grained structures. Similarly, the presence of a fine lamellar martensitic structure in the initial state of the Ti–2wt.% Mo alloy explains the formation of a greater amount of the ω-phase compared to the coarse-grained single-β-phase of the Ti–18wt.% Mo alloy.
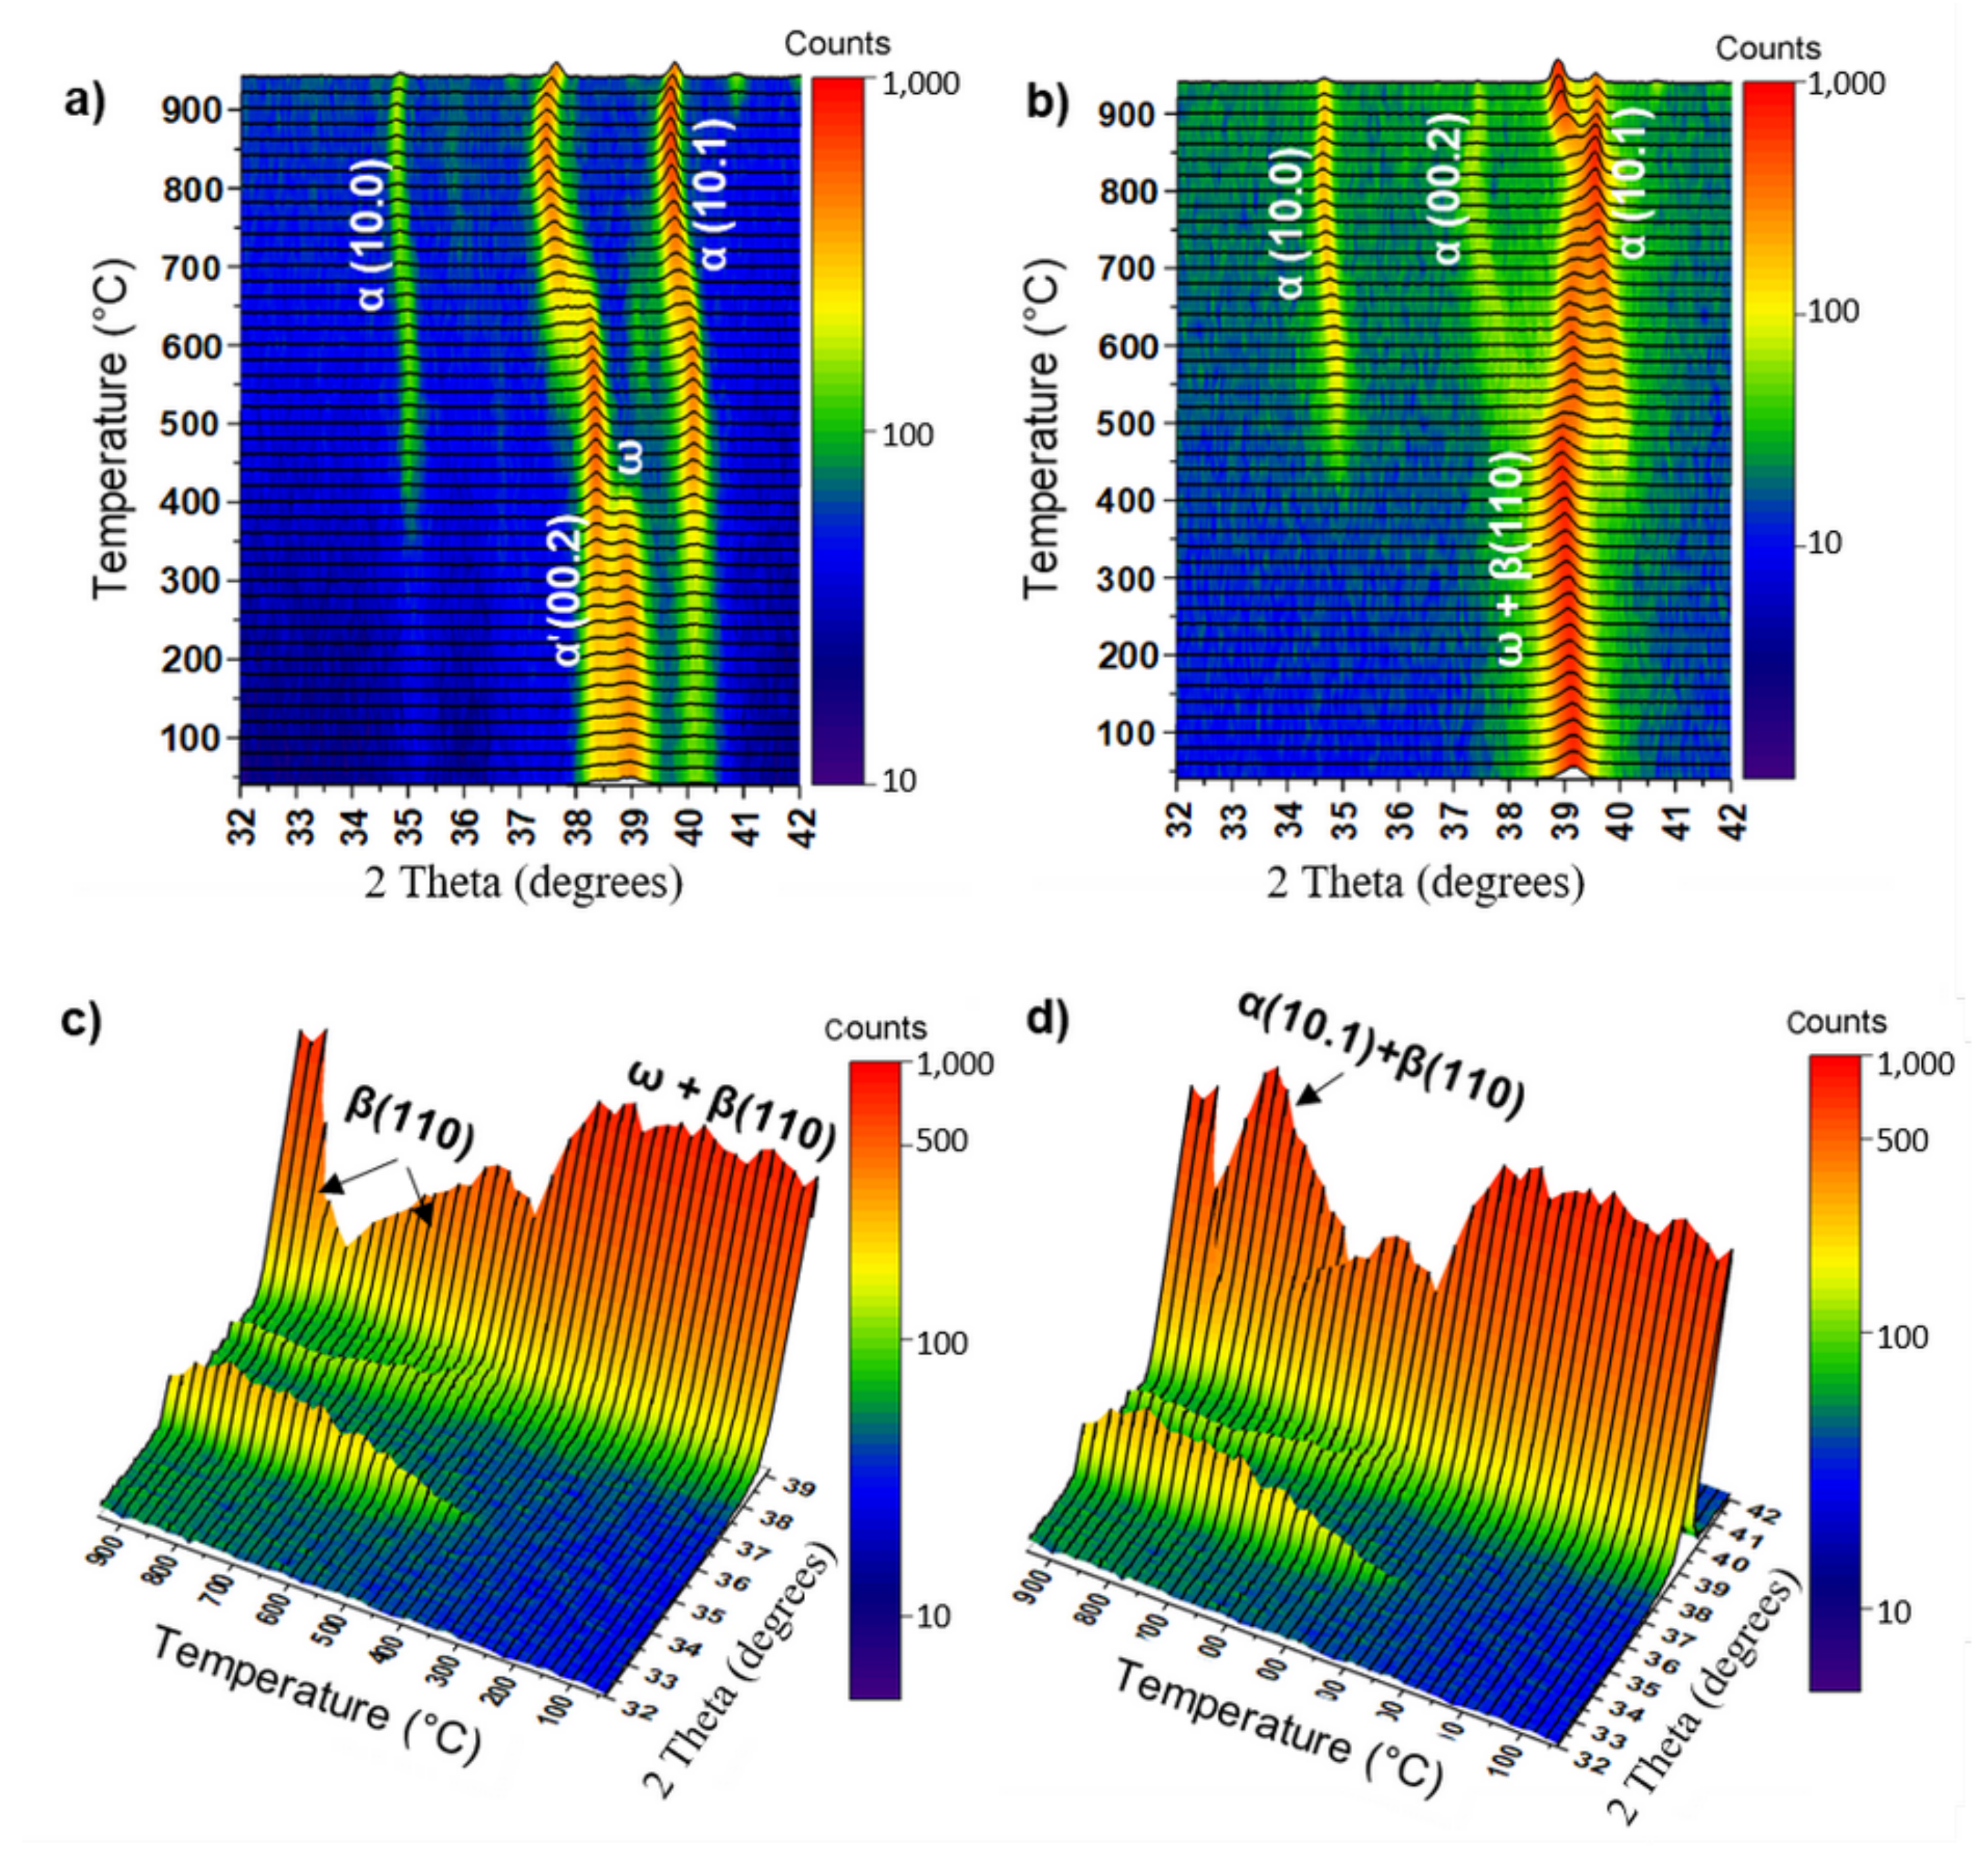
The results of the studies of the ω-phase thermal stability in the deformed Ti–2wt.% Mo and Ti–18wt.% Mo alloys are shown in
Figure 12. Three peaks belonging to α′(00.2), ω(10.1)/(11.0) and α′(10.1) can be seen on the XRD in situ heating map of the deformed Ti–2wt.% Mo alloy in the 2θ angle range of 32–42° before its heating (
Figure 12a). Heating of the alloy above 300 °C leads to a gradual decrease in the intensity of the ω-phase peak. The ω-phase peak disappeared at a temperature of approximately 400 °C. At the same time, the intensity of the α′(00.2) and α′(10.1) peaks increased, and a new α′(10.0) peak appeared. All this testifies to the decomposition of the ω-phase into the α′- or α-phase. When heated above 600 °C, a shift in the α′-phase peaks towards lower angles was observed. This shift indicates an increase in the lattice parameters. This increase can be a result of lattice thermal expansion from the heating. It should be noted that, theoretically, the α′-martensite should be more enriched in Mo than the α-phase, since α′-martensite comes from the β-phase enriched in Mo due to the diffusionless transformation. Therefore, the lattice parameters of α′- martensite should be slightly smaller than that of the α-phase, and their peaks should be somewhat shifted towards higher angles of 2θ. But, in the case of the Ti–2wt.% Mo alloy, the low content of Mo means the lattice parameters of the α′-martensite and the α-phase are almost the same (for α′-phase
a = 2.949 ± 0.006 nm,
c = 4.681 ± 0.006 nm; for α-phase:
a = 2.954 ± 0.006 nm,
c = 4.690 ± 0.006 nm), so there is no visible difference in peak positions between these two phases. It should be noted that, in the case of the Ti–1wt.%Fe alloy in the initial state of α′-martensite and a small amount of β-phase, an assumption was made about the probable α′→α→ω sequence of transformations during HPT deformation [
30]. The authors of this work noticed a significant increase in the lattice parameters of the α′ after HPT, and their approach to the parameter of pure titanium (α) already after a 0.1 anvil revolution, when the ω-phase had not yet formed. This result led to the assumption that, at the first stage of deformation, the α′-phase transforms into the α-phase which, in turn, transforms into the ω-phase.
One peak at the 2θ angle of 39.1° was observed in the XRD in situ heating map before heating of the deformed Ti–18wt.% Mo alloy (
Figure 12b). This peak corresponded to the ω- (11.0 + 10.1) and β- (110) phases. It can be seen that this peak slightly shifted to the right compared to the peak in the Ti–2wt.% Mo alloy. This is explained by a decrease in the lattice parameter of the ω-phase in the Ti–18wt.% Mo alloy due to the higher content of molybdenum (
Table 3). With the heating of the Ti–18wt.% Mo alloy, the intensity of this peak decreased in the temperature range of 420–500 °C (
Figure 12c), and formation of new peaks from the α-phase were observed at the same time. This indicates the decomposition of the ω-phase. Shifting the peak of the β-phase (110) towards larger angles after the decomposition of the ω-phase is associated with the enrichment of the β-phase with molybdenum. It is possible that molybdenum from the decomposed ω-phase diffused into the β-phase, but when heated above 850 °C, the chemical composition of the β-phase came into an equilibrium state, and the peak of the β-phase shifted again to the left. To check whether the shifted peak of the β-phase after the decomposition of the ω-phase really belonged to the β-phase, the deformed sample was annealed in an in situ XRD chamber at a temperature of 620 °C for 10 min and then a thin foil was made using the FIB method.
The TEM studies of a thin foil of the Ti–18wt.% Mo alloy after HPT and heating at 620 °C (
Figure 13) showed the microstructure including regions with a fine-grained microstructure (
Figure 13a,b), coarse-grained regions with an increased density of dislocations (
Figure 13c,d) and large grains (up to 500 nm in size) with a regular shape and free of dislocations (
Figure 13e–g). Most of the diffraction reflexes in the fine-grained area (
Figure 13a) belonged to the α-phase, one belonged to the ω-phase, and the other was common to both phases (
Figure 13b). The presence of only one unambiguous reflection of the ω-phase indicates its almost complete decomposition. The coarse-grained regions with an increased density of dislocations corresponded also to the α-phase.
Figure 13d shows the SAED pattern, which is an overlay of two lattices of the α-phase. The SAED patterns taken from areas 1 and 2 in
Figure 13e showed the presence of the β- (
Figure 13f) and α-phases (
Figure 13g), respectively. The EDS microchemical analysis showed that the grains of the α-phase were enriched in Mo from 0.1 to 0.9wt./%, while the grains of the β-phase from 28.3 to 33.4wt.% Mo. The high content of Mo in the β-phase observed after the ω-phase decomposition (compared to the initial β-phase with a Mo content of 18 wt.%), explains the shift in the peak of the β-phase (110) towards higher 2θ angles (
Figure 12b).
When comparing the Ti–18wt.% Mo alloy with the Ti–20wt.% Nb alloy, the following question arises: Why does the position of the β-phase peak (110) in the alloy with niobium not shift to the right after the decomposition of the ω-phase? The point is that after HPT of the Ti–20wt.% Nb alloy, the β-phase completely transformed into the ω-phase. Under the heating of the deformed Ti–20wt.% Nb alloy, the ω-phase decomposed into the α- and β-phases, and the β-phase immediately obtained the required chemical composition close to equilibrium. In the case of the Ti–18wt.% Mo alloy, the β-phase was already present in the microstructure before the decomposition of the ω-phase, and when the ω-phase decomposed, the molybdenum atoms, as a beta stabilizer, passed to the β-phase and enriched it which, in turn, resulted in a decrease in its lattice parameters and, therefore, to a slight shift in the position of the β-phase peak (110).
It was shown for the alloys belonging to the Ti-Nb and Ti-Mo systems that the formation of a high-pressure ω-phase may depend on the phase composition and grain size of the initial microstructure. In the case of the Ti–Nb alloys, it was found that an increase in the alloying element in the α-phase hinders the process of the α→ω phase transition. In [
29], using a Ti–4wt.% Co alloy deformed by the HPT, this phenomenon is explained by a decrease in the lattice parameters of the α-phase, which is unfavorable for its transition to the ω-phase. The ω-phase is more easily formed from the β-phase due to the large dimensional and structural similarities between these phases; therefore, in the studied two-phase (α + β) Ti–Nb alloys, a complete β→ω phase transformation can be seen. However, in the case of the Ti–18wt.% Mo alloy with the initial β-phase coarse-grained microstructure, only 47% of the β-phase underwent phase transformation. In this case, the amount of the obtained ω-phase was less than the amount of the ω-phase formed from the finely dispersed martensitic microstructure of the deformed Ti–2wt.% Mo alloy. It is possible that the size of the grains also influenced the phase transformation, since it is easier for small plates (grains) to gain deformation and overcome the critical shear stresses necessary for α→ω or β→ω transformations.
Comparing the thermal stability of the ω-phase in the studied Ti–Nb and Ti–Mo alloys, it can be seen that an increase in the alloying element in the ω-phase leads to an increase in its thermal stability from 200 to 370 °C for Ti–Nb alloys and from 300 to 500 °C for Ti–Mo alloys. The formation of the high-pressure ω-phase is martensitic (diffusionless), but is the decomposition of the ω-phase also diffusionless? This question is open, because the mechanism of this transformation is still not fully understood and not sufficiently documented in the literature. There are suggestions that the decomposition of the ω-phase may be of a diffusion nature. In [
29], the thermal stability of the ω-phase formed from the α-solid solution of HPT-deformed Ti–Co alloys was studied using different scanning calorimetry. It turns out that the temperature interval of the reverse-phase transformation ω→α varied depending on the heating rate: the lower the heating rate, the greater the shift in the temperature interval towards lower temperatures. This dependence indicates the diffusion nature of this transformation or at least the diffusion contribution to the transformation. In addition, it was shown in [
37] that the reverse transformation ω→α is prevented by crystal defects in the ω-phase. A significant decrease in the dislocation density in the ω-phase before the initiation of the ω→α transformation was found. Since dislocation annihilation is a thermally activated process, this makes a significant contribution to the observed phase transformation. Thus, if the process of the reverse-phase transformation has a diffusive character, then the decomposition of the ω-phase with a high content of the alloying element may require a larger amount of diffusive mass transfer, which is achieved by increasing the heating temperature of the deformed material. One can assume that a ω-phase with a high content of the alloying element will contain more defects in the crystal structure caused by SPD. The annihilation of these defects with an increase in temperature will promote the decomposition of the ω-phase. It should be noted that alloying titanium with beta-stabilizing elements, such as Nb and Mo as well as Fe [
28] and Co [
29], leads to a significant increase in the thermal stability of the ω-phase compared to pure titanium supplied by HPT, where the process of decomposition of the ω-phase was observed in a temperature range of 140–180 °C [
17]. It should be noted that knowledge on the thermal stability of the ω-phase is necessary to determine the conditions for the thermo-mechanical treatment of Ti alloys in order to modify their mechanical properties. It follows from a review of the literature that the use of short-term, low-temperature annealing before tensile testing [
38,
39] or tension at elevated temperatures [
24,
40] can lead to an improvement in the plasticity of HPT-deformed alloys. For example, the short-term annealing of HPT-treated titanium at 200–300 °C increased both the ductility and strength [
38,
39]. Since the metastable ω-phase in the pure Ti remained in the HPT-deformed samples only up to 180 °C [
17], the observed changes in the mechanical properties under annealing could be due to the ω→α back transformation. The important increase in ductility together with a slight strength decrease was also observed in the Zr-2.5wt.% Nb alloy after HPT and low-temperature annealing [
41], where these changes in the properties were correlated with a partial reverse ω→α phase transformation. Therefore, the application of the HPT process and additional annealing is very promising for the development of advanced metallic biomaterials with high levels of mechanical properties. Currently, a small number of works are dedicated to the influence of the ω-Ti on the mechanical behavior of the SPD-treated alloys, where generally the hardness and Young’s modulus are usually measured [
24,
25,
36,
41,
42,
43], while there are practically no data on the tensile strength. The next step of our work will be to study the effect of the α→ω and ω→α phase transformations on the mechanical properties (i.e., strength and ductility) of alloys after HPT and after HPT with low-temperature annealing, determined in a tensile experiment.


 ,
, 


