
Effects of Admixtures on Energy Consumption in the Process of Ready-Mixed Concrete Mixing
 ,
,  , , and
Abstract
:1. Introduction
1.1. Importance of Mixing
1.2. Mixing Mechanism
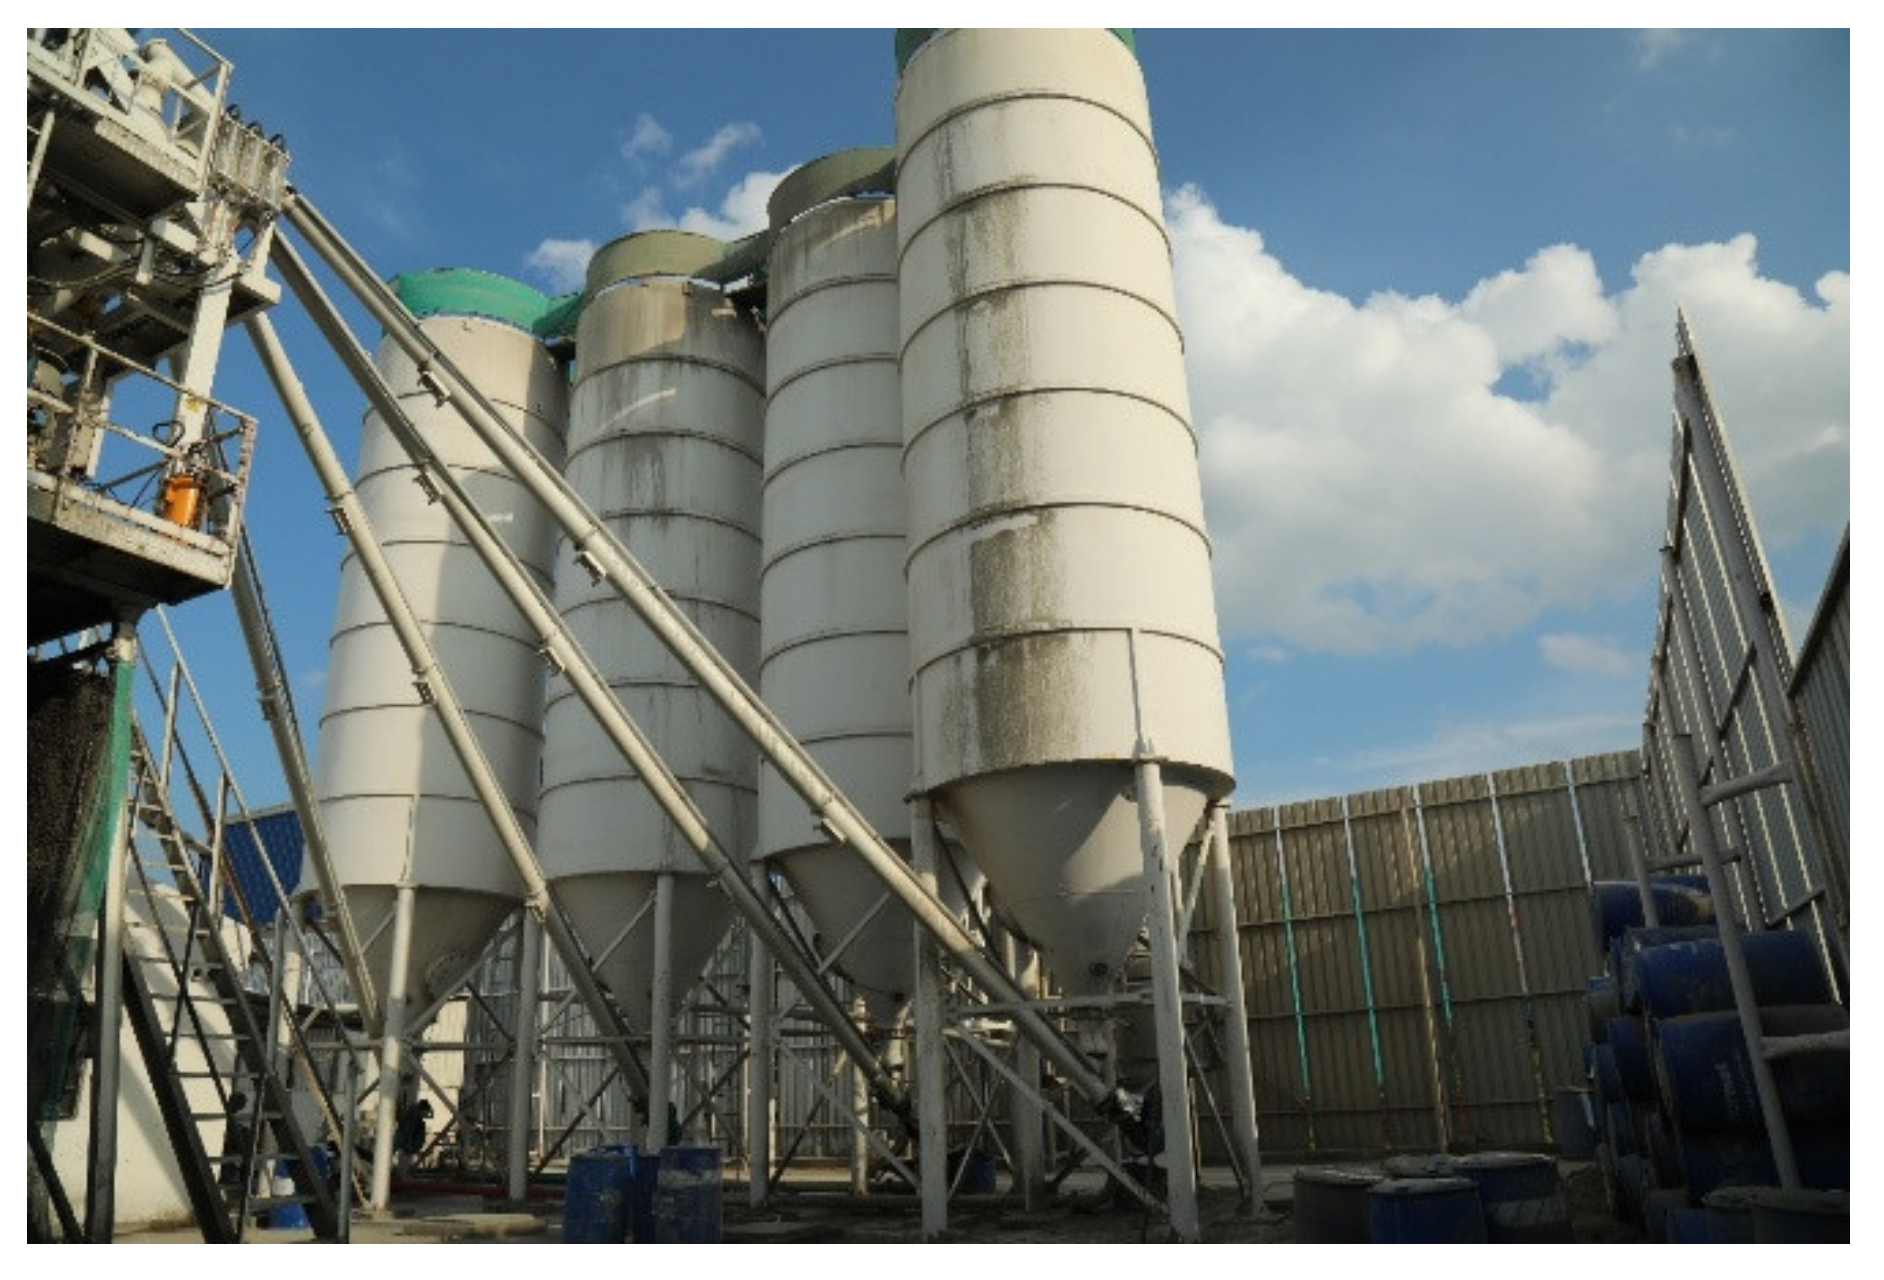
1.3. Production and Energy Consumption of Ready-Mixed Concrete
1.4. The Relation between Power Consumption and the Mixing of Concrete
2. Materials and Methods
2.1. Composition of the Concrete Ingredients
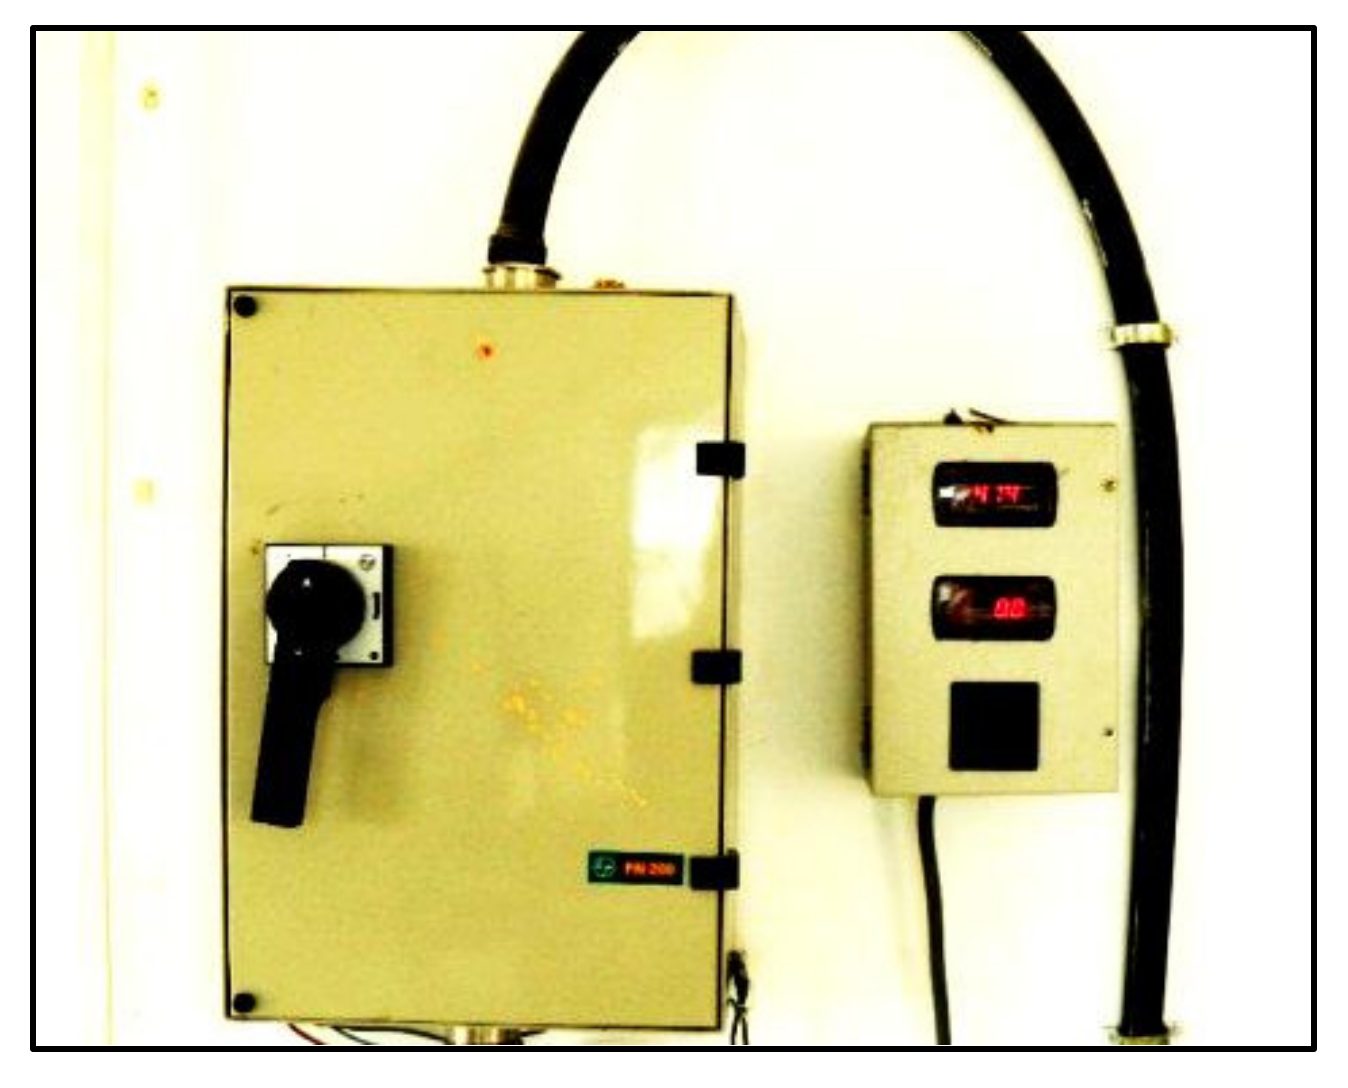
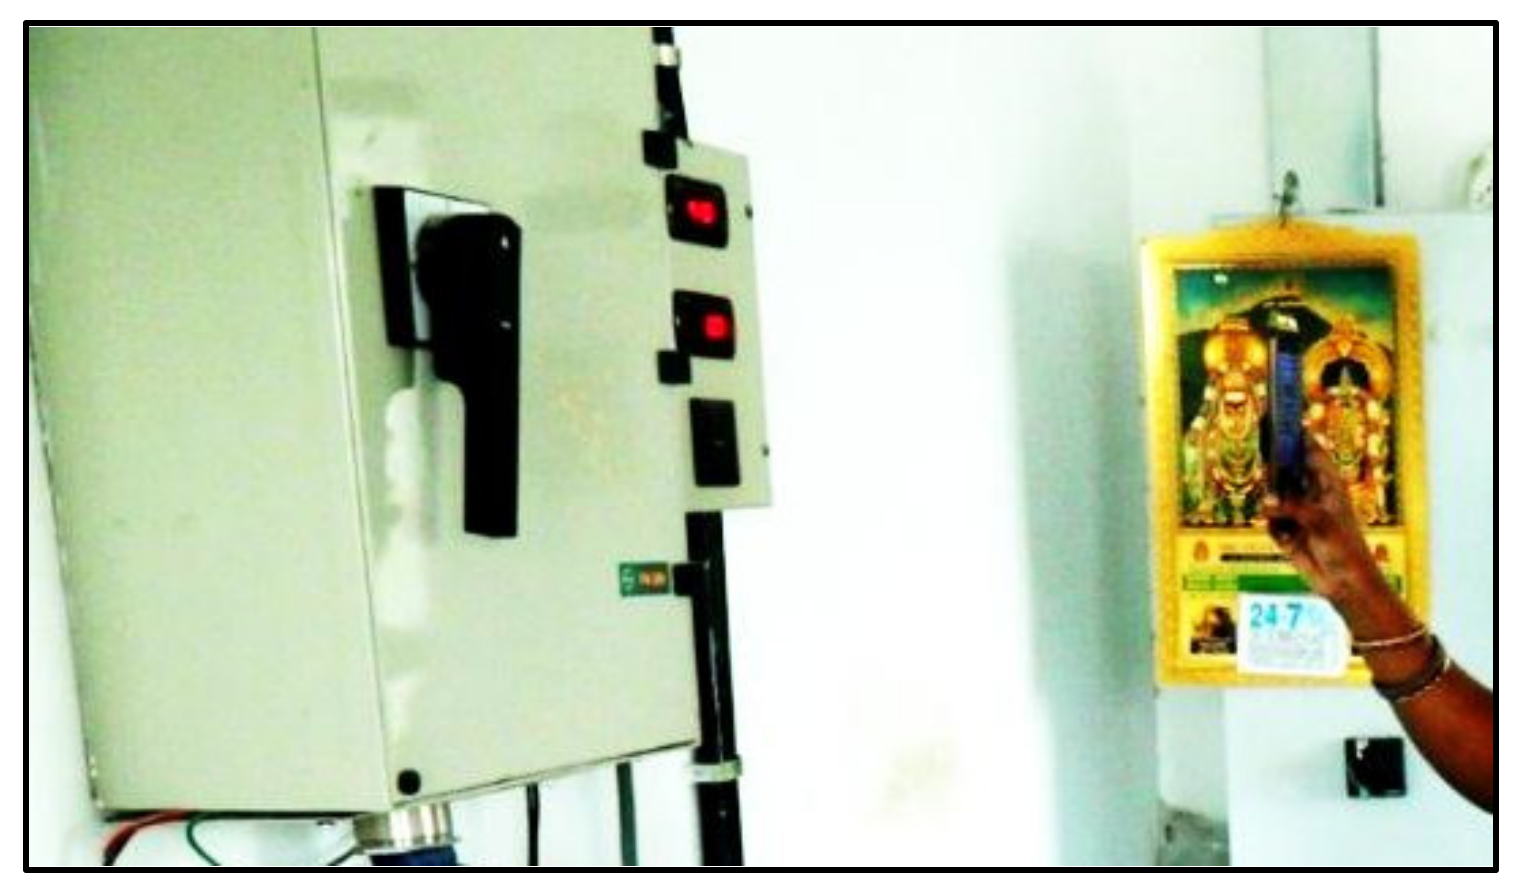
2.2. Power Meter Reading
2.3. Measurement of Slump Value
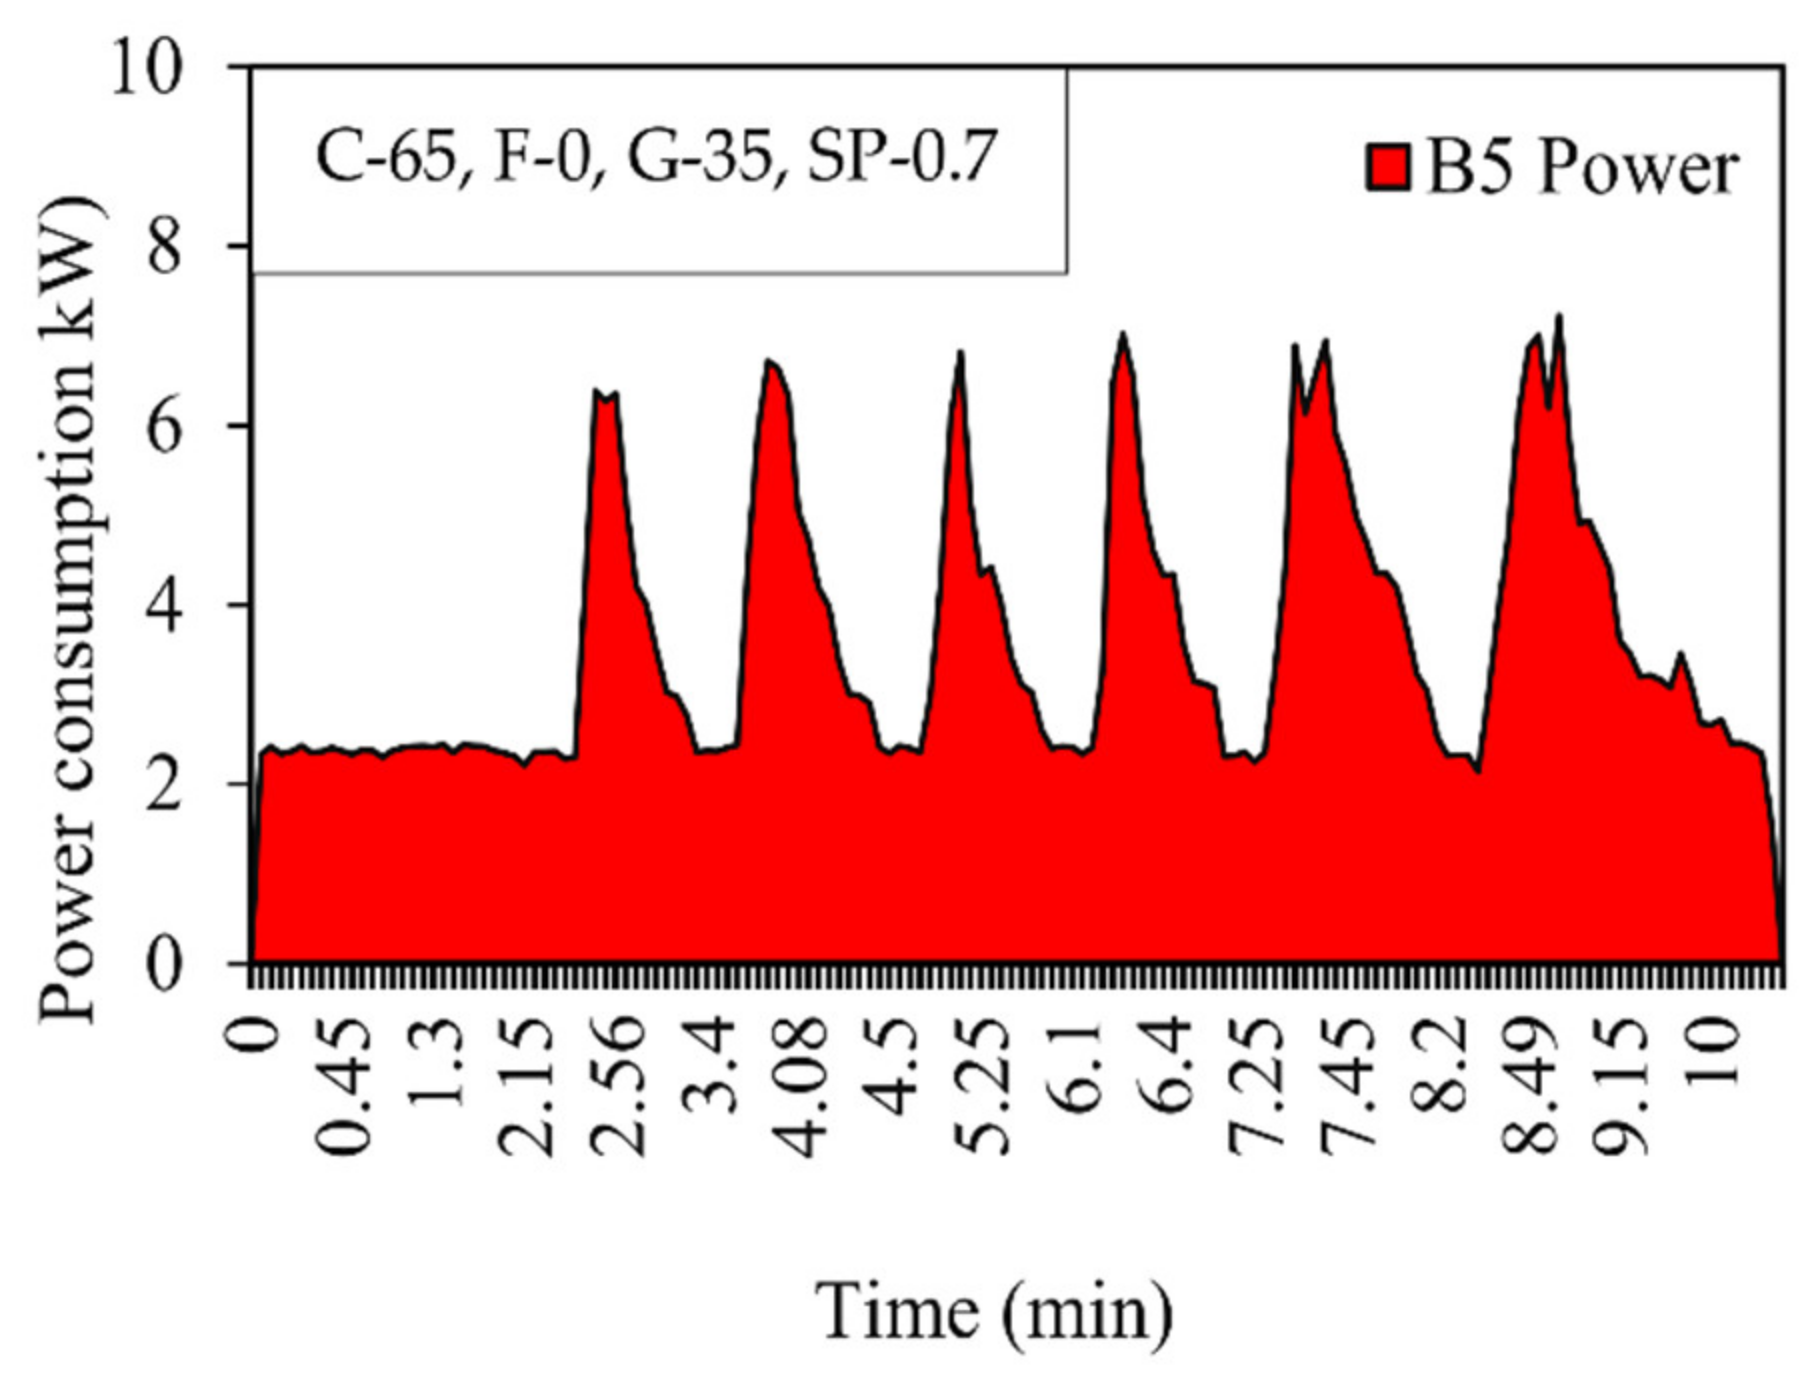
3. Results and Discussion
4. Conclusions
- –
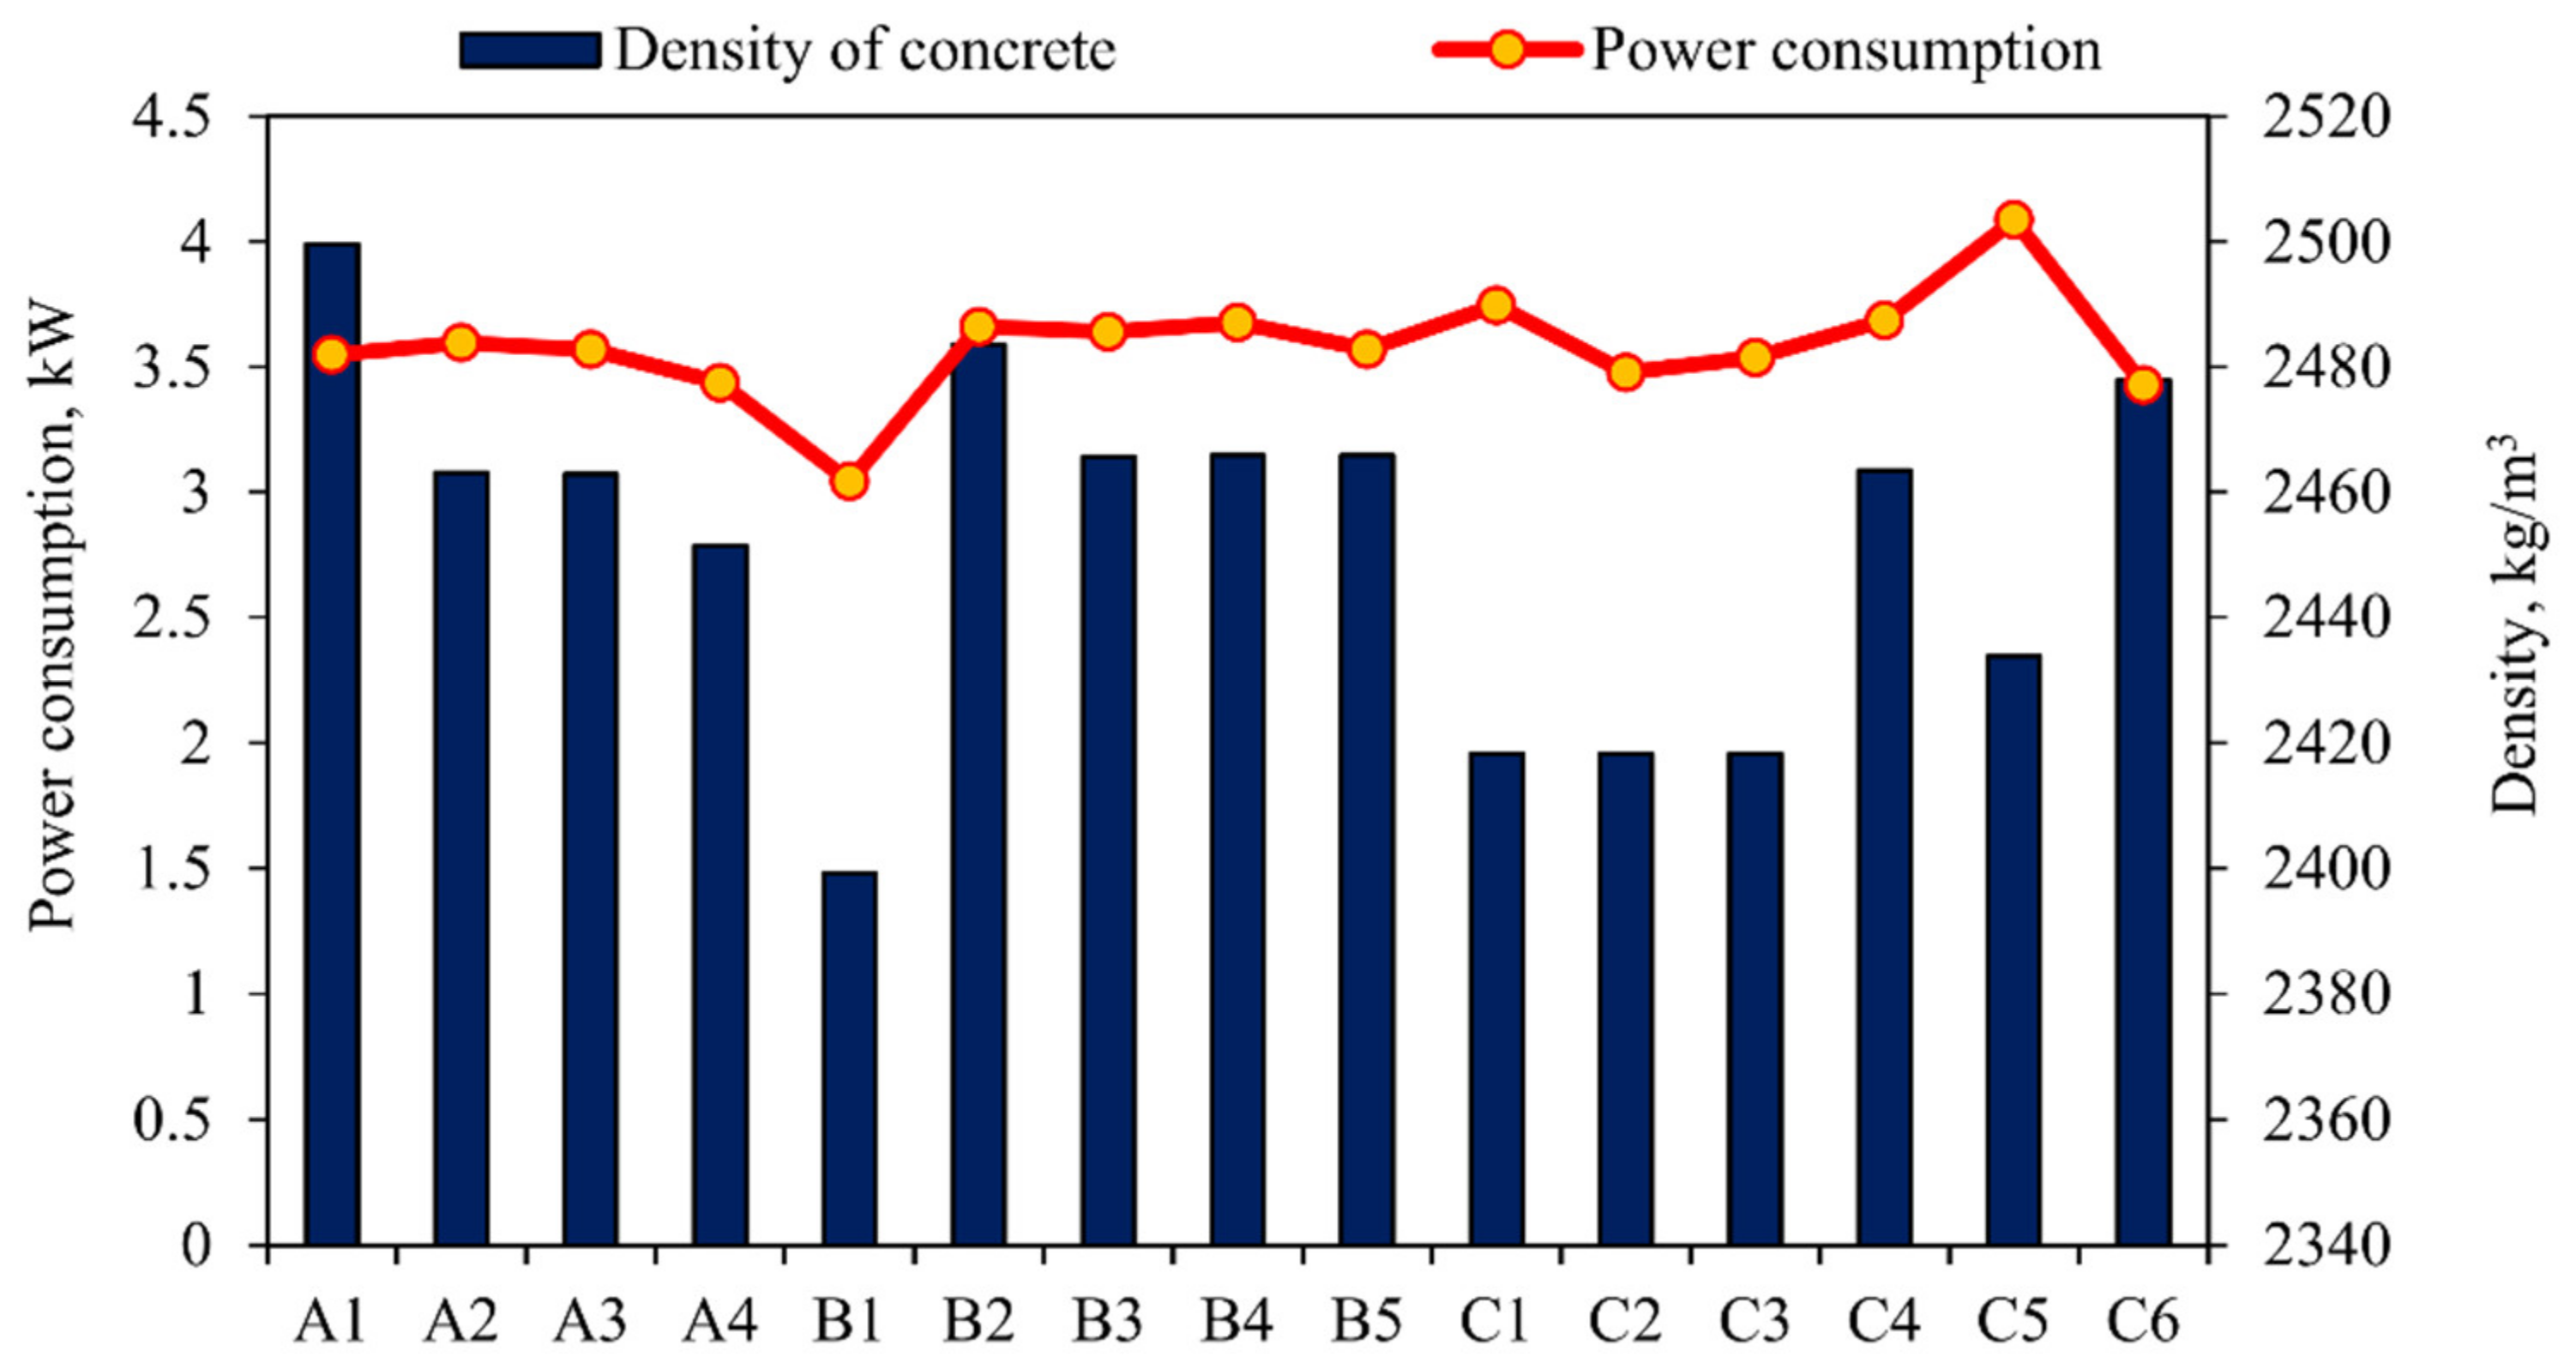
- A maximum fly ash content of 22% increases the power consumption by 19.27–20.28%. Inversely, a minimum fly ash content of 16–18% decreases the power consumption by 1.3–9.83%. A GGBS content of 35–44% increases the power consumption by 3.8–20.8%.
- –
- For the slump value, 16–18% of fly ash increases the value by 12.5–25%, and hence there is a decrease in the power consumption. A fly ash content of 22% decreases the slump by 11.8 to 15.8%, and there is a corresponding increase in the power consumption by 19.27 to 20.28%. There is an increase in the slump value of 6.7–16.8% for 35–44% GGBS content.
- –
- It is obvious from the findings that the maximum use of fly ash will consume more energy to achieve homogeneity and increase the energy required for concrete production.
- –
- For concrete containing fly ash, its curve profile, which is visible in the energy consumption curve, rises and falls unevenly due to the formation of granules when fly ash and GGBS are mixed with water.
- –
- The quality of the mixing depends upon the degree of homogeneity attained at the end. The homogeneity obtained depends on several factors, such as the properties of single particles, the properties of bulk particles, operating conditions, and mix design.
- –
- It was found that an increase or decrease in water content may also lead to an increase or decrease in power consumption. The texture of the aggregate and the mineral admixtures added to the concrete can cause internal abrasion on the surface of the mixing drum.
- –
- Aggregate and mineral admixture wear and particle collisions are other factors leading to increased power consumption. The mixer drum has difficulty blending certain materials because hard particles prevent blending and overcome the torque, so the drum consumes excess power in order to rotate. This could be one of the key reasons for the difference in power depletion when using different mineral admixtures.
Author Contributions
Funding
Institutional Review Board Statement
Informed Consent Statement
Data Availability Statement
Acknowledgments
Conflicts of Interest
References
- Kermeli, K.; Worrell, E.; Masanet, E. Energy Efficiency Improvement and Cost Saving Opportunities for the Concrete Industry. An ENERGY STAR® Guide for Energy and Plant Managers; The U.S. Environmental Protection Agency: Berkeley, CA, USA, 2011.
- Lee, Y.H.; Chua, N.; Amran, M.; Lee, Y.Y.; Kueh, A.H.; Fediuk, R.; Vatin, N.; Vasilev, Y. Thermal Performance of Structural Lightweight Concrete Composites for Potential Energy Saving. Crystals 2021, 11, 461. [Google Scholar] [CrossRef]
- Lee, Y.H.; Amran, M.; Lee, Y.Y.; Kueh, A.B.H.; Kiew, S.F.; Fediuk, R.; Vatin, N.; Vasilev, Y. Thermal behavior and energy efficiency of modified concretes in the tropical climate: A systemic review. Sustainability 2021, 13, 11957. [Google Scholar] [CrossRef]
- Makul, N.; Fediuk, R.; Amran, M.; Al-Akwaa, M.S.; Pralat, K.; Nemova, D.; Petropavlovskii, K.; Novichenkova, T.; Petropavlovskaya, V.; Sulman, M. Utilization of biomass to ash: An overview of the potential resources for alternative energy. Materials 2021, 14, 6482. [Google Scholar] [CrossRef]
- Miryuk, O.; Fediuk, R.; Amran, M. Foam Glass Crystalline Granular Material from a Polymineral Raw Mix. Crystals 2021, 11, 1447. [Google Scholar] [CrossRef]
- Kozin, A.; Fediuk, R.; Yarysova, S.; Gordienko, P.; Lesovik, V.; Mosaberpanah, M.A.; Amran, M.; Gunasekaran, M. Improvement of mechanical characteristics of mortar by using of wollastonite. Mag. Civ. Eng. 2021, 7, 10715. [Google Scholar]
- Sorensen, C.; Berge, E.; Nikolaisen, E.B. Investigation of Fiber Distribution in Concrete Batches Discharged from Ready-Mix Truck. Int. J. Concr. Struct. Mater. 2014, 8, 279–287. [Google Scholar] [CrossRef] [Green Version]
- Avudaiappan, S.; Amran, M.; Aepuru, R.; Fediuk, R.; Vatin, N. Prediction of Pore Volume Dispersion and Microstructural Characteristics of Concrete Using Image Processing Technique. Crystals 2021, 11, 1476. [Google Scholar]
- Lesovik, V.S.; Ahmed, A.A.; Fediuk, R.S.; Kozlenko, B.; Amran, Y.H.M.; Alaskhanov, A.K.; Asaad, M.A.; Murali, G.; Uvarov, V.A. Performance investigation of demolition wastes-based concrete composites. Mag. Civ. Eng. 2021, 106, 10608. [Google Scholar] [CrossRef]
- Cazacliu, B.; Roquet, N. Concrete mixing kinetics by means of power measurement. Cem. Concr. Res. 2009, 39, 182–194. [Google Scholar] [CrossRef]
- Cazacliu, B. In-mixer measurements for describing mixture evolution during concrete mixing. Chem. Eng. Res. Des. 2008, 86, 1423–1433. [Google Scholar] [CrossRef]
- Moreno Juez, J.; Artoni, R.; Cazacliu, B. Monitoring of concrete mixing evolution using image analysis. Powder Technol. 2017, 305, 477–487. [Google Scholar] [CrossRef] [Green Version]
- Kolesnikov, A.; Fediuk, R.; Amran, M.; Klyuev, S.; Klyuev, A.; Volokitina, I.; Naukenova, A.; Shapalov, S.; Utelbayeva, A.; Kolesnikova, O.; et al. Modeling of Non-Ferrous Metallurgy Waste Disposal with the Production of Iron Silicides and Zinc Distillation. Materials 2022, 15, 2542. [Google Scholar] [CrossRef]
- Loganina, V.; Davydova, O.; Fediuk, R.; Amran, M.; Klyuev, S.; Klyuev, A.; Sabitov, L.; Nabiullina, K. Improving the Durability of Lime Finishing Mortars by Modifying Them with Silicic Acid Sol. Materials 2022, 15, 2360. [Google Scholar] [CrossRef]
- Raju, S.; Rathinam, J.; Dharmar, B.; Rekha, S.; Avudaiappan, S.; Amran, M.; Ramamoorthy, R.V. Cyclically Loaded Copper Slag Admixed Reinforced Concrete Beams with Cement Partially Replaced with Fly Ash. Materials 2022, 15, 3101. [Google Scholar] [CrossRef]
- Subash, N.; Avudaiappan, S.; Adish Kumar, S.; Amran, M.; Vatin, N.; Fediuk, R.; Aepuru, R. Experimental Investigation on Geopolymer Concrete with Various Sustainable Mineral Ashes. Materials 2021, 14, 7596. [Google Scholar] [CrossRef]
- Chopin, D.; Cazacliu, B.; de Larrard, F.; Schell, R. Monitoring of concrete homogenisation with the power consumption curve. Mater. Struct. Constr. 2007, 40, 897–907. [Google Scholar] [CrossRef]
- Daumann, B.; Anlauf, H.; Nirschl, H. Determination of the energy consumption during the production of various concrete recipes. Cem. Concr. Res. 2009, 39, 590–599. [Google Scholar] [CrossRef]
- Avudaiappan, S.; Prakatanoju, S.; Amran, M.; Aepuru, R.; Saavedra Flores, E.I.; Das, R.; Gupta, R.; Fediuk, R.; Vatin, N. Experimental Investigation and Image Processing to Predict the Properties of Concrete with the Addition of Nano Silica and Rice Husk Ash. Crystals 2021, 11, 1230. [Google Scholar] [CrossRef]
- Lesovik, V.; Fediuk, R.; Amran, M.; Alaskhanov, A.; Volodchenko, A.; Murali, G.; Uvarov, V.; Elistratkin, M. 3d-printed mortars with combined steel and polypropylene fibers. Fibers 2021, 9, 79. [Google Scholar] [CrossRef]
- Arularasi, V.; Thamilselvi, P.; Avudaiappan, S.; Flores, E.I.S.; Amran, M.; Fediuk, R.; Vatin, N.; Karelina, M. Rheological behavior and strength characteristics of cement paste and mortar with fly ash and GGBS admixtures. Sustainability 2021, 13, 9600. [Google Scholar] [CrossRef]
- Jang, K.P.; Kwon, S.H.; Choi, M.S.; Kim, Y.J.; Park, C.K.; Shah, S.P. Experimental Observation on Variation of Rheological Properties during Concrete Pumping. Int. J. Concr. Struct. Mater. 2018, 12, 79. [Google Scholar] [CrossRef]
- Tattersall, G.H.; Banfill, P.F. The Rheology of Fresh Concrete, 1st ed.; Pitman Books Limited: London, UK, 1983. [Google Scholar]
- Amran, M.; Abdelgader, H.S.; Onaizi, A.M.; Fediuk, R.; Ozbakkaloglu, T.; Rashid, R.S.; Murali, G. 3D-printable alkali-activated concretes for building applications: A critical review. Constr. Build. Mater. 2022, 319, 126126. [Google Scholar] [CrossRef]
- Klyuev, S.; Klyuev, A.; Fediuk, R.; Ageeva, M.; Fomina, E.; Amran, M.; Murali, G. Fresh and mechanical properties of low-cement mortars for 3D printing. Constr. Build. Mater. 2022, 338, 127644. [Google Scholar] [CrossRef]
- Chakrawarthi, V.; Avudaiappan, S.; Amran, M.; Dharmar, B.; Raj Jesuarulraj, L.; Fediuk, R.; Saavedra Flores, E. Impact Resistance of Polypropylene Fibre-Reinforced Alkali–Activated Copper Slag Concrete. Materials 2021, 14, 7735. [Google Scholar] [CrossRef]
- Makul, N.; Fediuk, R.; Amran, H.M.M.; Zeyad, A.M.; de Azevedo, A.R.G.; Klyuev, S.; Vatin, N.; Karelina, M. Capacity to develop recycled aggregate concrete in south east asia. Buildings 2021, 11, 234. [Google Scholar] [CrossRef]
- Dils, J.; De Schutter, G.; Boel, V. Influence of mixing procedure and mixer type on fresh and hardened properties of concrete: A review. Mater. Struct. 2012, 45, 1673–1683. [Google Scholar] [CrossRef]
- Mazanec, O.; Lowke, D.; Schiel, P. Mixing of high performance concrete: Effect of concrete composition and mixing intensity on mixing time. Mater. Struct. Constr. 2010, 43, 357–365. [Google Scholar] [CrossRef]
- Beitzel, H. Optimisation of the Mixing Process for Producing SCHP Concrete; RILEM Bookseries; Springer: Berlin/Heidelberg, Germany, 2010; Volume 1, pp. 175–183. [Google Scholar] [CrossRef]
- Cazacliu, B.; Legrand, J. Characterization of the granular-to-fluid state process during mixing by power evolution in a planetary concrete mixer. Chem. Eng. Sci. 2008, 63, 4617–4630. [Google Scholar] [CrossRef]
- Yang, M.; Jennings, H.M. Influences of mixing methods on the microstructure and rheological behavior of cement paste. Adv. Cem. Based Mater. 1995, 2, 70–78. [Google Scholar] [CrossRef]
- Lim, J.L.G.; Raman, S.N.; Lai, F.C.; Zain, M.F.M.; Hamid, R. Synthesis of nano cementitious additives from agricultural wastes for the production of sustainable concrete. J. Clean. Prod. 2018, 171, 1150–1160. [Google Scholar] [CrossRef]
- Lim, J.L.G.; Raman, S.N.; Safiuddin, M.; Zain, M.F.M.; Hamid, R. Autogenous Shrinkage, Microstructure, and Strength of Ultra-High Performance Concrete Incorporating Carbon Nanofibers. Materials 2019, 12, 320. [Google Scholar] [CrossRef] [PubMed] [Green Version]
- Wallevik, J.E.; Wallevik, O.H. Analysis of shear rate inside a concrete truck mixer. Cem. Concr. Res. 2017, 95, 9–17. [Google Scholar] [CrossRef]
- Wang, K.; Hu, J. Use of a moisture sensor for monitoring the effect of mixing procedure on uniformity of concrete mixtures. J. Adv. Concr. Technol. 2005, 3, 371–383. [Google Scholar] [CrossRef] [Green Version]
- Chopin, D.; de Larrard, F.; Cazacliu, B. Why do HPC and SCC require a longer mixing time? Cem. Concr. Res. 2004, 34, 2237–2243. [Google Scholar] [CrossRef]
- Ngo, H.T.; Kaci, A.; Kadri, E.H.; Ngo, T.T.; Trudel, A.; Lecrux, S. Energy consumption reduction in concrete mixing process by optimizing mixing time. Energy Procedia 2017, 139, 810–816. [Google Scholar] [CrossRef]
- Kazaz, A.; Ulubeyli, S.; Er, B.; Arslan, V.; Arslan, A.; Atici, M. Fresh Ready-mixed Concrete Waste in Construction Projects: A Planning Approach. Procedia Eng. 2015, 123, 268–275. [Google Scholar] [CrossRef] [Green Version]
- Nelubova, V.; Strokova, V.; Fediuk, R.; Amran, M.; Vatin, N.; Vasilev, Y. Effect of an aluminosilicate disperse additive on behaviors of autoclave silicate materials. Buildings 2021, 11, 239. [Google Scholar] [CrossRef]
- Collet, R.; Oulahna, D.; de Ryck, A.; Jezequel, P.H.; Martin, M. Mixing of a wet granular medium: Effect of the particle size, the liquid and the granular compacity on the intensity consumption. Chem. Eng. J. 2010, 164, 299–304. [Google Scholar] [CrossRef]
- Lesovik, V.; Volodchenko, A.; Fediuk, R.; Mugahed Amran, Y.H. Improving the Hardened Properties of Nonautoclaved Silicate Materials Using Nanodispersed Mine Waste. J. Mater. Civ. Eng. 2021, 33, 4021214. [Google Scholar] [CrossRef]
- Lesovik, V.; Volodchenko, A.; Fediuk, R.; Mugahed Amran, Y.H.; Timokhin, R. Enhancing performances of clay masonry materials based on nanosize mine waste. Constr. Build. Mater. 2021, 269, 121333. [Google Scholar] [CrossRef]
- Arularasi, V.; Thamilselvi, P.; Avudaiappan, S.; Flores, E.I.S. Energy Consumption of Self-Compacting Concrete during Mixing and Its Impact on the Yield Stress Measured in the Ready-Mix Concrete Plant. Adv. Civ. Eng. 2021, 2021, 6664577. [Google Scholar] [CrossRef]
- Raman, S.N.; Ngo, T.; Mendis, P.; Mahmud, H.B. High-strength rice husk ash concrete incorporating quarry dust as a partial substitute for sand. Constr. Build. Mater. 2011, 25, 3123–3130. [Google Scholar] [CrossRef]
- Tamanna, K.; Raman, S.N.; Jamil, M.; Hamid, R. Utilization of wood waste ash in construction technology: A review. Constr. Build. Mater. 2020, 237, 117654. [Google Scholar] [CrossRef]
- Tang, Y.X.; Lee, Y.H.; Amran, M.; Fediuk, R.; Vatin, N.; Kueh, A.B.H.; Lee, Y.Y. Artificial Neural Network-Forecasted Compression Strength of Alkaline-Activated Slag Concretes. Sustainability 2022, 14, 5214. [Google Scholar] [CrossRef]
- Amran, M.; Murali, G.; Khalid, N.H.A.; Fediuk, R.; Ozbakkaloglu, T.; Lee, Y.H.; Haruna, S.; Lee, Y.Y. Slag uses in making an ecofriendly and sustainable concrete: A review. Constr. Build. Mater. 2021, 272, 121942. [Google Scholar] [CrossRef]
- Watano, S. Direct control of wet granulation processes by image processing system. Powder Technol. 2001, 117, 163–172. [Google Scholar] [CrossRef]
- Leuenberger, H.; Betz, G. Chapter 15 Granulation process control—Production of pharmaceutical granules: The classical batch concept and the problem of scale-up. Handb. Powder Technol. 2007, 11, 705–733. [Google Scholar] [CrossRef]
- Kristensen, H.G. Particle agglomeration in high shear mixers. Powder Technol. 1996, 88, 197–202. [Google Scholar] [CrossRef]
- Watano, S. Chapter 10 Online monitoring. Handb. Powder Technol. 2007, 11, 477–498. [Google Scholar] [CrossRef]
- Kazaz, A.; Ulubeyli, S. Current Methods for the Utilization of the Fresh Concrete Waste Returned to Batching Plants. Procedia Eng. 2016, 161, 42–46. [Google Scholar] [CrossRef] [Green Version]
- Leuenberger, H. Granulation, new techniques. Pharm. Acta Helv. 1982, 57, 72–82. [Google Scholar]
- Daumann, B.; Fath, A.; Anlauf, H.; Nirschl, H. Determination of the mixing time in a discontinuous powder mixer by using image analysis. Chem. Eng. Sci. 2009, 64, 2320–2331. [Google Scholar] [CrossRef] [Green Version]
- Daumann, B.; Nirschl, H. Assessment of the mixing efficiency of solid mixtures by means of image analysis. Powder Technol. 2008, 182, 415–423. [Google Scholar] [CrossRef] [Green Version]
- Wang, Y.; Huang, J.; Wang, D.; Liu, Y.; Zhao, Z.; Liu, J. Experimental investigation on thermal conductivity of aerogel-incorporated concrete under various hygrothermal environment. Energy 2019, 188, 115999. [Google Scholar] [CrossRef]


 —SNF is used and for other mixes,
  —PCE is used.
—SNF is used and for other mixes, —PCE is used.
—PCE is used.
—SNF is used and for other mixes, —PCE is used.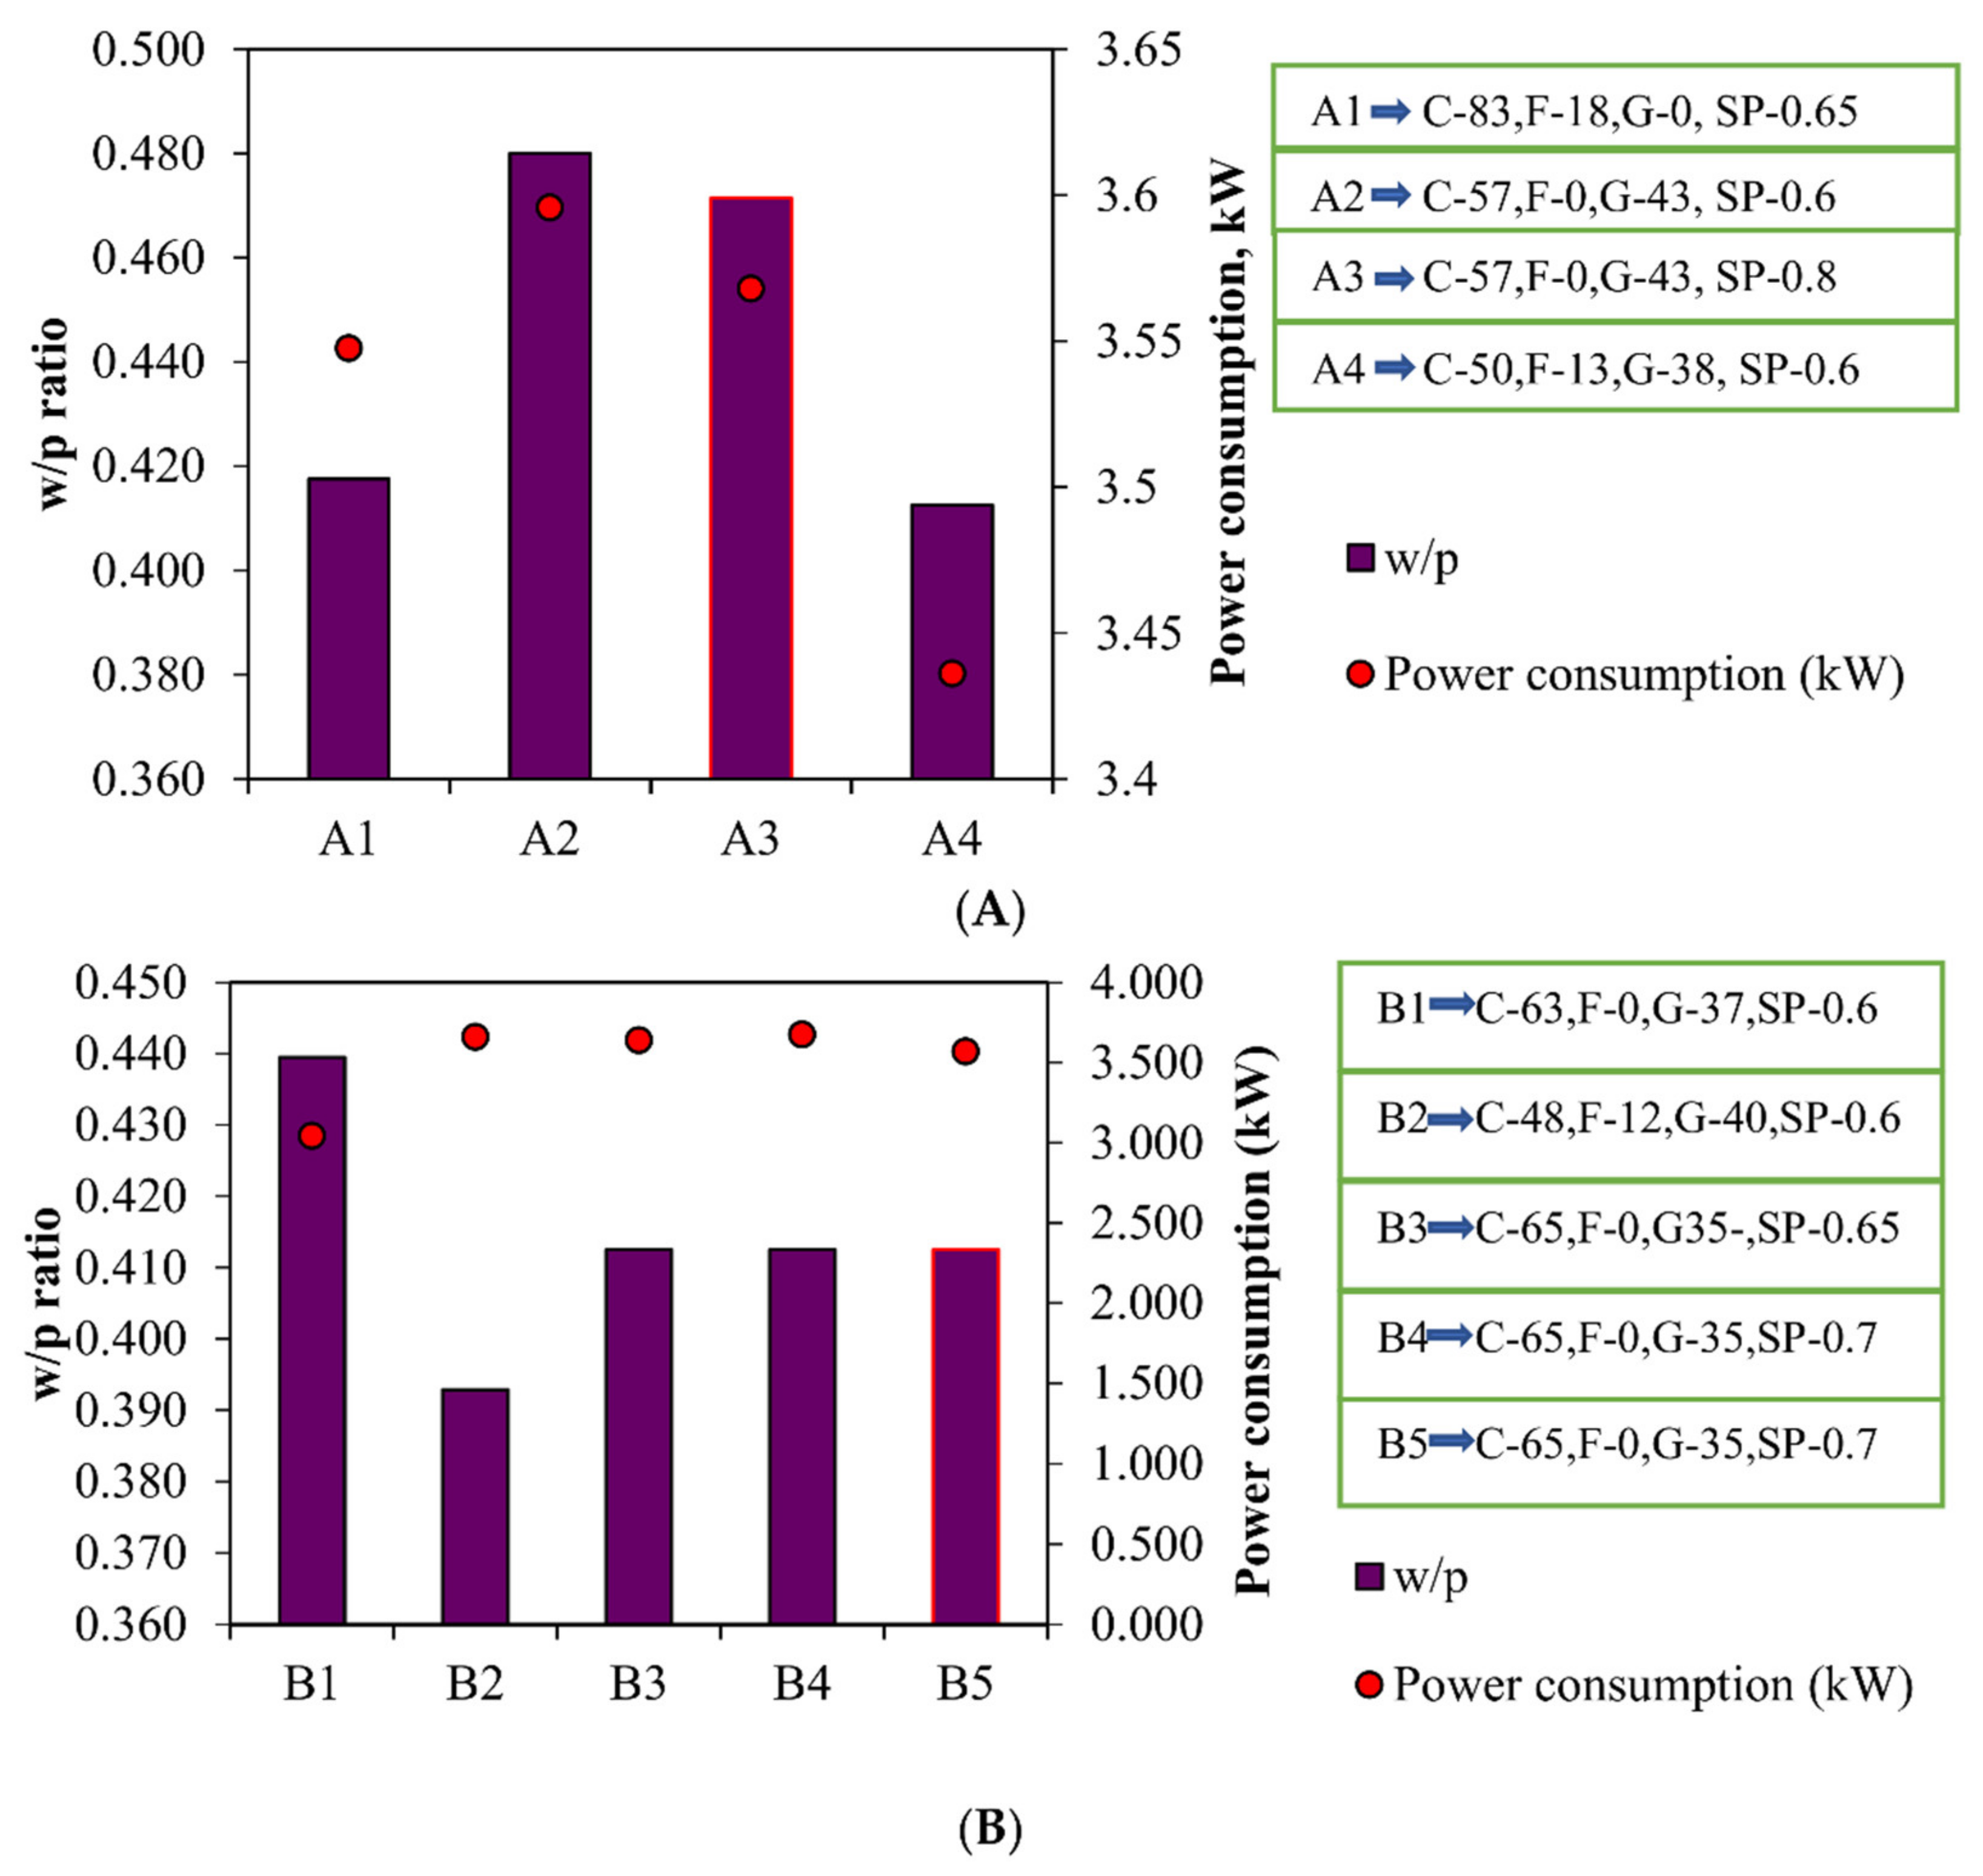


| Components | SiO2 | Al2O3 | CaO | MgO | Fe2O3 | SO3 | S | Cl | Na2O | K2O | TiO2 | Mn2O3 |
|---|---|---|---|---|---|---|---|---|---|---|---|---|
| Cement | 23.6 | 6.2 | 62.3 | 2.5 | 3.1 | 1.9 | - | 0.03 | - | - | - | - |
| Fly ash | 51.5 | 18.8 | 5.7 | 1.9 | 17.1 | 2.5 | 0.5 | - | 0.4 | 0.6 | 0.75 | 0.12 |
| GGBS | 32.5 | 11.2 | 41.3 | 10.6 | 2.1 | 0.5 | - | - | - | 0.32 | 0.6 | 0.35 |
| Properties | Cement | GGBS | Fly Ash |
|---|---|---|---|
| Initial setting time (min) | 30 | 90 | 80 |
| Specific gravity | 3.15 | 2.9 | 2.7 |
| Normal consistency (%) | 29 | - | - |
| Final setting time (min) | 510 | 550 | 580 |
| Specific surface area, m2/kg | 300 | 375 | 390 |
| Properties | Sand #1 (Sand-C) | Sand #2 (Sand-M) | Gravel #1 (12 mm) | Gravel #2 (20 mm) |
|---|---|---|---|---|
| Specific gravity | 2.6 | 2.7 | 2.6 | 2.6 |
| Water absorption | 0.9 | 1.7 | 1 | 1 |
| Fineness modulus | 3.3 | 3.4 | 5.2 | 6.5 |
| Parameter | SNF | PCE |
|---|---|---|
| Chemical name | Sulphonated naphthalene formaldehyde | Polycarboxylic Ether |
| Appearance | Reddish-brown liquid | Light-brown liquid |
| pH | 6 | 6 |
| Relative density | 1.11 | 1.07 |
| Chloride content | 0.2% | 0.1% |
| Type | Retarding Superplasticizer | Retarding Superplasticizer |
| Components | Cement | C-Sand | M-Sand | Fly Ash | GGBS | Water | Superplasticizer | ||
|---|---|---|---|---|---|---|---|---|---|
| Mix | Grade | kg/m3 | Quantity (kg) | Type | |||||
| A1 | M25 | 330 | 432 | 322 | 70 | 0 | 167 | 2.6 | PCE |
| A2 | M25 | 200 | 400 | 400 | 0 | 150 | 168 | 2.1 | PCE |
| A3 | M25 | 200 | 458 | 305 | 0 | 150 | 165 | 2.8 | SNF |
| A4 | M25 | 200 | 438 | 292 | 50 | 150 | 165 | 2.4 | PCE |
| B1 | M30 | 240 | 360 | 360 | 0 | 140 | 167 | 2.28 | PCE |
| B2 | M30 | 200 | 444 | 290 | 50 | 170 | 165 | 2.52 | PCE |
| B3 | M30 | 260 | 382 | 382 | 0 | 140 | 165 | 2.6 | PCE |
| B4 | M30 | 260 | 382 | 382 | 0 | 140 | 165 | 2.8 | PCE |
| B5 | M30 | 260 | 382 | 382 | 0 | 140 | 165 | 2.8 | SNF |
| C1 | M40 | 250 | 350 | 350 | 0 | 200 | 164 | 2.25 | PCE |
| C2 | M40 | 250 | 350 | 350 | 0 | 200 | 164 | 2.25 | SNF |
| C3 | M40 | 250 | 350 | 350 | 0 | 200 | 164 | 2.25 | PCE |
| C4 | M40 | 410 | 363 | 363 | 80 | 0 | 165 | 2.45 | PCE |
| C5 | M40 | 360 | 349 | 349 | 100 | 0 | 168 | 2.76 | PCE |
| C6 | M40 | 280 | 350 | 350 | 0 | 200 | 165 | 2.88 | PCE |
| Mix | Water/Powder | Total Quantity (m3) | Batch Quantity (m3) | Duration of Mixing (Min) |
|---|---|---|---|---|
| A1 | 0.413 | 6 | 1 | 7.48 |
| A2 | 0.48 | 6 | 1 | 8.15 |
| A3 | 0.471 | 6 | 1 | 8.25 |
| A4 | 0.413 | 6 | 1 | 5.25 |
| B1 | 0.439 | 4 | 1 | 8.55 |
| B2 | 0.393 | 6 | 1 | 8.4 |
| B3 | 0.413 | 6 | 1 | 9.23 |
| B4 | 0.413 | 6 | 1 | 10.4 |
| B5 | 0.413 | 6 | 1 | 8.15 |
| C1 | 0.364 | 5 | 1 | 6.34 |
| C2 | 0.364 | 7 | 1 | 9.53 |
| C3 | 0.364 | 4 | 1 | 5.15 |
| C4 | 0.337 | 6 | 1 | 7.42 |
| C5 | 0.365 | 5 | 1 | 6.08 |
| C6 | 0.344 | 6 | 1 | 8.27 |
| Mix | Power Consumption (kW) | Slump (mm) |
|---|---|---|
| A1 | 3.547 | 200 |
| A2 | 3.595 | 160 |
| A3 | 3.568 | 190 |
| A4 | 3.436 | 160 |
| B1 | 3.042 | 170 |
| B2 | 3.659 | 150 |
| B3 | 3.638 | 160 |
| B4 | 3.675 | 170 |
| B5 | 3.568 | 170 |
| C1 | 3.744 | 180 |
| C2 | 3.477 | 180 |
| C3 | 3.536 | 170 |
| C4 | 3.685 | 190 |
| C5 | 4.086 | 160 |
| C6 | 3.426 | 180 |
Publisher’s Note: MDPI stays neutral with regard to jurisdictional claims in published maps and institutional affiliations. |
© 2022 by the authors. Licensee MDPI, Basel, Switzerland. This article is an open access article distributed under the terms and conditions of the Creative Commons Attribution (CC BY) license (https://creativecommons.org/licenses/by/4.0/).
Share and Cite
Arularasi, V.; Pachiappan, T.; Avudaiappan, S.; Raman, S.N.; Guindos, P.; Amran, M.; Fediuk, R.; Vatin, N.I. Effects of Admixtures on Energy Consumption in the Process of Ready-Mixed Concrete Mixing. Materials 2022, 15, 4143. https://doi.org/10.3390/ma15124143
Arularasi V, Pachiappan T, Avudaiappan S, Raman SN, Guindos P, Amran M, Fediuk R, Vatin NI. Effects of Admixtures on Energy Consumption in the Process of Ready-Mixed Concrete Mixing. Materials. 2022; 15(12):4143. https://doi.org/10.3390/ma15124143
Chicago/Turabian StyleArularasi, Veerabadrasamy, Thamilselvi Pachiappan, Siva Avudaiappan, Sudharshan Naidu Raman, Pablo Guindos, Mugahed Amran, Roman Fediuk, and Nikolai Ivanovich Vatin. 2022. "Effects of Admixtures on Energy Consumption in the Process of Ready-Mixed Concrete Mixing" Materials 15, no. 12: 4143. https://doi.org/10.3390/ma15124143