Article

Research and Statistical Analysis on Impact Resistance of Steel Fiber Expanded Polystyrene Concrete and Expanded Polystyrene Concrete

1
State Key Laboratory of Hydraulic Engineering Simulation and Safety, Tianjin University, Tianjin 300350, China
2
School of Civil Engineering, Tianjin University, Tianjin 300350, China
*
Author to whom correspondence should be addressed.
Materials 2022, 15(12), 4216; https://doi.org/10.3390/ma15124216
Submission received: 13 May 2022 / Revised: 6 June 2022 / Accepted: 11 June 2022 / Published: 14 June 2022
(This article belongs to the Topic Multifunctional Concrete for Smart Infrastructures)

Abstract

:
Steel fiber foamed concrete (SFFC) combines the impact resistance of steel fiber concrete (SFC) and the energy absorption characteristics of foamed concrete (FC), and it has brought attention to the impact field. Using the mechanical properties of SFFC expanded polystyrene concrete, we prepared (EPSC) specimens with 10%, 20%, 30%, 40%, 50% by volume of expanded polystyrene (Veps), and steel fiber expanded polystyrene concrete (SFEPSC) specimens by adding 1% steel fiber (SF) based on the EPSC in this study. The relationship between compressive strength, the Veps and apparent density was revealed. The relationship between the first crack and the ultimate failure impact of SFEPSC specimens was obtained by a drop-weight test. The impact resistance of SFEPSC and EPSC and the variation law of Veps were studied by mathematical statistics. The log-normal and the two-parameter Weibull distributions were used to fit the probability distribution of impact resistance of the SFEPSC and EPSC specimens. Finally, both types of specimens’ destruction modes and mechanisms were analyzed. The mechanism of the EPS particles and the SFs dissipating impact load energy was analyzed from the energy point of view.

1. Introduction

It is well known that concrete structures encounter both static and dynamic loads (such as seismic, shock, and explosion loads) during their design life [1,2,3]. Concrete structures are more likely to be destroyed under the dynamic load, and the casualties and property losses are also more serious [4,5]. To make concrete structures safe, some scholars have researched improving the dynamic mechanical properties of concrete structures [6,7,8]. It has been shown that metal foams with good impact resistance [9,10] are often used as a protective layer of structures. However, the cost of foam metal is high, and it is not suitable for the construction of buildings as a whole. As a low-cost porous material, FC has good energy dissipation properties [7]. The static and dynamic compressive properties, stiffness and toughness of foamed concrete can be significantly improved by adding glass fibers (GF) and polypropylene fibers (PPF) [11,12,13,14]. Therefore, it is more suitable for the direct construction of concrete structures. However, there can be a weakness if the concrete structure is subjected to a high-temperature detonation shock wave; the weak fire resistance of GF and PPF leads to decreased mechanical properties [15,16,17]. Some researchers think that SF is a good material [18]; they hold that SFFC has excellent physical properties [19], dynamic mechanical properties and fire resistance [20,21]. However, these studies revealed the ultimate bearing capacity of SFFC at different strain rates through an SHPB test but ignored the accumulation of fatigue damage during the cyclic impact process. This is extremely detrimental to the protective effect of the material during service and even affects the operational safety of concrete structures in service. Therefore, it is significant to reveal the statistical characteristics of fatigue damage of protective materials under impact loads.
In addition, the type of foaming agent [22] and pore structure [23] also affect the mechanical properties of concrete structures. The mechanical properties of FC were significantly reduced in the dry-wet cycle environment [24]. EPSC, which makes use of the advantages and makes up for the deficiencies of FC, is suitable for above-ground, underground and dry-wet cycle projects [25,26]. However, studies incorporating SF have rarely been reported. In this study, the EPSC specimens with five EPS volumes (Veps = 10%, 20%, 30%, 40% and 50%) were designed and marked as S0E10, S0E20, S0E30, S0E40, S0E50. Based on the EPSC, the SFEPSC specimens were prepared by adding 1% SF by volume, marked as S1E10, S1E20, S1E30, S1E40, and S1E50. A drop-weight test statistically analyzed the impact test results of SFEPSC and EPSC. The fatigue damage characteristics and energy dissipation mechanism of two types of concrete materials were also analyzed.

2. Experimental

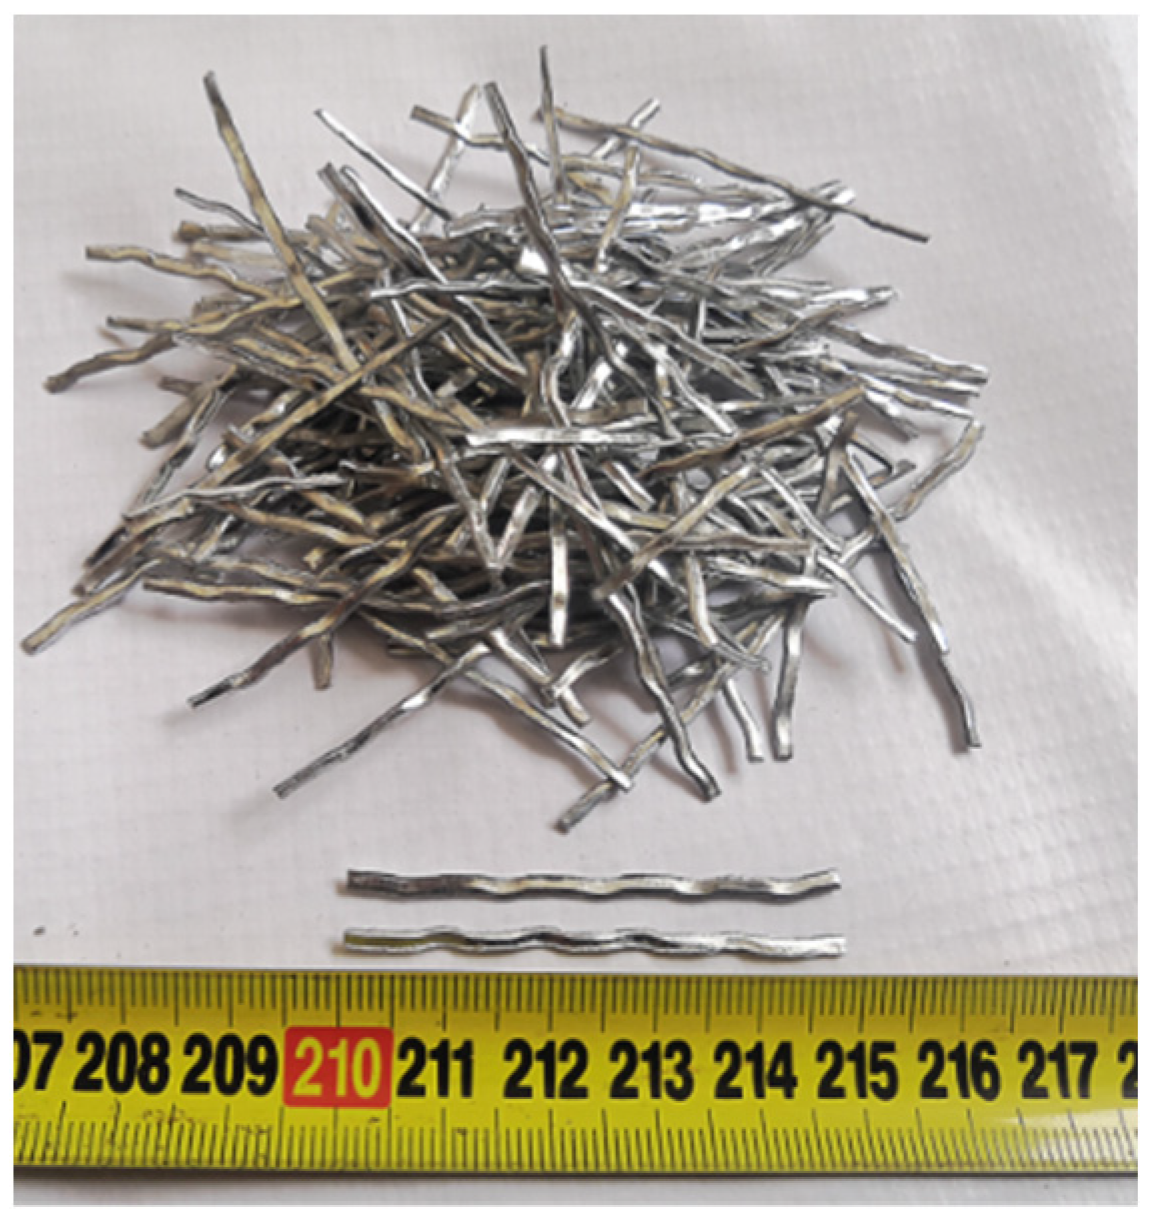
2.1. Materials and Mix Proportions

P.O 42.5 grade ordinary Portland cement (PC), whose compressive and flexural strengths are 24.3 MPa (3-d) and 4.1 Mpa (3-d) by the Chinese standard GB/T 17671–1999 test method [27], was used in this study. Microsilica (Ms) can improve the mechanical properties of materials. Thus, the mix proportion of Ms was replaced by 10% of the cement mass. The chemical composition of cement and microsilica is shown in Table 1.
EPS with good heat insulation and shock absorption was prepared by suspension polymerization of styrene and adding a blowing agent. The density of EPS is 25 kg/m3, and the diameter is 3–5 mm. Figure 1 shows the diameter gradation of the EPS particles used in the experiment. Corrugated steel fiber (SF) shown in Figure 2 was made of cold-rolled strip steel through a shearing and scoring process, which has high tensile strength, easy dispersion and good adhesion to concrete. The SF has a density of 7810 kg/m3, a length of 48 mm, and an aspect ratio (length of SF/diameter or width of SF) of 24. The tensile strength was 610 MPa.
Fine aggregate (FA) was natural river sand with a bulk density of 1710 kg/m3 and a medium sand fineness modulus of 2.73. The usage amount was 30% of the aggregate mass. The coarse aggregate (CA) was limestone, and its physical properties are shown in Table 2. Polycarboxylate superplasticizer (PS) was used, for which the water (W) reduction rate was 20–30%.
The SFEPSC and EPSC specimens with a diameter of 152 mm and a thickness of 64 mm are shown in Figure 3. There were 12 specimens prepared for each mix proportion, and the total account of both types of specimens was 120. The compressive strength (fcu) of the basis mix proportion marked S0E0 was 48.7 MPa (28-d). The specimen type number and mix proportion of SFEPSC and EPSC are shown in Table 3.

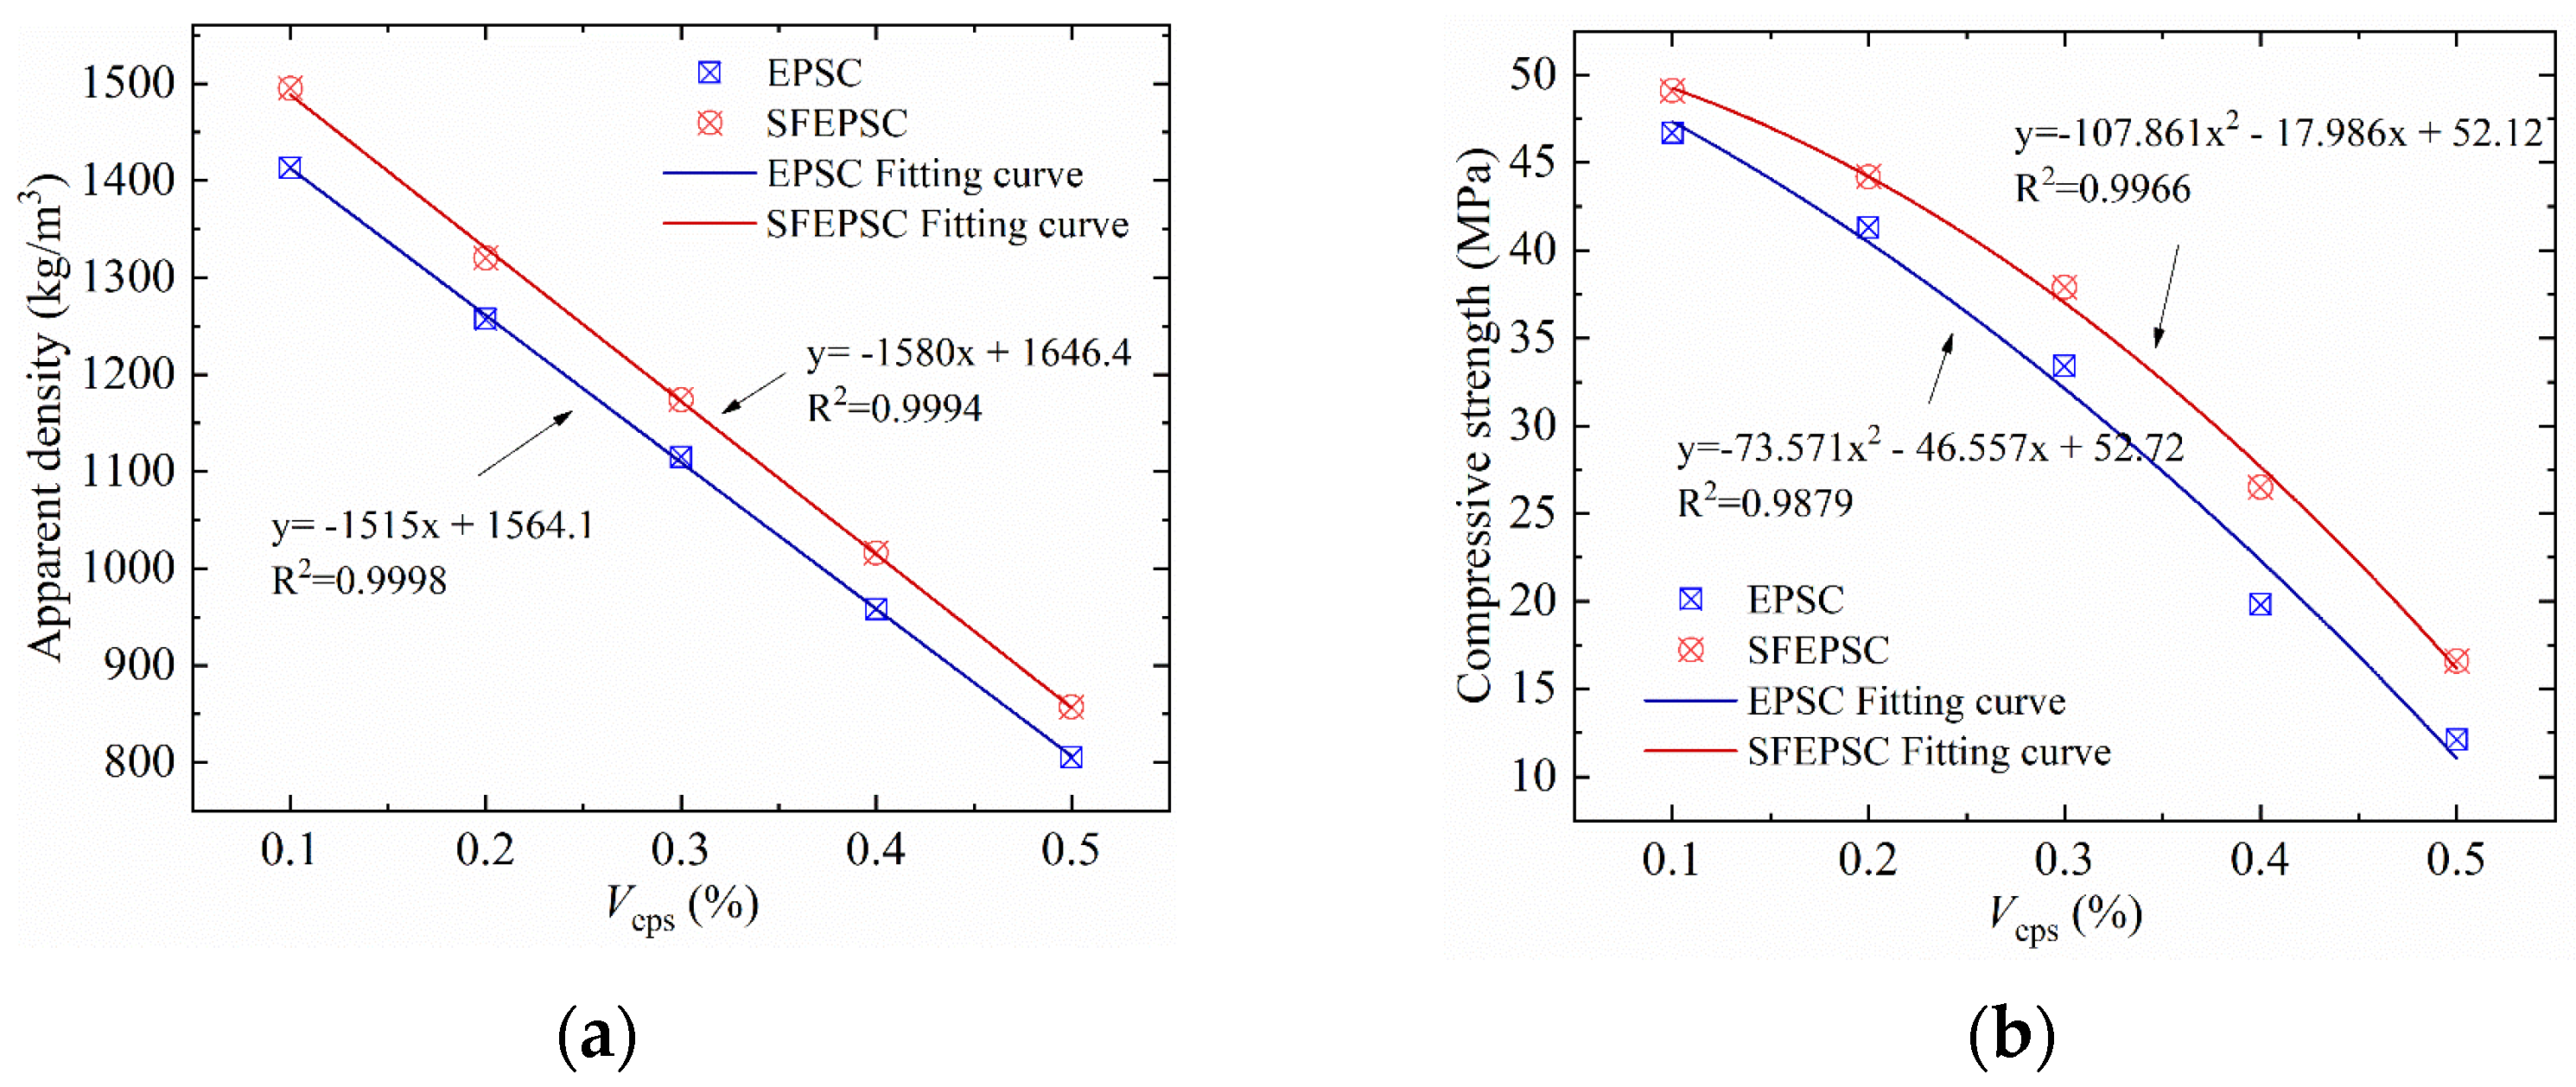
2.2. The Influence of Veps and Apparent Density on Compressive Strength

Figure 4a,b, and c show the relationship between compressive strength, the Veps and the apparent density of SFEPSC and EPSC. It can be seen in Figure 4 that: (1) the apparent density of two types of concrete decreases linearly with the increase in Veps, as shown in Figure 4a. The apparent density of SFEPSC decreases 4.9% faster than the apparent density of EPSC, and the compressive strength shows a quadratic curve decreasing trend with the increase in Veps shown in Figure 4b. (2) The compressive strength of both concrete specimens increases with the apparent density, as shown in Figure 4c. The compressive strength of SFEPSC increases at a slower rate than EPSC when the apparent density is less than 1250 kg/m3. When the apparent density is more than 1250 kg/m3, the compressive strength increase rate is opposite to that of less than 1250 kg/m3. (3) The compressive strength of SFEPSC at Veps equal to 10%, 20%, 30%, 40% and 50% are 49.1 MPa, 44.2 Mpa, 37.9 Mpa, 26.5 Mpa and 16.6 Mpa, as shown in Figure 4c. The apparent density is 95%, 84%, 75%, 65% and 55% of S0E0. The compressive strength of EPSC at Veps equal to 10%, 20%, 30%, 40% and 50% are 46.7 MPa, 41.3 MPa, 33.4 MPa, 19.8 MPa and 12.1 MPa. The apparent density is 90%, 80%, 71%, 61% and 51% of S0E0. The above results showed that the compressive strength of SFEPSC can be higher than S0E0 when the Veps is equal to 10%.

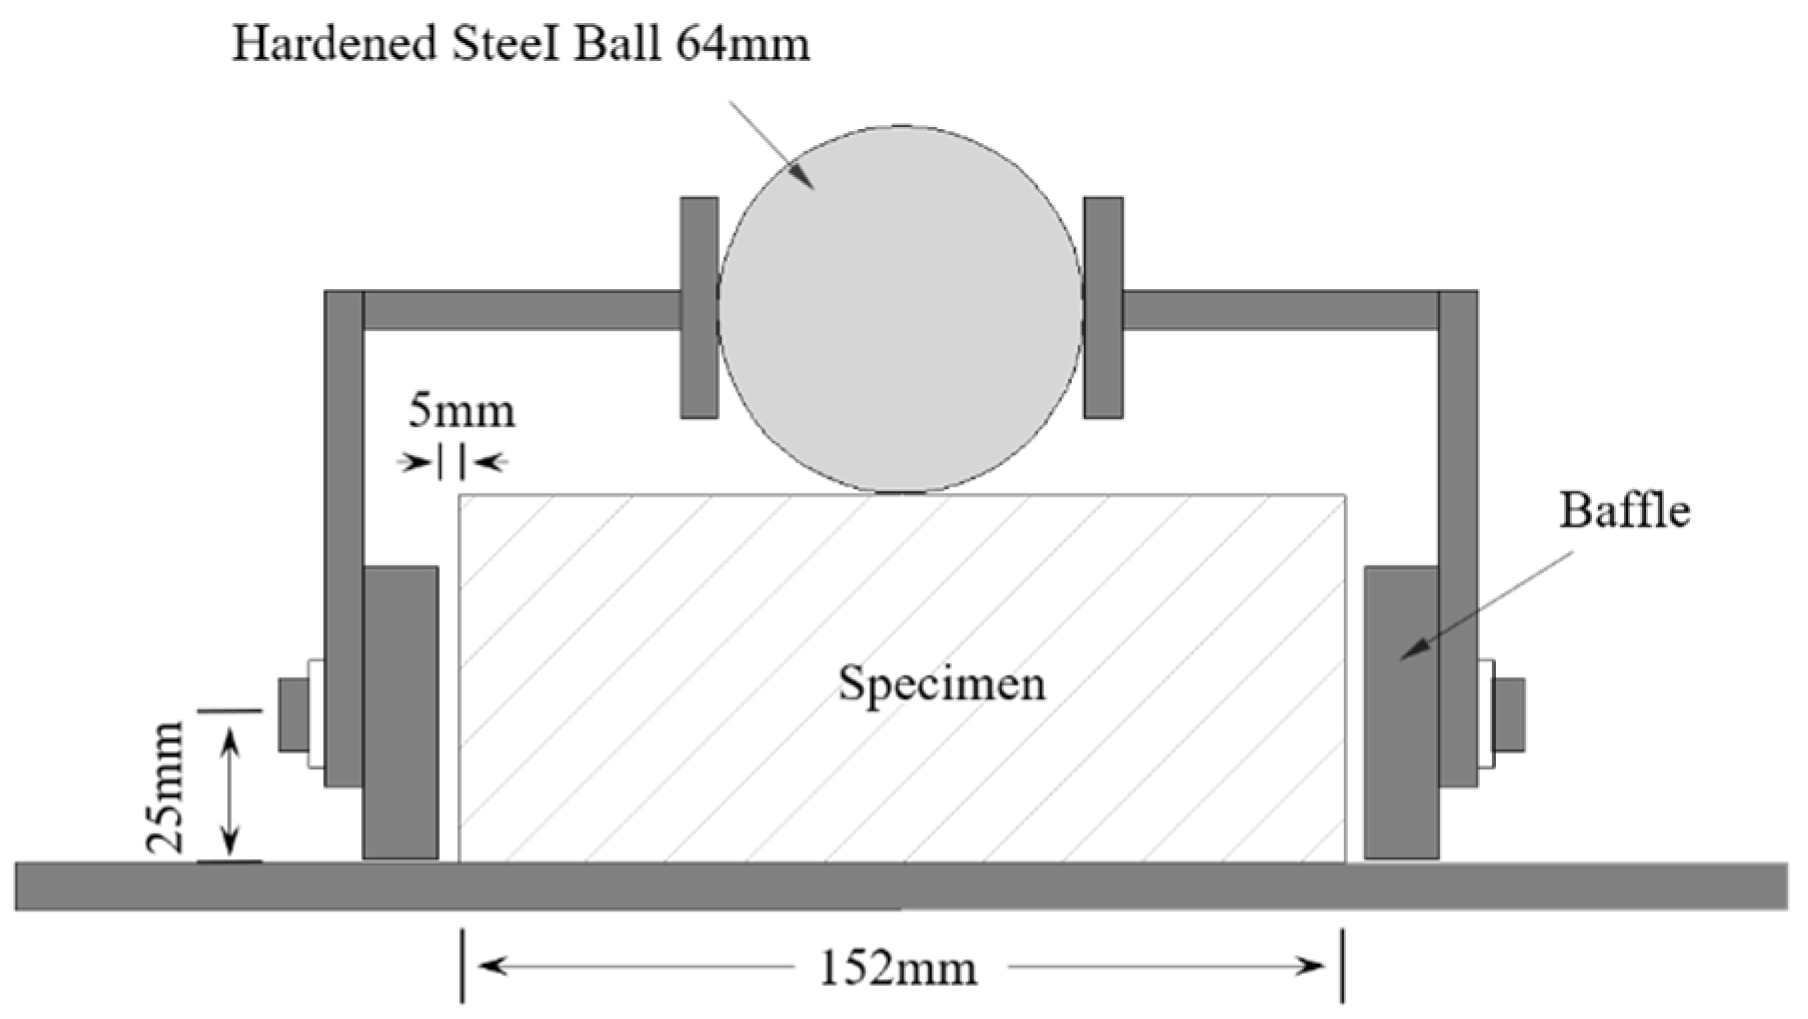
2.3. Drop-Weight Test Device and Test Method

This experiment adopted the standard test and method recommended by the ACI544 committee [28]. The test device and the specimen placement are shown in Figure 5. We applied lubricating oil to the bottom of the specimens to reduce the friction of the fixed plate during the test process. There were four baffles approximately 5 mm from the edge of the specimen. The steel ball weighed 4.54 kg and was freely dropped from a height of 457 mm. Each impact completed was recorded as a cycle. The surface of the specimen was observed after each impact, and the number (N1) of first-crack impact resistance in blows was recorded when the first visible crack appeared on the specimen. Impacts continued to occur until the specimen touched three baffles, and the number (N2) of the ultimate failure impact resistance in blows was recorded, along with the difference number (ΔN) of impacts between the first crack (N1) and the ultimate failure number (N2).

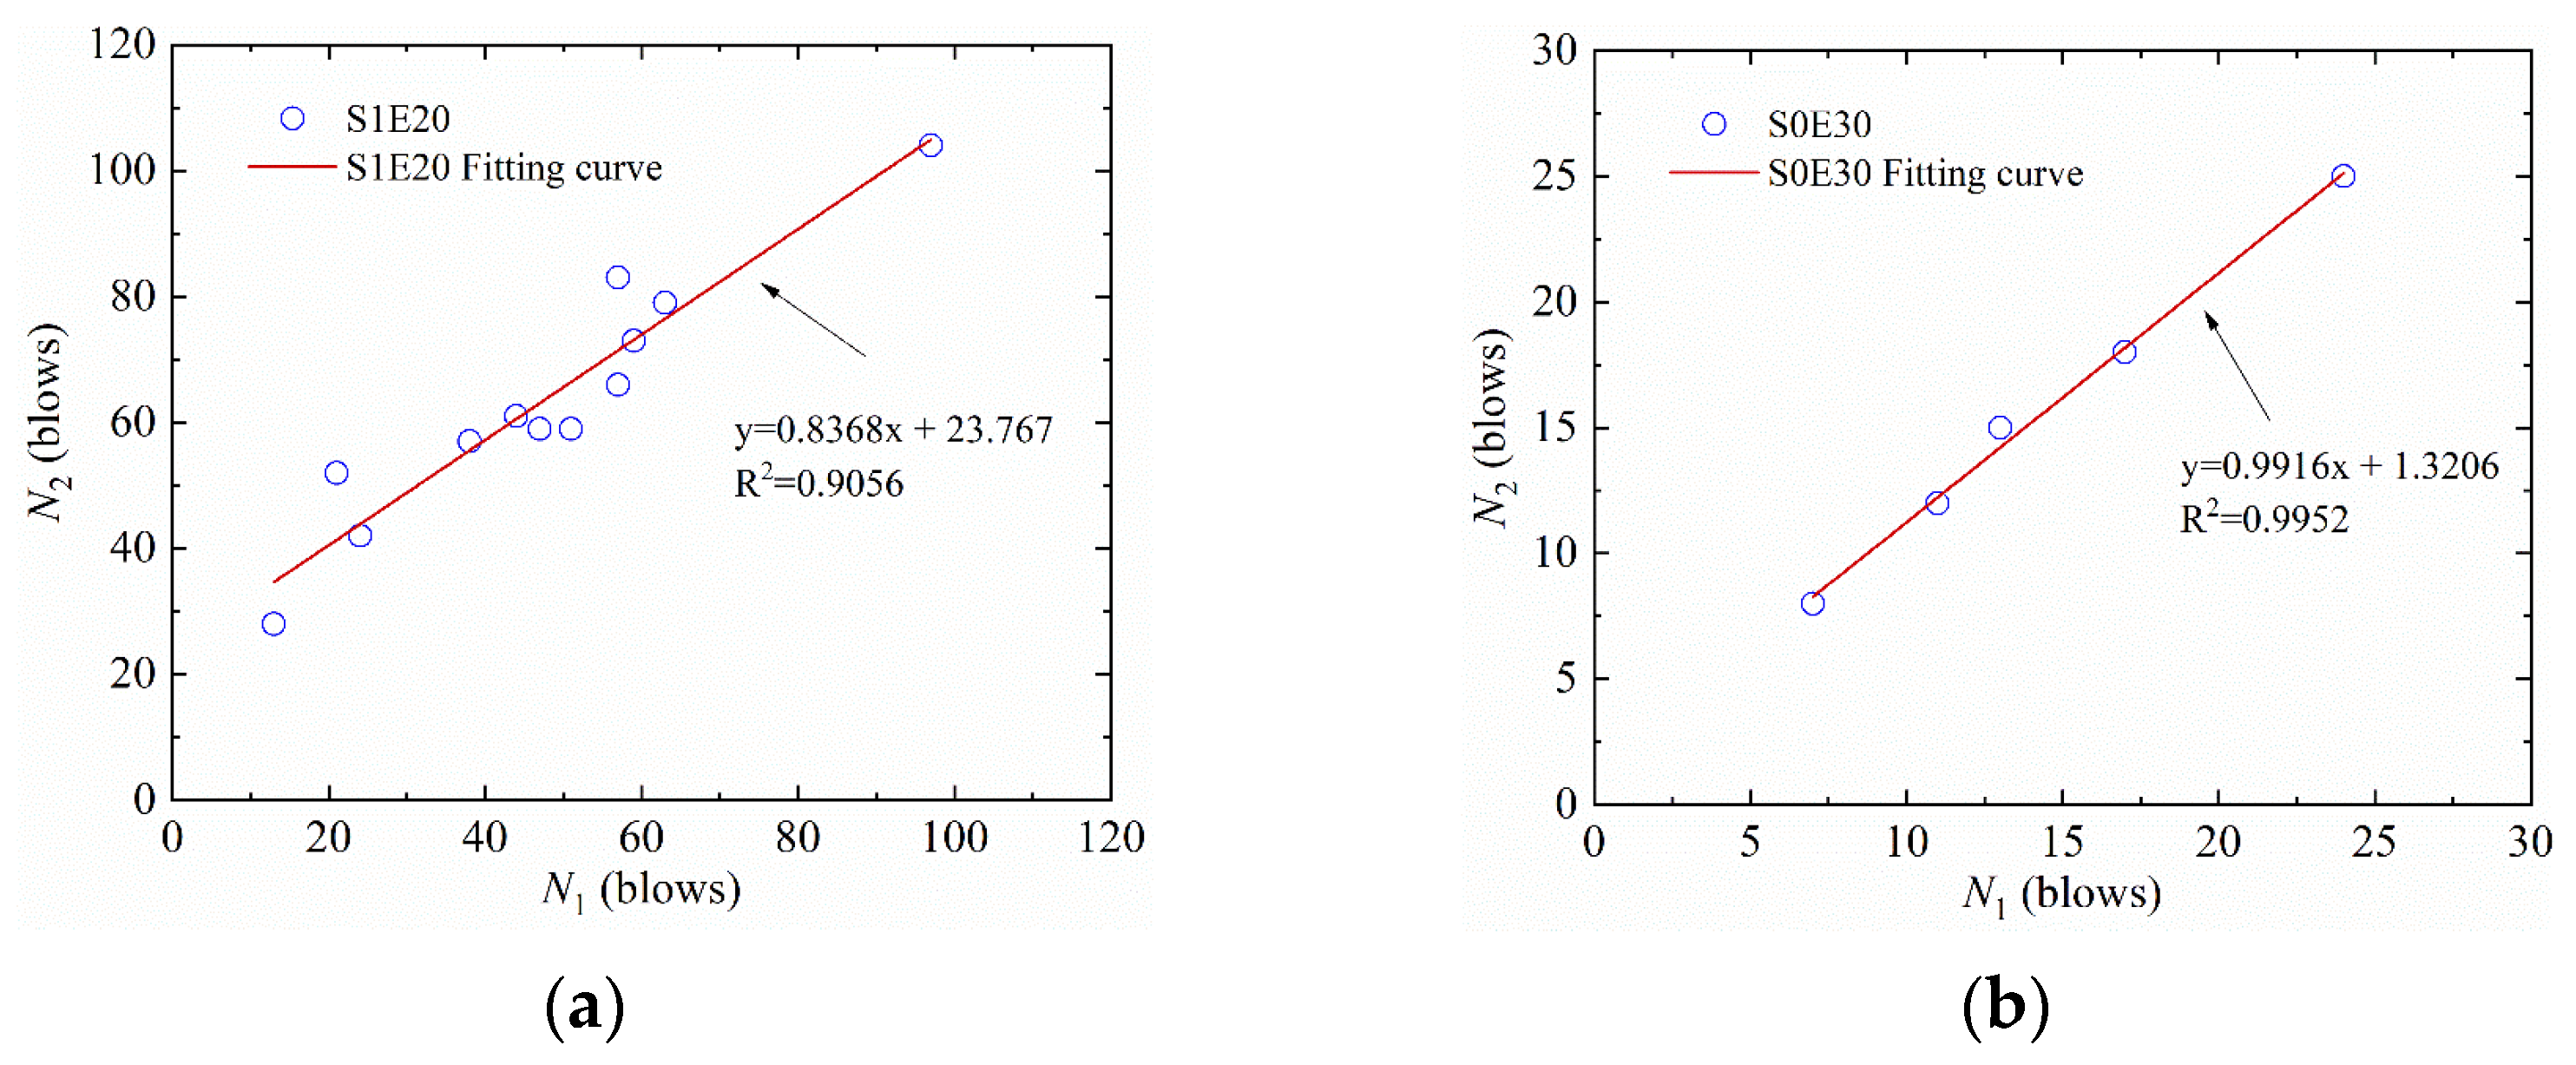
2.4. Test Results and Statistical Analysis

It can be seen that the dispersion of EPSC is higher than SFEPSC from Table 4, which lists N1, N2, and ΔN of SFEPSC and EPSC in the drop-weight test. About 70% of total EPSC specimens were completely destroyed at the first visible crack, and about 30% could bear the load before the first visible crack. The specimen impact resistance of Veps = 50% was about twice that of Veps = 10%.
The SFEPSC specimen could continue to bear the impact load after the first visible crack impact. The N1, N2 and ΔN were higher than EPSC. The SFEPSC specimen, in which the Veps was 20%, could still bear the highest load capacity after the first-crack impact, and the average impact resistance was up to 6.7 times greater than S0E20. The above showed that the overall impact resistance of SFEPSC is higher than EPSC.
According to the theory of linear regression analysis, the linear relationship between the first-crack impact resistance in blows and the ultimate failure impact resistance in blows can be regressed by Formula (1):
N2 = a × N1 + b
where a and b are regression coefficients. The linear regression curves of SFEPSC and EPSC are shown in Figure 6, and the linear regression parameter values are shown in Table 5.
There is a good linear relationship between N1 and N2, as shown in Figure 6 and Table 5. If we exclude the data (101/109) of S1E10 in Table 4, then the R2 =0.8717 becomes R2 = 0.9105. Therefore, the R2 =0.8717 can still be used to describe the set of S1E10 specimens. Due to the small amount of EPSC specimen data, the linear relationship could not be well represented. If the data of the EPSC specimens was large enough, their functional relationship could be fully shown. For example, S0E30 and S0E50 both have linear functional relationships.
The mean value ( x ¯ ), standard deviation (SD) σ, and coefficient of variation ( C O V = σ / x ¯ ) of the impact resistance indicators of SFEPSC and EPSC are listed in Table 6.
The fluctuation range of x ¯ , σ and COV of SFEPSC corresponding to N1 and N2 shows volatility, which is less than 22.8%, as shown in Table 6. It can be seen that both N1 and N2 of SFEPSC are inversely proportional to the Veps when Veps < 30%. The SF and concrete together bear a large amount of load because of the small Veps, and the specimen showed larger SFC discrete features [29,30]. The fluctuation range of N1 and N2 of SFEPSC becomes smaller when Veps ≥ 30%, and the overall fluctuation is stable at a constant value. The specimen shows a significant buffering effect at a big Veps.
Table 6 shows that the overall impact resistance of EPSC is relatively low. When Veps is less than 30%, the number of impacts of EPSC is inversely proportional to Veps. When Veps is more than 30%, the fluctuation range of the impact number of EPSC decreases, and the overall value tends to be a constant value. The EPSC has the highest impact resistance at Veps = 30%.
COV is an important indicator that reflects the degree of data dispersion. A small COV value reflects that the data is concentrated near the mean value, and the degree of dispersion is small. On the contrary, a big COV value reflects that the data deviates far from the mean value, and the degree of dispersion is large. The COV of SFEPSC is smaller than that of EPSC in Table 6, indicating that the impact resistance of SFEPSC is more stable. The ultimate failure specimen proportion at the first-crack impact of EPSC is considerable. Although SD and COV are both reduced, the overall impact resistance of the EPSC specimen tends to be stable. This indicates that the impact resistance of both types of concrete specimens decreases with increasing Veps, and the stability of impact resistance of SFEPSC is better than that of EPSC.

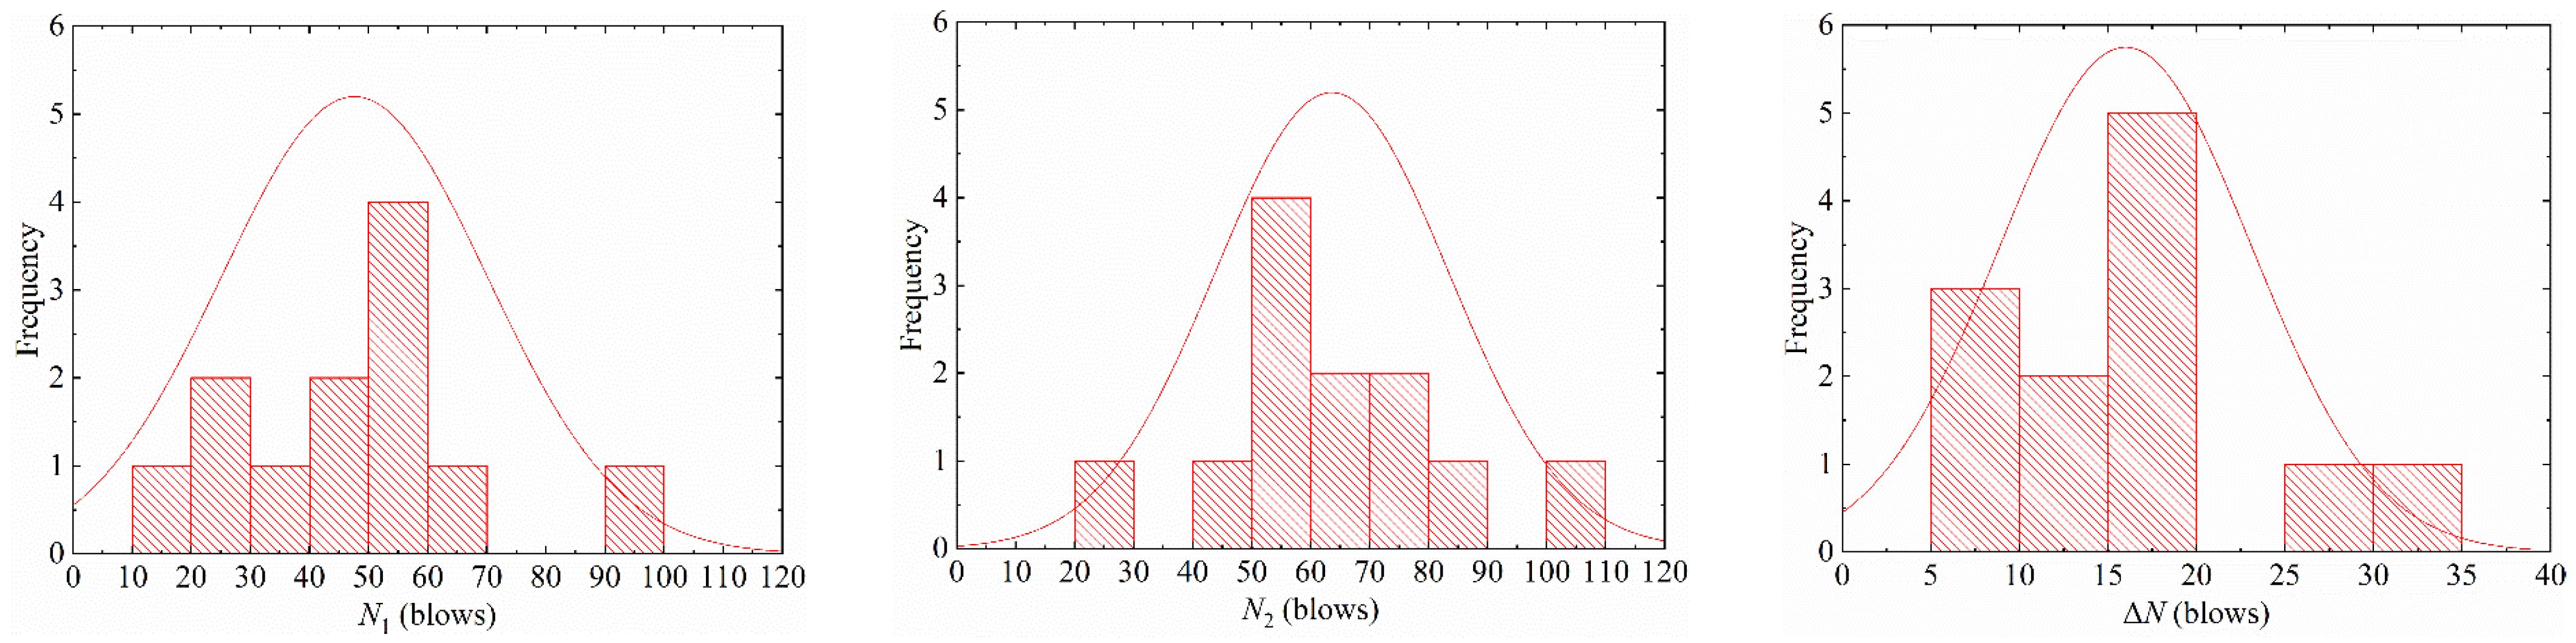
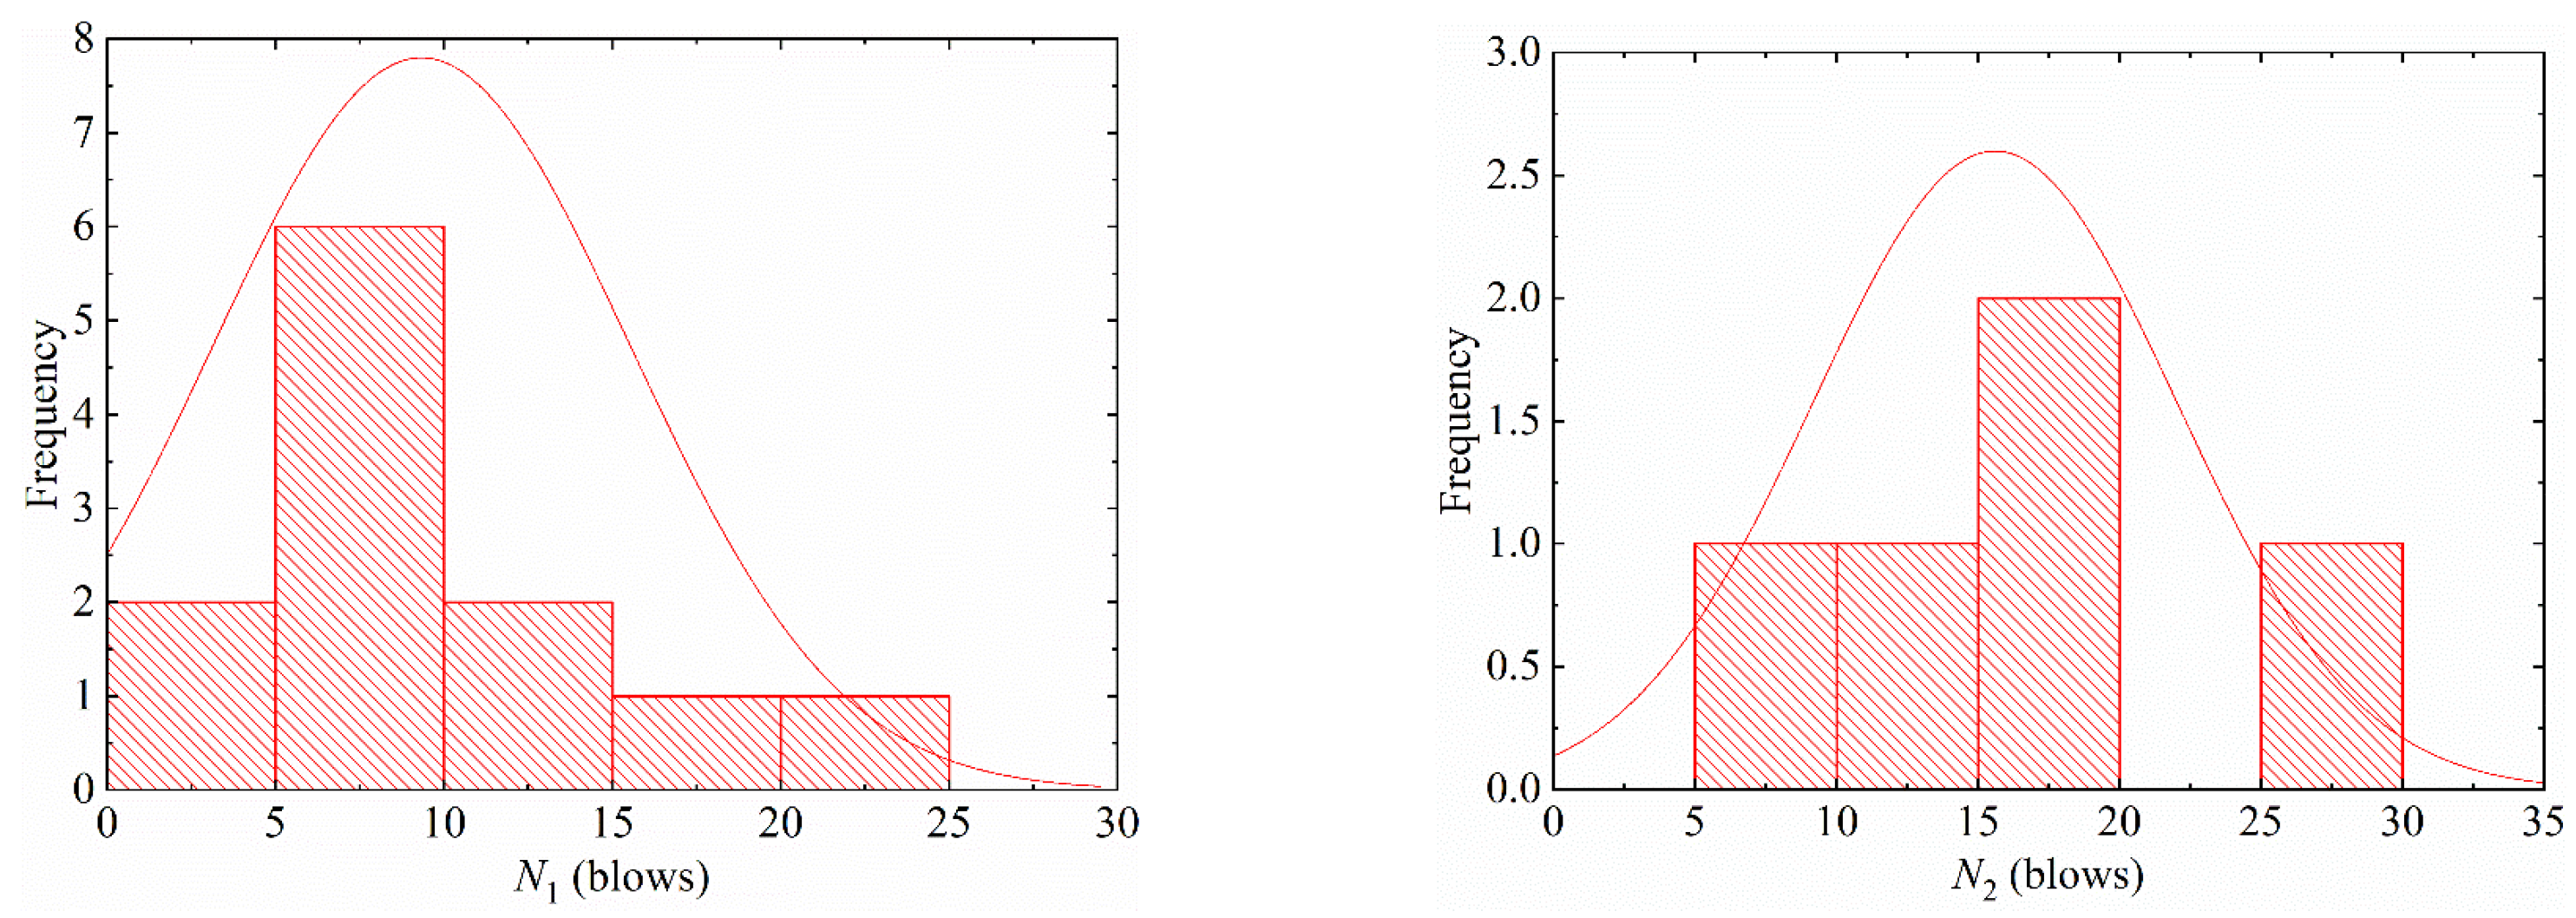
3. Probability Distribution Characteristics

A common method was used to determine the distribution type of specimen statistical data: a certain typical characteristic distribution was used as a hypothesis according to the probability density distribution characteristics of specimen data, followed by hypothesis testing to determine whether it conformed well. This research used statistical analysis methods to perform statistical analysis in Table 4, and the statistical results are shown in Figure 7 and Figure 8. According to the characteristics of the specimen distribution, it is proposed to use log-normal distribution and two-parameter Weibull distribution to fit the probability distribution of impact test results, respectively.

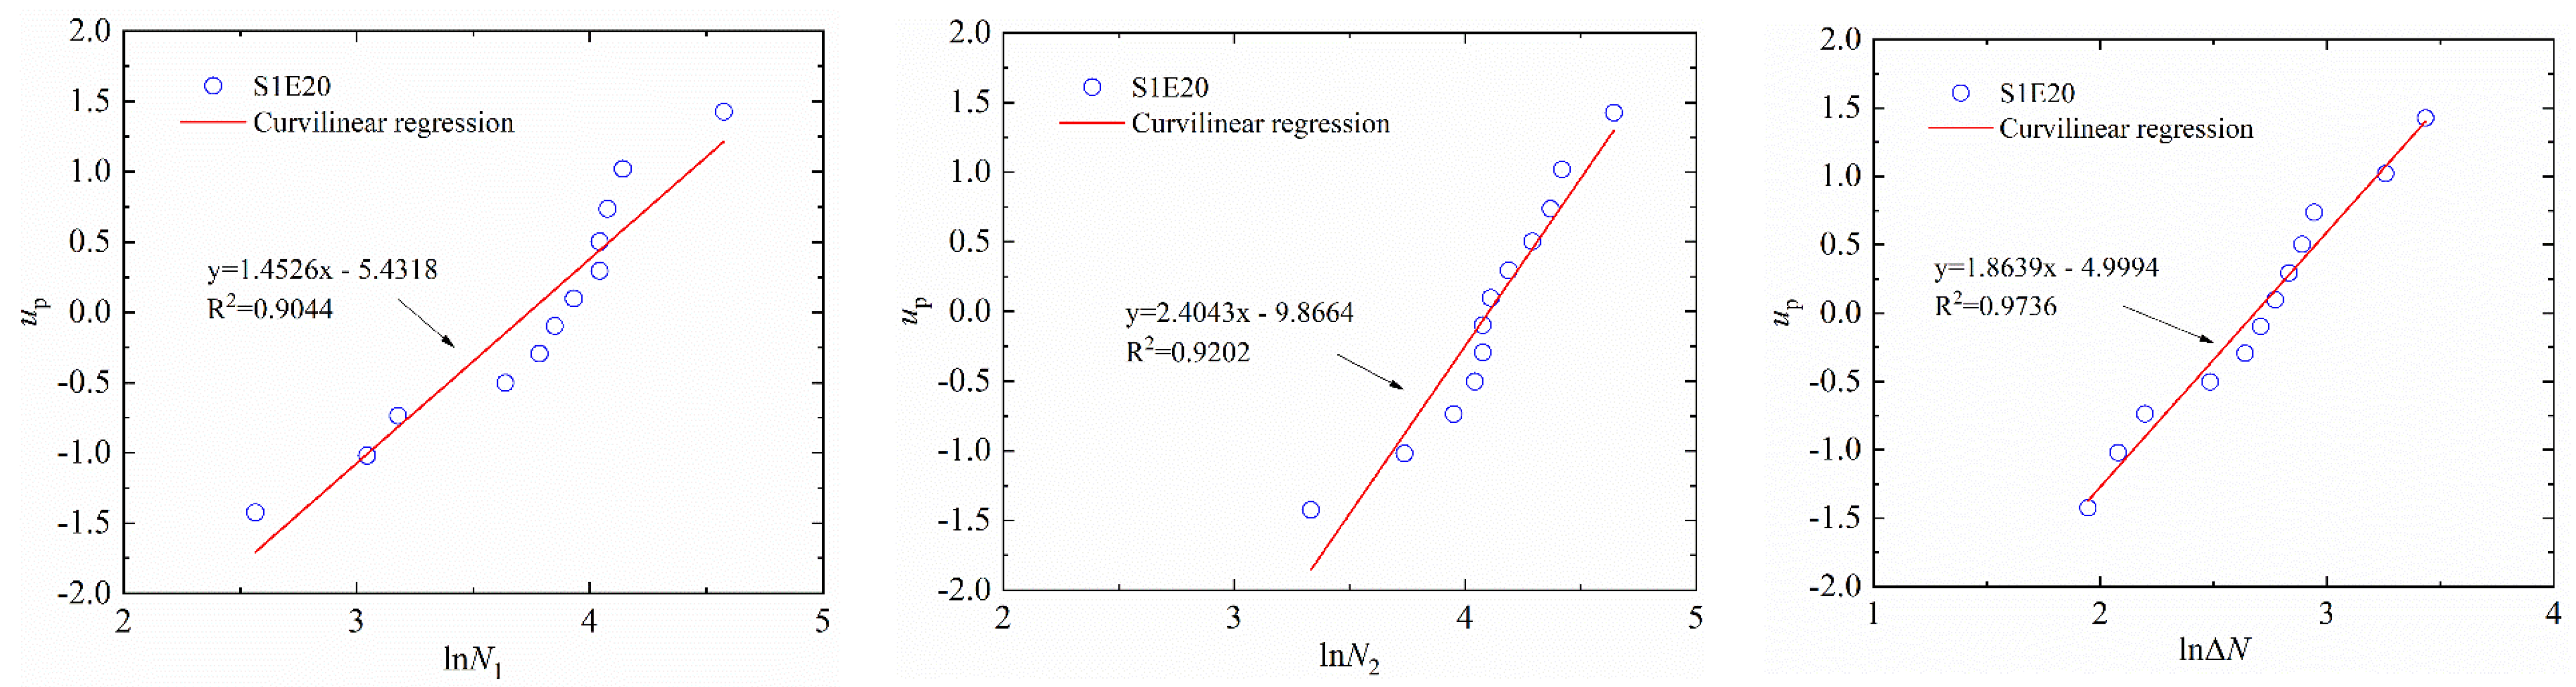
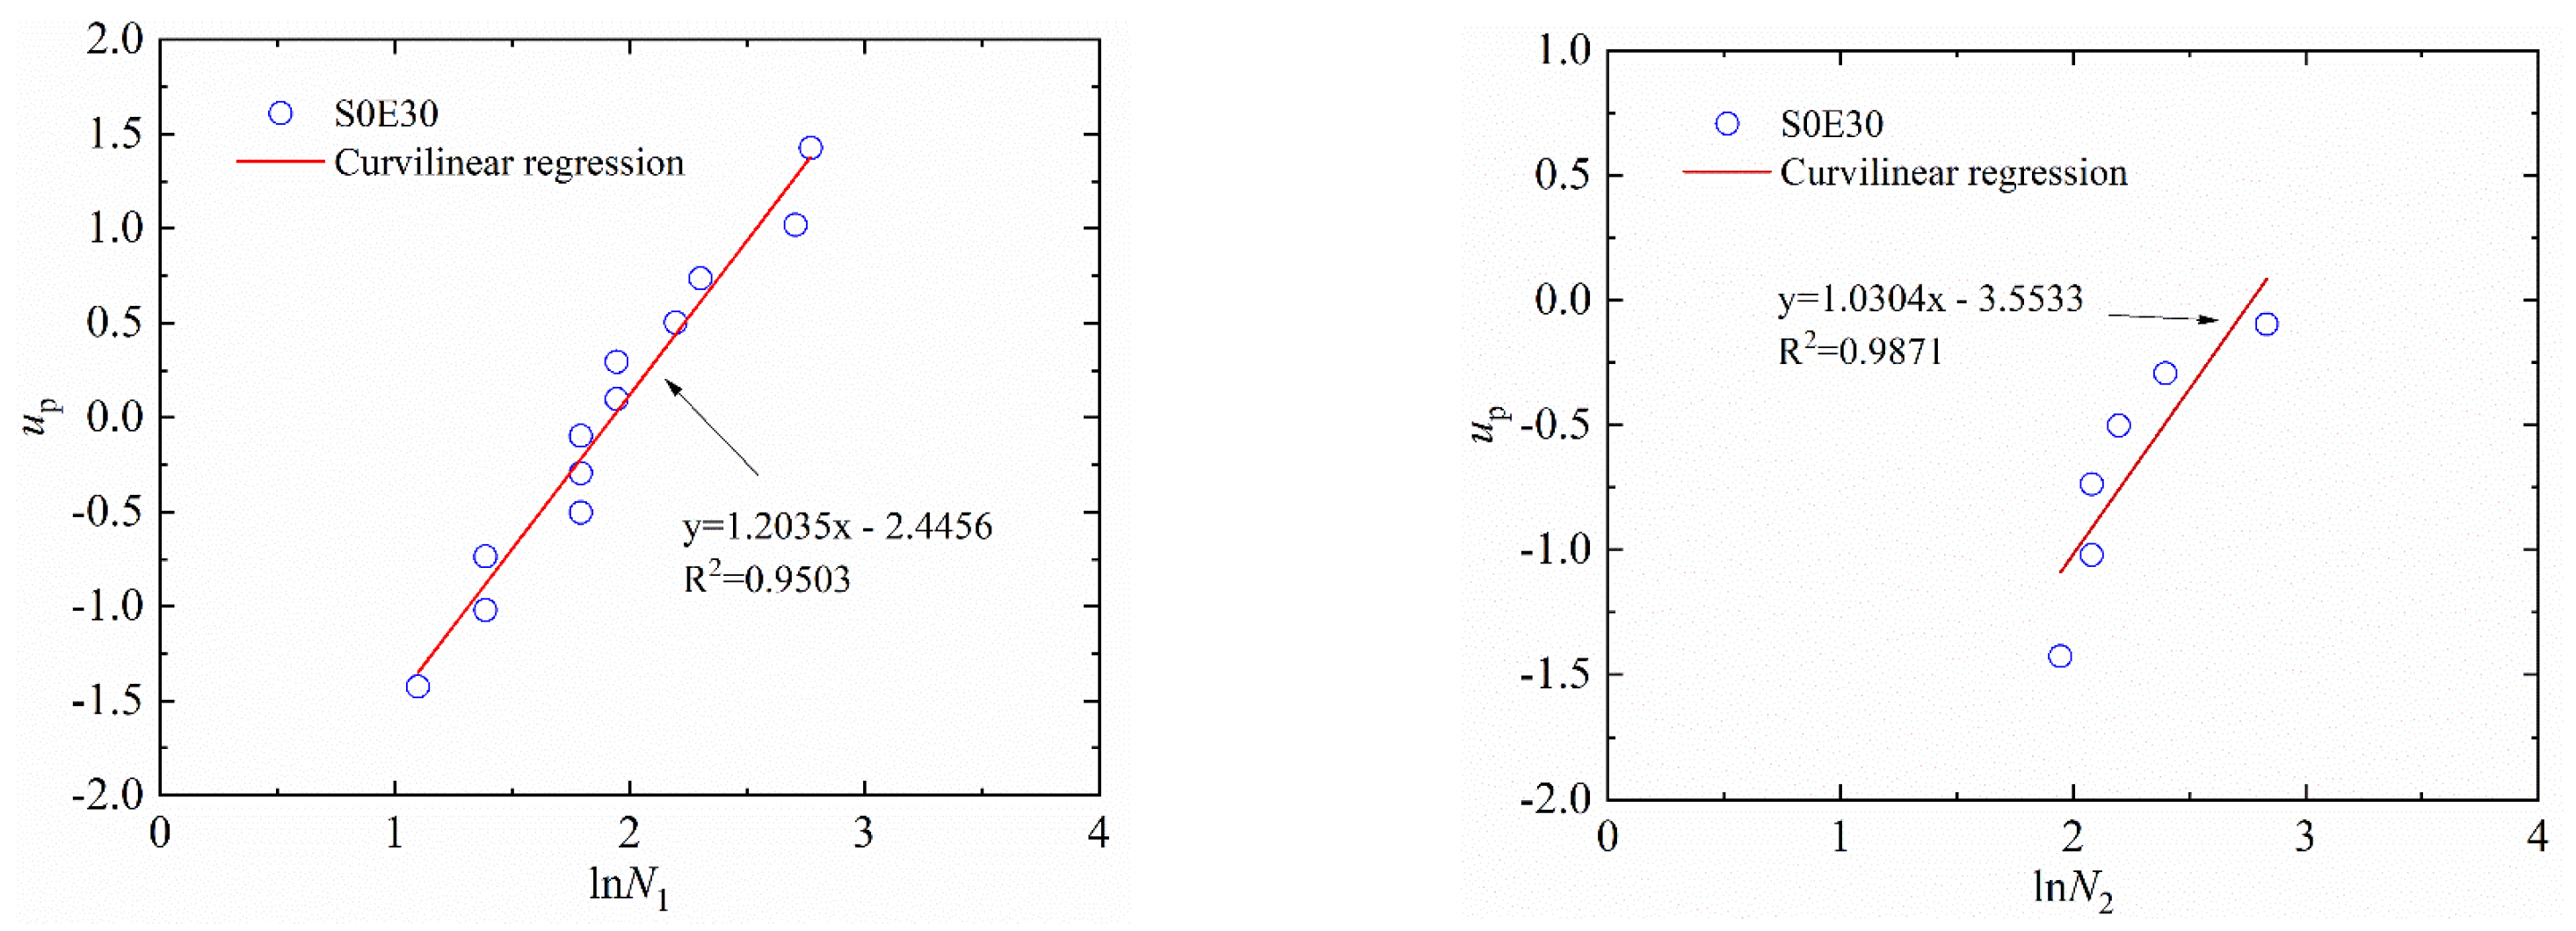
3.1. Log-Normal Distribution

The normal probability paper test is a commonly used method to test the normality of data [31,32]. The horizontal axis of the normal probability paper is represented by a random variable X for a uniform scale. The vertical axis is represented by F(x) for the non-uniform scale. If the distribution function F(x) is the normal type, then (x, F(x)) is a straight line on the normal probability paper. The statistic of specimen function plays an important role in statistical inference, and the order statistic is commonly used in reliability research. Suppose that n specimens are taken from the population, and they are arranged in ascending order and denoted as x(1)x(2) ≤ … ≤ x(n), where x(i) is called the i order statistic of specimen subset, which is a function of the specimen subset and also a random variable. Called the substandard i (i = 1, 2, …, n) of x(i), the rank or order number of x ( i ) . When the observations are equal, the average value of the substandard i is regarded as the rank of these observations. The first-order statistic x(i) of the specimen subset is the minimum value, and the end order statistic x(i) of the specimen subset is the maximum value. Fn is written as:
F n ( x ) = { 0 ;             x < x ( i )   i n + i ;       x ( i ) x < x ( i + 1 ) n n + 1 ;       x ( n ) x
where Fn(x) is the empirical distribution function. According to Bernoulli’s law of large numbers, Fn(x) is almost close to F(x) when n is large enough. If (x, Fn(x)) is drawn in the coordinate system, it should be close to a linear function. The linear relational expression is
Y = α 1 X β 1
where Y = u p , with u p being the cumulative probability density; X = ln N 1 ; and the α 1 and β 1 are the regression coefficients. For example, the linear regressions of N 1 , N 2 and ΔN of S1E20 and S0E30 in a log-normal distribution are shown in Figure 9 and Figure 10, respectively. Table 7 and Table 8 lists the ln N u p linear regression results of SFEPSC and EPSC.

3.2. Weibull Distribution

The fatigue life of SFC obeys the Weibull probability distribution [33,34]. The impact resistance of SFEPSC and its fatigue performance are similar in nature to the force mechanism. Therefore, the Weibull distribution analyzed the probability distribution of the impact resistance of SFEPSC in this study. The distribution law of the impact resistance index of two types of concrete specimens can be expressed by the following Weibull density function:
f ( N ) = b N a N 0 ( N N 0 N a N 0 ) b 1 × exp [ ( N N 0 N a N 0 ) b ]                 N 0 N <
where N 0 is the minimum life parameter, N a is the characteristic life parameter, and b is the Weibull shape parameter. The Weibull variable is denoted by N ξ . According to the Weibull density function f ( N ) given by Formula (4), the survival rate of the Weibull variable N ξ is obtained. Considering the reliability, the minimum life parameter N 0 in Formula (4) is taken as 0, which is simplified to the two-parameter Weibull distribution:
f ( N ) = b N a [ N N a ] b 1 exp [ ( N N a ) b ]           0 N <
Then
P ( N > N ξ ) = exp [ ( N N a ) b ]
Equation (6) is transformed into 1 P = exp ( N N a ) b , and the logarithm of both sides is obtained:
ln l n ( 1 / P ) = b ln N b ln N a
which is
Y = α 2 X β 2
where Y = ln l n ( 1 / P ) ; X = ln N . Here, α 2 and β 2 are the regression coefficients. Equation (8) can be used to test whether the test data of two types of concrete obey the two-parameter Weibull distribution. For example, the Weibull distributions of the number of impacts of S1E20 and S0E30 are shown in Figure 11 and Figure 12, respectively. Table 9 and Table 10 lists the ln N ln l n ( 1 / P ) linear regression results of N 1 , N 2 and Δ N of SFEPSC and EPSC.
The data points of S1E20 are all near a linear function shown in Figure 9 and Figure 11, which show that both the log-normal distribution and the Weibull distribution can better describe the impact resistance of SFEPSC. The N1 and N2 of SFEPSC can be described by the log-normal distribution and the Weibull distribution, as shown in Table 7 and Table 9. Since there were fewer EPSC specimens available for complete failure at the first visible crack (N1), only the distribution study of the N1 of EPSC was carried out. The results show that the N1 of EPSC can be described by two distributions (Figure 10 and Figure 12, Table 8 and Table 10).

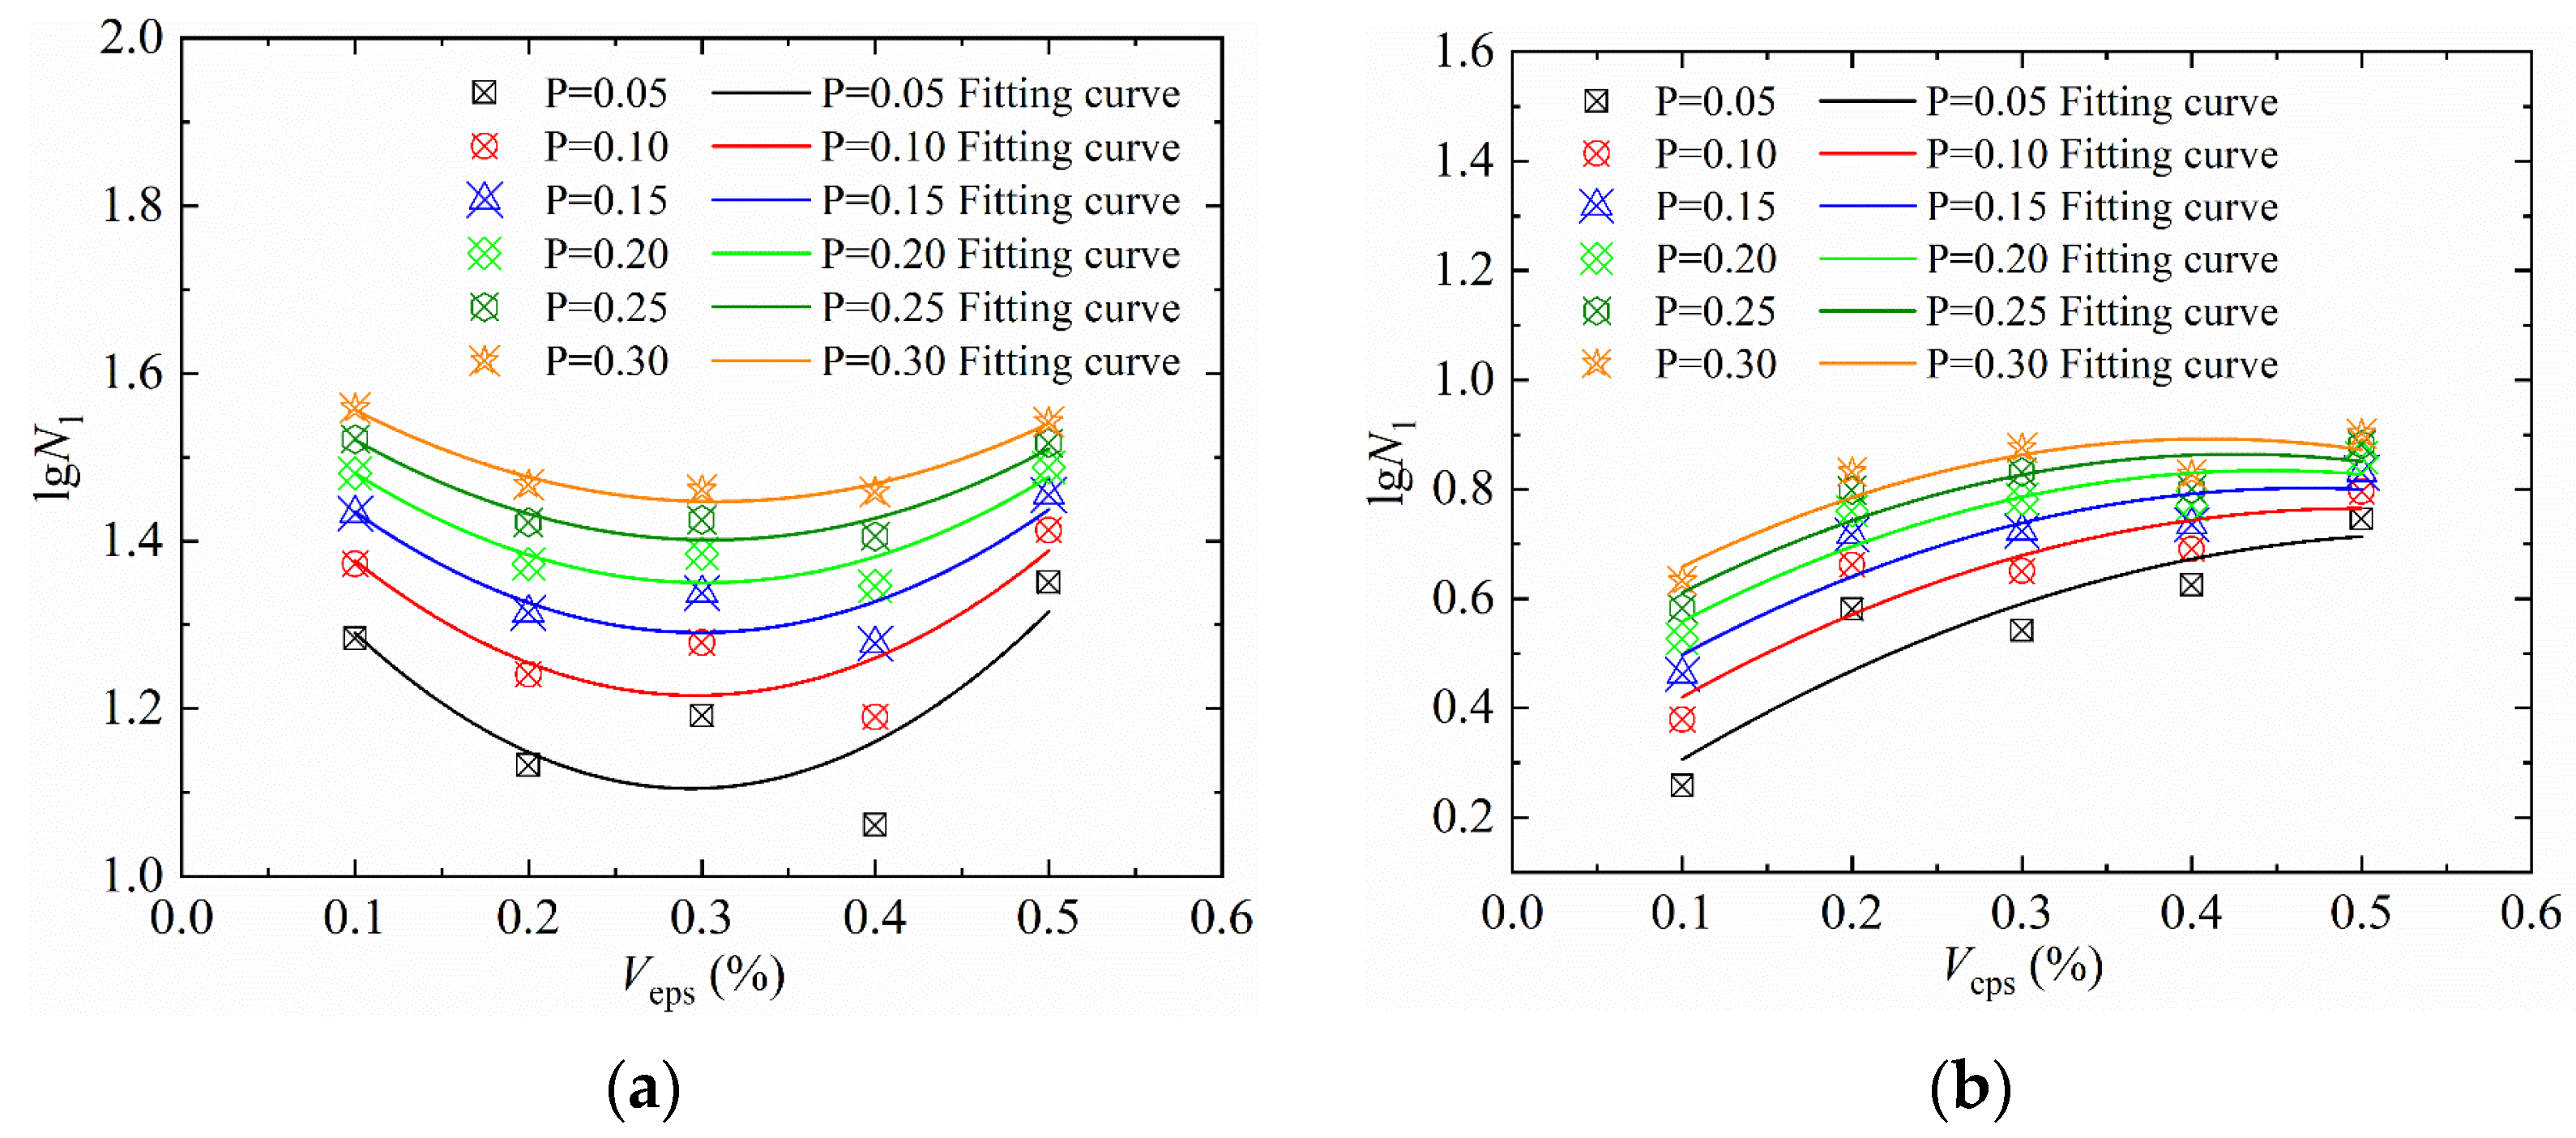
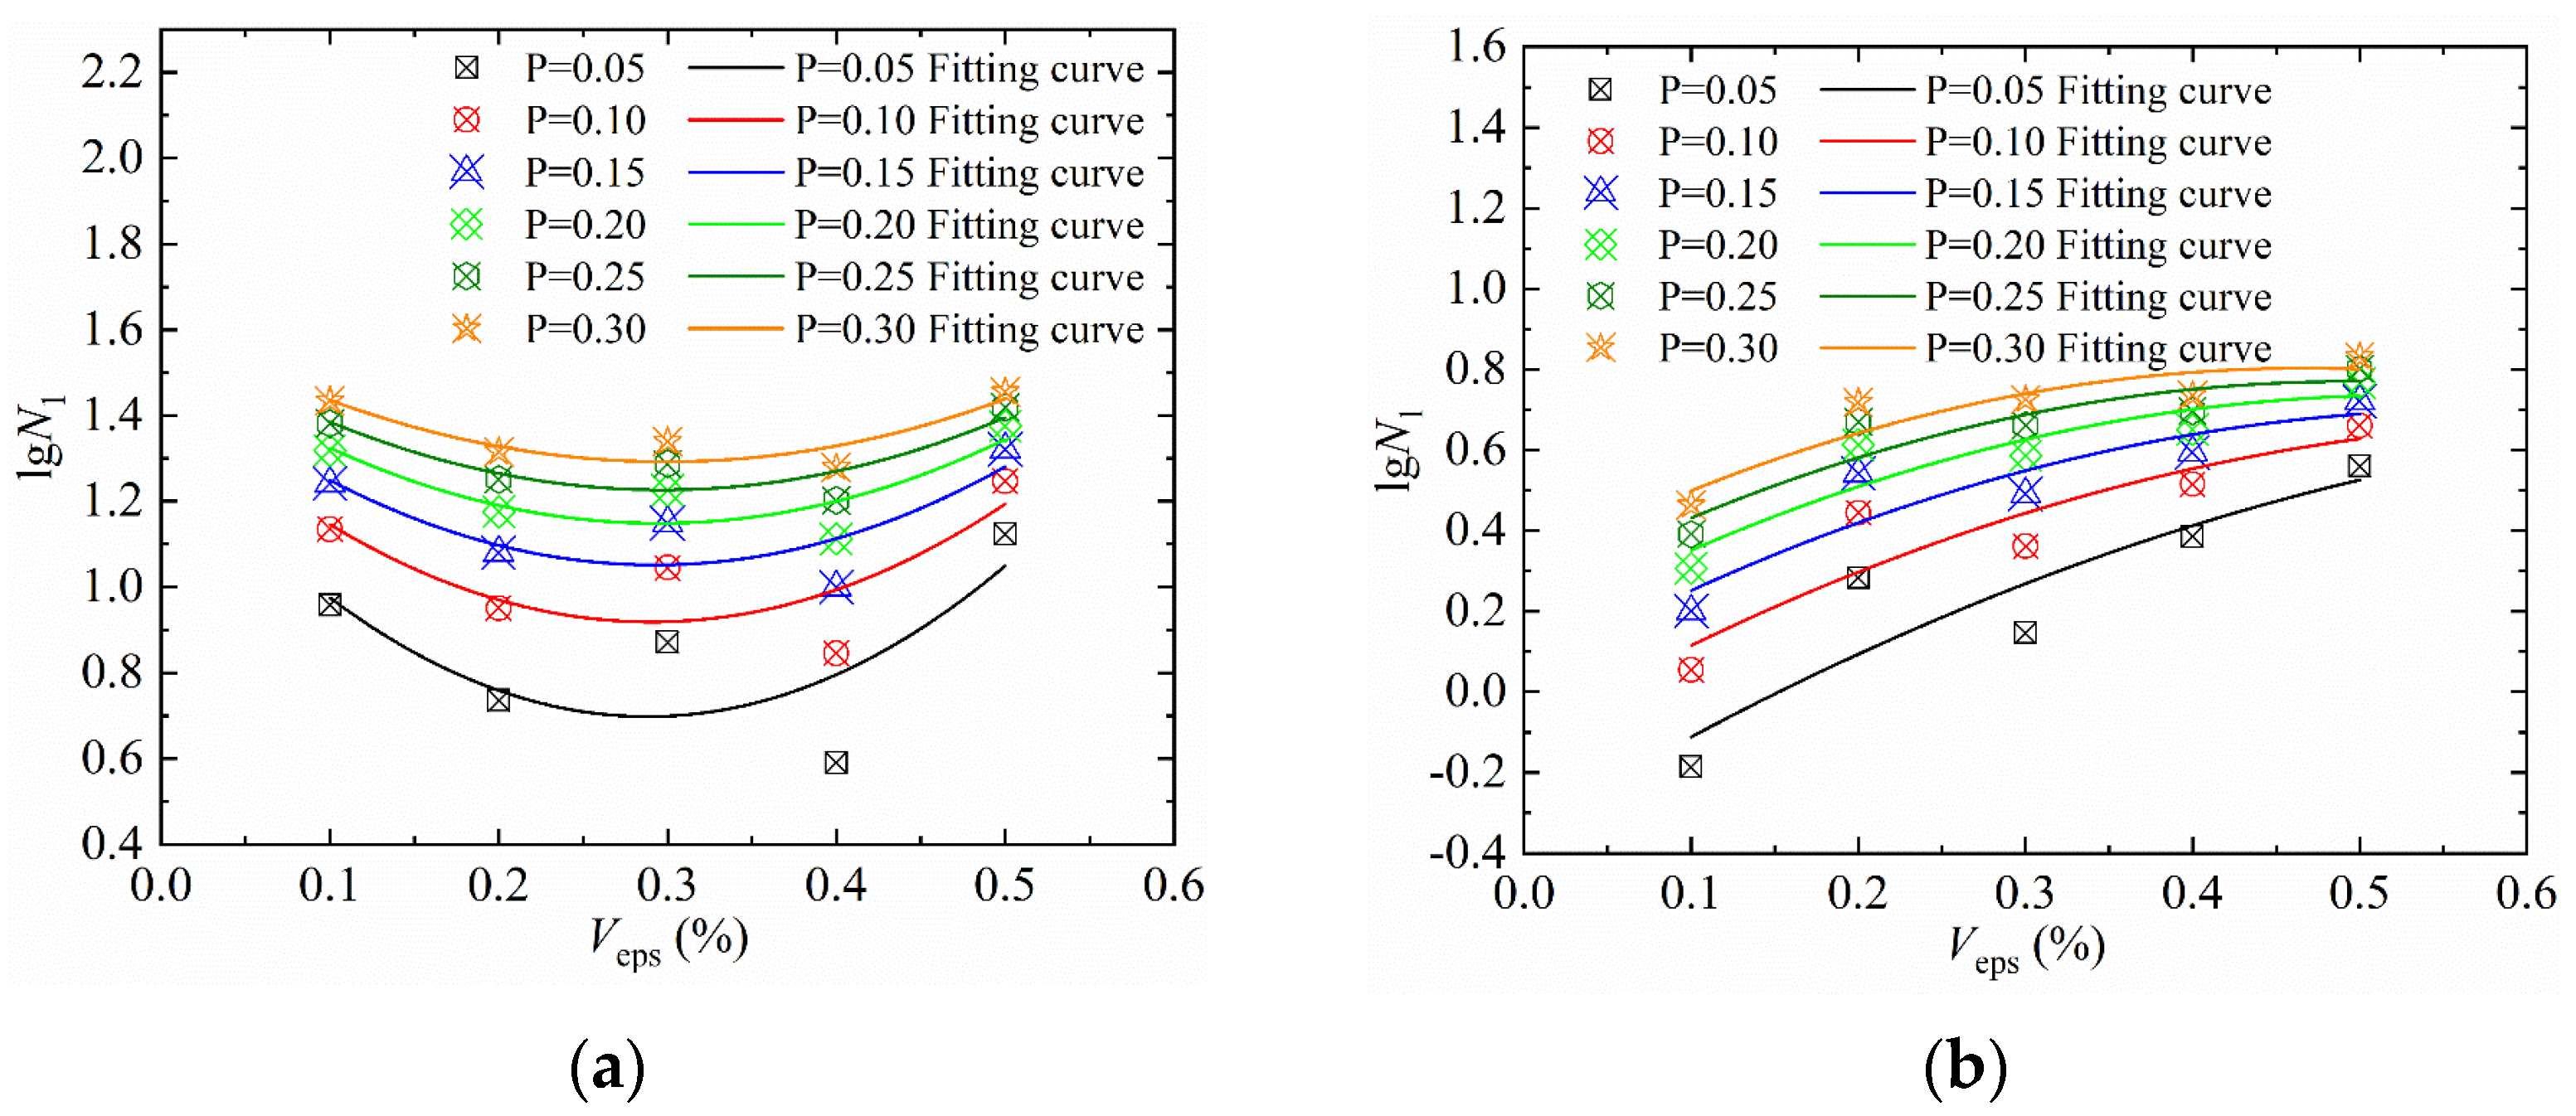
3.3. Curve of SFEPSC and EPSC Impact Resistance

According to Equations (3) and (8), the corresponding failure probability of the two distributions of SFEPSC and EPSC can be obtained for the number of impact resistance N1 and N2.
The log-normal distribution is:
N = exp ( u p + β 1 α 1 )
The Weibull distribution is:
N = exp [ l n l n ( 1 / P ) + β 2 α 2 ]
where α i , β i are obtained from Table 7, Table 8, Table 9 and Table 10. We calculated the impact resistance performance indexes under different failure probabilities and list them in Table 11 according to Formulas (9) and (10).
We then plotted the PVepslgN1 curve [31,35] of the impact resistance of SFEPSC and EPSC, as shown in Figure 13 and Figure 14, according to the data in Table 11. The numbers of the first crack of SFEPSC and EPSC and the Veps are shown in a conic relationship under different failure probabilities, and the concavity and convexity of the conic relationship are different. The curve normalized fitting is shown in formula (11), and the coefficients m, n and l are shown in Table 12.
l g N 1 = m V eps 2 n V eps + l

4. Destruction Mode and Energy Consumption Mechanism

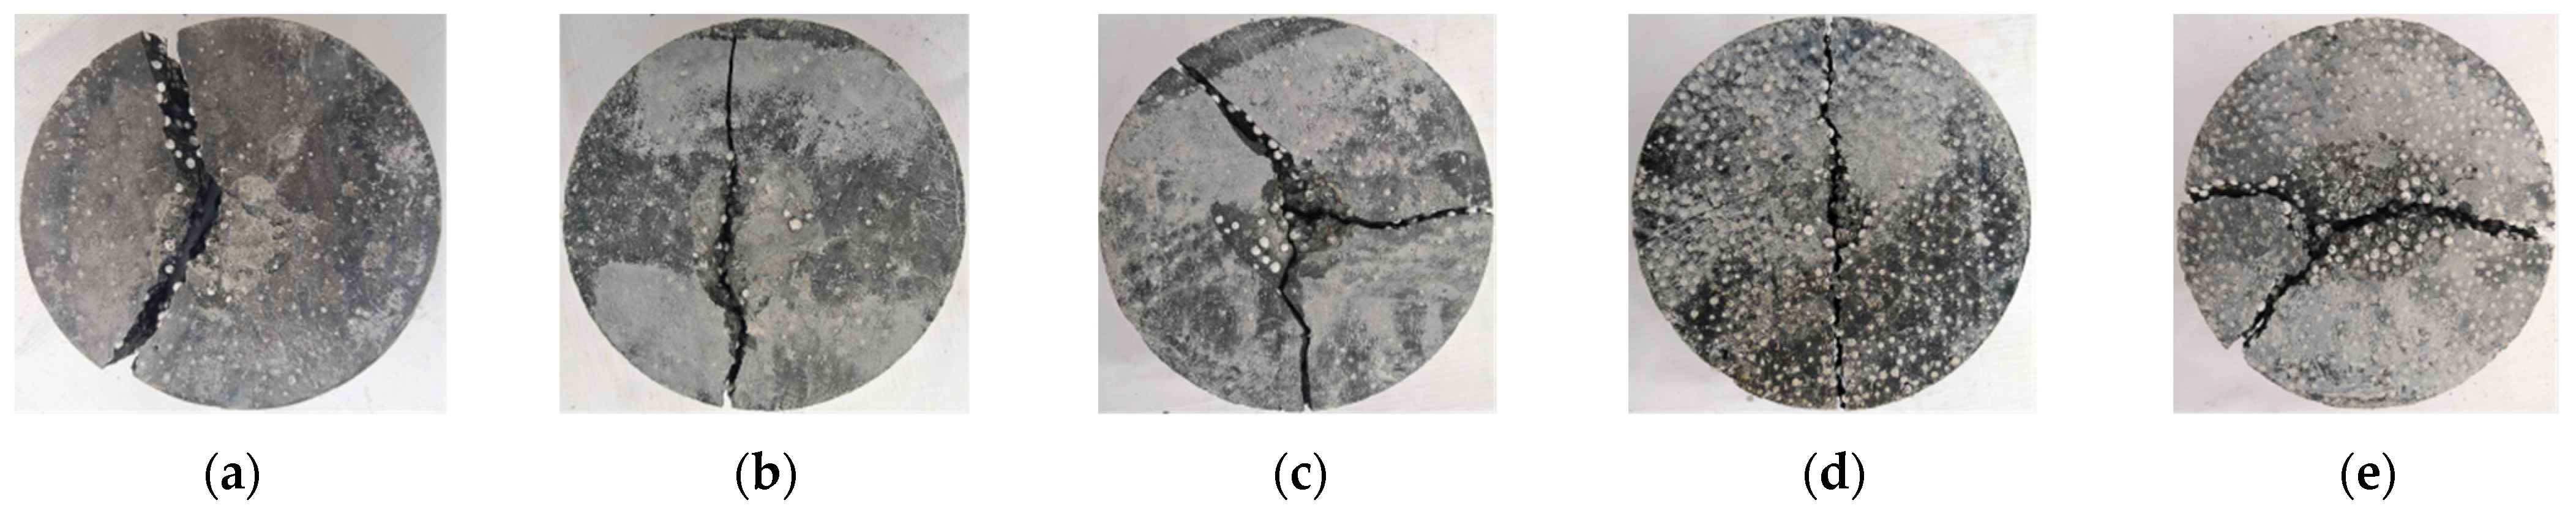
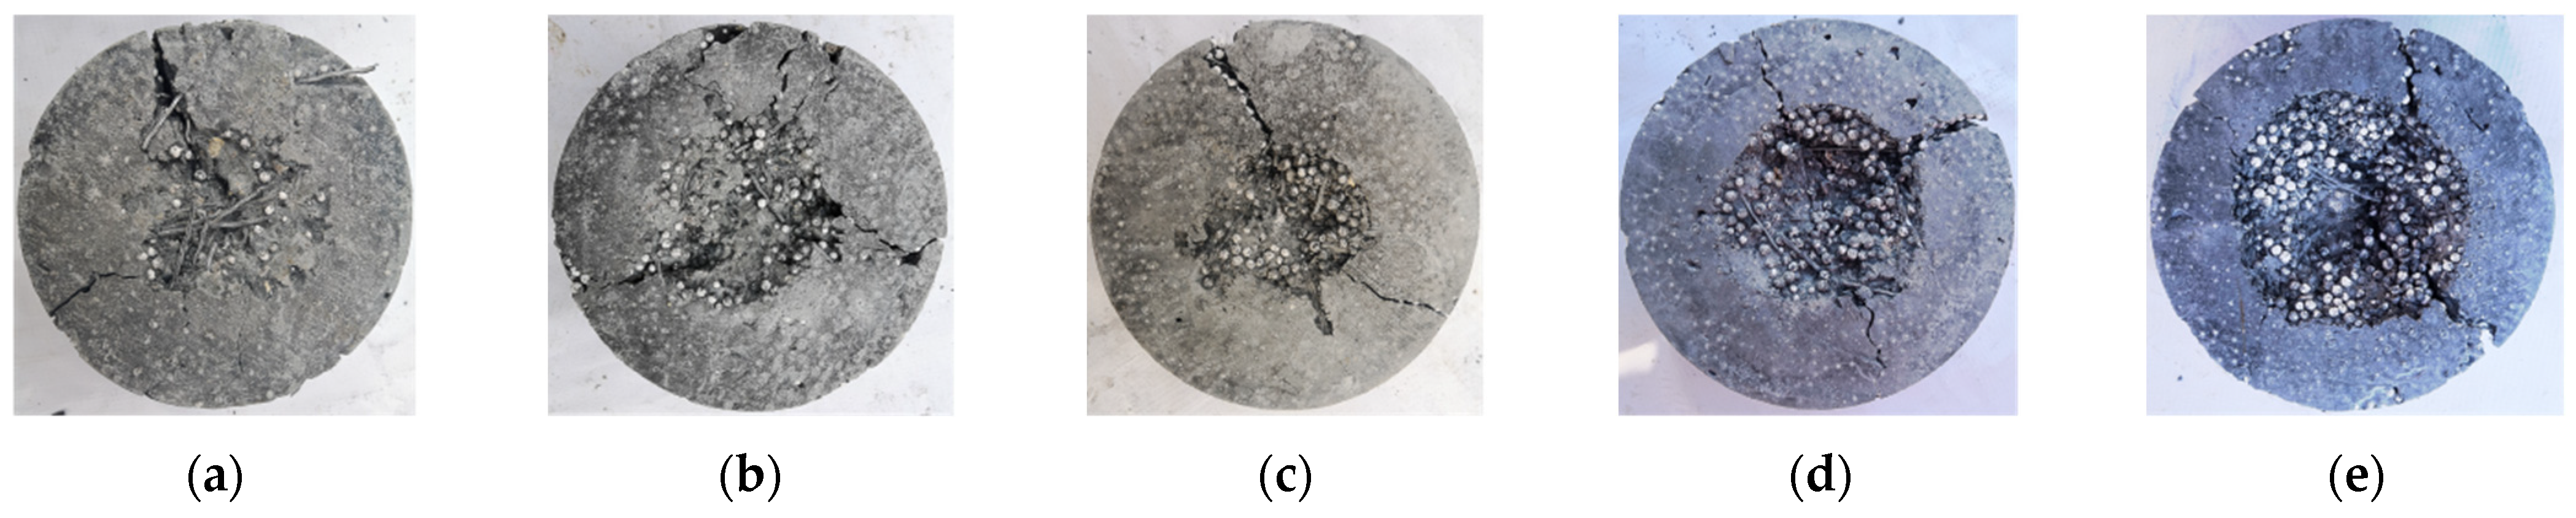
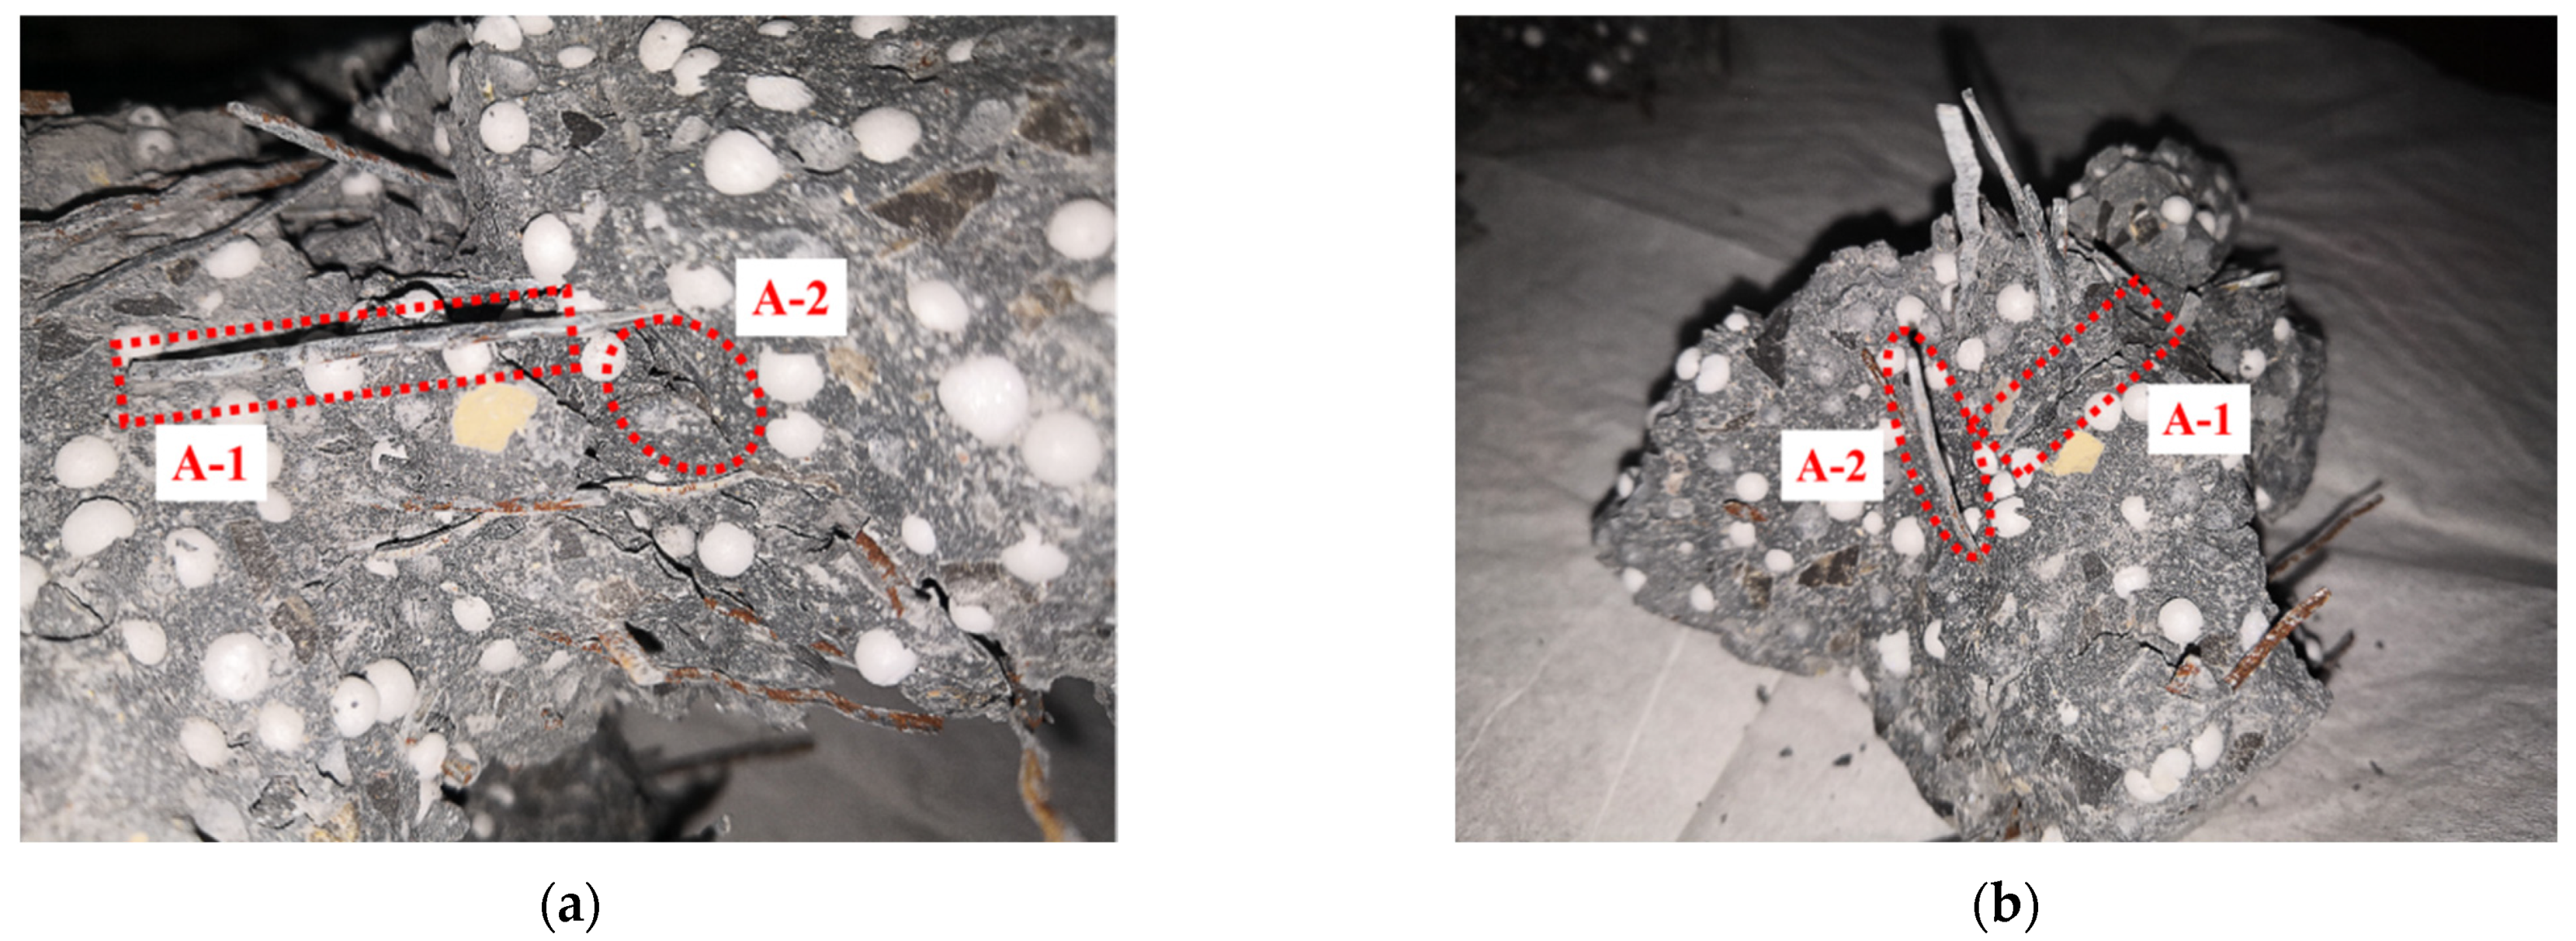
4.1. Destruction Mode

There are two main types of damage on the surface of specimens after impact: splitting and pitting. Figure 15 and Figure 16 show the destruction mode of EPSC and SPESC, respectively. The EPSC specimens are broken with shallow pits shown in Figure 15. The depression on the surface of the specimen is unobvious, and the failure surface is relatively flat when Veps < 30%, as shown in Figure 17a. The pit on the specimen surface deepens when Veps ≥ 30% and its failure surface becomes relatively rough, as shown in Figure 17b,c. The SFEPSC specimens are broken with deep pits, as shown in Figure 16. The fragments of the specimen are connected by SFs, and the failure surfaces are relatively rough, as shown in Figure 18. The pit on the surface of the specimen is relatively shallow when the Veps < 30%, and there are randomly distributed SF connections on the pit surface. The specimen surface was locally squeezed, large deformation occurred, and the SF bounced away. The specimen was dented and destroyed along the direction of force contact surface gradually transferred to the transmission direction, and the pit depth increased with increasing Veps.
It can be seen that the specimen stiffness was larger and the pit was shallower at a smaller Veps. The overall specimen stiffness was small, and the pit was deeper at a large Veps. The SF effectively connected EPSC fragments to improve their impact resistance, which was consistent with the role of SF in normal concrete.

4.2. Energy Consumption Mechanism

Splits and pits in the specimen were the main energy dissipation methods for SFEPSC and EPSC after being subjected to an impact load. Due to the micro-elasticity of EPS particles, a “micro-spring damping” was formed in the specimen interior. Once the top of the specimen was subjected to an impact load, the EPS and the concrete hole absorbed part of the impact load. The other part of the load was transferred to the specimen bottom by EPS and concrete. The aggregate and bonded materials played a major role in the energy transfer process. The EPS particles absorbed energy and released it evenly to the surroundings with tiny potential energy and dissipated energy. Since the impact force of each drop weight occurred within 1ms and the stress was difficult to redistribute through the SFs in a short time, it caused a partial fracture on the impact surface of the specimen. At the same time, the specimen surface and pit absorbed energy through large deformation. If the Veps was larger, the local absorbed load was higher than the energy transferred from the pit to its surroundings. The larger the volume of EPS in the range of 10~50%, the better cushioning effect it had under impact. The impact force on the specimen bottom was small, and finally, the specimen’s partial damage led to overall damage.
There was friction between the SF and concrete in the specimen. The SFEPSC mainly absorbed energy in two ways. One was that the friction between SF and concrete in the specimen overcame the impact load and converted it into heat. The other was that the EPS absorbed the load, converted it into micro-elastic potential energy, and released it uniformly. Although the overall bearing capacity of SFEPSC decreased after the first crack, there was friction between randomly distributed SFs and concrete inside the specimen. It could still continue to withstand impact load, as shown in Figure 18. This indicates that EPS and SF share the energy dissipation of SFEPSC, and the SF gives the specimen the ability to still dissipate energy after the first crack.

5. Conclusions

The current paper studied the fatigue impact resistance of SFEPSC and EPSC by a drop-weight test and statistical analysis when the Veps was between 10% and 50%, and the following conclusions could be drawn:
  • The apparent density of the two types of concrete specimens had a linear relationship with Veps and compressive strength. The compressive strength had a quadratic relationship with Veps. The apparent density and compressive strength of SFEPSC were higher than EPSC at the same volume of EPS;
  • By adding SF to EPSC, the impact resistance of SFEPSC was higher than EPSC. It had a highly linear relationship between the first visible crack, N1, and the ultimate failure, N2, and S1E20 had the best impact resistance;
  • The log-normal distribution and the two-parameter Weibull distribution could better describe the impact resistance of the first visible crack and the ultimate failure of SFEPSC and the EPSC at the first visible crack;
  • Under different failure probabilities, the impact resistance of SFEPSC had a concave quadratic relationship with Veps, while EPSC had a convex quadratic relationship. The impact resistance of both types could be tested and predicted by the PVepslgN curve;
  • The failure modes of the two types of concrete specimens were different. By adding SF, the pits of EPSC specimens became deepened before splitting. The pit depth of both specimens increased with the increase in Veps, and the fractures were relatively rough;
  • The energy consumption mechanism of both types of concrete specimens was different. EPSC dissipated shock loads by the EPS particles. By adding SF to EPSC, especially after the first cracking of the specimen, the SF energy absorption and friction energy dissipation characteristics were more obvious.

Author Contributions

Conceptualization and methodology, W.H. and S.Z.; software, W.H.; investigation, W.H.; data curation, W.H.; writing—original draft preparation, W.H.; visualization, W.H.; supervision, S.Z.; project administration, S.Z.; funding acquisition, S.Z. All authors have read and agreed to the published version of the manuscript.

Funding

This research received no external funding.

Institutional Review Board Statement

Not applicable.

Informed Consent Statement

Not applicable.

Data Availability Statement

Part of the data underlying this article will be shared on reasonable request from the corresponding author.

Conflicts of Interest

The authors declare no conflict of interest.

References

  1. Wei, P.; Zhang, S.; Wang, X.; Wang, C. Derivation of the True Strain Rate Effect of Roller Compacted Concrete (RCC) from Impact-Induced Fragmentation. J. Adv. Concr. Technol. 2021, 19, 1040–1051. [Google Scholar] [CrossRef]
  2. Rahmani, T.; Kiani, B.; Shekarchi, M.; Safari, A. Statistical and experimental analysis on thebehavior of fiber reinforced concrete subjected to drop weight test. Constr. Build. Mater. 2012, 37, 360–369. [Google Scholar] [CrossRef]
  3. Zhang, S.; Wei, P.; Wang, C.; Wang, G.; Lu, W.; Cao, K. Failure criteria calibration based on the triaxial compression behavior of roller compacted concrete (RCC). Mater. Struct. 2021, 54, 7. [Google Scholar] [CrossRef]
  4. Wang, C.; Wei, P.; Wang, X.; Wang, G.; Lu, W.; Cao, K. Blast-Resistance and Damage Evaluation of Concrete Gravity Dam Exposed to Underwater Explosion: Considering the Initial Stress Field. KSCE J. Civ. Eng. 2021, 25, 2922–2935. [Google Scholar] [CrossRef]
  5. Li, Q.; Wang, G.; Lu, W.; Niu, X.; Chen, M.; Yan, P. Failure modes and effect analysis of concrete gravity dams subjected to underwater contact explosion considering the hydrostatic pressure. Eng. Fail. Anal. 2018, 85, 62–76. [Google Scholar] [CrossRef]
  6. Lu, L.; Zhu, Y.; Zou, D.G.; Fan, Q.; Dong, S. Evaluation of anti-explosion performance of Shuibuya concrete-faced rockfill dam slabs subjected to strong shock waves caused by an underwater explosion. Adv. Mech. Eng. 2019, 11, 168781401882220. [Google Scholar] [CrossRef] [Green Version]
  7. Hu, J.; Wang, P. Element Analysis of Tunnel Structure with EPS Granule Layers Subjected to Blast Load. J. Highw. Transp. Res. Dev. 2016, 10, 53–58. [Google Scholar] [CrossRef]
  8. Zhang, J.; Zhang, Y.; Fan, J.; Fang, Q.; Long, Y. Mesoscopic investigation of layered graded metallic foams under dynamic compaction. Adv. Struct. Eng. 2018, 21, 2081–2098. [Google Scholar] [CrossRef]
  9. Yan, L.; Su, P.; Han, Y.; Han, B. Effects of Aluminum Foam Filling on Compressive Strength and Energy Absorption of Metallic Y-Shape Cored Sandwich Panel. Metals 2020, 10, 1670. [Google Scholar] [CrossRef]
  10. Xin, Y.; Yan, H.; Cheng, S.; Li, H. Drop weight impact tests on composite sandwich panel of aluminum foam and epoxy resin. Mech. Adv. Mater. Struct. 2021, 28, 343–356. [Google Scholar] [CrossRef]
  11. Jones, M.R.; McCarthy, A. Preliminary views on the potential of foamed concrete as a structural material. Mag. Concr. Res. 2005, 57, 21–31. [Google Scholar] [CrossRef]
  12. Park, S.B.; Yoon, E.S.; Lee, B.I. Effects of processing and materials variations on mechanical properties of lightweight cement composites. Cem. Concr. Res. 1999, 29, 193–200. [Google Scholar] [CrossRef]
  13. Roslan, A.F.; Awang, H.; Mydin, M.A.O. Effects of various additives on drying shrinkage, compressive and flexural strength of lightweight foamed concrete (LFC). In Advanced Materials Research; Trans Tech Publications Ltd.: Stafa-Zurich, Switzerland, 2013; Volume 626, pp. 594–604. [Google Scholar]
  14. Deng, Z.; Cheng, H.; Wang, Z.; Zhu, G.; Zhong, H. Compressive behavior of the cellular concrete utilizing millimeter-size spherical saturated SAP under high strain-rate loading. Constr. Build. Mater. 2016, 119, 96–106. [Google Scholar] [CrossRef]
  15. Serrano, R.; Cobo, A.; Prieto, M.I.; de las NievesGonzález, M. Analysis of fire resistance of concrete with polypropylene or steel fibers. Constr. Build. Mater. 2016, 122, 302–309. [Google Scholar] [CrossRef] [Green Version]
  16. Eidan, J.; Rasoolan, I.; Rezaeian, A.; Poorveis, D. Residual mechanical properties of polypropylene fiber-reinforced concrete after heating. Constr. Build. Mater. 2019, 198, 195–206. [Google Scholar] [CrossRef]
  17. Yuan, Z.; Wen, H.; Liu, Y.; Wang, Q. Synergistic effect between piperazine pyrophosphate and melamine polyphosphate in flame retarded glass fiber reinforced polypropylene. Polym. Degrad. Stab. 2021, 184, 109477. [Google Scholar] [CrossRef]
  18. Smarzewski, P.; Barnat-Hunek, D. Property assessment of hybrid fiber-reinforced ultra-high-performance concrete. Int. J. Civ. Eng. 2018, 16, 593–606. [Google Scholar] [CrossRef] [Green Version]
  19. Abd, S.M.; Ismail, D.K.; Ghalib, D. Mechanical properties of the light weight foamed concrete with steel fiber of different aspect ratio. In Proceedings of the 2018 1st International Scientific Conference of Engineering Sciences-3rd Scientific Conference of Engineering Science (ISCES), IEEE, Diyala, Iraq, 10–11 January 2018; pp. 305–310. [Google Scholar]
  20. Wang, S.; Le HT, N.; Poh, L.H.; Quek, S.T.; Zhang, M. Effect of high strain rate on compressive behavior of strain-hardening cement composite in comparison to that of ordinary fiber-reinforced concrete. Constr. Build. Mater. 2017, 136, 31–43. [Google Scholar] [CrossRef]
  21. Li, Y.; Pimienta, P.; Pinoteau, N.; Tan, K.H. Effect of aggregate size and inclusion of polypropylene and steel fibers on explosive spalling and pore pressure in ultra-high-performance concrete (UHPC) at elevated temperature. Cem. Concr. Compos. 2019, 99, 62–71. [Google Scholar] [CrossRef]
  22. Hou, L.; Li, J.; Lu, Z.; Niu, Y. Influence of foaming agent on cement and foam concrete. Constr. Build. Mater. 2021, 280, 122399. [Google Scholar] [CrossRef]
  23. Kearsley, E.P.; Wainwright, P.J. The effect of porosity on the strength of foamed concrete. Cem. Concr. Res. 2002, 32, 233–239. [Google Scholar] [CrossRef]
  24. Neramitkornburi, A.; Horpibulsuk, S.; Shen, S.L.; Chinkulkijniwat, A.; Arulrajah, A.; Disfani, M.M. Durability against wetting–drying cycles of sustainable Lightweight Cellular Cemented construction material comprising clay and fly ash wastes. Constr. Build. Mater. 2015, 77, 41–49. [Google Scholar] [CrossRef]
  25. Sayadi, A.A.; Tapia, J.V.; Neitzert, T.R.; Clifton, G.C. Effects of expanded polystyrene (EPS) particles on fire resistance, thermal conductivity and compressive strength of foamed concrete. Constr. Build. Mater. 2016, 112, 716–724. [Google Scholar] [CrossRef]
  26. Ayse, K.; Filiz KA, R. Properties of concrete containing waste expanded polystyrene and natural resin. Constr. Build. Mater. 2016, 105, 572–578. [Google Scholar]
  27. GB/T 17671–1999; Method of Testing Cements–Determination of Strength. China Standards Press: Beijing, China, 1999.
  28. Ahmad, S.H.; Arockiasamy, M.; Balaguru, P.N.; Ball, C.G.; Ball, H.P., Jr.; Batson, G.B.; Daniel, J.I. Measurement of Properties of Fiber Reinforced Concrete; American Concrete Institute: Farmington Hills, MI, USA, 1988. [Google Scholar]
  29. Song, P.S.; Hwang, S.; Sheu, B.C. Statistical evaluation for impact resistance of steel-fibre-reinforced concretes. Mag. Concr. Res. 2004, 56, 437–442. [Google Scholar] [CrossRef]
  30. Kilinc, K.; Celik, A.O.; Tuncan, M.; Tuncan, A.; Arslan, G.; Arioz, O. Statistical distributions of in situ microcore concrete strength. Constr. Build. Mater. 2012, 26, 393–403. [Google Scholar] [CrossRef]
  31. Walpole, R.E.; Myers, R.H.; Myers, S.L.; Ye, K. Probability and Statistics for Engineers and Scientists; Macmillan: New York, NY, USA, 1993. [Google Scholar]
  32. Limpert, E.; Stahel, W.A.; Abbt, M. Log-normal distributions across the sciences: Keys and clues: On the charms of statistics, and how mechanical models resembling gambling machines offer a link to a handy way to characterize log-normal distributions, which can provide deeper insight into variability and probability—Normal or log-normal: That is the question. BioScience 2001, 51, 341–352. [Google Scholar]
  33. Bajaj, V.; Singh, S.P.; Singh, A.P.; Kaushik, S.K. Flexural fatigue analysis of hybrid fibre-reinforced concrete. Mag. Concr. Res. 2012, 64, 361–373. [Google Scholar] [CrossRef]
  34. Singh, S.P.; Kaushik, S.K. Flexural fatigue life distributions and failure probability of steel fibrous concrete. Mater. J. 2000, 97, 658–667. [Google Scholar]
  35. The Britannica Guide to Statistics and Probability; Britannica Educational Publishing: Chicago, IL, USA, 2010.
Figure 1. EPS gradation curve.
Materials 15 04216 g001
Figure 2. Corrugated steel fiber.
Materials 15 04216 g002
Figure 3. Specimens.
Materials 15 04216 g003
Figure 4. The relationship between compressive strength, the Veps and apparent density of SFEPSC and EPSC: (a) relationship between apparent density and Veps; (b) relationship between compressive strength and Veps; (c) relationship between compressive strength and apparent density.
Materials 15 04216 g004aMaterials 15 04216 g004b
Figure 5. Drop-weight test device.
Materials 15 04216 g005
Figure 6. Scatter diagram of impact data with fitted regression line for SFEPSC and EPSC: (a) S1E20; (b) S0E30.
Materials 15 04216 g006
Figure 7. Distribution of the impact resistance for S1E20.
Materials 15 04216 g007
Figure 8. Distribution of the impact resistance for S0E30.
Materials 15 04216 g008
Figure 9. The linear regression of N1, N2 and ΔN of S1E20 in log-normal distribution.
Materials 15 04216 g009
Figure 10. The linear regression of N1 and N2 of S0E30 in log-normal distribution.
Materials 15 04216 g010
Figure 11. The linear regression of N1, N2 and ΔN of S1E20 in the Weibull distribution.
Materials 15 04216 g011
Figure 12. The linear regression of N1 and N2 of S0E30 in the Weibull distribution.
Materials 15 04216 g012
Figure 13. PVepslgN1 curves in log-normal distribution: (a) SFEPSC; (b) EPSC.
Materials 15 04216 g013
Figure 14. PVepslgN1 curves in Weibull distribution: (a) SFEPSC; (b) EPSC.
Materials 15 04216 g014
Figure 15. Destruction mode of EPSC specimens: (a) S0E10; (b) S0E20; (c) S0E30; (d) S0E40; (e) S0E50.
Materials 15 04216 g015
Figure 16. Destruction mode of SFEPSC specimens: (a) S1E10; (b) S1E20; (c) S1E30; (d) S1E40; (e) S1E50.
Materials 15 04216 g016
Figure 17. Failure fracture surface mode of EPSC specimens: (a) S0E20; (b) S0E30; (c) S0E40.
Materials 15 04216 g017
Figure 18. S1E20 failure mode: (a) A-1 and A-2 of the major specimen are the SF and SF hole, respectively; (b) the A-1 and A-2 of crushed specimen block are the SF hole and SF, respectively.
Materials 15 04216 g018
Table 1. Chemical composition of cement and microsilica (by mass).
OxideSiO2Al2O3Fe2O3CaOMgONa2OK2OSO3NaOLoss
PC (%)21.604.134.7264.442.060.110.560.74-1.64
Ms (%)94.430.930.970.280.77---1.391.23
Table 2. Physical and mechanical property of coarse aggregates (kg/m3).
Particle Size/mmApparent DensityBulk DensityMud ContentCrush Index/%
<10249013700.577.9
Table 3. Mix proportion of SFEPSC and EPSC.
TypeW/BW
(kg)
Binders (kg)FA
(kg)
CA
(kg)
PS
(kg)
SF
(%)
EPS
(kg)
Slump
(mm)
ρd
(kg/m3)
PCMs
S0E00.44238.2487.254.12305362.8--1151568
S1E100.44238.2487.254.12305362.878.52.8711495
S1E200.44238.2487.254.12305362.878.53.1841320
S1E300.44238.2487.254.12305362.878.510.7981174
S1E400.44238.2487.254.12305362.878.516.71171016
S1E500.44238.2487.254.12305362.878.525124857
S0E100.44238.2487.254.12305362.8-2.81101413
S0E200.44238.2487.254.12305362.8-3.11161257
S0E300.44238.2487.254.12305362.8-10.71231115
S0E400.44238.2487.254.12305362.8-16.7129958
S0E500.44238.2487.254.12305362.8-25135805
Table 4. Impact resistance test results for SFEPSC and EPSC specimens (blows).
NumberN1/N2ΔN
S1E10S1E20S1E30S1E40S1E50S1E10S1E20S1E30S1E40S1E50
136/5224/4257/6662/6961/7516189714
220/2238/5721/2875/8334/43219789
349/7813/2839/4810/1933/412915998
428/5921/5260/6854/5980/9131318511
5101/10959/7323/3441/4837/428141175
634/4097/10441/5089/9851/6067999
769/7957/8333/4566/6962/73102612311
860/8444/6125/3350/6147/5524178118
939/5447/5969/7758/6431/4315128612
1069/8463/7927/3343/5536/4415166128
1182/9757/6687/9617/2434/421592078
1257/6951/5932/4143/5234/41128997
NumberS0E10S0E20S0E30S0E40S0E50S0E10S0E20S0E30S0E40S0E50
121/2216/17339/1211003
2236512/1500003
33465700000
4267/86700100
547/8715/17901020
667/817/18713/1501102
767/99811/1202001
811/1210/1111/1288/911101
93913/1510/12800220
1046/777701000
112425400000
125624/259/10600110
For the sake of comparison, the number of EPSC specimens completely destroyed at the first visible crack was defined as N1.
Table 5. Linear regression parameter values of SFEPSC and EPSC.
Specimen TypeRankabR2
S1E10120.961917.2970.8717
S1E20120.836823.7670.9056
S1E30120.99938.78120.9941
S1E40120.97968.78390.9876
S1E50121.0855.34050.9854
S0E102///
S0E2060.55894.31810.4356 *
S0E3050.99161.32060.9952
S0E403///
S0E5051.11630.76740.8505
Rank represents the number of valid test results. R2 = coefficient of determination. * Low precision, not included in analysis.
Table 6. Statistical analysis results of impact test of SFEPSC and EPSC (blows).
Statistical
Parameters
N1/N2ΔN
S1E10S1E20S1E30S1E40S1E5`0S1E10S1E20S1E30S1E40S1E50
Rank12/1212/1212/1212/1212/121212121212
x ¯ 54/6948/6443/5351/5845/5415161079
σ24/2522/2021/2122/2216/1797432
COV%44/3645/3149/3943/3835/316044404322
S0E10S0E20S0E30S0E40S0E50S0E10S0E20S0E30S0E40S0E50
Rank12/212/612/512/312/526535
x ¯ 6/178/109/207/138/1333243
σ5/74/46/63/43/30.4 0.7 0.7 0.8 1.2
COV%83/4150/4066/3043/3138/231323352040
Qualitative analysis by score.
Table 7. Values of log-normal parameters for fatigue life of SFEPSC.
BlowsSpecimen TypeRankα1β1R2
N1S1E10121.76996.87630.981
S1E20121.45265.43180.9044
S1E30121.80156.58630.9672
S1E40121.22284.63190.8114
S1E50122.5369.53260.8723
N2S1E10121.80877.51910.8802
S1E20122.40439.86640.9202
S1E30122.15588.34880.9657
S1E40121.64116.53330.8409
S1E50122.71110.7150.8253
ΔNS1E10121.05742.66360.8838
S1E20121.86394.99940.9736
S1E30122.53555.62960.8299
S1E40122.14844.27730.8922
S1E50122.99836.54310.9297
Table 8. Values of log-normal parameters for fatigue life of EPSC.
BlowsSpecimen TypeRankα1β1R2
N1S0E10121.12921.66420.9114
S0E20121.6313.14230.9615
S0E30121.20352.44560.9503
S0E40122.00133.8320.9480
S0E50122.54945.31480.9392
N2S0E102///
S0E2061.32463.66690.7554 *
S0E3051.03043.55330.9871
S0E403///
S0E5052.02395.88920.9199
ΔNS0E102///
S0E2061.29310.52970.5594 *
S0E3051.13690.6380.6292 *
S0E403///
S0E5050.7340.37140.8348 *
* Low precision, not included in analysis.
Table 9. Values of Weibull parameters for fatigue life of SFEPSC.
BlowsSpecimen TypeRankα2β2R2
N1S1E10122.14638.84210.9895
S1E20121.80457.25130.9538
S1E30122.11058.21940.9071
S1E40121.55336.38730.8947
S1E50122.883311.3410.7705
N2S1E10122.27279.95120.9497
S1E20122.951712.6380.9512
S1E30122.528110.2940.9075
S1E40122.06288.71530.9078
S1E50123.045212.540.7116
ΔNS1E10121.32153.83220.9432
S1E20122.23996.51140.9609
S1E30122.91446.97440.7493
S1E40122.6775.83320.9467
S1E50123.61848.39990.9254
Table 10. Values of Weibull parameters for fatigue life of EPSC.
BlowsSpecimen TypeRankα2β2R2
N1S0E10121.2972.41490.8217
S0E20121.93564.23250.9254
S0E30121.45663.46330.9513
S0E40122.40085.10050.9323
S0E50123.10156.96940.9499
N2S0E102///
S0E2061.96195.73430.6989 *
S0E3051.63635.85440.9769
S0E403///
S0E5053.24819.64940.9298
ΔNS0E102///
S0E2062.10521.0660.6252 *
S0E3051.89731.21260.6851 *
S0E403///
S0E5051.14740.81180.8007 *
* Low precision, not included in analysis.
Table 11. Fatigue lives of SFEPSC and EPSC corresponding to different failure probabilities.
BlowsFailure ProbabilityLog-Normal DistributionWeibull Distribution
S1E10S1E20S1E30S1E40S1E50S1E10S1E20S1E30S1E40S1E50
N10.051914161222957413
0.10241719152614911718
0.1527202219291712141021
0.2030242422312115171324
0.2533262725332418191626
0.3036292929352721221929
N20.052631222028121712917
0.1031362725321824171423
0.1536393028362328211827
0.2040433332382832242130
0.2544463536413236272533
0.3048493839433639302936
S0E10S0E20S0E30S0E40S0E50S0E10S0E20S0E30S0E40S0E50
N10.051.83.83.54.25.60.71.91.42.43.6
0.102.44.64.54.96.31.12.82.33.34.6
0.152.95.25.35.46.81.63.53.13.95.3
0.203.45.86.05.97.22.04.13.84.55.8
0.253.86.36.86.37.62.54.74.65.06.3
0.304.36.87.56.782.95.25.35.46.8
Note: EPSC data are analyzed in fractional form.
Table 12. The coefficients of PVepslgN1 curves of SFEPSC and EPSC.
Concrete TypePLog-Normal DistributionWeibull Distribution
mnlR2 mnlR2
SFEPSC0.054.95242.90851.53160.7469 7.82114.50771.34800.6315
0.104.16602.47021.58190.8143 6.26303.63921.44770.6781
0.153.63552.17441.61580.8785 5.32493.11621.50770.7231
0.203.21381.93931.64280.8943 4.63872.73371.55160.7706
0.252.85201.73771.66590.9259 4.08892.42711.58680.8226
0.302.52721.55661.68670.9789 3.62362.16781.61160.9001
EPSC0.05−2.0230−2.23380.10270.8428 −1.5322−2.5134−0.34750.8159
0.10−2.1575−2.15710.22610.8940 −1.7988−2.3615−0.10300.8801
0.15−2.2482−2.10540.30930.9179 −1.9592−2.27010.04420.9194
0.20−2.3204−2.06430.37550.9436 −2.0766−2.20320.15190.9453
0.25−2.3822−2.02900.43230.9348 −2.1707−2.14960.23820.9482
0.30−2.4378−1.99740.48330.9208 −2.2503−2.10420.31120.9479
Publisher’s Note: MDPI stays neutral with regard to jurisdictional claims in published maps and institutional affiliations.

