
Optimization of Laser-MAG Hybrid Welding Parameters of Ship Steel Based on Response Surface Methodology

 and
and
Abstract
:1. Introduction
2. Materials and Methods
3. Model Verification and Optimal Parameter Solution
3.1. Fitting Model Check and Model Optimization
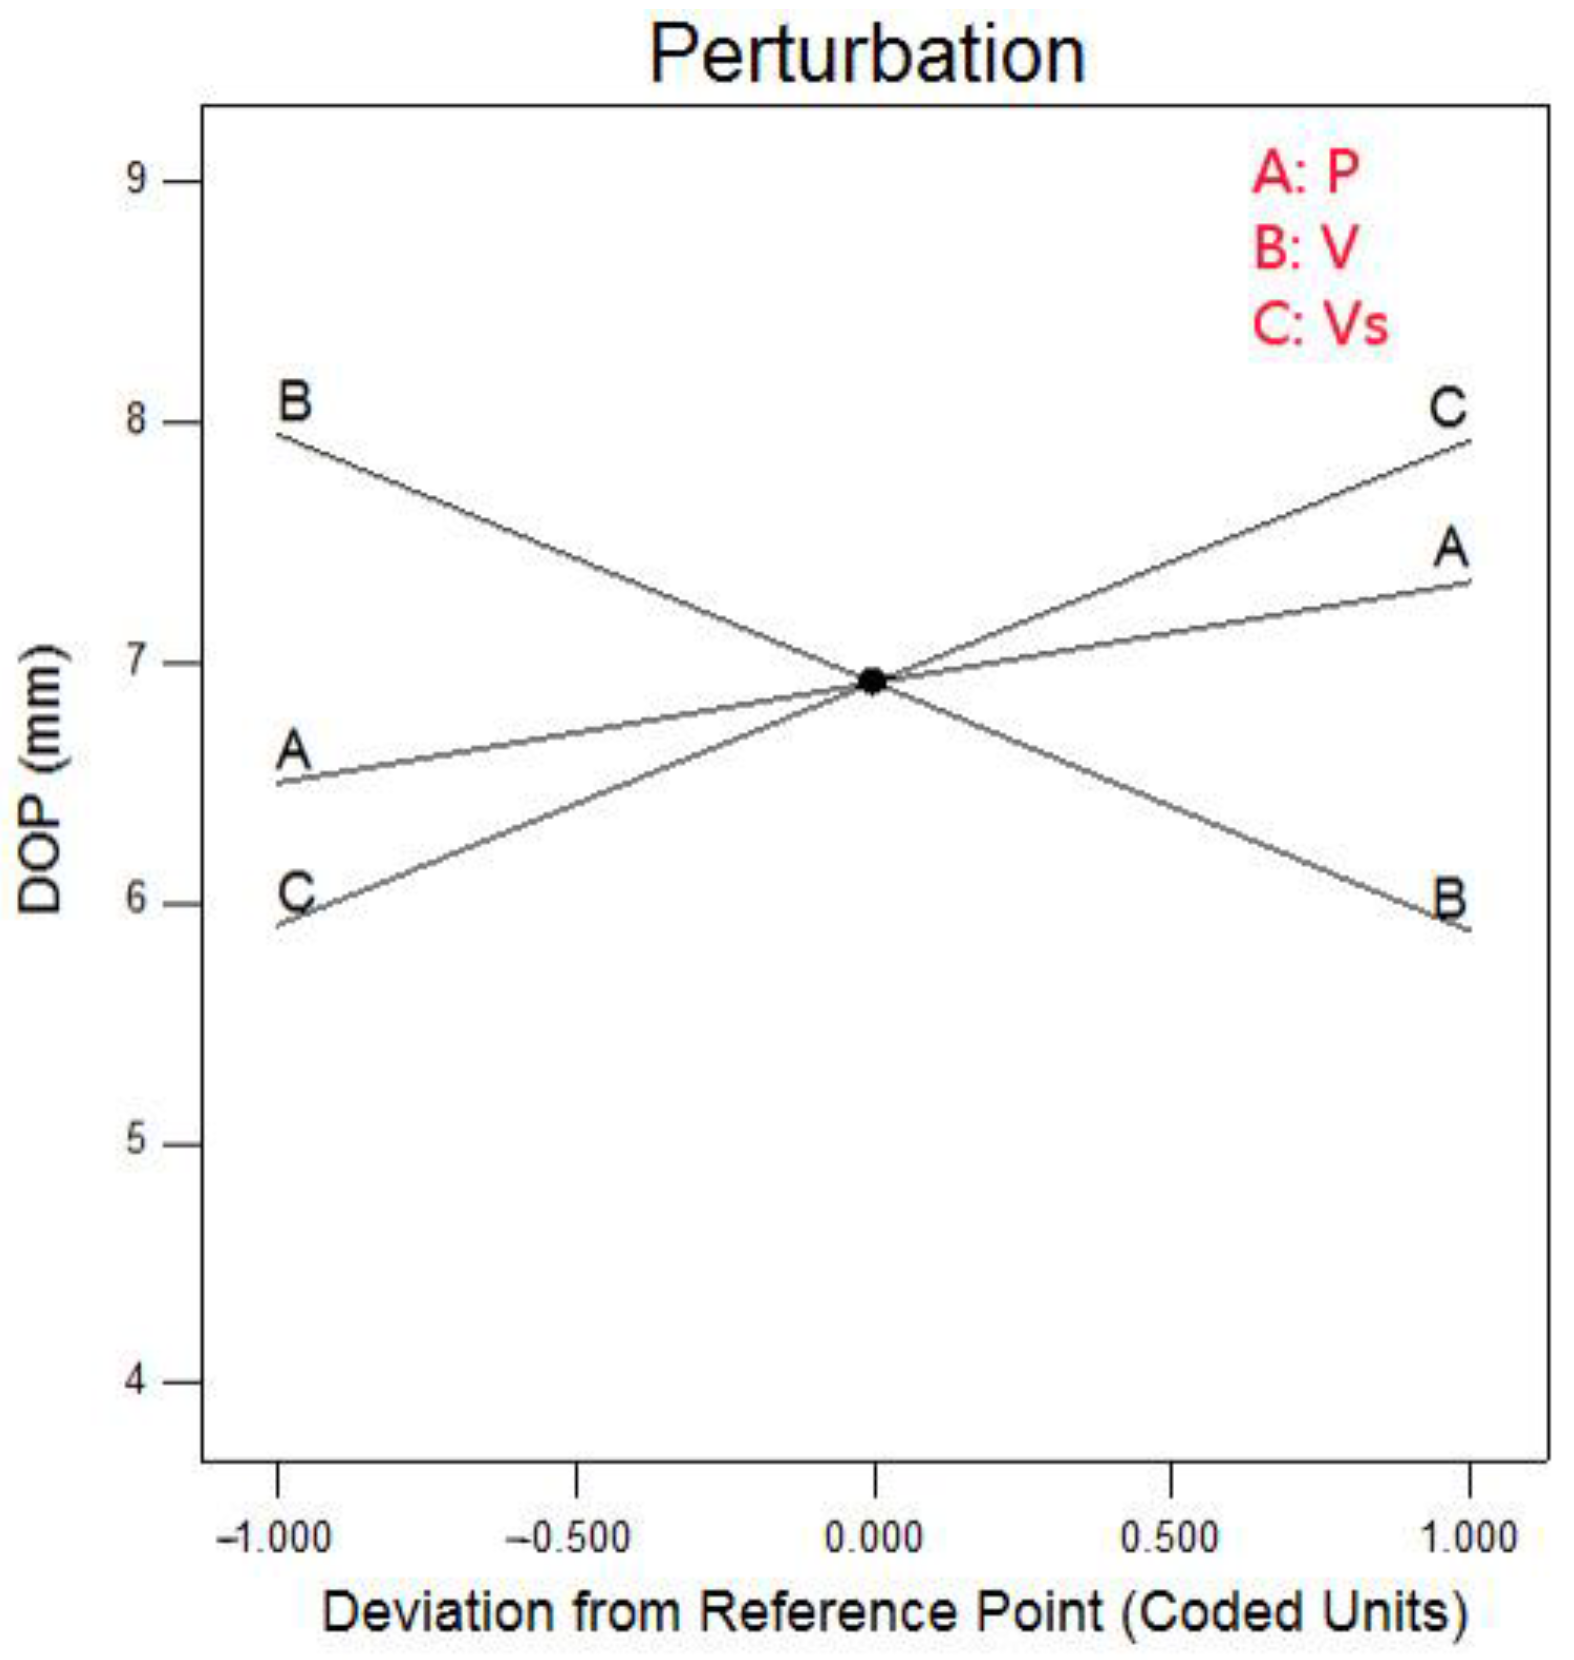
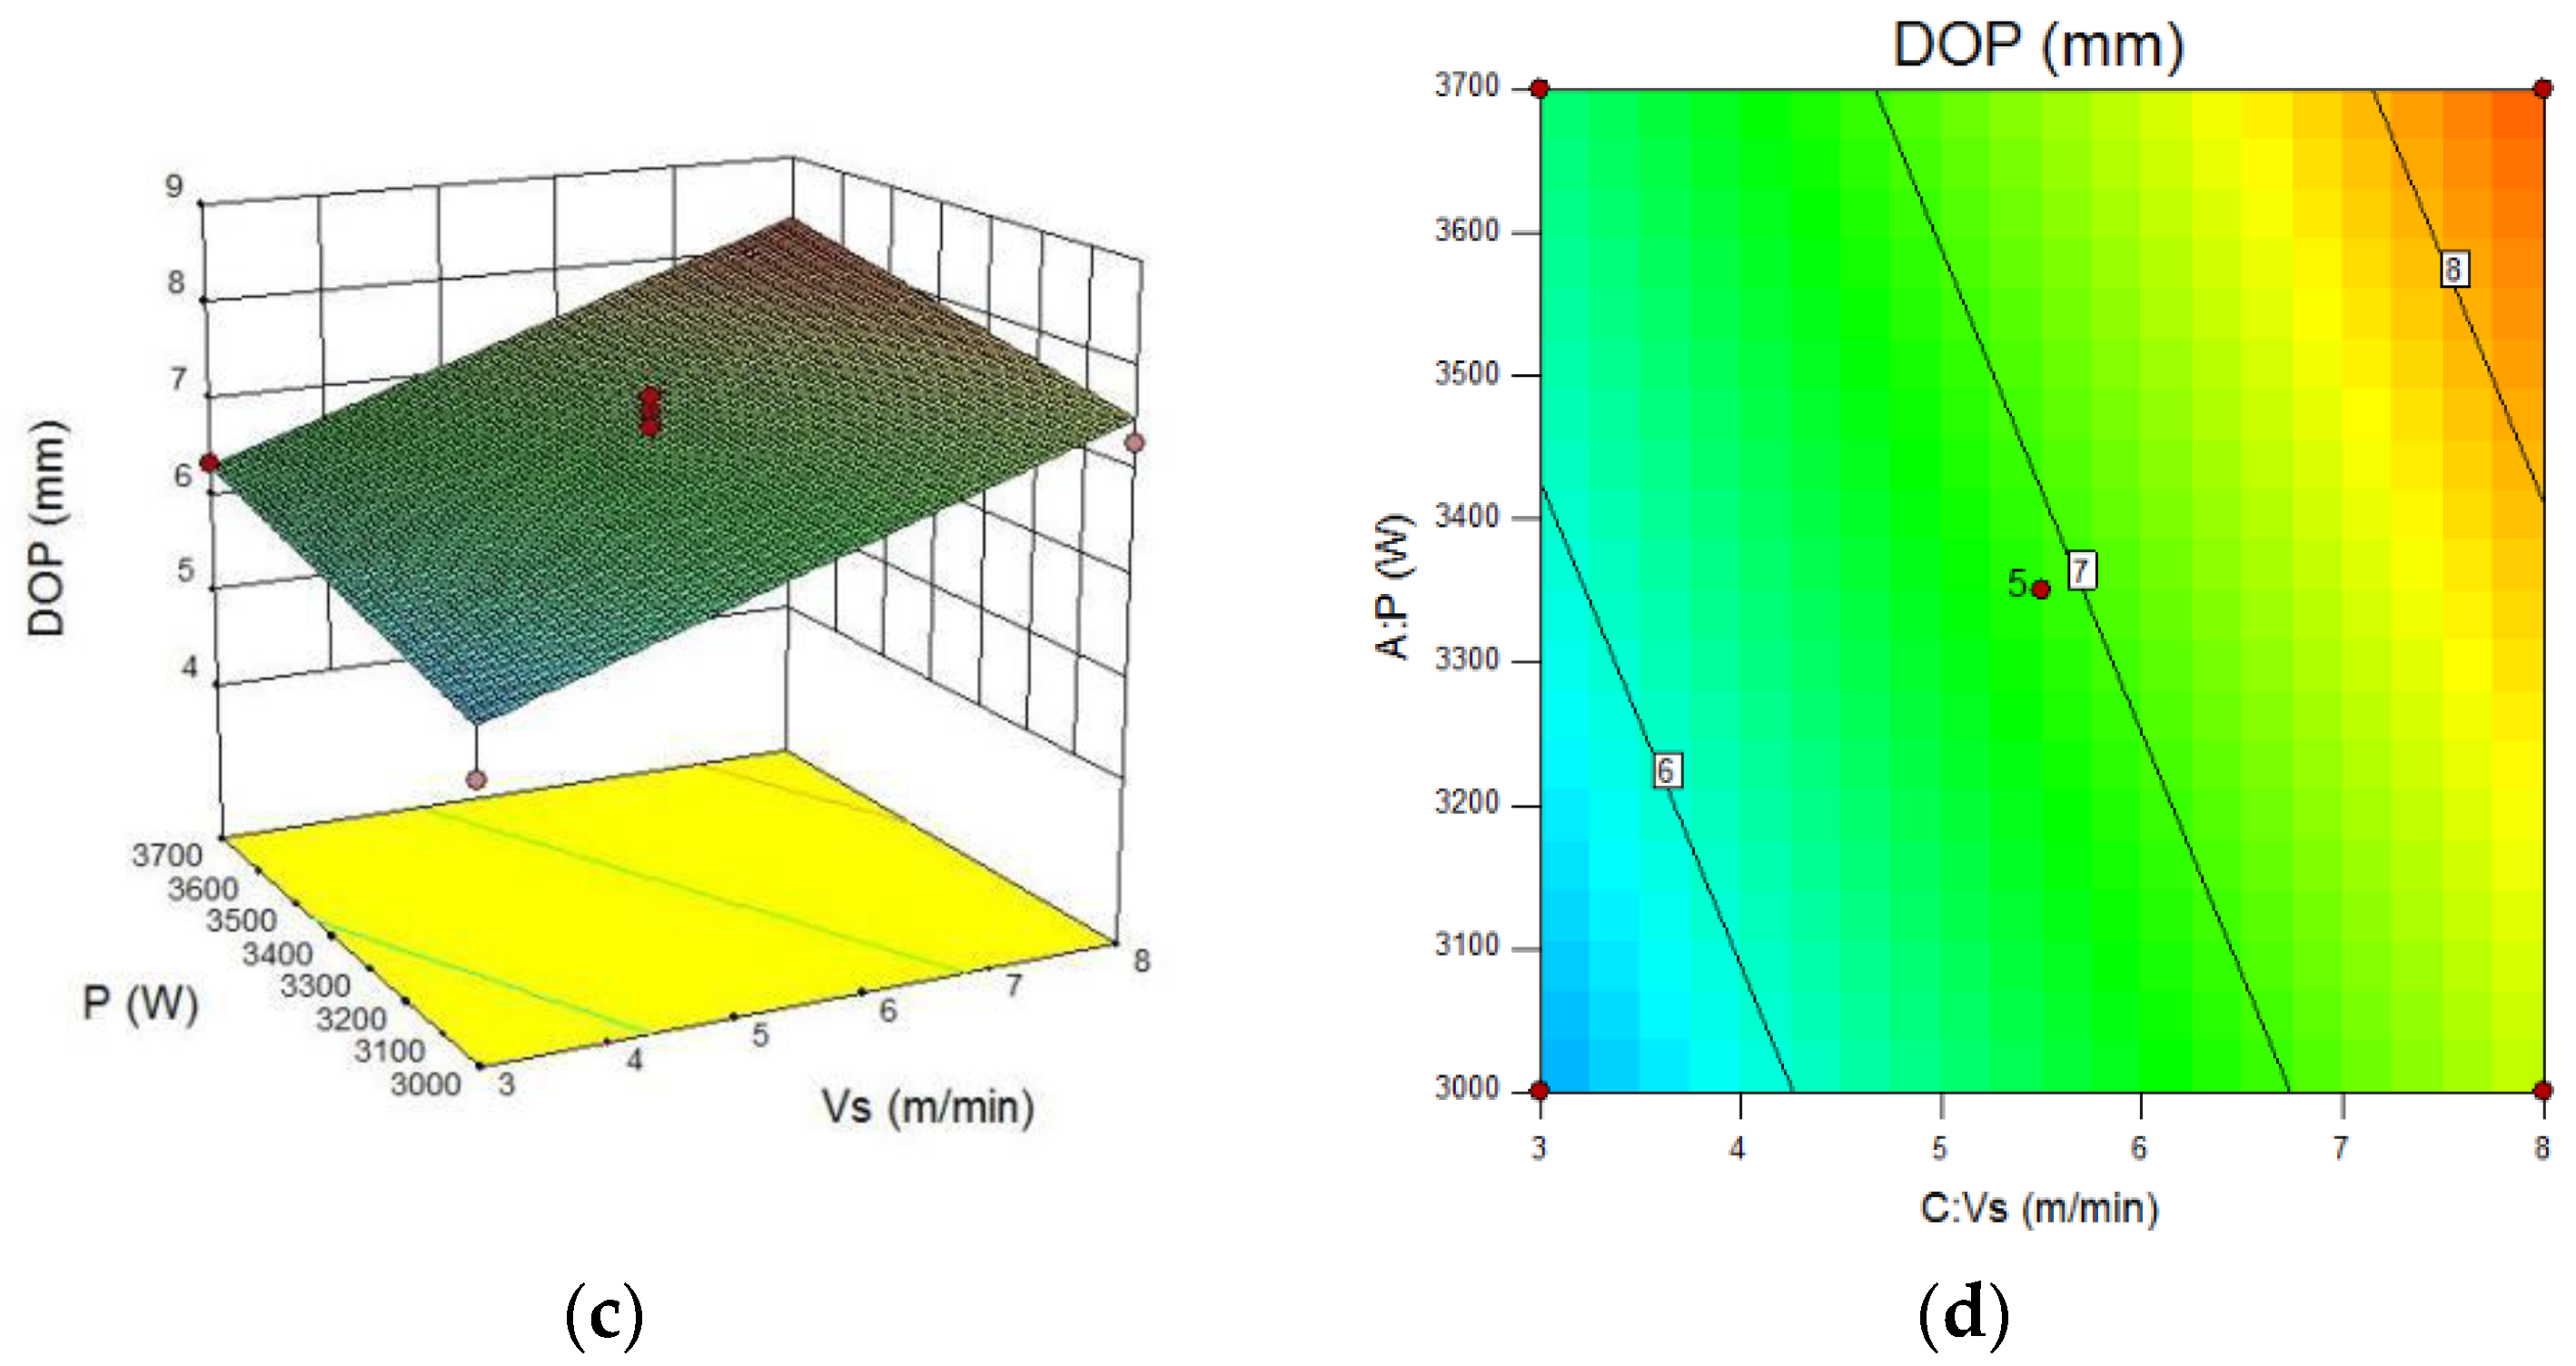
3.1.1. Test of Weld Penetration Fitting Model
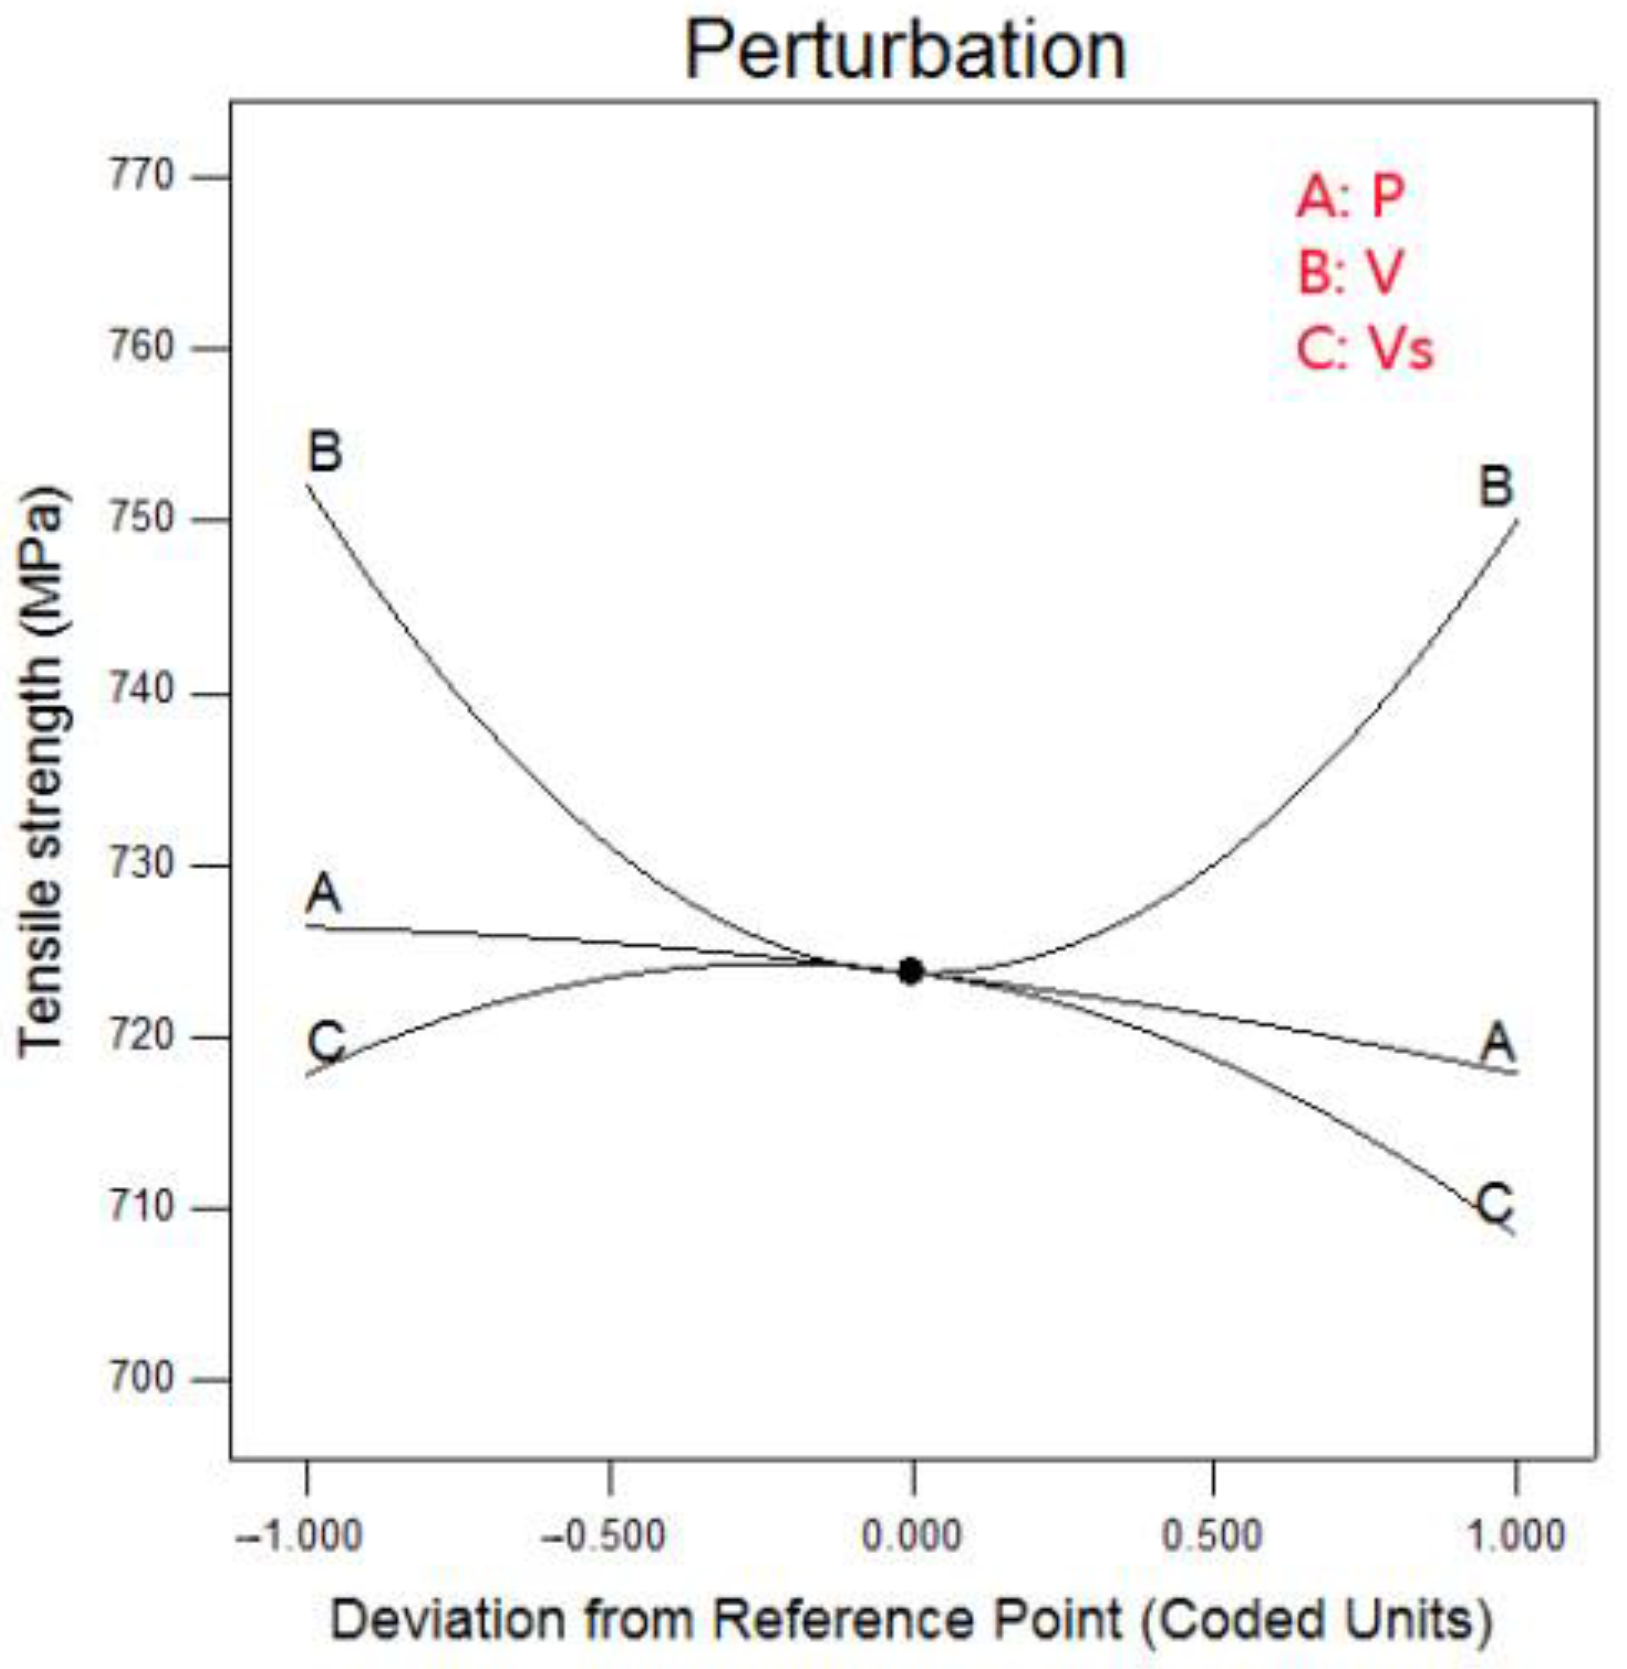
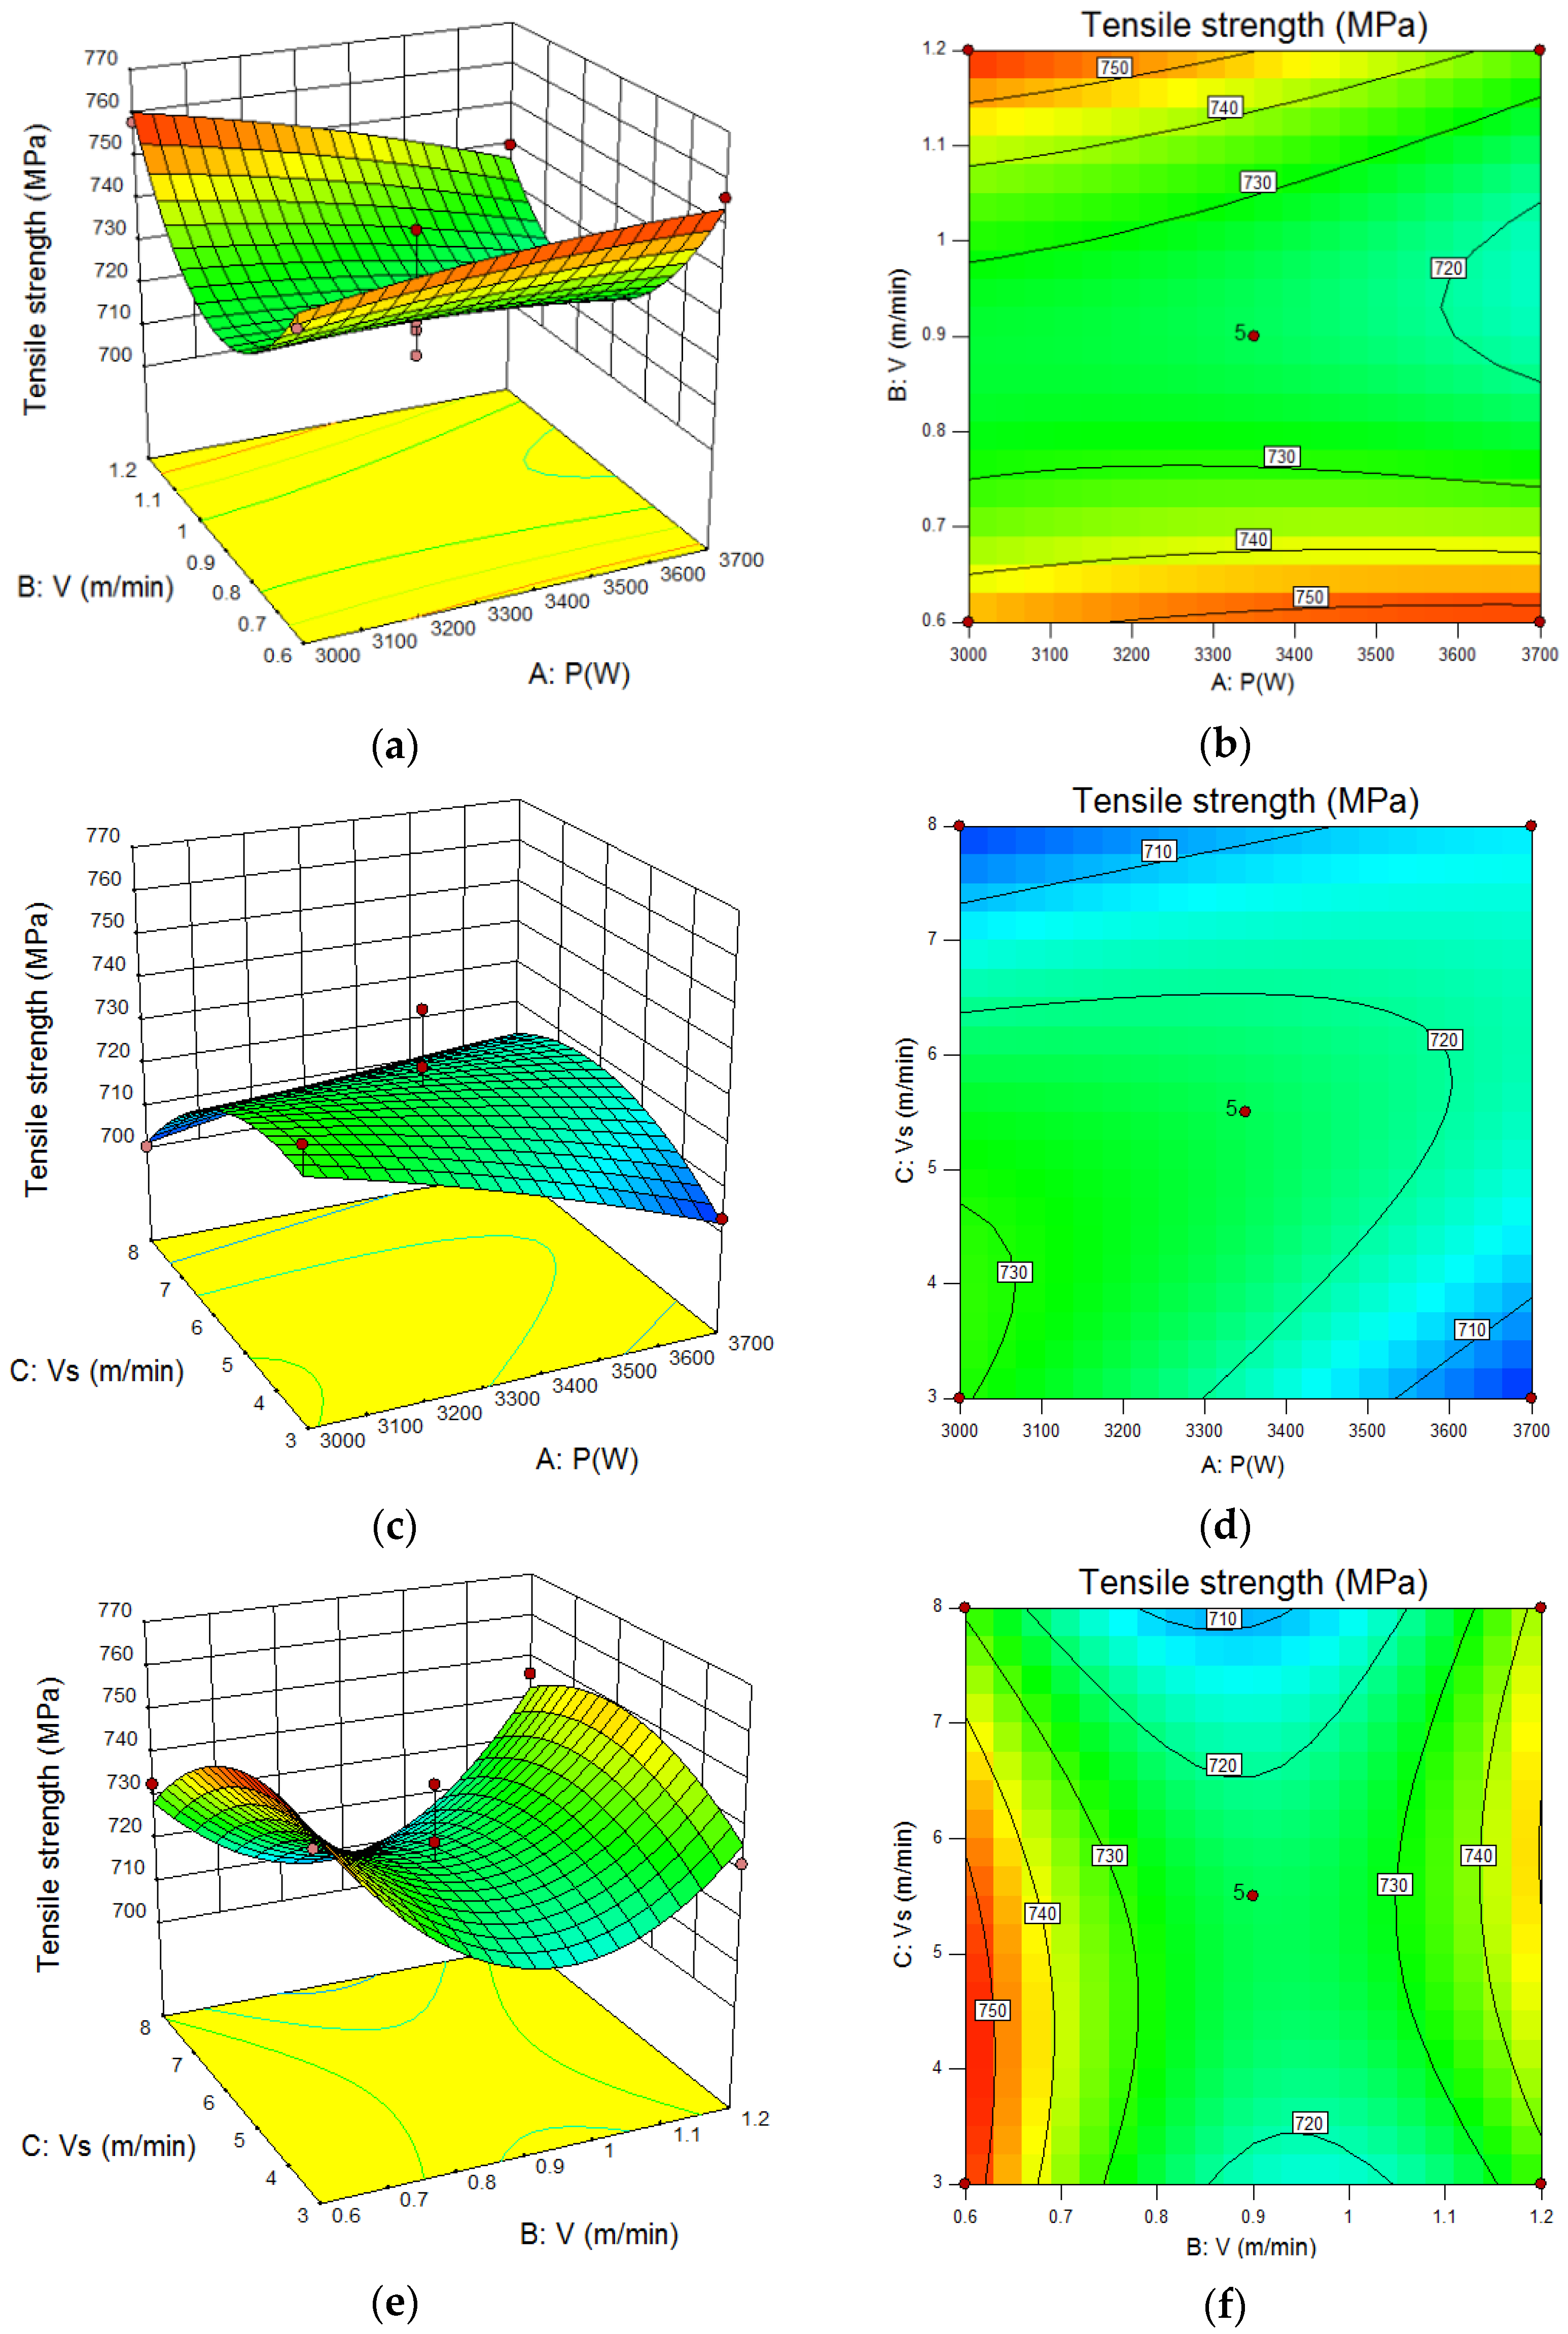
3.1.2. Test of Tensile Strength Fitting Model
3.1.3. Test of Impact Absorption Energy Fitting Model
3.2. RSM Optimization Based on Expected Value Method
3.3. Verify the Optimal Solution of the Model
4. Conclusions
- Based on the current situation of ship construction welding process, RSM experimental design method was used to optimize the process parameters of laser-arc hybrid welding, the groove size was optimized, and the process and experimental efficiency were greatly improved. At the same time, the performance of the welded joint was related to process parameters. Through the factorial experimental design of welding parameters and performance indices, the welding parameters were optimized.
- RSM experimental design method identified the important influence of process parameters (laser power, welding speed and wire feeding speed) on weld penetration and mechanical properties of laser-arc hybrid welding, among which welding speed has the most significance.
- Optimal welding parameters: P = 3700 W, V = 0.8 m/min, Vs = 7 m/min. On the premise that the mechanical properties meet the inspection standards, the maximum penetration can reach nearly 8 mm.
Author Contributions
Funding
Institutional Review Board Statement
Informed Consent Statement
Data Availability Statement
Conflicts of Interest
References
- Peng, K.; Yang, C.; Lin, S.; Fan, C.; Han, Y.; Wu, M. Thermal cycles and its effect on HAZ microstructure and mechanical properties of 10CrNi3MoV steel in double-sided double arc welding. Int. J. Adv. Manuf. Technol. 2017, 93, 967–974. [Google Scholar] [CrossRef]
- Bagger, C.; Olsen, F.O. Review of laser hybrid welding. J. Laser Appl. 2005, 17, 2–14. [Google Scholar] [CrossRef]
- Gunst, R.F. Response Surface Methodology: Process and Product Optimization Using Designed Experiments. Technometrics 2008, 38, 284–286. [Google Scholar] [CrossRef]
- Bas, D.; Boyacı, I.H. Modeling and optimization I: Usability of response surface methodology. J. Food Eng. 2007, 78, 836–845. [Google Scholar] [CrossRef]
- Johnson, R.T.; Montgomery, D.C. Choice of second-order response surface designs for logistic and Poisson regression models. Int. J. Exp. Des. Process Optim. 2009, 1, 2–23. [Google Scholar] [CrossRef]
- Goos, P.; Vandebroek, M. D-optimal response surface designs in the presence of random block effects. Comput. Stat. Data Anal. 2001, 37, 433–453. [Google Scholar] [CrossRef]
- Lee, C.P.; Huang, M.N.L. D-optimal designs for second-order response surface models with qualitative factors. J. Data Sci. 2011, 9, 139–153. [Google Scholar] [CrossRef]
- Ragavendran, M.; Chandrasekhar, N.; Ravikumar, R.; Saxena, R.; Vasudevan, M.; Bhaduri, A. Optimization of hybrid laser–TIG welding of 316LN steel using response surface methodology (RSM). Opt. Lasers Eng. 2017, 94, 27–36. [Google Scholar] [CrossRef]
- Ahn, J.; Chen, L.; Davies, C.; Dear, J. Parametric optimisation and microstructural analysis on high power Yb-fibre laser welding of Ti–6Al–4V. Opt. Lasers Eng. 2016, 86, 156–171. [Google Scholar] [CrossRef]
- Olabi, A.; Alsinani, F.; Alabdulkarim, A.; Ruggiero, A.; Tricarico, L.; Benyounis, K. Optimizing the CO2 laser welding process for dissimilar materials. Opt. Lasers Eng. 2013, 51, 832–839. [Google Scholar] [CrossRef]
- Salah, A.N.; Mehdi, H.; Mehmood, A.; Hashmi, A.W.; Malla, C.; Kumar, R. Optimization of process parameters of friction stir welded joints of dissimilar aluminum alloys AA3003 and AA6061 by RSM. Mater. Today Proc. 2022, 56, 1675–1683. [Google Scholar] [CrossRef]
- Salah, A.N.; Mehdi, H.; Mehmood, A.; Hashmi, A.W.; Malla, C.; Kumar, R. Optimization of process parameters in friction stir welded dissimilar magnesium alloys using RSM. Mater. Today Proc. 2021, 46, 9736–9746. [Google Scholar] [CrossRef]
- Jahanzaib, M.; Hussain, S.; Wasim, A.; Aziz, H.; Mirza, A.; Ullah, S. Modeling of weld bead geometry on HSLA steel using response surface methodology. Int. J. Adv. Manuf. Technol. 2016, 89, 2087–2098. [Google Scholar] [CrossRef]
- Cai, X.; Fan, C.; Lin, S.; Ji, X.; Yang, C. Optimization of shielding gas composition in narrow gap GMA welding based on response surface methodology. Int. J. Adv. Manuf. Technol. 2018, 95, 2405–2412. [Google Scholar] [CrossRef]
- Ning, J.; Sievers, D.E.; Garmestani, H.; Liang, S.Y. Analytical modeling of in-process temperature in powder bed additive manufacturing considering laser power absorption, latent heat, scanning strategy, and powder packing. Materials 2019, 12, 808. [Google Scholar] [CrossRef] [PubMed] [Green Version]
- Myers, R.H.; Montgomery, D.C.; Anderson-Cook, C.M. Response Surface Methodology: Process and Product Optimization Using Designed Experiments; John Wiley & Sons: Hoboken, NJ, USA, 2016. [Google Scholar]
- Juang, S.; Tarng, Y. Process parameter selection for optimizing the weld pool geometry in the tungsten inert gas welding of stainless steel. J. Mater. Processing Technol. 2002, 122, 33–37. [Google Scholar] [CrossRef]
- Lee, H.-K.; Han, H.-S.; Son, K.-J.; Hong, S.-B. Optimization of Nd: YAG laser welding parameters for sealing small titanium tube ends. Mater. Sci. Eng. A 2006, 415, 149–155. [Google Scholar] [CrossRef]
- Sudasna-na-Ayudthya, P. Comparison of Response Surface Model and Taguchi Methodology for Robust Design; Oregon State University: Corvallis, OR, USA, 1992. [Google Scholar]
- Kim, S.B.; Tsui, K.L.; Sukchotrat, T.; Chen, V.C.P. A comparison study and discussion of the Mahalanobis-Taguchi System. Int. J. Ind. Syst. Eng. 2009, 4, 631–644. [Google Scholar] [CrossRef]
- Wu, C.; Black, J.; Jiang, B. Using Taguchi methods to determine/optimize robot process capability for path following. Robot. Comput. Integr. Manuf. 1991, 8, 9–25. [Google Scholar] [CrossRef]
- Jung, B.C.; Black, J.T.; Chen, D.W.H.; Hool, J.N. Taguchi-based methodology for determining/optimizing robot process capability. IIE Trans. 1991, 23, 169–184. [Google Scholar] [CrossRef]
- Chang, M.T.; Yeh, C.H. An innovative manufacturing process for bamboo injection molding by using TRIZ and Taguchi method. J. Chin. Inst. Ind. Eng. 2012, 29, 454–465. [Google Scholar] [CrossRef]
- Liu, L.; Nazaret, W.A.; Beale, R.G. Computer-aided design for quality (CADQ). ATT Tech. J. 1990, 69, 46–60. [Google Scholar] [CrossRef]
- Alvarez, A.; Abdi, B.; Young, D.; Weed, H.; Teplik, J.; Herald, E. Application of statistical design and response surface methods to computer-aided VLSI device design. IEEE Trans. Comput. Aided Des. Integr. Circuits Syst. 1988, 7, 272–288. [Google Scholar] [CrossRef]
- Ning, J.; Nguyen, V.; Huang, Y.; Hartwig, K.T.; Liang, S.Y. Inverse determination of Johnson–Cook model constants of ultra-fine-grained titanium based on chip formation model and iterative gradient search. Int. J. Adv. Manuf. Technol. 2018, 99, 1131–1140. [Google Scholar] [CrossRef]
- Khuri, A.I.; Mukhopadhyay, S. Response surface methodology. Wiley Interdiscip. Rev. Comput. Stat. 2010, 2, 128–149. [Google Scholar] [CrossRef]
- Altarazi, S.; Hijazi, L.; Kaiser, E. Process parameters optimization for multiple-inputs-multiple-outputs pulsed green laser welding via response surface methodology. In Proceedings of the 2016 IEEE IEEM, Bali, Indonesia, 4–7 December 2016; pp. 1041–1045. [Google Scholar] [CrossRef]


| Brand | C | Mn | Ni | Cr | Mo | Si | Ti | Cu | P | S | V |
|---|---|---|---|---|---|---|---|---|---|---|---|
| 10CrNi3MoV | 0.027 | 0.44 | 2.73 | 1.01 | 0.250 | 0.230 | - | - | 0.005 | 0.001 | 0.07 |
| WM960S | 0.041 | 1.38 | 2.80 | - | 0.268 | 0.495 | 0.044 | 0.079 | 0.008 | 0.005 | 0.10 |
| Brand | Rp0.2 (MPa) | Rm (MPa) | A (%) | Z (%) |
|---|---|---|---|---|
| 10CrNi3MoV | 670 | 730 | 21.6 | 72.2 |
| WM960S | 672 | 729 | 23.5 | 73 |
| Constant Welding Parameters | Value |
|---|---|
| Defocus Distance | −2 mm |
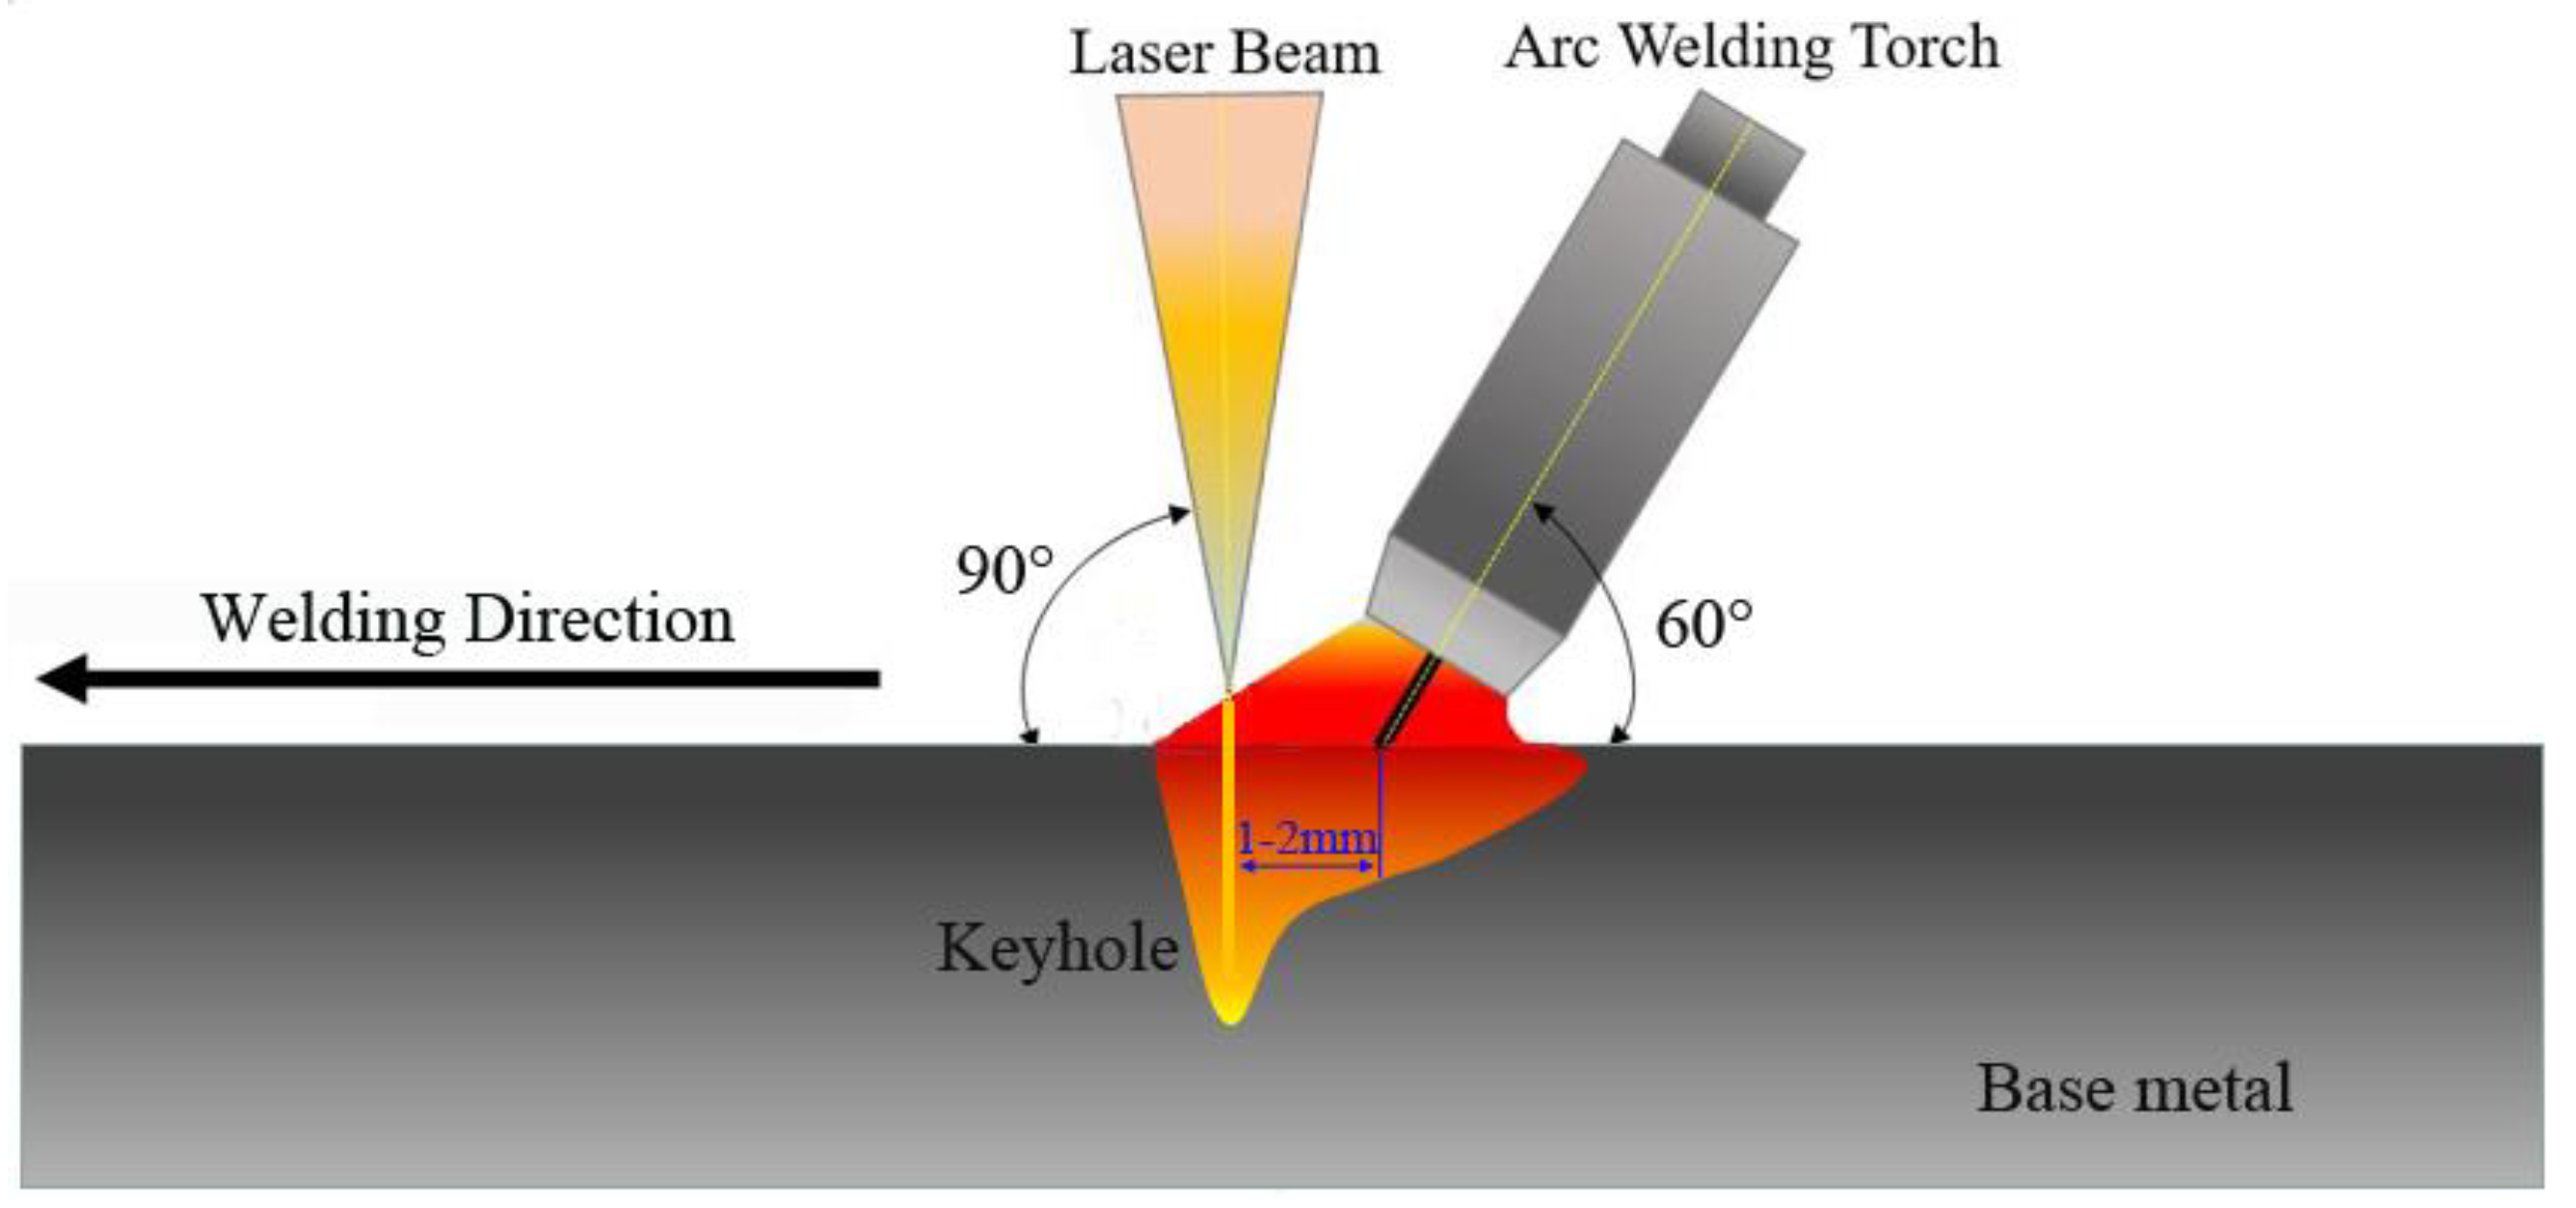
| Laser-Wire Distance | 1–2 mm |
| Extension Length of Welding Wire | 15 mm |
| Shielding Gas Flow | 20–25 L/min |
| Deflection Angle of Welding Torch | 30° |
| Welding Parameters | Unit | −1 | 0 | −1 |
|---|---|---|---|---|
| P | W | 3000 | 3350 | 3700 |
| V | m/min | 0.6 | 0.9 | 1.2 |
| Vs | m/min | 3 | 5.5 | 8 |
| Run | Factor 1 A:P (W) | Factor 2 B:V (m/min) | Factor 3 C:Vs (m/min) | Response 1 DOP (mm) | Response 2 Rm (MPa) | Response 3 Akv (J) |
|---|---|---|---|---|---|---|
| 1 | 3000 | 0.9 | 8 | 7.28 | 700 | 28 |
| 2 | 3350 | 0.9 | 5.5 | 7.07 | 728 | 42 |
| 3 | 3350 | 1.2 | 8 | 7.30 | 746 | 32 |
| 4 | 3000 | 0.6 | 5.5 | 8.17 | 744 | 25 |
| 5 | 3350 | 0.6 | 8 | 8.58 | 733 | 27 |
| 6 | 3350 | 0.9 | 5.5 | 6.51 | 712 | 31 |
| 7 | 3350 | 0.6 | 3 | 6.92 | 751 | 24 |
| 8 | 3350 | 0.9 | 5.5 | 7.39 | 741 | 20 |
| 9 | 3350 | 1.2 | 3 | 4.82 | 732 | 22 |
| 10 | 3700 | 0.9 | 3 | 6.35 | 703 | 28 |
| 11 | 3000 | 0.9 | 3 | 4.99 | 737 | 35 |
| 12 | 3700 | 1.2 | 5.5 | 6.36 | 740 | 49 |
| 13 | 3350 | 0.9 | 5.5 | 7.24 | 718 | 29 |
| 14 | 3350 | 0.9 | 5.5 | 7.39 | 720 | 30 |
| 15 | 3700 | 0.9 | 8 | 7.99 | 706 | 45 |
| 16 | 3000 | 1.2 | 5.5 | 5.08 | 758 | 46 |
| 17 | 3700 | 0.6 | 5.5 | 8.16 | 756 | 26 |
| Source | Sum of Squares | df | Mean Square | F Value | p-Value Prob > F | Source |
|---|---|---|---|---|---|---|
| Model | 18.08 | 3 | 6.03 | 37.60 | <0.0001 | significant |
| A-P | 1.39 | 1 | 1.39 | 8.70 | 0.0113 | significant |
| B-V | 8.55 | 1 | 8.55 | 53.33 | <0.0001 | significant |
| C-Vs | 8.14 | 1 | 8.14 | 50.78 | <0.0001 | significant |
| Residual | 2.08 | 13 | 0.16 | |||
| Lack of Fit | 1.55 | 9 | 0.17 | 1.29 | 0.4326 | Not significant |
| Pure Error | 0.53 | 4 | 0.13 | |||
| Cor Total | 20.17 | 16 | ||||
| C.V. % | 5.79 | Adeq Precision | 21.033 | |||
| R-Squared | 0.8967 | R2 Adj-R2 Pred | 0.09 | |||
| Source | Sum of Squares | df | Mean Square | F Value | p-Value Prob > F | Source |
|---|---|---|---|---|---|---|
| Model | 4718.00 | 9 | 524.22 | 5.43 | 0.0181 | significant |
| A-P | 145.35 | 1 | 145.35 | 1.51 | 0.2594 | |
| B-V | 8.00 | 1 | 8.00 | 0.083 | 0.7818 | |
| C-Vs | 179.55 | 1 | 179.55 | 1.86 | 0.2148 | |
| AB | 225.00 | 1 | 225.00 | 2.33 | 0.1706 | |
| AC | 398.00 | 1 | 398.00 | 4.12 | 0.0818 | |
| BC | 256.00 | 1 | 256.00 | 2.65 | 0.1474 | |
| A2 | 11.29 | 1 | 11.29 | 0.12 | 0.7424 | |
| B2 | 3146.69 | 1 | 3146.69 | 32.60 | 0.0007 | |
| C2 | 476.45 | 1 | 476.45 | 4.94 | 0.0617 | |
| Residual | 675.60 | 7 | 96.51 | |||
| Lack of Fit | 174.80 | 3 | 58.27 | 0.47 | 0.7221 | Not significant |
| Pure Error | 500.80 | 4 | 125.20 | |||
| Cor Total | 5393.60 | 16 | ||||
| C.V. % | 1.34% | R-Squared | 0.8747 | |||
| Adeq Precision | 7.855 | R2 Adj-R2 Pred | 0.39 | |||
| Source | Sum of Squares | df | Mean Square | F Value | p-Value Prob > F | Source |
|---|---|---|---|---|---|---|
| Model | 366.75 | 3 | 122.25 | 1.85 | 0.1878 | Not significant |
| A-P | 24.50 | 1 | 24.50 | 0.37 | 0.5530 | |
| B-V | 276.13 | 1 | 276.13 | 4.18 | 0.0617 | |
| C-Vs | 66.13 | 1 | 66.13 | 1.0 | 0.3353 | |
| Residual | 858.78 | 13 | 66.06 | |||
| Lack of Fit | 613.58 | 9 | 68.18 | 1.11 | 0.4967 | Not significant |
| Pure Error | 245.20 | 4 | 61.30 | |||
| Cor Total | 1225.53 | 16 | ||||
| C.V.% | 25.63% | Adeq Precision | 4.439 | |||
| R-Squared | 0.2993 | R2 Adj-R2 Pred | 0.05 | |||
| Process Parameters | Goal | Lower Limit | Upper Limit |
|---|---|---|---|
| P (W) | In range | 3000 | 3700 |
| V (m/min) | maximize | 0.6 | 0.8 |
| Vs (m/min) | In range | 3 | 8 |
| DOP | maximize | 5 | 8.5 |
| Tensile strength (MPa) | maximize | 700 | 750 |
| Akv (J) | maximize | 20 | 49 |
| Number | P (W) | V (m/min) | Vs (m/min) | DOP | Rm (MPa) | AKv (J) | Desirability |
|---|---|---|---|---|---|---|---|
| 1 | 3699.999 | 0.800 | 7.058 | 8.309 | 721.240 | 33.290 | 0.628 |
| 2 | 3700.000 | 0.800 | 7.036 | 8.300 | 721.333 | 33.264 | 0.628 |
| 3 | 3700.000 | 0.800 | 7.083 | 8.319 | 721.133 | 33.318 | 0.628 |
| 4 | 3699.996 | 0.800 | 7.111 | 8.330 | 721.010 | 33.350 | 0.628 |
| P (W) | V (m/min) | Vs (m/min) | Defocus Amount (mm) | Laser-Wire Distance (mm) | Shield Gas Flow (L/min) |
|---|---|---|---|---|---|
| 3700 | 0.8 | 7 | −2 | 2 | 20 |
| Target | Predicted Result | Actua Result | Error |
|---|---|---|---|
| DOP | 8.3 mm | 7.8 mm | 5% |
| Strength | 721 MPa | 723 MPa | 0.2% |
| Akv | 33 J | 34 J | 3% |
Publisher’s Note: MDPI stays neutral with regard to jurisdictional claims in published maps and institutional affiliations. |
© 2022 by the authors. Licensee MDPI, Basel, Switzerland. This article is an open access article distributed under the terms and conditions of the Creative Commons Attribution (CC BY) license (https://creativecommons.org/licenses/by/4.0/).
Share and Cite
Sun, H.; Zhu, J.; Zhang, B.; Liu, C.; Miao, C.; Wang, K.; Zhao, X. Optimization of Laser-MAG Hybrid Welding Parameters of Ship Steel Based on Response Surface Methodology. Materials 2022, 15, 4328. https://doi.org/10.3390/ma15124328
Sun H, Zhu J, Zhang B, Liu C, Miao C, Wang K, Zhao X. Optimization of Laser-MAG Hybrid Welding Parameters of Ship Steel Based on Response Surface Methodology. Materials. 2022; 15(12):4328. https://doi.org/10.3390/ma15124328
Chicago/Turabian StyleSun, Hongwei, Jialei Zhu, Benshun Zhang, Chao Liu, Chunyu Miao, Kai Wang, and Xiaoxin Zhao. 2022. "Optimization of Laser-MAG Hybrid Welding Parameters of Ship Steel Based on Response Surface Methodology" Materials 15, no. 12: 4328. https://doi.org/10.3390/ma15124328