
Cast Microstructure of a Complex Concentrated Noble Alloy Ag20Pd20Pt20Cu20Ni20


Abstract
:1. Introduction
2. Materials and Methods
3. Results
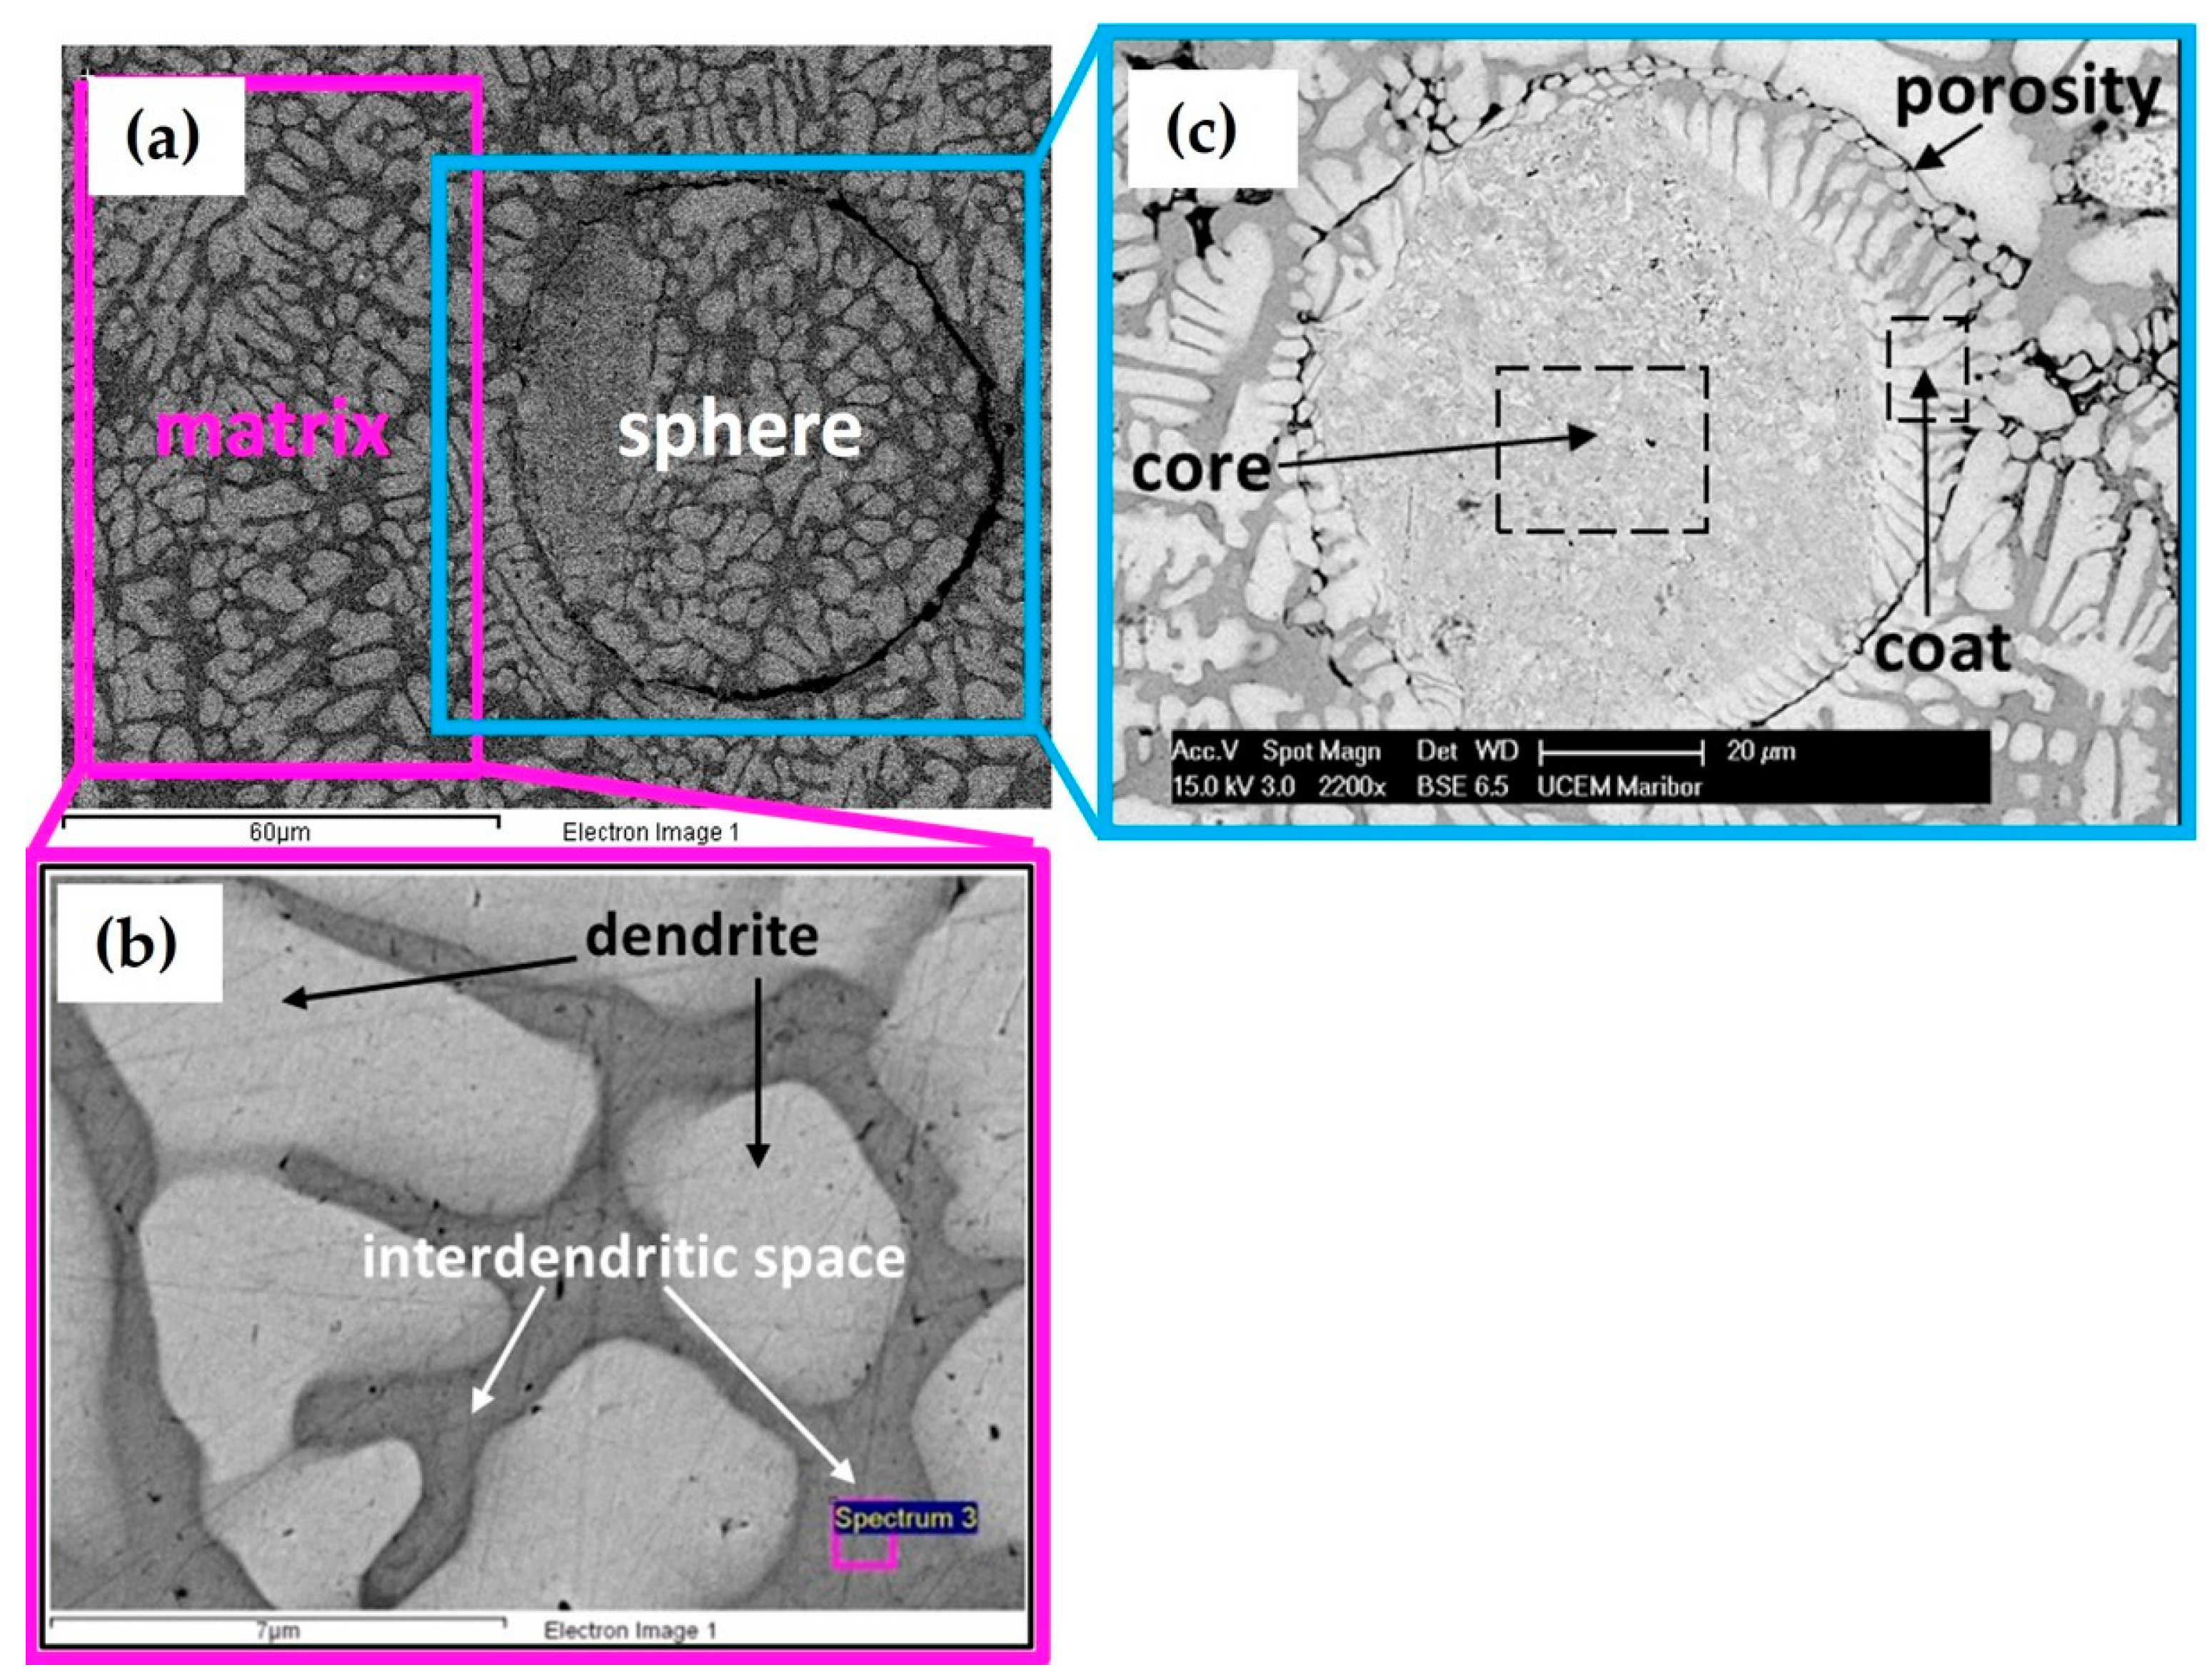
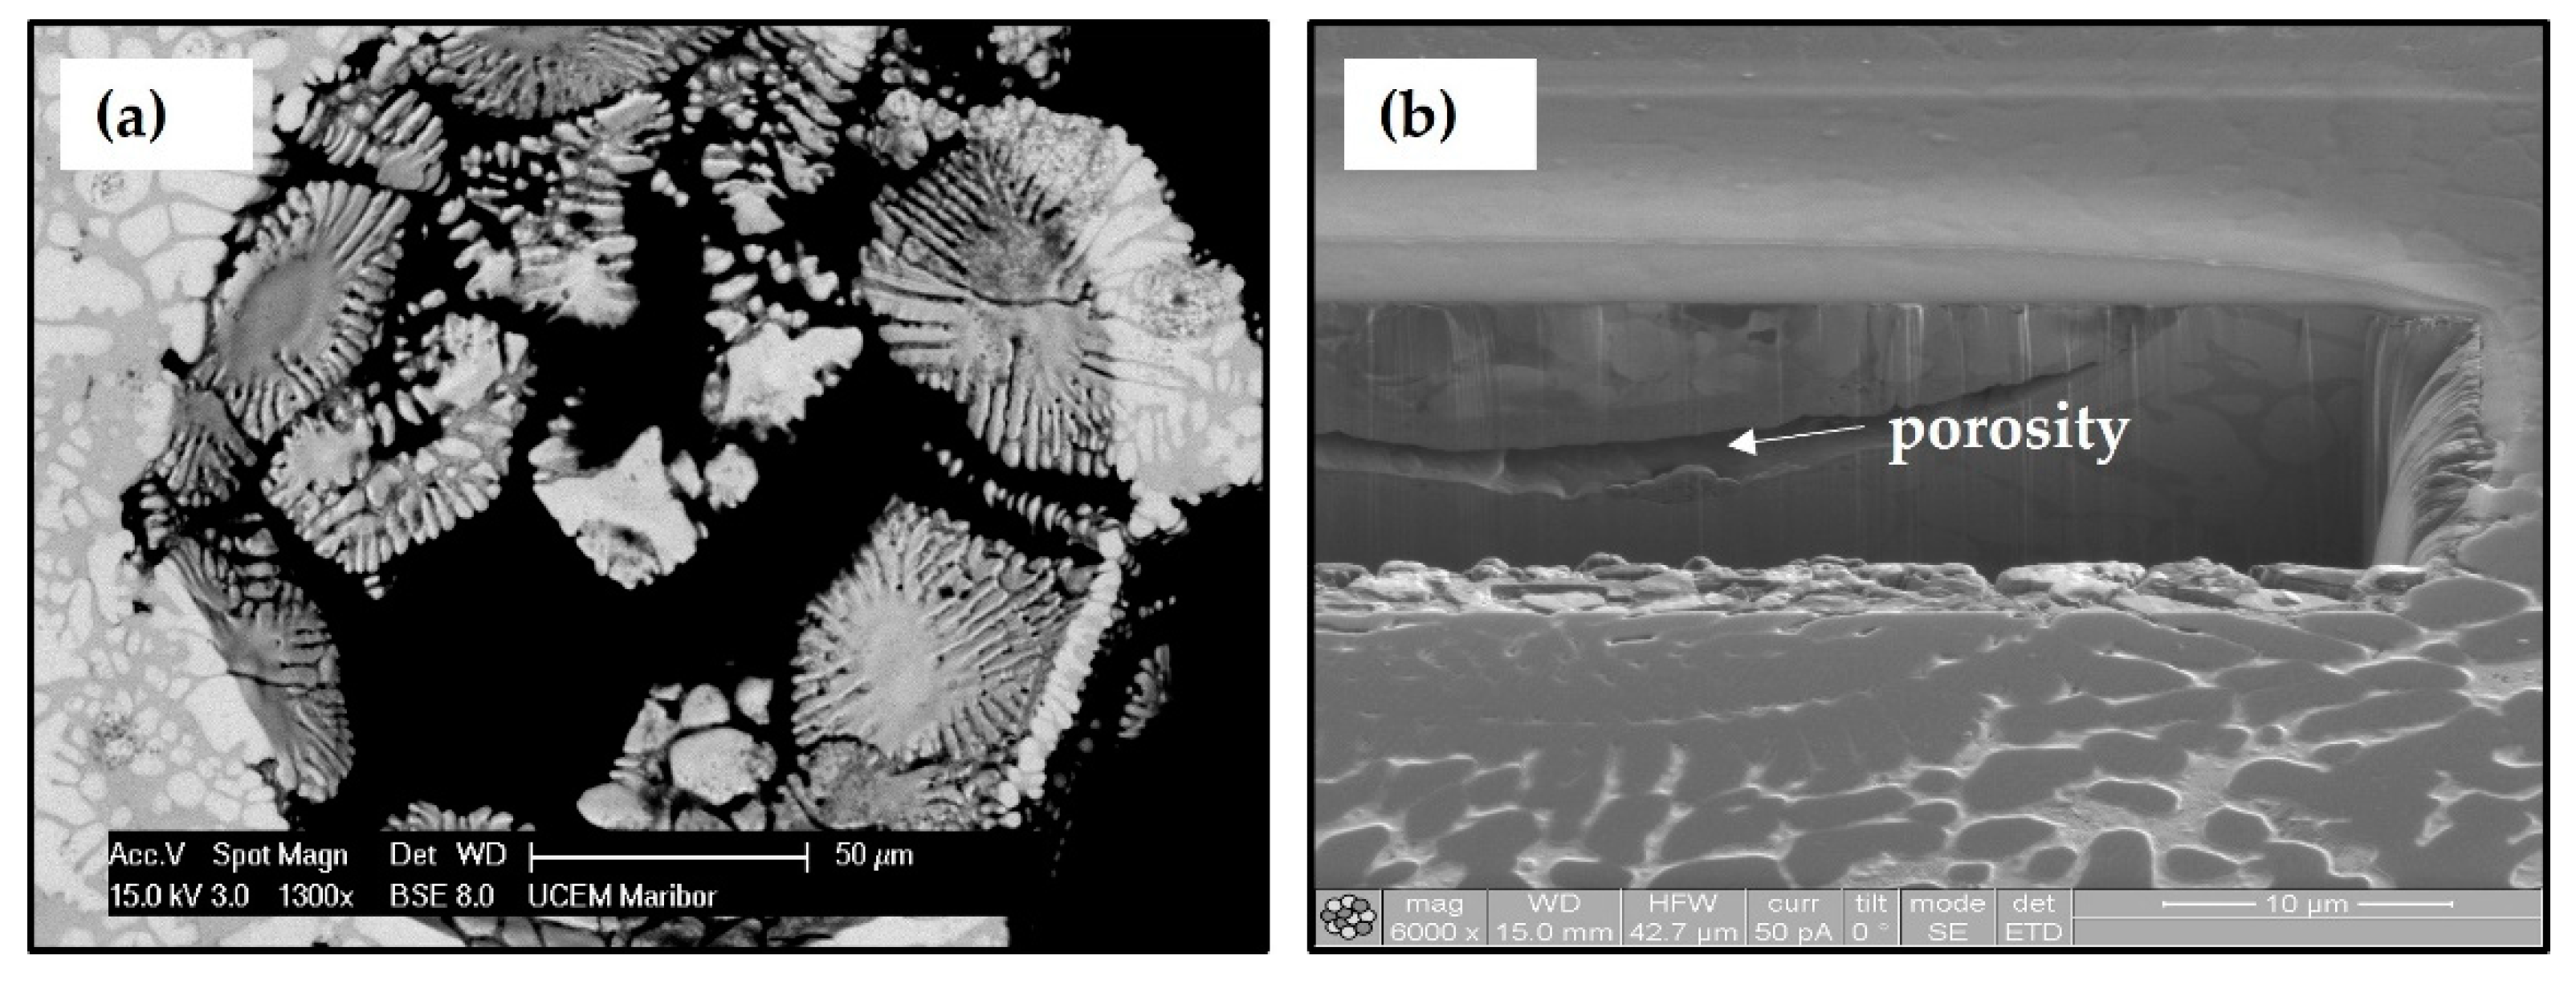
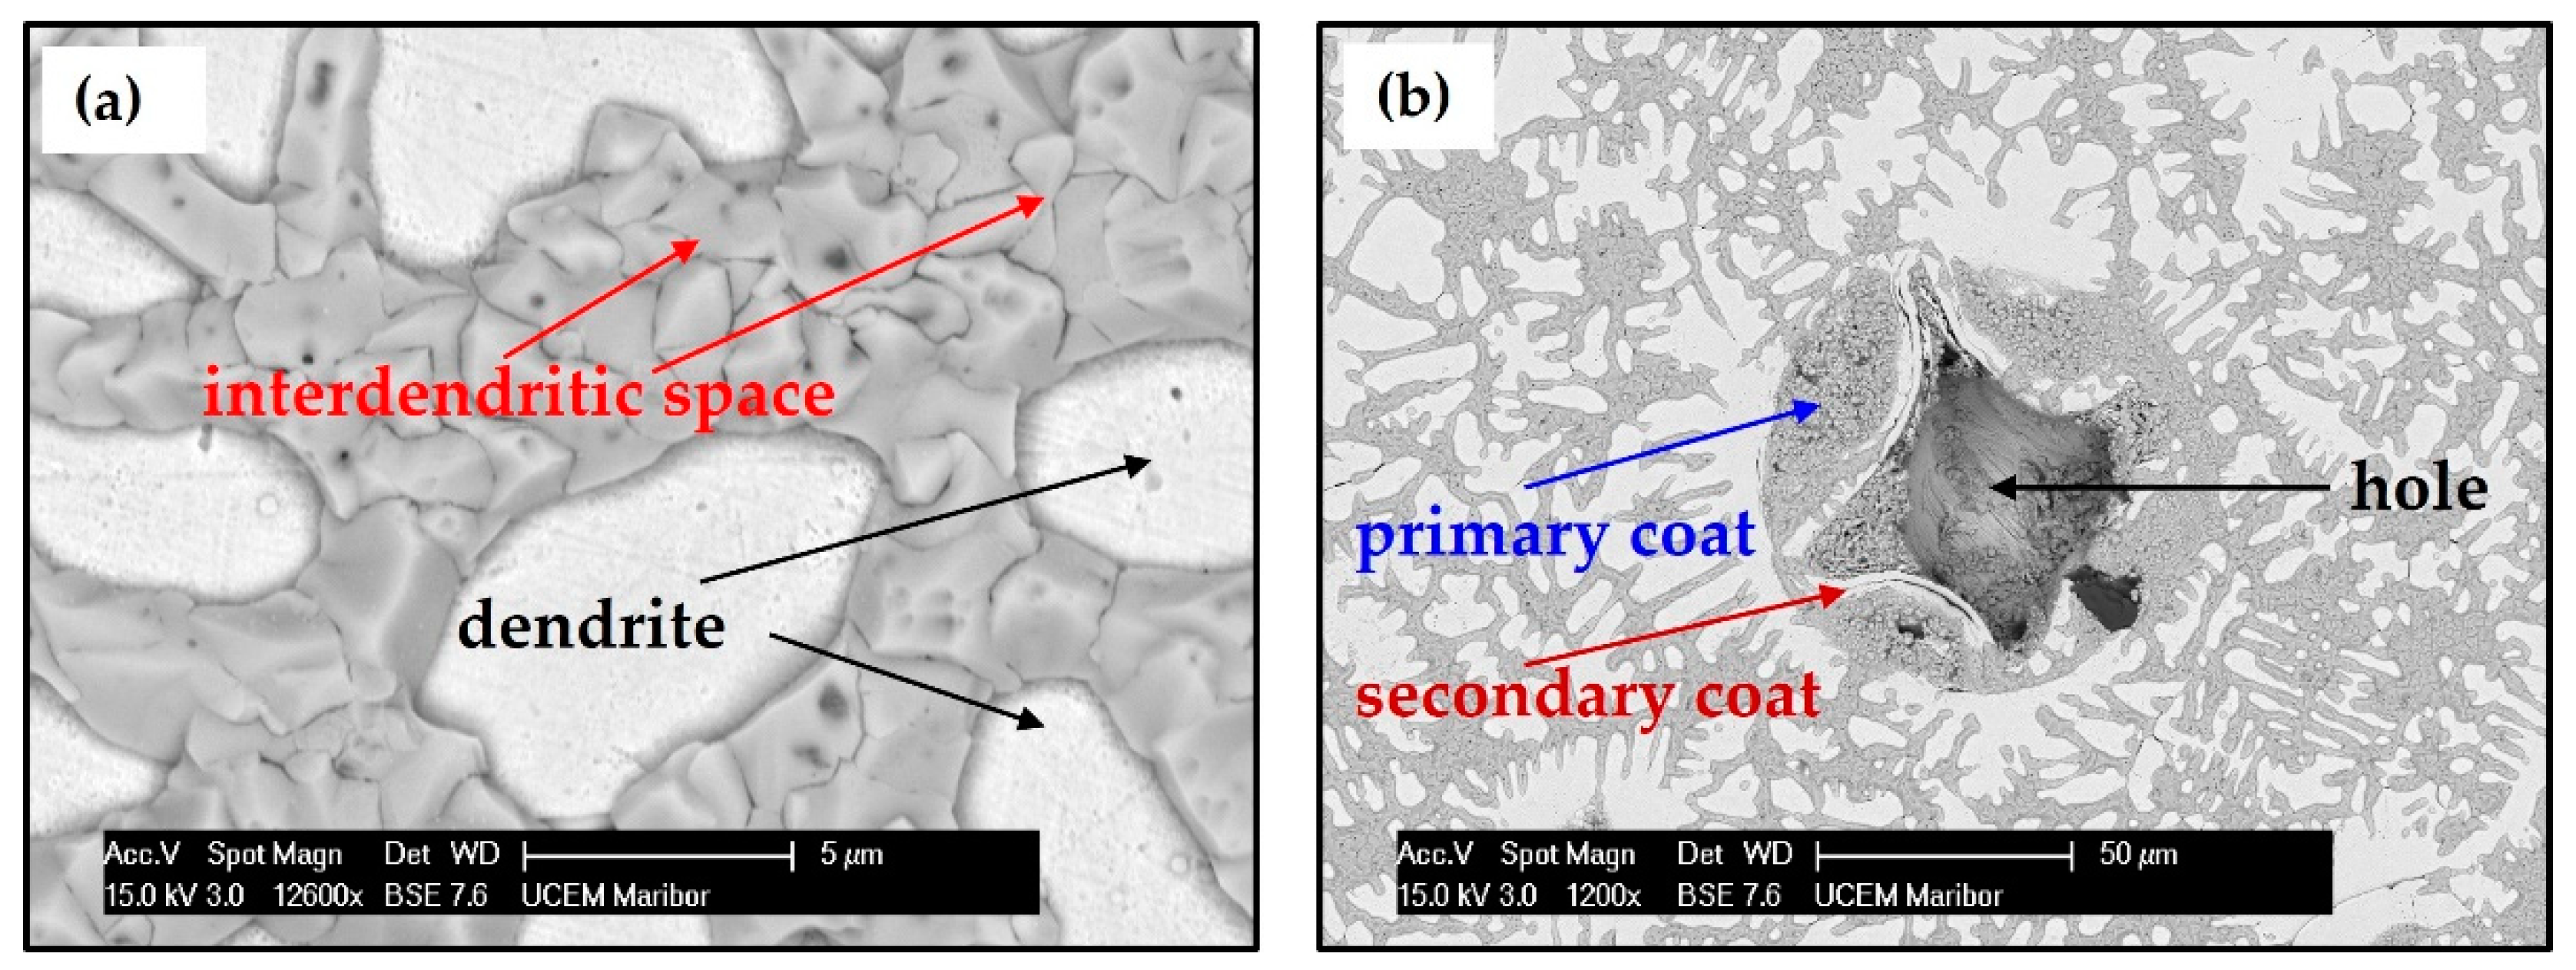
3.1. Microstructure of Cast CCNA Alloy
3.2. Microstructure of the Annealed CCNA Alloy
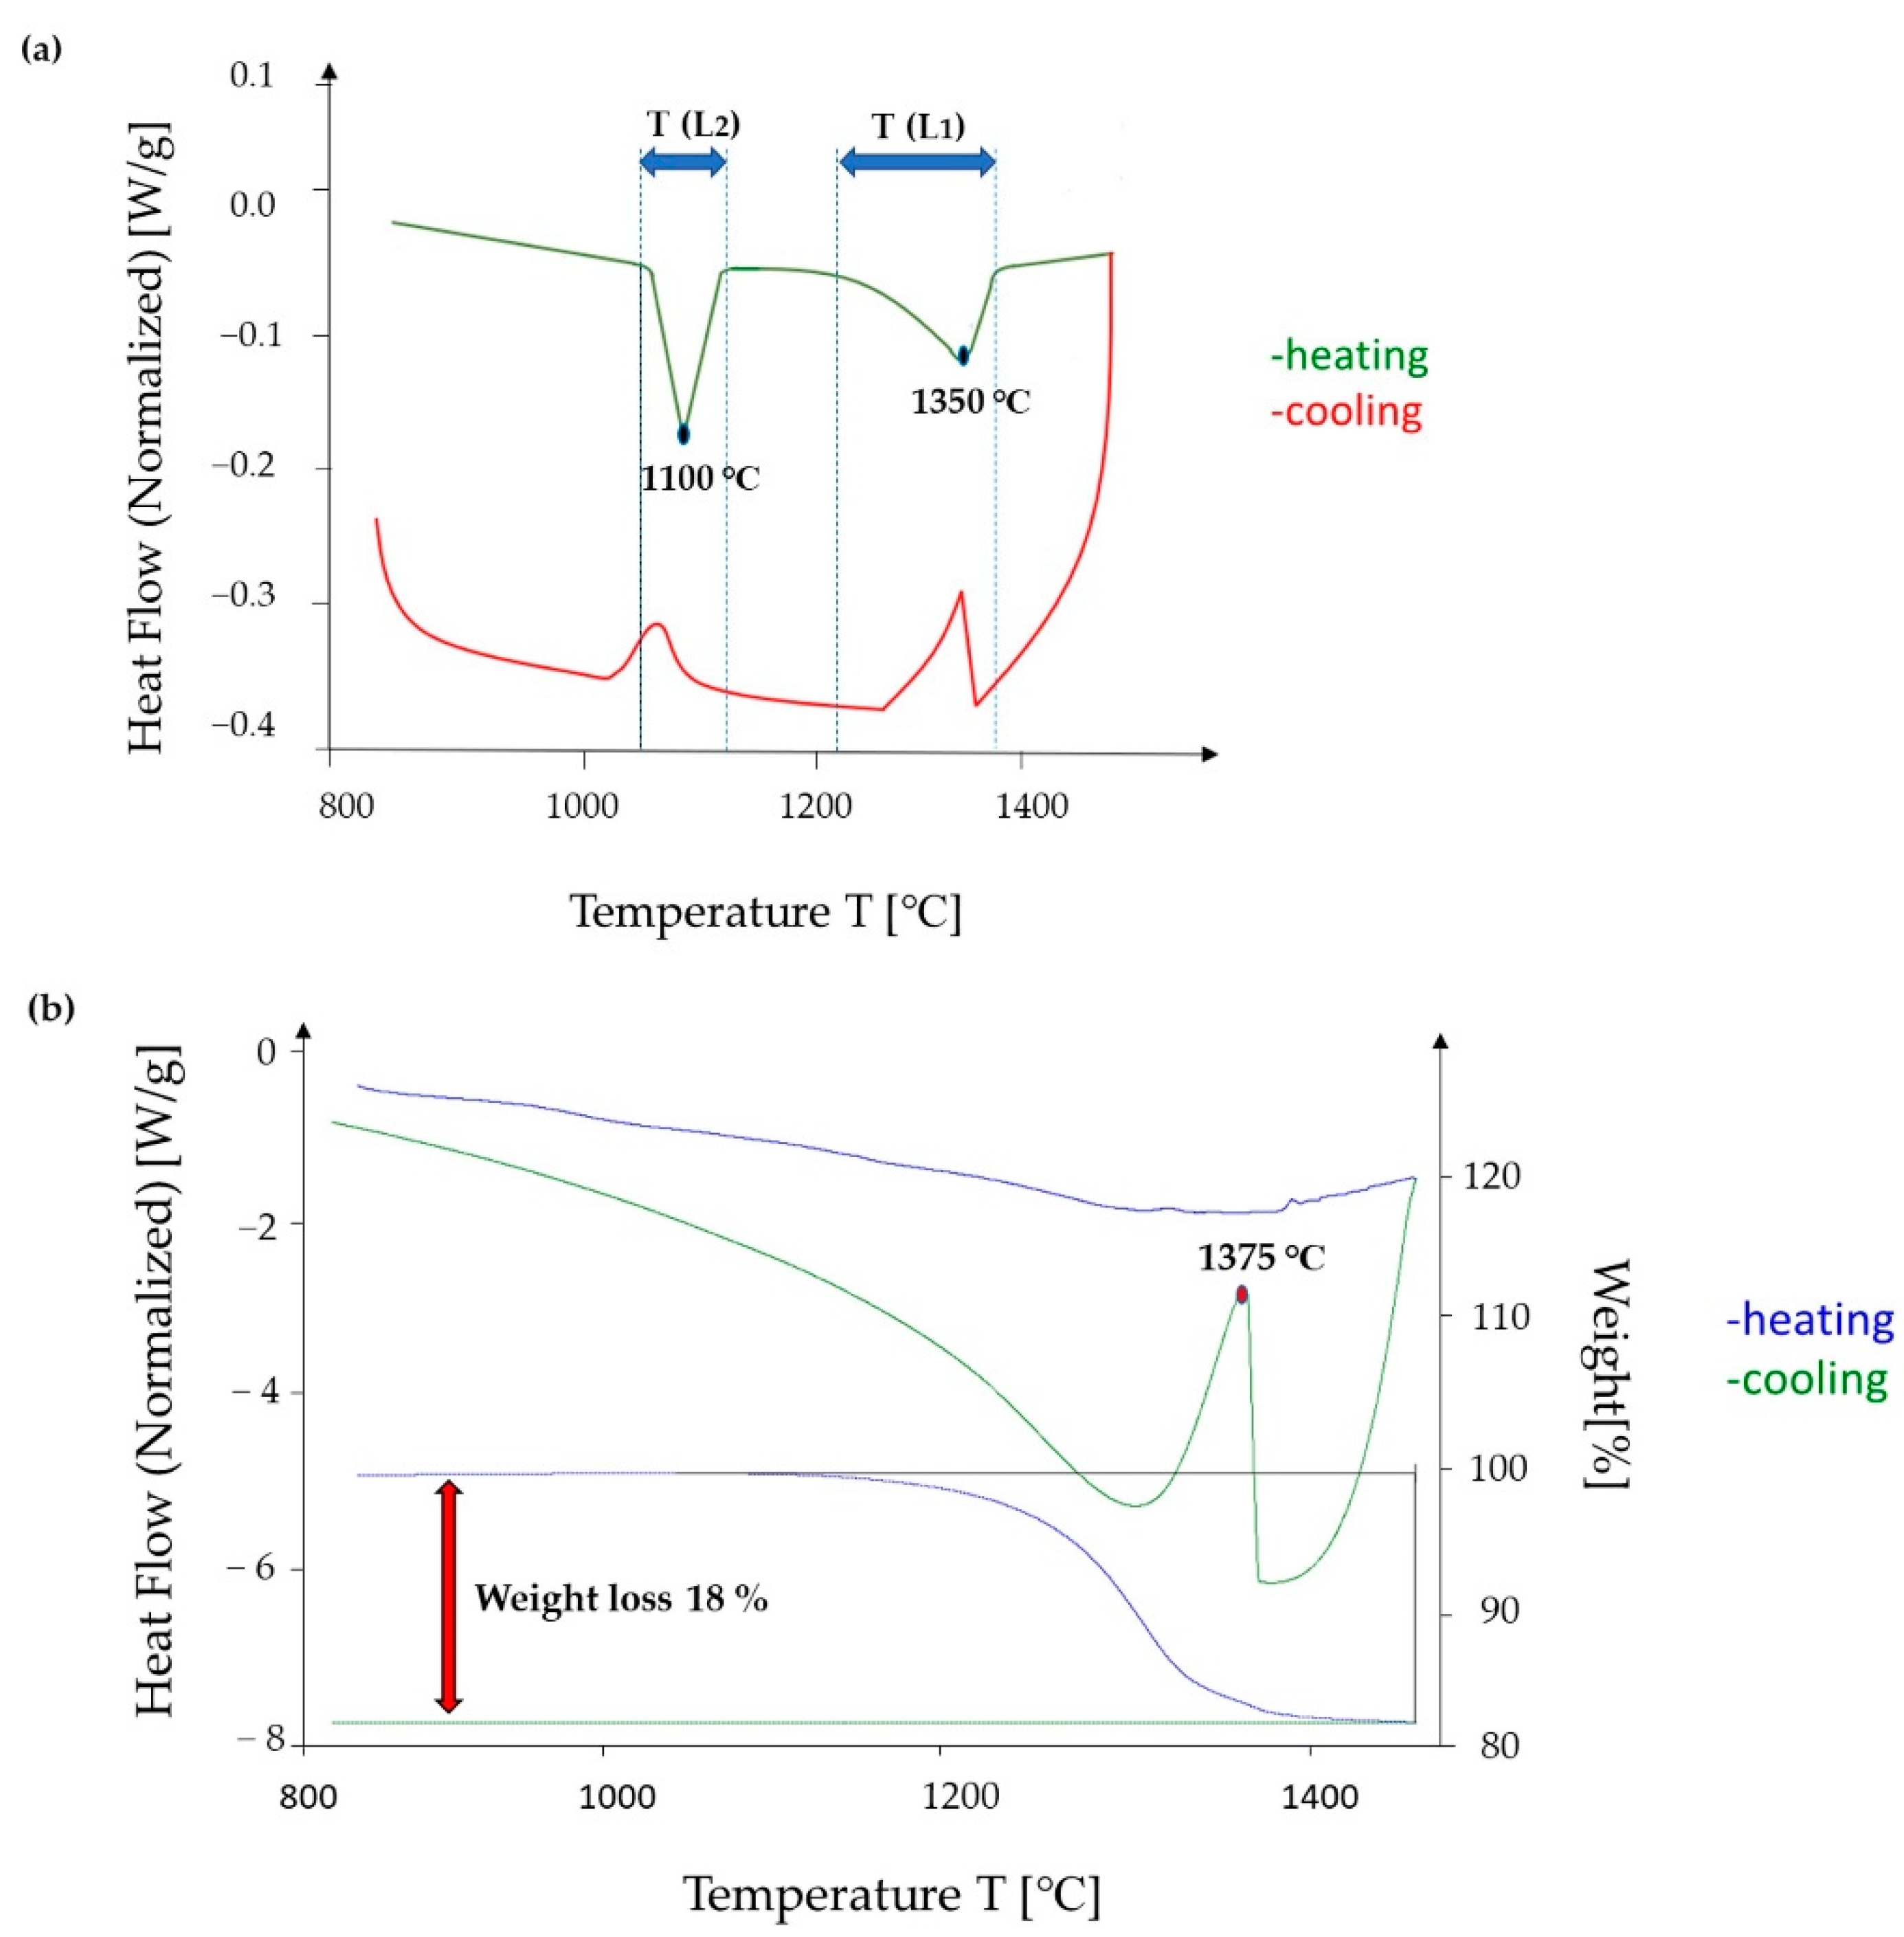
3.3. DSC Analysis of the Cast CCNA Alloy
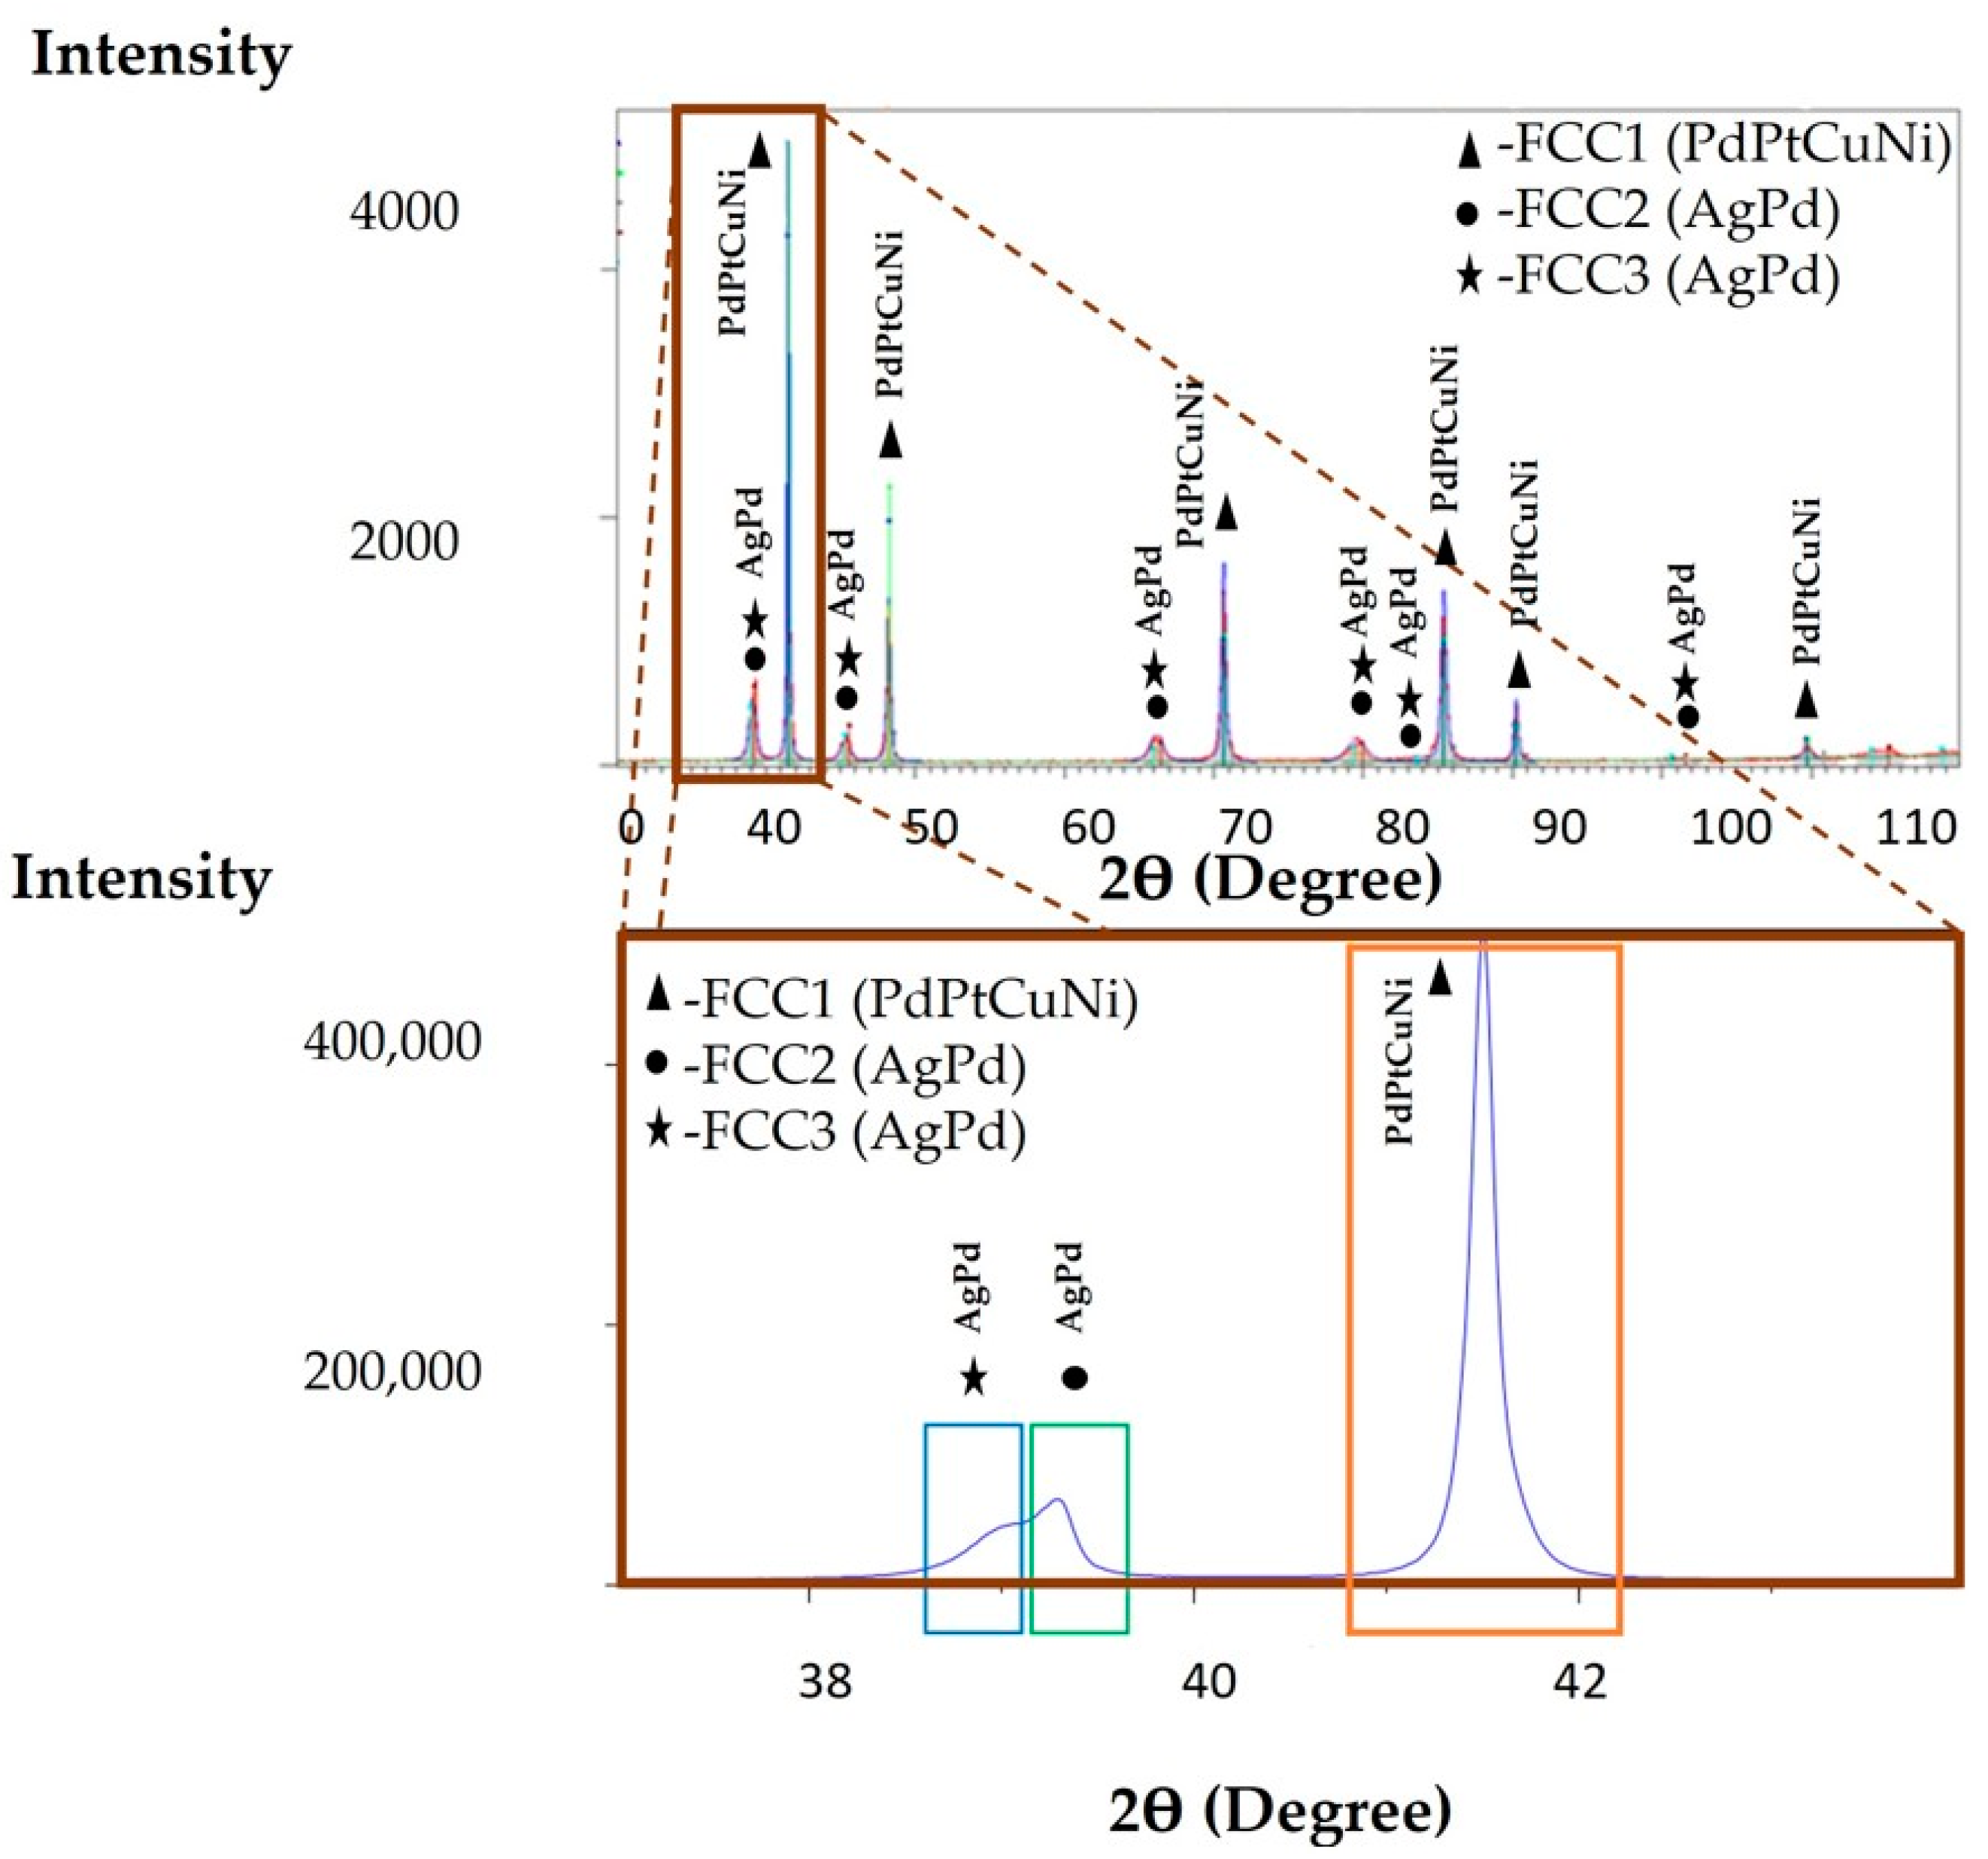
3.4. XRD Analysis of the Cast CCNA Alloy
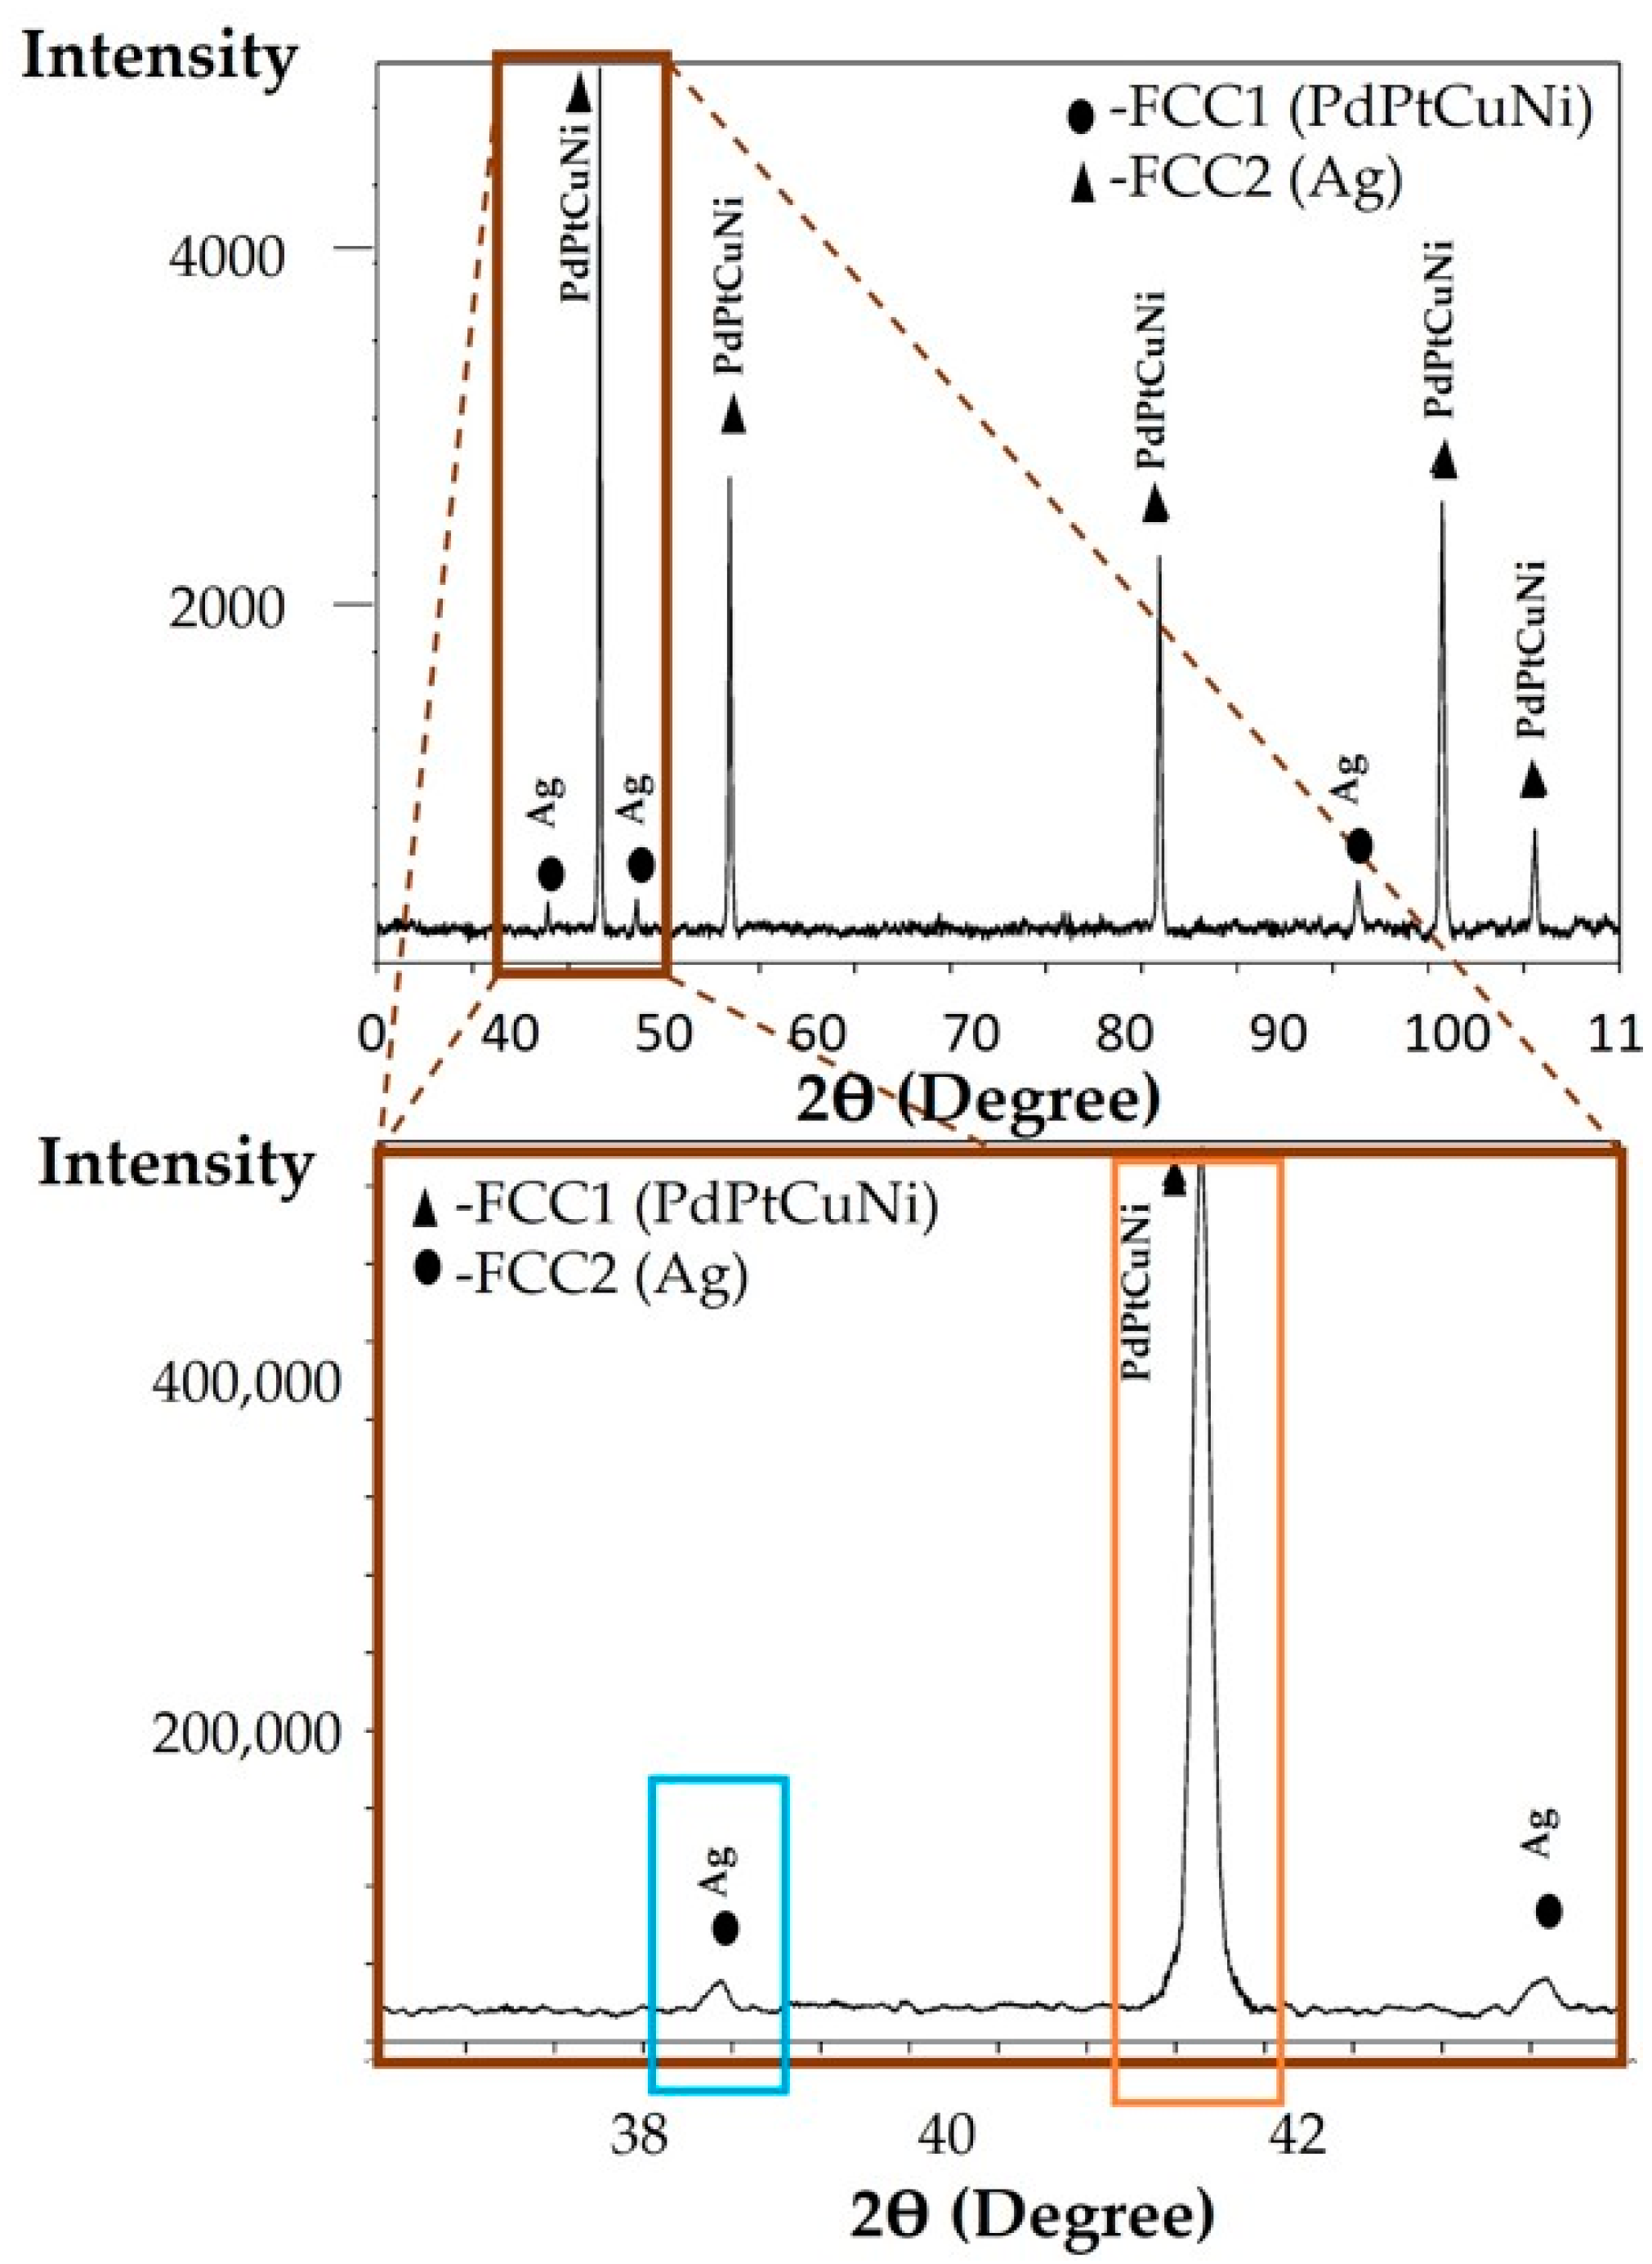
3.5. XRD Analysis of the Annealed CCNA Alloy
4. Discussion
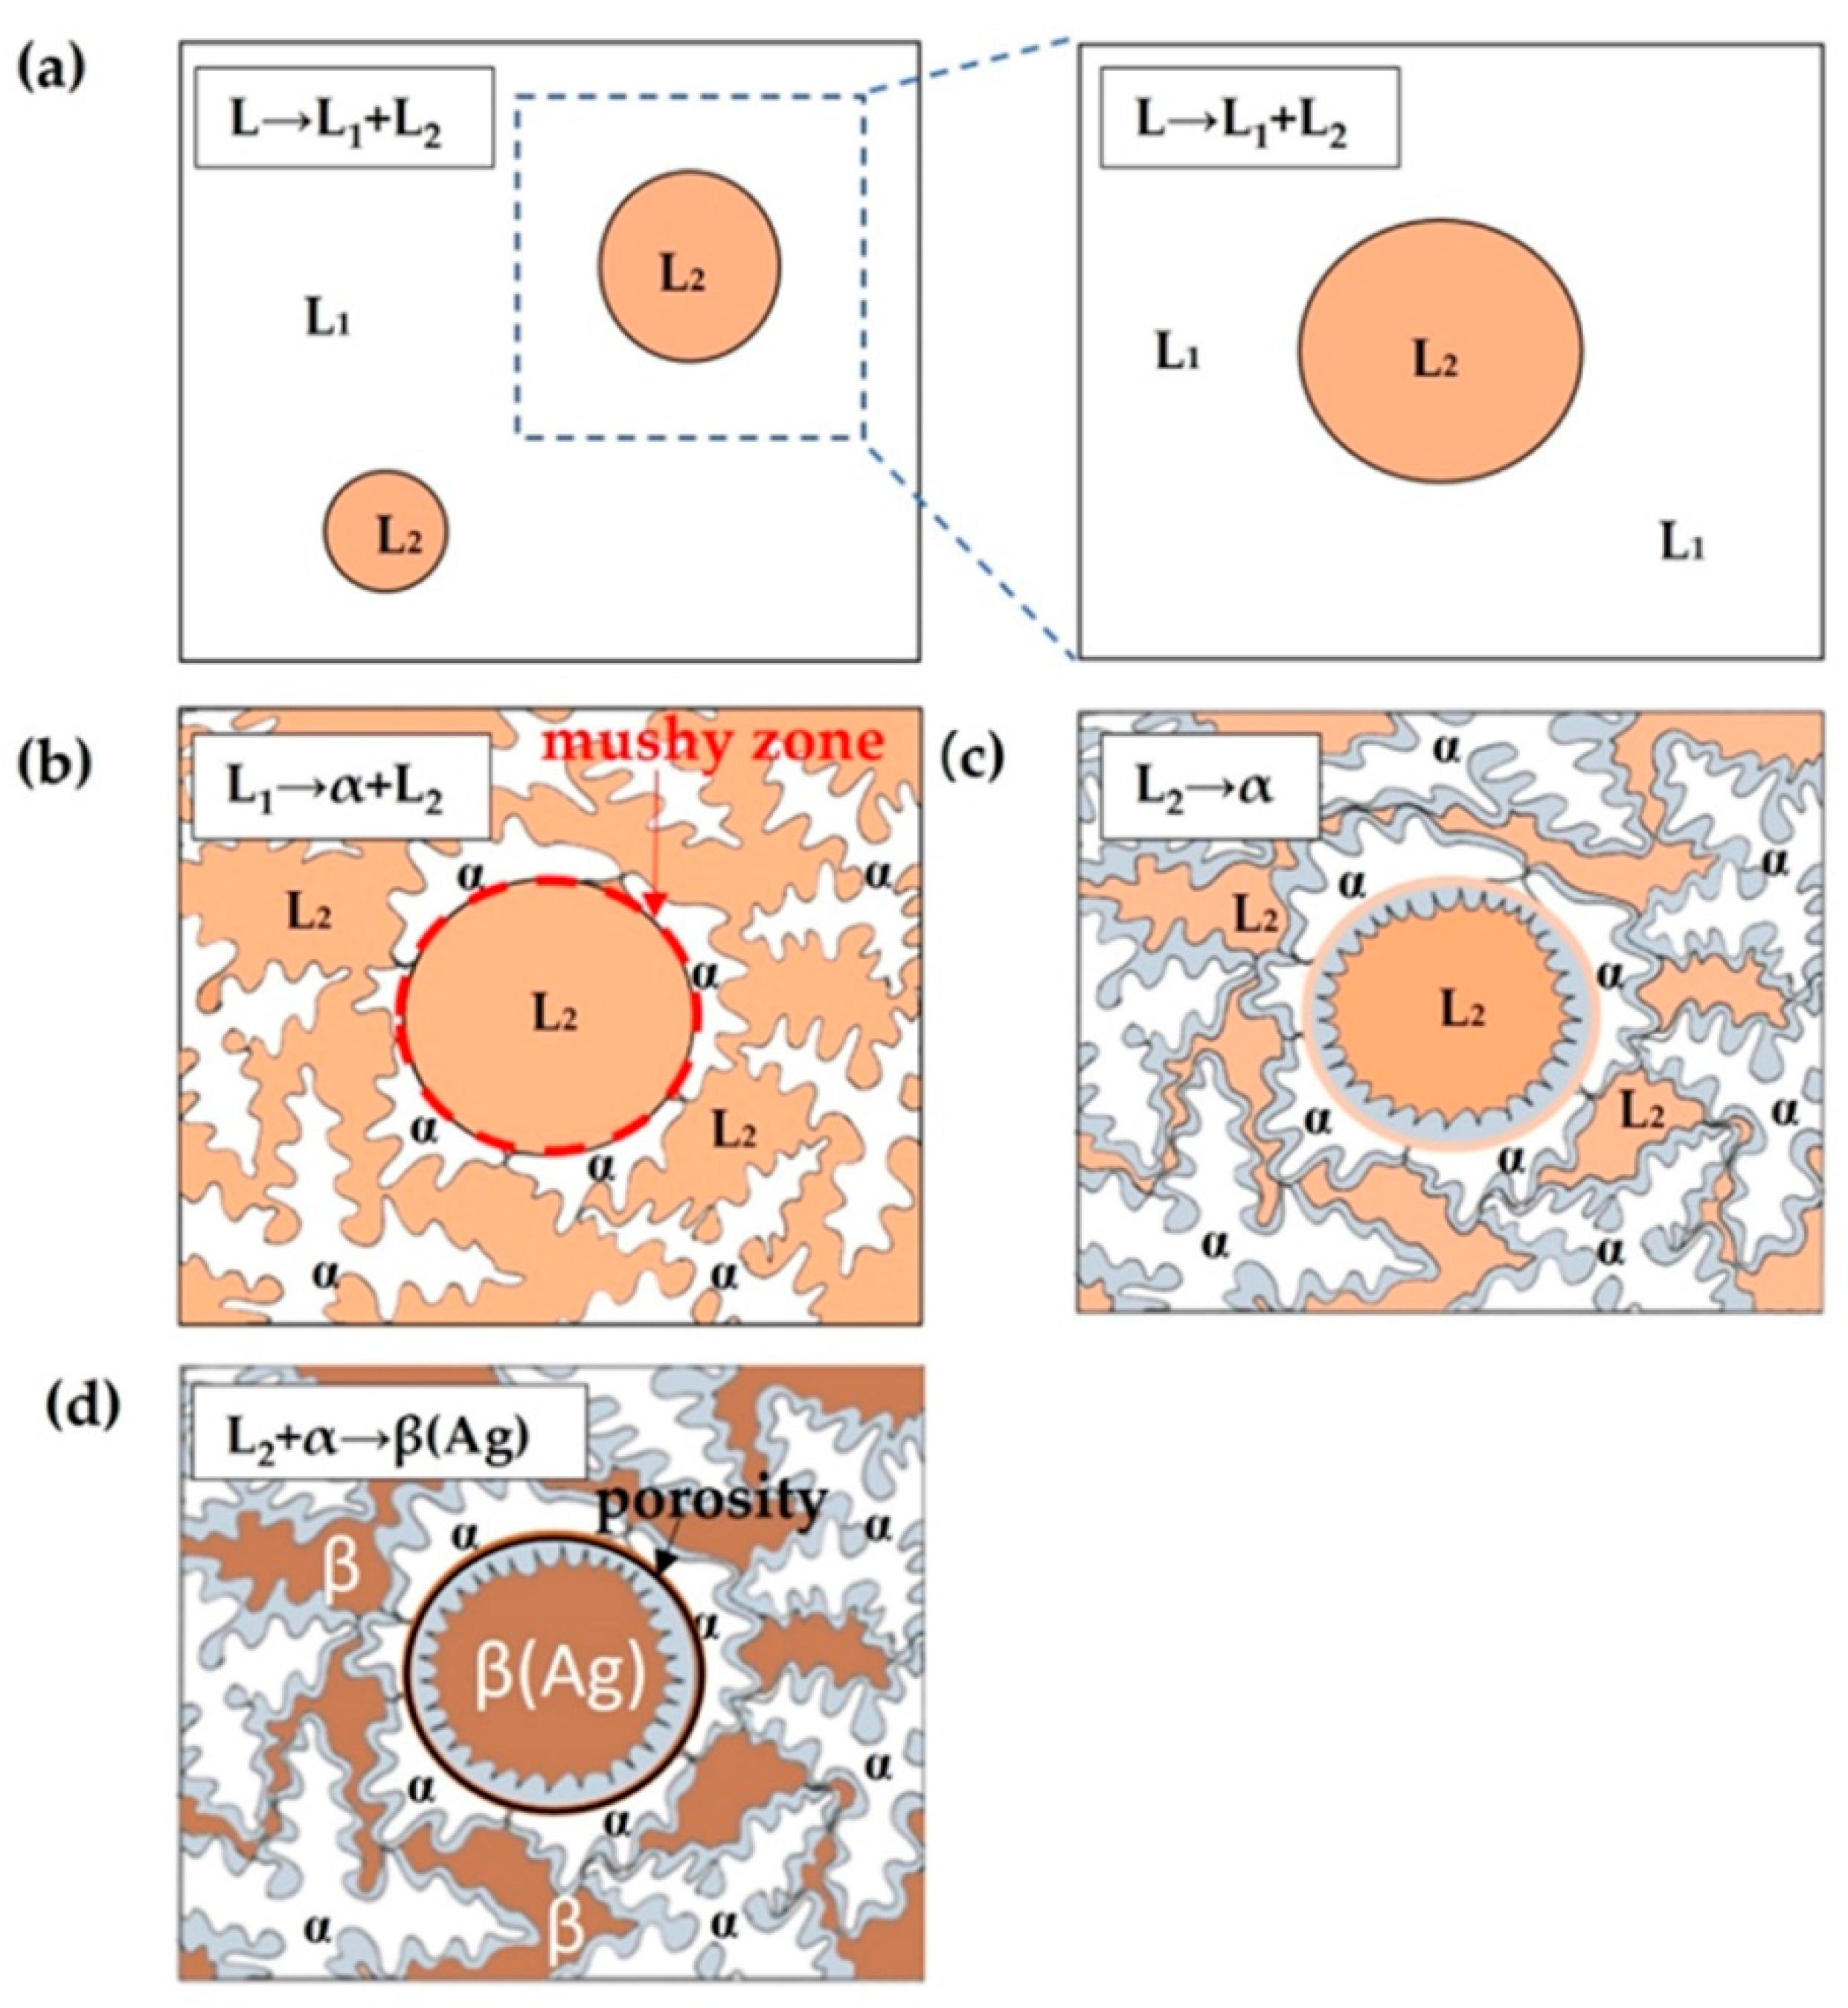
- (a)
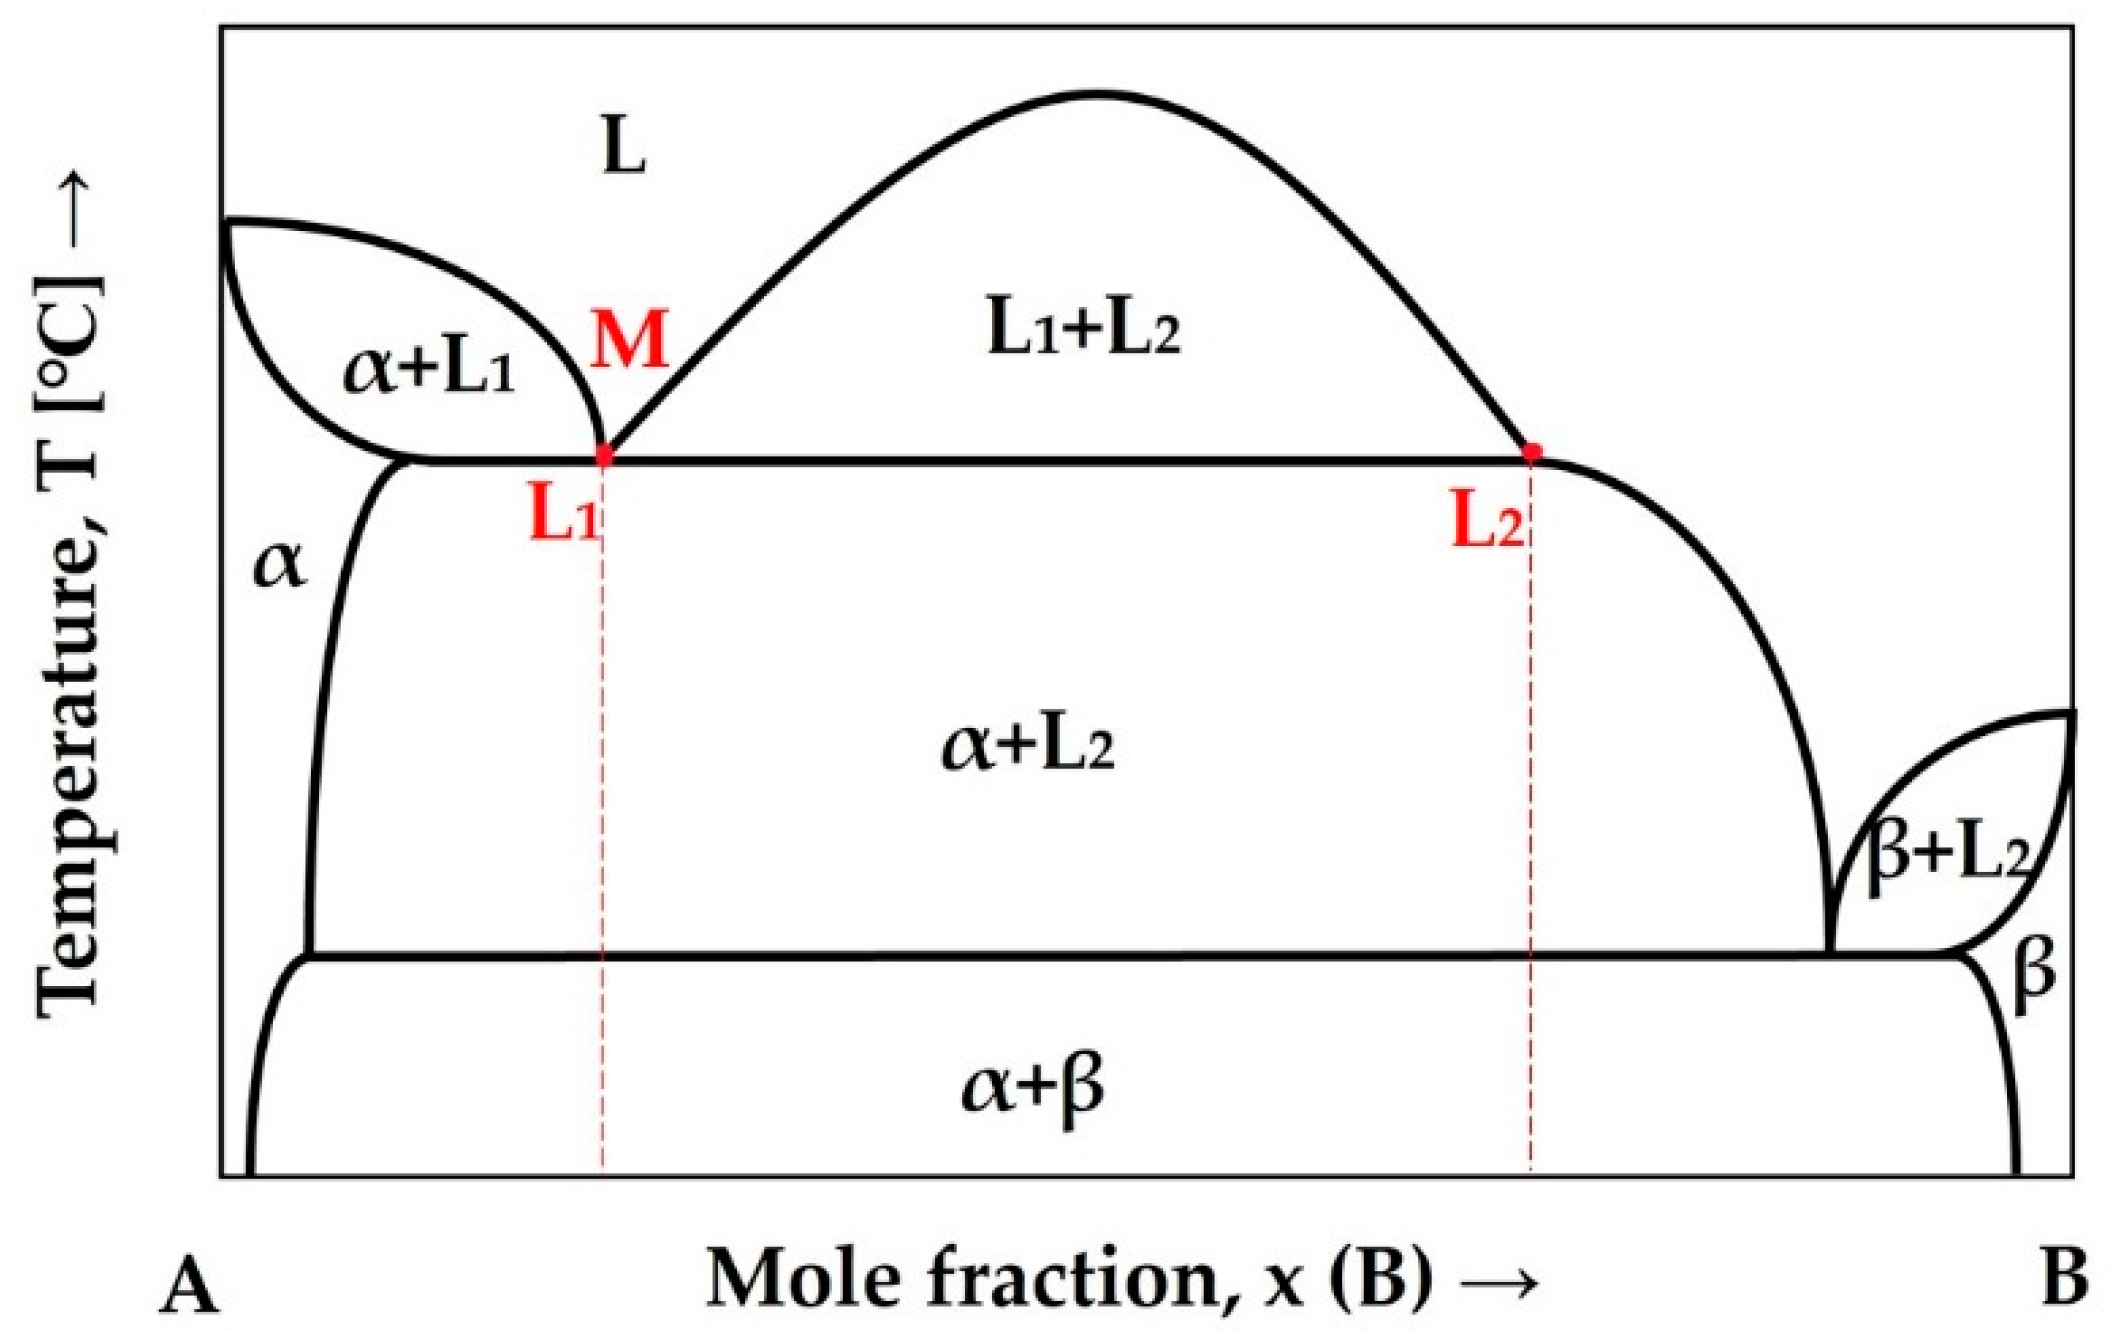
- Liquid phase separation L → L1 + L2;
- (b)
- Monotectic reaction L1 → α + L2;
- (c)
- Thickening of the dendrites in the matrix and the coat formation in the sphere with solidification of the melt L2 (L2 → α);
- (d)
- Peritectic solidification of the rest of the melt in the interdendritic space in the matrix, as well as in the core of the sphere.
5. Conclusions
- -
- Cast CCNA is in a highly metastable state with three crystallographic phases present.
- -
- The results of the annealing process show the transition to a thermodynamically stable state with two crystallographic phases.
- -
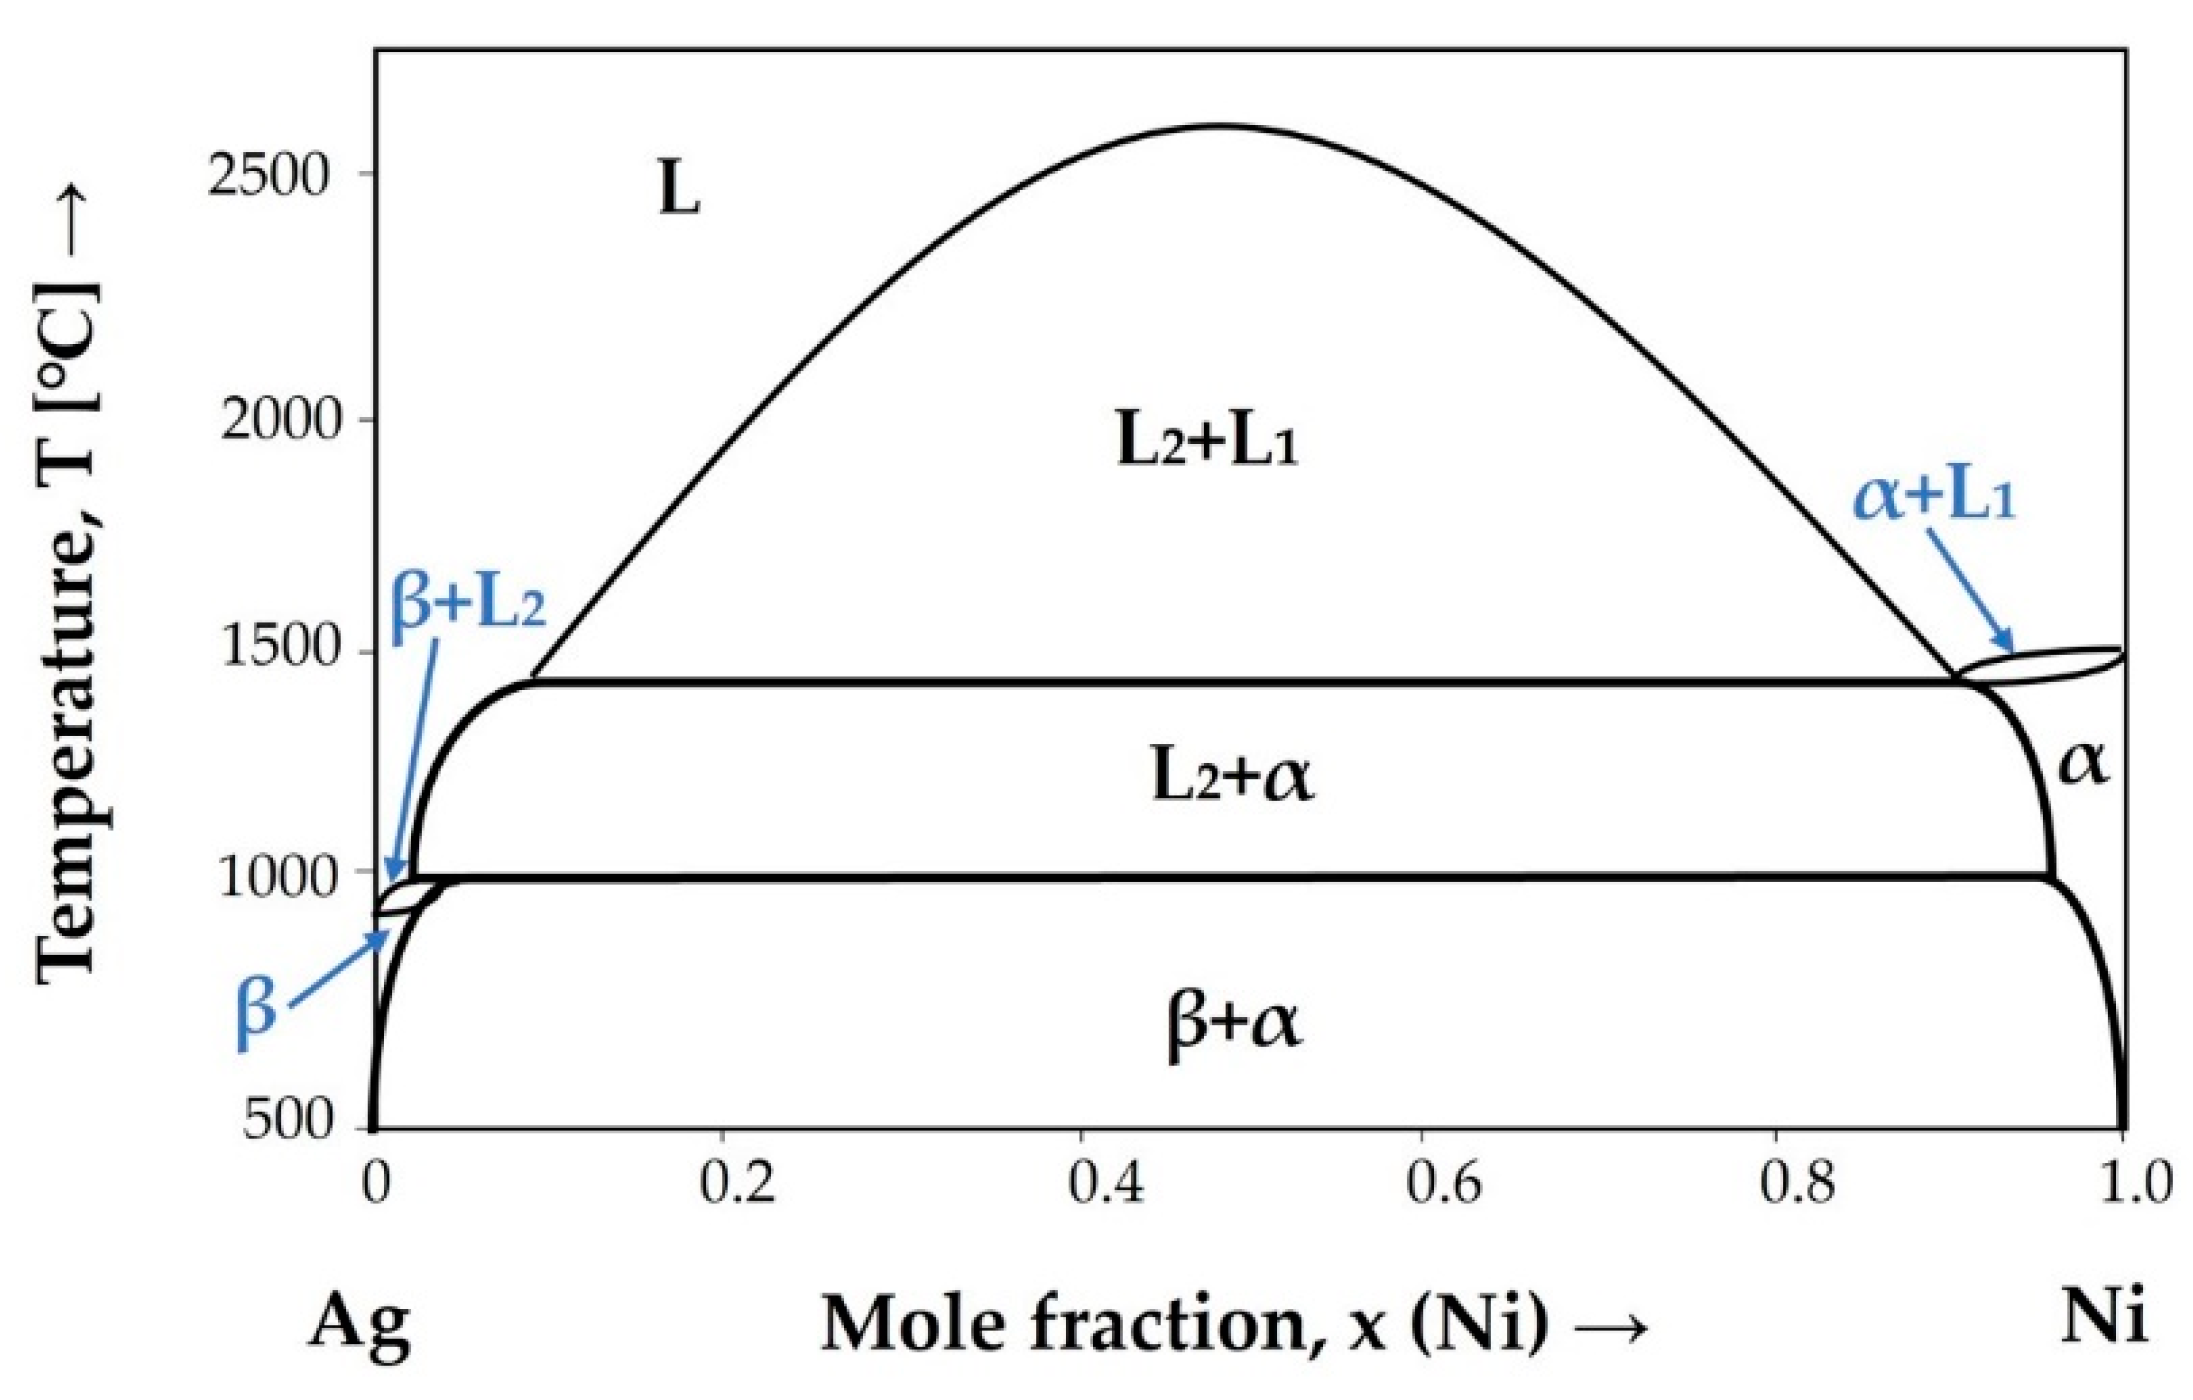
- Liquid phase separation with a monotectic reaction takes place during CCNA melting, where L melt separates into L1 (rich in Ni dendrites) and L2 (rich in Ag interdendritic space). As the L1 melt achieves greater subcooling, solidification begins with the formation of dendrites around the L2 melt, as well as equiaxially.
- -
- As the monotectic reaction of dendrite formation takes place in the space, a further course of solidification is performed by thickening the dendrite and solidifying the coat of the sphere L2 → α.
- -
- Solidification of the centre of the sphere takes place via a peritectic reaction, and this represents the last stage.
- -
- The closed mushy zone prevents the L2 melt of the interdendritic space and the equalisation of the centre of the sphere, which leads to a small difference in chemical analysis.
Author Contributions
Funding
Conflicts of Interest
Abbreviations
| CCNA | complex concentrated noble alloy |
| CCA | complex concentrated alloy |
| DSC | differential scanning calorimetry |
| EDS | energy dispersive spectroscopy |
| FIB | focussed ion beam |
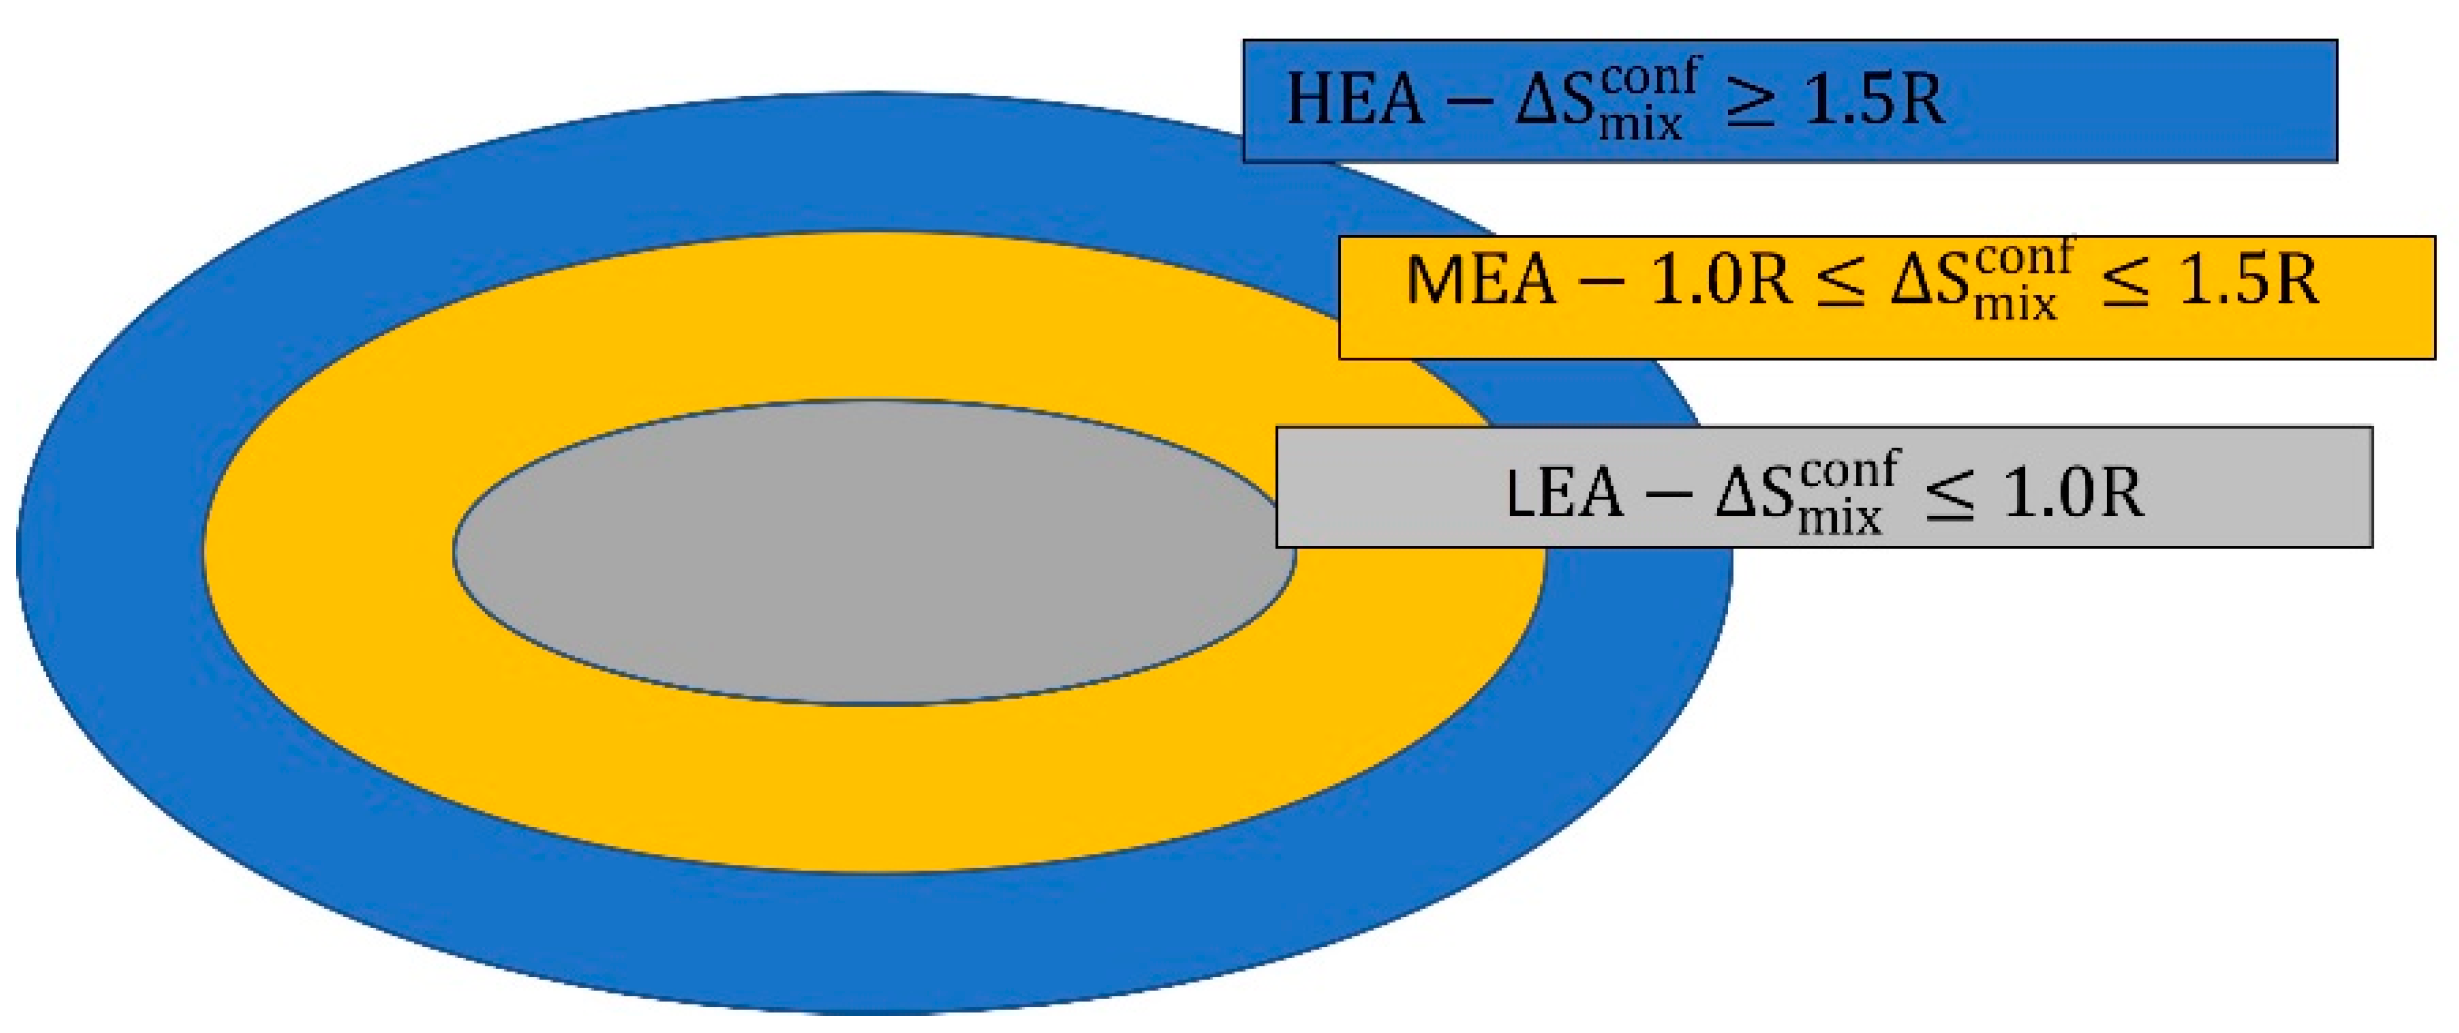
| HEA | high—entropy alloy |
| IM | intermetallic phase |
| LEA | low entropy alloys |
| MEA | media entropy alloys |
| SEM | scanning electron microscope |
| SS | solid solutions |
| VEC | valence electron concentration |
| XRD | X—ray diffraction |
References
- Zhang, Y.; Zuo, T.T.; Tang, Z.; Gao, M.C.; Dahmen, K.A.; Liaw, P.K.; Lu, Z.P. Microstructures and properties of high—entropy alloys. Prog. Mater. Sci. 2014, 61, 1–93. [Google Scholar] [CrossRef]
- Raabe, D.; Tasan, C.C.; Springer, H.; Bausch, M. From High—Entropy Alloys to High—Entropy Steels. Steel Res. Int. 2015, 86, 1127–1138. [Google Scholar] [CrossRef]
- Miracle, D.B.; Senkov, O.N. A critical review of high entropy alloys and related concepts. Acta Mater. 2017, 122, 448–511. [Google Scholar] [CrossRef] [Green Version]
- Macdonald, B.E.; Fu, Z.; Zheng, B.; Chen, W.; Lin, Y.; Chen, F.; Zhang, L.; Ivanisenko, J.; Zhou, Y.; Hahn, H.; et al. Recent Progress in High Entropy Alloy Research. JOM 2017, 69, 2024–2031. [Google Scholar] [CrossRef]
- Yeh, J.-W.; Chen, S.K.; Lin, S.-J.; Gan, J.-Y.; Chin, T.-S.; Shun, T.-T.; Tsau, C.-H.; Chang, S.-Y. Nanostructured High—Entropy Alloys with Multiple Principal Elements: Novel Alloy Design Concepts and Outcomes. Adv. Eng. Mater. 2004, 6, 299–303. [Google Scholar] [CrossRef]
- Haase, C.; Tang, F.; Wilms, M.B.; Weisheit, A.; Hallstedt, B. Combining thermodynamic modeling and 3D printing of elemental powder blends for high—throughput investigation of high—entropy alloys – Towards rapid alloy screening and design. Mater. Sci. Eng. A 2017, 688, 180–189. [Google Scholar] [CrossRef]
- Mohanty, S.; Samal, S.; Tazuddin, A.; Tiwary, C.S.; Gurao, N.P.; Biswas, K. Effect of processing route on phase stability in equiatomic multicomponent Ti20Fe20Ni20Co20Cu20high entropy alloy. Mater. Sci. Technol. 2015, 31, 1214–1222. [Google Scholar] [CrossRef]
- Yeh, J.-W. Alloy Design Strategies and Future Trends in High—Entropy Alloys. JOM 2013, 65, 1759–1771. [Google Scholar] [CrossRef]
- Nagase, T.; Takemura, M.; Matsumuro, M.; Maruyama, T. Solidification Microstructure of AlCoCrFeNi2.1 Eutectic High Entropy Alloy Ingots. Mater. Trans. 2018, 59, 255–264. [Google Scholar] [CrossRef] [Green Version]
- Senkov, O.; Miracle, D. A new thermodynamic parameter to predict formation of solid solution or intermetallic phases in high entropy alloys. J. Alloy. Compd. 2016, 658, 603–607. [Google Scholar] [CrossRef] [Green Version]
- Zhang, Y.; Li, R. New Advances in High—Entropy Alloys. Entropy 2020, 22, 1158. [Google Scholar] [CrossRef] [PubMed]
- Kube, S.A.; Schroers, J. Metastability in high entropy alloys. Scr. Mater. 2020, 186, 392–400. [Google Scholar] [CrossRef]
- Wu, D.; Kusada, K.; Nanba, Y.; Koyama, M.; Yamamoto, T.; Toriyama, T.; Matsumura, S.; Seo, O.; Gueye, I.; Kim, J.; et al. Noble—Metal High—Entropy—Alloy Nanoparticles: Atomic—Level Insight into the Electronic Structure. J. Am. Chem. Soc. 2022, 144, 3365–3369. [Google Scholar] [CrossRef] [PubMed]
- Winkler, B.; Juarez-Arellano, E.; Morgenroth, W.; Barkov, A.; Dippel, A.-C.; Zimmermann, M.; Ivashko, O.; Gutowski, O. Pt2AuCuNiSn, a new noble metal single—phase high entropy alloy. J. Solid State Chem. 2021, 294, 121837. [Google Scholar] [CrossRef]
- Varvenne, C.; Curtin, W.A. Predicting yield strengths of noble metal high entropy alloys. Scr. Mater. 2018, 142, 92–95. [Google Scholar] [CrossRef] [Green Version]
- Sohn, S.; Liu, Y.; Liu, J.; Gong, P.; Prades—Rodel, S.; Blatter, A.; Scanley, B.E.; Broadbridge, C.C.; Schroers, J. Noble metal high entropy alloys. Scr. Mater. 2017, 126, 29–32. [Google Scholar] [CrossRef] [Green Version]
- Huang, X.; Yang, G.; Li, S.; Wang, H.; Cao, Y.; Peng, F.; Yu, H. Noble—metal—based high—entropy—alloy nanoparticles for electrocatalysis. J. Energy Chem. 2021, 68, 721–751. [Google Scholar] [CrossRef]
- Yan, X.; Zhang, Y. Functional properties and promising applications of high entropy alloys. Scr. Mater. 2020, 187, 188–193. [Google Scholar] [CrossRef]
- Katiyar, N.K.; Biswas, K.; Yeh, J.-W.; Sharma, S.; Tiwary, C.S. A Perspective on the Catalysis Using the High Entropy Alloys. Nano Energy 2021, 88, 106261. [Google Scholar] [CrossRef]
- Xie, P.; Yao, Y.; Huang, Z.; Liu, Z.; Zhang, J.; Li, T.; Wang, G.; Shahbazian-Yassar, R.; Hu, L.; Wang, C. Highly efficient decomposition of ammonia using high—entropy alloy catalysts. Nat. Commun. 2019, 10, 1–12. [Google Scholar] [CrossRef] [Green Version]
- Nellaiappan, S.; Katiyar, N.K.; Kumar, R.; Parui, A.; Malviya, K.D.; Pradeep, K.G.; Singh, A.K.; Sharma, S.; Tiwary, C.S.; Biswas, K. High—Entropy Alloys as Catalysts for the CO2 and CO Reduction Reactions: Experimental Realization. ACS Catal. 2020, 10, 3658–3663. [Google Scholar] [CrossRef]
- Steurer, W. Single—phase high—entropy alloys—A critical update. Mater. Charact. 2020, 162, 110179. [Google Scholar] [CrossRef]
- Guo, S.; Ng, C.; Liu, C. Anomalous solidification microstructures in Co—free AlxCrCuFeNi2 high—entropy alloys. J. Alloy. Compd. 2013, 557, 77–81. [Google Scholar] [CrossRef]
- Paule, R.C.; Mandel, J.; Worths, B. Analysis of interlaboratory measurements on the vapor pressure of gold. Pure Appl. Chem. 1972, 31, 371–394. [Google Scholar] [CrossRef]
- Wang, Z.; Wu, Q.; Zhou, W.; He, F.; Yu, C.; Lin, D.; Wang, J.; Liu, C. Quantitative determination of the lattice constant in high entropy alloys. Scr. Mater. 2019, 162, 468–471. [Google Scholar] [CrossRef]
- Hsu, U.; Hung, U.; Yeh, J.; Chen, S.; Huang, Y.; Yang, C. Alloying behavior of iron, gold and silver in AlCoCrCuNi—based equimolar high—entropy alloys. Mater. Sci. Eng. A 2007, 460–461, 403–408. [Google Scholar] [CrossRef]
- Liu, X.J.; Gao, F.; Wang, C.P.; Ishida, K. Thermodynamic Assessments of the Ag—Ni Binary and Ag—Cu—Ni Ternary Systems. J. Electron. Mater. 2007, 37, 210–217. [Google Scholar] [CrossRef]


| Components in at. % | ||||||
|---|---|---|---|---|---|---|
| Field | Ag | Pd | Pt | Cu | Ni | |
| Sphere coat | Mean Value | 18.43 | 20.48 | 18.92 | 21.28 | 20.90 |
| Max. Value | 20.41 | 21.93 | 20.60 | 22.97 | 22.82 | |
| Min. Value | 14.83 | 19.70 | 17.85 | 19.93 | 17.45 | |
| St. Dev. | 2.21 | 0.78 | 1.09 | 1.22 | 2.03 | |
| Sphere core | Mean Value | 51.83 | 20.14 | 2.71 | 23.24 | 2.1 |
| Max. Value | 55.29 | 20.22 | 2.88 | 26.12 | 2.42 | |
| Min. Value | 48.37 | 20.05 | 2.53 | 20.35 | 1.78 | |
| St. Dev. | 4.89 | 0.12 | 0.24 | 4.08 | 0.45 | |
| Matrix dendrite | Mean Value | 3.45 | 16.88 | 29.68 | 19.28 | 30.71 |
| Max. Value | 3.95 | 17.64 | 31.99 | 22.50 | 31.32 | |
| Min. Value | 2.82 | 15.84 | 26.72 | 16.48 | 29.92 | |
| St. Dev. | 0.41 | 0.66 | 2.30 | 2.87 | 0.58 | |
| Matrix interdendritic space | Mean Value | 54.11 | 25.05 | 3.36 | 17.49 | 0.00 |
| Max. Value | 56.75 | 26.83 | 5.45 | 20.44 | 0.00 | |
| Min. Value | 52.05 | 22.52 | 1.31 | 15.67 | 0.00 | |
| St. Dev. | 2.11 | 1.58 | 1.57 | 1.96 | 0.00 | |
| Components in at. % | ||||||
|---|---|---|---|---|---|---|
| Field | Ag | Pd | Pt | Cu | Ni | |
| Sphere core | Mean Value | 100 | 0 | 0 | 0 | 0 |
| Max. Value | 100 | 0 | 0 | 0 | 0 | |
| Min. Value | 100 | 0 | 0 | 0 | 0 | |
| St. Dev. | 0 | 0 | 0 | 0 | 0 | |
| Matrix dendrite | Mean Value | 0.64 | 18.58 | 25.69 | 27.47 | 27.62 |
| Max. Value | 3.84 | 20.88 | 27.27 | 29.34 | 30.61 | |
| Min. Value | 0.00 | 17.53 | 24.21 | 20.75 | 25.07 | |
| St. Dev. | 1.57 | 1.23 | 1.20 | 3.31 | 2.08 | |
| Matrix interdendritic space | Mean Value | 100 | 0 | 0 | 0 | 0 |
| Max. Value | 100 | 0 | 0 | 0 | 0 | |
| Min. Value | 100 | 0 | 0 | 0 | 0 | |
| St. Dev. | 0 | 0 | 0 | 0 | 0 | |
| Components in at. % | |||||
|---|---|---|---|---|---|
| Ag | Pd | Pt | Cu | Ni | |
| Mean Value | 0 | 25.00 | 25.00 | 25.00 | 25.00 |
| Max Value | 0 | 26.75 | 25.65 | 25.85 | 25.99 |
| Min Value | 0 | 24.99 | 25.01 | 25.00 | 24.95 |
| St. Dev. | 0 | 0.88 | 0.32 | 0.43 | 0.52 |
| Area | XRD Lattice Parameter, a = [Å] | Calculated Lattice Parameter, a = [Å] |
|---|---|---|
| Orange area | 3765 | 3.56 |
| Blue area | 3996 | 3.95 |
| Green area | 3968 | 3.89 |
Publisher’s Note: MDPI stays neutral with regard to jurisdictional claims in published maps and institutional affiliations. |
© 2022 by the authors. Licensee MDPI, Basel, Switzerland. This article is an open access article distributed under the terms and conditions of the Creative Commons Attribution (CC BY) license (https://creativecommons.org/licenses/by/4.0/).
Share and Cite
Simić, L.; Rudolf, R.; Majerič, P.; Anžel, I. Cast Microstructure of a Complex Concentrated Noble Alloy Ag20Pd20Pt20Cu20Ni20. Materials 2022, 15, 4788. https://doi.org/10.3390/ma15144788
Simić L, Rudolf R, Majerič P, Anžel I. Cast Microstructure of a Complex Concentrated Noble Alloy Ag20Pd20Pt20Cu20Ni20. Materials. 2022; 15(14):4788. https://doi.org/10.3390/ma15144788
Chicago/Turabian StyleSimić, Lidija, Rebeka Rudolf, Peter Majerič, and Ivan Anžel. 2022. "Cast Microstructure of a Complex Concentrated Noble Alloy Ag20Pd20Pt20Cu20Ni20" Materials 15, no. 14: 4788. https://doi.org/10.3390/ma15144788