3.1.1. Determination of Fuel Agent
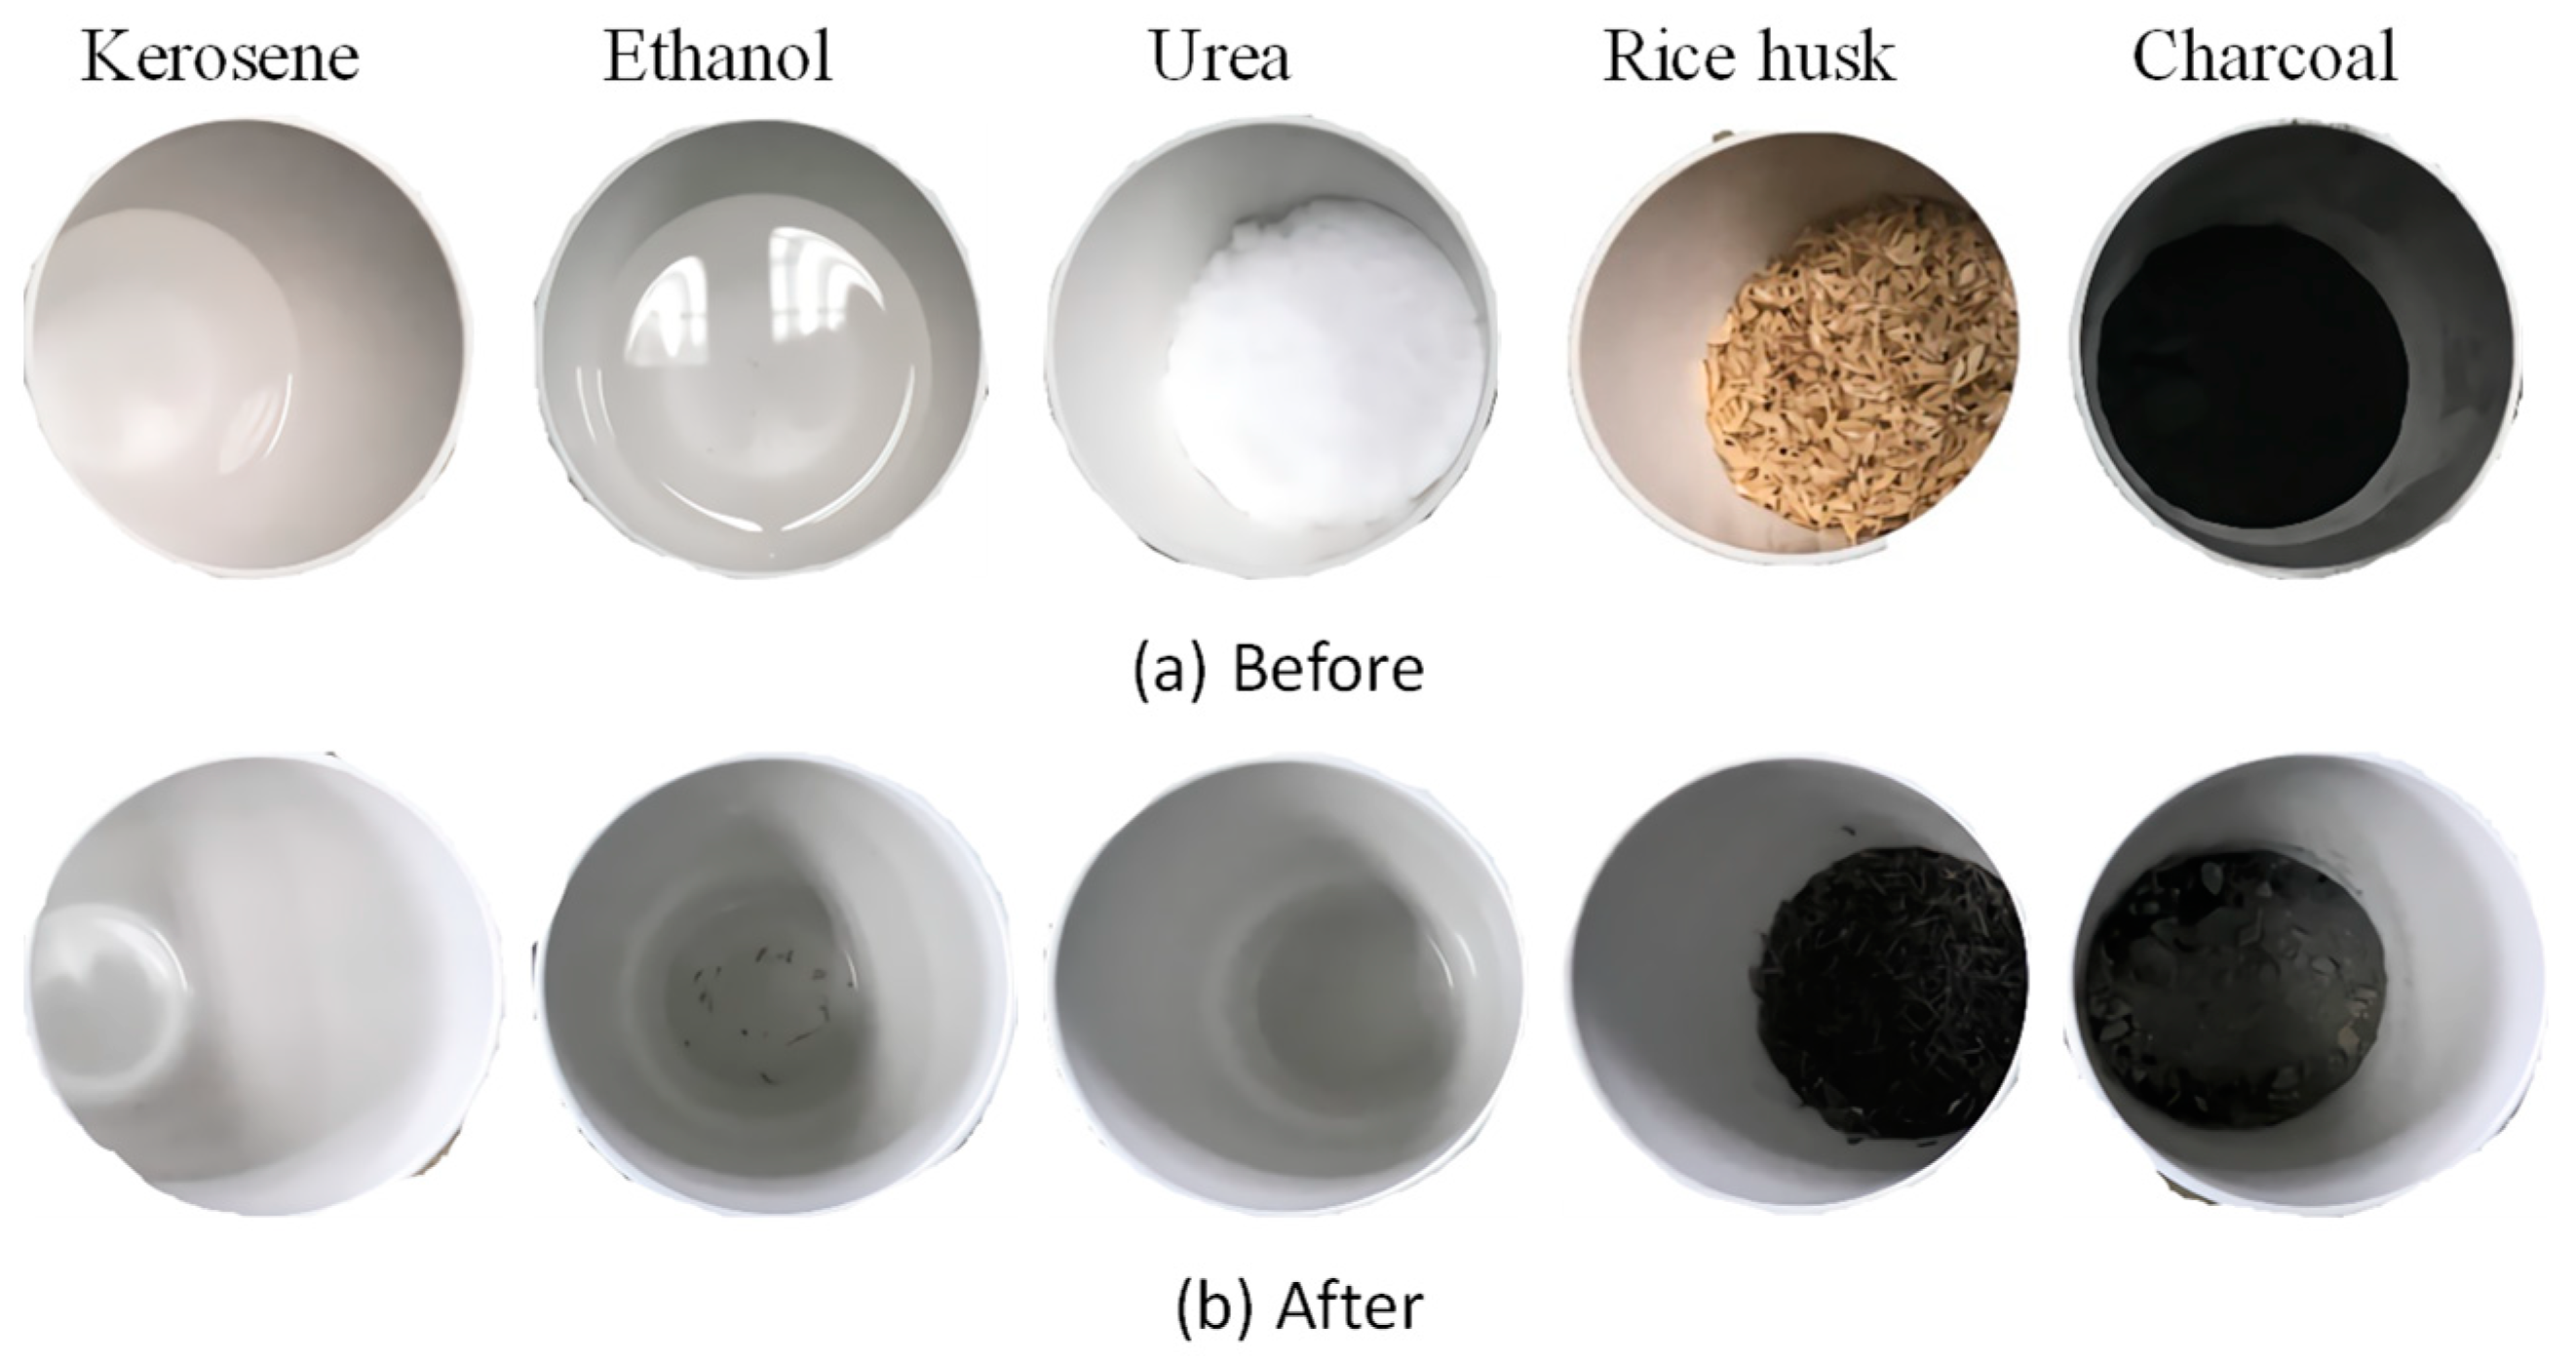
The appearances of the fuel agents before calcination and corresponding calcined residues are shown in
Figure 3. It can be seen that there are no obvious residues for kerosene, ethanol, and urea since the main reaction products are gases such as water vapor, CO
2, and NH
3. In comparison, some rice husk ash and charcoal ash were observed. Rice husk ash is rich in amorphous silica with a highly microporous cellular structure [
29,
30], which may have an adverse effect on the final products as the highly microporous structure could absorb a lot of water, impeding a further reaction of belite. The main elements in charcoal ash are Ca, Mg, K, Na, and P [
31], thus adding more irrelevant elements into the final reaction product system. Therefore, it is apparent that kerosene, ethanol, and urea are better compared to rich husk and charcoal to be used as the fuel agent.
The mixture of each fuel agent and raw material before and after calcination is shown in
Figure 4a,b. For the mixtures before calcination (shown in
Figure 4a), it is apparent that the combined micro-silica and CaCO
3 powders were not well-dispersed in the liquid kerosene, most of which just precipitated and accumulated on the bottom of the crucible. However, the micro-silica and CaCO
3 powders were distributed in ethanol solution homogenously, which is considered better than the kerosene. The worse dispersion state of micro-silica and CaCO
3 powders in the kerosene might be associated with its oily characteristic. A slurry was formed when mixing the urea with the micro-silica and CaCO
3 powders. The color of the mixtures with these three fuel agents is similar to the original combination of micro-silica and CaCO
3 powders. For the raw materials mixed with rice husk or charcoal, the obtained mixture showed no color of the raw materials, and it seems that the rice husk or charcoal dominates the whole mixture. This can be explained by considering the relatively larger volume of the rice husk or charcoal because of their lower density than that of the raw materials. Thus, these results suggest that kerosene, rice husk, and charcoal are not suitable to be used as fuel agents because they are not able to achieve a homogeneous mixture with the raw materials.
After calcination in the muffle, as shown in
Figure 4b, it was found that almost all the reaction products for kerosene and ethanol mainly accumulated under the bottom of the crucible with a color of light grey. Besides, the products seemed to be very fragile and crispy with some obvious rifts. The fragile and easily damaged products are associated with the gas released during the calcination process, which indirectly suggests that this method is feasible. The reaction products formed for urea were relatively fluffy near the crucible mouth, indicating a significant increase in the total volume. Besides, the color was snow white, which suggests a relatively high purity. There were a lot of burned grey residues and still burning black charcoals for rice husk and charcoal used as the fuel agent, respectively. Based on these observations, urea is assumed to be a better fuel agent, since the increased volume of the reaction products indicates a large amount of gases released during reaction and the pure white color demonstrates a high content of belite in the final products.
To further verify the assumption, the mineralogical composition of the obtained reaction products and corresponding content determined by using semi-quantitative XRD analysis is shown in
Figure 5 and
Table 4. It shows that the highest percentage of Ca
2SiO
4 in total and β-Ca
2SiO
4 was obtained when urea was used as the fuel agent, which was 55.3% and 32.7%, respectively. Kerosene and ethanol led to similar productivity of Ca
2SiO
4, the latter of which had a slightly higher content, probably due to the good dispersion of raw materials in ethanol compared to that in the kerosene. Not surprisingly, the charcoal and rice husk resulted in the lowest content of Ca
2SiO
4 in total and β-Ca
2SiO
4, less than 30% and just at 20%, accordingly. All these results were consistent with the aforementioned appearances of the mixture before and after calcination. It was also noticed that the percentage of SiO
2 present in the final reaction products was relatively low for urea (3.4%) and ethanol (3.0%), suggesting a higher reaction degree compared to other fuel agents, except for rice husk, since most of the residual SiO
2 might be introduced by the rice husk. It is probably because the original micro-silica and CaCO
3 powders had a rather complete reaction accompanied by the combustion of rice husk and the formation of rice husk ash with amorphous aluminosilicate rich in SiO
2. The highest percentage of CaSiO
3 (a reaction product formed when the heating temperature is not high enough) seen in the charcoal-added mixture can be due to its continuous burning, which requires a lot of heating energy, leading to a lower temperature for calcination and thus an incomplete reaction.
In conclusion, urea was hereafter selected as the optimized fuel agent not only because of the much greater volume of the reaction products, but also the highest percentage of Ca
2SiO
4 phases obtained with fewer impurities, including Ca
3SiO
5 and SiO
2. It is also worth noting that one more advantage for urea is its relatively low cost, which makes it the most frequently used fuel among other organic fuels [
17]. It is noteworthy that the total concentration of Ca
2SiO
4 was not high enough, which is why for the following tests the holding temperature and time were set at 1050 °C and 2 h, respectively [
32,
33].
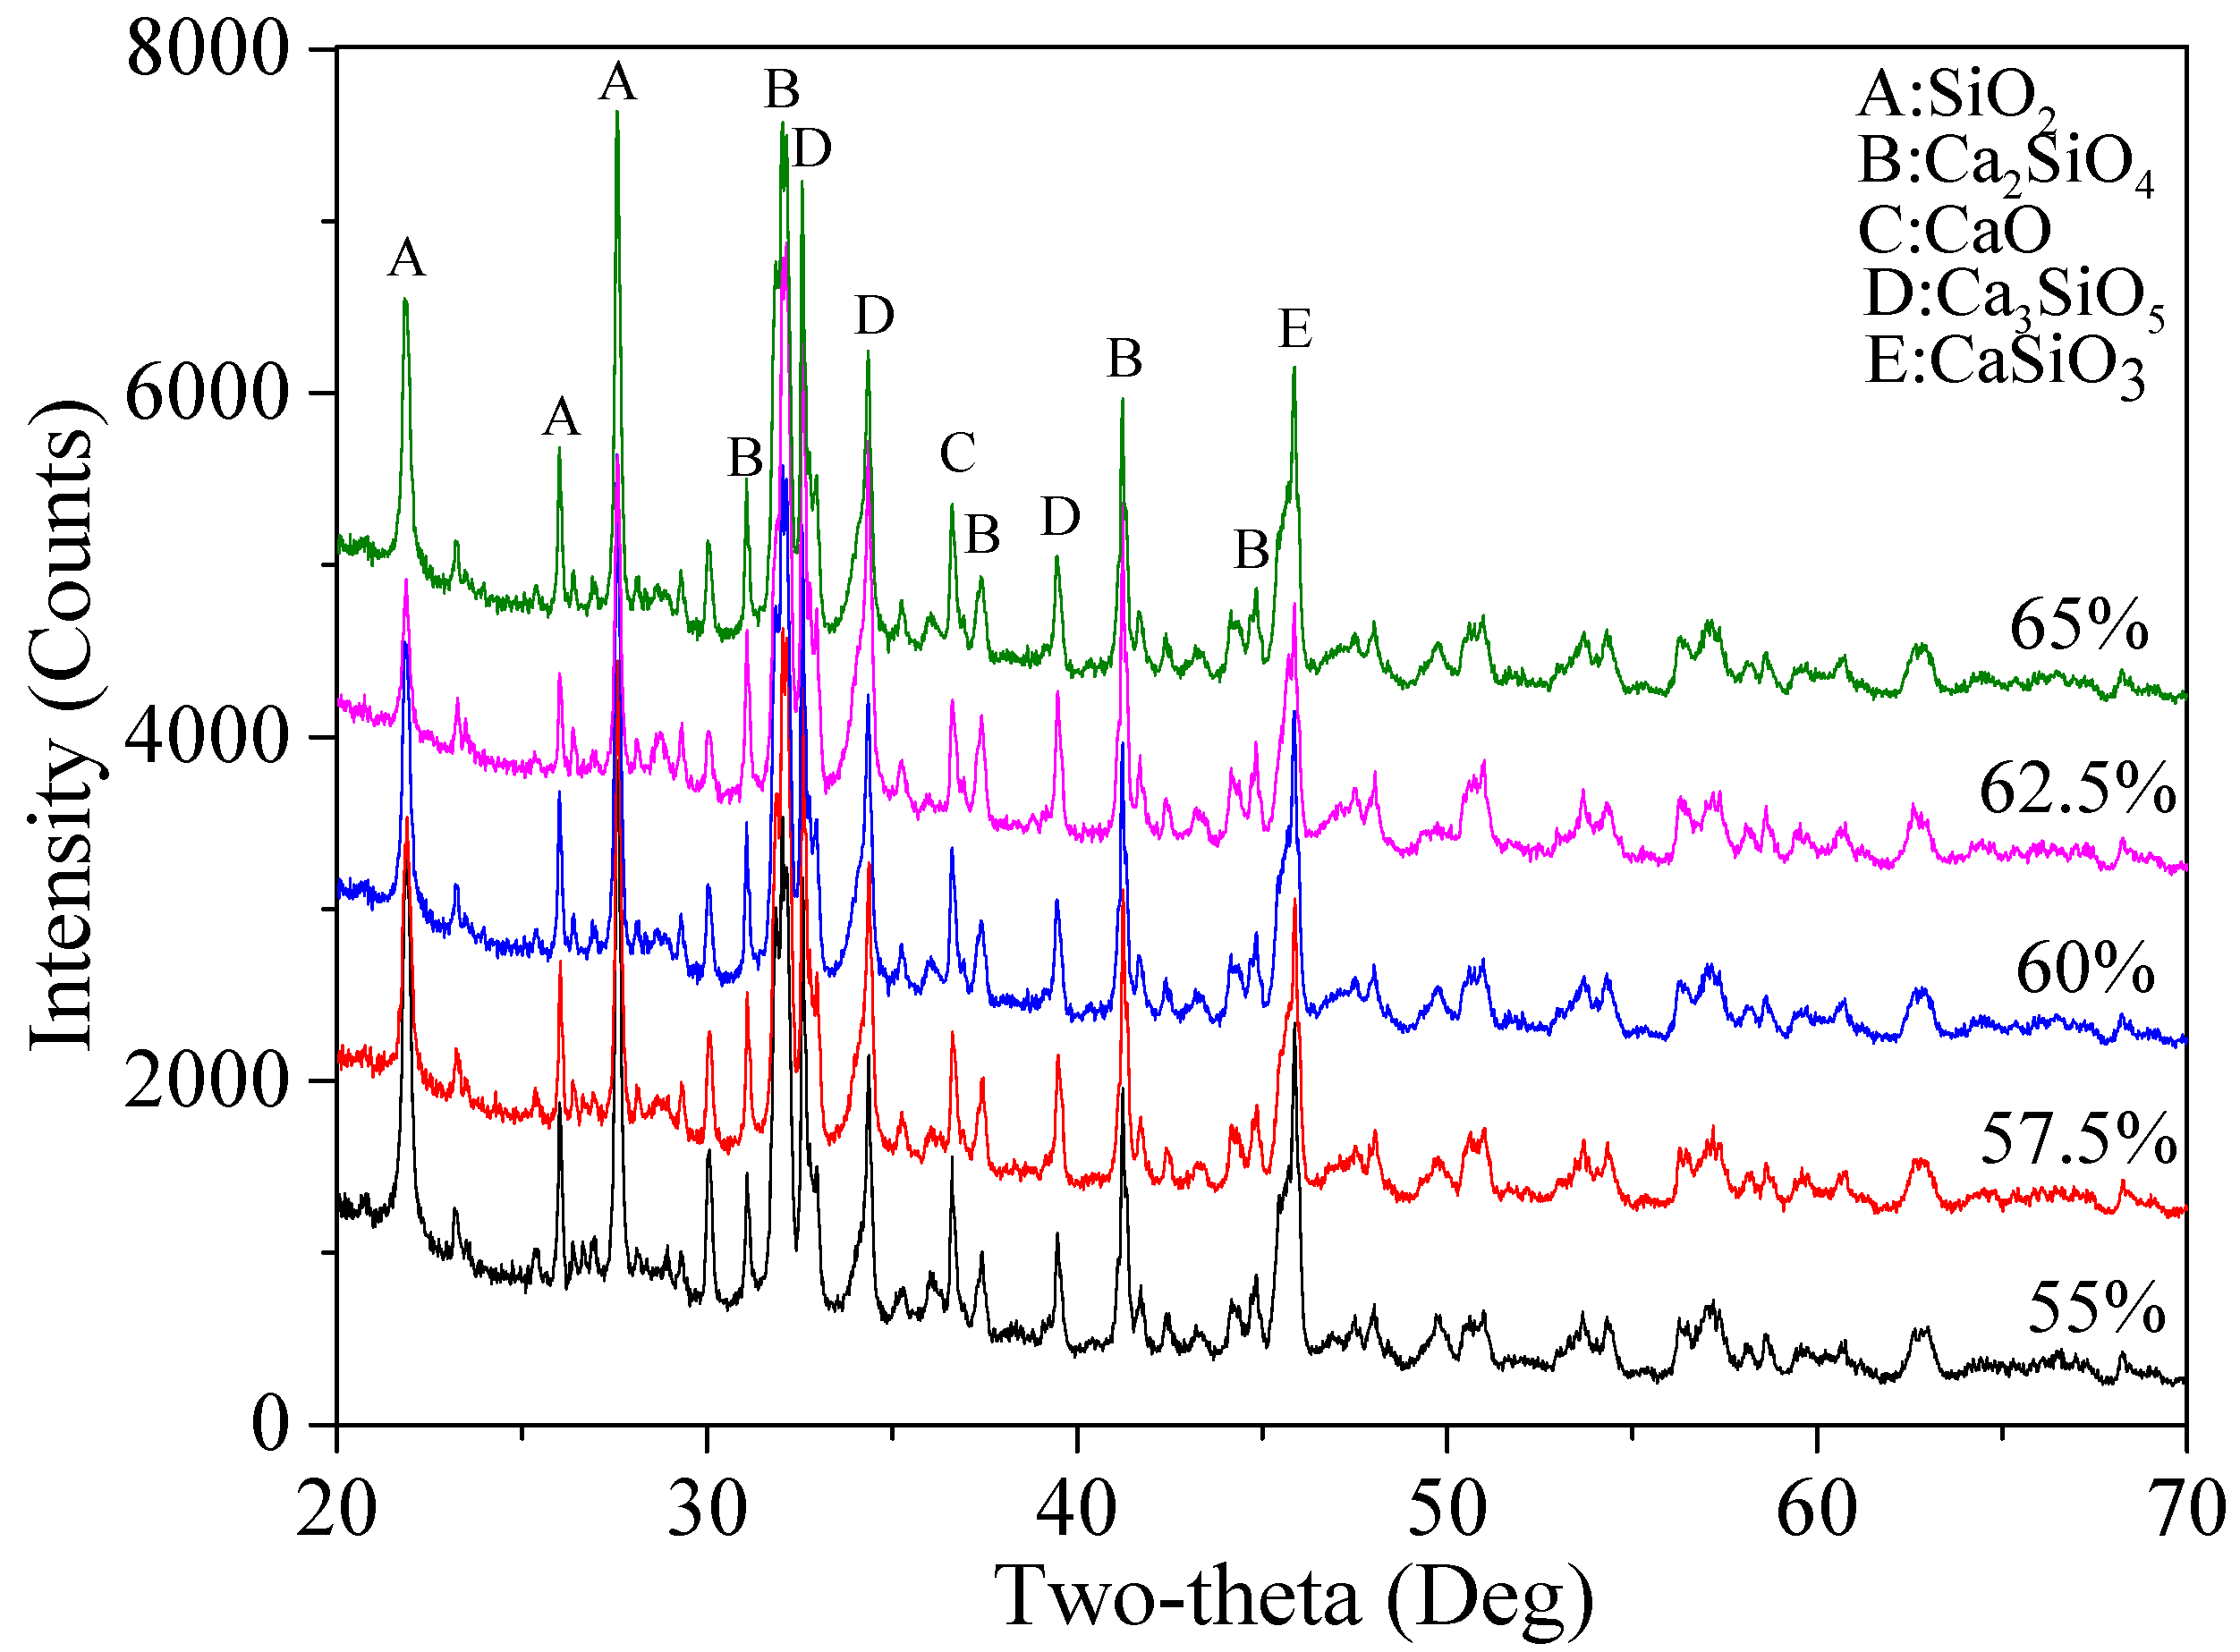
3.1.2. Determination of CaO/(SiO2 + CaO) Ratios
After the selection of urea as the fuel agent, percentages of various mineralogical phases formed under different ratios of CaO/(SiO
2 + CaO), namely 65%, 62.5%, 60%, 57.5%, and 55%, were calculated based on the XRD semi-quantitative analysis. The corresponding patterns and the final results are shown in
Figure 6 and
Table 5, respectively. The highest Ca
2SiO
4 in total and the second highest value of β-Ca
2SiO
4 with relatively high hydration reactivity were achieved when the ratio was 62.5%, which were 79.5% and 69.9%, respectively. The highest content of another belite polymorph with high reactivity, α′-Ca
2(SiO
4), was 2.5% with CaO/(SiO
2 + CaO) at 65%, followed by 2.4% when CaO/(SiO
2 + CaO) was 62.5%. Besides, the percentage ratio of the residual SiO
2 considering CaO/(SiO
2 + CaO) at 62.5% was 3.1%, the second lowest one among the five mixtures of reaction products, after that of the CaO/(SiO
2 + CaO) ratio at 65%. In addition, there was no significant difference in the content of CaO for all systems, which ranged between 0.2% and 0.5%, indicating that the CaO from CaCO
3 powders almost completely reacted with the micro-silica powders. As the aim of the research was to obtain highly reactive belite cement with higher purity, the 62.5% ratio of CaO/(SiO
2 + CaO) was determined as the optimal ratio.
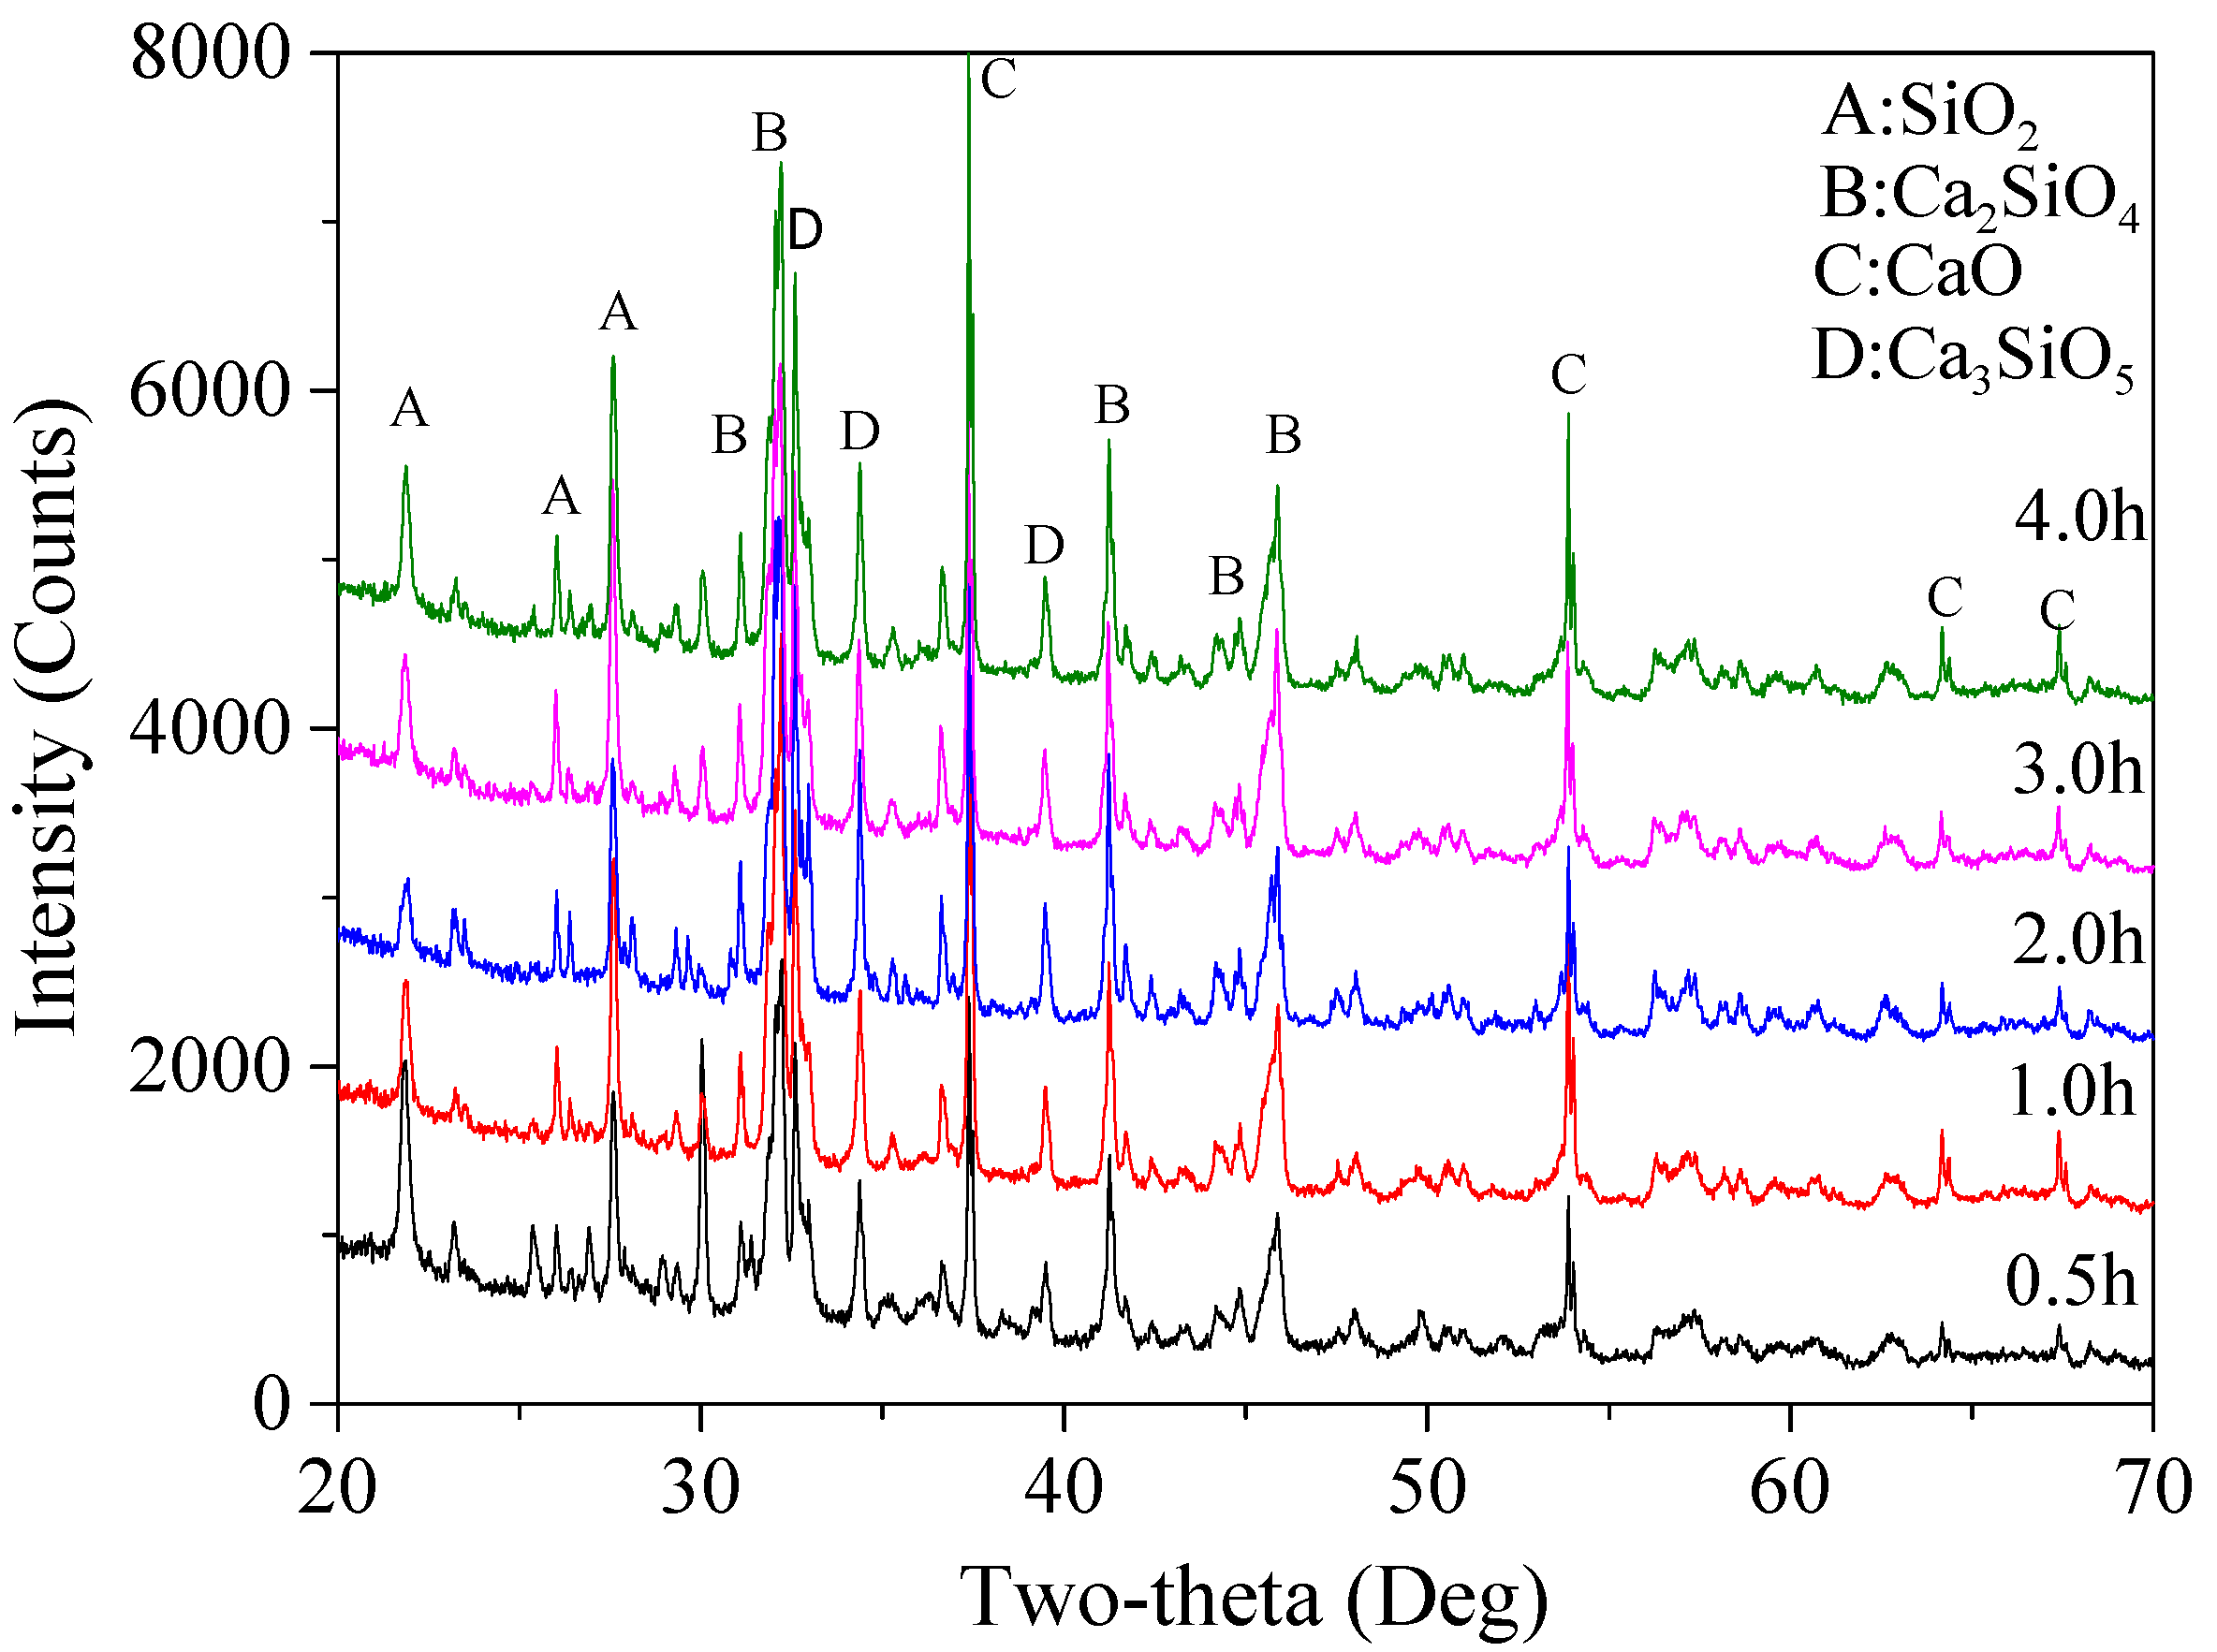
3.1.3. Determination of Holding Time
According to the selected fuel agent and the CaO/(SiO
2 + CaO) ratio at 62.5%, different holding times (0.5, 1.0, 2.0, 3.0, and 4.0 h) were used to examine the effect of holding time on the final reaction products and to determine the most suitable holding time. Based on the XRD patterns (shown in
Figure 7), calculated percentages of various mineralogical phases in the final products are listed in
Table 6.
According to the results, the total content of Ca
2SiO
4 increased first from 74.2% for 0.5 h up to 87.2% with the holding time at 2.0 h, and then decreased slightly to 86.1% and 86.4%, respectively, when the holding time was 3.0 and 4.0 h. This outcome demonstrates that a longer holding time did not necessarily lead to higher content of Ca
2SiO
4, and there is an optimal holding duration above which no more Ca
2SiO
4 could be formed. This might be associated with the limited temperature, in which case a further reaction duration had no significant effect on increasing the amounts of the final products. The content of β-Ca
2(SiO
4) decreased first from 56.0% (0.5 h) to only 28.1% (1.0 h), then increased up to 40.7% (2.0 h) and 59.4% (3.0 h), followed by a sharp decrease down to only about 31.4% when the holding time was 4.0 h. A 2.0 h holding time led to the highest content of α′-Ca
2(SiO
4) (8%), with the highest hydraulic reactivity [
34]. Besides, it also can be seen that CaO and SiO
2 content experienced no significant reductions after 2.0 h of suspension, indicating that a longer holding time would not facilitate further reactions, which might also be associated with the holding temperature selected in this study. Considering that a reduced holding time usually leads to less energy consumption, a 2 h holding time was chosen for the following tests.
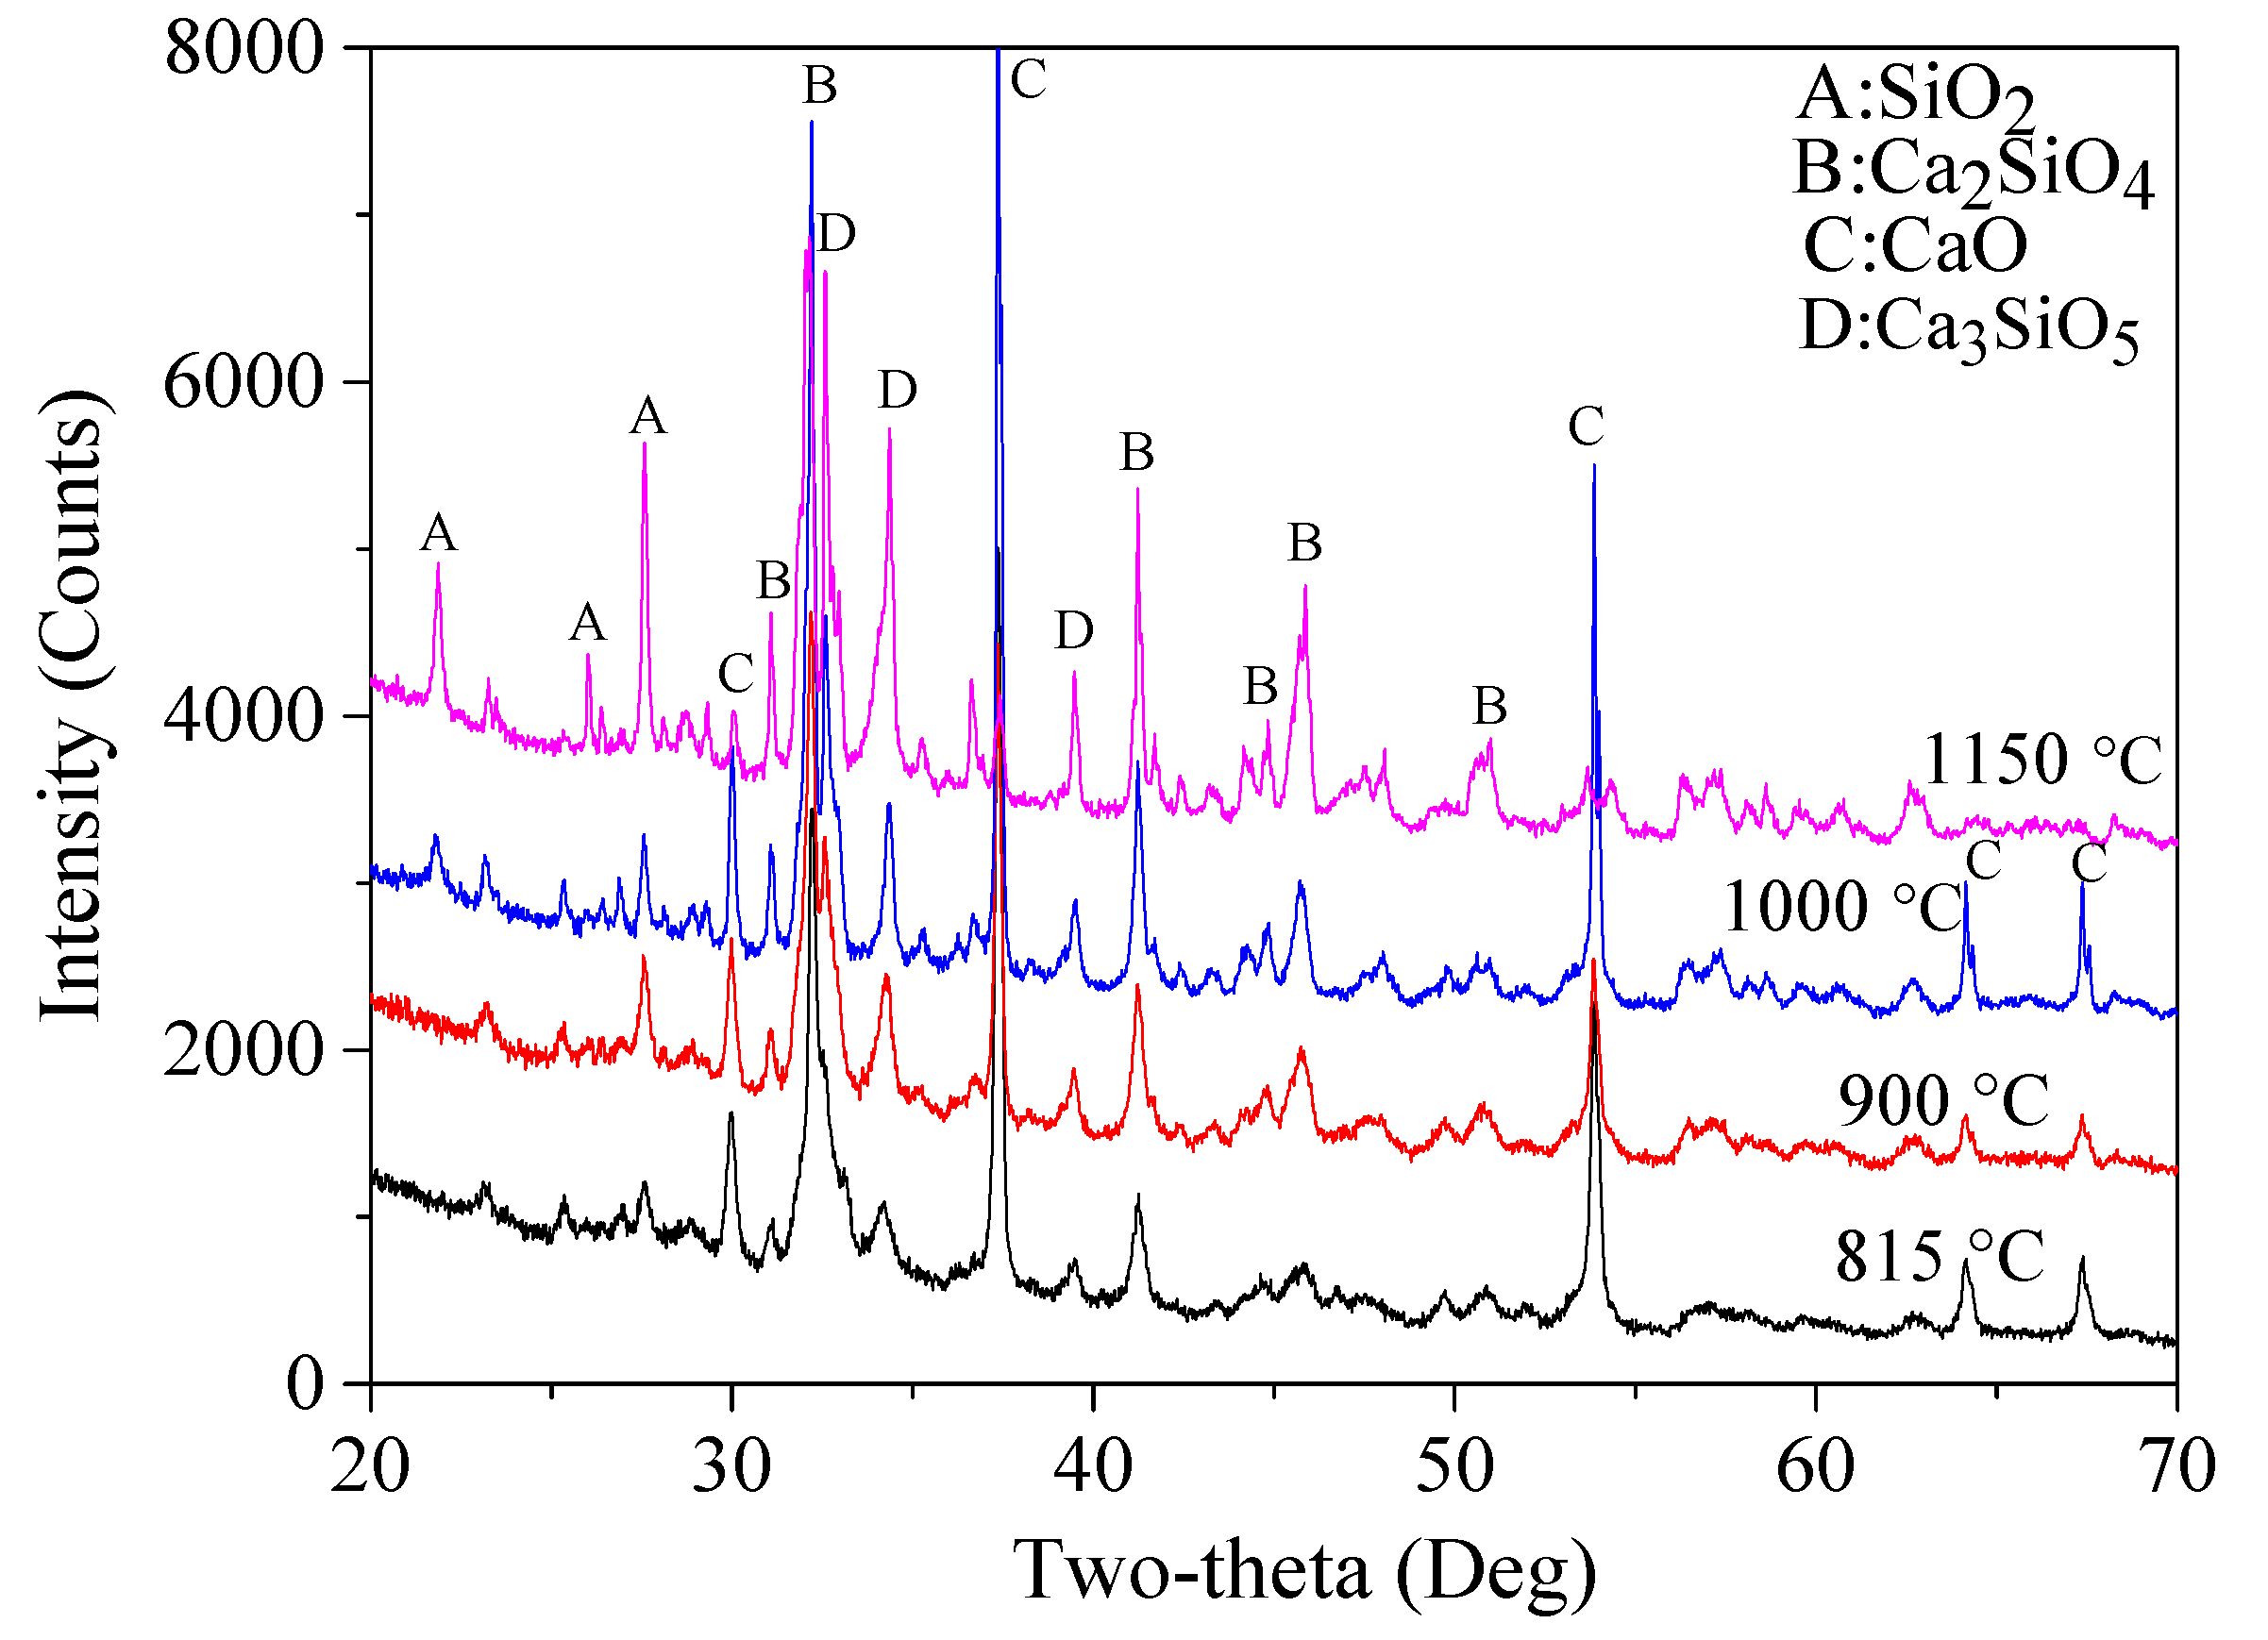
3.1.5. Determination of Fuel Agent Content
Finally, based on the predetermined optimized process parameters, the optimal amount of fuel agent was determined. As mentioned earlier, the original amount of urea used was 4.902 times that of the combined mass of micro-silica and CaCO
3 powders. XRD patterns and corresponding calculated percentage ratios of various products are presented in
Figure 9 and
Table 8, respectively. It is clear that the content of Ca
2SiO
4 in total increased first from 70.9% to 87.2% when the amount of urea grew from 80% to 100%, followed by a small reduction, 81.8% (110%) and 73.2% (120%). The decreased amount of Ca
2SiO
4 in total can be attributed to the fact that an excessive amount of urea would require more O
2, which may then result in an inadequate combustion. As a result, the actual temperature for calcination might not be high enough to achieve a high production of Ca
2SiO
4. The minimum percentage ratio of CaO and SiO
2 can be seen in the reaction products for 110% and 100% of urea, which was 5.8% and 3.1%, respectively. Thus, since 100% of urea led to the highest content of Ca
2SiO
4 in total and the lowest percentage ratio of unreacted SiO
2, 100% of urea was finally selected.
After this process, all the process parameters involved in the synthesis of nano-belite cement were optimized, which are summarized in
Table 9.


