
Multi-Criteria Optimisation of Friction Stir Welding Parameters for EN AW-2024-T3 Aluminium Alloy Joints


Abstract
:1. Introduction
2. Material and Methods
2.1. Material
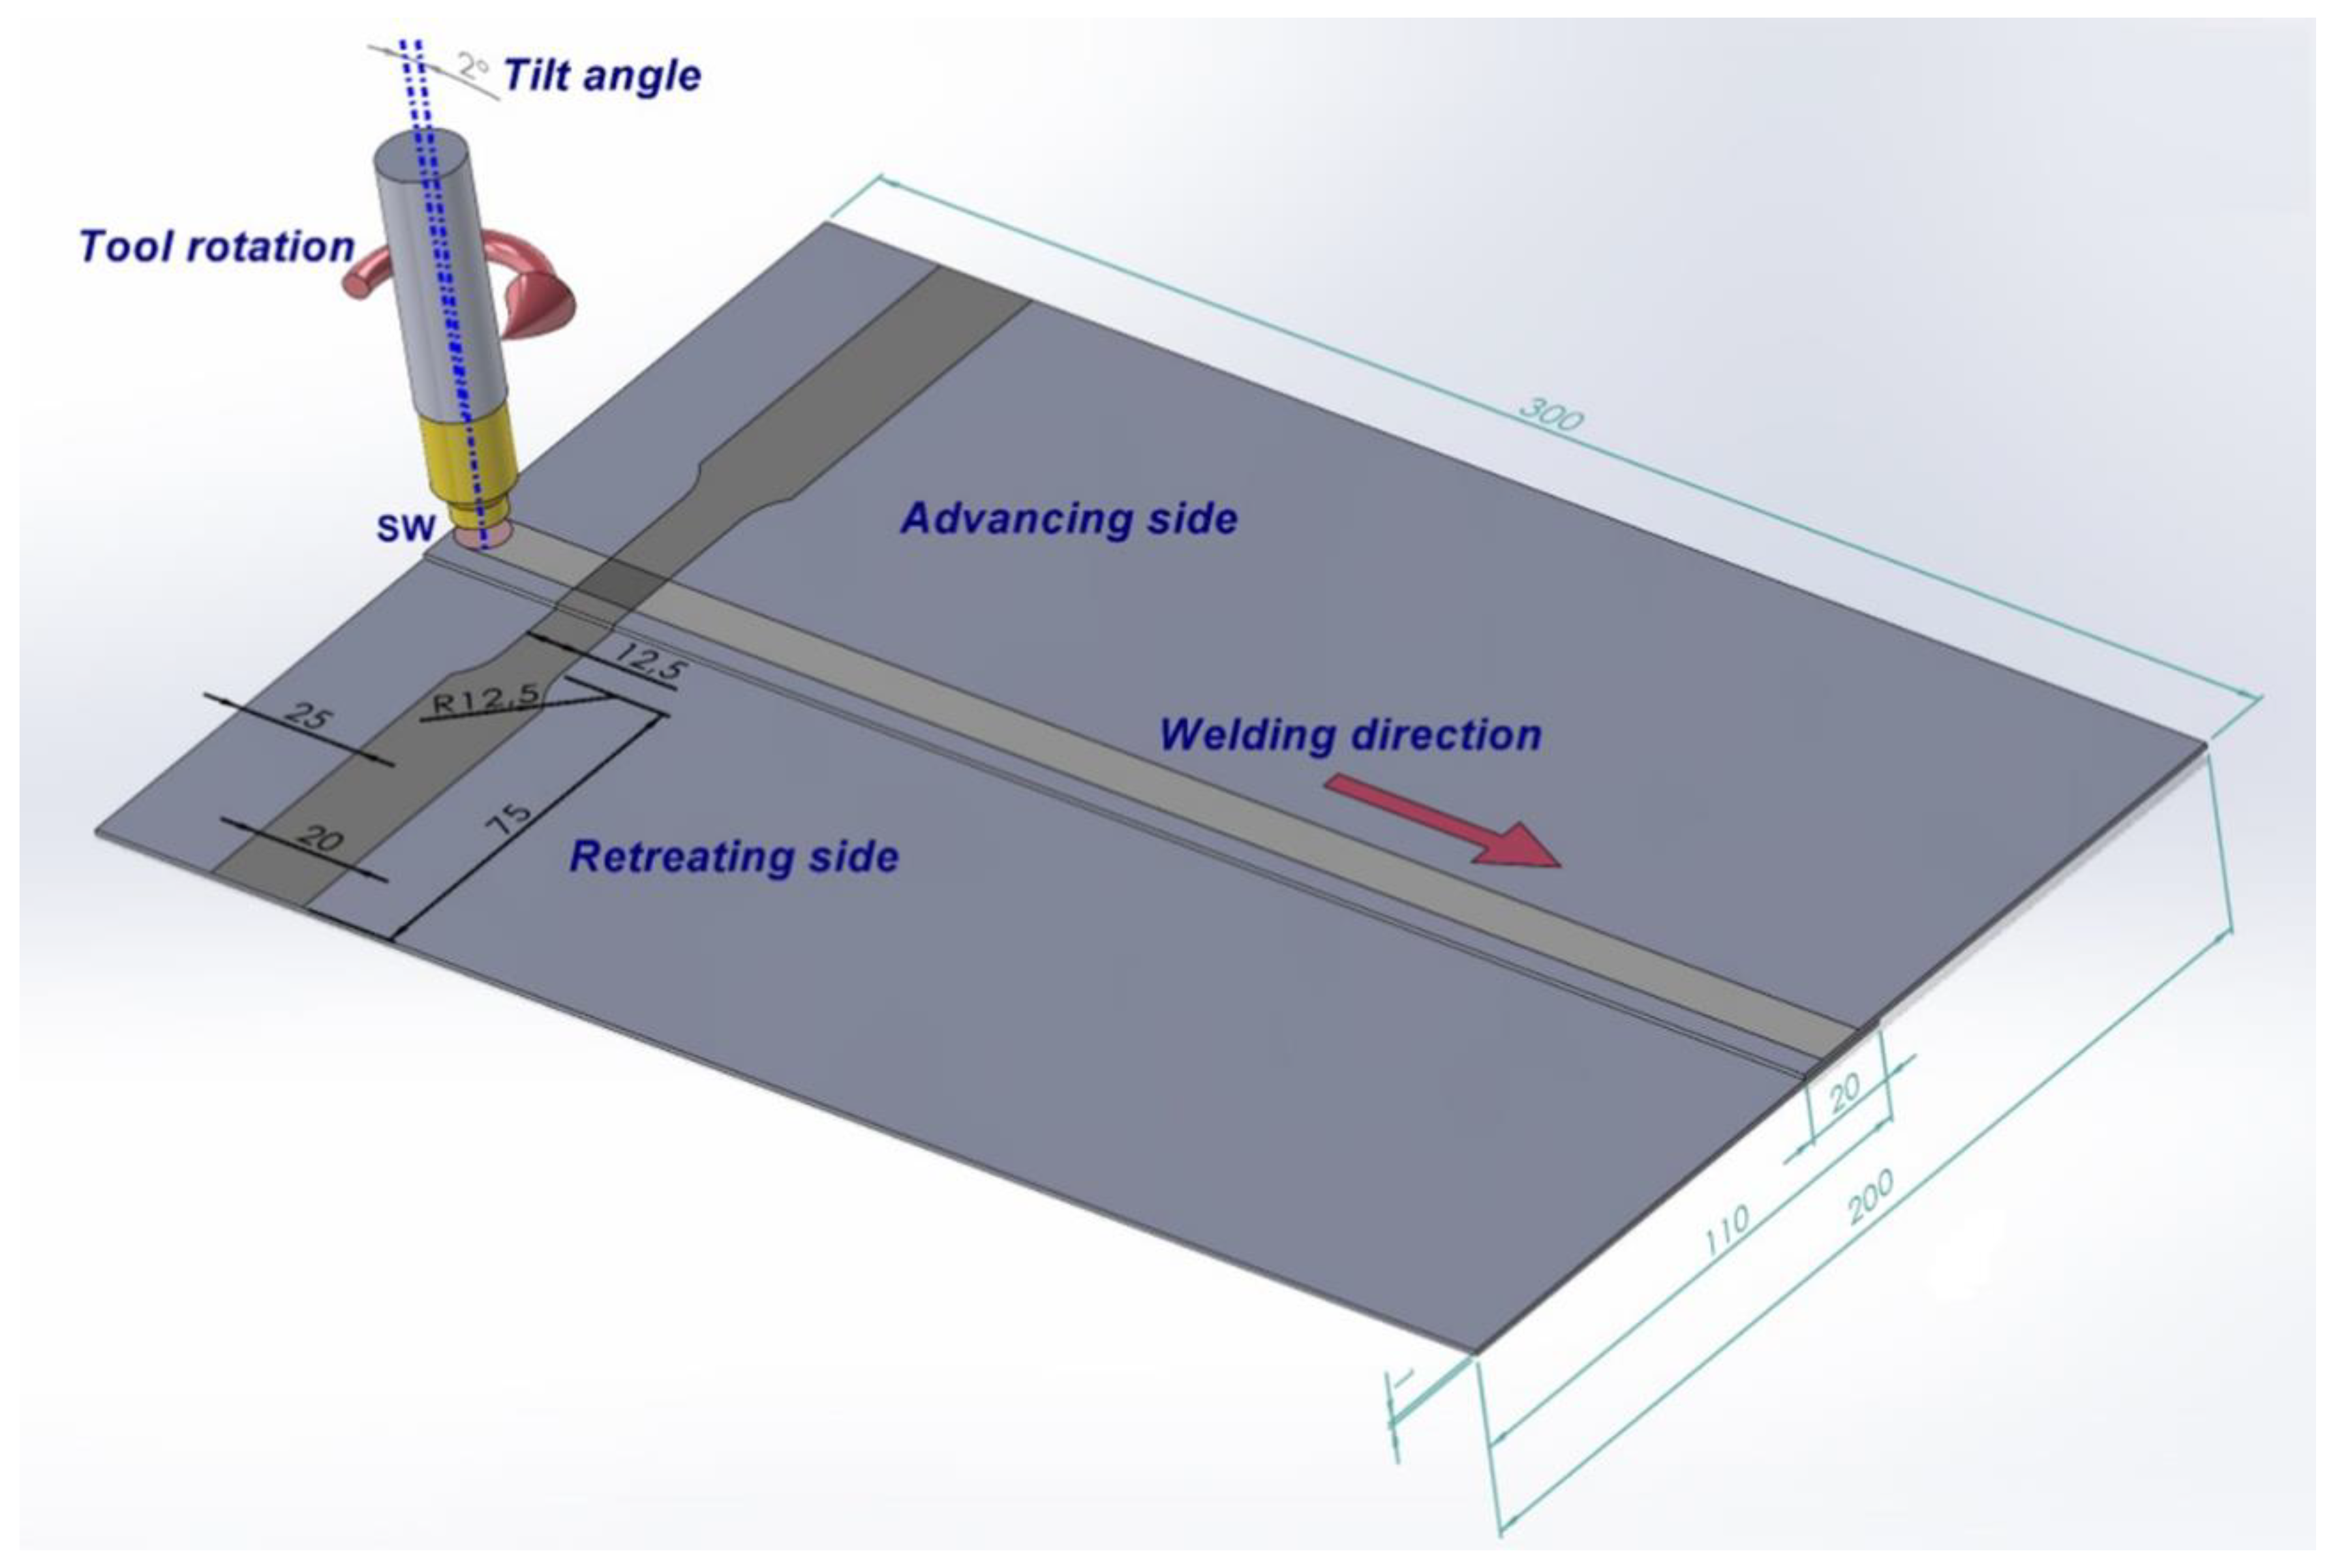
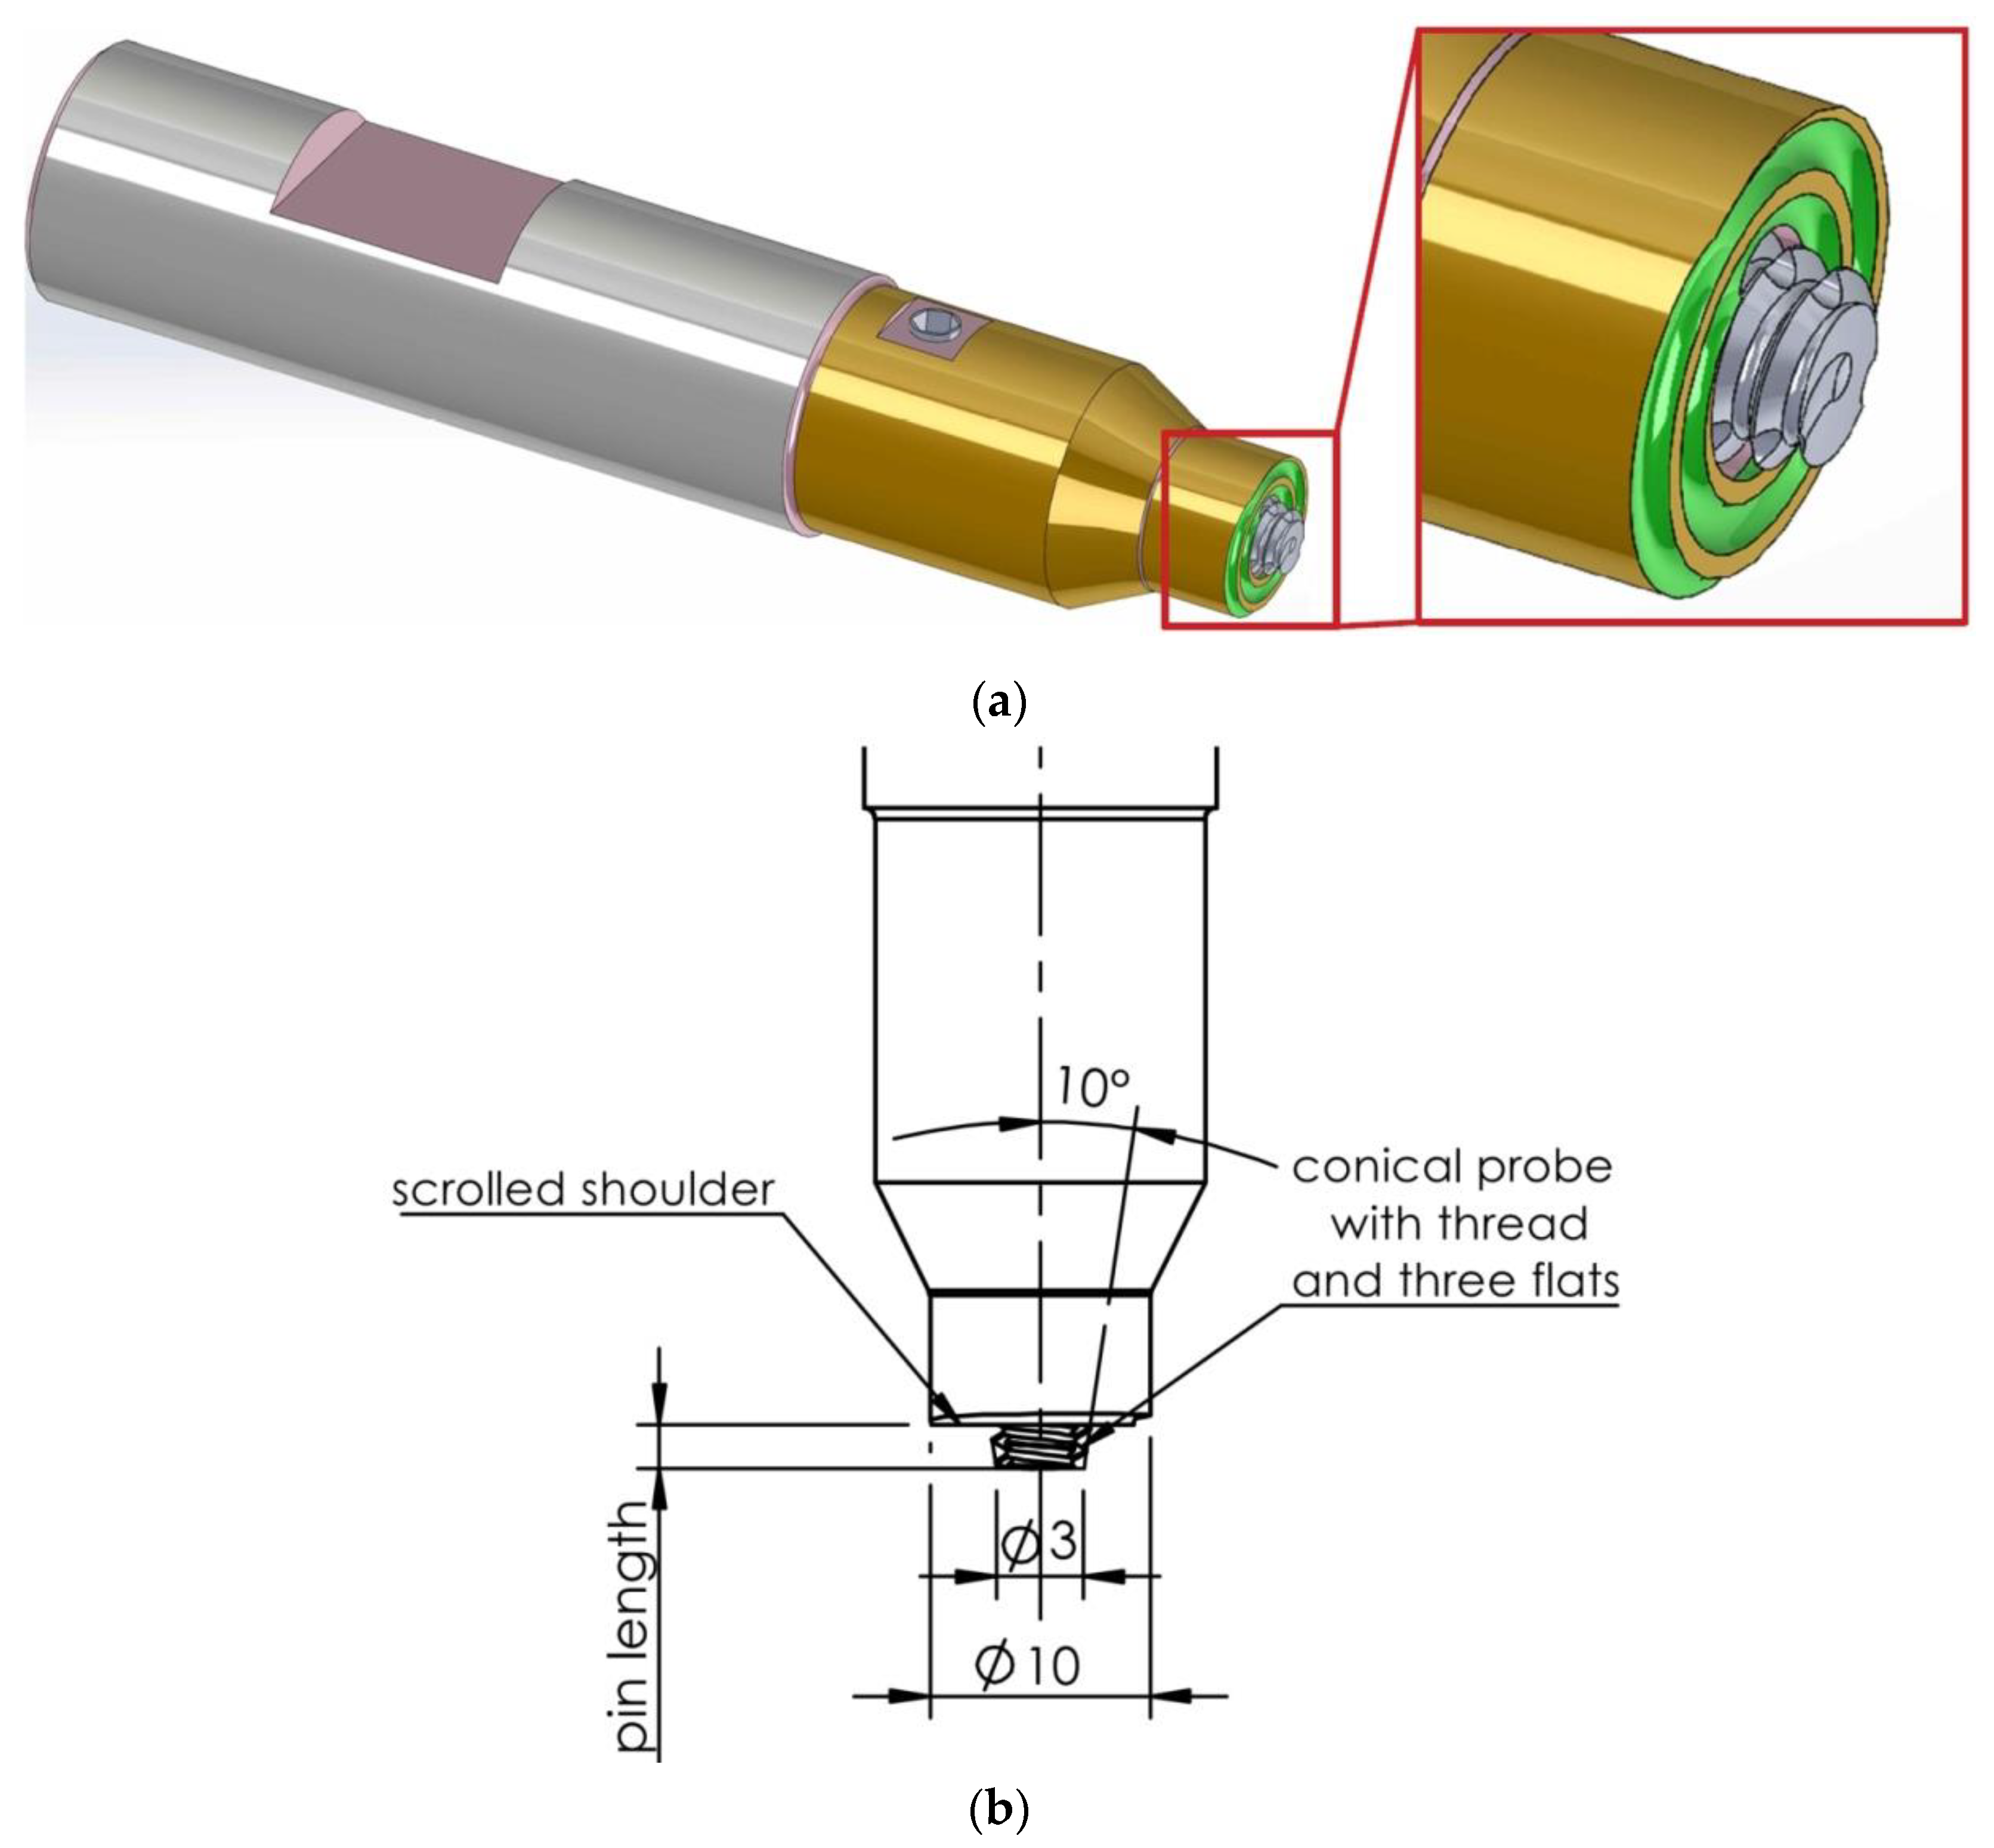
2.2. Welding Procedure
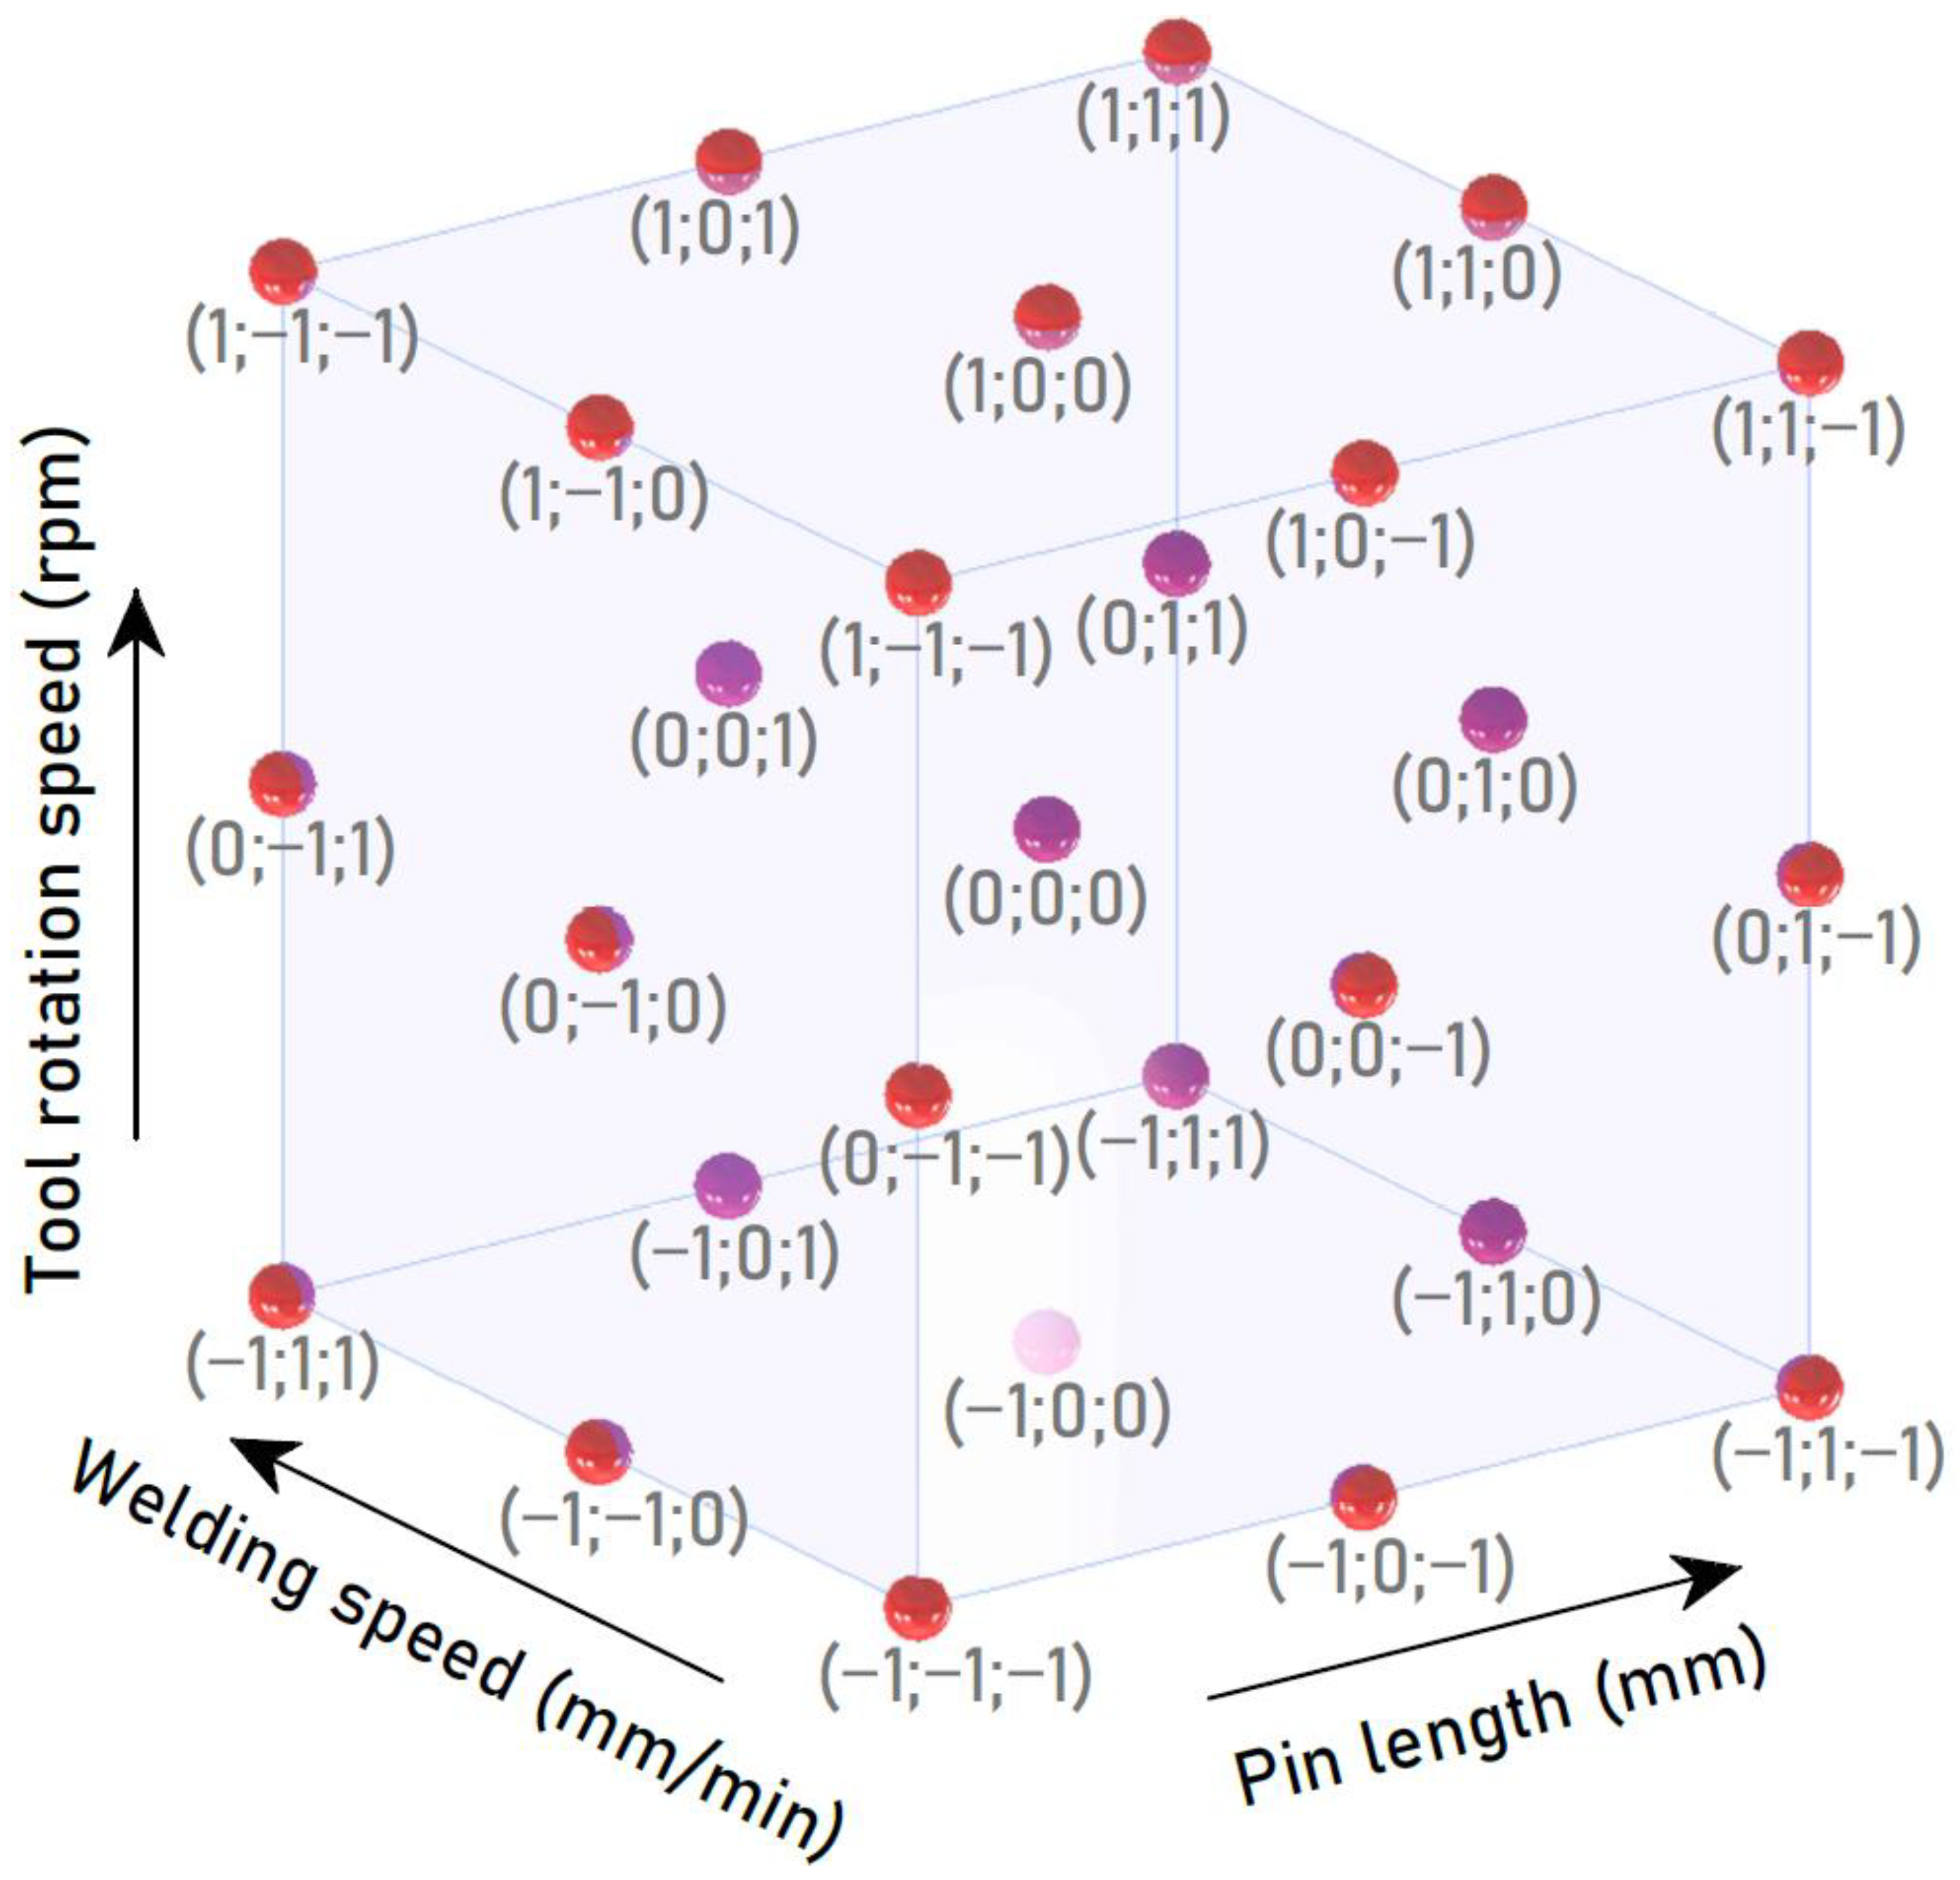
2.3. Optimisation of the Welding Parameters
3. Results and Discussion
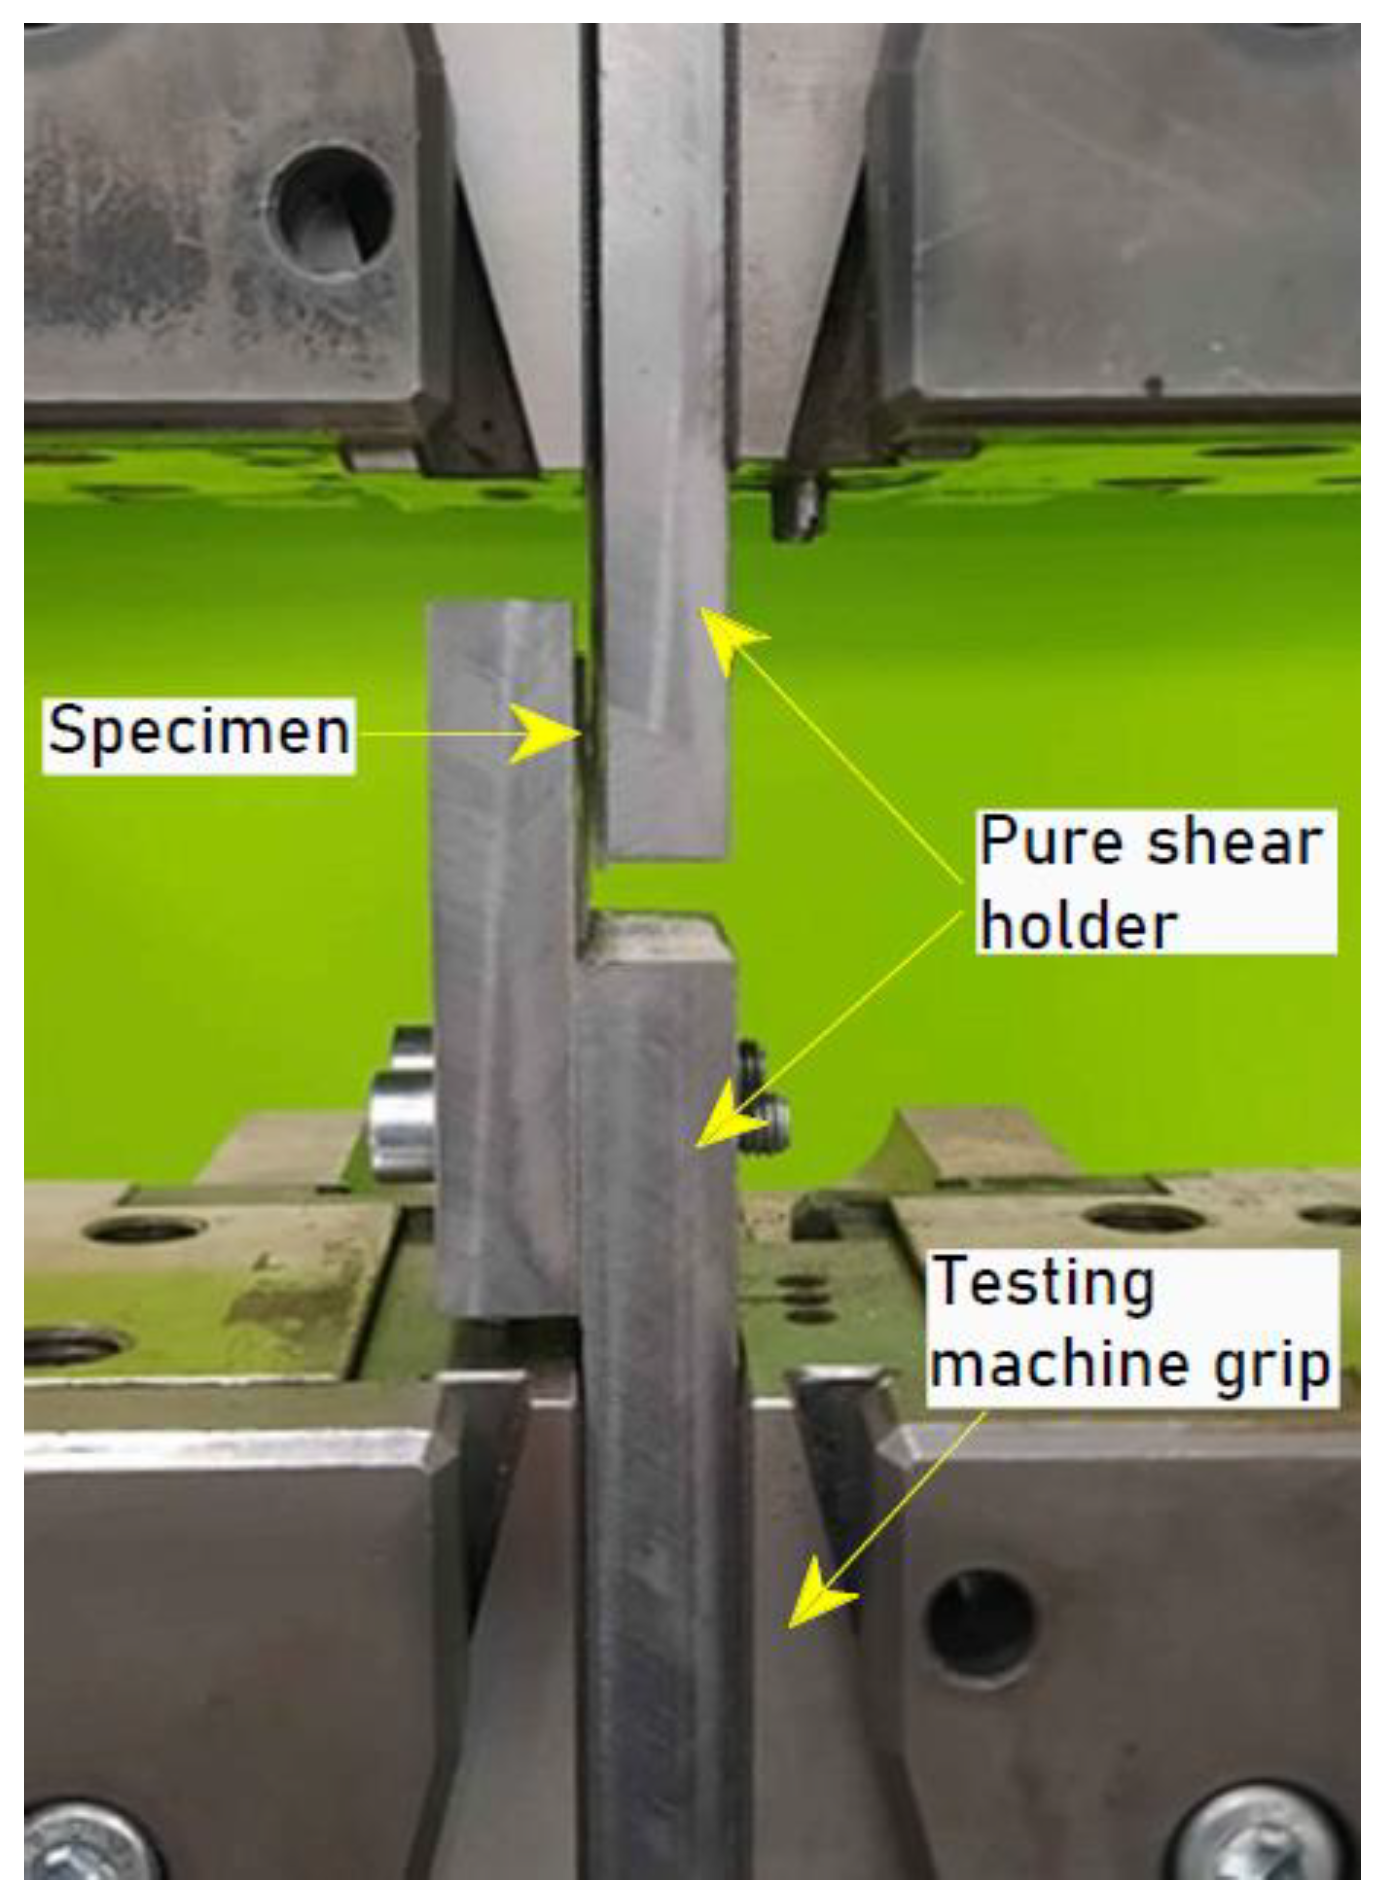
3.1. Tensile/Pure Shear Tests
3.2. Multi-Objective Optimisation of FSW Parameters
3.3. Optimisation of the FSW Process
- D Rm—a set of feasible solutions—the range of the FSW process parameters.
- z = (z1, z2, …, zm) —an acceptable solution.
- fi: D R—i-th objective function (I = 1, 2, …, k).
- (z) = (f1(z), f2(z))—objective function of a multi-criteria problem.
4. Conclusions
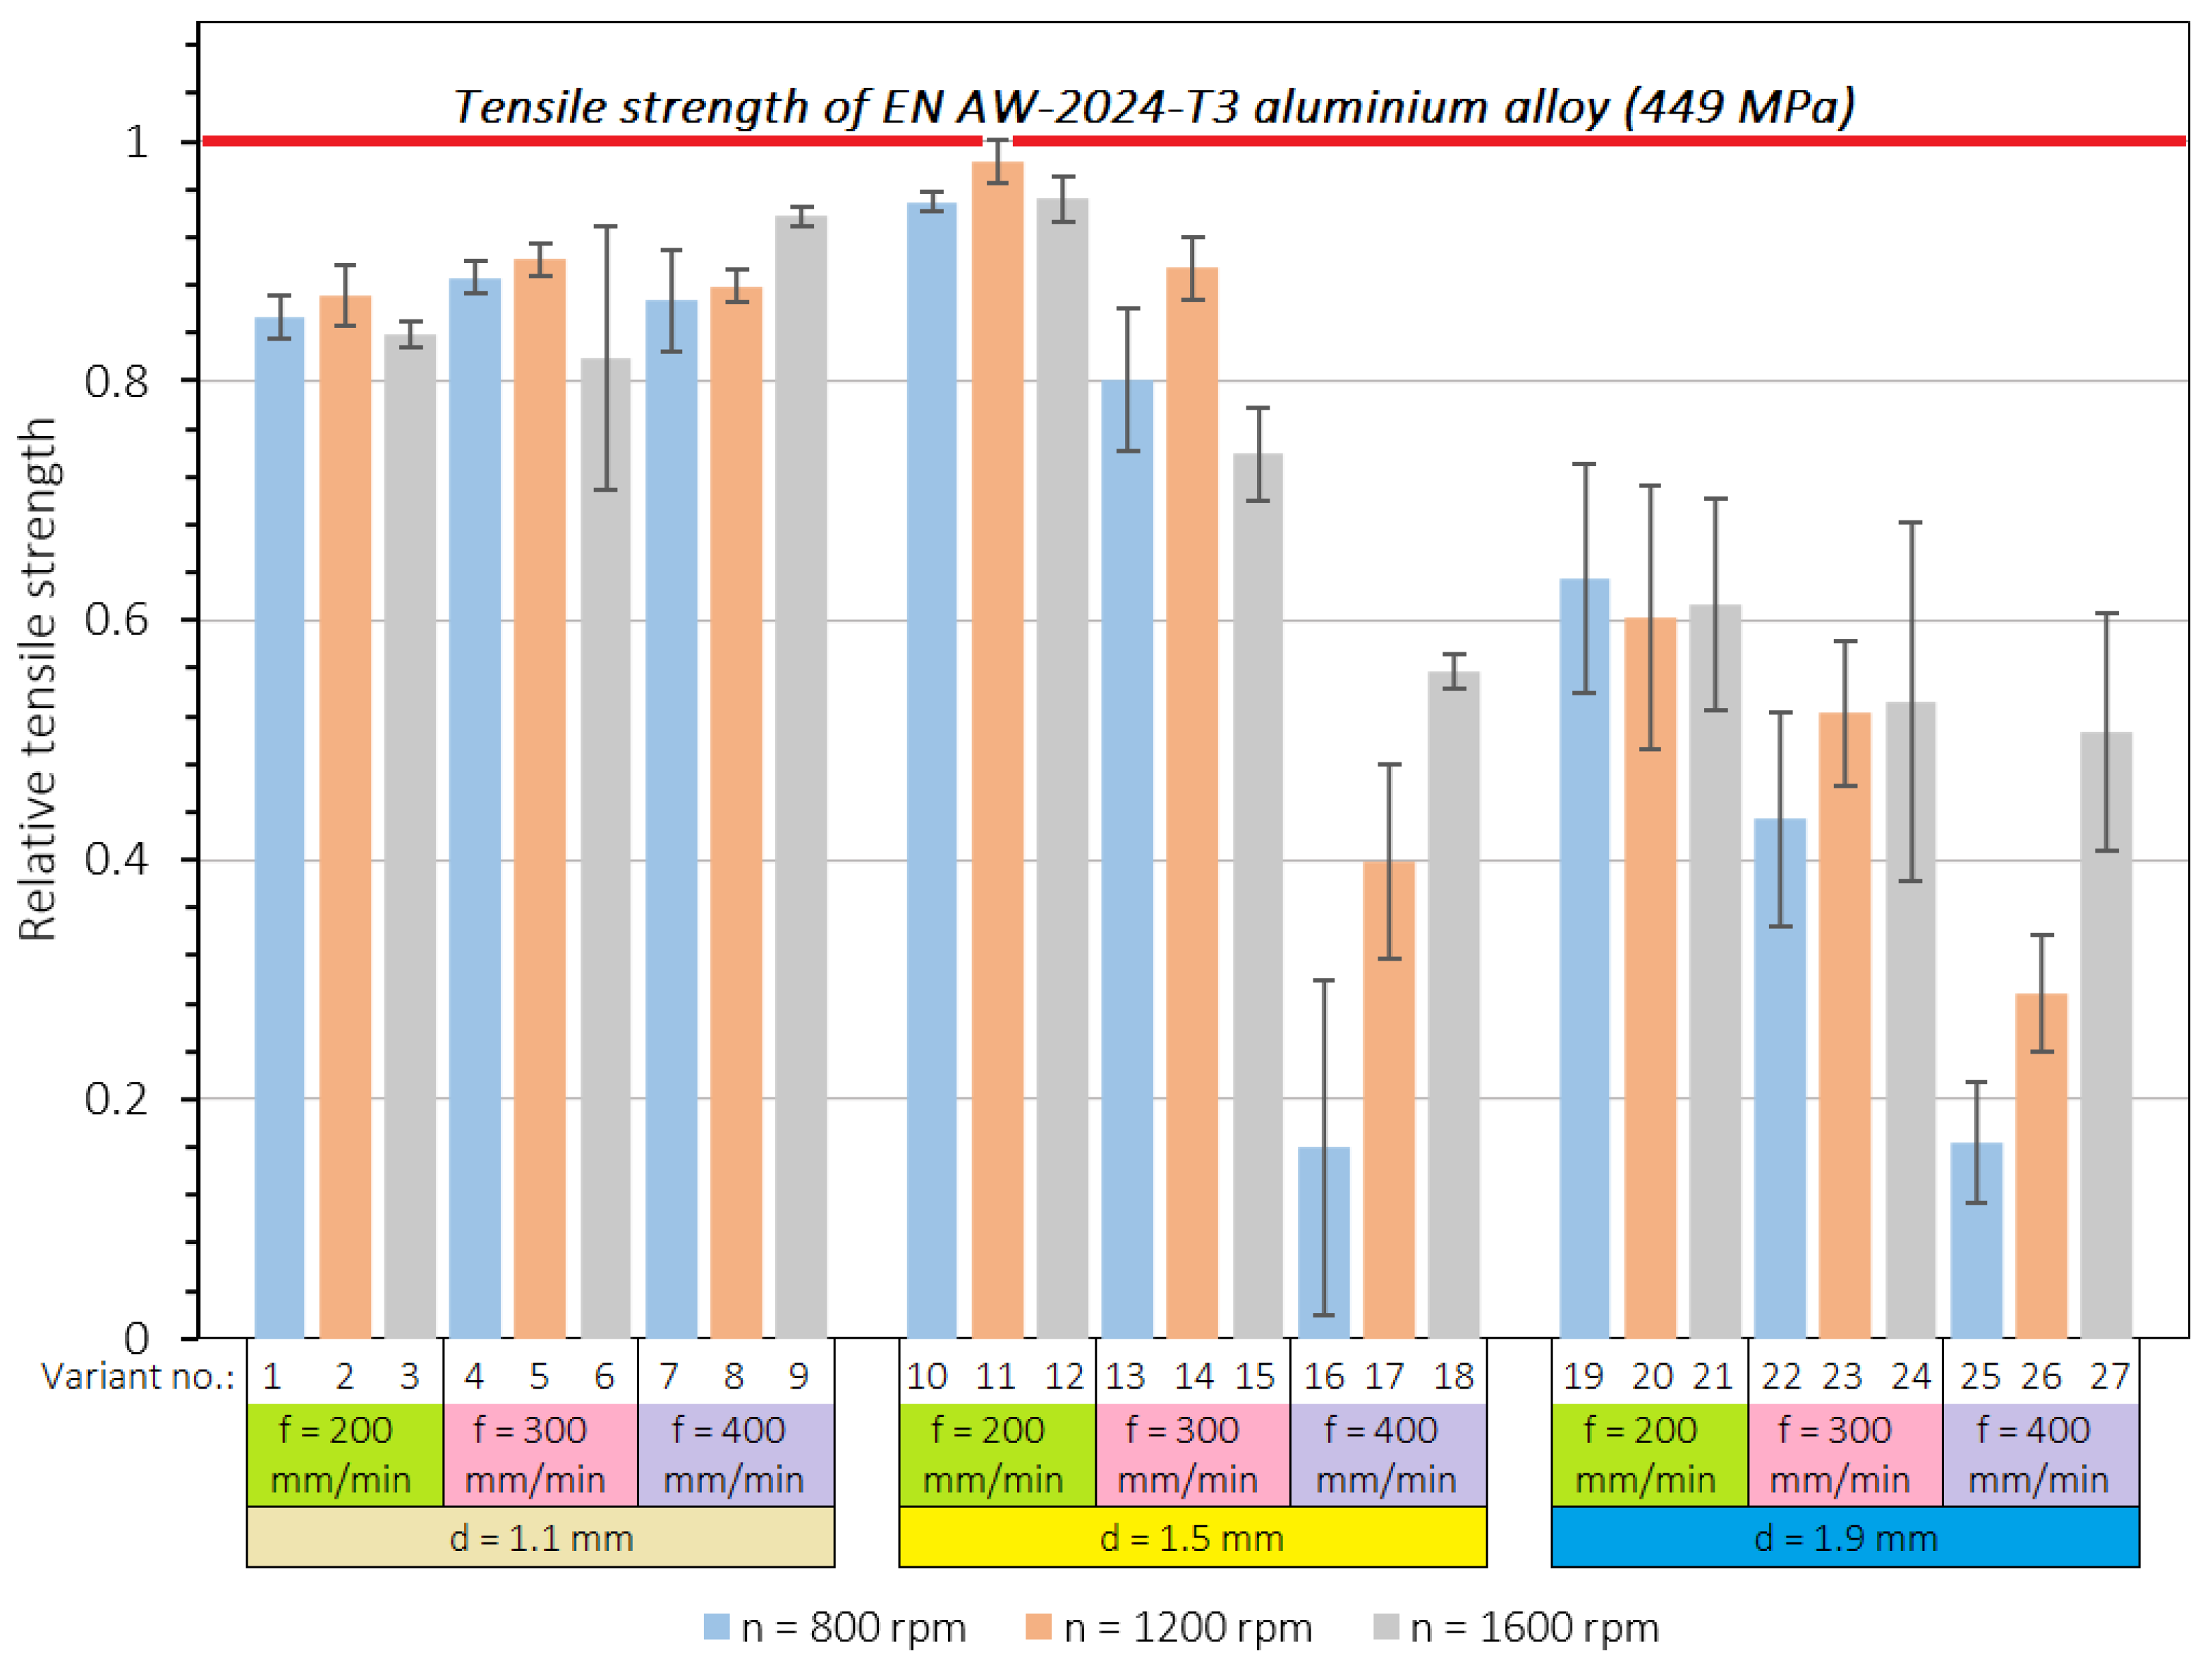
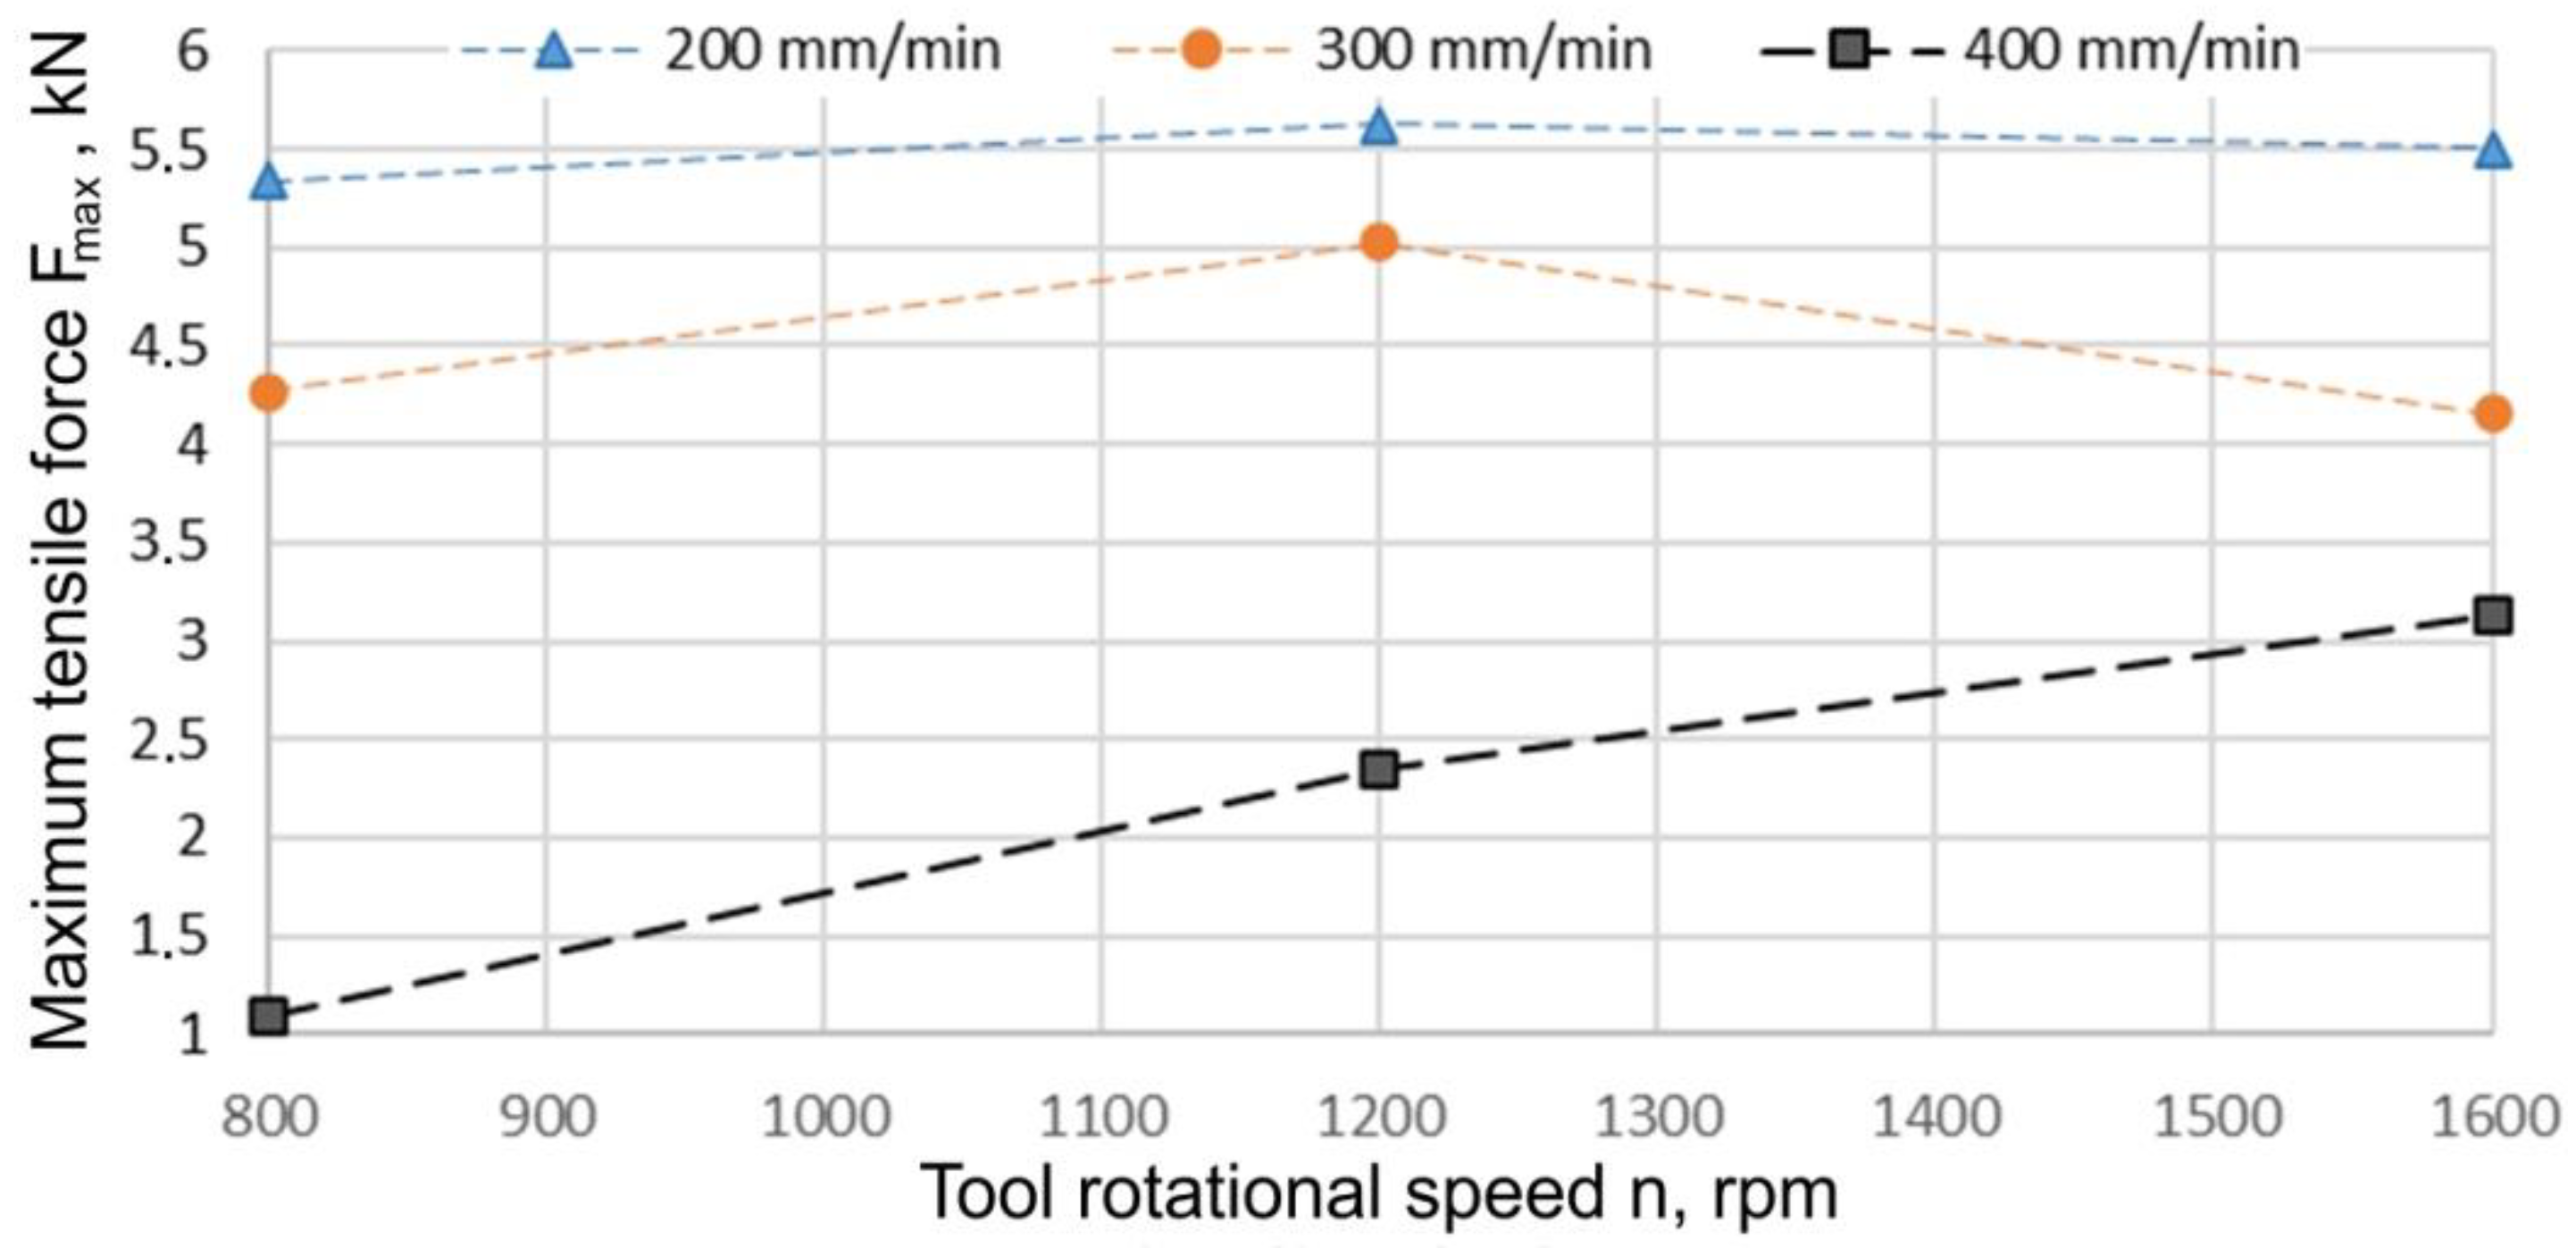
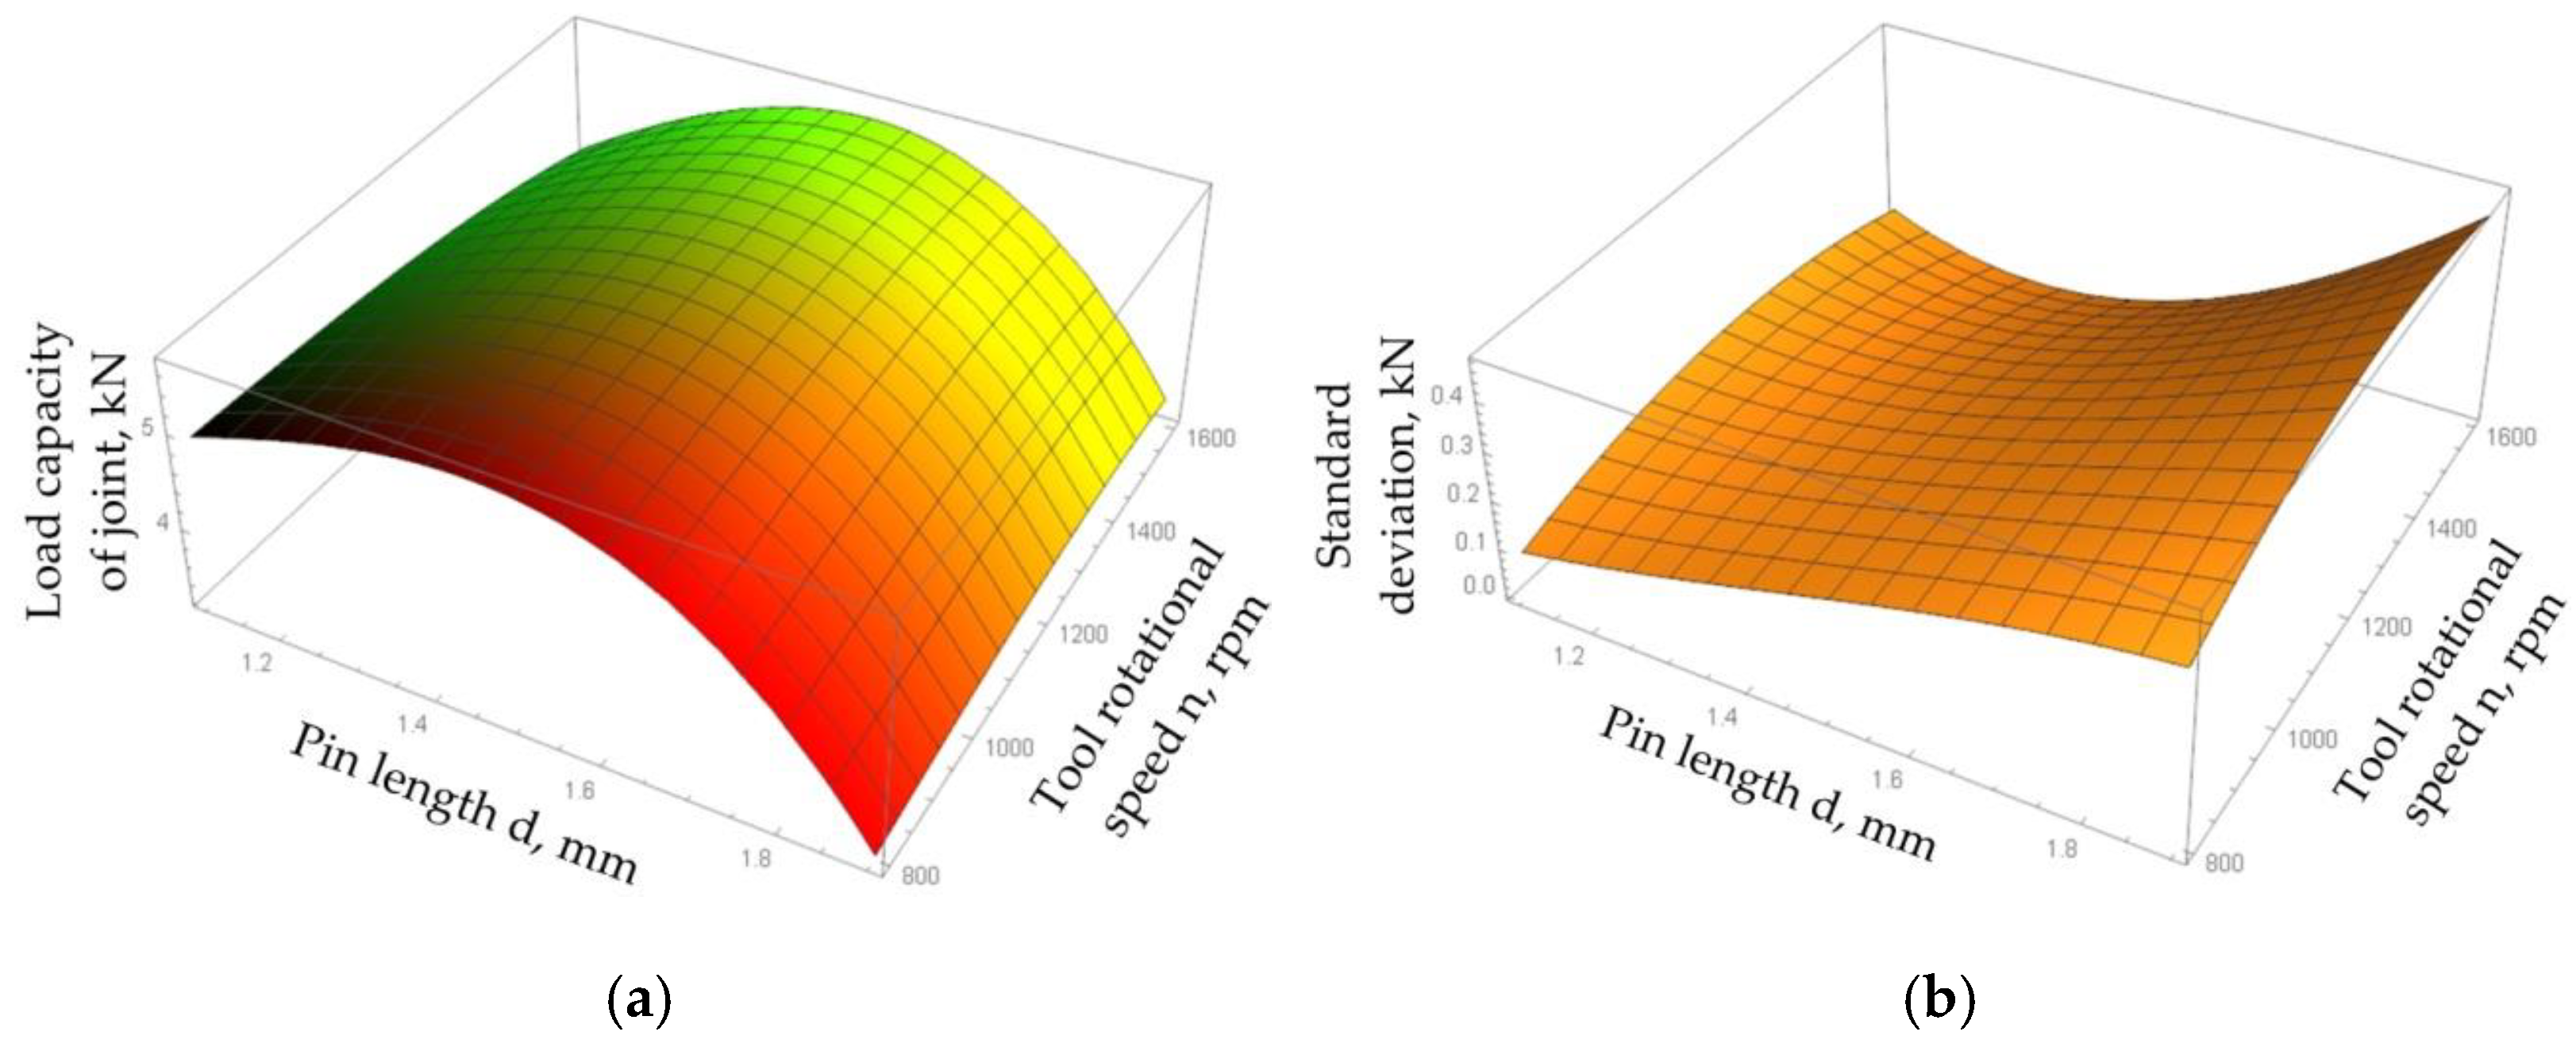
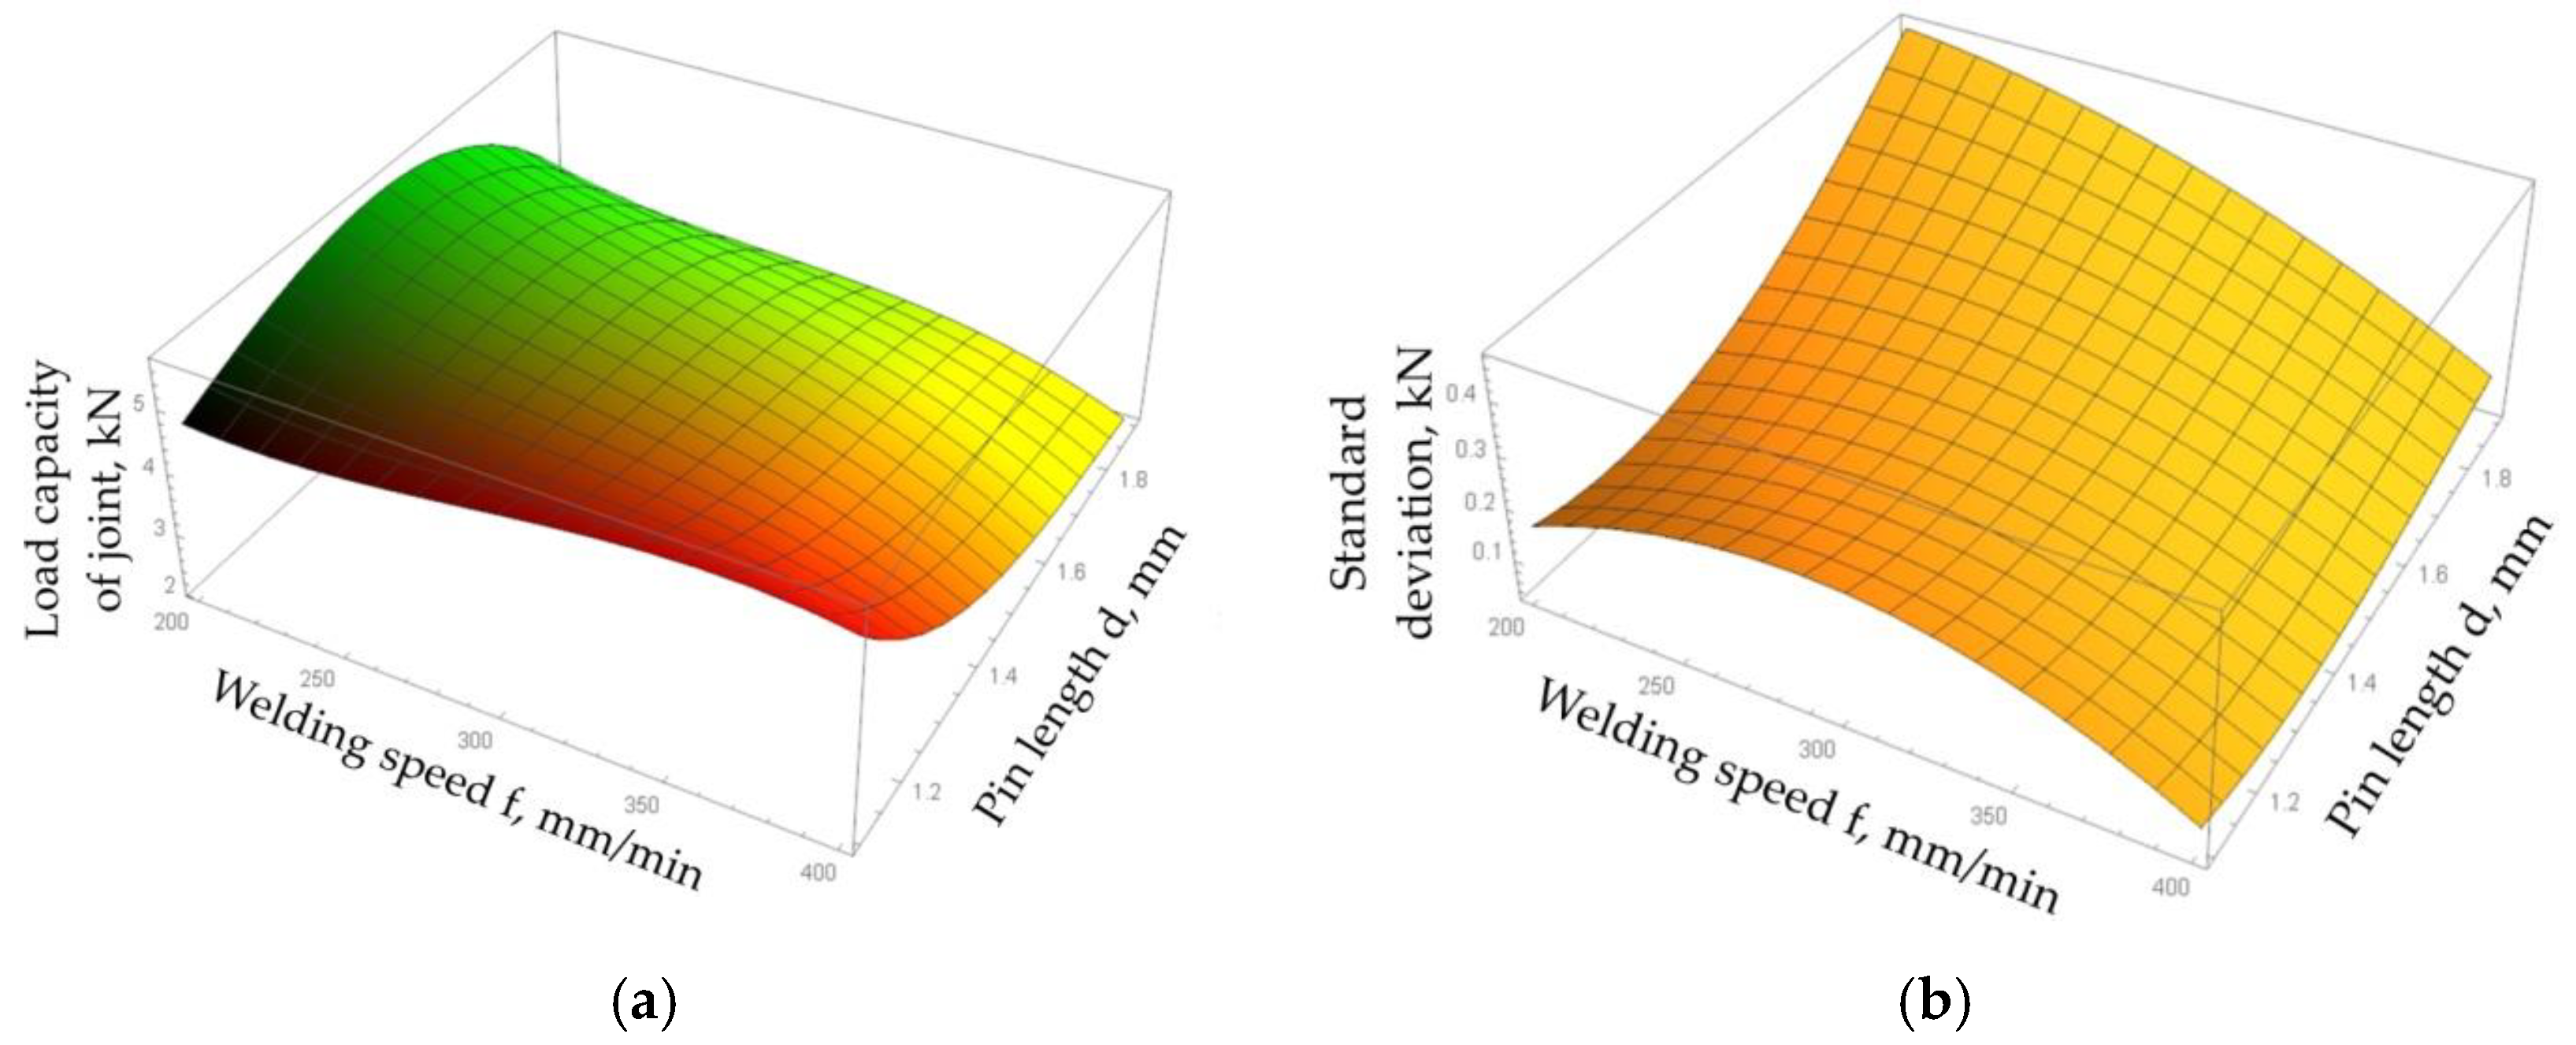
- An increase in welding speed at the value of the pin length considered caused a decrease in the load capacity of the joint as well as a significant increase in the dispersion of the results.
- Among the combinations of parameters that were considered, the lowest load capacity was found in joints made using the following parameters: pin length d = 1.5 mm, welding speed f = 400 mm/min, and tool rotational speed n = 800 rpm.
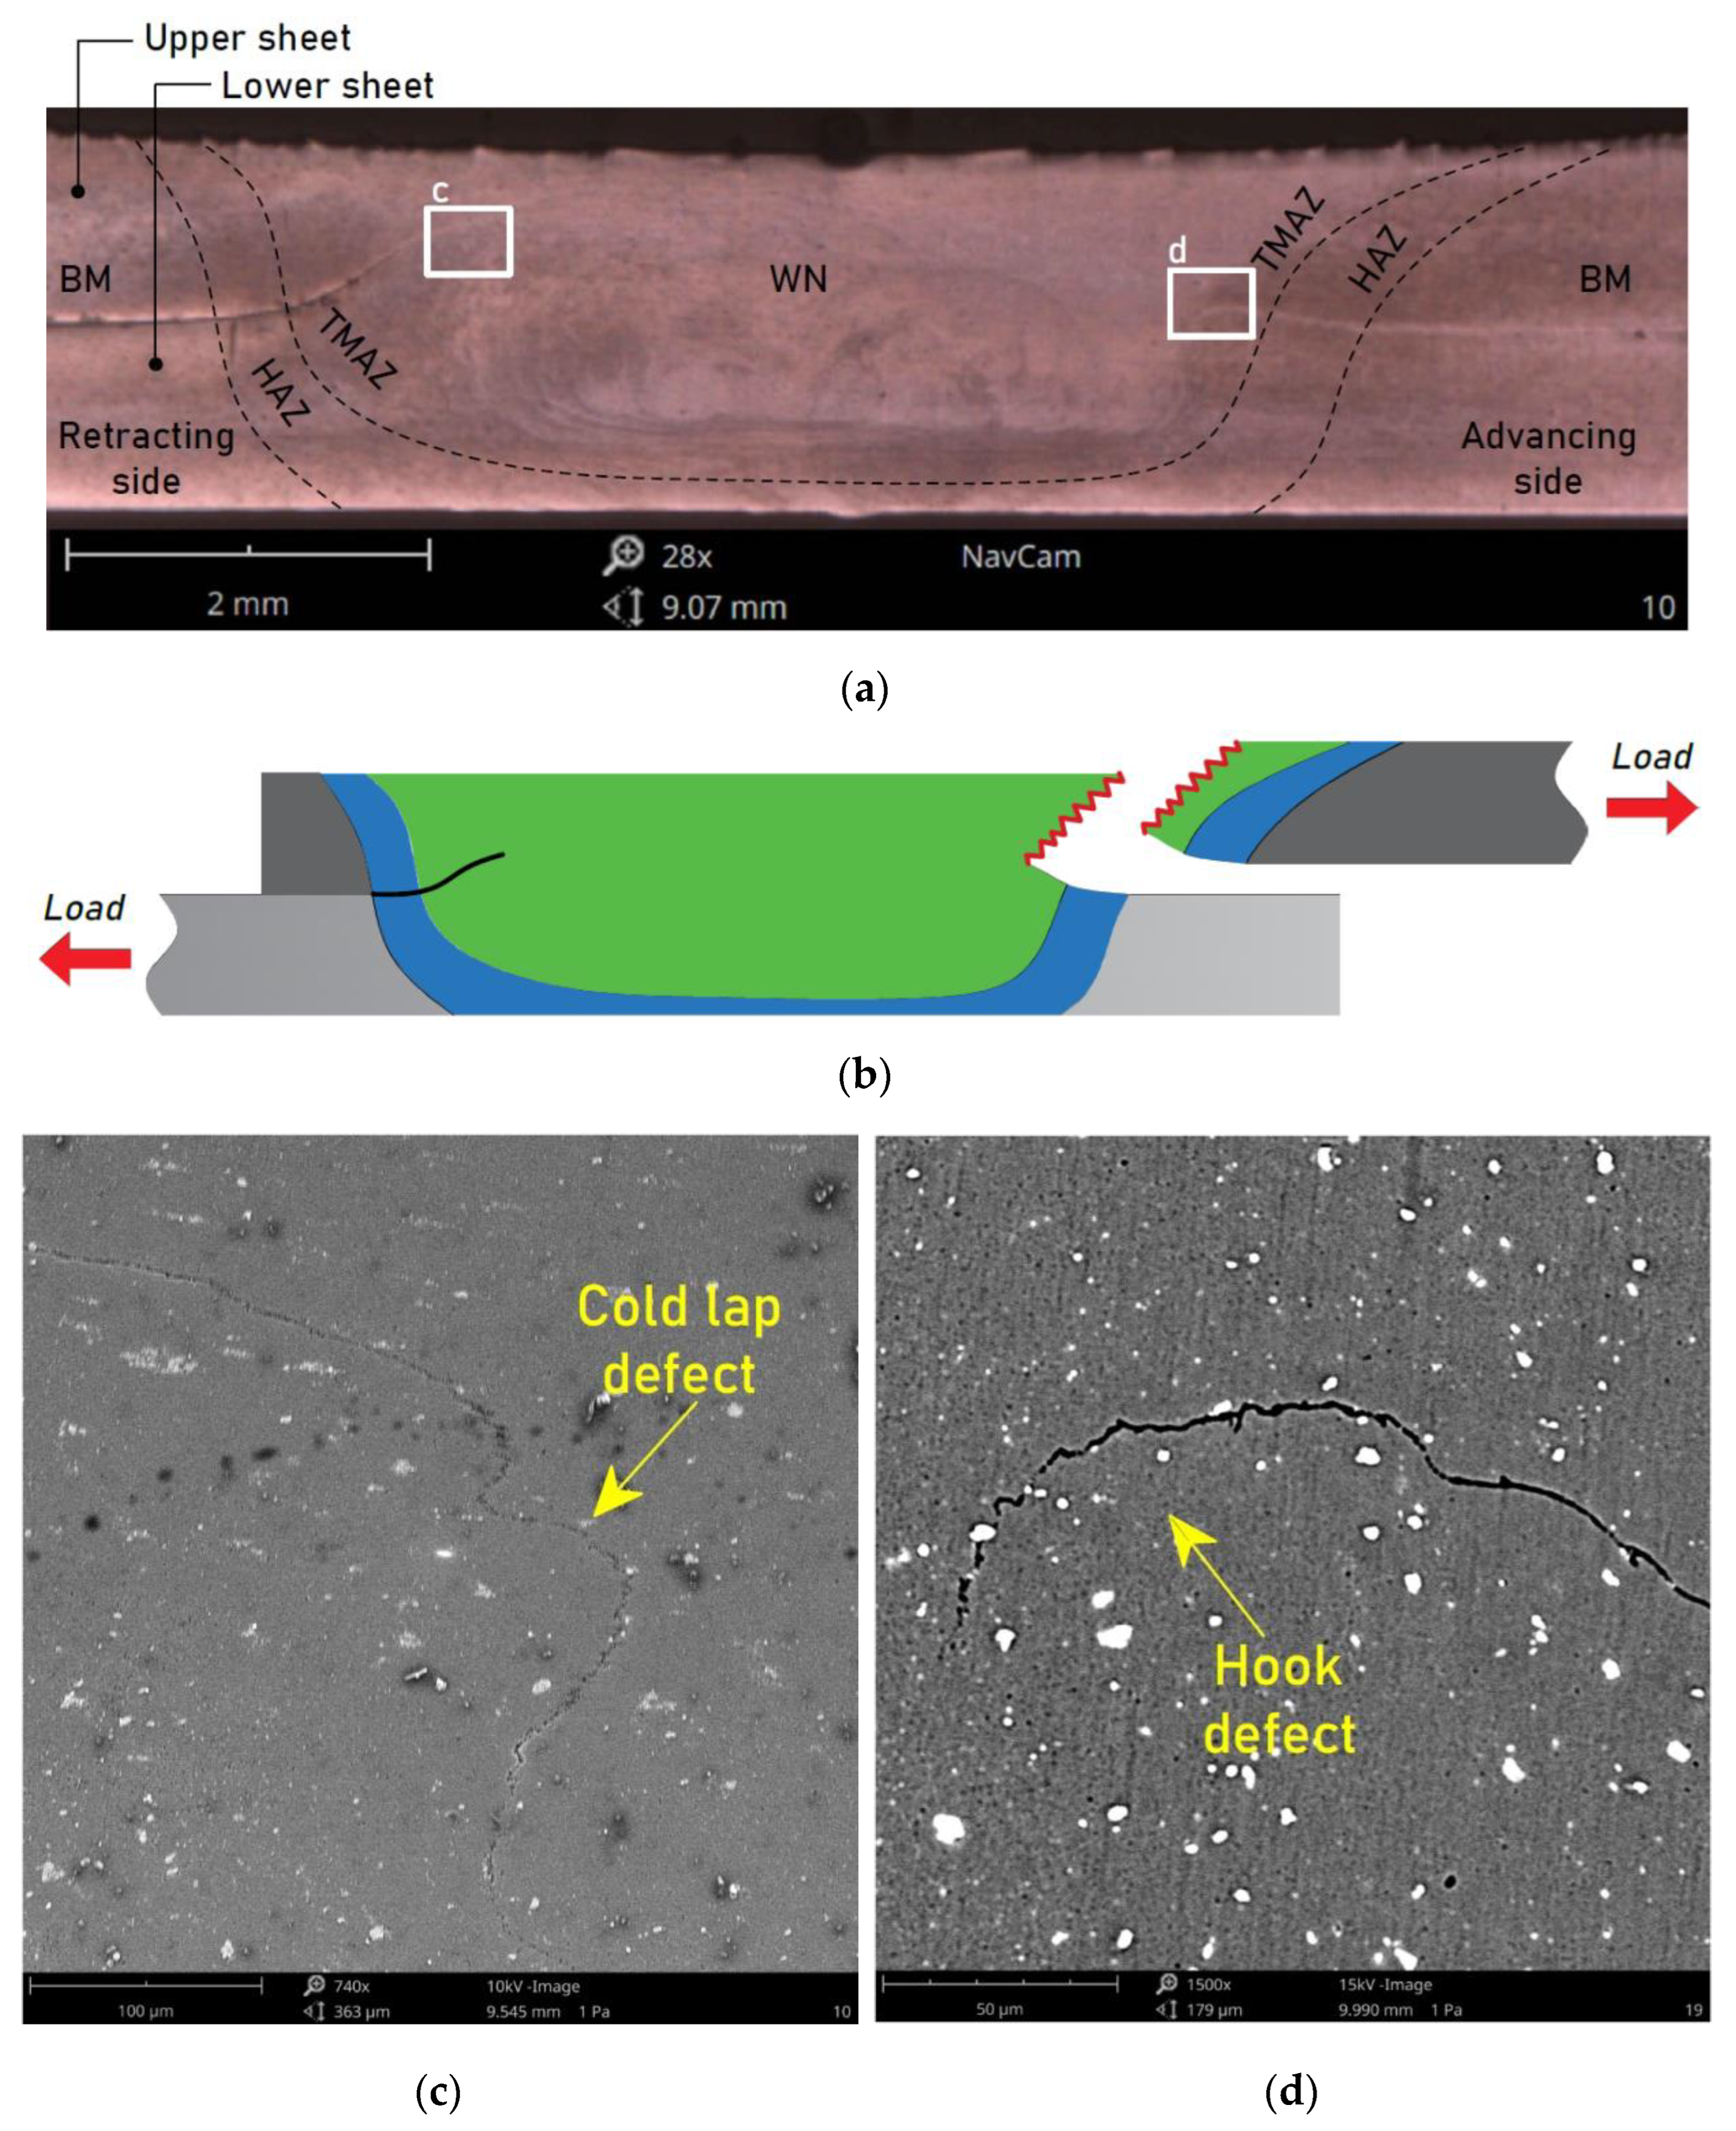
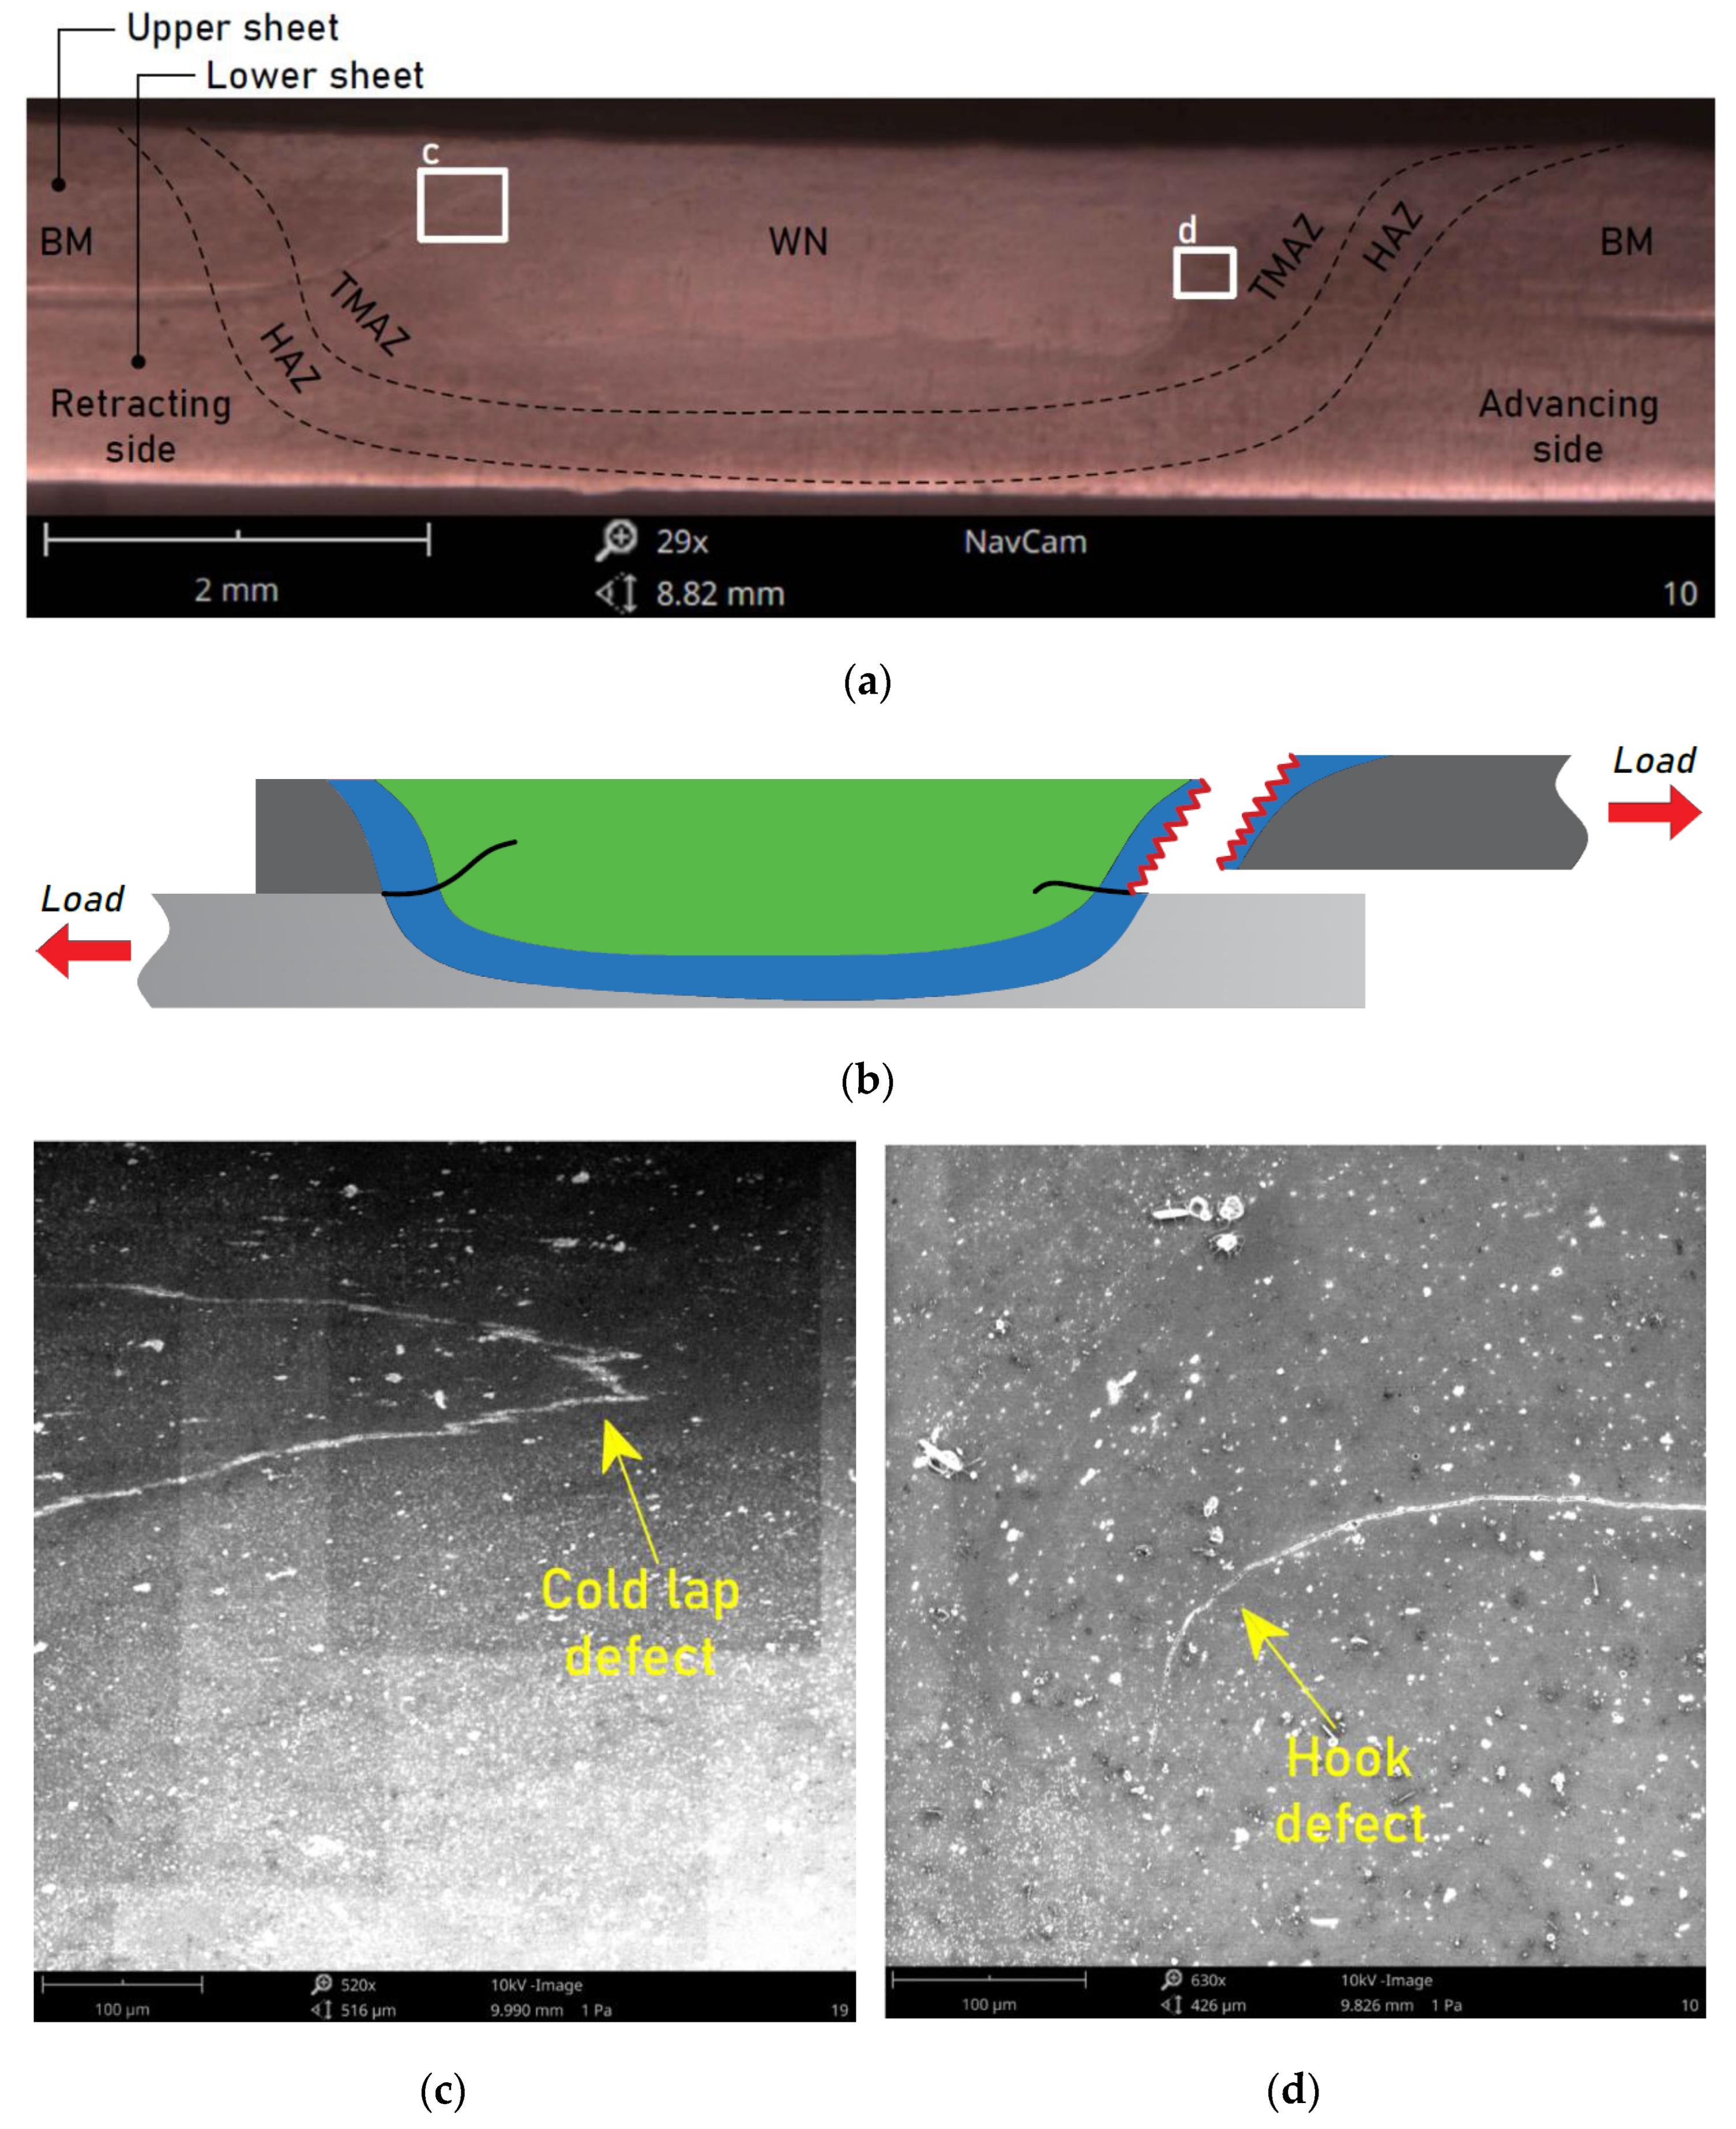
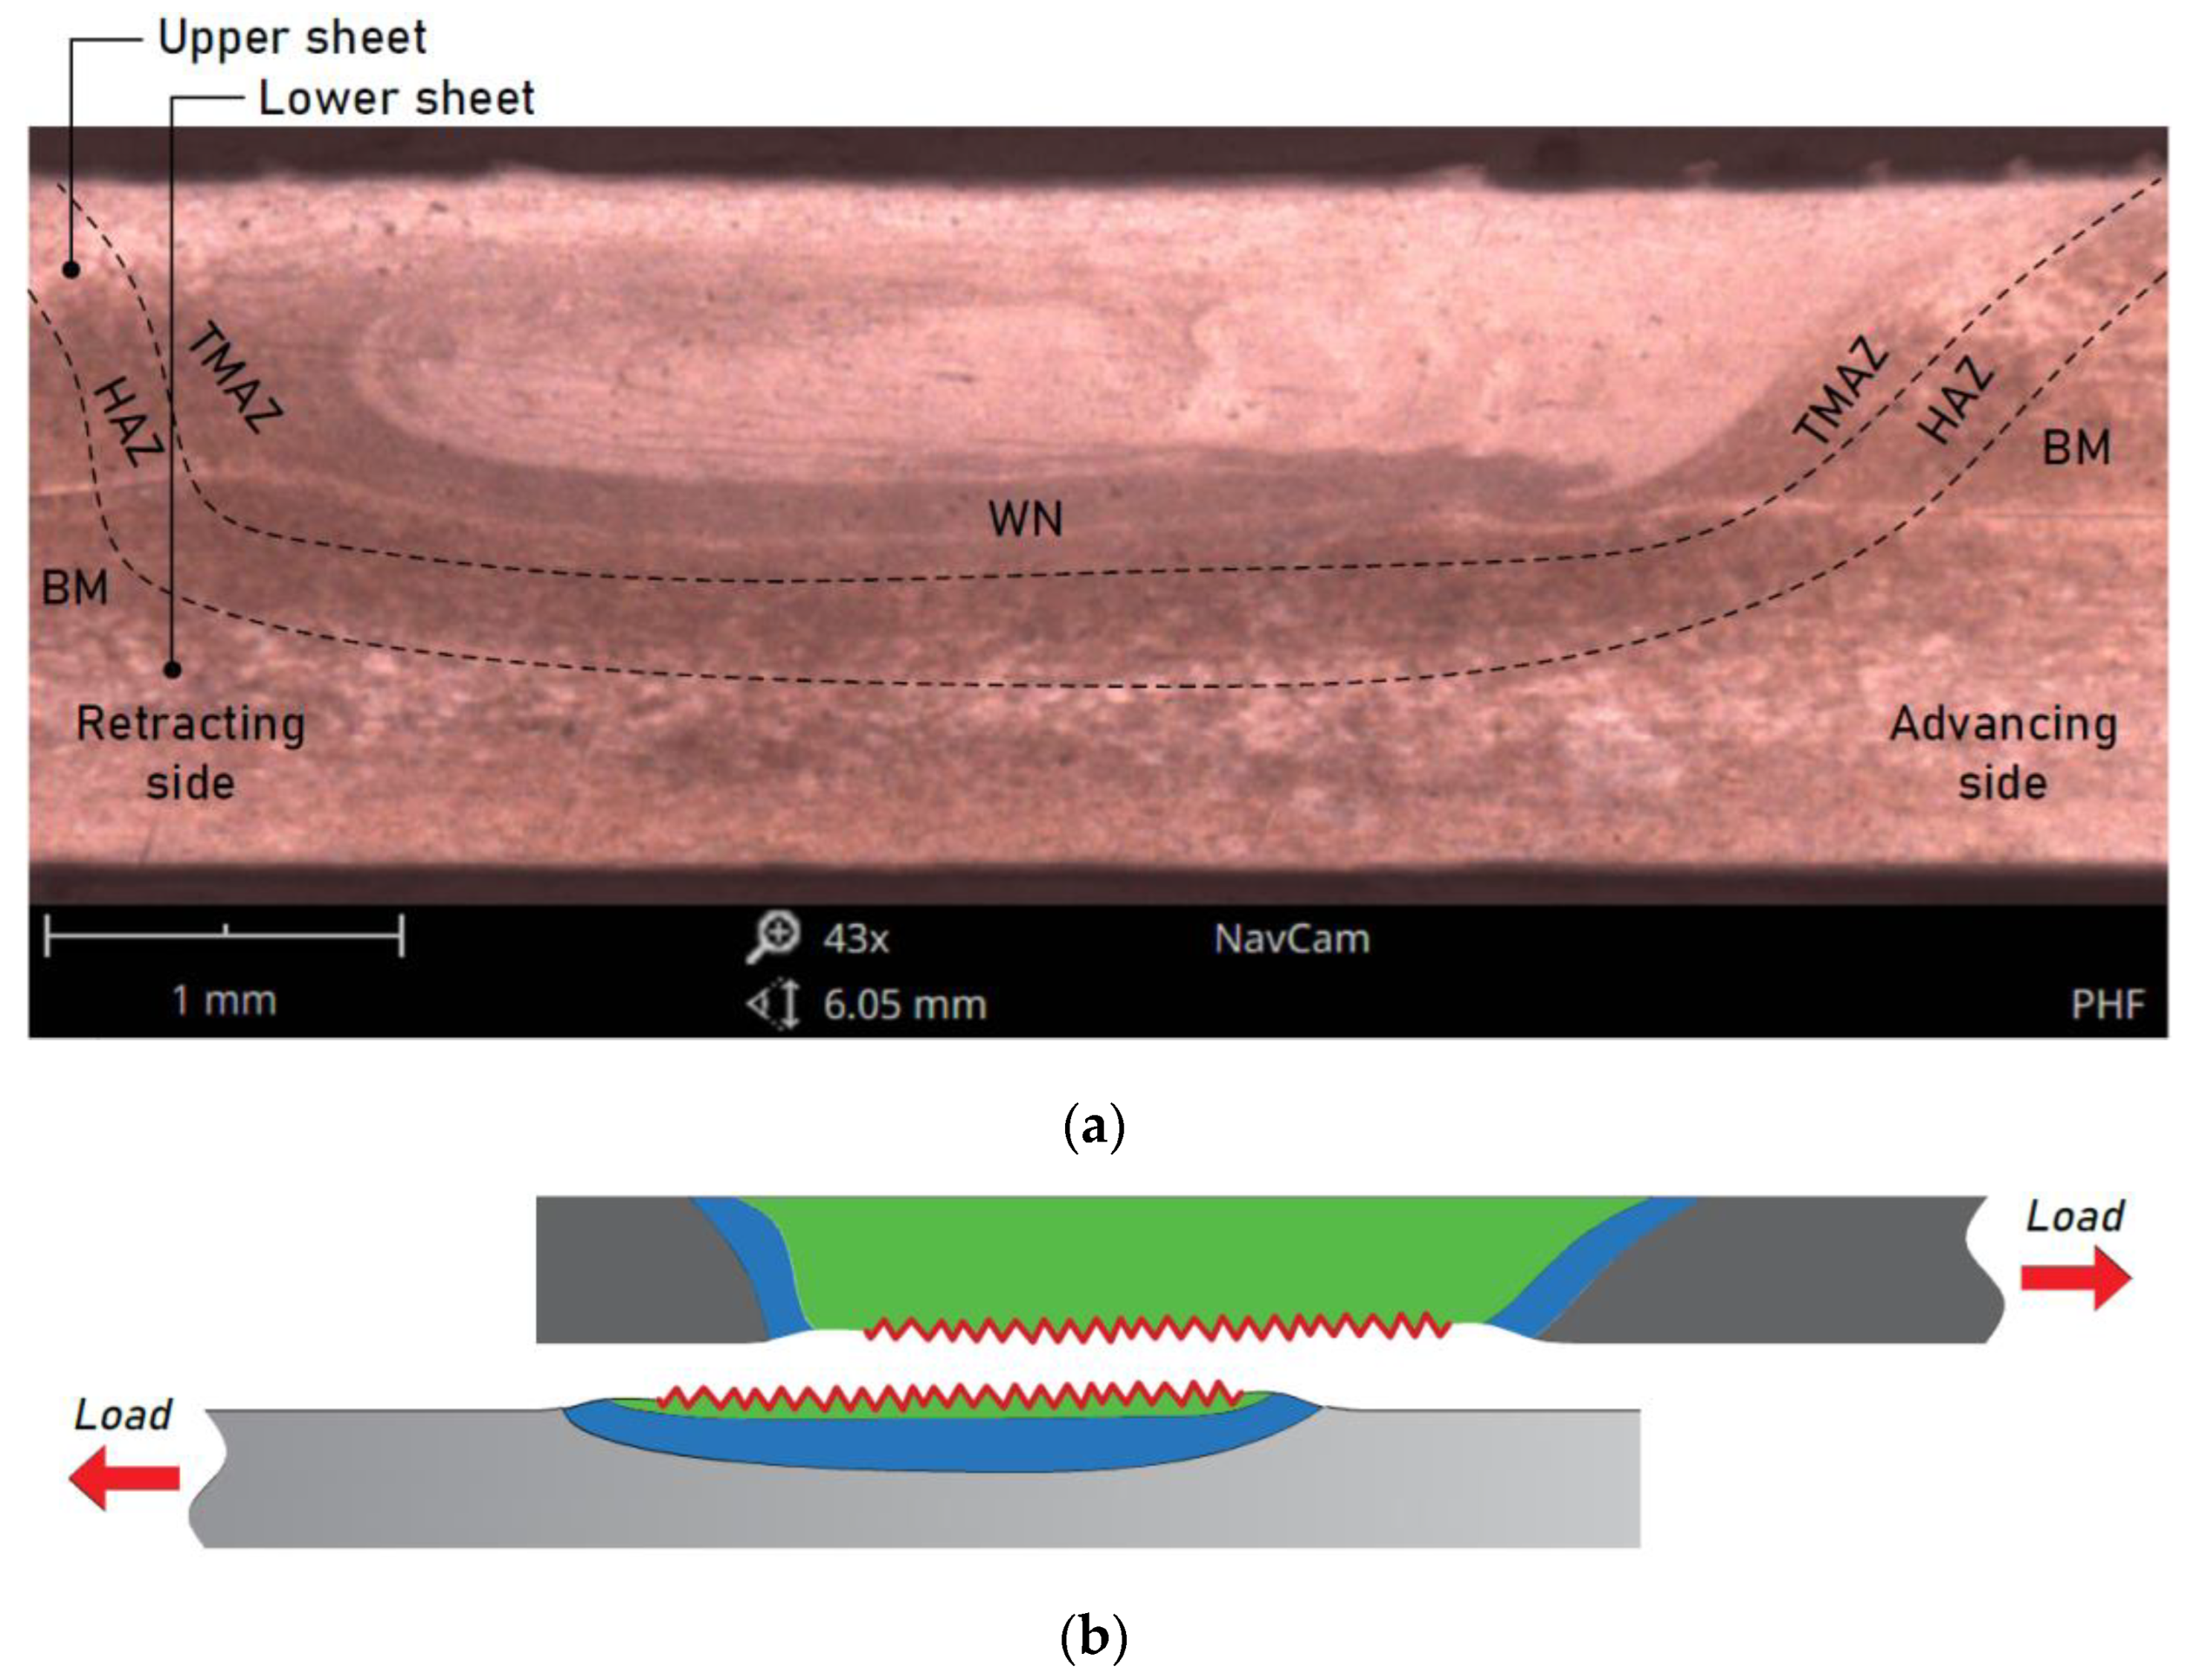
- The metallographic analysis also made it possible to identify a typical defect for FSW joints, namely a cold lap defect on the retracting side of the weld. As in the case of the hook defect, there was no metallic continuity in the cold lap area.
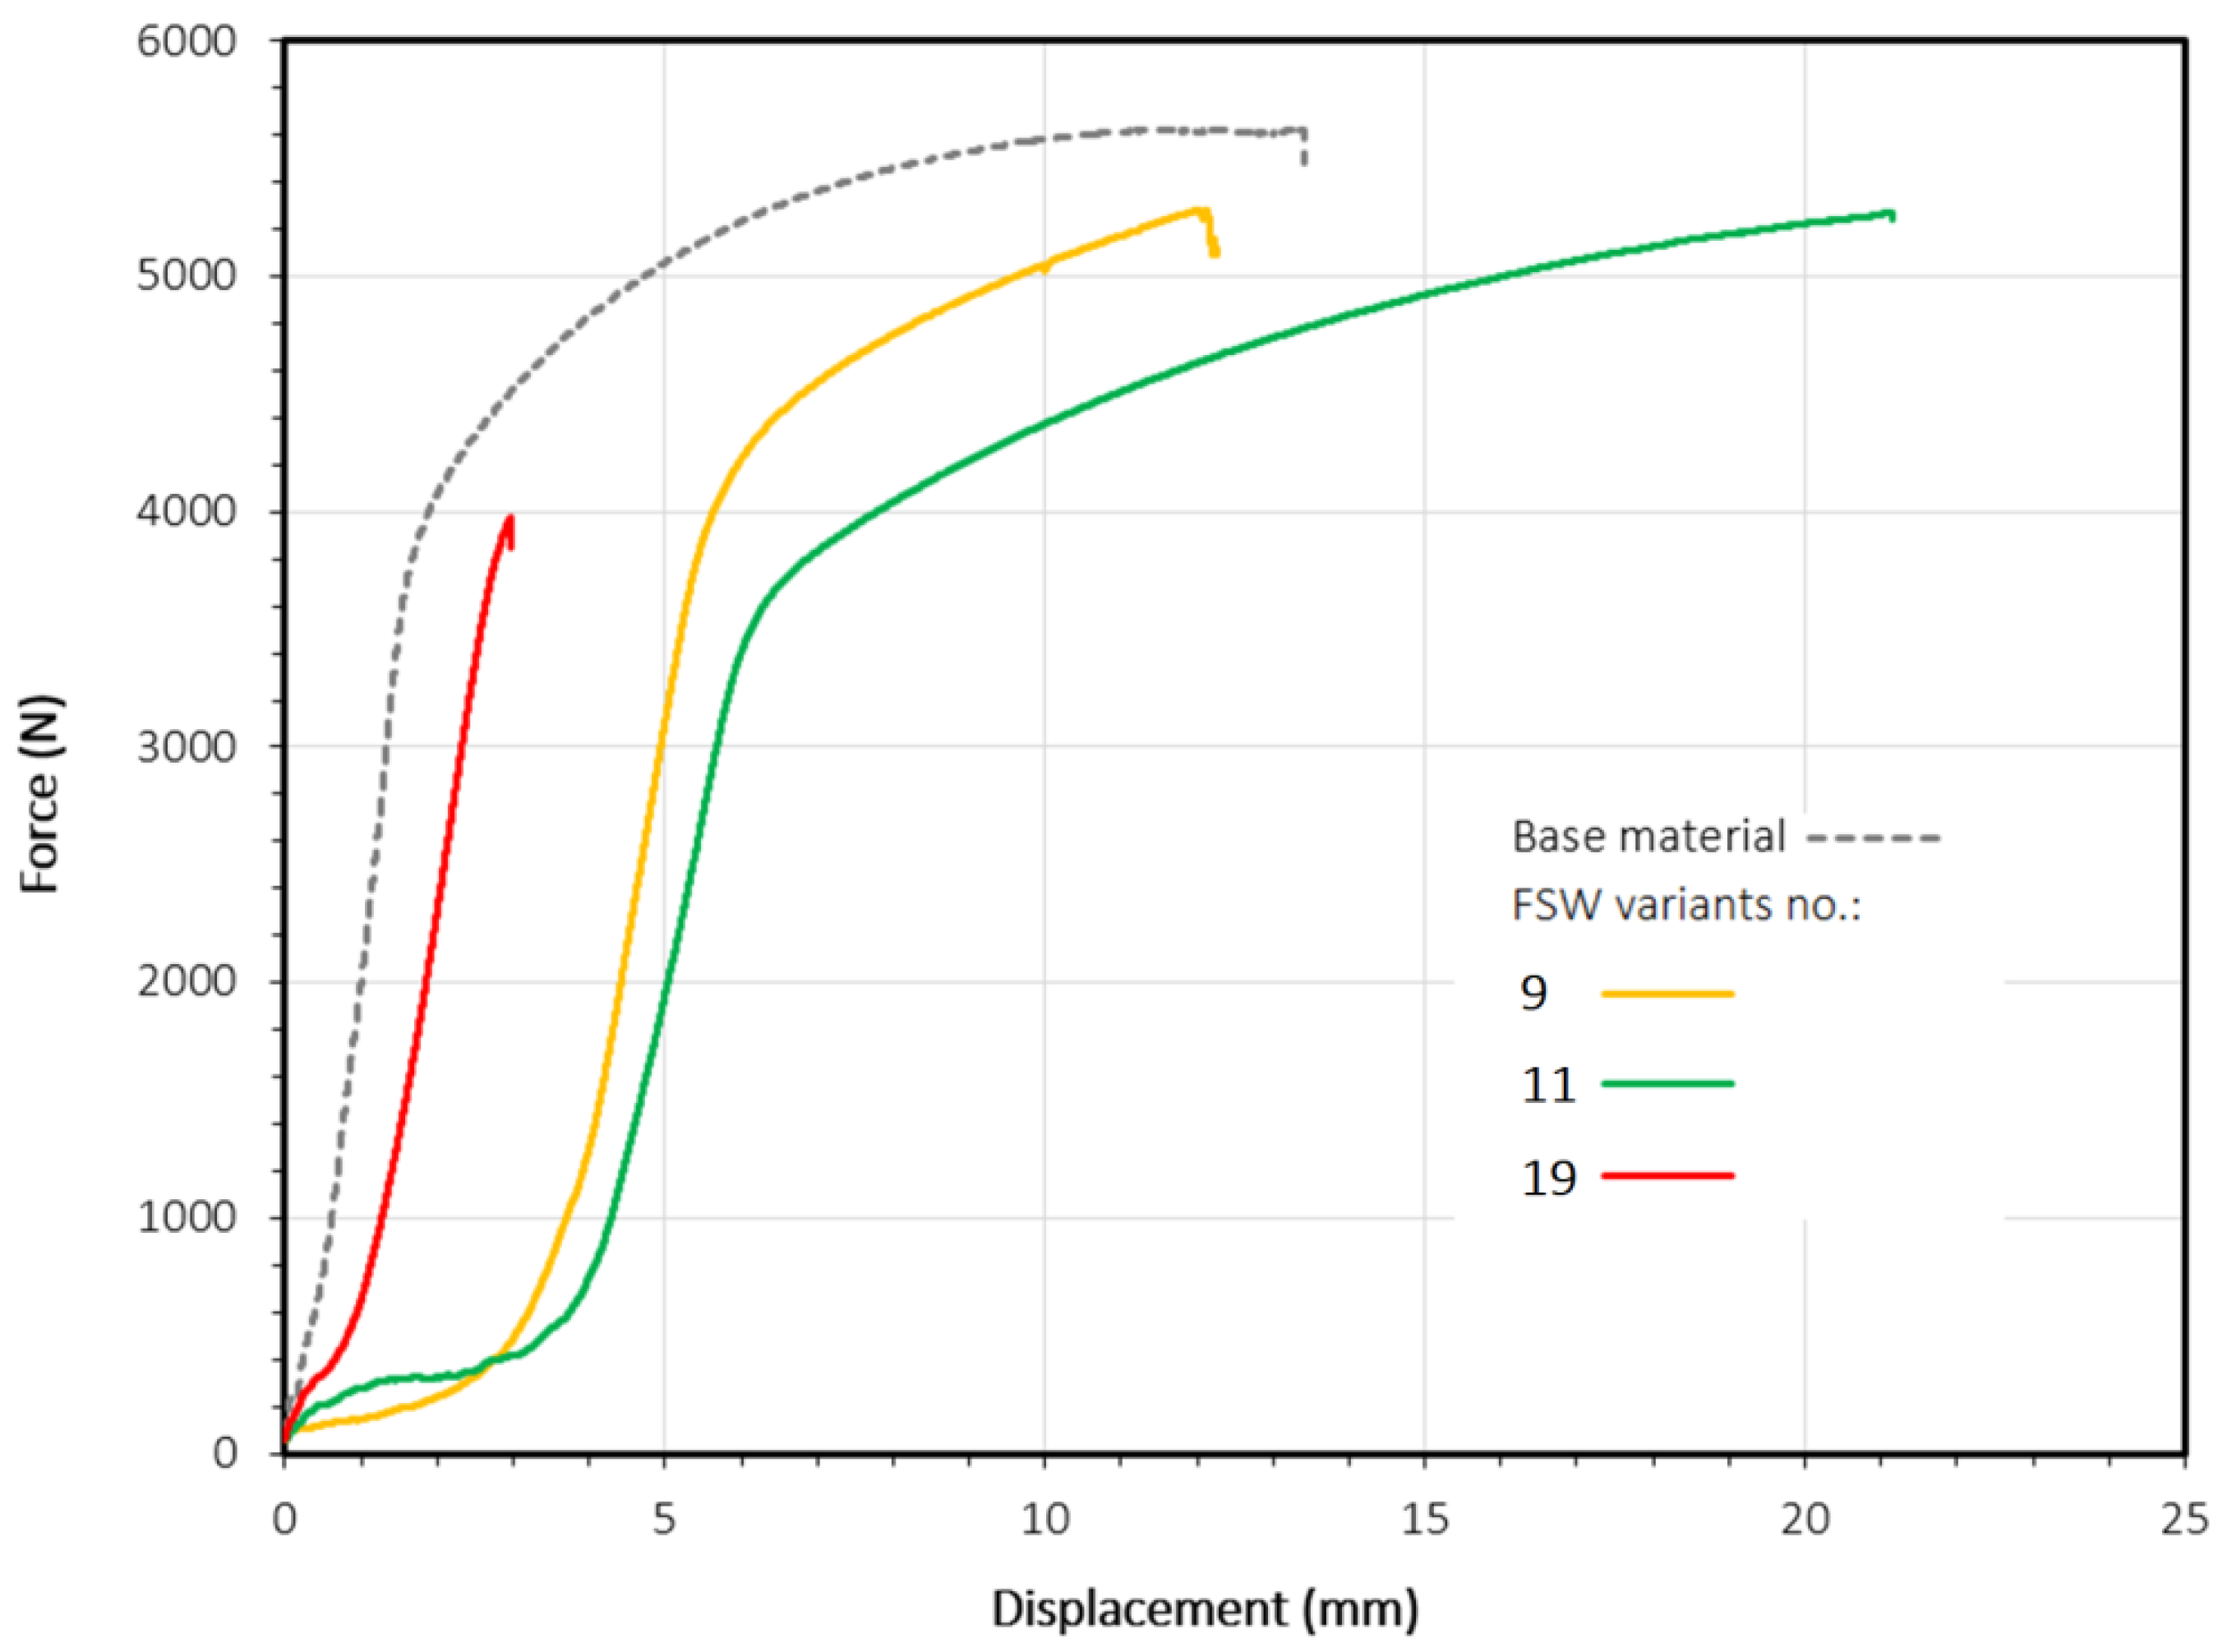
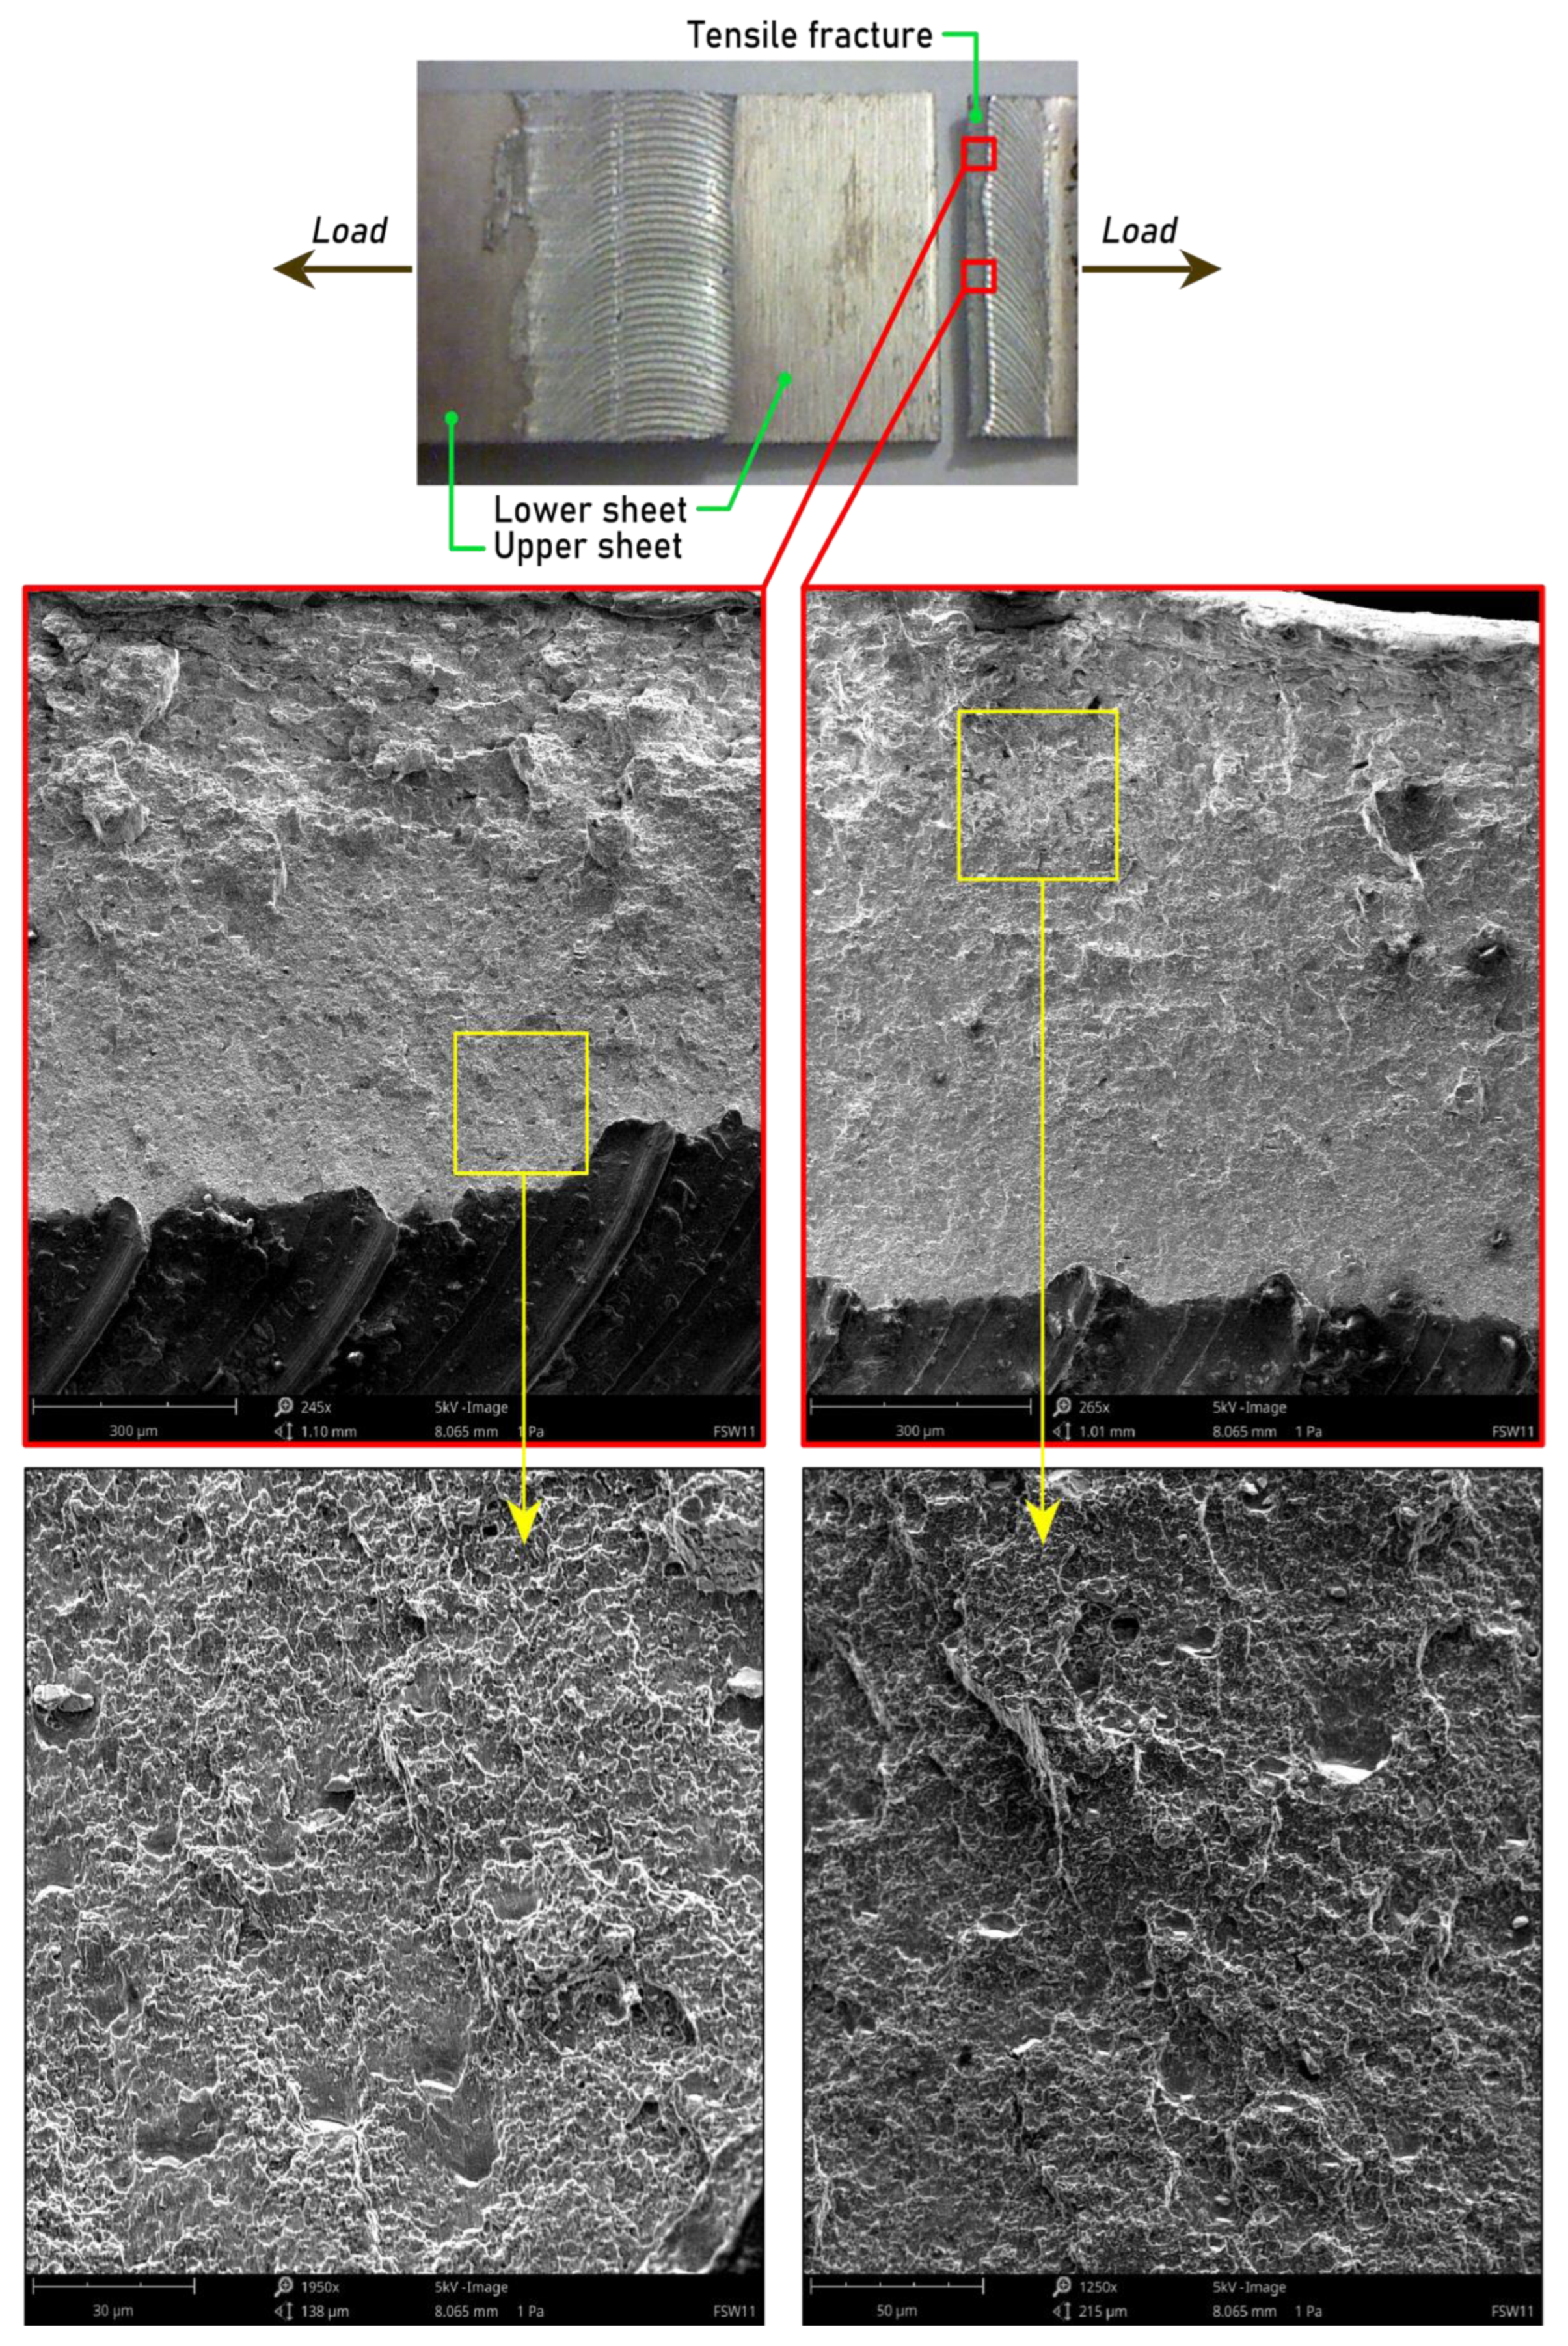
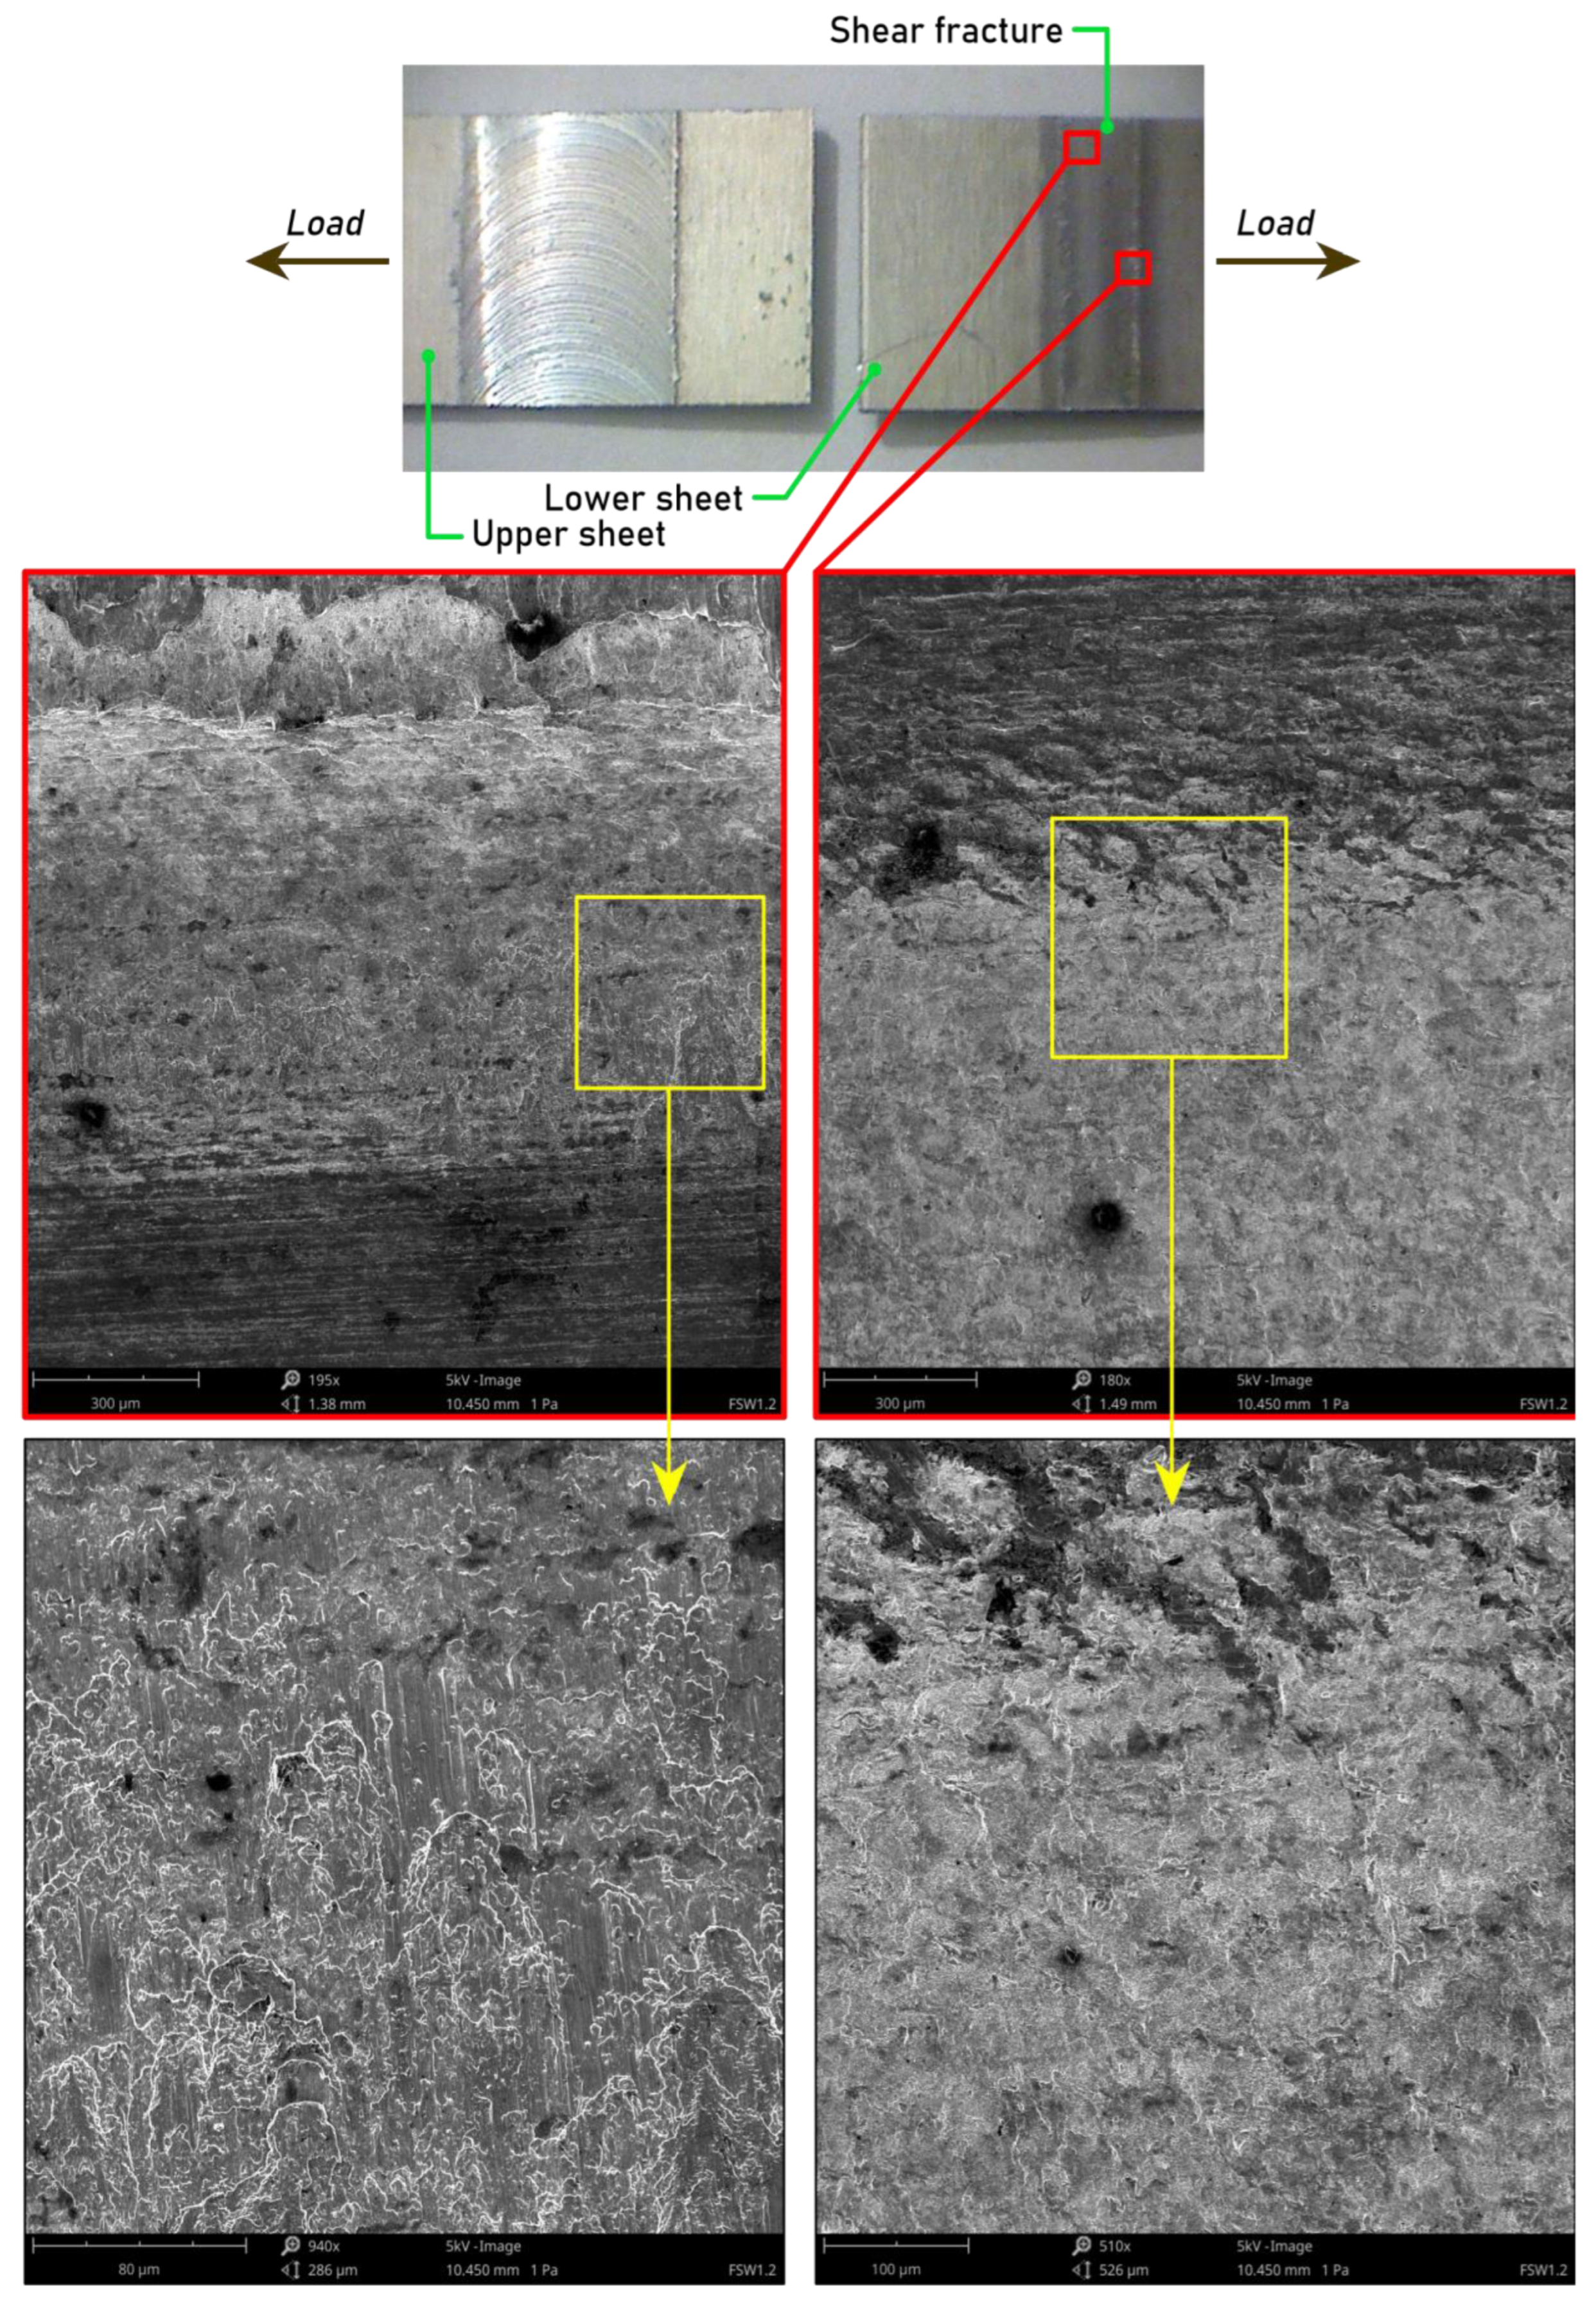
- The shear failure mode was the most frequently observed mechanism of the destruction of joints made at the smallest pin length that was considered (d = 1.1 mm).
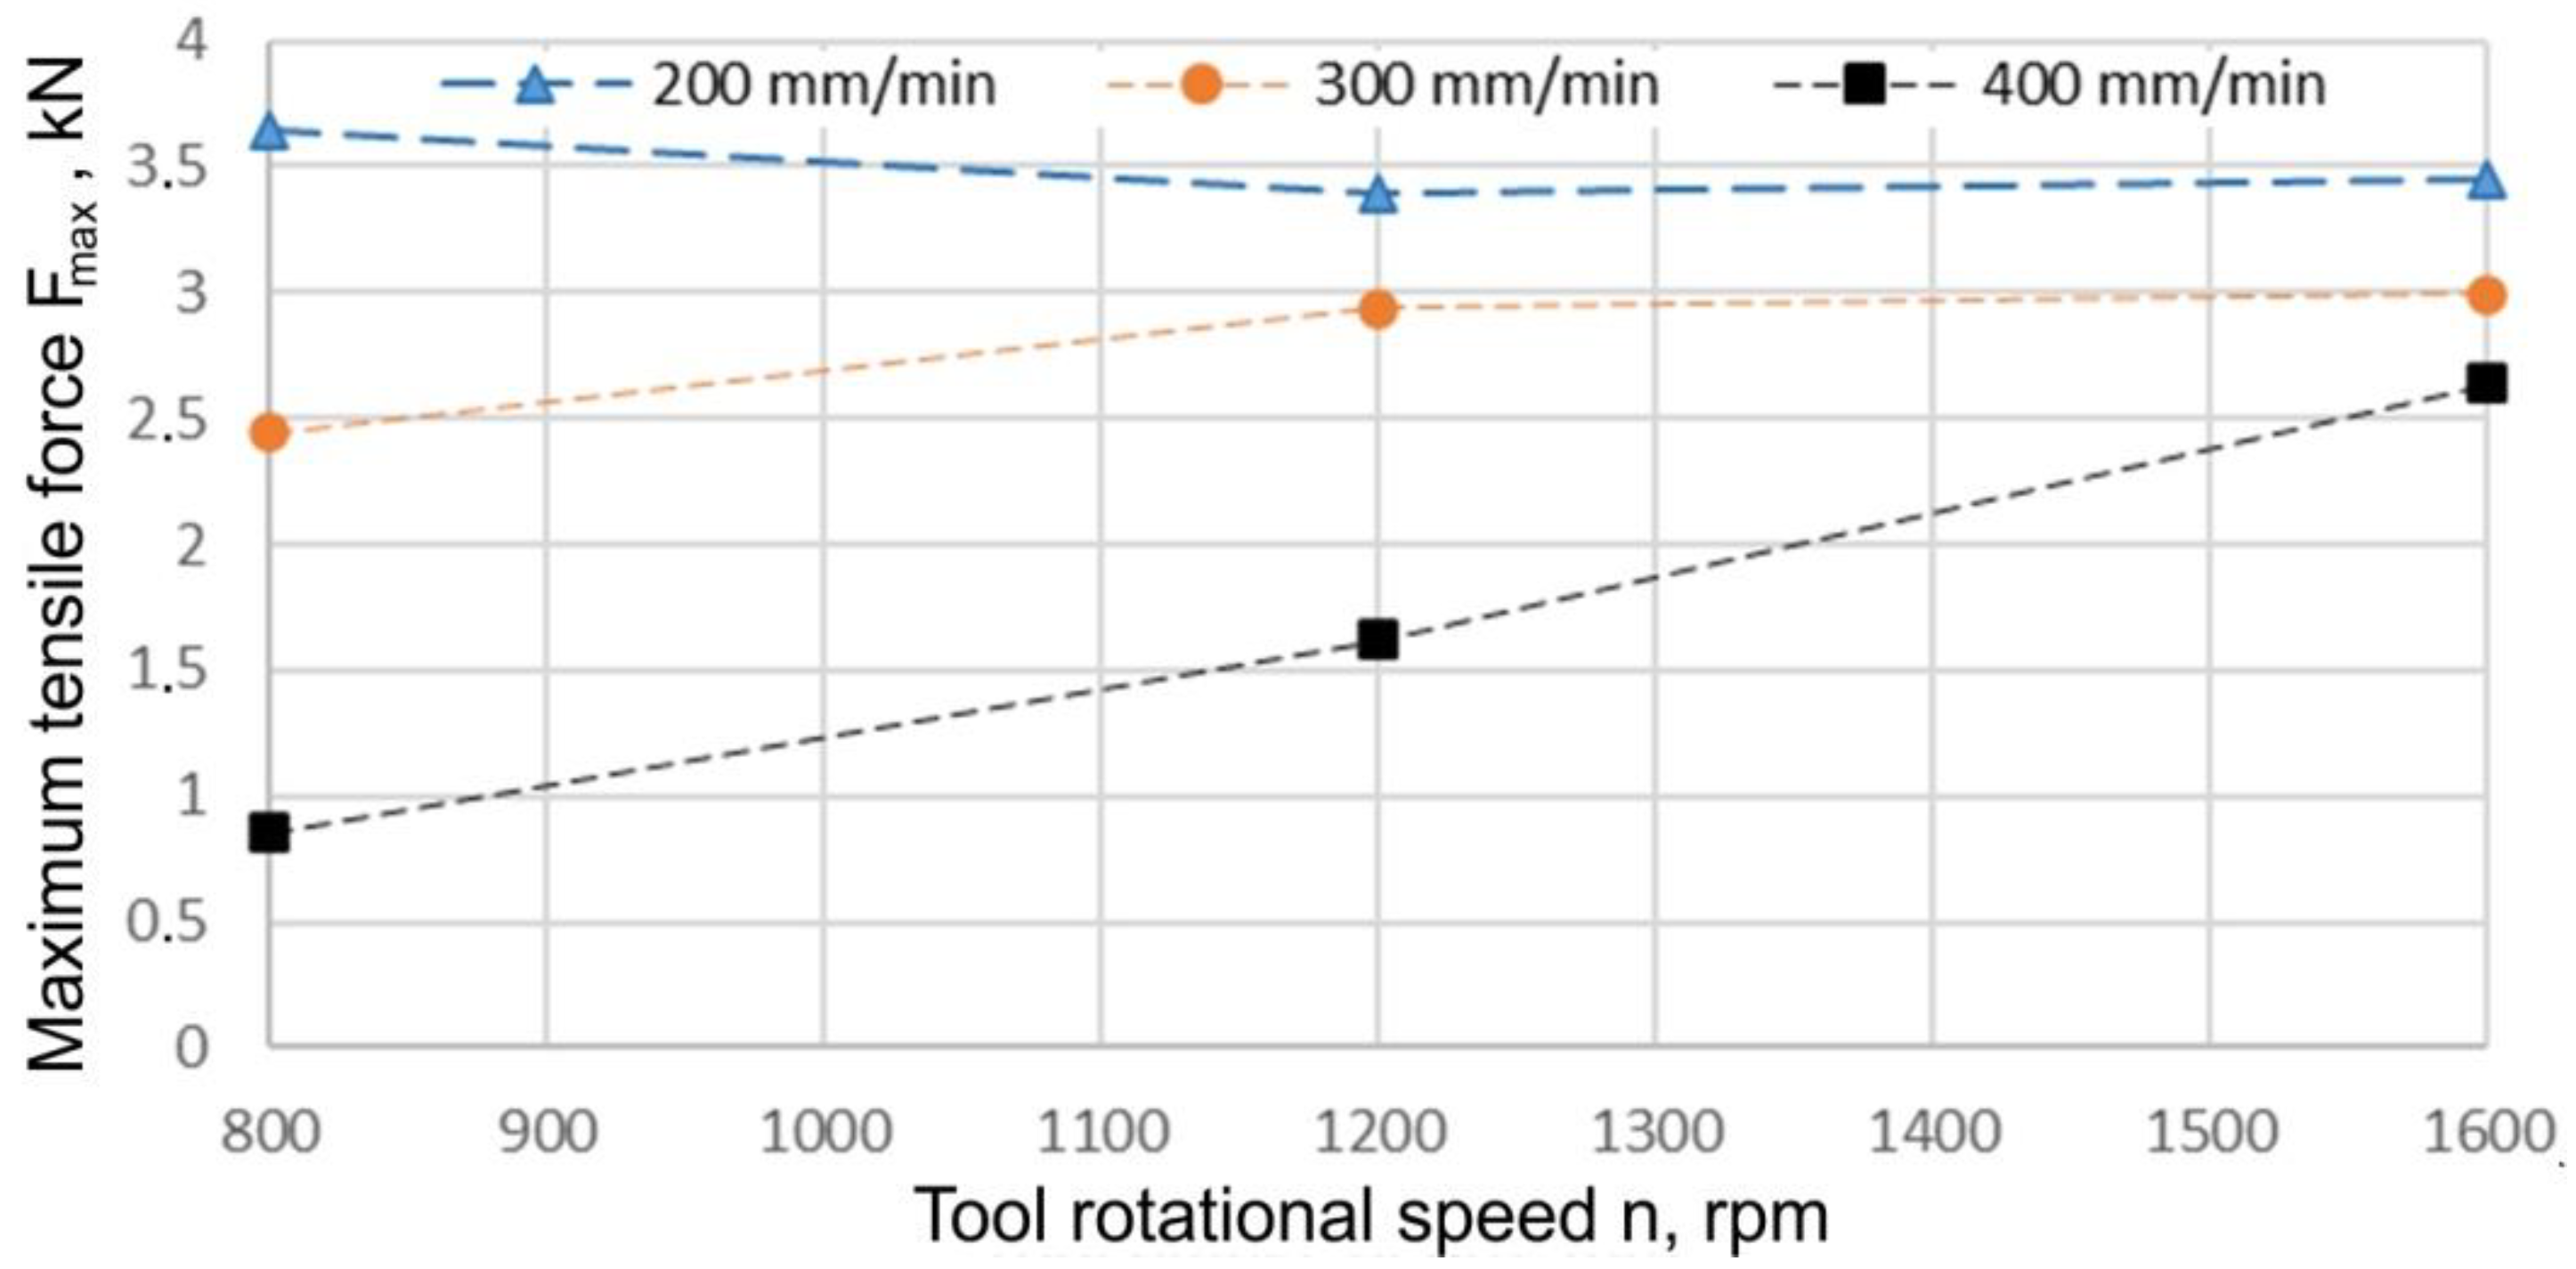
- Regardless of the tool rotational speed adopted, the highest strength of the joint was observed for the pin length d = 1.5 mm. After this value was exceeded, all the characteristics showed a trend of decreasing joint strength with increasing pin length.
- For the joints processed with a welding speed of 400 mm/min, the load capacity of the joint increased with the increasing tool rotational speed.
- At lower values of tool rotational speed, the standard deviation of the process increased with an increase in pin length.
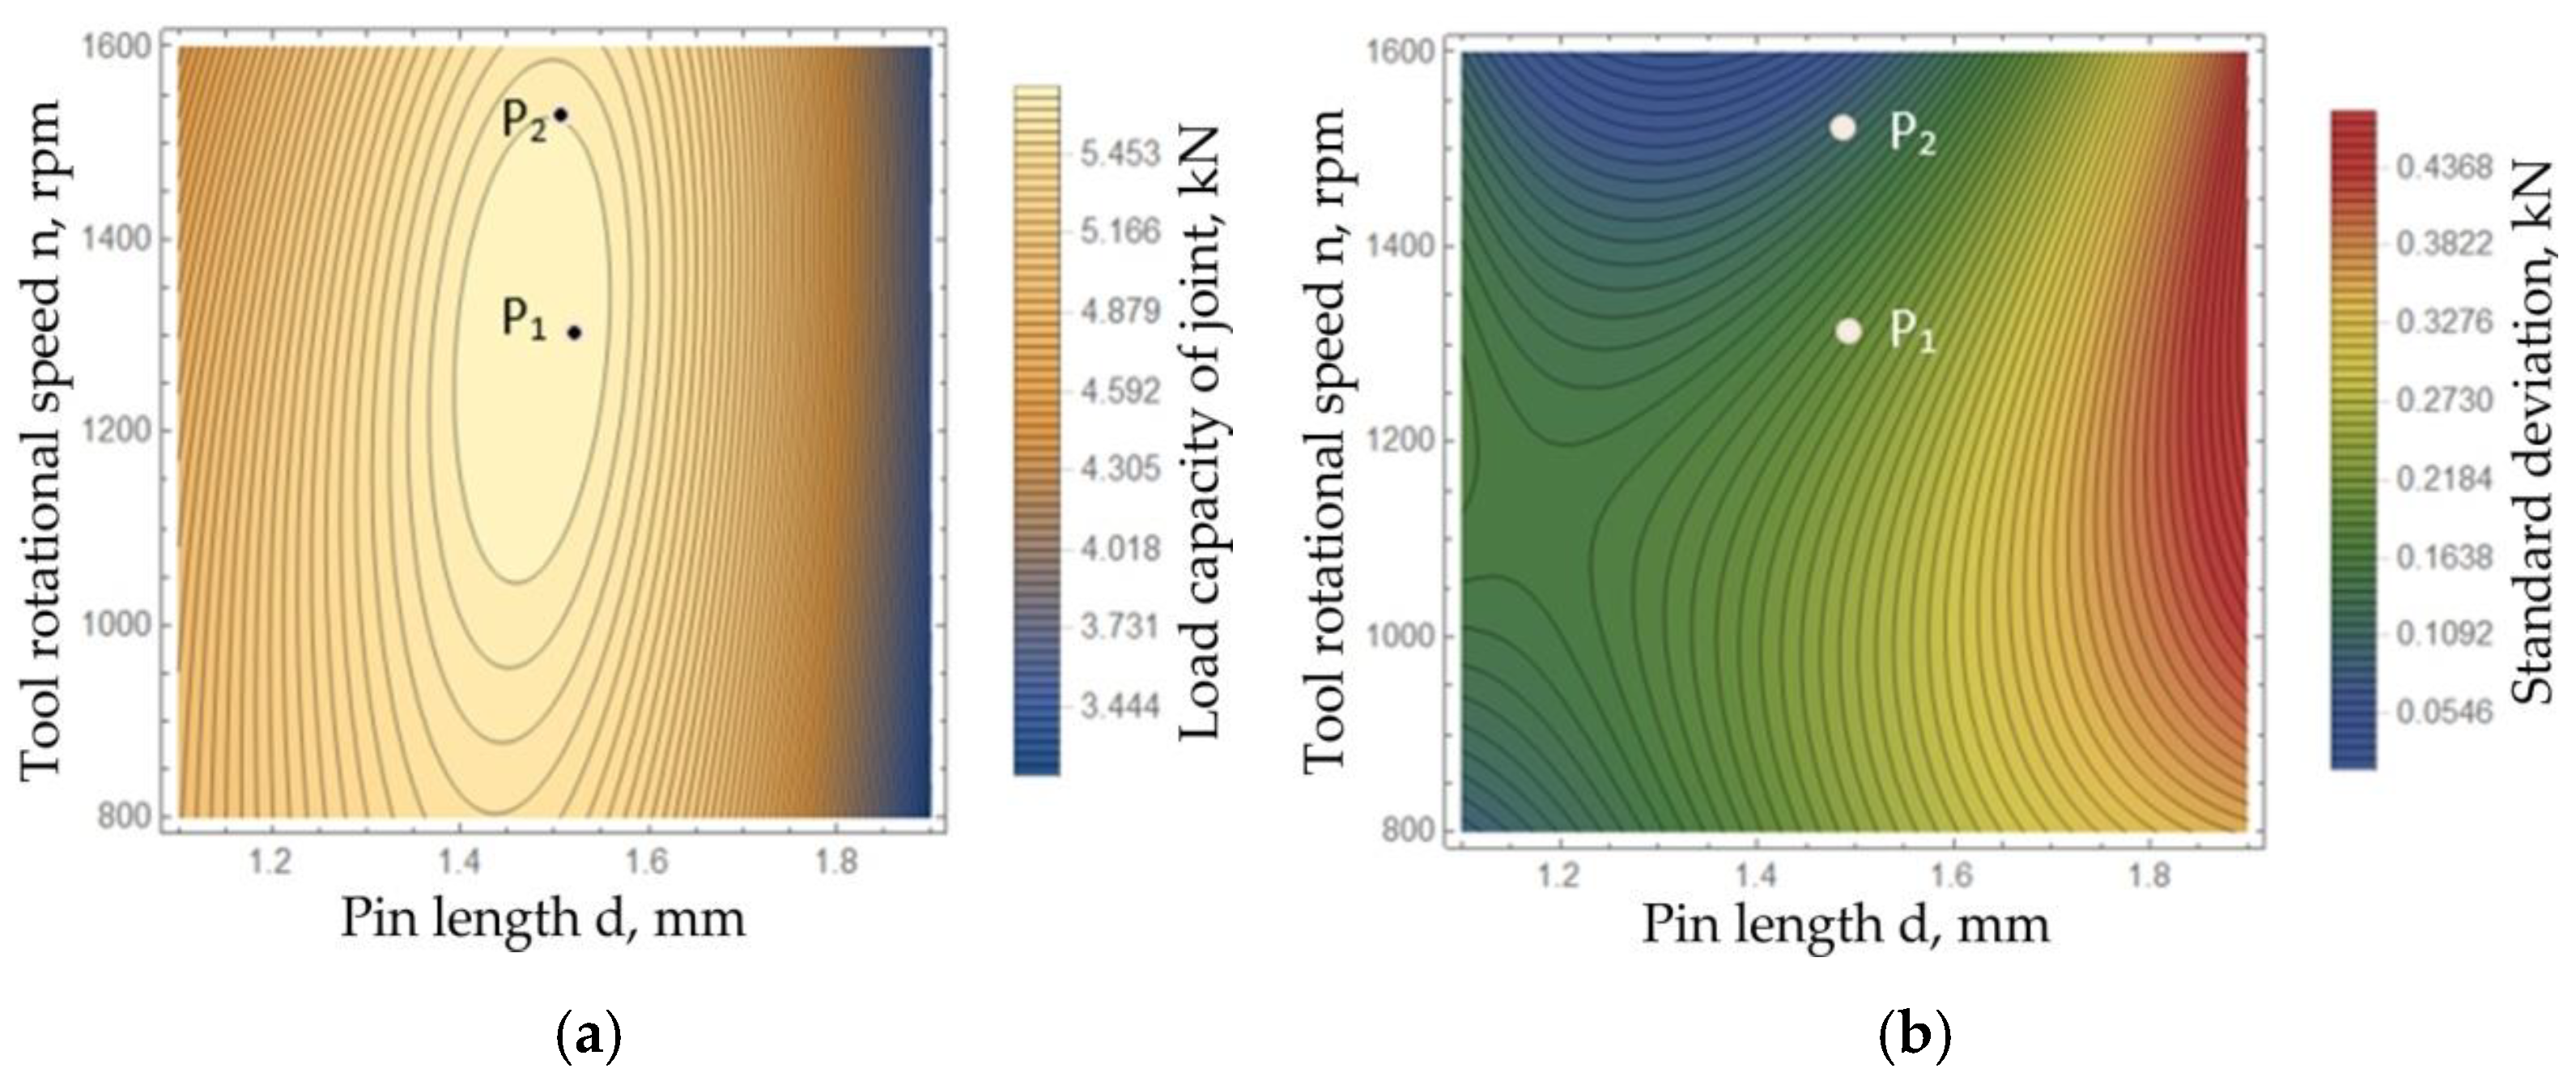
- The use of the parameters obtained as a result of the multi-criteria optimisation allowed a minimum load capacity of joints of 5.338 kN to be obtained with a much greater stability of the results; the lowest value of the standard deviation was obtained here (SD = 0.043 kN).
- As a result of the multi-criteria optimisation, taking into account both optimisation criteria, the optimal parameters were welding speed f = 200 mm/min, tool rotational speed n = 1517 rpm, and pin length d = 1.46 mm; for these parameters, the load capacity of the connection was demonstrated to be 5.65 kN and standard deviation SD = 0.09 kN.
- The highest load capacity (5.527 kN) was found in joints made using the following parameters: pin length d = 1.5 mm, welding speed f = 200 mm/min, and tool rotational speed n = 1200 rpm.
Author Contributions
Funding
Institutional Review Board Statement
Informed Consent Statement
Data Availability Statement
Acknowledgments
Conflicts of Interest
References
- Yang, X.W.; Fu, T.; Li, W.Y. Friction Stir Spot Welding: A Review on Joint Macro- and Microstructure, Property, and Process Modelling. Adv. Fric. Weld. 2014, 2014, 697170. [Google Scholar] [CrossRef] [Green Version]
- Suryanarayanan, R.; Sridhar, V.G. Effect of Process Parameters in Pinless Friction Stir Spot Welding of Al 5754-Al 6061 Alloys. Metall. Microstruct. Analysis 2020, 9, 261–272. [Google Scholar]
- Li, W.; Li, J.; Zhang, Z.; Gao, D.; Wang, W.; Dong, C. Improving mechanical properties of pinless friction stir spot welded joints by eliminating hook defect. Mater. Des. 2014, 62, 247–254. [Google Scholar] [CrossRef]
- Wu, S.; Sun, T.; Shen, Y.; Yan, Y.; Ni, R.; Liu, W. Conventional and swing friction stir spot welding of aluminum alloy to magnesium alloy. Int. J. Adv. Manuf. Technol. 2021, 116, 2401–2412. [Google Scholar] [CrossRef]
- Rostamiyan, Y.; Seidanioo, A.; Sohrabpoor, H.; Teimouri, R. Experimental studies on ultrasonically assisted friction stir spot welding of AA6061. Arch. Civ. Mech. Eng. 2015, 15, 335–346. [Google Scholar] [CrossRef]
- Christy, J.V.; Mourad, A.H.I.; Sherif, M.M.; Shivamurthy, B. Review of recent trends in friction stir welding process of aluminum alloys and aluminum metal matrix composites. Trans. Nonferr. Met. Soc. China 2021, 31, 3281–3309. [Google Scholar] [CrossRef]
- Rai, R.; De, A.; Bhadeshia, H.K.D.H.; Debroy, T. Review: Friction stir welding tools. Sci. Technol. Weld. Join. 2011, 16, 325–342. [Google Scholar] [CrossRef]
- Praneetha, K.; Apoorva, M.; Laxmi, T.P.; Sekhar, S.R.; Sashank, S.S. Experimental investigation on aluminium alloy AA6082 and AA2014 using the friction stir welding. Mater. Today Proc. 2020, 62, 3397–3404. [Google Scholar] [CrossRef]
- Ambroziak, A. Zgrzewanie Tarciowe Materiałów o Różnych Właściwościach; Oficyna Wydawnicza Politechniki Wrocławskiej: Wrocław, Poland, 2011. [Google Scholar]
- Kowalczyk, L. Łączenie Metali w Stanie Stałym w Procesach Obróbki Plastycznej; Wydawnictwo Naukowo-Techniczne: Warszawa, Poland, 1988. [Google Scholar]
- Trzepieciński, T.; Najm, S.M.; Oleksik, V.; Vasilca, D.; Paniti, I.; Szpunar, M. Recent Developments and Future Challenges in Incremental Sheet Forming of Aluminium and Aluminium Alloy Sheets. Metals 2022, 12, 124. [Google Scholar] [CrossRef]
- Trzepieciński, T.; Krasowski, B.; Kubit, A.; Wydrzyński, D. Possibilities of application of incremental sheet-forming technique in aircraft industry. Zesz. Nauk. Politech. Rzesz. 2018, 35, 87–100. [Google Scholar] [CrossRef] [Green Version]
- Gloria, A.; Montanari, R.; Richetta, M.; Varone, A. Alloys for Aeronautic Applications: State of the Art and Perspectives. Metals 2019, 9, 662. [Google Scholar] [CrossRef] [Green Version]
- Boitsov, A.G.; Kuritsyn, D.N.; Siluyanova, M.V.; Kuritsyna, V.V. Friction Stir Welding in the Aerospace Industry. Russ. Eng. Res. 2018, 38, 1029–1033. [Google Scholar] [CrossRef]
- Wang, G.; Zhao, Y.; Hao, Y. Friction stir welding of high-strength aerospace aluminum alloy and application in rocket tank manufacturing. J. Mater. Sci. Technol. 2018, 34, 73–91. [Google Scholar] [CrossRef]
- Weis, O.C.A. Influence of Energy Input in Friction Stir Welding on Structure Evolution and Mechanical Behaviour of Precipitation-Hardening in Aluminium Alloys (AA2024-T351, AA6013-T6 and Al-Mg-Sc). Ph.D. Thesis, GKSS-Forschungszentrum Geesthacht GmbH, Geesthacht, Germany, 2008. [Google Scholar]
- Elangovan, K.; Balasubramanian, V.; Valliappan, M. Effect of Tool Pin Profile and Tool Rotational Speed on Mechanical Properties of Friction Stir Welded AA6061 Aluminium Alloy. Mater. Manuf. Process. 2008, 23, 251–260. [Google Scholar] [CrossRef]
- Rajakumar, S.; Muralidharan, C.; Balasubramanian, V. Optimization of the friction-stir-welding process and tool parameters to attain a maximum tensile strength of AA7075–T 6 aluminium alloy. Proc. IMechE. Part B J. Mech. Eng. 2010, 224, 1175–1191. [Google Scholar] [CrossRef]
- Tansel, I.N.; Demetgul, M.; Okuyucu, H.; Yapici, A. Optimizations of friction stir welding of aluminum alloy by using genetically optimized neural network. Int. J. Adv. Manuf. Technol. 2010, 48, 95–101. [Google Scholar] [CrossRef] [Green Version]
- Winiczenko, R. Optymalizacja parametrów zgrzewania tarciowego za pomocą algorytmów genetycznych. Inżynieria Rolnicza 2008, 2, 313–321. [Google Scholar]
- Elatharasan, G.; Kumar, V.S. Modelling and optimization of friction stir welding parameters for dissimilar aluminium alloys using RSM. Procedia Eng. 2012, 38, 3477–3481. [Google Scholar] [CrossRef] [Green Version]
- Dhancholia, D.D.; Sharma, A.; Vyas, C. Optimisation of Friction Stir Welding Parameters for AA 6061 and AA 7039 Aluminium Alloys by Response Surface Methodology (RSM). Int. J. Adv. Mech. Eng. 2014, 4, 565–571. [Google Scholar]
- Mohamed, M.F.; Yaknesh, S.; Kumar, C.M.A.; Rajadurai, G.; Janarthanan, S.; Vignes, A.V.S. Optimization of friction stir welding parameters for enhancing welded joints strength using Taguchi based grey relational analysis. Mater. Today Proc. 2021, 39, 676–681. [Google Scholar] [CrossRef]
- Prasad, M.V.R.D.; Namala, K.K. Process parameters optimization in friction stir welding by ANOVA. Mater. Today Proc. 2018, 5, 4824–4831. [Google Scholar] [CrossRef]
- Kumar, C.V.; Muthukumaran, S.; Pradeep, A.; Kumaran, S.S. Optimizational study of friction welding of steel tube to aluminium tube plate using an external tool process. Int. J. Mech. Mater. Eng. 2011, 6, 300–306. [Google Scholar]
- Wang, J.M.; Yan, H.J.; Zhou, J.M.; Li, S.X.; Gui, G.C. Optimization of parameters for an aluminum melting furnace using the Taguchi approach. App. Therm. Eng. 2012, 33–34, 33–43. [Google Scholar] [CrossRef]
- Vijian, P.; Arunachalam, V.P. Optimization of squeeze casting process parameters using Taguchi analysis. Int. J. Adv. Manuf. Technol. 2007, 33, 1122–1127. [Google Scholar] [CrossRef]
- Chandran, R.; Ramaiyan, S.; Shanbhan, A.G.; Santhanam, S.K.V. Optimization of Welding Parameters for Friction Stir Lap Welding of AA6061-T6 Alloy. Modern Mech. Eng. 2018, 8, 31–41. [Google Scholar] [CrossRef] [Green Version]
- Abbas, A.A.; Abdulkadham, H.H. Optimization of Friction Stir Welding Process Parameters to joint 7075-T6 Aluminium Alloy by Utilizing Taguchi Technique. J. Eng. 2019, 25, 1–15. [Google Scholar] [CrossRef] [Green Version]
- Arab, M.; Zemri, M. Optimization of Process Parameters on Friction Stir Welding of AA 6082-T6 Butt Joints Using Taguchi Method. Mech. Mech. Eng. 2018, 22, 1371–1380. [Google Scholar] [CrossRef]
- Bora, B.; Kumar, R.; Chattopadhyaya, S.; Borucki, S. Analysis of Variance of Dissimilar Cu-Al Alloy Friction Stir Welded Joints with Different Offset Conditions. Appl. Sci. 2021, 11, 4604. [Google Scholar] [CrossRef]
- Bayazid, S.M.; Farhangi, H.; Ghahramani, A. Investigation of friction stir welding parameters of 6063-7075 aluminum alloys by Taguchi method. Procedia Mater. Sci. 2015, 11, 6–11. [Google Scholar] [CrossRef] [Green Version]
- Raweni, A.; Majstrović, V.; Sedmak, A.; Tadić, S.; Kirin, S. Optimization of AA5083 Friction Stir Welding Parameters Using Taguchi Method. Tech. Vjesn. 2018, 25, 861–866. [Google Scholar]
- Navale, S.B.; Borkar, B.R. Process parameters optimization in FSW process using Taguchi method. Int. J. Adv. Res. Innov. Ideas Educ. 2018, 4, 551–558. [Google Scholar]
- Nazarlou, R.D.; Akhgar, B.N.; Omidbakhsh, F. Optimization of friction stir welding parameters with Taguchi method for maximum electrical conductivity in Al-1080 welded sections. Sci. Iran. Trans. B Mech. Eng. 2021, 28, 2250–2258. [Google Scholar] [CrossRef]
- Jain, N.; Kumar, R. Multi-response optimization of process parameters in friction stir welded aluminum 6061-T6 alloy using Taguchi grey relational analysis. Weld J. Eng. 2021. [Google Scholar] [CrossRef]
- Mishra, A. Artificial Intelligence Algorithms for the Analysis of Mechanical Property of Friction Stir Welded Joints by using Python Programming. Weld. Technol Rev. 2020, 92, 7–16. [Google Scholar] [CrossRef]
- Shehabeldeen, T.A.; Elaziz, M.A.; Elsheikh, A.H.; Zhou, J. Modeling of friction stir welding process using adaptive neuro-fuzzy inference system integrated with harris hawks optimizer. J. Mater. Res. Technol. 2019, 8, 5882–5892. [Google Scholar] [CrossRef]
- Andersen, K.; Cook, G.E.; Karsai, G.; Ramaswamy, K. Artificial neural networks applied to arc welding process modeling and control. Conf. Rec. IEEE Ind. Appl. Soc. Annu. Meet. 1989, 2, 2327–2331. [Google Scholar]
- Shojaeefard, M.H.; Behnagh, R.A.; Akbari, M.; Givi, M.K.B.; Farhani, F. Modelling and Pareto optimization of mechanical properties of friction stir welded AA7075/AA5083 butt joints using neural network and particle swarm algorithm. Mater. Des. 2013, 44, 190–198. [Google Scholar] [CrossRef]
- Lakshminarayanan, A.K.; Balasubramanian, V. Comparison of RSM with ANN in predicting tensile strength of friction stir welded AA7039 aluminium alloy joints. Trans. Nonferr. Met. Soc. China 2009, 19, 9–18. [Google Scholar] [CrossRef]
- Aliha, M.R.M.; Shahheidari, M.; Bisadi, M.; Akbari, M.; Hossain, S. Mechanical and metallurgical properties of dissimilar AA6061-T6 and AA7277-T6 joint made by FSW technique. Int. J. Adv. Manuf. Technol. 2016, 86, 2551–2565. [Google Scholar] [CrossRef]
- Okuyucu, H.; Kurt, A.; Arcaklioglu, E. Artificial neural network application to the friction stir welding of aluminum plater. Mater. Des. 2017, 28, 78–84. [Google Scholar] [CrossRef]
- Kubit, A.; Kluz, R.; Ochałek, K.; Wydrzyński, D.; Trzepieciński, T. Friction stir welding of 2024-T3 aluminium alloy sheet with sheet pre-heating. Mater. Technol. 2018, 52, 283–288. [Google Scholar]
- ISO 14273:2016; Resistance welding—Destructive Testing of Welds—Specimen Dimensions and Procedure for Tensile Shear Testing Resistance Spot and Embossed Projection Wells. International Organization for Standardization: Geneva, Switzerland, 2016.
- Chitturi, V.; Pedapati, S.R.; Awang, M. Investigation of Weld Zone and Fracture Surface of Friction Stir Lap Welded 5052 Aluminum Alloy and 304 Stainless Steel Joints. Coatings 2020, 10, 1062. [Google Scholar] [CrossRef]
- Kudła, K.; Wojsyk, K.; Kucharczyk, Z. Własności zakładkowych złączy spajanych metodą zgrzewania tarciowego z przemieszaniem (FSW–Friction Stir Welding). Obróbka Plastyczna Metali 2013, 24, 179–191. [Google Scholar]
- Song, Y.; Yang, X.; Cui, L.; Hou, X.; Shen, Z.; Xu, Y. Defect features and mechanical properties of friction stir lap welded dissimilar AA2024–AA7075 aluminum alloy sheets. Mater. Des. 2014, 55, 9–18. [Google Scholar] [CrossRef]
- Singh, G.; Singh, K.; Singh, J. Effect of axial force on mechanical and metallurgical properties of friction welded AA6082 joints. Adv. Mater. Res. 2012, 383–390, 3356–3360. [Google Scholar]
- Kumar, R.; Singh, K.; Pandey, S. Process forces and heat input as function of process parameters in AA5083 friction stir welds. Trans. Nonferr. Met. Soc. China 2012, 22, 288–298. [Google Scholar] [CrossRef]
- Wahid, M.A.; Siddiquee, A.N.; Khan, Z.A.; Asjad, M. Friction stir welds of Al alloy-Cu: An international on effect of plunge depth. Arch. Mech. Eng. 2016, 63, 619–634. [Google Scholar] [CrossRef] [Green Version]
- Flores, O.V.; Kennedy, C.; Murr, L.E.; Brown, D.; Pappu, S.; Nowak, B.M.; Nowak, B.M. Microstructural issues in a friction stir welded aluminium alloy. Scr. Mater. 1998, 38, 703–708. [Google Scholar] [CrossRef]
- Lee, W.B.; Yeon, Y.M.; Jung, S.B. Mechanical properties related to micro structural variation of 6061 Al alloy joints by friction stir welding. Mater. Trans. 2004, 45, 1700–1705. [Google Scholar] [CrossRef] [Green Version]
- Moataz, M.; Salem, A.H.G. Friction stir welding parameters; a tool for controlling abnormal grain growth during subsequent heat treatment. Mater. Sci. Eng. 2005, 391, 51–59. [Google Scholar]


| Cu | Mg | Mn | Si | Fe (max.) | Zn (max.) | Ti | Cr | Others | Al | |
|---|---|---|---|---|---|---|---|---|---|---|
| Each | Total | |||||||||
| 3.8–4.9 | 1.2–1.8 | 0.3–0.9 | 0.5 | 0.5 | 0.25 | 0.15 | 0.1 | 0.05 | 0.015 | balance |
| Yield Stress Rp0.2, MPa | Ultimate Tensile Stress Rm, Mpa | Elongation A5, % | Hardness, HB |
|---|---|---|---|
| 250–290 | 360–425 | 12–14 | 104–123 |
| DoE Level | Pin Length d, mm | Welding Speed f, mm/min | Tool Rotational Speed n, rpm |
|---|---|---|---|
| −1 | 1.1 | 200 | 800 |
| 0 | 1.5 | 300 | 1200 |
| +1 | 1.9 | 400 | 1600 |
| Variant No. | Pin Length d, mm | Welding Speed f, mm/min | Tool Rotational Speed n, rpm | Failure Mode | Tensile Force (Sample A), kN | Tensile Force, (Sample B), kN | Tensile Force (Sample C), kN | Average Tensile Force, kN | Standard Deviation of Tensile Force, kN |
|---|---|---|---|---|---|---|---|---|---|
| 1 | 1.1 | 200 | 800 | S | 4.888 | 4.829 | 4.684 | 4.801 | 0.085 |
| 2 | 1.1 | 200 | 1200 | S | 5.001 | 4.973 | 4.718 | 4.898 | 0.127 |
| 3 | 1.1 | 200 | 1600 | S | 4.651 | 4.783 | 4.719 | 4.717 | 0.054 |
| 4 | 1.1 | 300 | 800 | S | 5.002 | 4.898 | 5.048 | 4.983 | 0.062 |
| 5 | 1.1 | 300 | 1200 | S | 5.075 | 4.982 | 5.144 | 5.067 | 0.067 |
| 6 | 1.1 | 300 | 1600 | S | 3.906 | 4.879 | 5.015 | 4.600 | 0.493 |
| 7 | 1.1 | 400 | 800 | S | 5.145 | 4.826 | 4.654 | 4.875 | 0.204 |
| 8 | 1.1 | 400 | 1200 | S | 5.045 | 4.905 | 4.878 | 4.943 | 0.073 |
| 9 | 1.1 | 400 | 1600 | S | 5.282 | 5.319 | 5.213 | 5.271 | 0.044 |
| 10 | 1.5 | 200 | 800 | T | 5.395 | 5.328 | 5.291 | 5.338 | 0.043 |
| 11 | 1.5 | 200 | 1200 | T | 5.621 | 5.641 | 5.412 | 5.527 | 0.103 |
| 12 | 1.5 | 200 | 1600 | T | 5.408 | 5.209 | 5.440 | 5.352 | 0.102 |
| 13 | 1.5 | 300 | 800 | T | 4.704 | 4.120 | 4.678 | 4.501 | 0.269 |
| 14 | 1.5 | 300 | 1200 | T | 5.001 | 4.882 | 5.197 | 5.027 | 0.130 |
| 15 | 1.5 | 300 | 1600 | T | 4.285 | 3.929 | 4.251 | 4.155 | 0.161 |
| 16 | 1.5 | 400 | 800 | T | 0.803 | 0.814 | 1.078 | 0.898 | 0.127 |
| 17 | 1.5 | 400 | 1200 | T | 2.390 | 1.985 | 2.342 | 2.239 | 0.181 |
| 18 | 1.5 | 400 | 1600 | T | 3.136 | 3.075 | 3.189 | 3.134 | 0.046 |
| 19 | 1.9 | 200 | 800 | T | 3.980 | 3.578 | 3.147 | 3.569 | 0.339 |
| 20 | 1.9 | 200 | 1200 | T | 3.849 | 2.943 | 3.377 | 3.390 | 0.369 |
| 21 | 1.9 | 200 | 1600 | T | 3.169 | 3.867 | 3.304 | 3.447 | 0.302 |
| 22 | 1.9 | 300 | 800 | T | 2.187 | 2.413 | 2.717 | 2.439 | 0.217 |
| 23 | 1.9 | 300 | 1200 | T | 2.882 | 2.757 | 3.169 | 2.936 | 0.172 |
| 24 | 1.9 | 300 | 1600 | T | 3.358 | 2.355 | 3.259 | 2.991 | 0.451 |
| 25 | 1.9 | 400 | 800 | T | 0.880 | 0.986 | 0.894 | 0.921 | 0.047 |
| 26 | 1.9 | 400 | 1200 | T | 1.655 | 1.696 | 1.513 | 1.621 | 0.078 |
| 27 | 1.9 | 400 | 1600 | T | 2.628 | 3.247 | 2.669 | 2.848 | 0.283 |
| Coefficient | WF(x) | Wσ(x) |
|---|---|---|
| −17.4188 | −2.41201 | |
| 21.4528 | 1.62391 | |
| 0.12861 | −0.00248 | |
| −0.00091 | 0.004926 | |
| −0.24367 | −0.001336 | |
| 0.00720 | −0.004807 | |
| −0.000049 | 3.5818 × 10⁻⁶ | |
| 0.08203 | −0.00211 | |
| −0.000023 | 9.964 × 10⁻⁶ | |
| 0.00197 | 0.001643 | |
| - | −3.006 × 10⁻⁸ | |
| - | 6.0817 × 10⁻⁹ | |
| 8.3457 | 0.84206 | |
| 0.000278 | 0.000013 | |
| 1.51 × 10⁻⁶ | −1.688 × 10⁻⁶ | |
| −7.1218 | −0.40246 | |
| −4.34 × 10⁻⁷ | - | |
| - | - |
Publisher’s Note: MDPI stays neutral with regard to jurisdictional claims in published maps and institutional affiliations. |
© 2022 by the authors. Licensee MDPI, Basel, Switzerland. This article is an open access article distributed under the terms and conditions of the Creative Commons Attribution (CC BY) license (https://creativecommons.org/licenses/by/4.0/).
Share and Cite
Kubit, A.; Trzepieciński, T.; Kluz, R.; Ochałek, K.; Slota, J. Multi-Criteria Optimisation of Friction Stir Welding Parameters for EN AW-2024-T3 Aluminium Alloy Joints. Materials 2022, 15, 5428. https://doi.org/10.3390/ma15155428
Kubit A, Trzepieciński T, Kluz R, Ochałek K, Slota J. Multi-Criteria Optimisation of Friction Stir Welding Parameters for EN AW-2024-T3 Aluminium Alloy Joints. Materials. 2022; 15(15):5428. https://doi.org/10.3390/ma15155428
Chicago/Turabian StyleKubit, Andrzej, Tomasz Trzepieciński, Rafał Kluz, Krzysztof Ochałek, and Ján Slota. 2022. "Multi-Criteria Optimisation of Friction Stir Welding Parameters for EN AW-2024-T3 Aluminium Alloy Joints" Materials 15, no. 15: 5428. https://doi.org/10.3390/ma15155428