

Tailoring Titanium Sheet Metal Using Laser Metal Deposition to Improve Room Temperature Single-Point Incremental Forming


Abstract
:1. Introduction
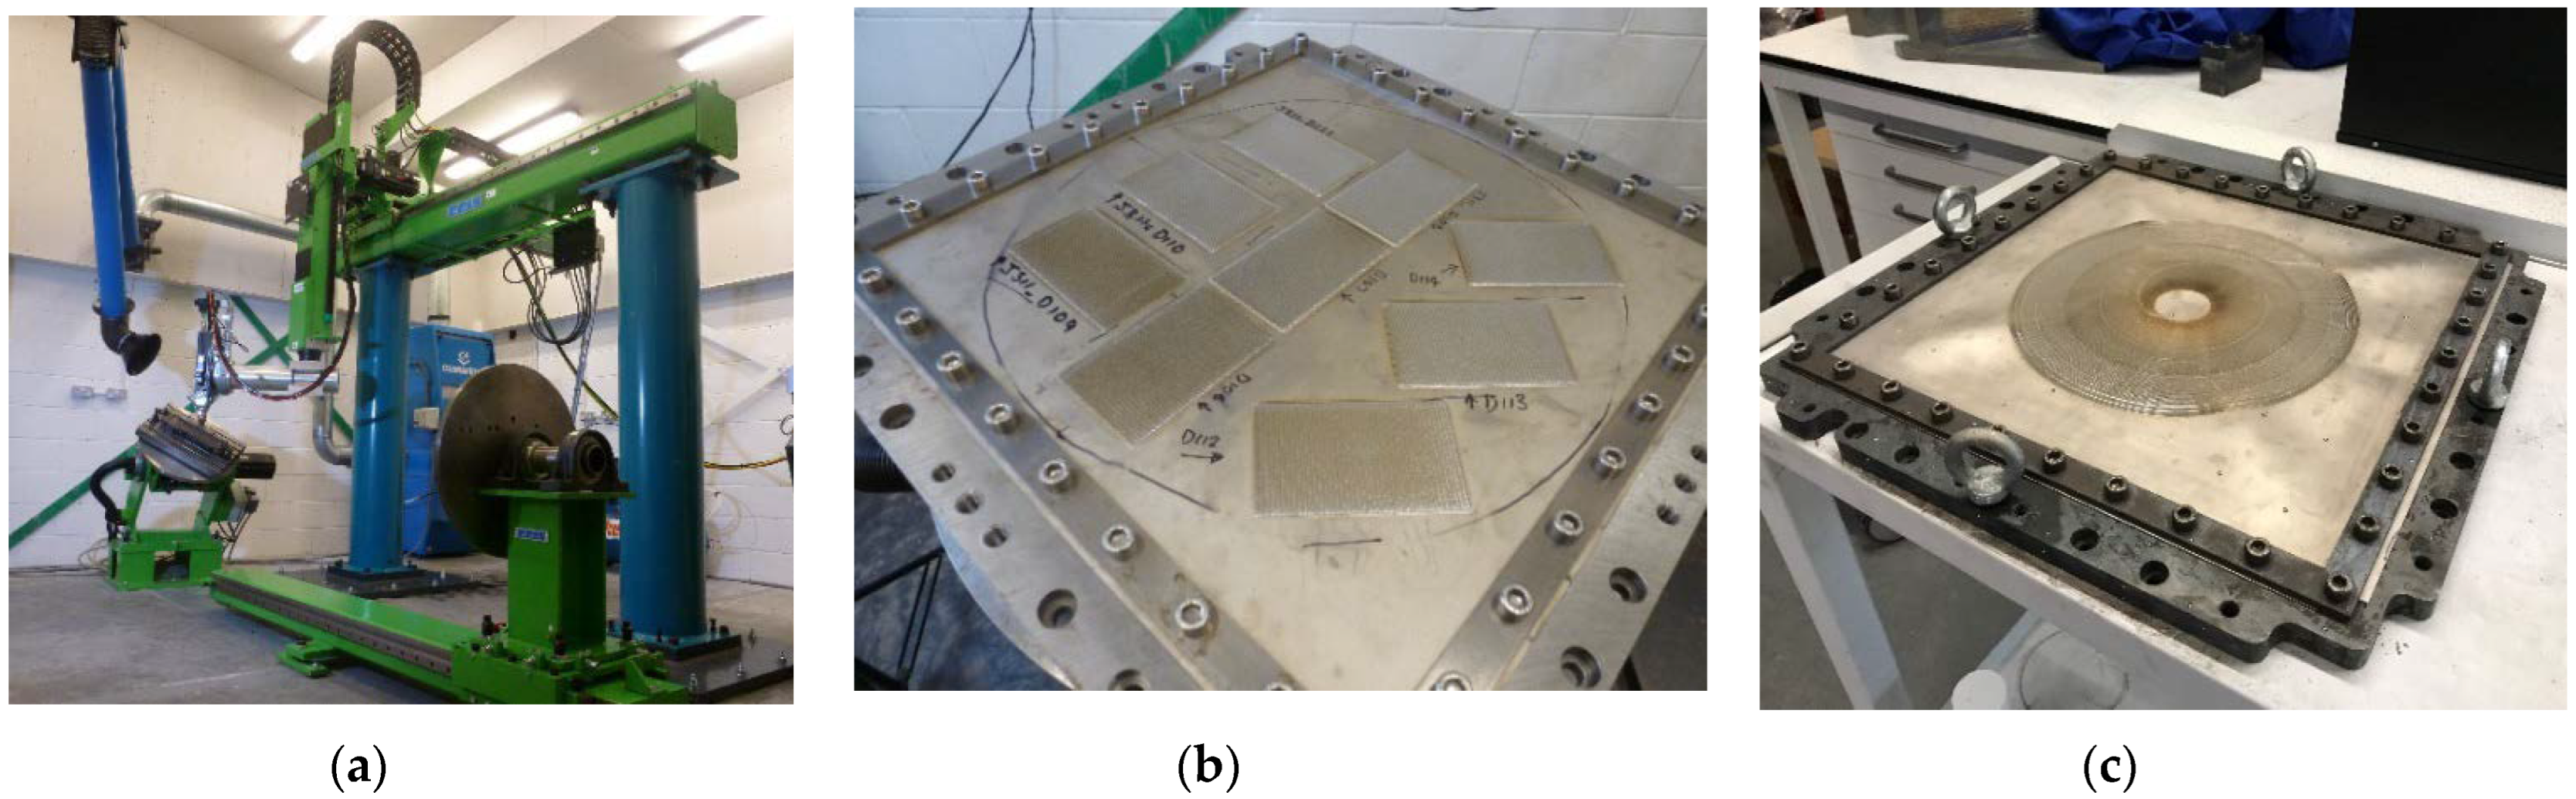
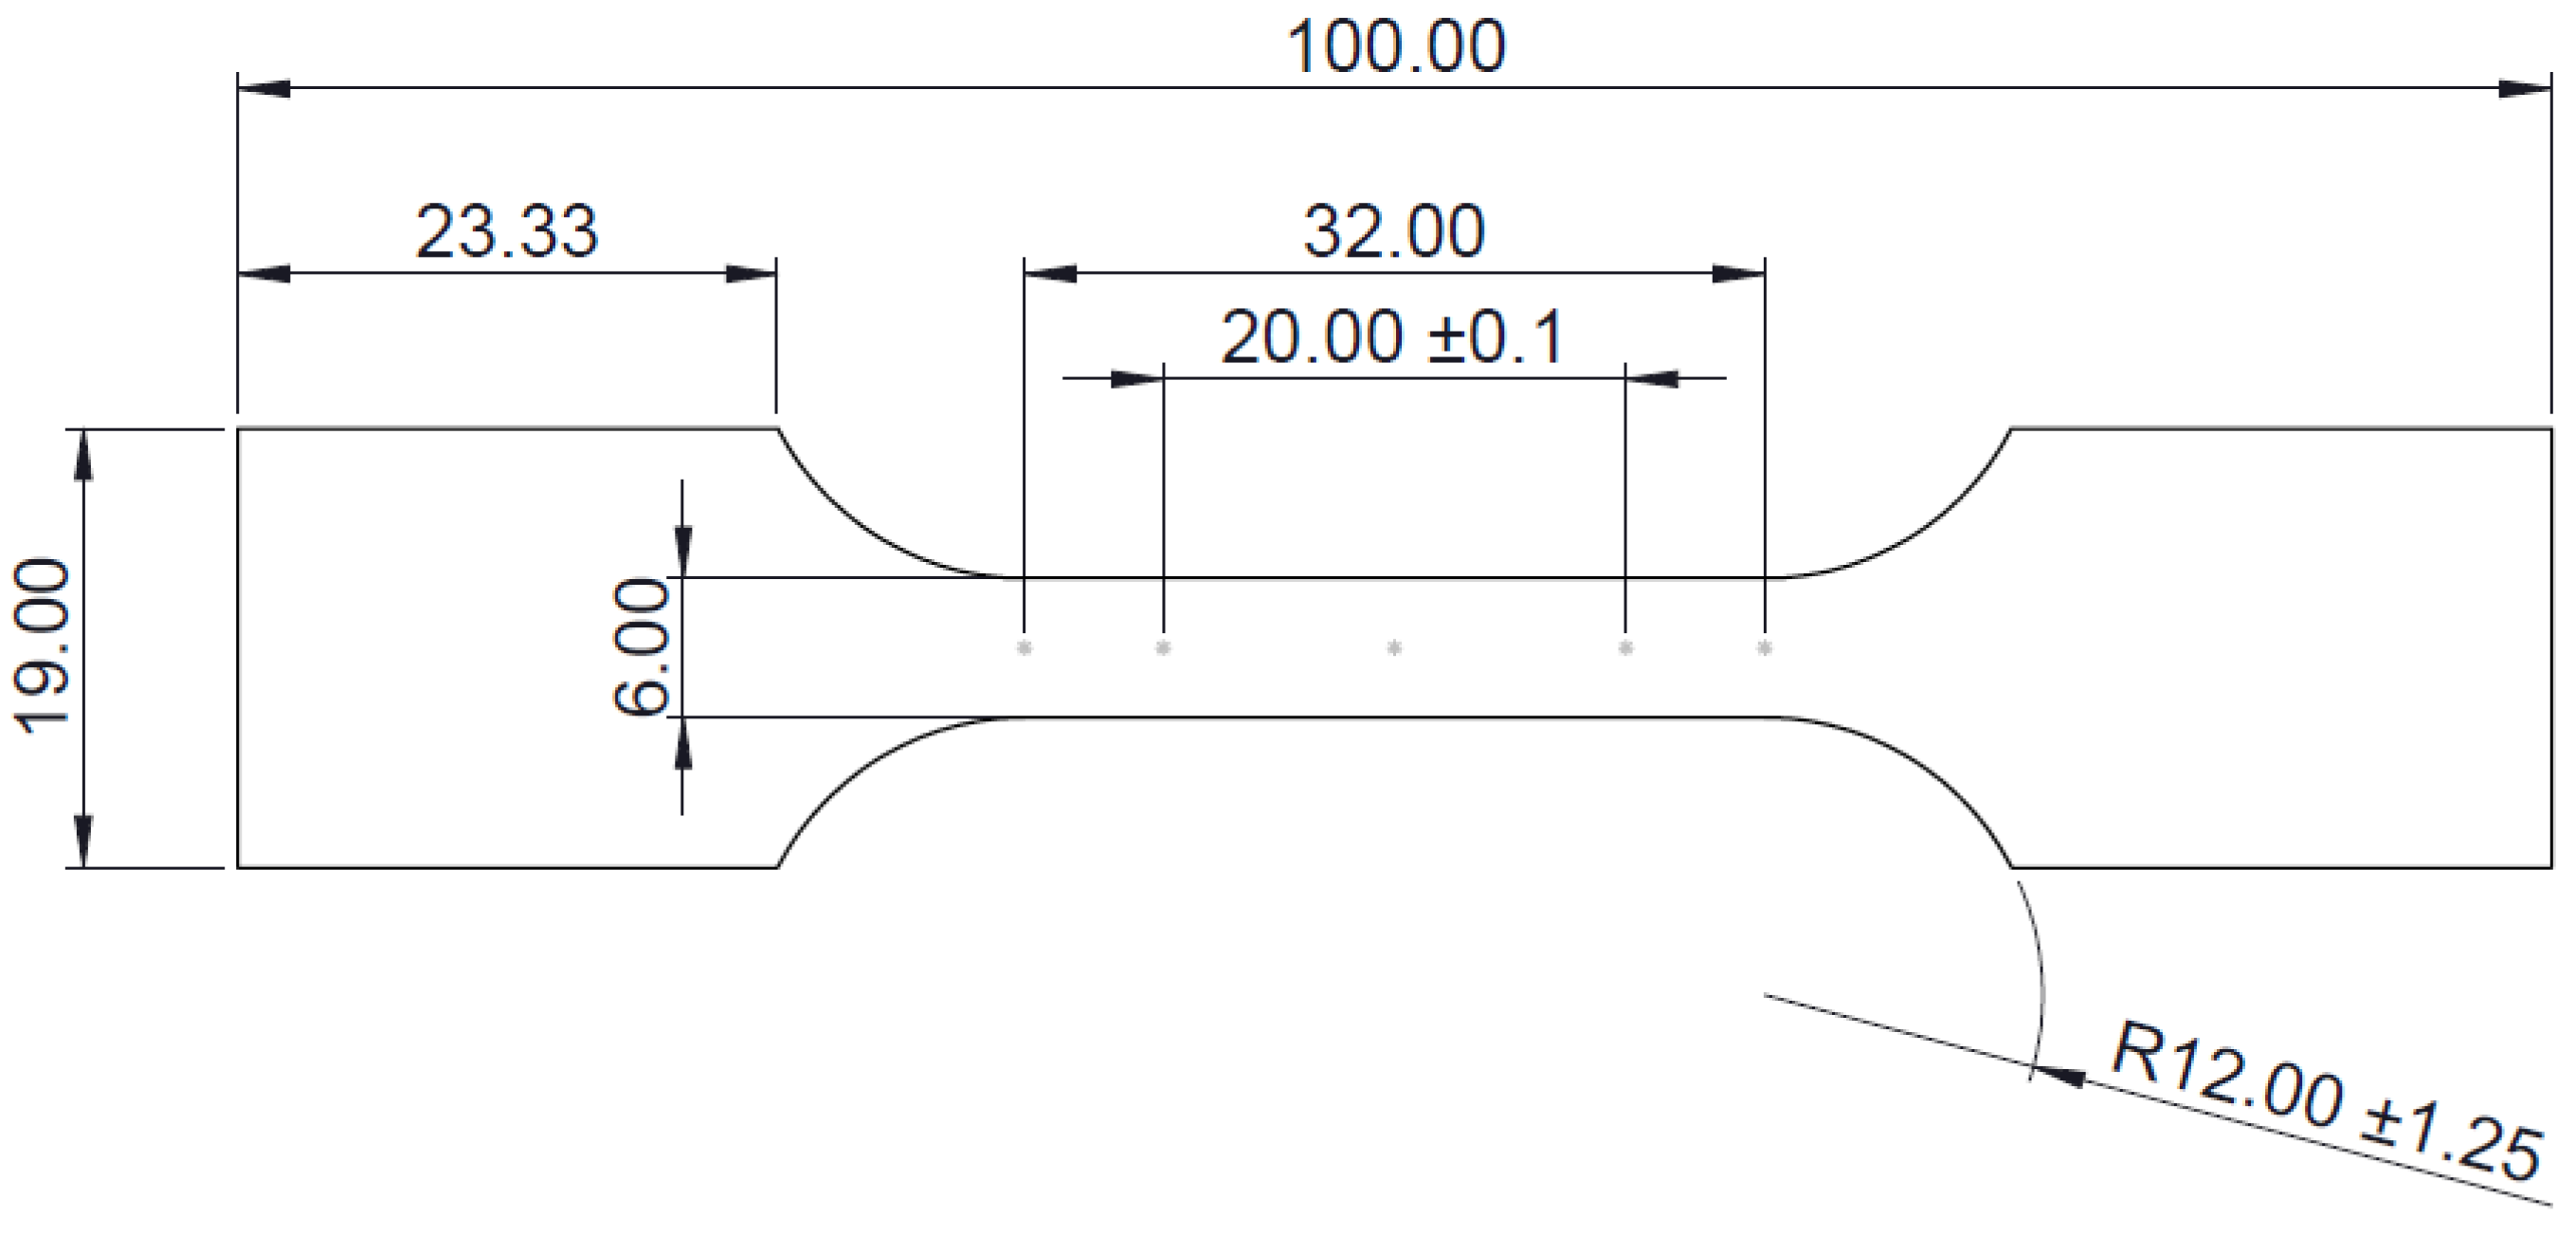
2. Materials and Methods
3. Results
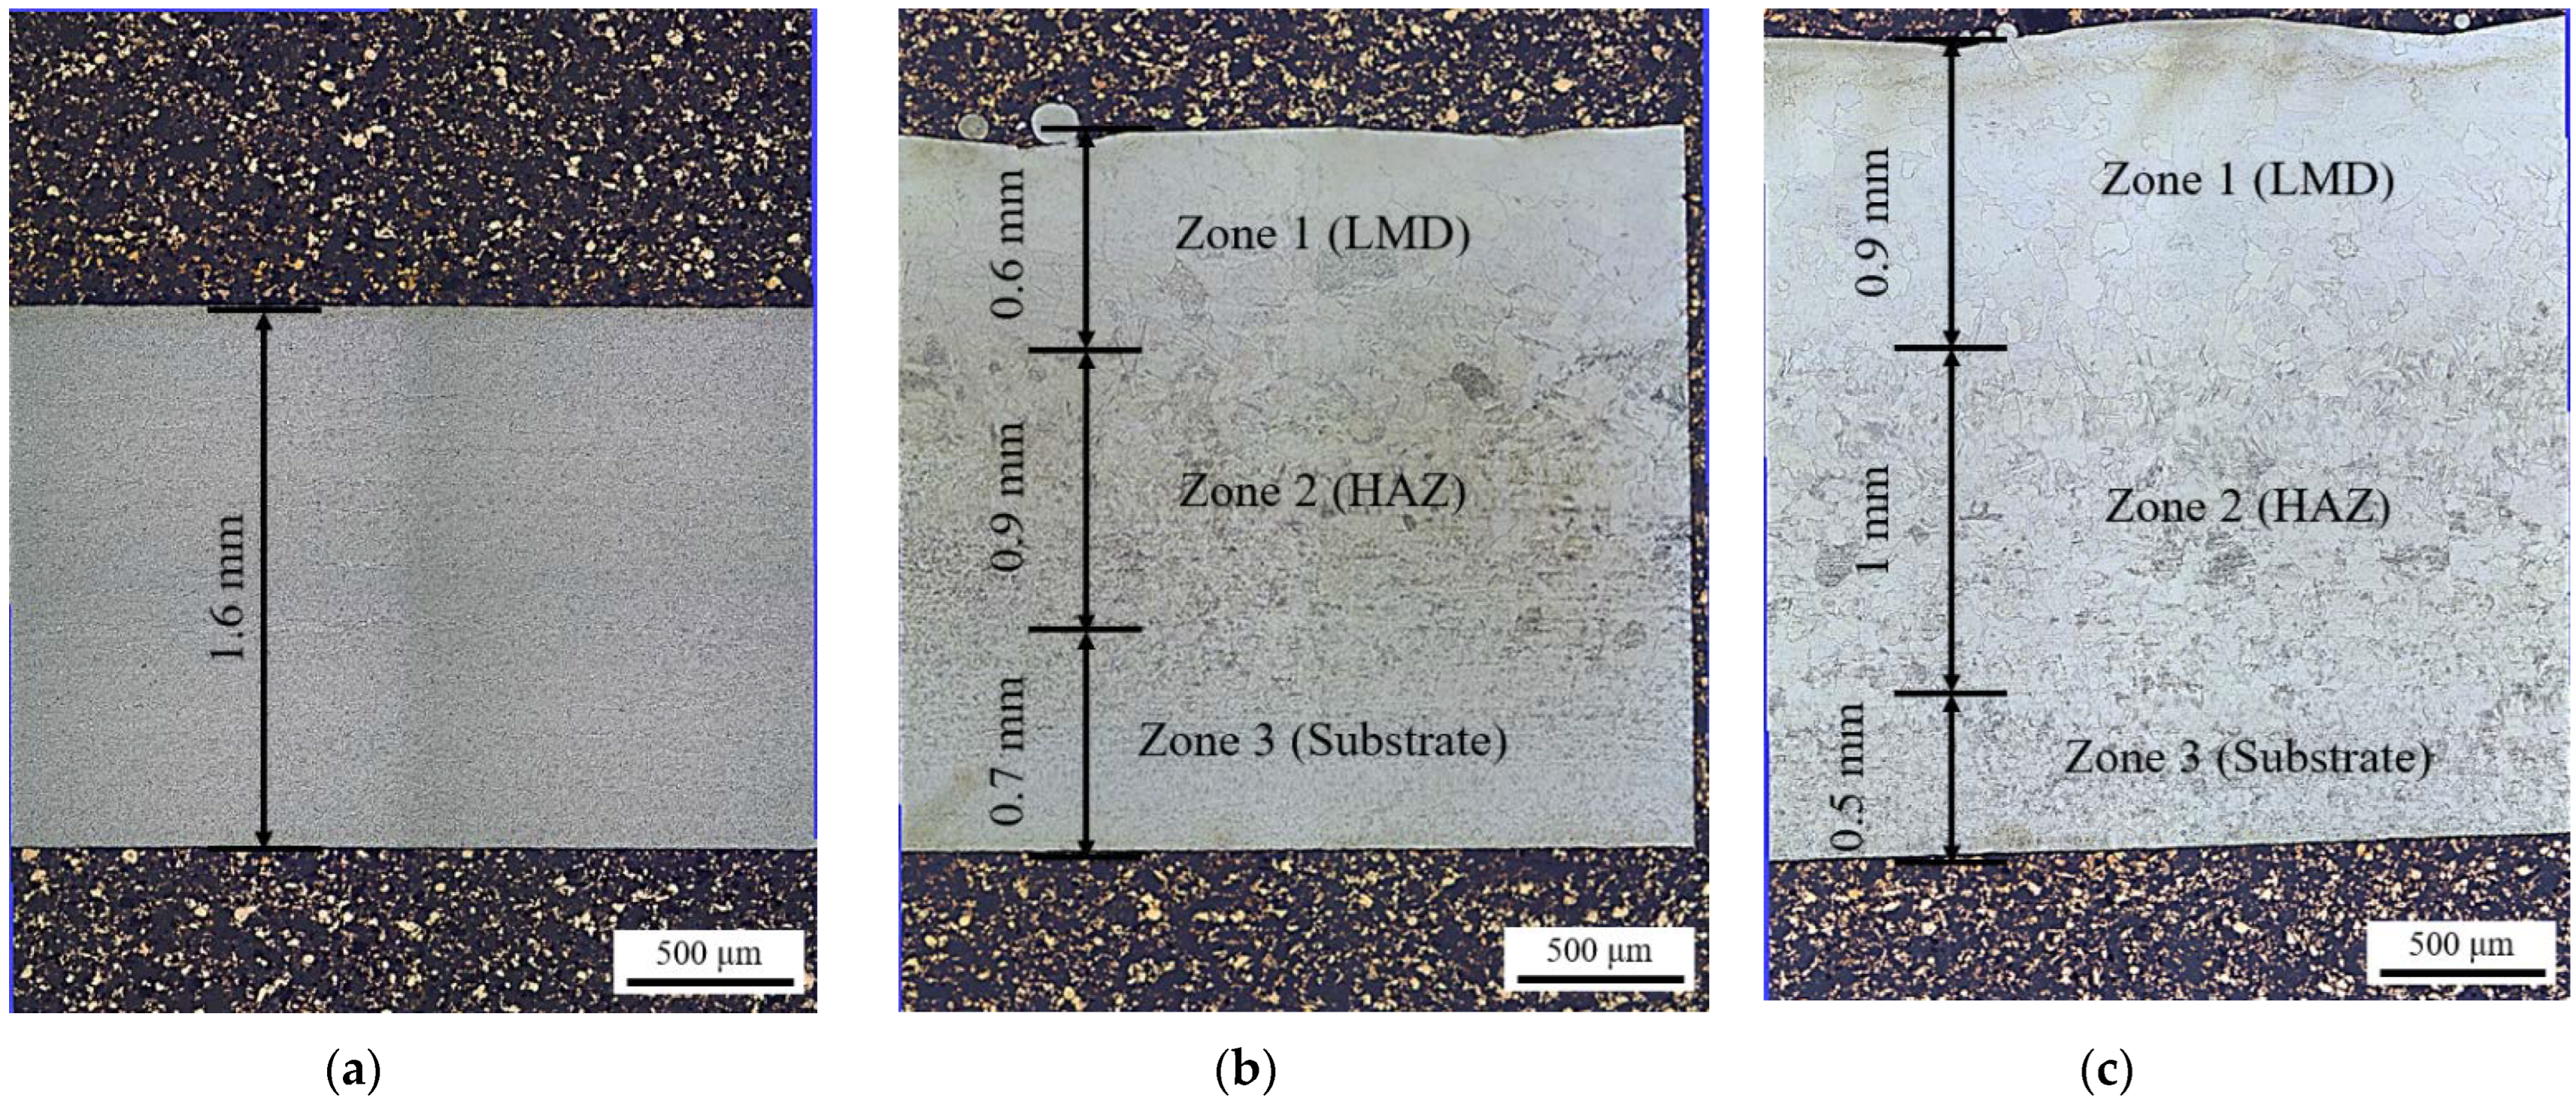
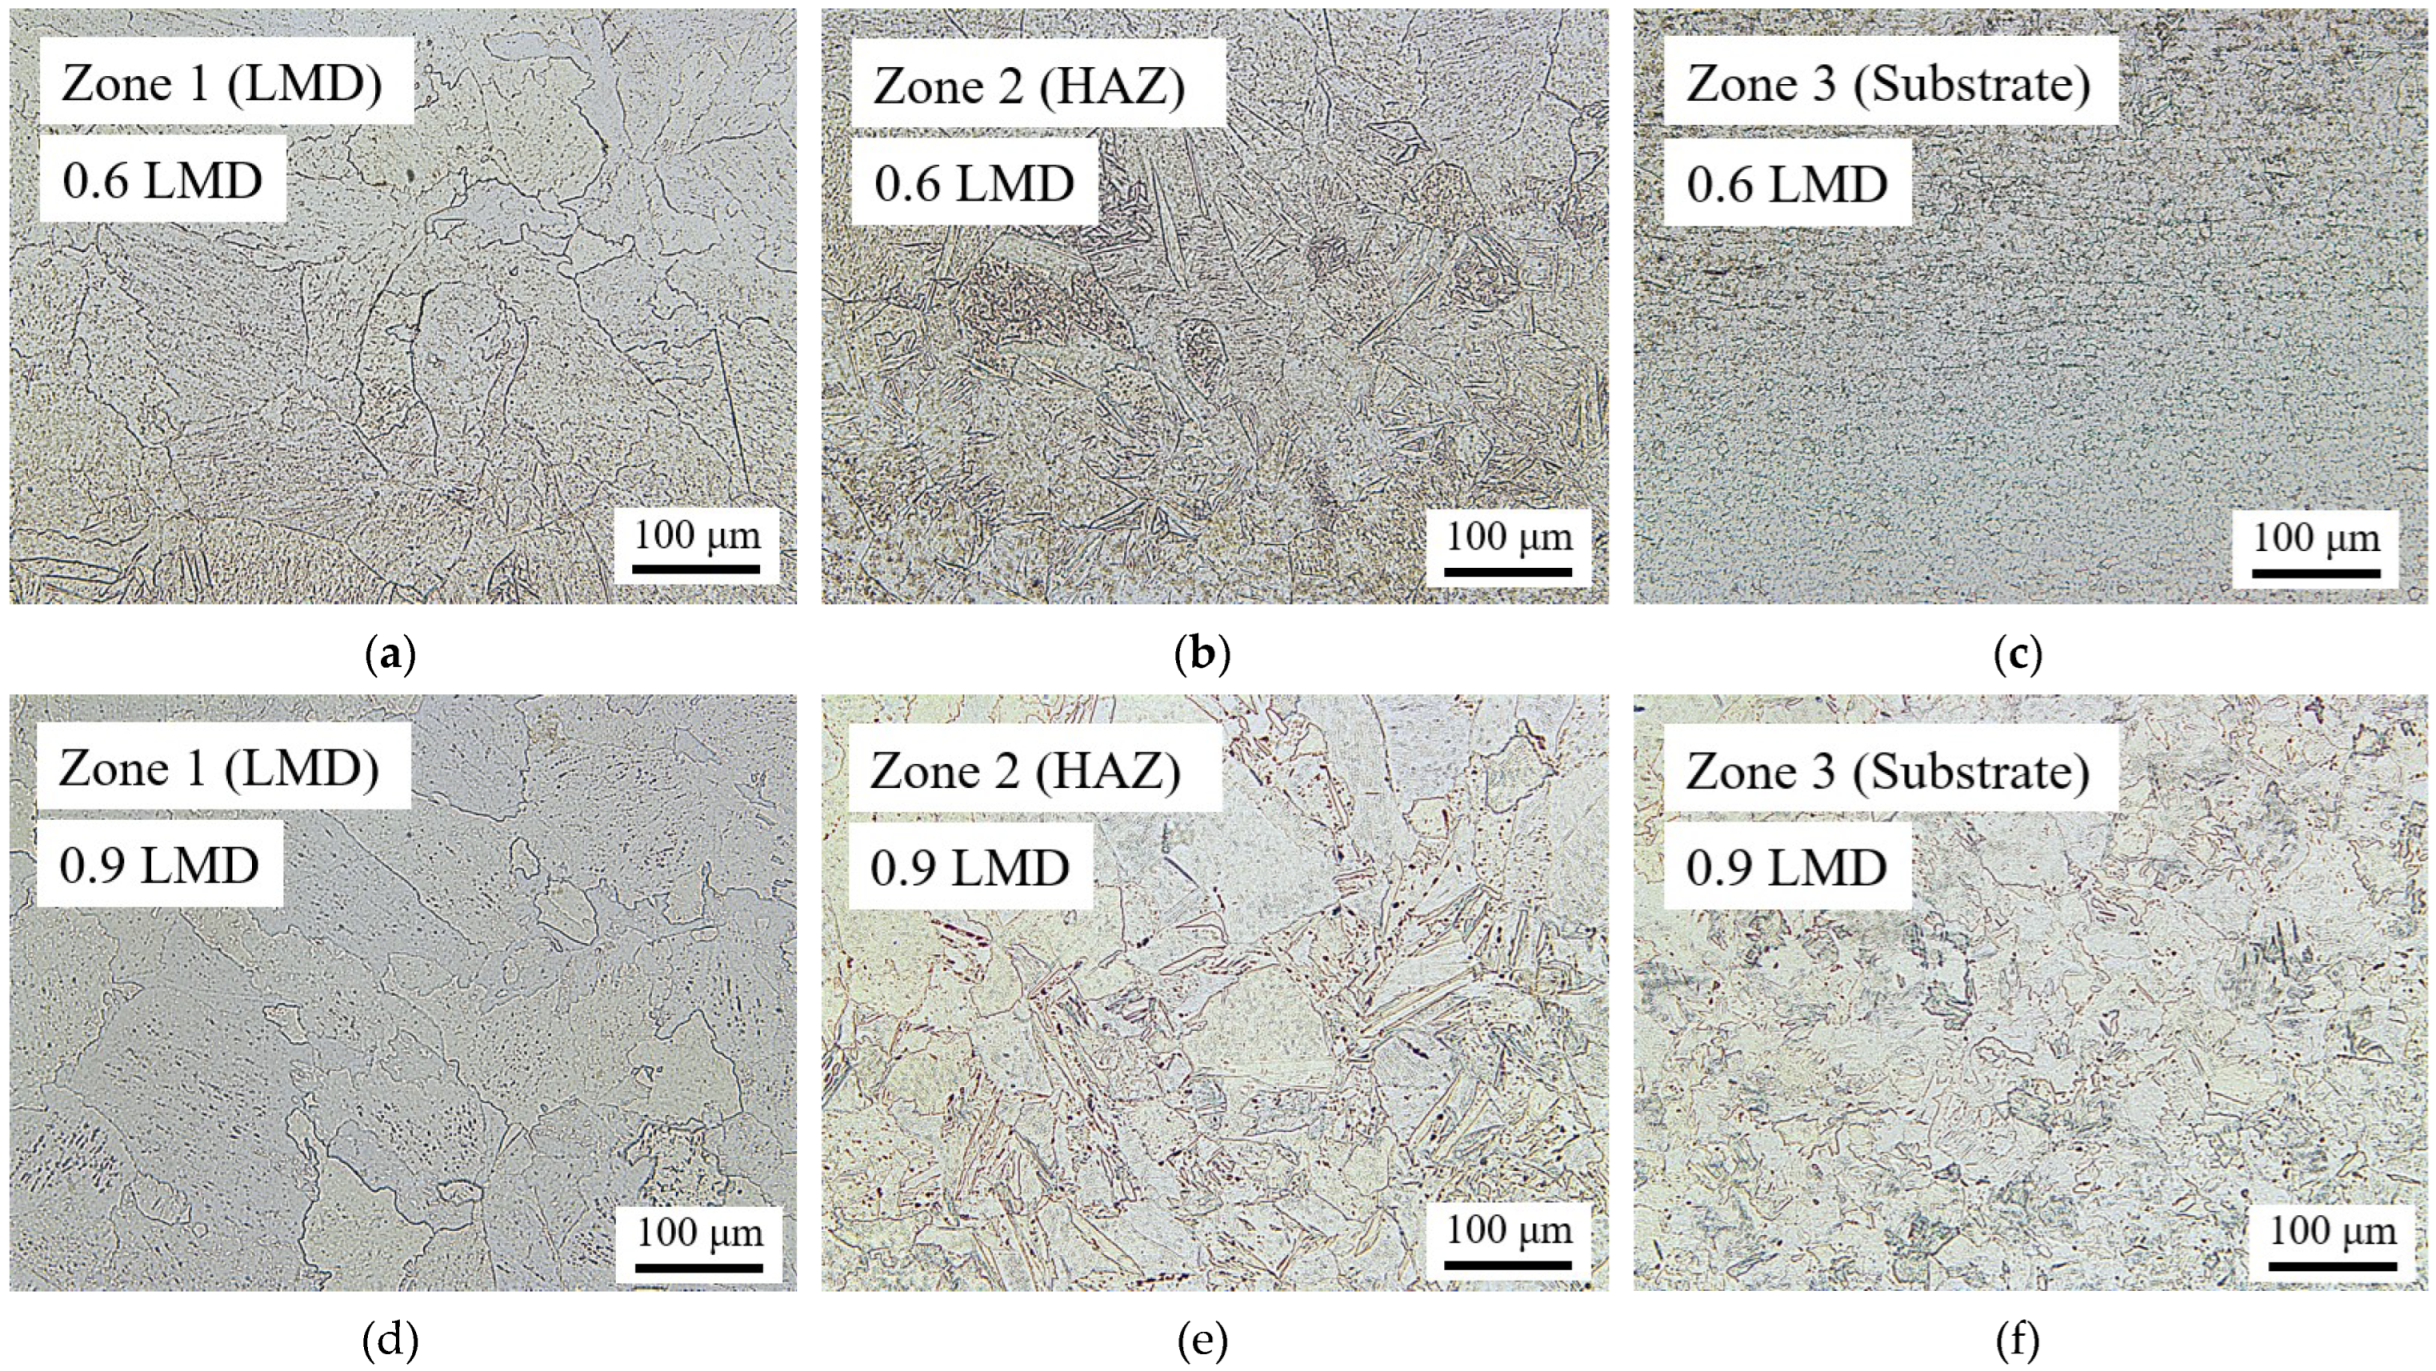
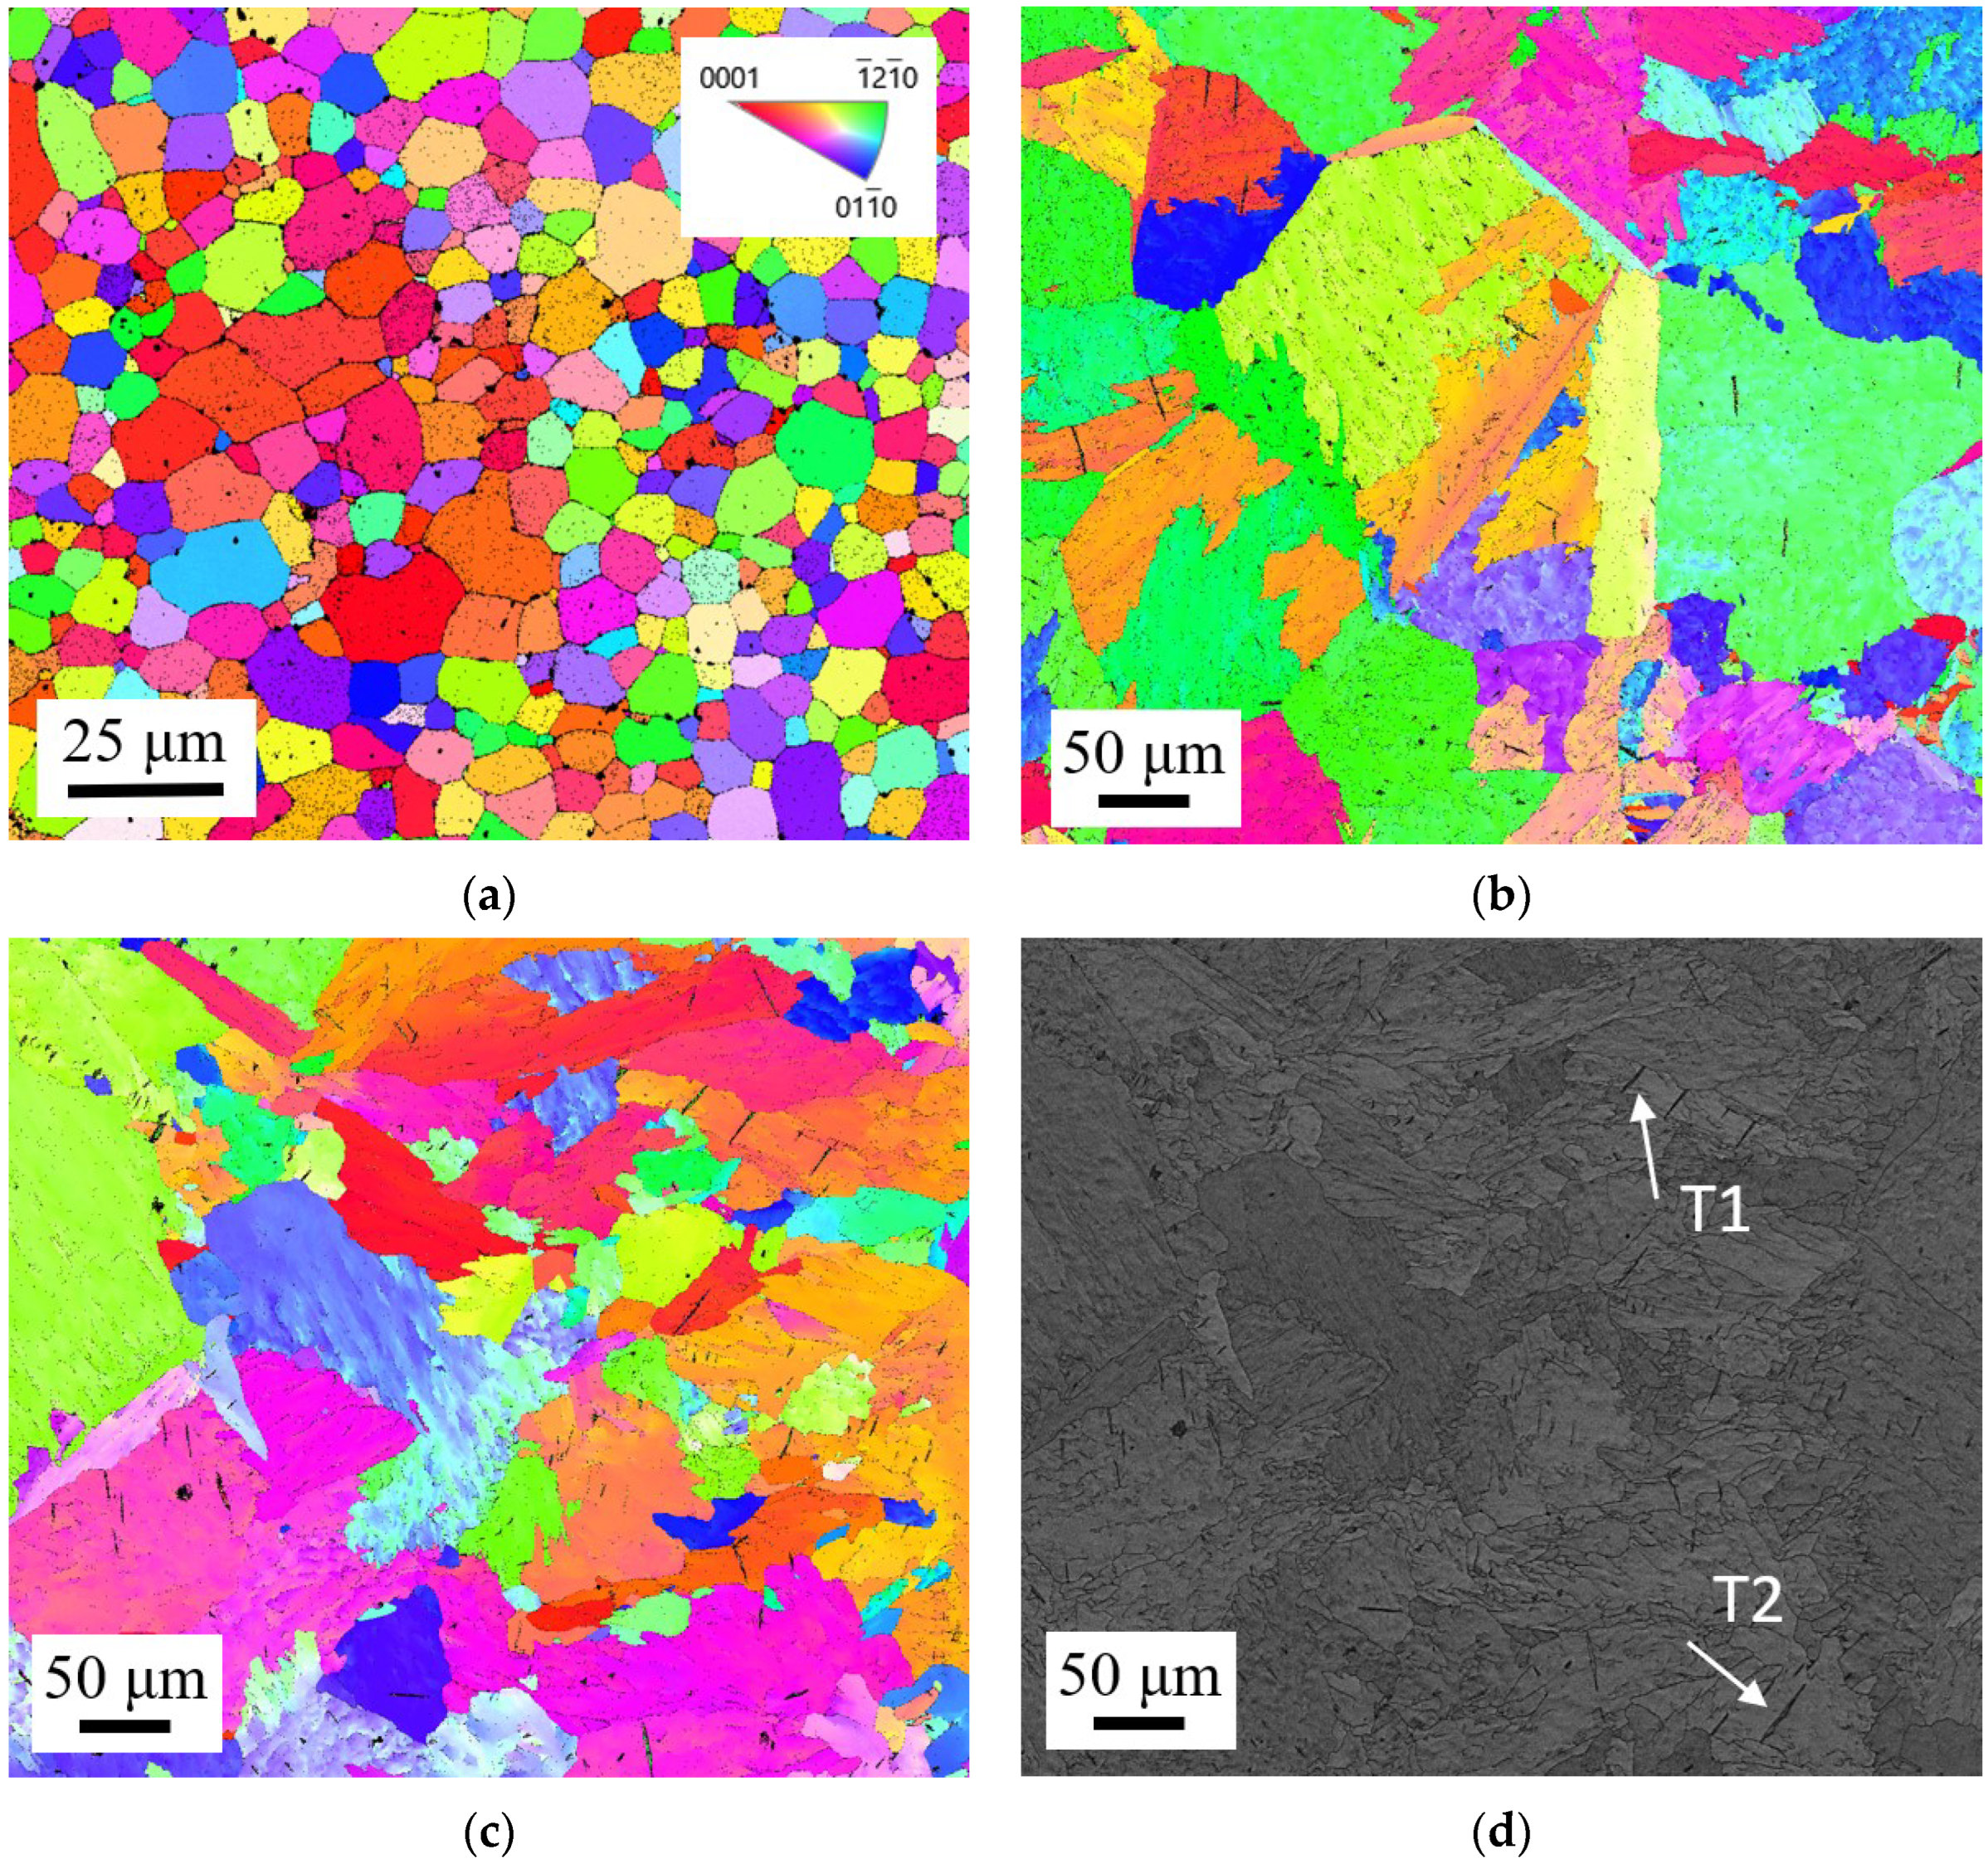
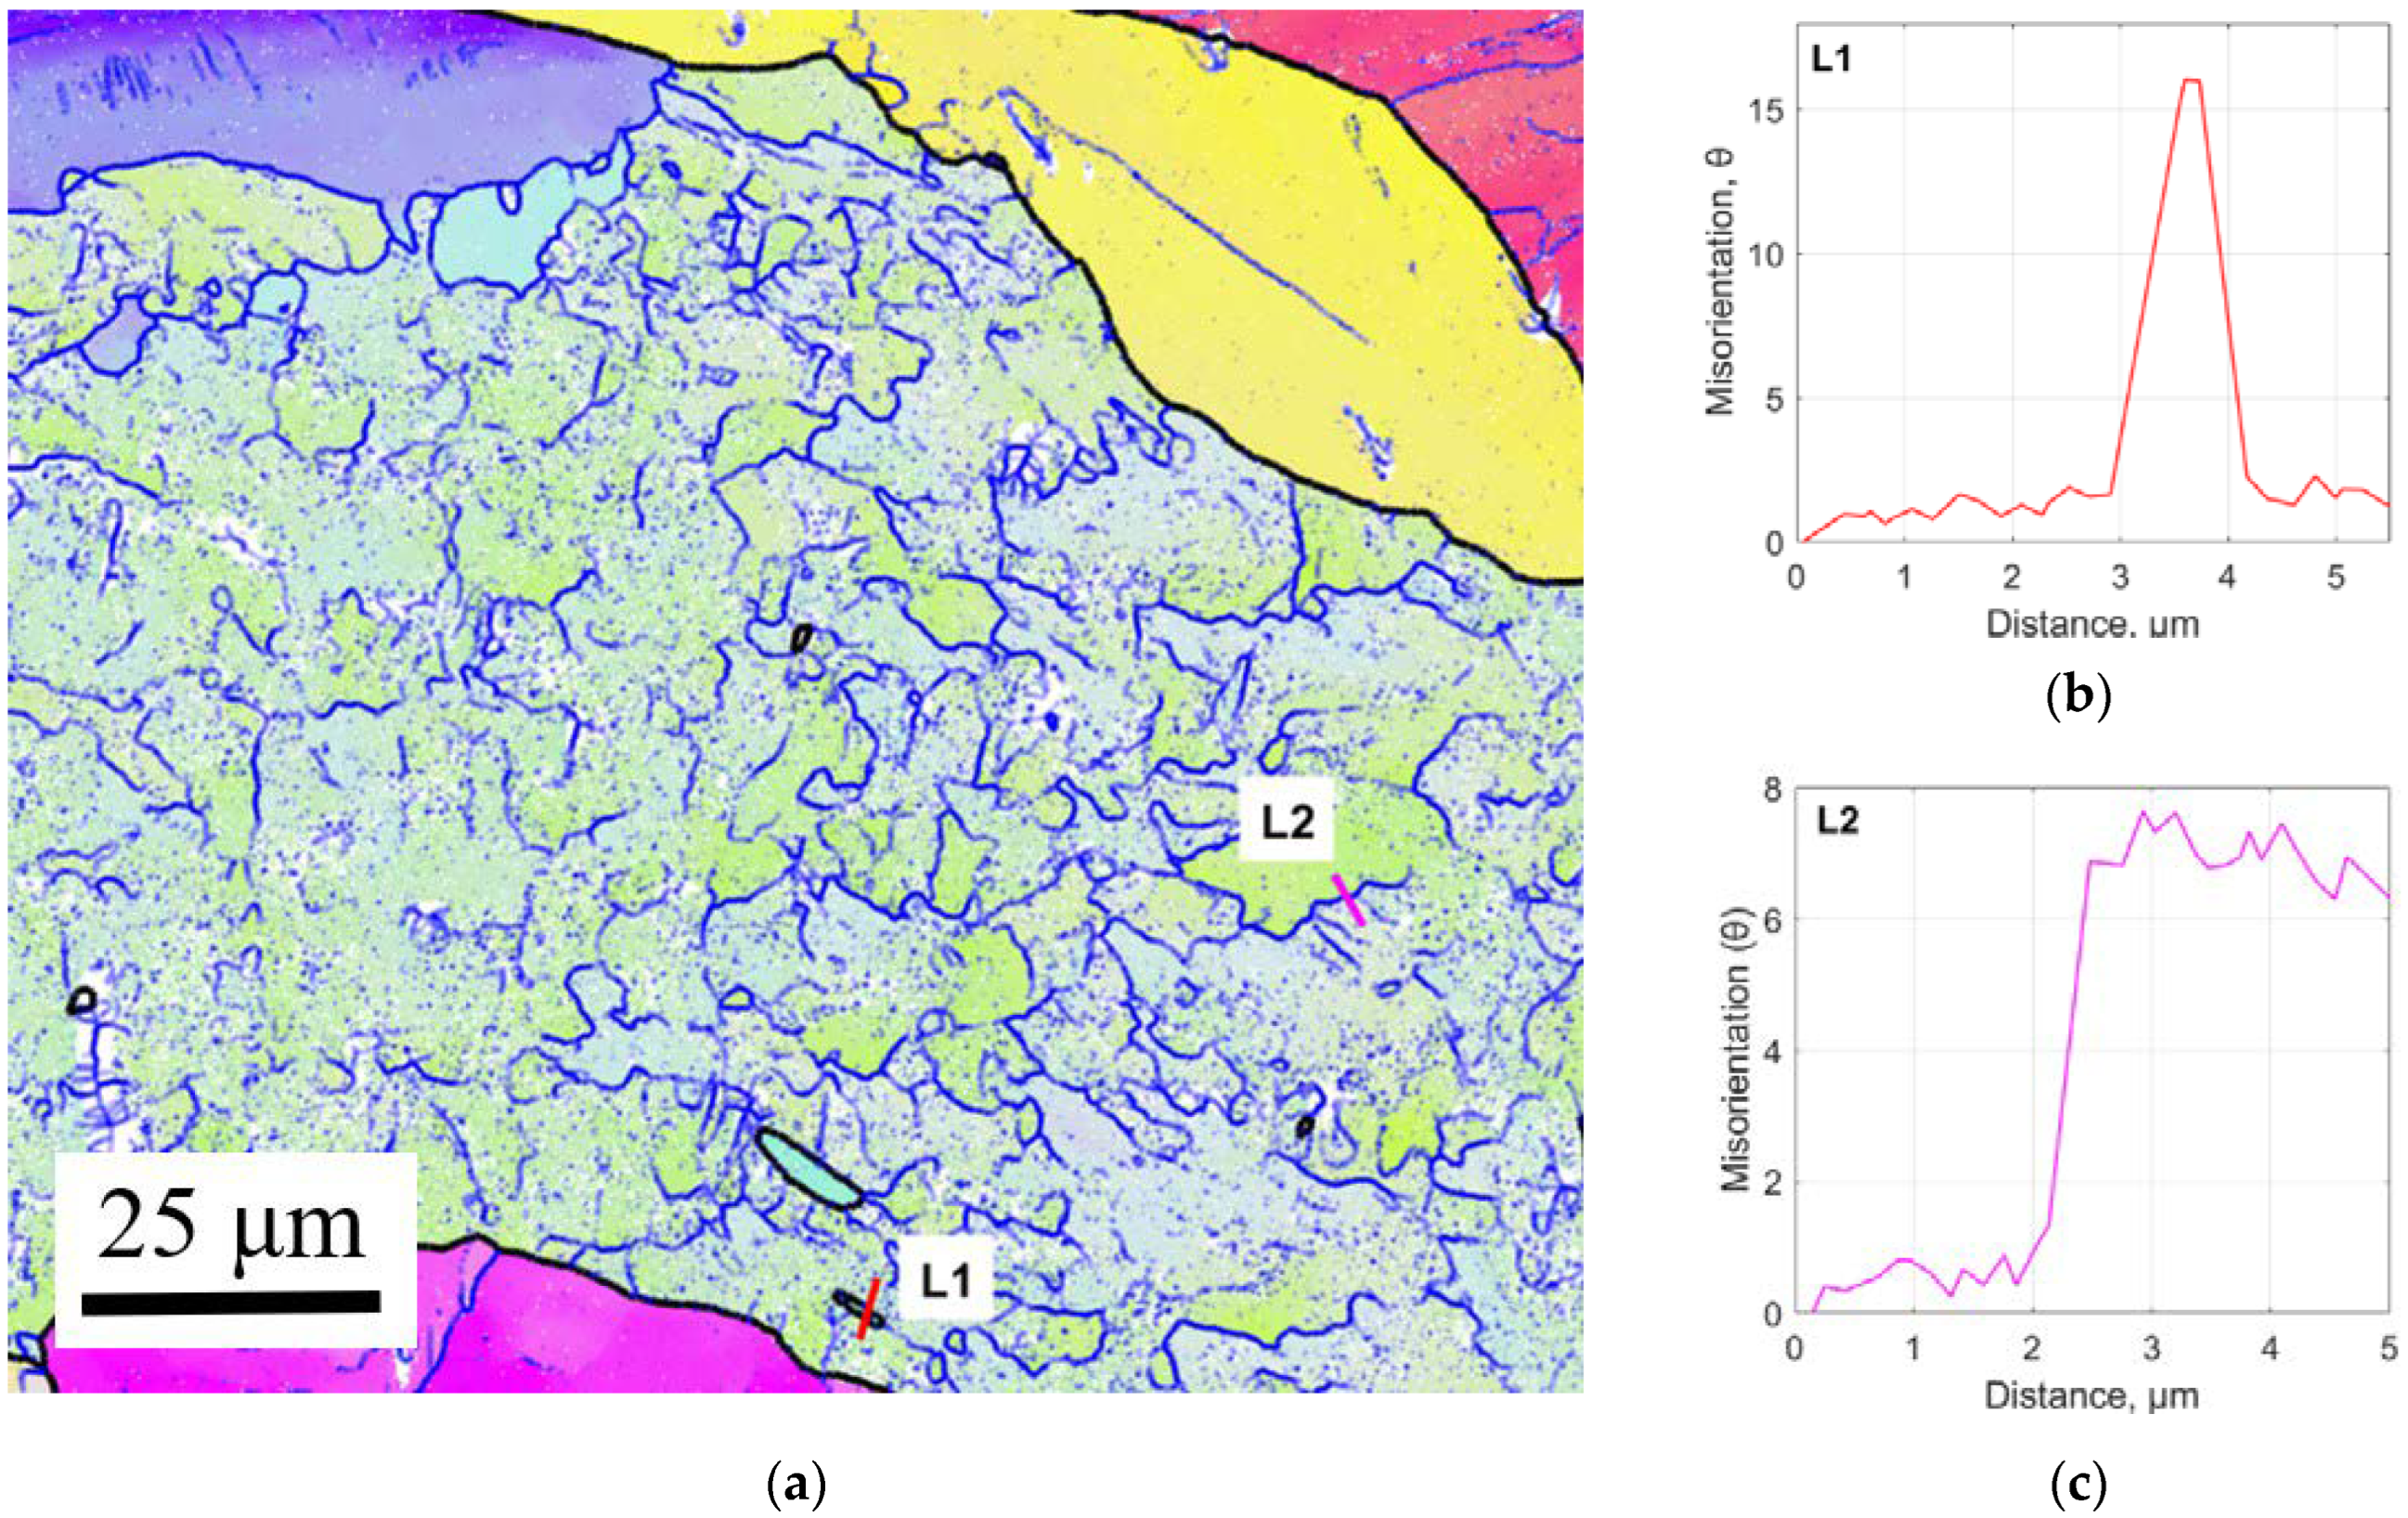
3.1. Microstructural Response to LMD
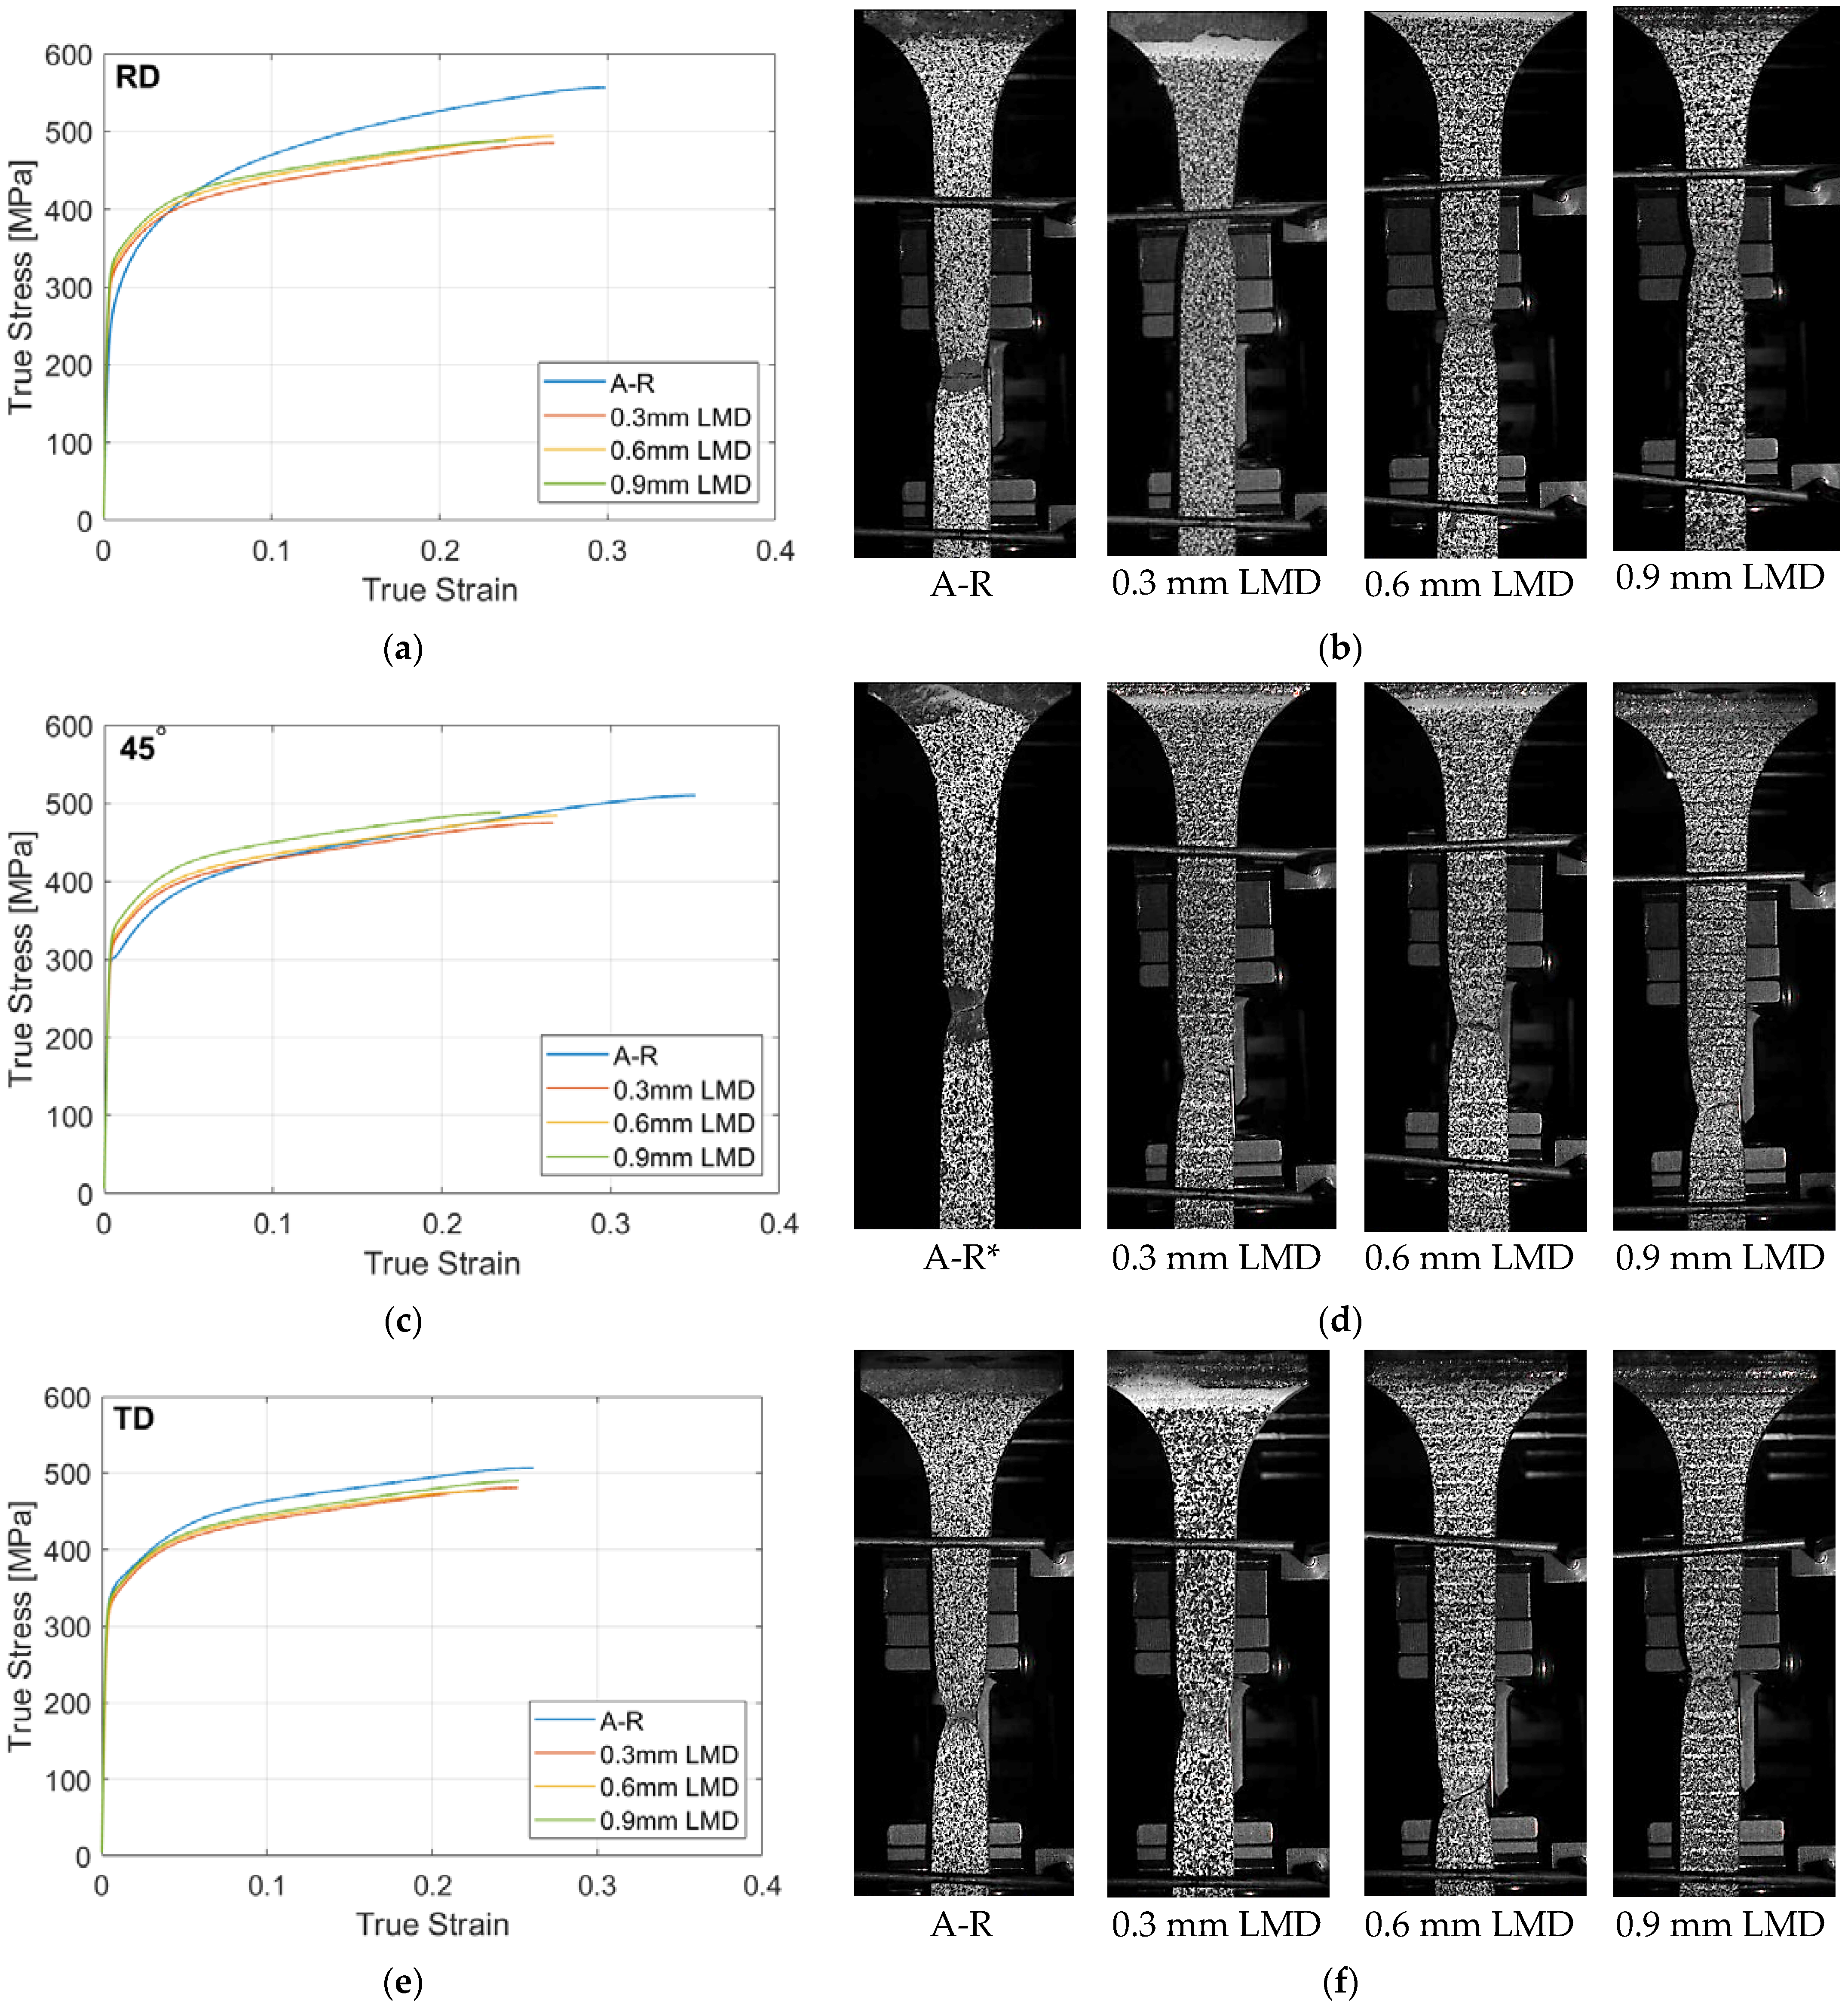
3.2. Mechanical Response to LMD Tailoring
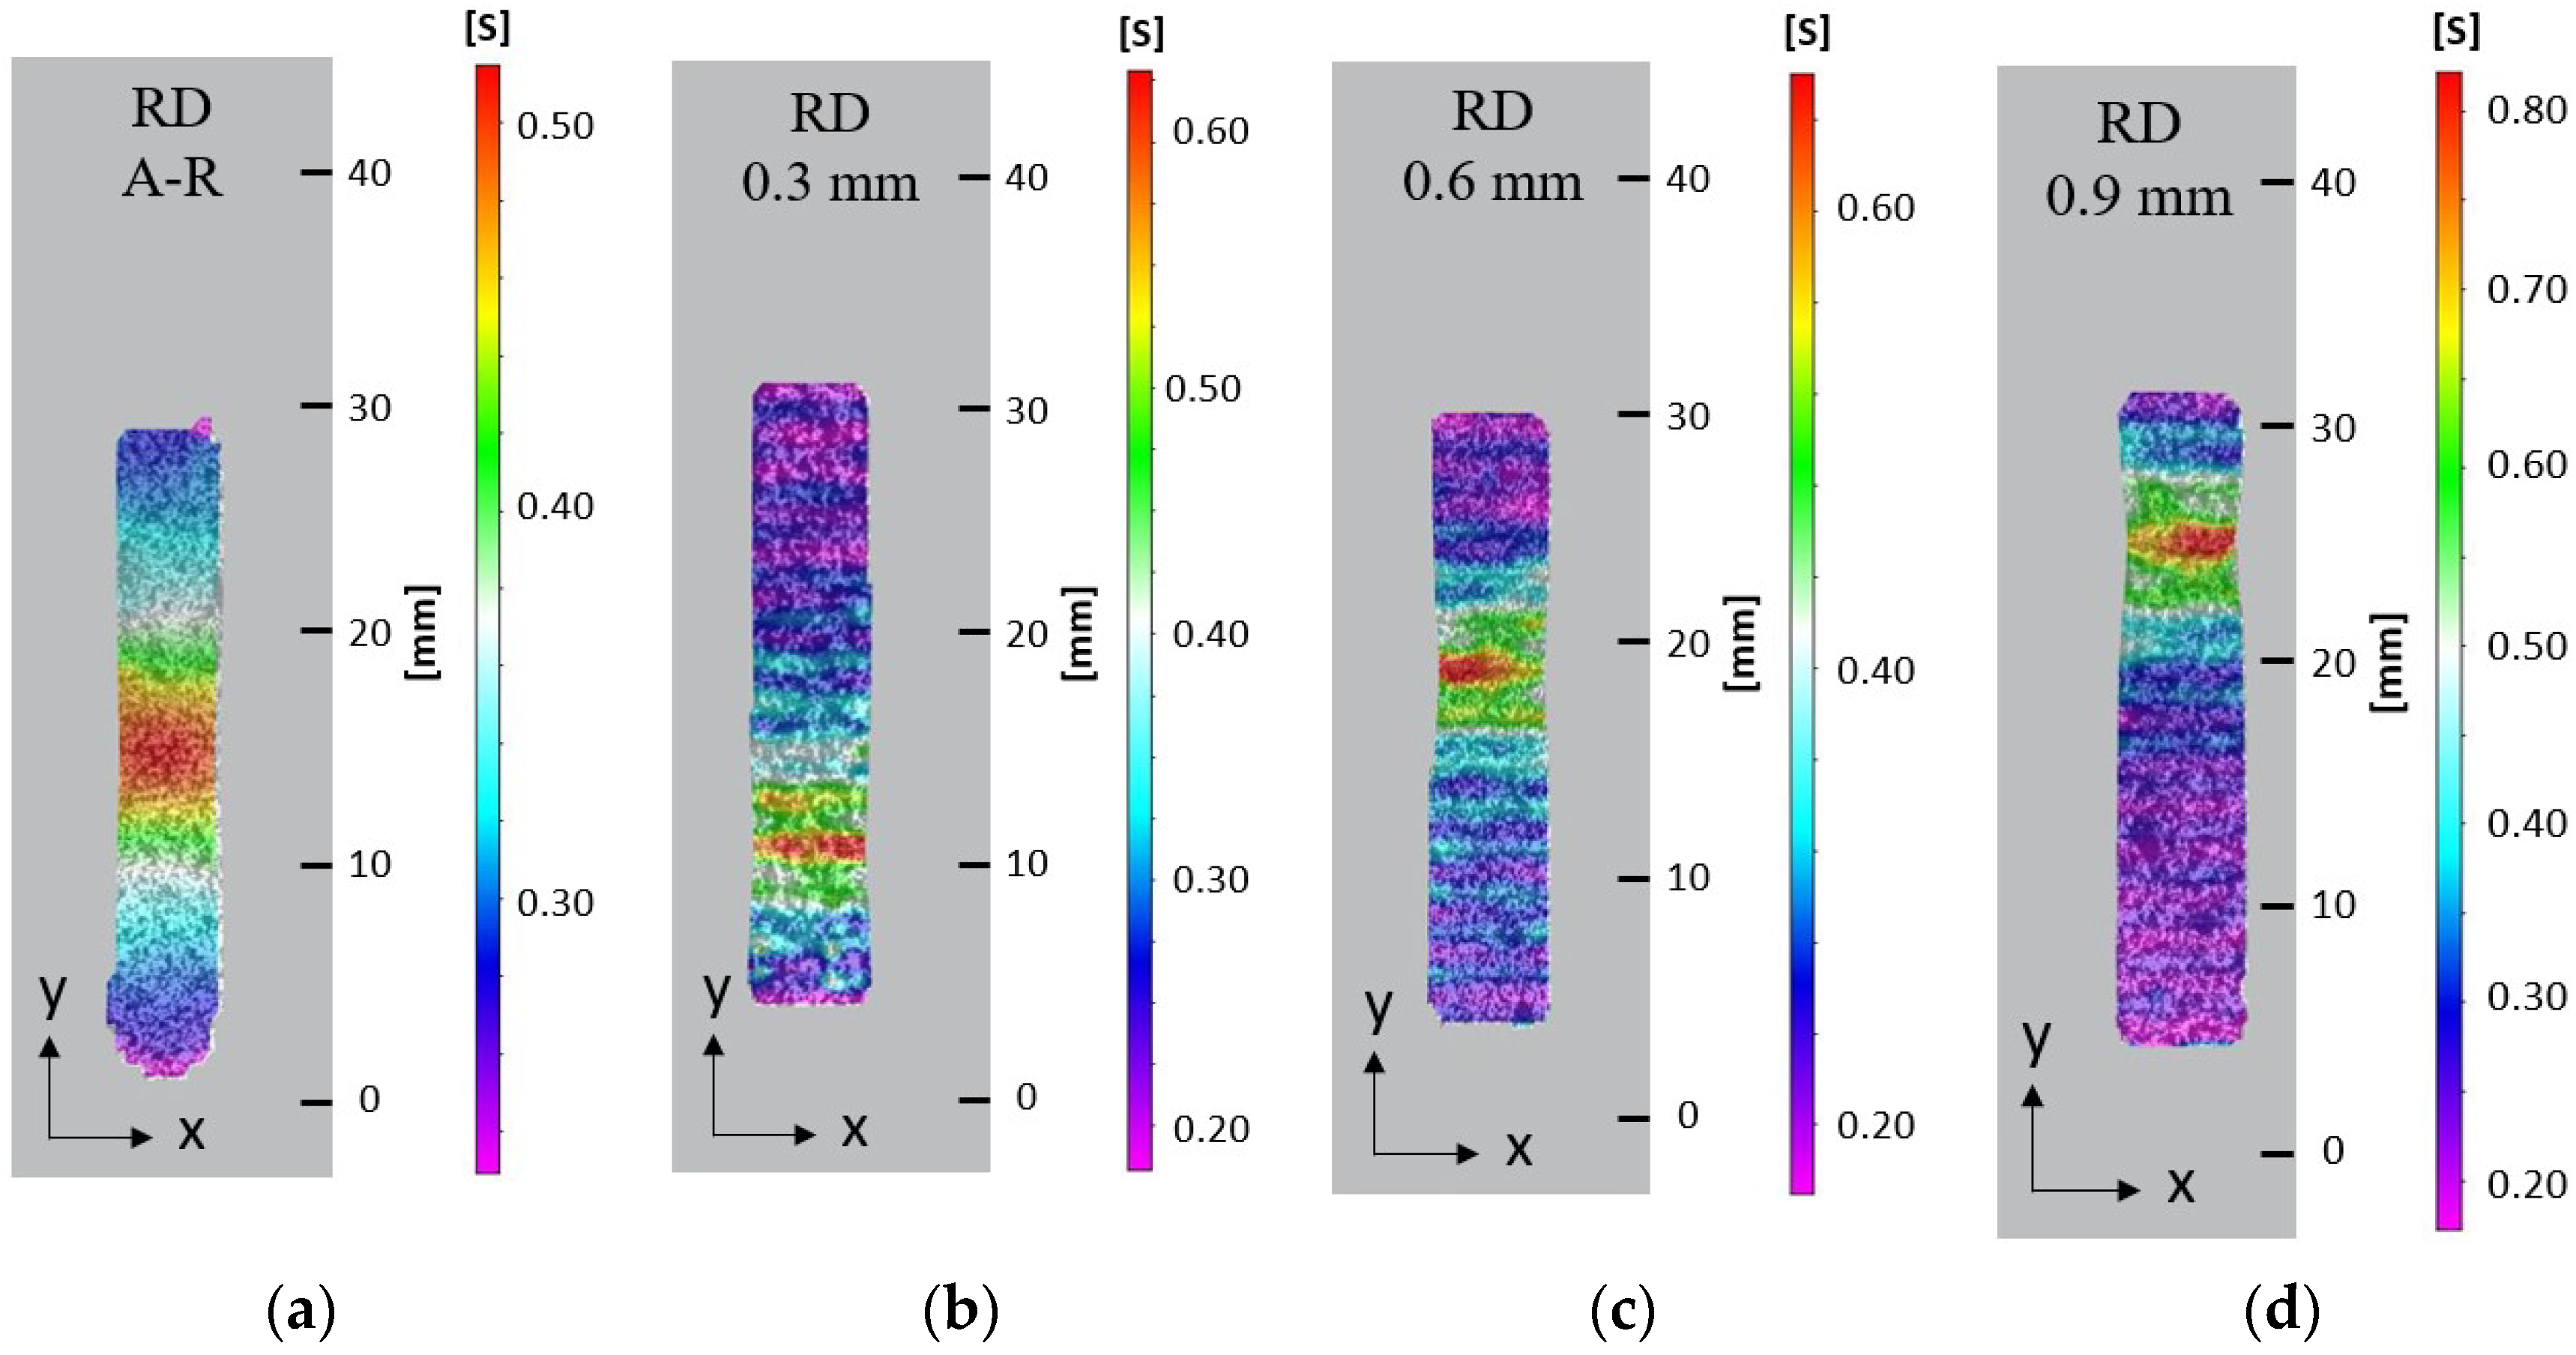
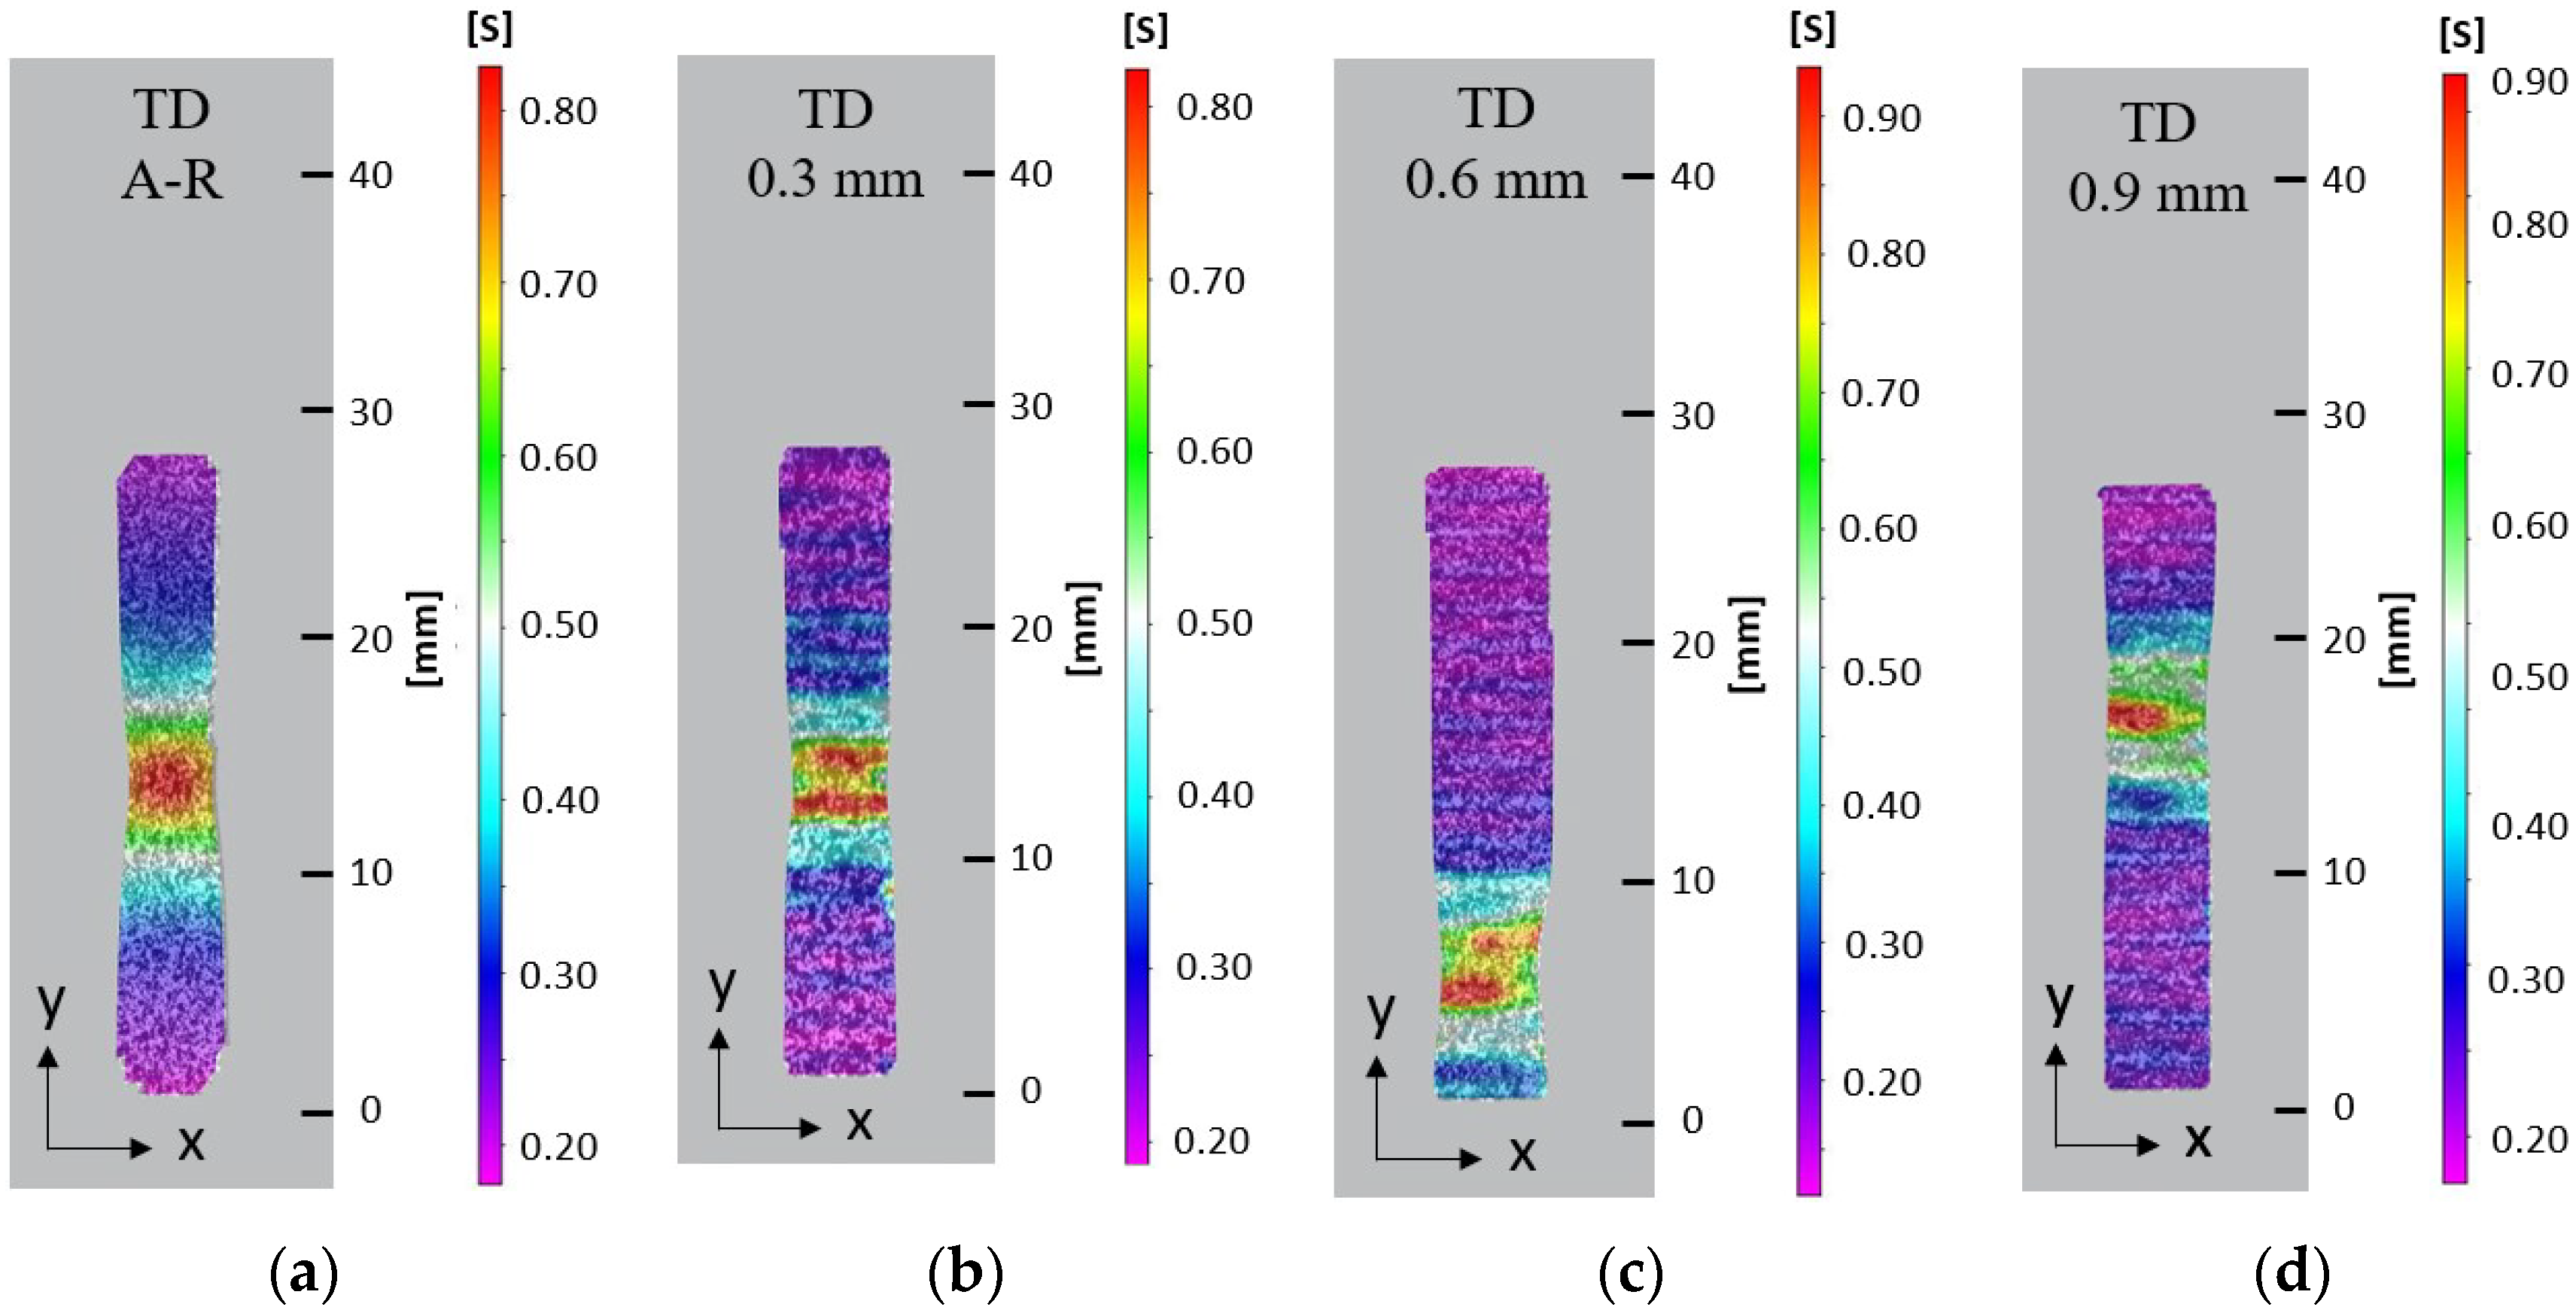
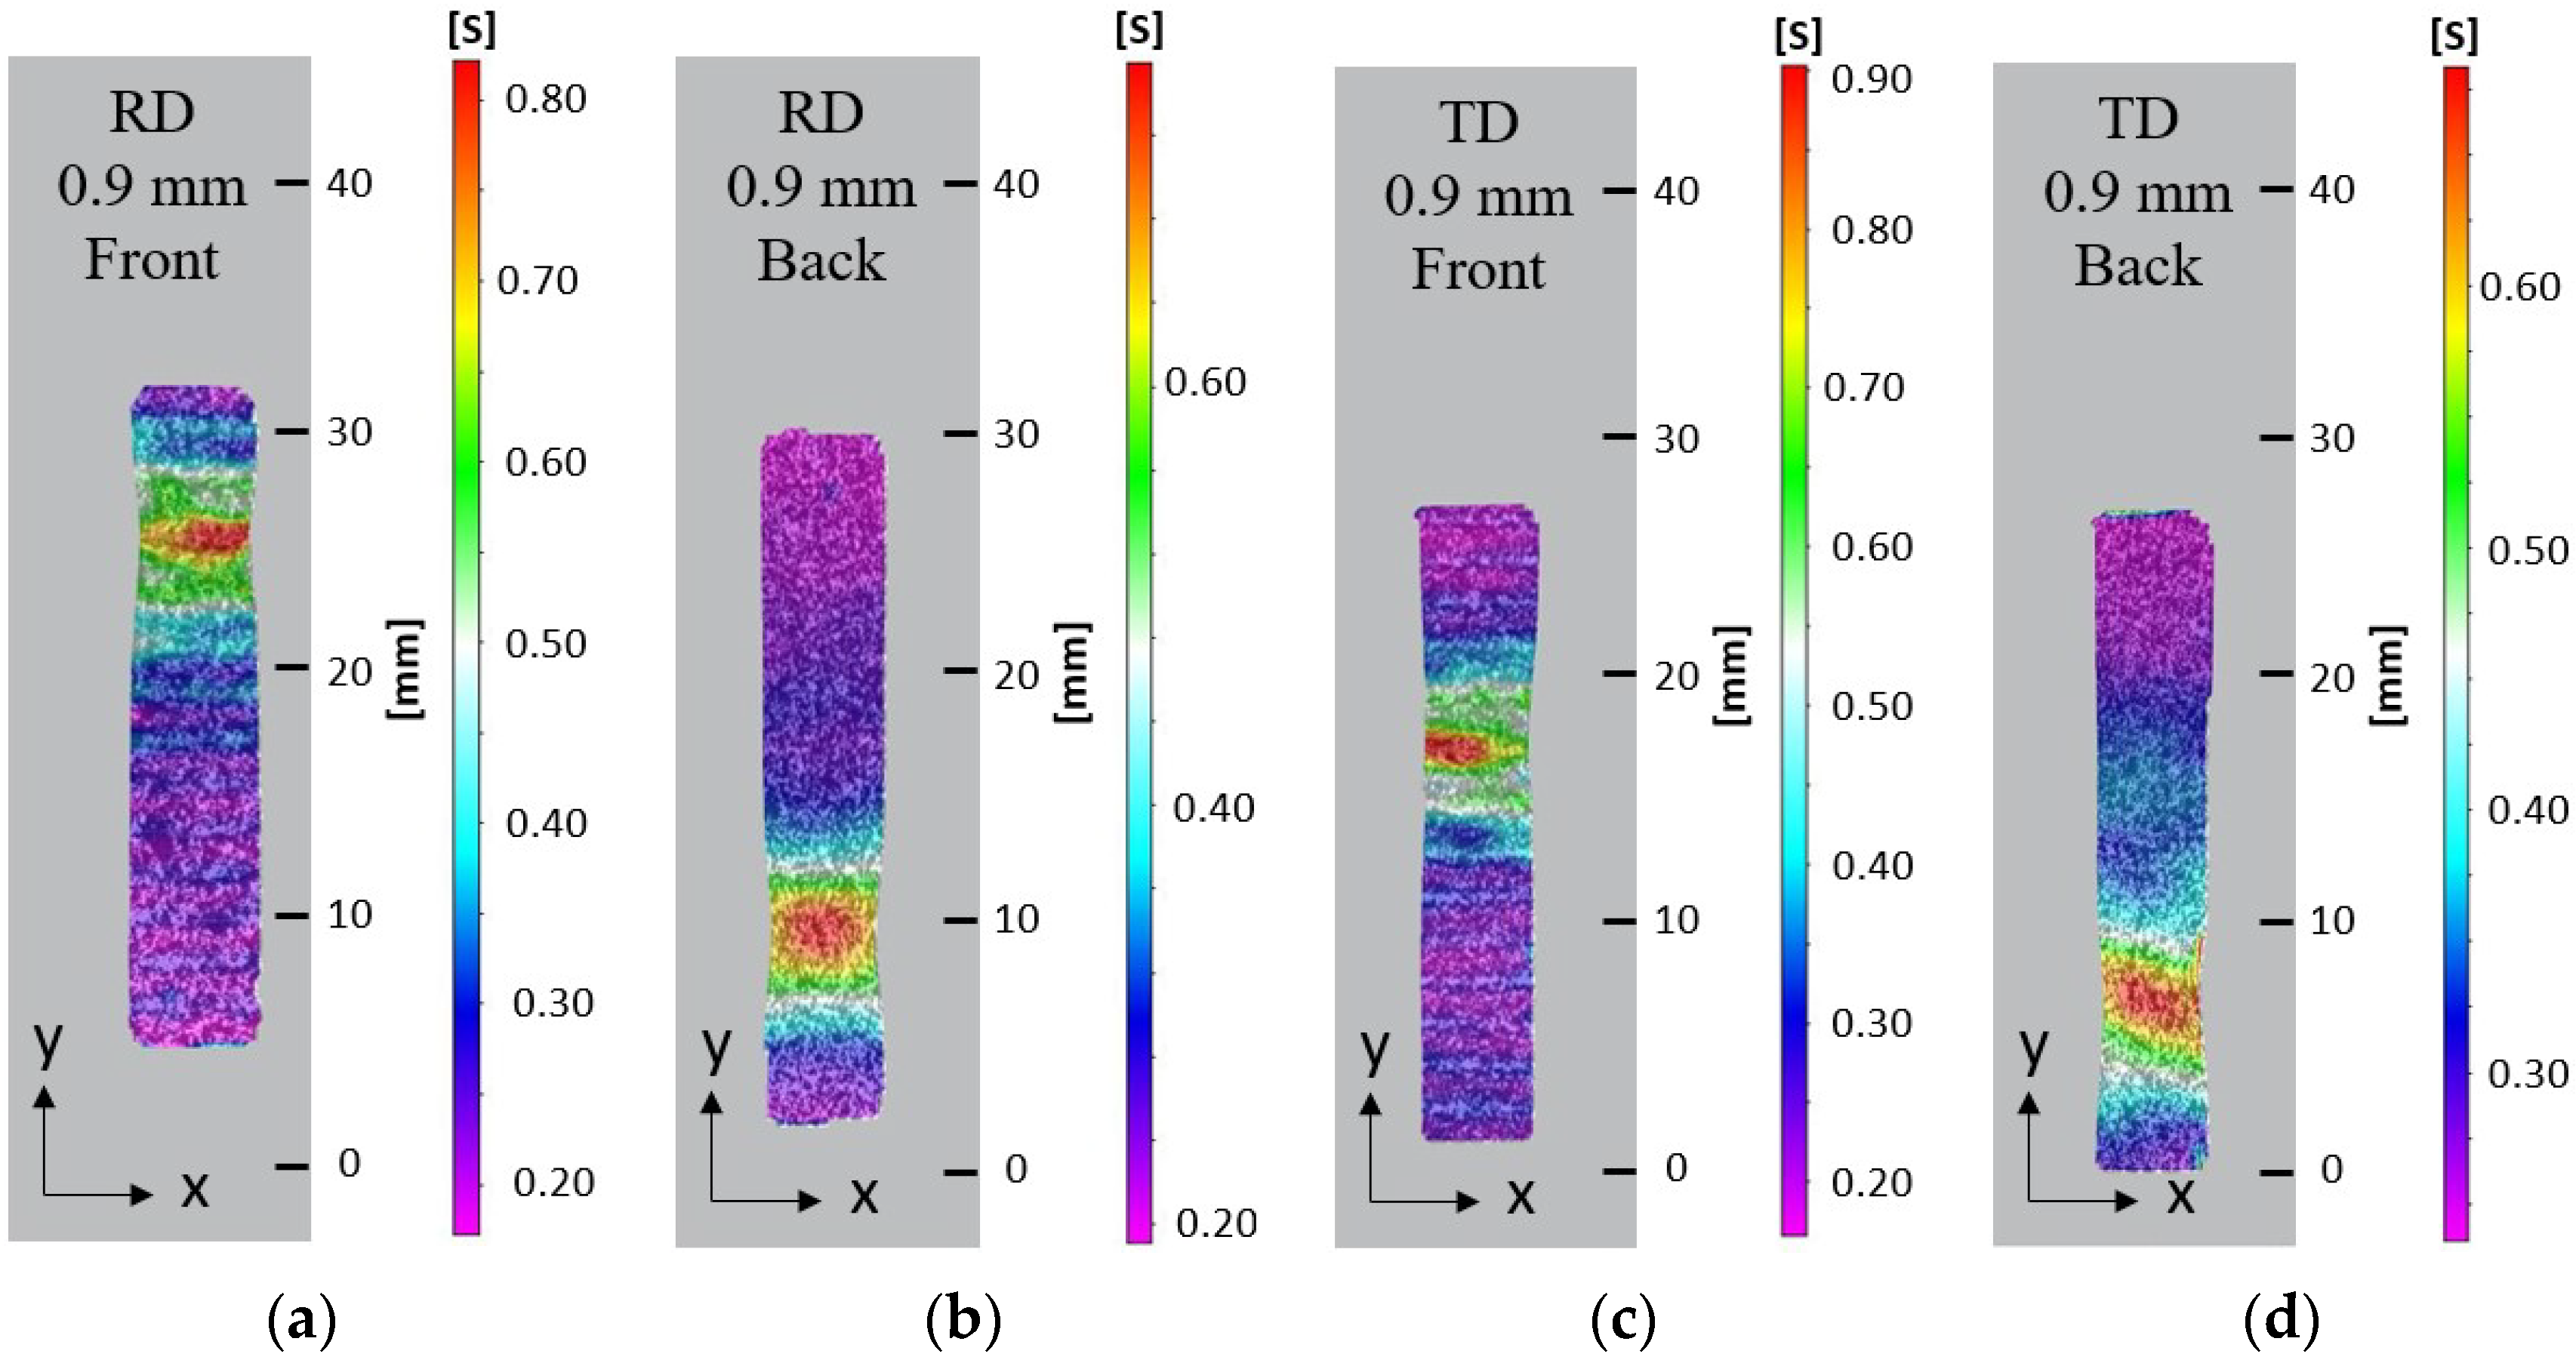
3.3. Strain Analysis of LMD Material
3.4. Material Study
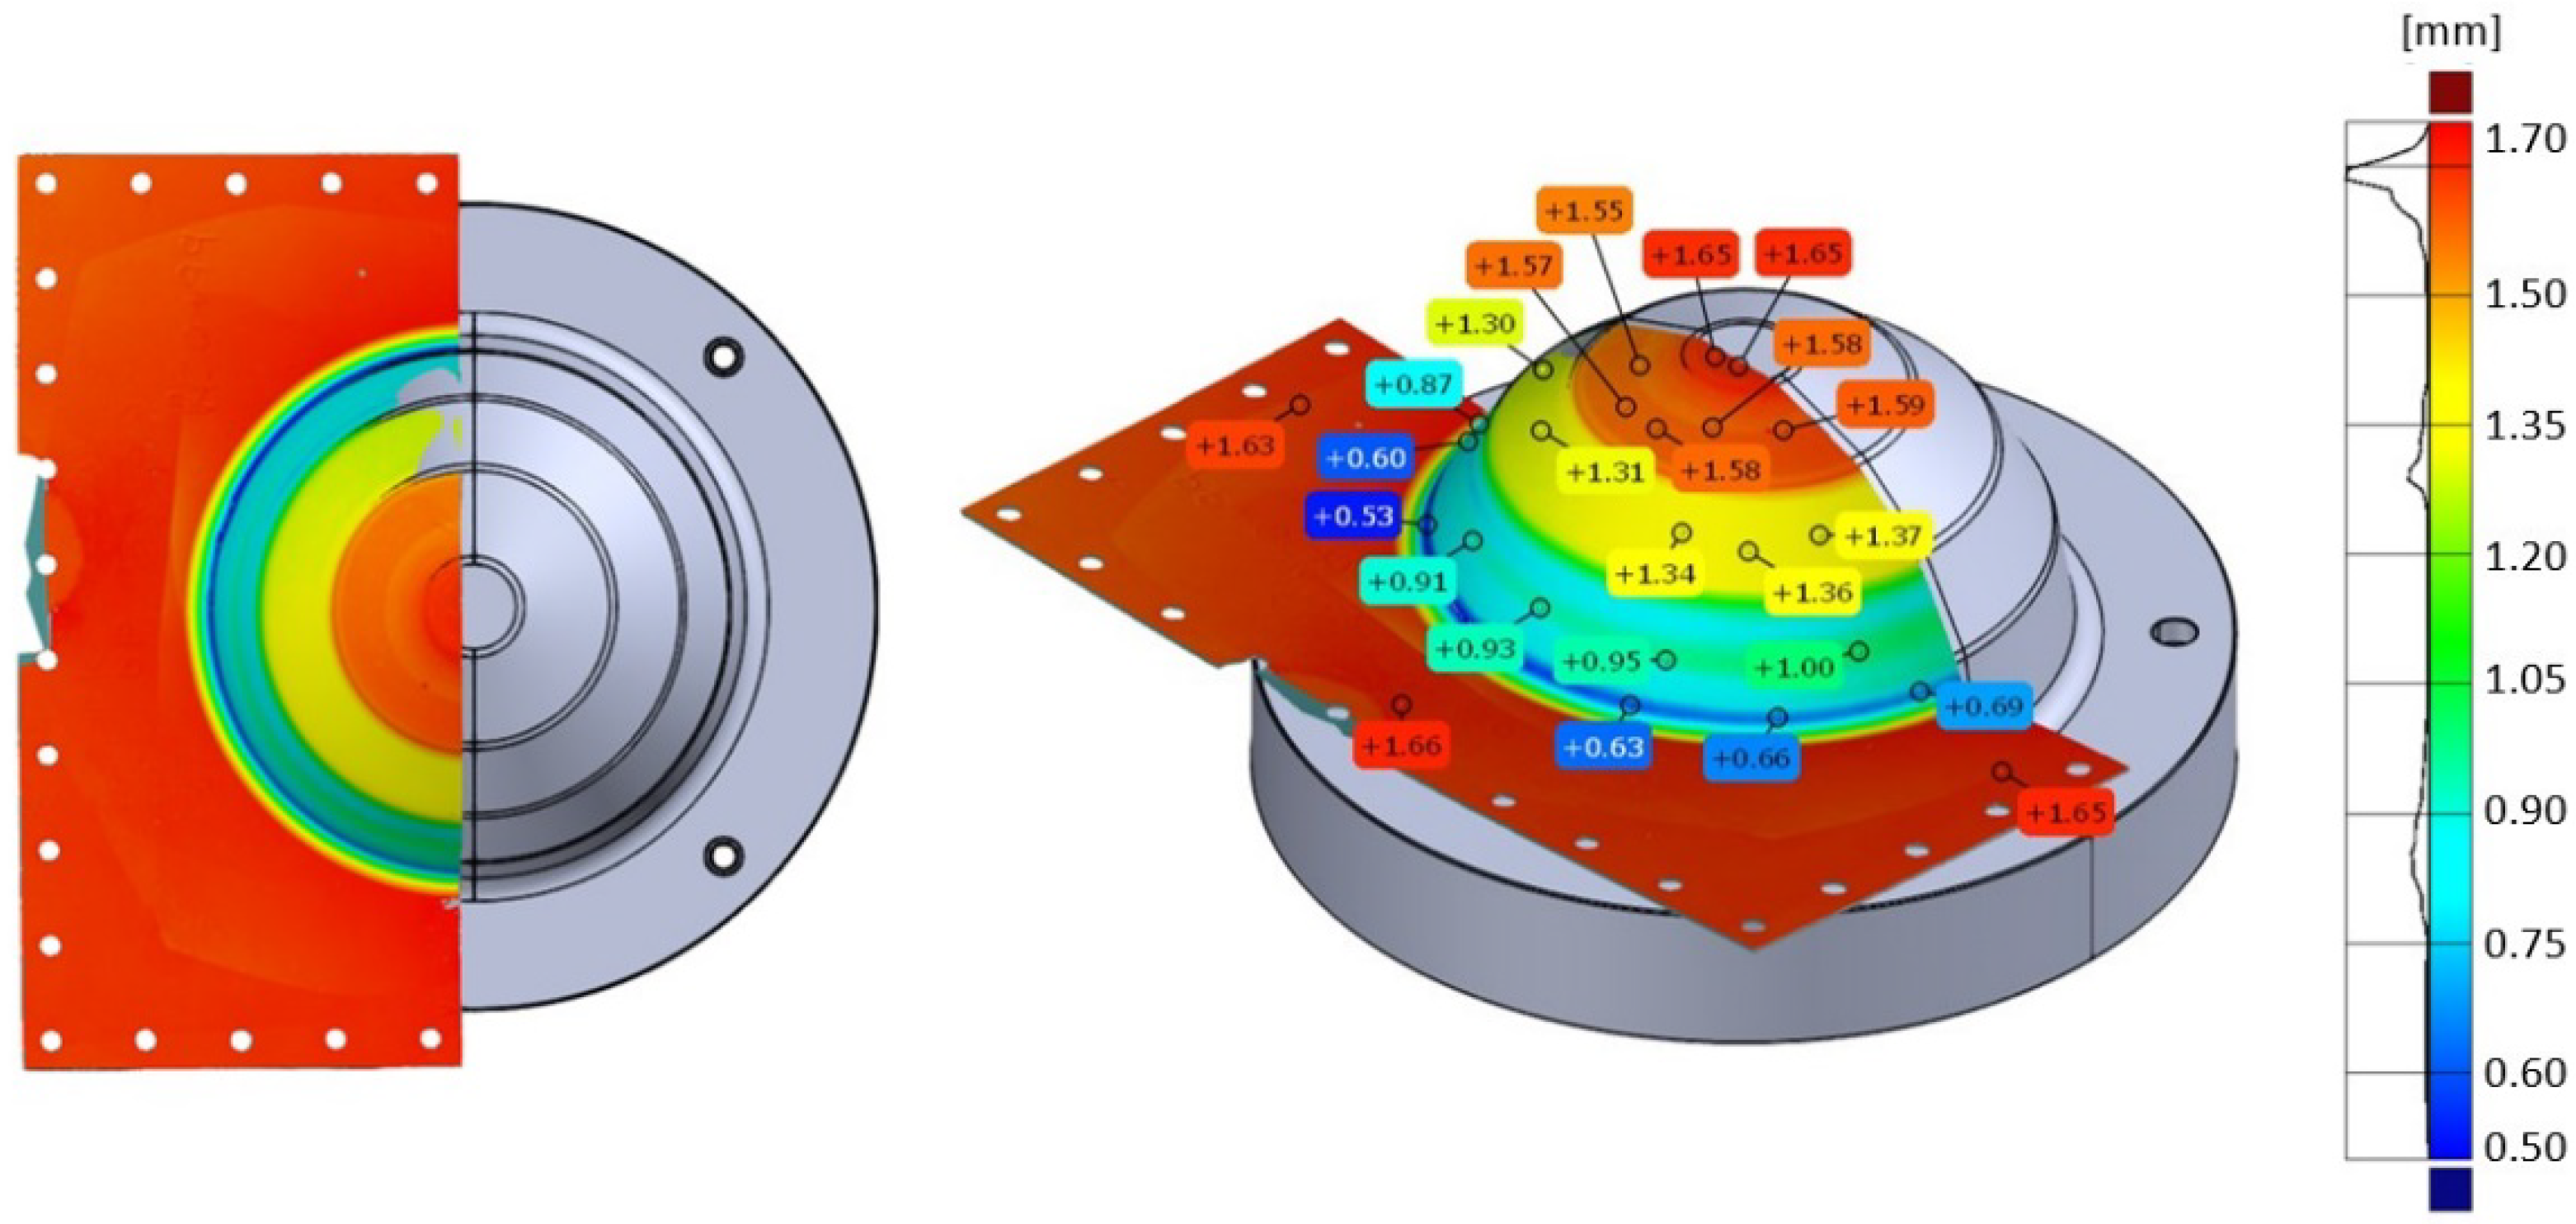
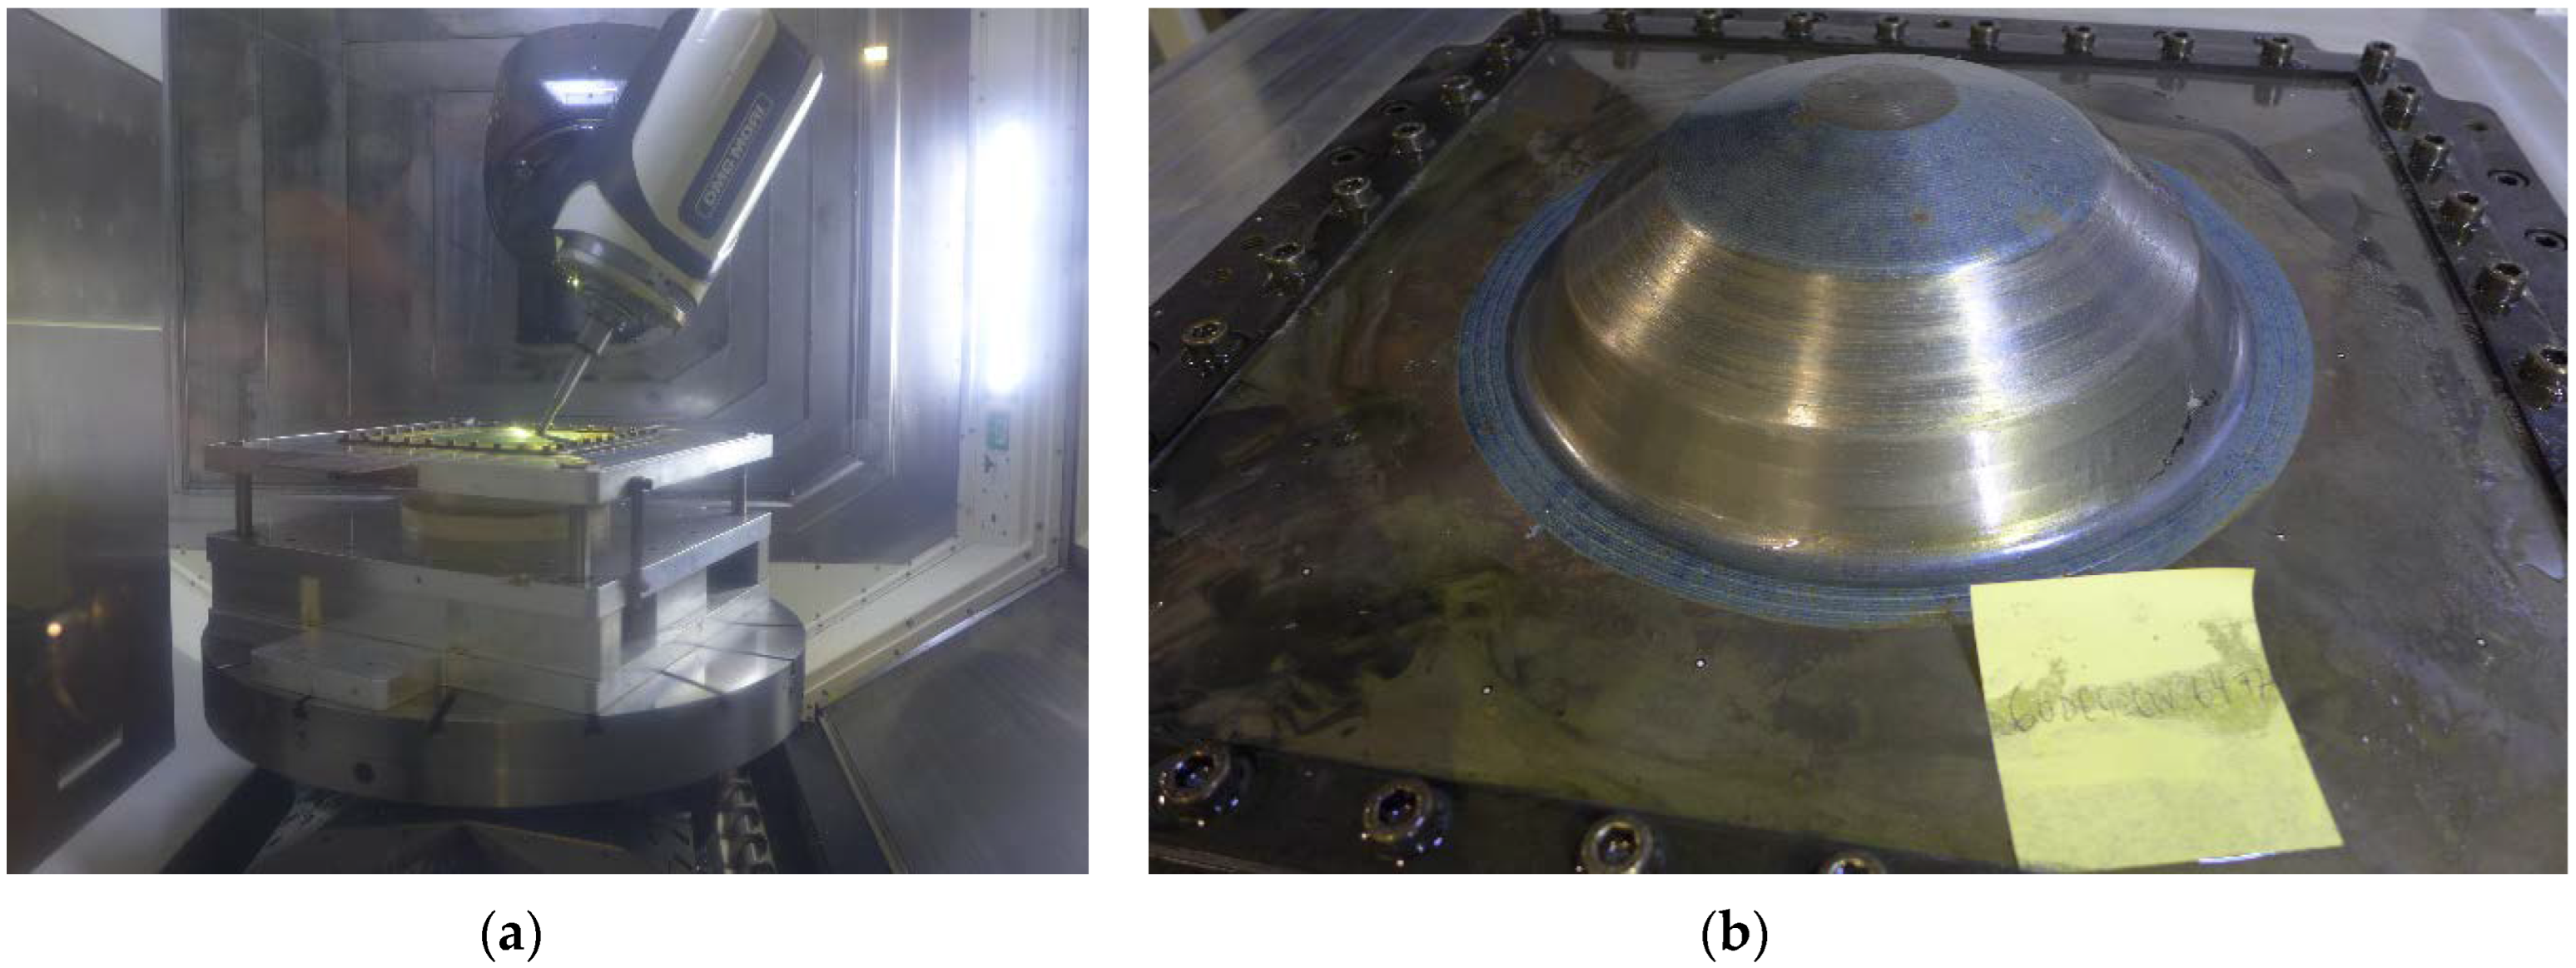
3.5. SPIF of LMD Tailored Preform
4. Summary and Conclusions
- Microstructural analysis of the LMD tailored material showed distinct regions across the thickness of the material sample. This consisted of the LMD deposited layer, a HAZ interface zone and the non-transformed substrate material.
- EBSD analysis of the LMD tailored material showed grain growth in response to LMD. Fragmentation of large grains was observed with intragranular LAB misorientations and fully enclosed HAB grains.
- Isotropic mechanical properties were observed in the LMD tailored material in contrast to the anisotropic properties of the A-R CP-Ti50A sheet. The LMD build height appeared to have little influence on strength. As such, an SPIF preform can be designed without significant consideration of directionality, or concerns about the thickness of LMD material. The results indicate LMD reinforcement reduces material ductility and lowers formability of CP titanium.
- In-situ DIC analysis during tensile testing showed the LMD build geometry to alter effective strain distribution across the sample surface, with surface strain propagating parallel to the LMD beads. This differs from the homogeneous spread of surface strain across the A-R samples.
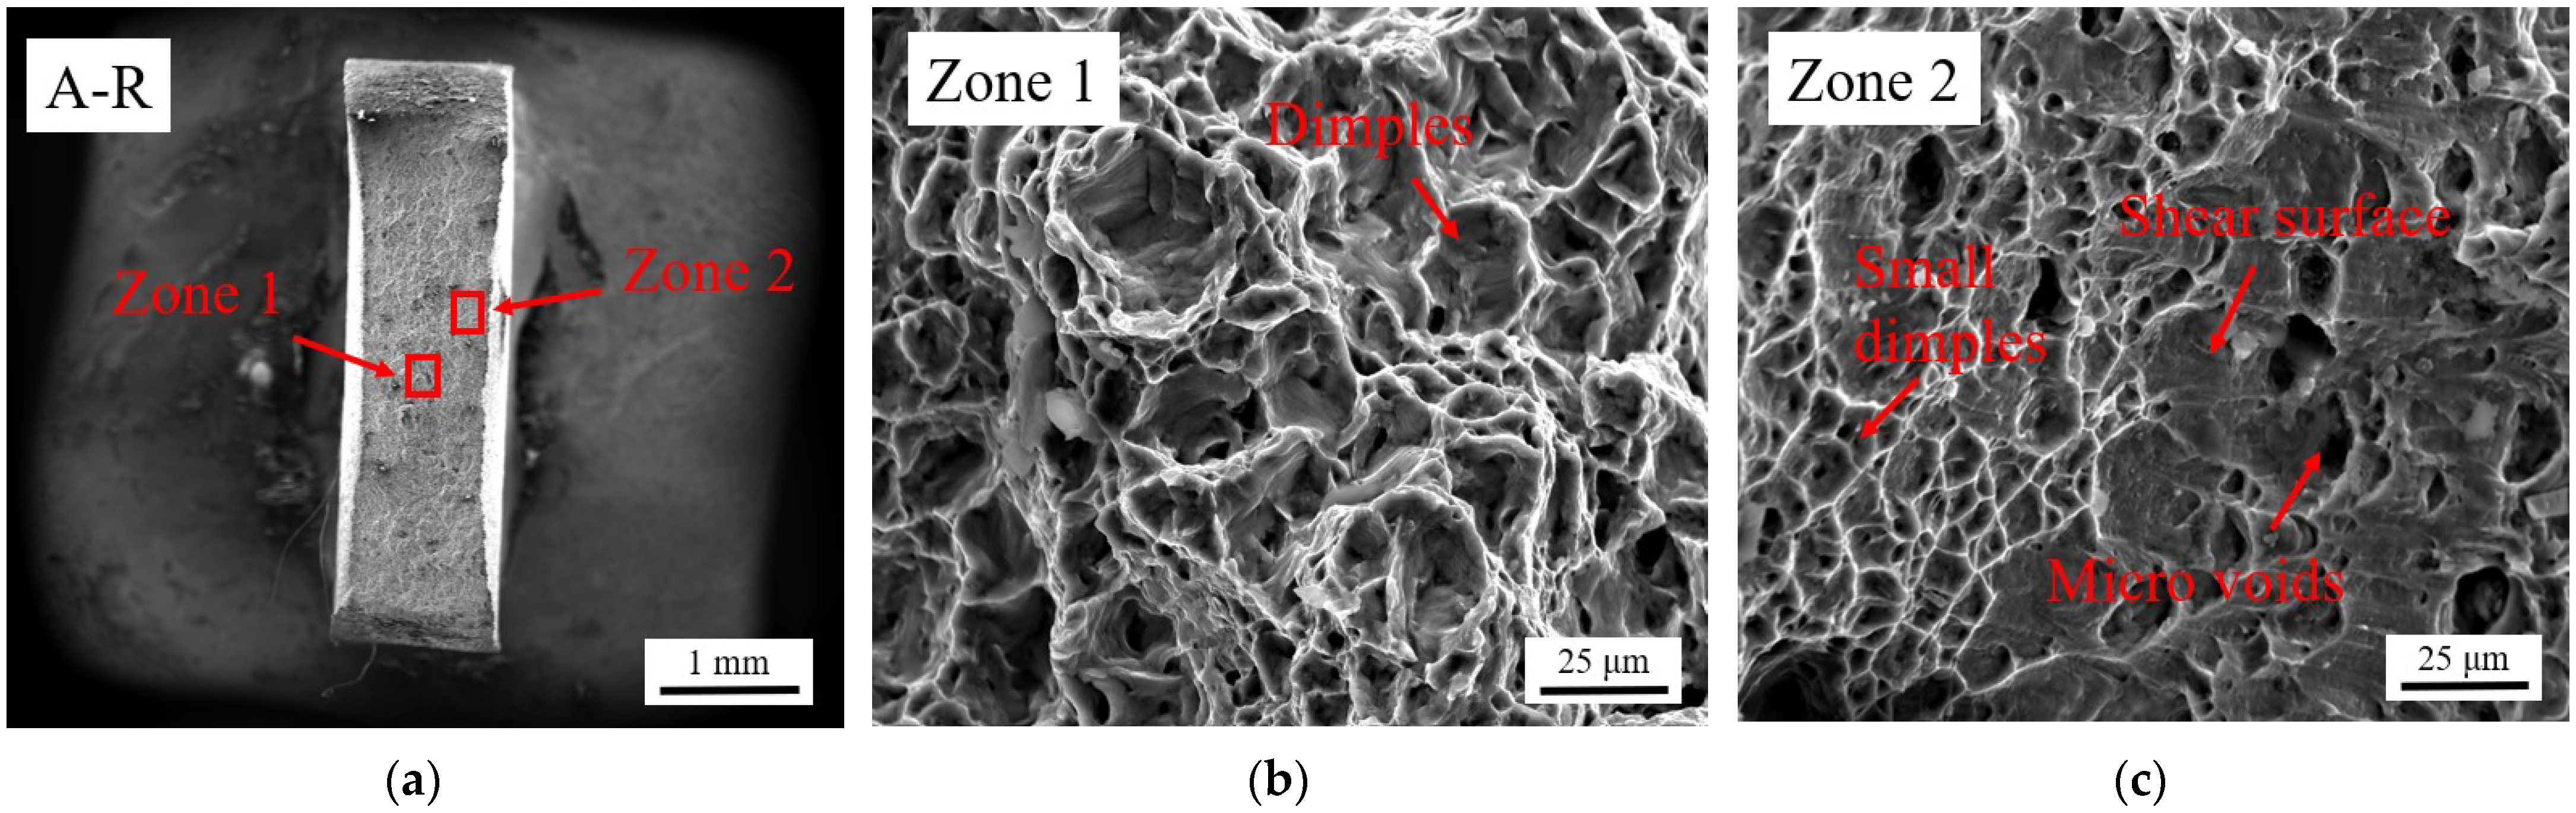
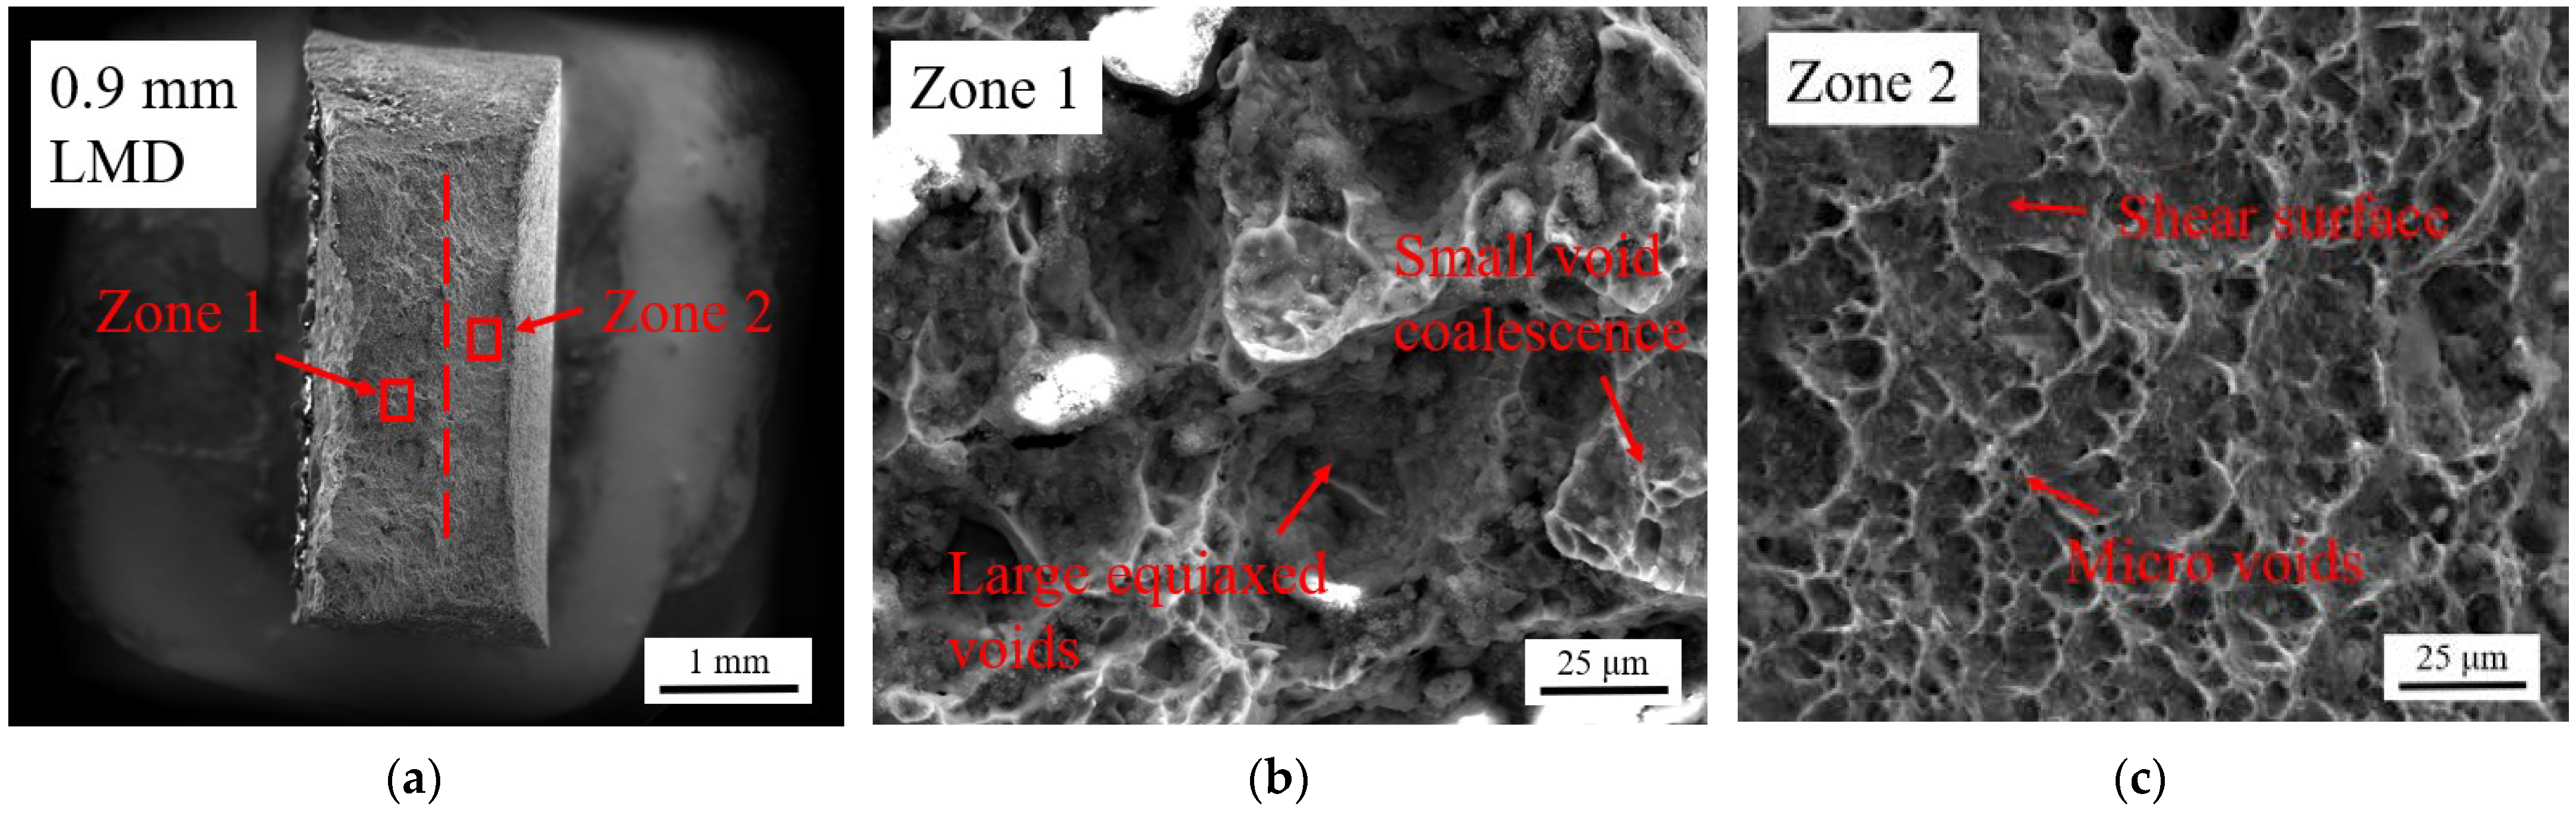
- Fractography analysis of the LMD thickened material fracture face showed a population of dimples and fine microscopic cracks, accompanied by large equiaxed voids with internal coalesced microscopic voids. No delamination of the deposit layer was evident suggesting good cohesion between the LMD layer and substrate.
- Microhardness values measured across the tailored material were statistically equal despite the difference in LMD build thickness.
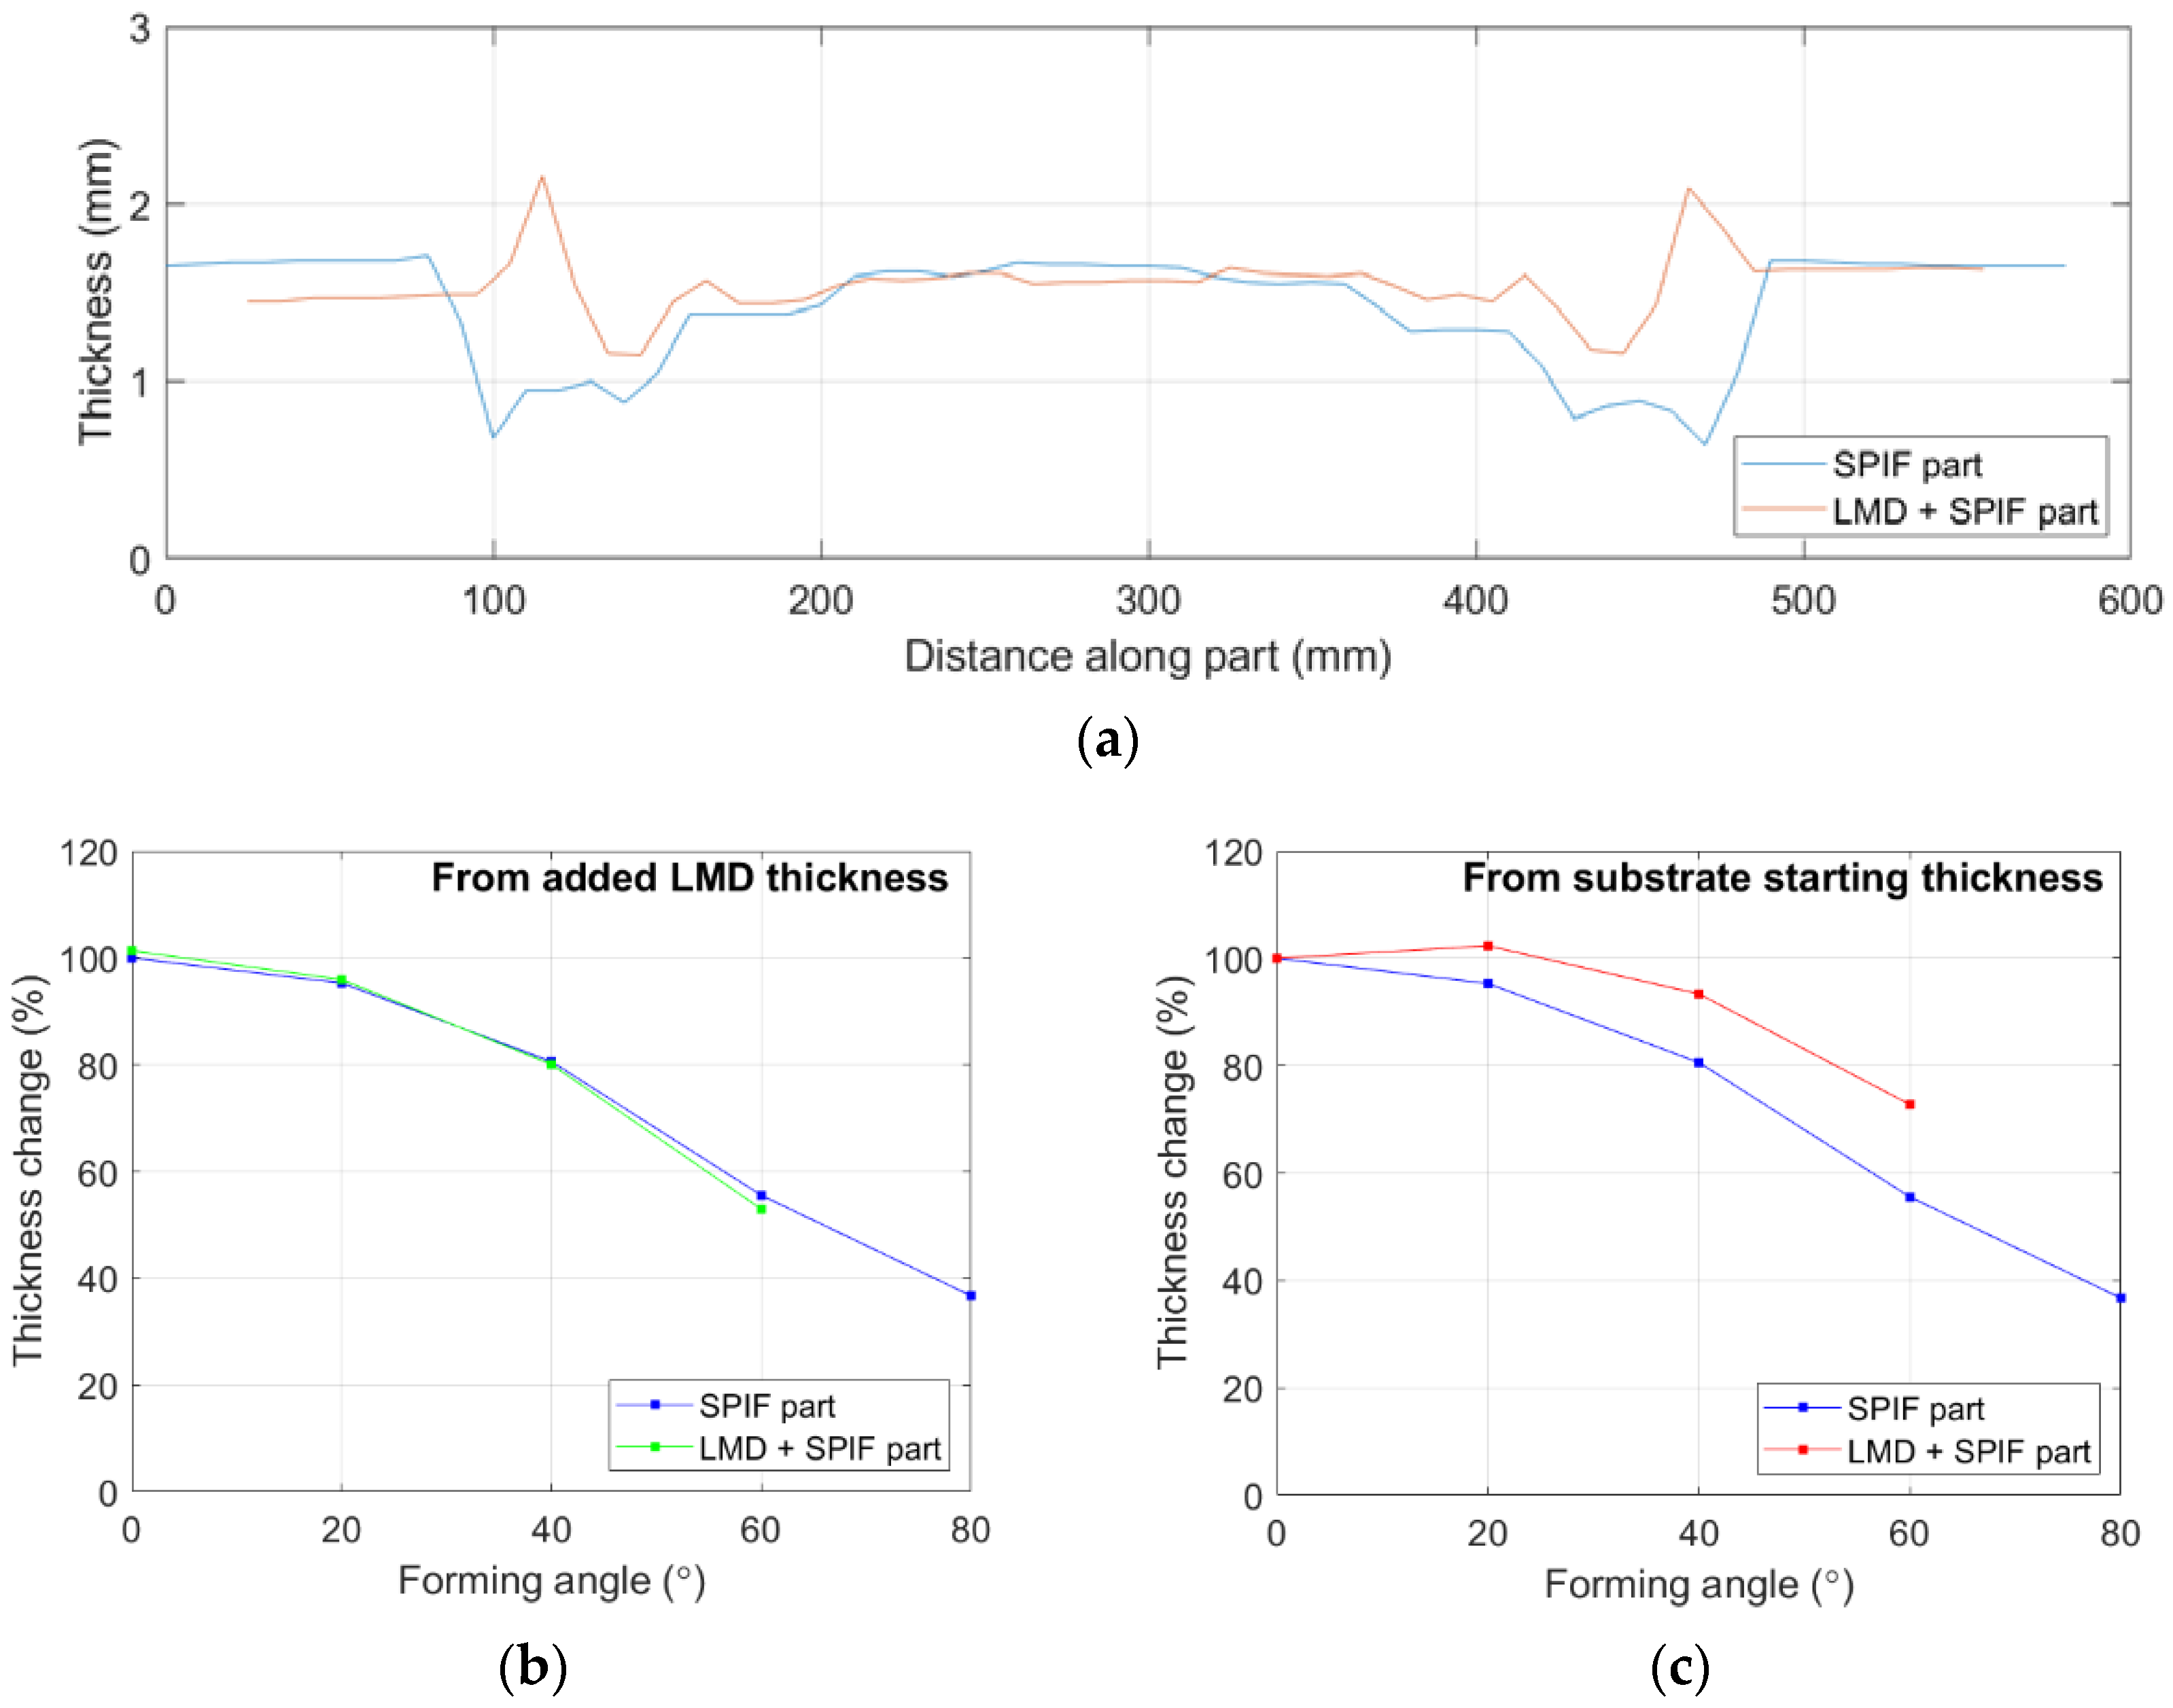
- LMD tailoring was seen to achieve greater homogeneity in the SPIF part, however the part failed during forming the 60° wall angled section.
Author Contributions
Funding
Acknowledgments
Conflicts of Interest
References
- Allwood, J.M.; Shouler, D.R.; Tekkaya, A.E. The Increased Forming Limits of Incremental Sheet Forming Processes. Key Eng. Mater. 2007, 344, 621–628. [Google Scholar] [CrossRef]
- More, K.R.; Sisodia, V.; Kumar, S. A Brief Review on Formability, Wall Thickness Distribution and Surface Roughness of Formed Part in Incremental Sheet Forming. In Advances in Manufacturing Processes; Lecture Notes in Mechanical Engineering; Springer: Singapore, 2021; pp. 135–149. [Google Scholar] [CrossRef]
- Jackson, K.; Allwood, J. The mechanics of incremental sheet forming. J. Mater. Process. Technol. 2008, 209, 1158–1174. [Google Scholar] [CrossRef]
- Oleksik, V.; Trzepieciński, T.; Szpunar, M.; Chodoła, Ł.; Ficek, D.; Szczęsny, I. Single-point incremental forming of titanium and titanium alloy sheets. Materials 2021, 14, 6372. [Google Scholar] [CrossRef] [PubMed]
- Trzepiecinski, T.; Oleksik, V.; Pepelnjak, T.; Najm, S.; Paniti, I.; Maji, K. Emerging Trends in Single Point Incremental Sheet Forming of Lightweight Metals. Metals 2021, 11, 1188. [Google Scholar] [CrossRef]
- Chen, F.K.; Chiu, K.H. Stamping formability of pure titanium sheets. J. Mater. Process. Technol. 2005, 170, 181–186. [Google Scholar] [CrossRef]
- Jagtap, R.; Kumar, S. An experimental investigation on thinning and formability in hybrid incremental sheet forming process. Procedia Manuf. 2019, 30, 71–76. [Google Scholar] [CrossRef]
- Behera, A.K.; de Sousa, R.A.; Ingarao, G.; Oleksik, V. Single point incremental forming: An assessment of the progress and technology trends from 2005 to 2015. J. Manuf. Process. 2017, 27, 37–62. [Google Scholar] [CrossRef]
- Jeswiet, J.; Micari, F.; Hirt, G.; Bramley, A.; Duflou, J.; Allwood, J. Asymmetric single point incremental forming of sheet metal. CIRP Ann. 2005, 54, 88–114. [Google Scholar] [CrossRef]
- Lu, H.; Liu, H.; Wang, C. Review on strategies for geometric accuracy improvement in incremental sheet forming. Int. J. Adv. Manuf. Technol. 2019, 102, 3381–3417. [Google Scholar] [CrossRef]
- Shamsari, M.; Mirnia, M.J. Formability improvement in single point incremental forming of truncated cone using a two-stage hybrid deformation strategy. Int. J. Adv. Manuf. Technol. 2017, 94, 2357–2368. [Google Scholar] [CrossRef]
- Ambrogio, G.; Gagliardi, F.; Serratore, G.; Ramundo, E.; Filice, L. SPIF of tailored sheets to optimize thickness distribution along the shaped wall. Procedia Manuf. 2019, 29, 80–87. [Google Scholar] [CrossRef]
- Ambrogio, G.; Gagliardi, F.; Muzzupappa, M.; Filice, L. Additive-incremental forming hybrid manufacturing technique to improve customised part performance. J. Manuf. Process. 2018, 37, 386–391. [Google Scholar] [CrossRef]
- Kumar, N.; Belokar, R.M.; Agrawal, A. Multi-objective optimization of quality characteristics in single point incremental forming process by response surface methodology. IJEMS 2019, 26, 254–264. [Google Scholar]
- Raut, J.; Marathe, S.; Raval, H. Numerical Investigation on Single Point Incremental Forming (SPIF) of Tailor Welded Blanks (TWBs). In Advances in Simulation, Product Design and Development; Springer: Singapore, 2020; pp. 43–54. [Google Scholar]
- Bambach, M.; Sviridov, A.; Weisheit, A.; Schleifenbaum, J.H. Case Studies on Local Reinforcement of Sheet Metal Components by Laser Additive Manufacturing. Metals 2017, 7, 113. [Google Scholar] [CrossRef]
- Hama-Saleh, R.; Weisheit, A.; Schleifenbaum, J.H.; Ünsal, I.; Sviridov, A.; Bambach, M. Formability Analysis of Micro-Alloyed Sheet Metals Reinforced by Additive Manufacturing. Procedia Manuf. 2020, 47, 1023–1028. [Google Scholar] [CrossRef]
- Yu, J.; Rombouts, M.; Maes, G.; Motmans, F. Material Properties of Ti6Al4V Parts Produced by Laser Metal Deposition. Phys. Procedia 2012, 39, 416–424. [Google Scholar] [CrossRef]
- Barro, Ó.; Arias-González, F.; Lusquiños, F.; Comesaña, R.; Del Val, J.; Riveiro, A.; Badaoui, A.; Gómez-Baño, F.; Pou, J. Improved commercially pure titanium obtained by laser directed energy deposition for dental prosthetic applications. Metals 2020, 11, 70. [Google Scholar] [CrossRef]
- Gu, D.D.; Meiners, W.; Wissenbach, K.; Poprawe, R. Wissenbach, Laser additive manufacturing of metallic components: Materials, processes, and mechanisms. Int. Mater. Rev. 2012, 57, 133–164. [Google Scholar] [CrossRef]
- MatWeb, TIMET TIMETAL® 50A CP Titanium (ASTM Grade 2). Available online: http://www.matweb.com/search/datasheet.aspx?matguid=247af0c81c8a4a9da817bafa791d20bf&ckck=1 (accessed on 8 February 2022).
- AP&C, Advanced Powders. Available online: https://www.advancedpowders.com/powders/titanium/cp-ti2 (accessed on 31 March 2022).
- Kusuma, C.; Ahmed, S.H.; Mian, A.; Srinivasan, R. Effect of Laser Power and Scan Speed on Melt Pool Characteristics of Commercially Pure Titanium (CP-Ti). J. Mater. Eng. Perform. 2017, 26, 3560–3568. [Google Scholar] [CrossRef]
- Lutjering, G.; Williams, J.C. Titanium, 2nd ed.; Springer: Hamburg, Germany, 2007. [Google Scholar]
- Qarni, M.J.; Sivaswamy, G.; Rosochowski, A.; Boczkal, S. On the evolution of microstructure and texture in commercial purity titanium during multiple passes of incremental equal channel angular pressing (I-ECAP). Mater. Sci. Eng. A 2017, 699, 31–47. [Google Scholar] [CrossRef] [Green Version]
- Yamanaka, K.; Saito, W.; Mori, M.; Matsumoto, H.; Sato, S.; Chiba, A. Abnormal grain growth in commercially pure titanium during additive manufacturing with electron beam melting. Materialia 2019, 6, 100281. [Google Scholar] [CrossRef]


| Constituent Elements | Ti | N | C | H | Fe | O |
|---|---|---|---|---|---|---|
| Composition, wt% | Balance | 0.03 | 0.08 | 0.015 | 0.20 | 0.18 |
| Sheet Orientation | Yield Strength (MPa) | Tensile Strength (MPa) | Poisson’s Ratio |
|---|---|---|---|
| RD | 353 ± 1.25 | 432 ± 0.78 | 0.33 |
| 45° to RD | 343 ± 1.62 | 389 ± 1.21 | 0.75 |
| TD | 378 ± 0.83 | 420 ± 0.95 | 0.9 |
| Region | Thickness (mm) | Thinning (mm) |
|---|---|---|
| θ = 0° | 1.65 ± 0.01 | N/A |
| θ = 20° | 1.57 ± 0.02 | 0.07 |
| θ = 40° | 1.34 ± 0.03 | 0.31 |
| θ = 60° | 0.93 ± 0.05 | 0.72 |
| θ = 80° | 0.62 ± 0.06 | 1.03 |
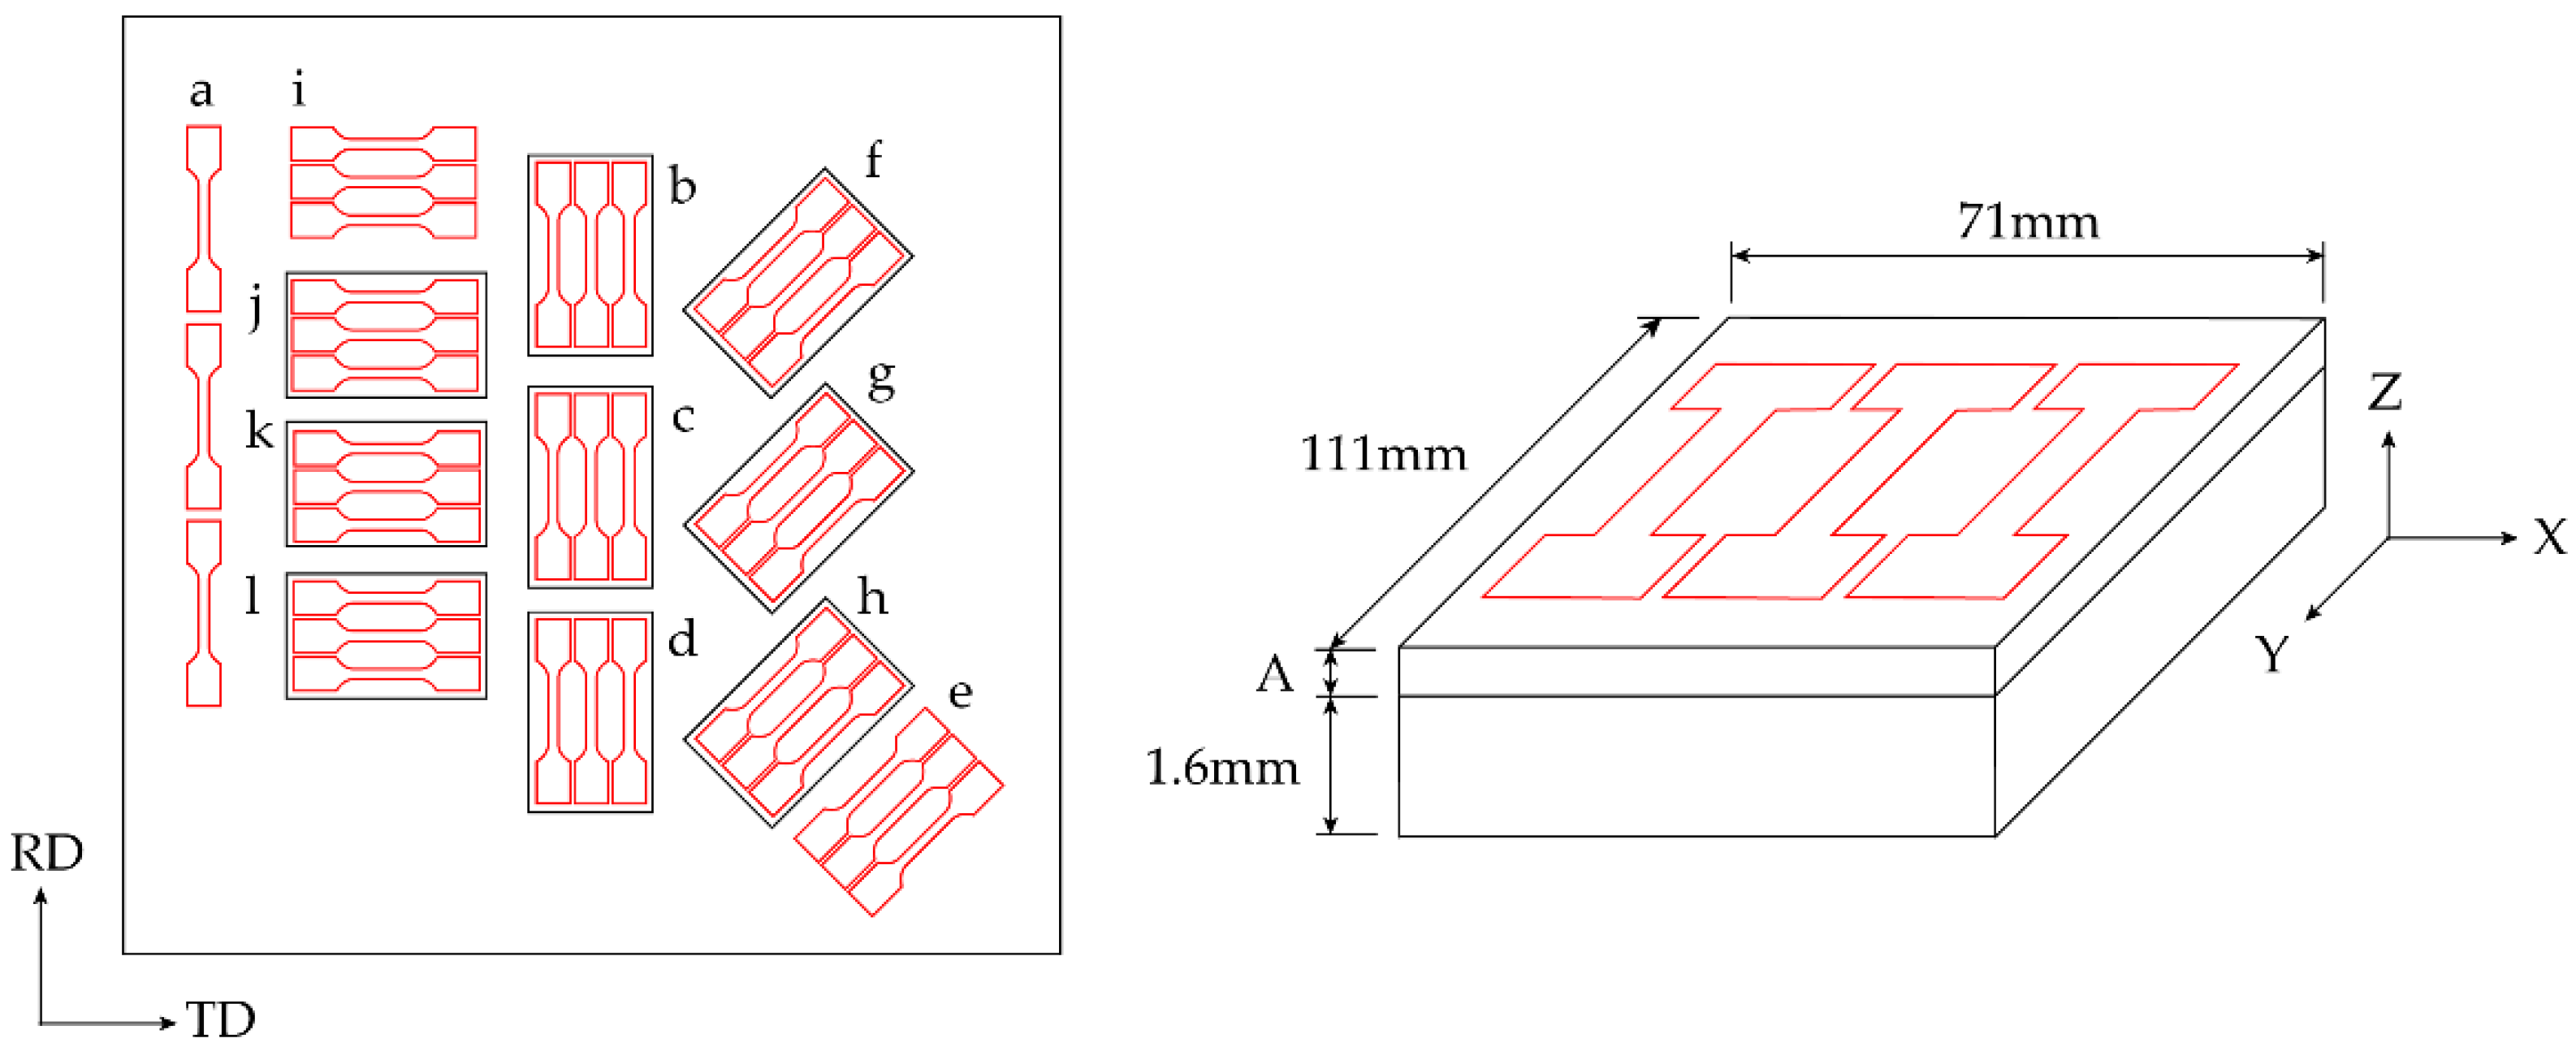
| Material Location | Tensile Gauge Orientation (Y direction) | LMD Thickness (A) (mm) |
|---|---|---|
| Set a | RD | 0 |
| Set b | RD | 0.3 |
| Set c | RD | 0.6 |
| Set d | RD | 0.9 |
| Set e | 45° to RD | 0 |
| Set f | 45° to RD | 0.3 |
| Set g | 45° to RD | 0.6 |
| Set h | 45° to RD | 0.9 |
| Set i | TD | 0 |
| Set j | TD | 0.3 |
| Set k | TD | 0.6 |
| Set j | TD | 0.9 |
| Material Location | Measurement Direction | Measured Stress (MPa) |
|---|---|---|
| Set b | TD | 137 ± 6.07 |
| RD | 27 ± 3.97 | |
| Set c | TD | 93 ± 5.25 |
| RD | 75 ± 5.78 | |
| Set d | TD | 133 ± 5.45 |
| RD | 55 ± 4.51 | |
| Set j | TD | −32 ± 6.21 |
| RD | 0 ± 5.13 | |
| Set k | TD | 51 ± 5.78 |
| RD | 77 ± 5.47 | |
| Set l | TD | 168 ± 6.69 |
| RD | 10 ± 4.55 |
| Material Location (See Table 4 for Variables) | YS (0.2% Proof Stress) (MPa) | E (% Increase, 20 mm Gauge) | UTS (MPa) |
|---|---|---|---|
| Set a | 353 ± 1.25 | 43 ± 0.75 | 432 ± 0.78 |
| Set b | 362 ± 1.02 | 38 ± 3.12 | 393 ± 2.34 |
| Set c | 367 ± 0.75 | 40 ± 3.51 | 401 ± 0.84 |
| Set d | 374 ± 2.36 | 38 ± 0.93 | 406 ± 0.39 |
| Set e | 343 ± 1.62 | 52 ± 0.29 | 389 ± 1.21 |
| Set f | 361 ± 0.32 | 40 ± 3.55 | 388 ± 1.09 |
| Set g | 368 ± 0.98 | 41 ± 2.85 | 394 ± 1.41 |
| Set h | 377 ± 1.73 | 38 ± 1.01 | 407 ± 1.67 |
| Set i | 378 ± 0.83 | 43 ± 0.84 | 420 ± 0.95 |
| Set j | 368 ± 2.49 | 38 ± 1.16 | 398 ± 3.63 |
| Set k | 373 ± 1.07 | 37 ± 2.05 | 402 ± 0.72 |
| Set l | 374 ± 1.44 | 40 ± 3.02 | 405 ± 1.50 |
Publisher’s Note: MDPI stays neutral with regard to jurisdictional claims in published maps and institutional affiliations. |
© 2022 by the authors. Licensee MDPI, Basel, Switzerland. This article is an open access article distributed under the terms and conditions of the Creative Commons Attribution (CC BY) license (https://creativecommons.org/licenses/by/4.0/).
Share and Cite
McPhillimy, M.; Yakushina, E.; Blackwell, P. Tailoring Titanium Sheet Metal Using Laser Metal Deposition to Improve Room Temperature Single-Point Incremental Forming. Materials 2022, 15, 5985. https://doi.org/10.3390/ma15175985
McPhillimy M, Yakushina E, Blackwell P. Tailoring Titanium Sheet Metal Using Laser Metal Deposition to Improve Room Temperature Single-Point Incremental Forming. Materials. 2022; 15(17):5985. https://doi.org/10.3390/ma15175985
Chicago/Turabian StyleMcPhillimy, Michael, Evgenia Yakushina, and Paul Blackwell. 2022. "Tailoring Titanium Sheet Metal Using Laser Metal Deposition to Improve Room Temperature Single-Point Incremental Forming" Materials 15, no. 17: 5985. https://doi.org/10.3390/ma15175985
APA StyleMcPhillimy, M., Yakushina, E., & Blackwell, P. (2022). Tailoring Titanium Sheet Metal Using Laser Metal Deposition to Improve Room Temperature Single-Point Incremental Forming. Materials, 15(17), 5985. https://doi.org/10.3390/ma15175985