Article

Preparation, Characterization, and Photocatalytic Performance of Ag/BiOBr0.85I0.15 Nanocomposites

School of Life Science, Huzhou University, No. 759, East 2nd Ring Road, Huzhou 313000, China
*
Author to whom correspondence should be addressed.
Materials 2022, 15(17), 6022; https://doi.org/10.3390/ma15176022
Submission received: 9 August 2022 / Revised: 26 August 2022 / Accepted: 28 August 2022 / Published: 31 August 2022
(This article belongs to the Section Catalytic Materials)

Abstract

:
In the present paper, a series of Ag/BiOBr0.85I0.15 composite nanoparticles with different silver loading were prepared by a combined solvothermal and photocatalytic reduction method. The composite samples have been characterized by XRD, XPS, SEM, EDX, TEM, UV-Vis, and N2 adsorption/desorption techniques. The characterization results showed that BiOBr0.85I0.15 composite nanoparticles have a tetragonal phase structure. Silver nanoparticles are uniformly distributed on the BiOBr0.85I0.15, which results in surface plasmon resonance absorption, effectively increasing the visible light absorption ability of BiOBr0.85I0.15. The photocatalytic activity of the samples was evaluated by photocatalytic degradation of ammonia nitrogen in circulating aquaculture water under simulated sunlight irradiation. The effect of the Ag loading amount on the photocatalytic degradation of ammonia nitrogen was investigated. Silver loading of 1% (molar ratio) can effectively improve the degradation capacity of the catalyst for ammonia nitrogen in water. The recycling experiments show that 1%Ag/BiOBr0.85I0.15 has good photocatalytic stability. ESR characterization and oxidation species scavenging experimental results suggest that h+, 1O2, and ·O2 are the main oxidizing species in the photocatalytic system.

1. Introduction

Advanced oxidation processes (AOPs) have been widely studied and applied to organic wastewater treatment because of their high capability to oxidize and remove organic compounds and pathogens originated from agricultural, industrial, and domestic activities [1,2,3,4]. Photocatalysis technology is one of the most effective AOPs for pollutant degradation [5,6]. Under the excitation of light, the electrons of the semiconductor transit from the valence band to the conduction band, thus forming photogenerated electrons in the conduction band and photogenerated holes in the valence band. The oxidative photogenerated holes and reductive electrons can directly react with pollutants on the surface of the semiconductor, leading to their degradation. Moreover, photocatalysis reaction can produce reactive oxygen species (ROS), which play a key role in the oxidative degradation of organic compounds due to their high reactivity [5,6,7,8].
So far, many semiconductors have been studied as photocatalysts, such as TiO2 [9,10,11], ZnO [12,13], CdS [14,15], SrTiO3 [16], and so forth. Much attention has been paid to improving the photocatalytic ability of semiconductors. However, since the conventional photocatalysts with wide band gaps can only be excited under UV-light irradiation, their practical application has been greatly limited. Because ultraviolet energy accounts for only 4% of solar energy, visible light-driven photocatalysts attract more attention [17]. Therefore, visible-light-responsive photocatalysts have also been prepared, and proved to be effective in the degradation of organic dyes and toxic and bio-refractory organic compounds in water, such as g-C3N4 [18,19], WO3 [20], Ag3PO4 [21,22], Ag3VO4 [23,24], etc. In recent years, Bi-based compounds have been found to have high visible light photocatalytic activity, such as BiVO4 [25,26], Bi2O3 [27], Bi2Ti2O7 [28], Bi2WO6 [29], BiOBr [30], BiOI [31], AgBiO3 [32], etc. They possess narrow band gaps for their hybridized O 2p and Bi 6s valence bands, which makes them have high visible light catalytic activity [33].
Some solid solutions have been constructed as photocatalysts, showing good catalytic ability in the degradation of pollutants under visible light irradiation. Xu et al. [34] synthesized ZnxCd1−xS solid solution photocatalysts which were extremely active for methylene blue photodegradation under visible light illumination. Zhang et al. [35] synthesized two-dimensional BiOClxBr1−x solid solution with exposed {001} facets and tunable band gaps by using solvothermal methods. The BiOCl0.5Br0.5 sample exhibited the highest photocatalytic activity for degrading rhodamine B. Wang et al. [36] developed a BiOBrxI1−x solid solution to degrade 4-chlorophenol under visible light and found that the BiOBr0.85I0.15 sample showed very good catalytic activity.
On the other hand, much research work has focused on preventing the rapid recombination of photogenerated electrons and holes through a variety of methods to improve the photocatalytic degradation efficiency, such as semiconductor composite [37,38], ion doping [39,40], noble metal deposition [41,42], and so on. Noble metals on the surface of semiconductors can form a Schottky barrier at the contact interface between noble metals and semiconductors, inhibit the recombination of photogenerated hole–electron pairs, and prolong the lifetime of photogenerated carriers.
As the content of ammonia nitrogen (NH4+-N) is a very important water quality index that affects the aquatic environment of aquaculture, the degradation of ammonia nitrogen is very important. On the other hand, the aquaculture water system contains a variety of nitrogen-containing organic compounds from fish feed residues, fish excreta, and secretions, which may produce ammonia after a series of transformations. In recent years, there have been studies on the direct removal of NH4+-N through a photocatalytic reaction. Under the action of oxygen-containing free radicals, ammonia can gradually lose hydrogen atoms and finally convert to N2 [43]. In this research, a series of Ag/BiOBr0.85I0.15 composite nanoparticles with different silver loading were synthesized via the solvothermal method and the photocatalytic reduction method. The composition, structure, morphology, and optical properties of the photocatalysts were characterized. The photocatalytic activity of the catalysts was investigated by the degradation of NH4+-N in aquaculture wastewater under simulated sunlight irradiation. The photocatalytic mechanism of the photocatalyst was also discussed.

2. Preparation and Experimental Details

2.1. Photocatalyst Preparation

The solvothermal method was used to synthesize the BiOBr0.85I0.15 nanoparticles [36]. In a typical process, 1.215 g bismuth nitrate pentahydrate (Bi(NO3)3·5H2O) (Sinopharm Chemical Reagent, Shanghai, China) and 1.000 g polyvinylpyrrolidone (PVP, K-30) (Zhanyun Chemical, Shanghai, China) were mixed with 60 mL glycerol (Zhanyun Chemical, Shanghai, China) and 60 mL H2O. The mixture was stirred to form solution A. Then, 0.219 g sodium bromide (NaBr) (Zhanyun Chemical, Shanghai, China) and 0.0622 g potassium iodide (KI) (Zhanyun Chemical, Shanghai, China) was dissolved into another 20 mL H2O under magnetic stirring to form solution B. Subsequently, under constant agitation, solution B was added to solution A drop by drop in 1 h at room temperature. The suspension was transferred into 50 mL Teflon-lined stainless-steel autoclaves for hydrothermal treatment, and kept at 150 °C for 8 h, and then cooled down to room temperature naturally. After filtration, the product was washed with deionized water and absolute ethanol three times, respectively, to remove other impurities, and then dried at 80 °C for 12 h.
Ag nanoparticles were deposited on the surface of BiOBr0.85I0.15 by a photo-reduction approach [44]. The composite photocatalyst, 1.0% Ag/BiOBr0.85I0.15 (molar ratio of Ag to BiOBr0.85I0.15 = 0.01:1), was prepared as follows: 0.0054 g AgNO3 was dissolved in 50 mL methanol under stirring. Then, 1.000 g of BiOBr0.85I0.15 nanoparticles were added into the methanol solution while vigorously stirring to form a suspension. The suspension was irradiated with an ultraviolet lamp (λ = 365 nm, 30 w) for 6.0 min. The radiation intensity received at the reaction liquid surface was 12.38 W/m2 (CAS 140CT Array Spectrometer, Instrument Systems, Munich, Germany). The photocatalytic reduction of silver ions enables the synthesis of Ag/BiOBr0.85I0.15. Then, the suspension was filtrated and washed with deionized water and absolute ethanol, respectively. Finally, the product was dried at 80 °C for 2.0 h in an electric vacuum drying oven.

2.2. Characterization and Analysis

A transmission electron microscope, Talos F200X TEM (Thermo Scientific, Waltham, MA, USA), was used with about 0.005 g of the sample to obtain the morphology of the photocatalyst. A scanning electron microscope, ZEISS SUPRA 40 SEM (Carl Zeiss Microscopy GmbH, Oberkochen, Germany), was used with about 0.01 g sample to obtain the surface microstructure images of the catalysts, and energy-dispersive X-ray spectroscopy (EDAX) elemental mapping was conducted using a Bruker XFlash 6|10 detector (Bruker, Karlsruhe, Germany). X-ray diffraction (XRD) of the nanoparticles was measured by a D8 Advance X-ray diffractometer (Bruker, Germany, λ = 1.5418 Å, Cu Kα radiation) with a scanning speed of 5° min−1, using about 0.2 g of the sample. X-ray photo-electron spectroscopy (XPS) (ESCALAB 250Xi, Thermo Fisher Scientific, USA) with monochromatic Al Kα X-ray radiation at 1486.71 eV was applied to identify the surface element composition and chemical states of the as-prepared samples of the nanoparticles, using about 0.03 g of the sample. The specific surface area of the catalysts was determined by an ASAP 2020 analyzer (Micromeritics Instrument Corporation, Norcross, GA, USA) with an analysis bath temperature of 77 K, using about 1 g of the sample. Electron spin resonance (ESR) spectroscopy (Bruker EMX 10/12 spectrometer, Karlsruhe, Germany) was used to investigate the generation of reactive oxygen radicals in the photoreaction system. Hydroxyl radical and superoxide anion radical were captured by 5,5-dimethyl-1-pyrroline-N-oxide (DMPO), and singlet oxygen was captured by 2,2,6,6-tetramethylpiperidine (TEMP). The UV-vis diffuse reflectance spectra (DRS) of samples were obtained by a spectrophotometer (UV270, Shimadzu, Kyoto, Japan), using the BaSO4 as the reflectance sample with about 0.02 g of the sample.
The NH4+-N in water samples was analyzed using chromogenic spectrophotometry by a DR2800 multi parameter water quality analyzer (HACH Company, Loveland, CO, USA), following the HACH Water Analysis Handbook (HACH, Beijing, China, 2010). The NH4+-N was determined by the salicylic acid method.
The transient photocurrents of the as-prepared samples were investigated on an Electrochemical Working Station (CHI660E, Chenhua Instruments Co., Shanghai, China) in a standard three-electrode electrochemical quartz cell with Na2SO4 (0.5 M) electrolyte solution. A 500 W Xe light with a filter (λ > 400 nm) was employed as the light source. FTO glass with coated photocatalysts was used as the working electrode. A Pt foil and an Ag/AgCl electrode served as the counter and reference electrode, respectively. The working electrodes were prepared by the spin-coating method. The 10-mg powder sample was dispersed in 1 mL of absolute ethanol, and then 50 μL of Nafion ethanol solution was added, and the uniform suspension was formed by ultrasonic treatment for 30 min. Then, 150 μL of the suspension was added to the ITO glass and dried at room temperature to form a working electrode. The changes of the photoinduced current intensity with time were measured by controlling the cycle light on and off (turn on the light for 20 s, and then turn off the light for another 20 s).

2.3. Photocatalytic Experiments

A certain amount (for example, 0.08 g) of photocatalyst was accurately weighed and added to a beaker containing 100 mL of the water sample from a freshwater-recirculating aquaculture system. The water sample was filtered by an 0.22-μm membrane before photocatalytic degradation. The main water quality parameters of the filtered water sample are pH, 8.0; chemical oxygen demand (COD), 88 mg/L; total organic carbon (TOC), 55 mg/L; and ammonia nitrogen (NH4+-N), 50 mg/L. The catalysts in the water sample were dispersed by ultrasonic wave for 2.0 min. Subsequently, the suspension was stirred for 60 min in the dark to reach an adsorption–desorption equilibrium on the surface of the catalyst. The photocatalytic degradation of the water sample started under the irradiation of a 300 W xenon lamp. The distance between the light source and the liquid level was 15 cm. The radiation intensity received at the liquid surface of the degradation reaction was 7.416 W/m2 (CAS 140CT Array Spectrometer, Instrument Systems, Munich, Germany). The temperature of the degradation system was controlled by a cold trap using constant temperature cooling water. Then, 2.0 mL reaction suspension was taken out at certain intervals. All aliquots were filtered through a 0.22-μm filter membrane before analysis.

3. Results and Discussion

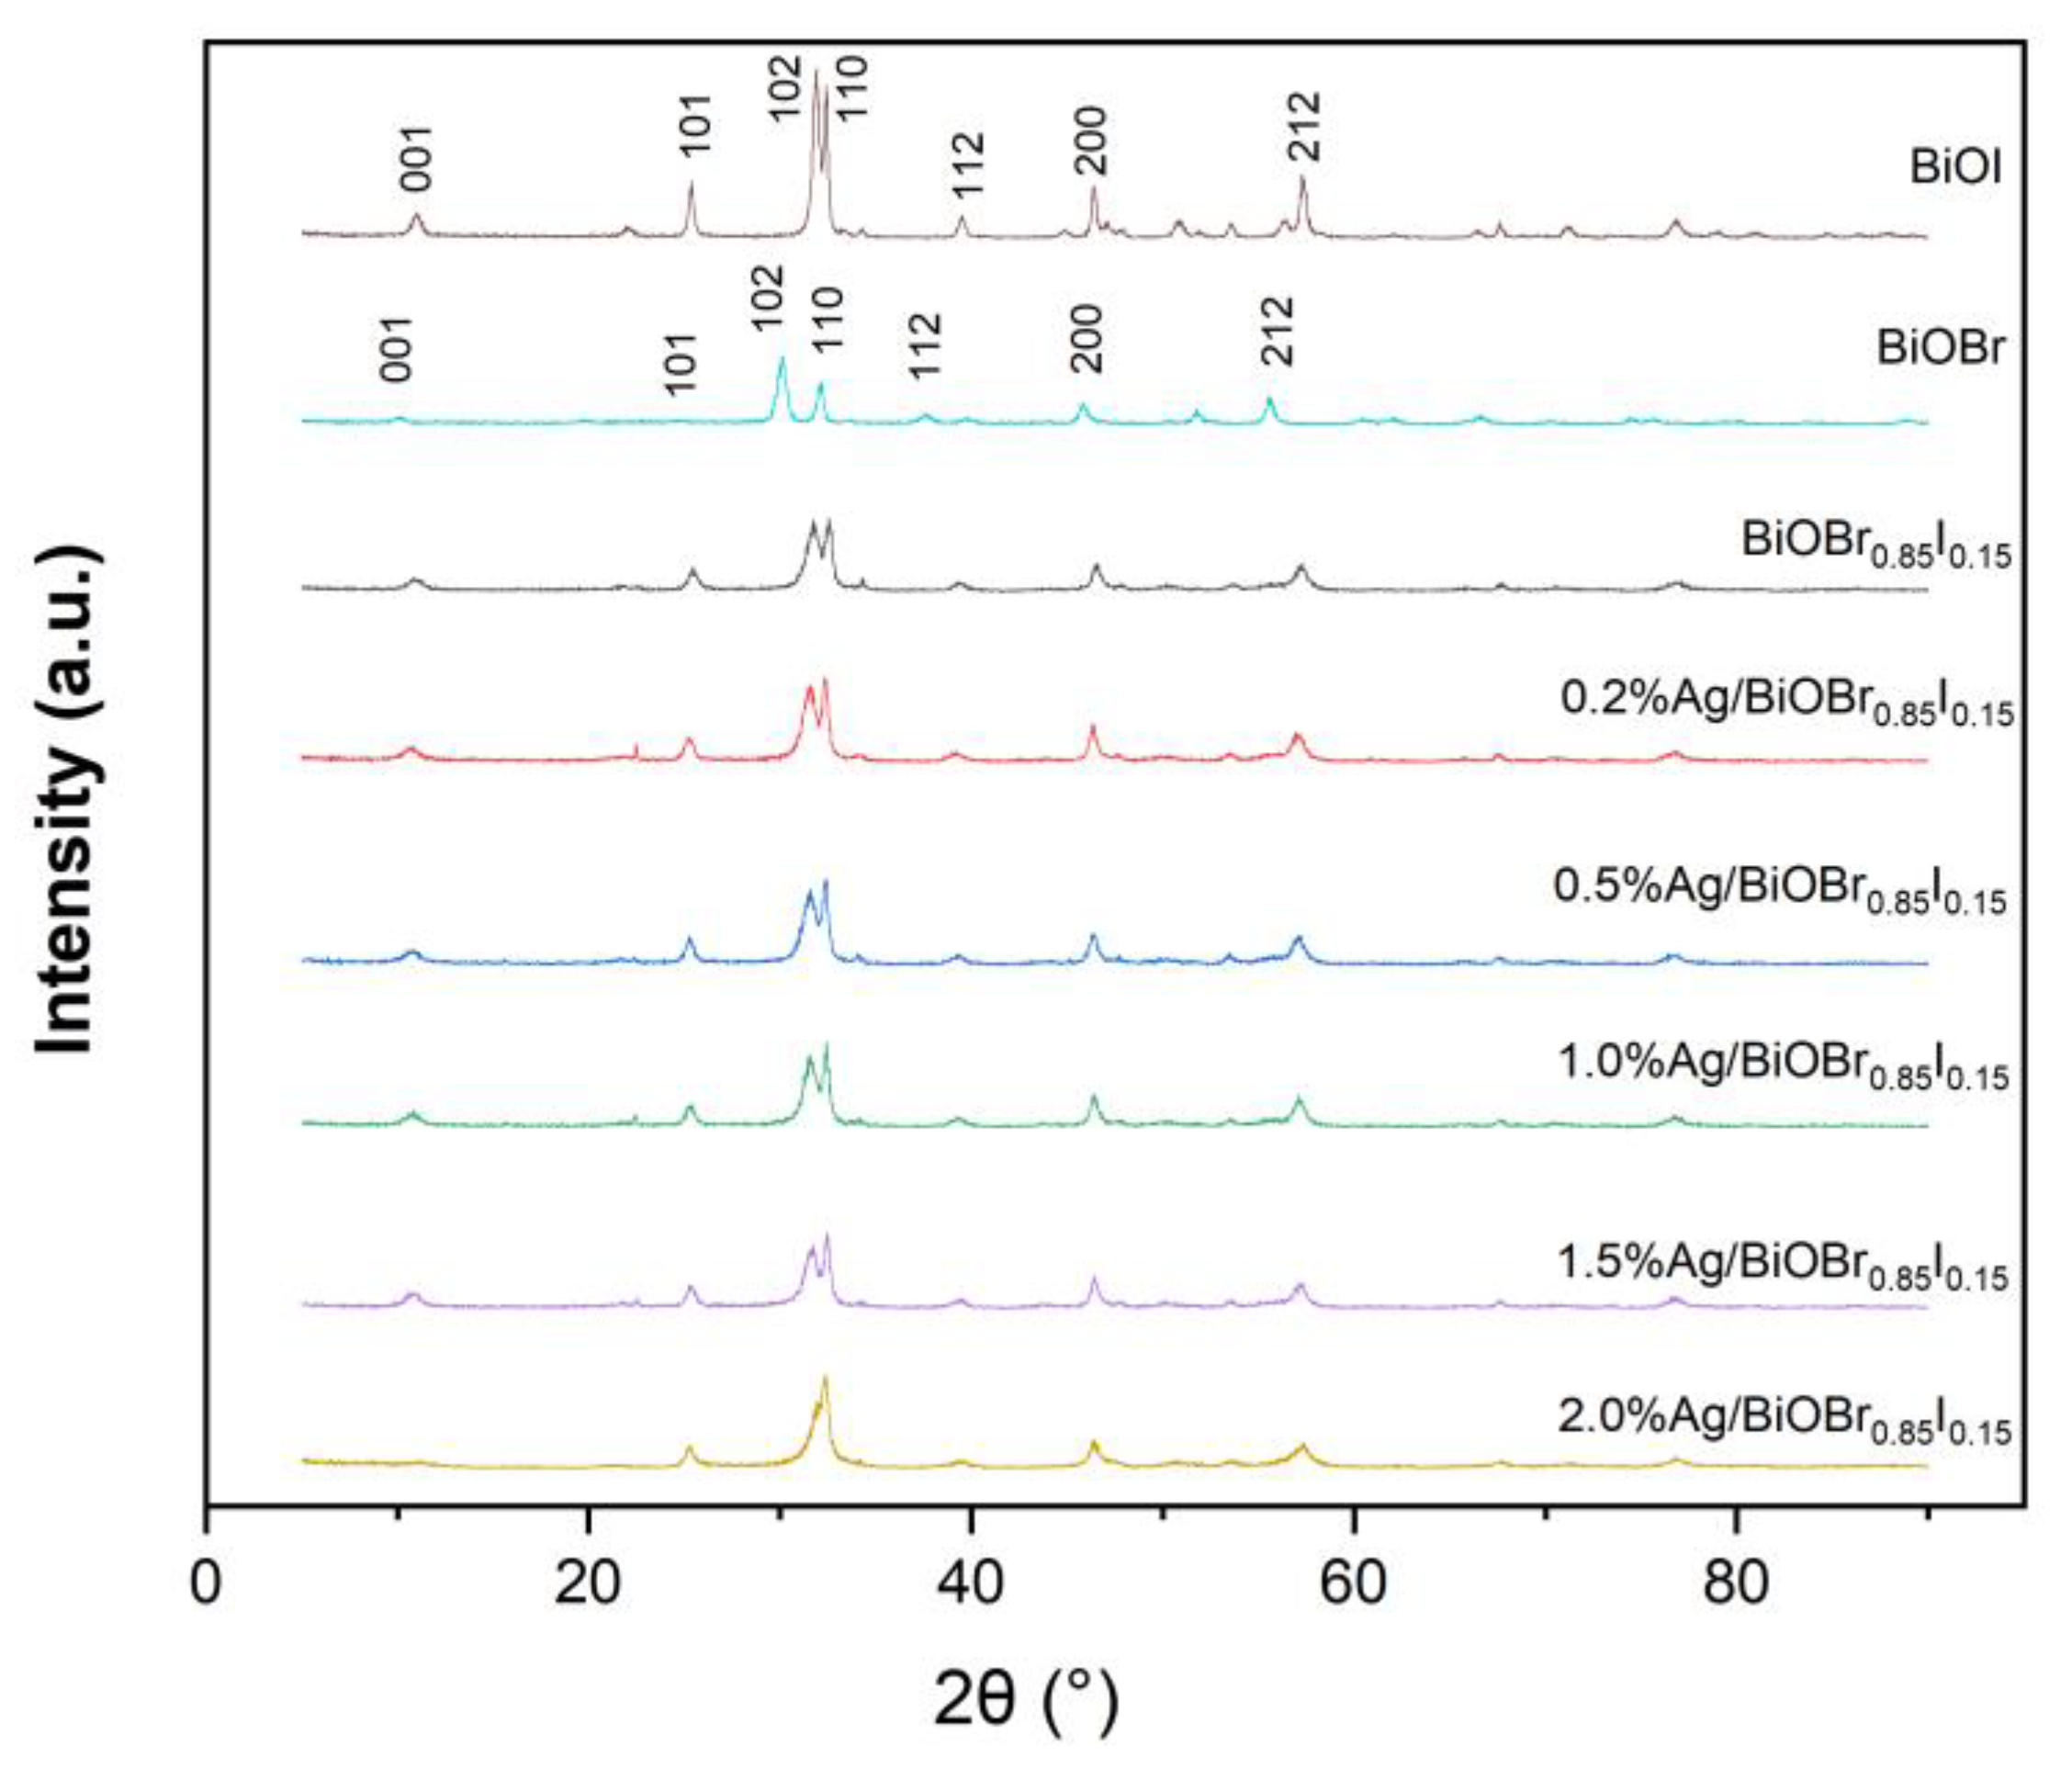
3.1. X-ray Diffraction (XRD)

Figure 1 shows the XRD patterns of BiOBr, BiOI, and Ag/BiOBr0.85I0.15 composite catalysts with different silver contents. The diffraction peaks of BiOBr at 2θ = 11.04°, 25.38°, 31.92°, 32.40°, 39.56°, 46.40°, and 57.30° correspond to {001}, {101}, {102}, {110}, {112}, {200}, and {212} crystal planes of the BiOBr crystal, respectively. The position of the BiOBr diffraction peak is consistent with the standard XRD pattern of the standard tetragonal phase BiOBr (JCPDS No. 01-073-2061) of the space group, P4/nmm (129). Its unit cell parameters are a = b = 3.923 Å, c = 8.092 Å. The diffraction peaks of BiOI at 2θ = 10.16°, 30.10°, 32.14°, 37.62°, 45.86°, 51.78°, and 55.56° correspond to {001}, {102}, {110}, {103}, {200}, {114}, and {212} crystal planes of the BiOI crystal, respectively. The position of the BiOI diffraction peak is consistent with the standard XRD pattern of the standard tetragonal phase BiOI (JCPDS No. 01-073-2062). The unit cell parameters are a = b = 3.984 Å, c = 9.128 Å. The diffraction peaks of BiOBr0.85I0.15 at 2θ = 10.88°, 25.38°, 31.74°, 32.40°, 39.36°, 46.44°, and 57.14° correspond to {001}, {101}, {102}, {110}, {103}, {200}, and {212} crystal planes of the BiOBr0.85I0.15 crystal, respectively [36].
In BiOBr0.85I0.15 and Ag/BiOBr0.85I0.15 composite catalysts with different silver contents, the ratio of I to Br is 0.15:0.85. Therefore, the XRD spectrum of the composite catalyst is closer to that of BiOBr. The diffraction peak of BiOBr0.85I0.15 is high and sharp, indicating that the samples have good crystallinity. In order to get the lattice parameters, a and c, of the synthesized BiOBr0.85I0.15 crystal, the Le Bail fitting was used to refine the XRD data (Fullprof, FullProf_Suite Windows (64 bits), Juan RodrÍguez-Carvajal, Laboratory Léon Brillouin (CEA-CNRS), CEA/Saclay, France, https://www.ill.eu/sites/fullprof/php/downloads.html). The lattice parameters, a and c, obtained by fitting are 3.930 Å and 8.270 Å, which is close to the calculated results of the solid solution using Vegard’s Law. Compared with BiOBr0.85I0.15, the characteristic diffraction peak of Ag/BiOBr0.85I0.15 has almost no change. Due to the very low concentration and high dispersion of silver in the composite sample, the XRD spectrum shows almost no silver diffraction peak.

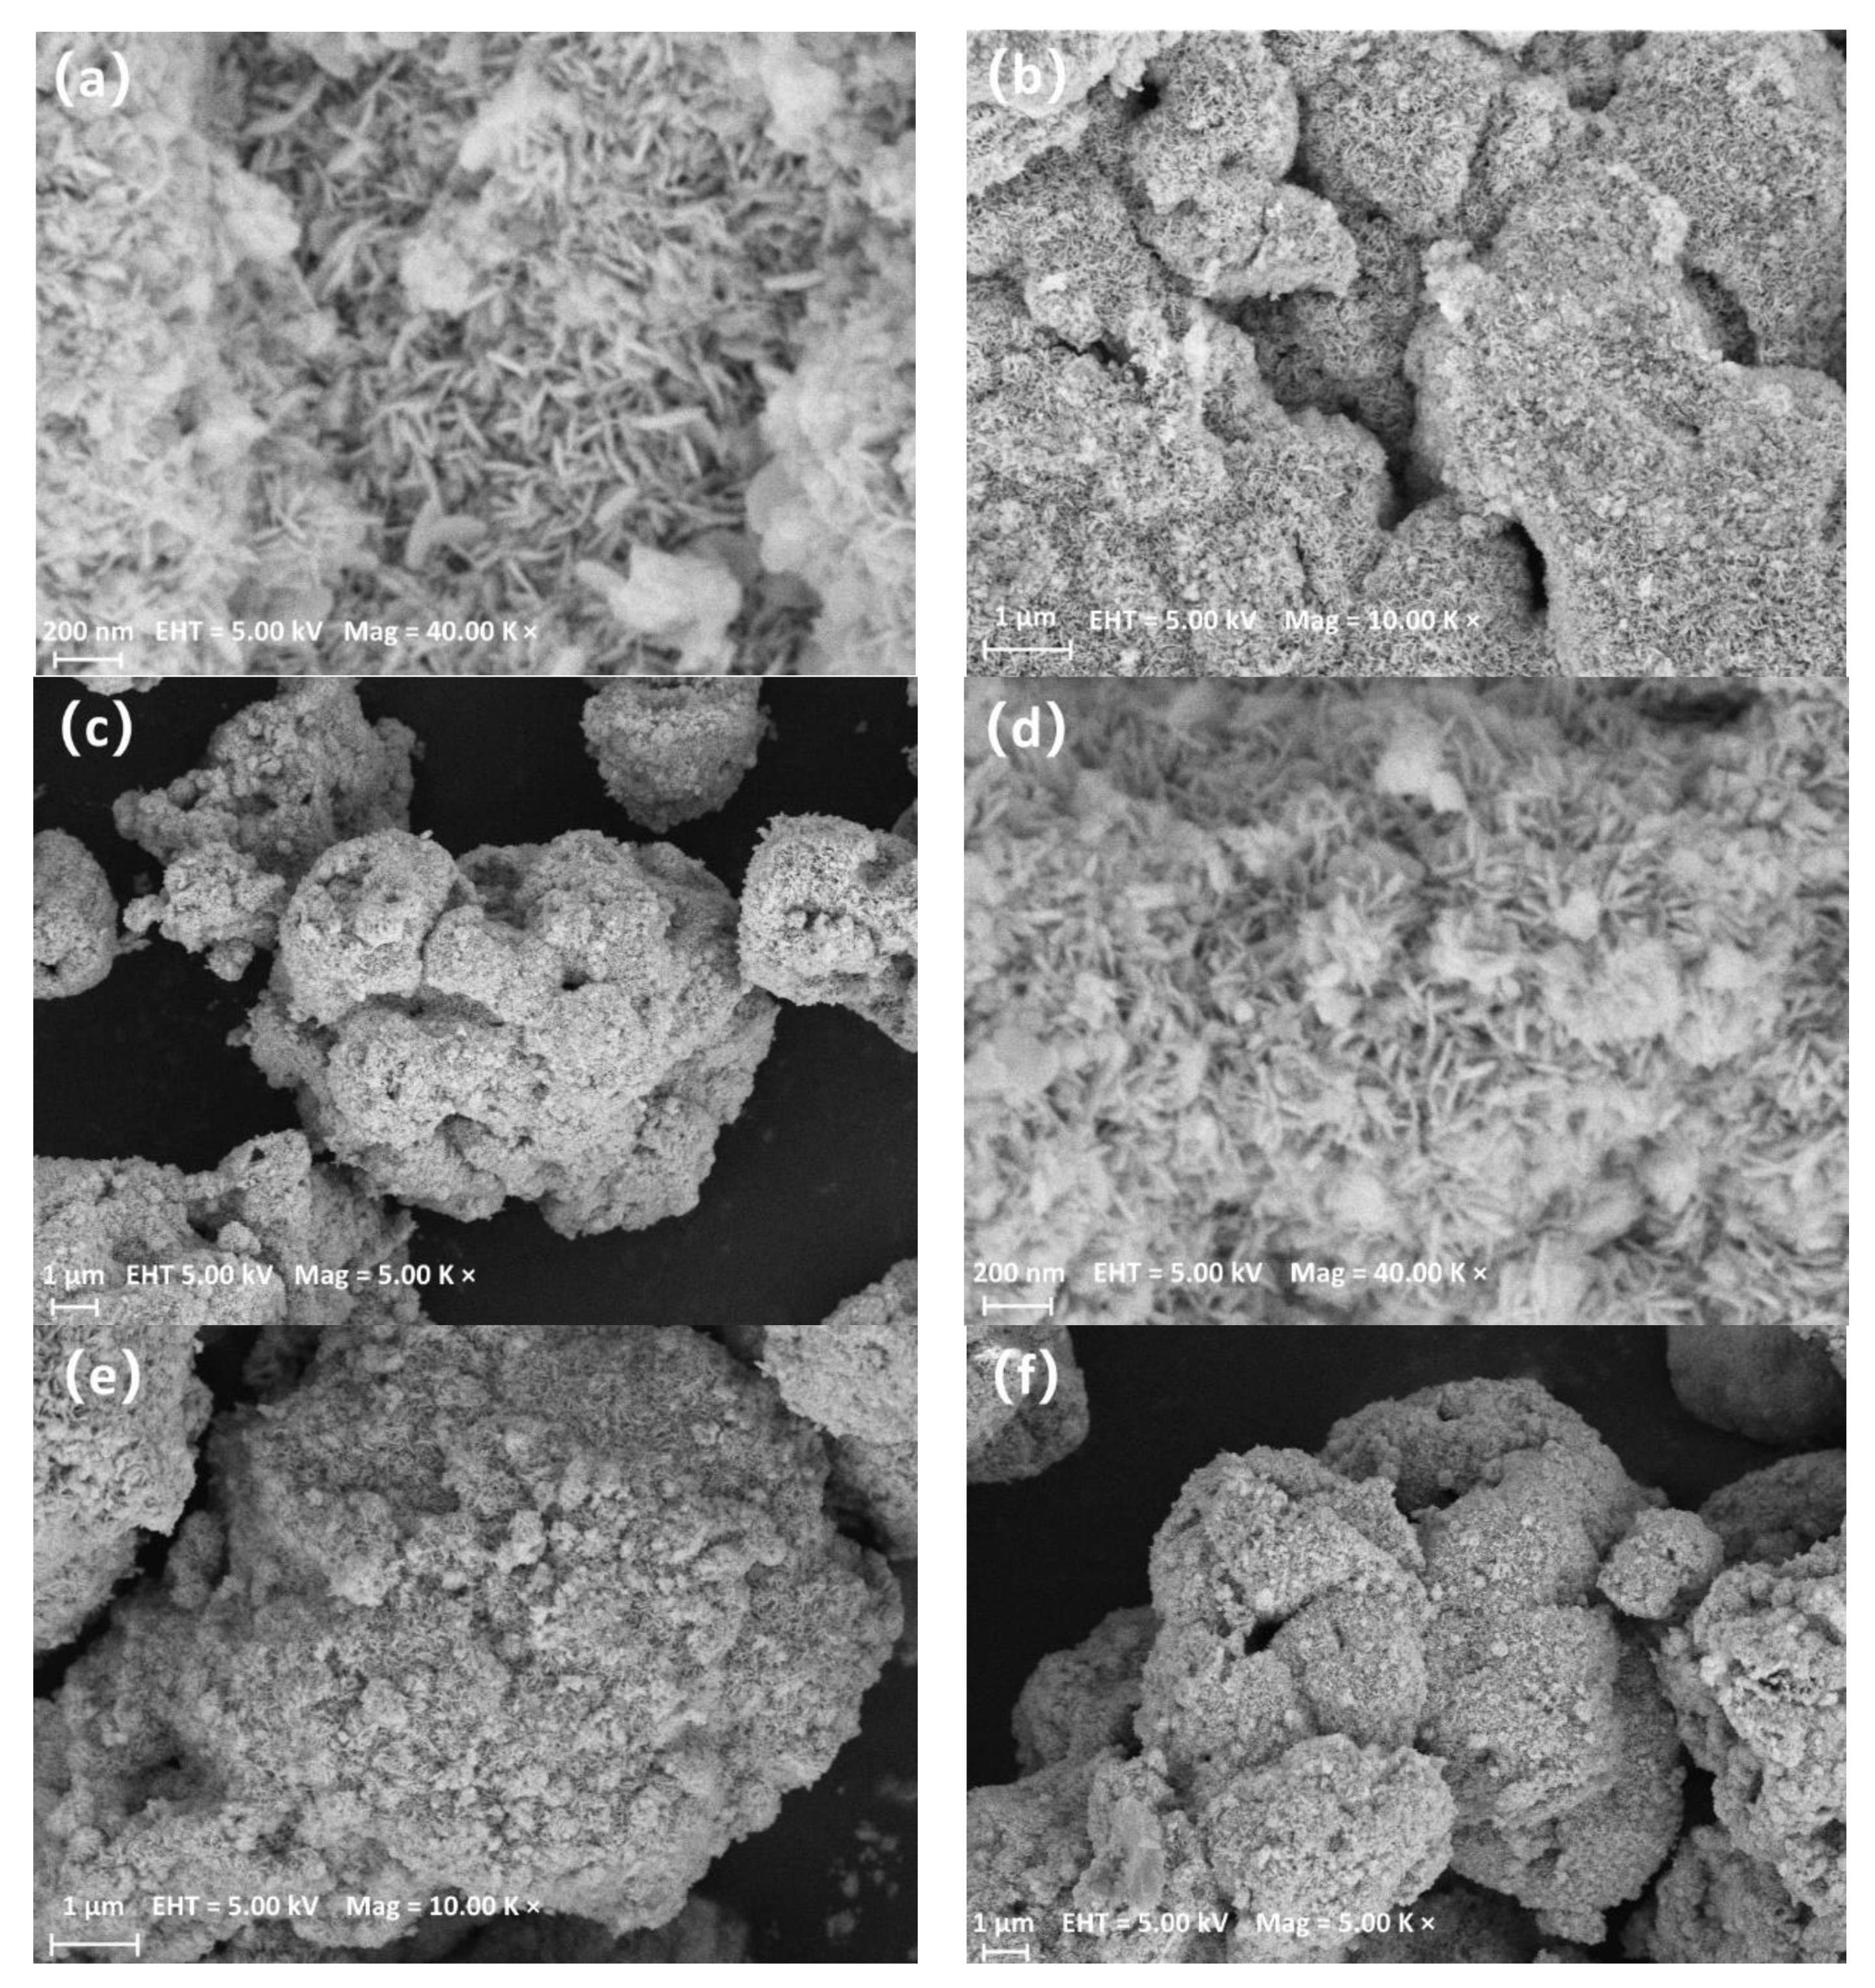
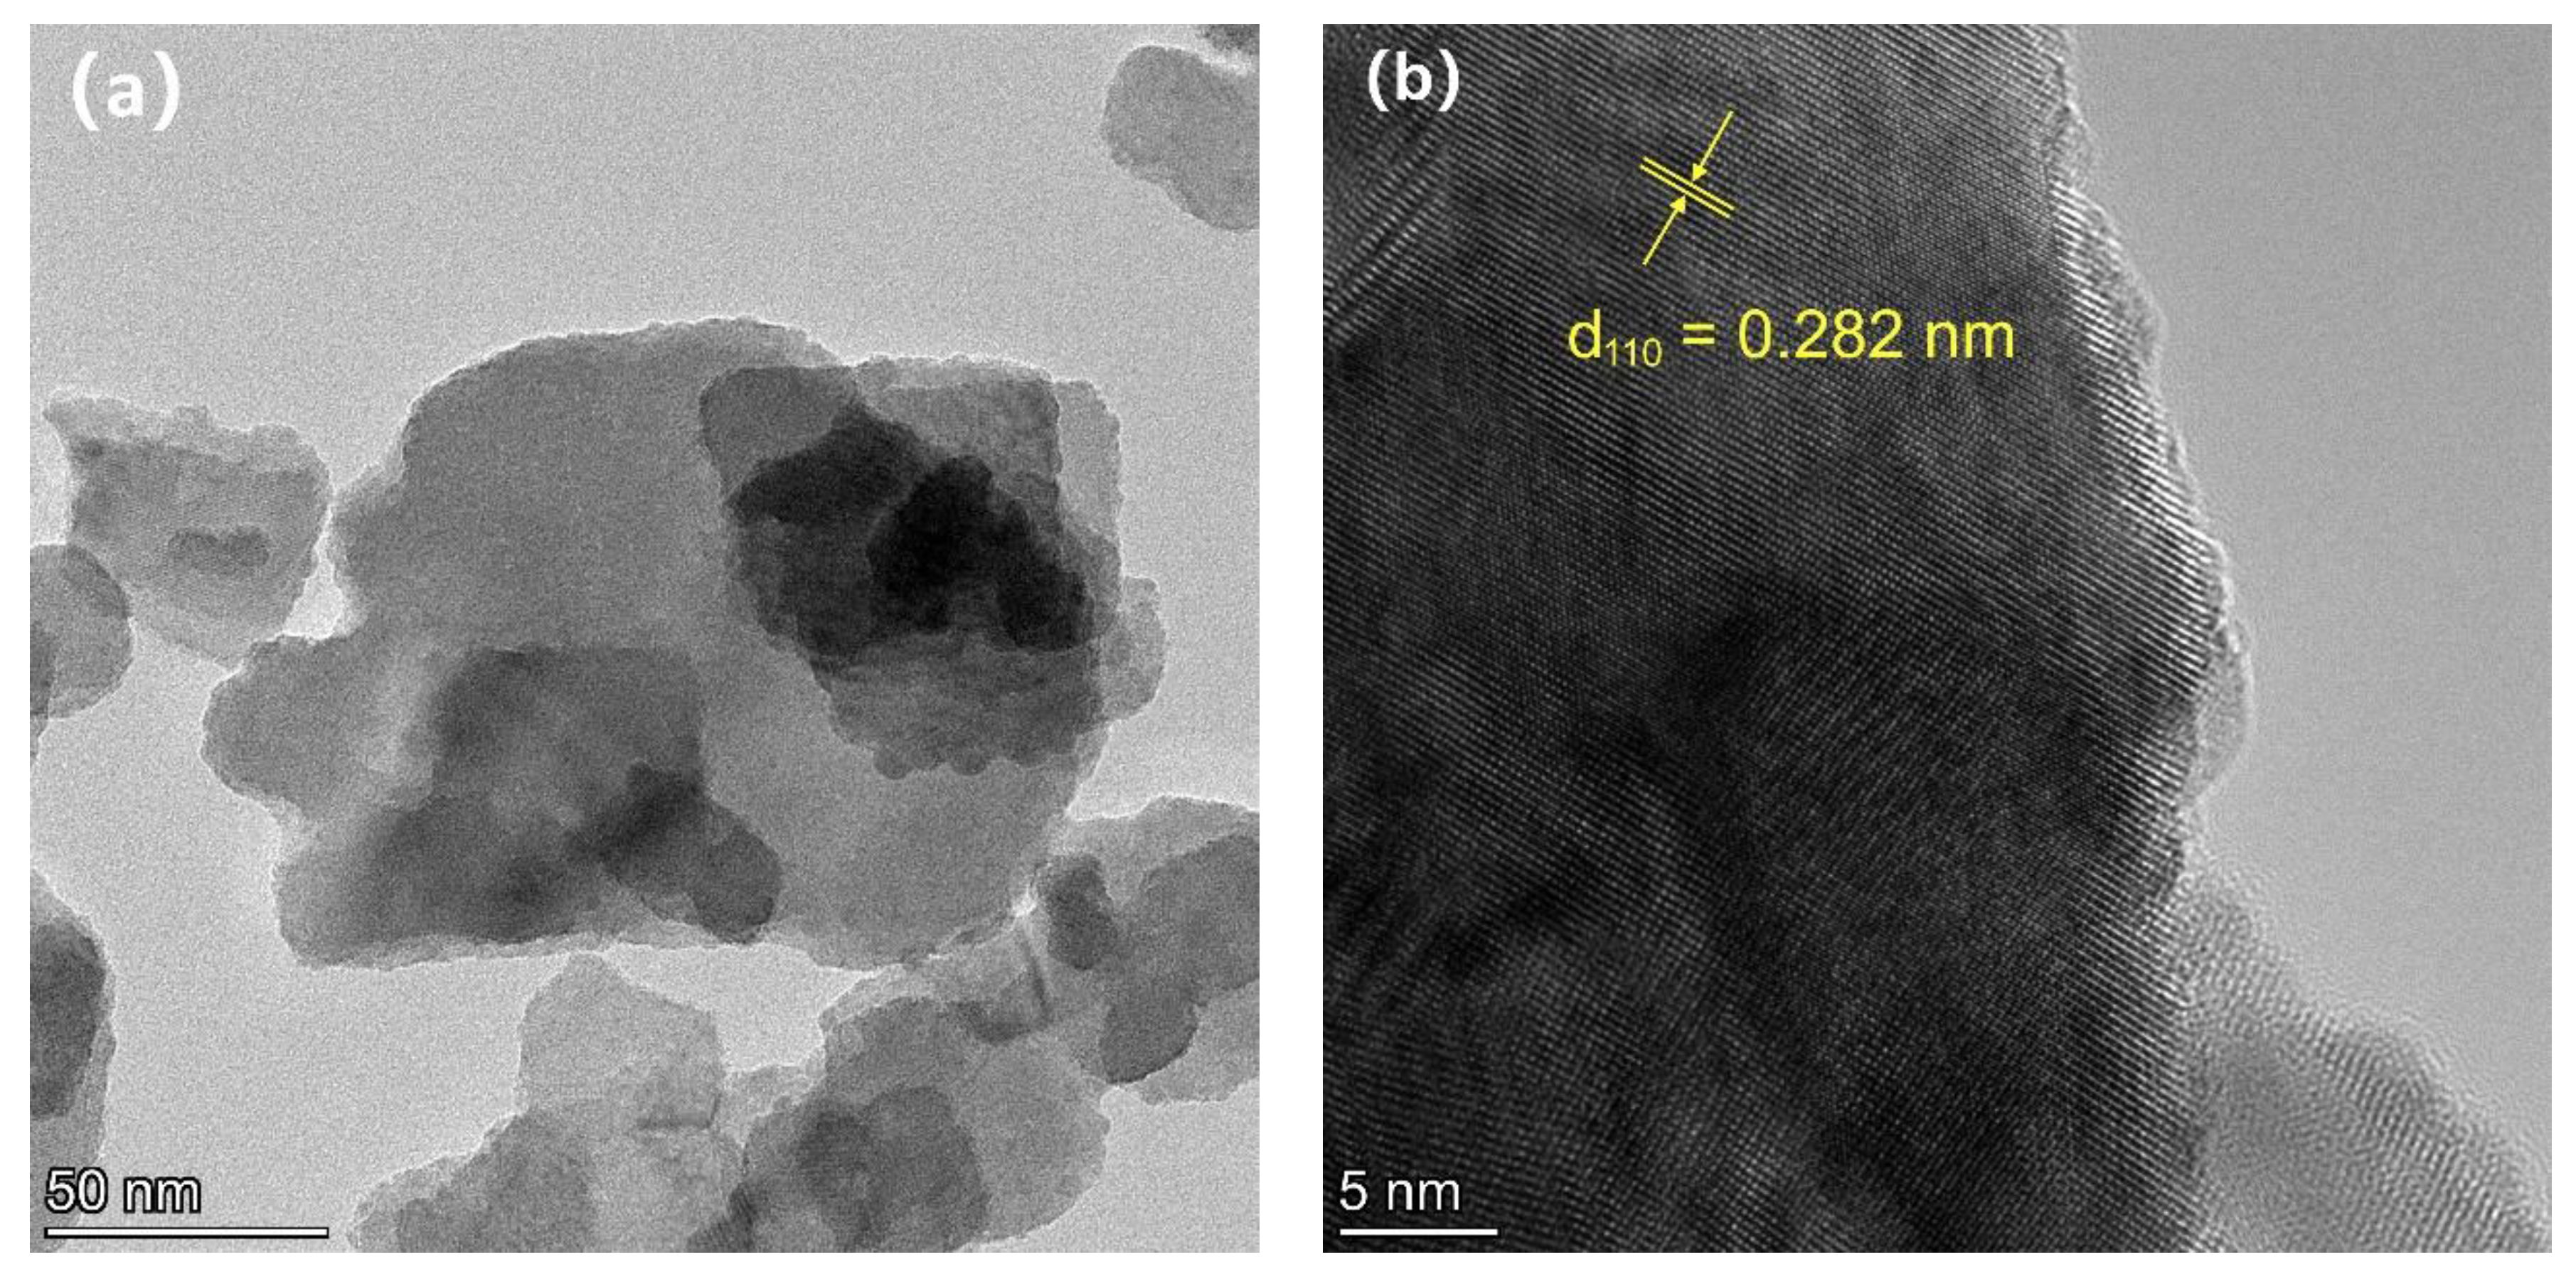
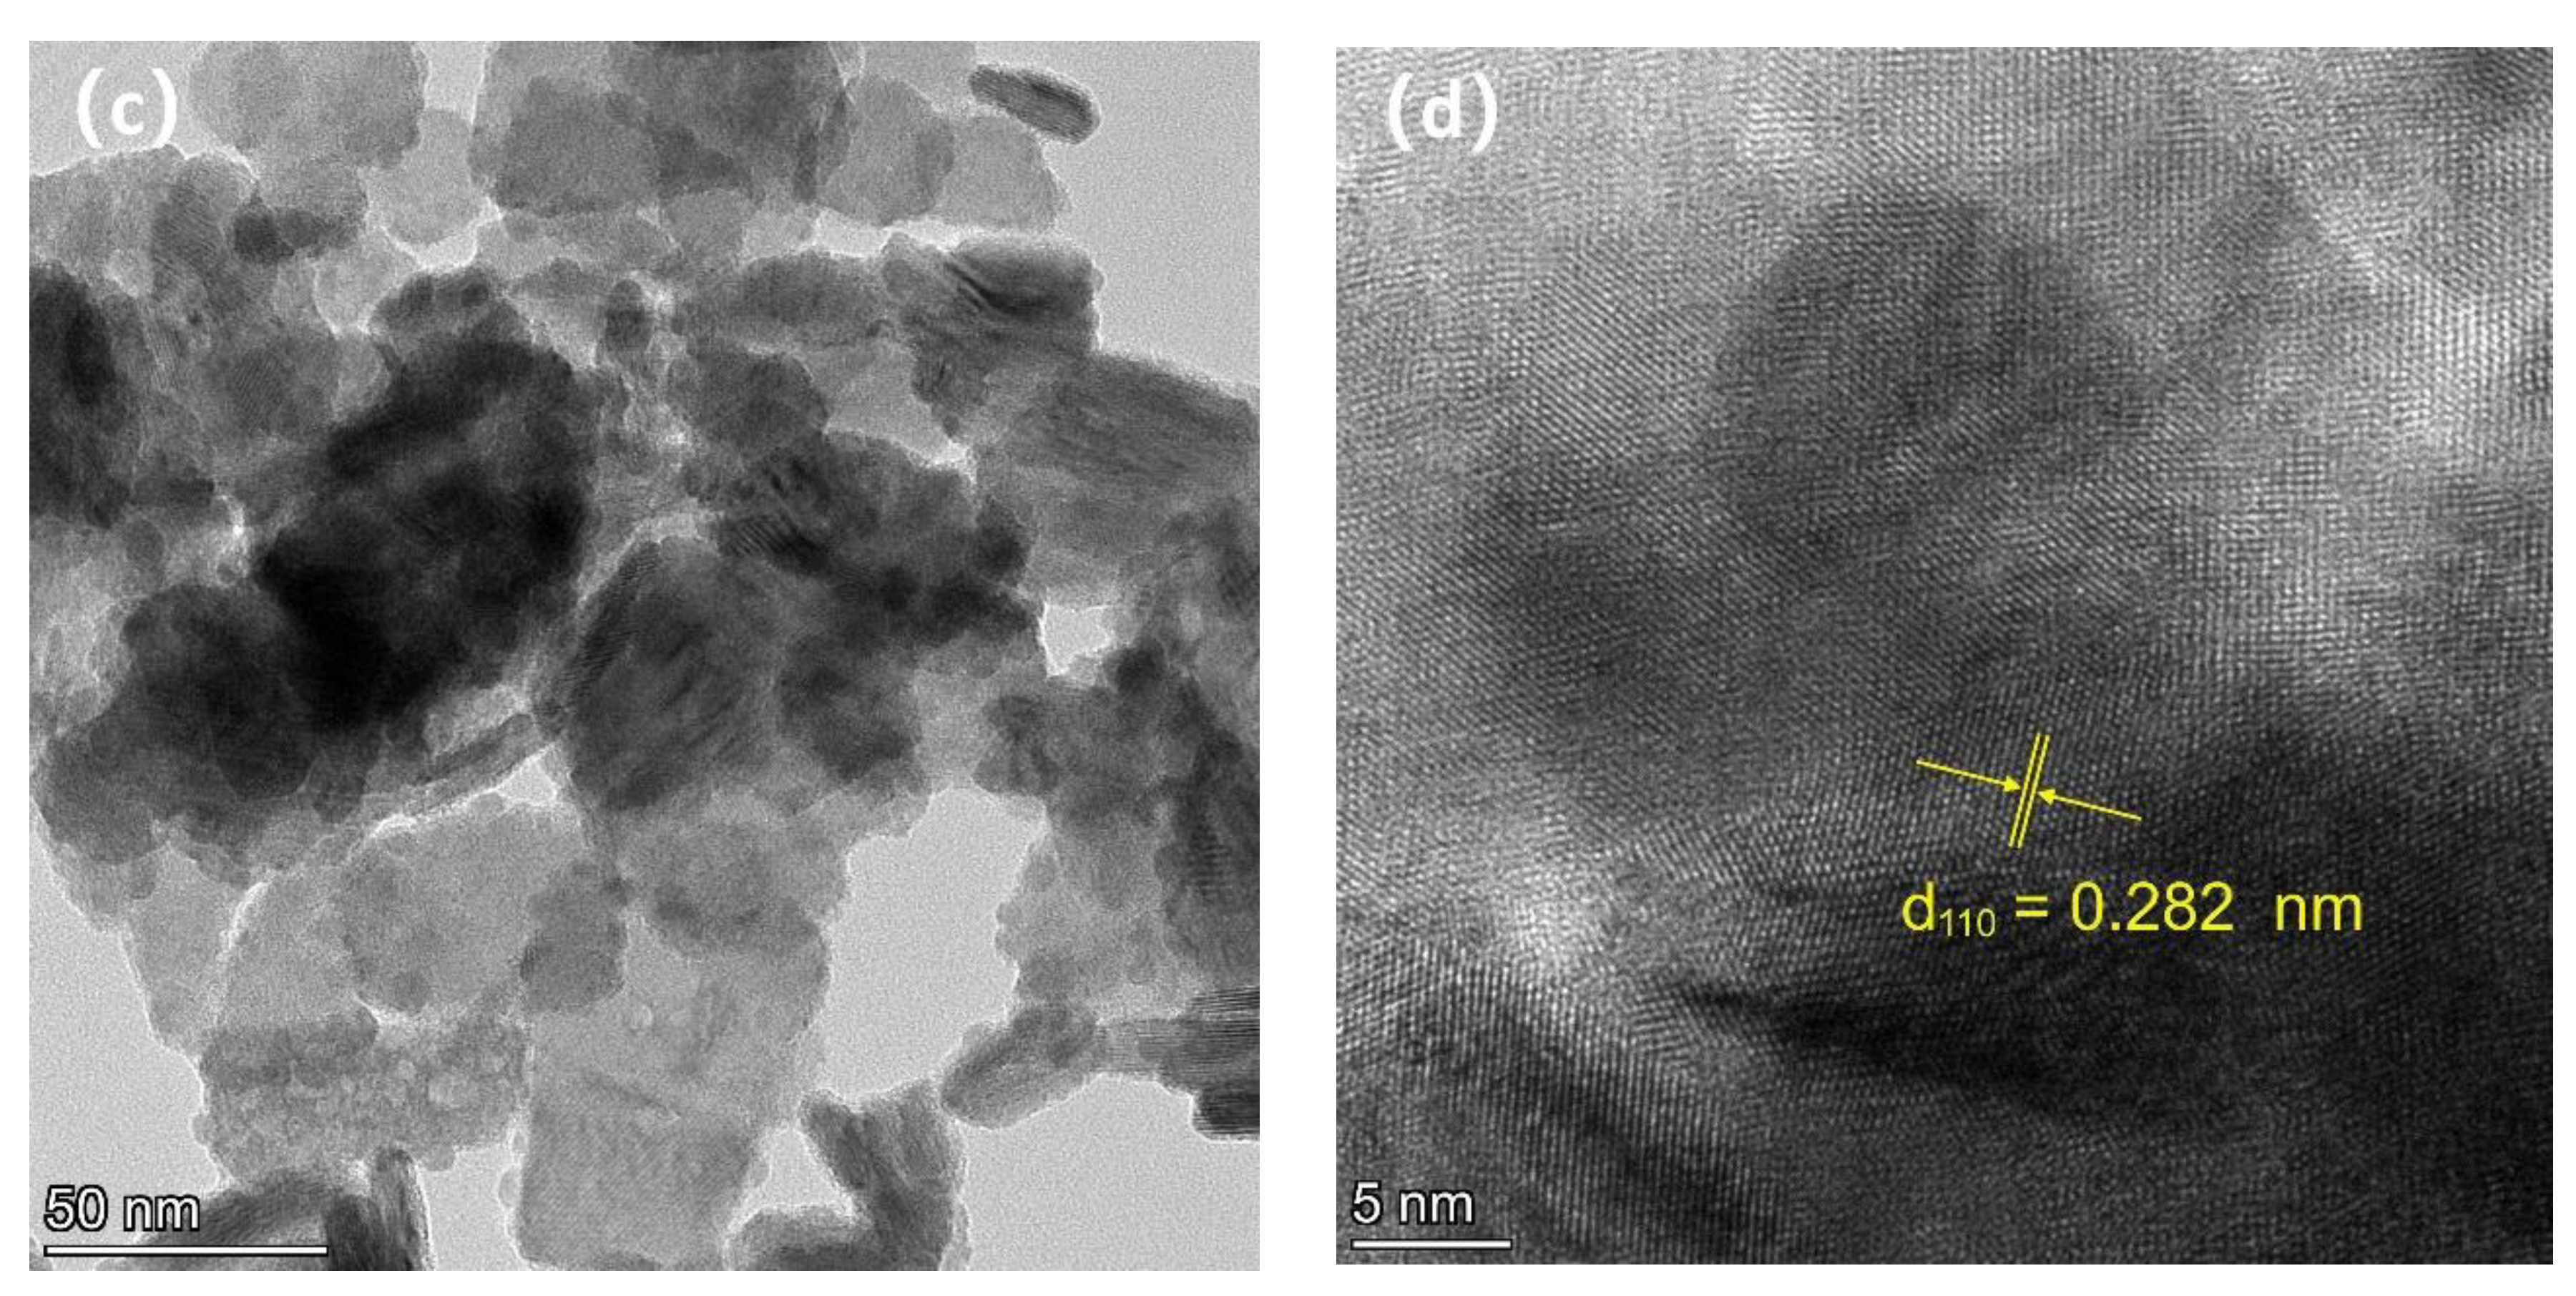
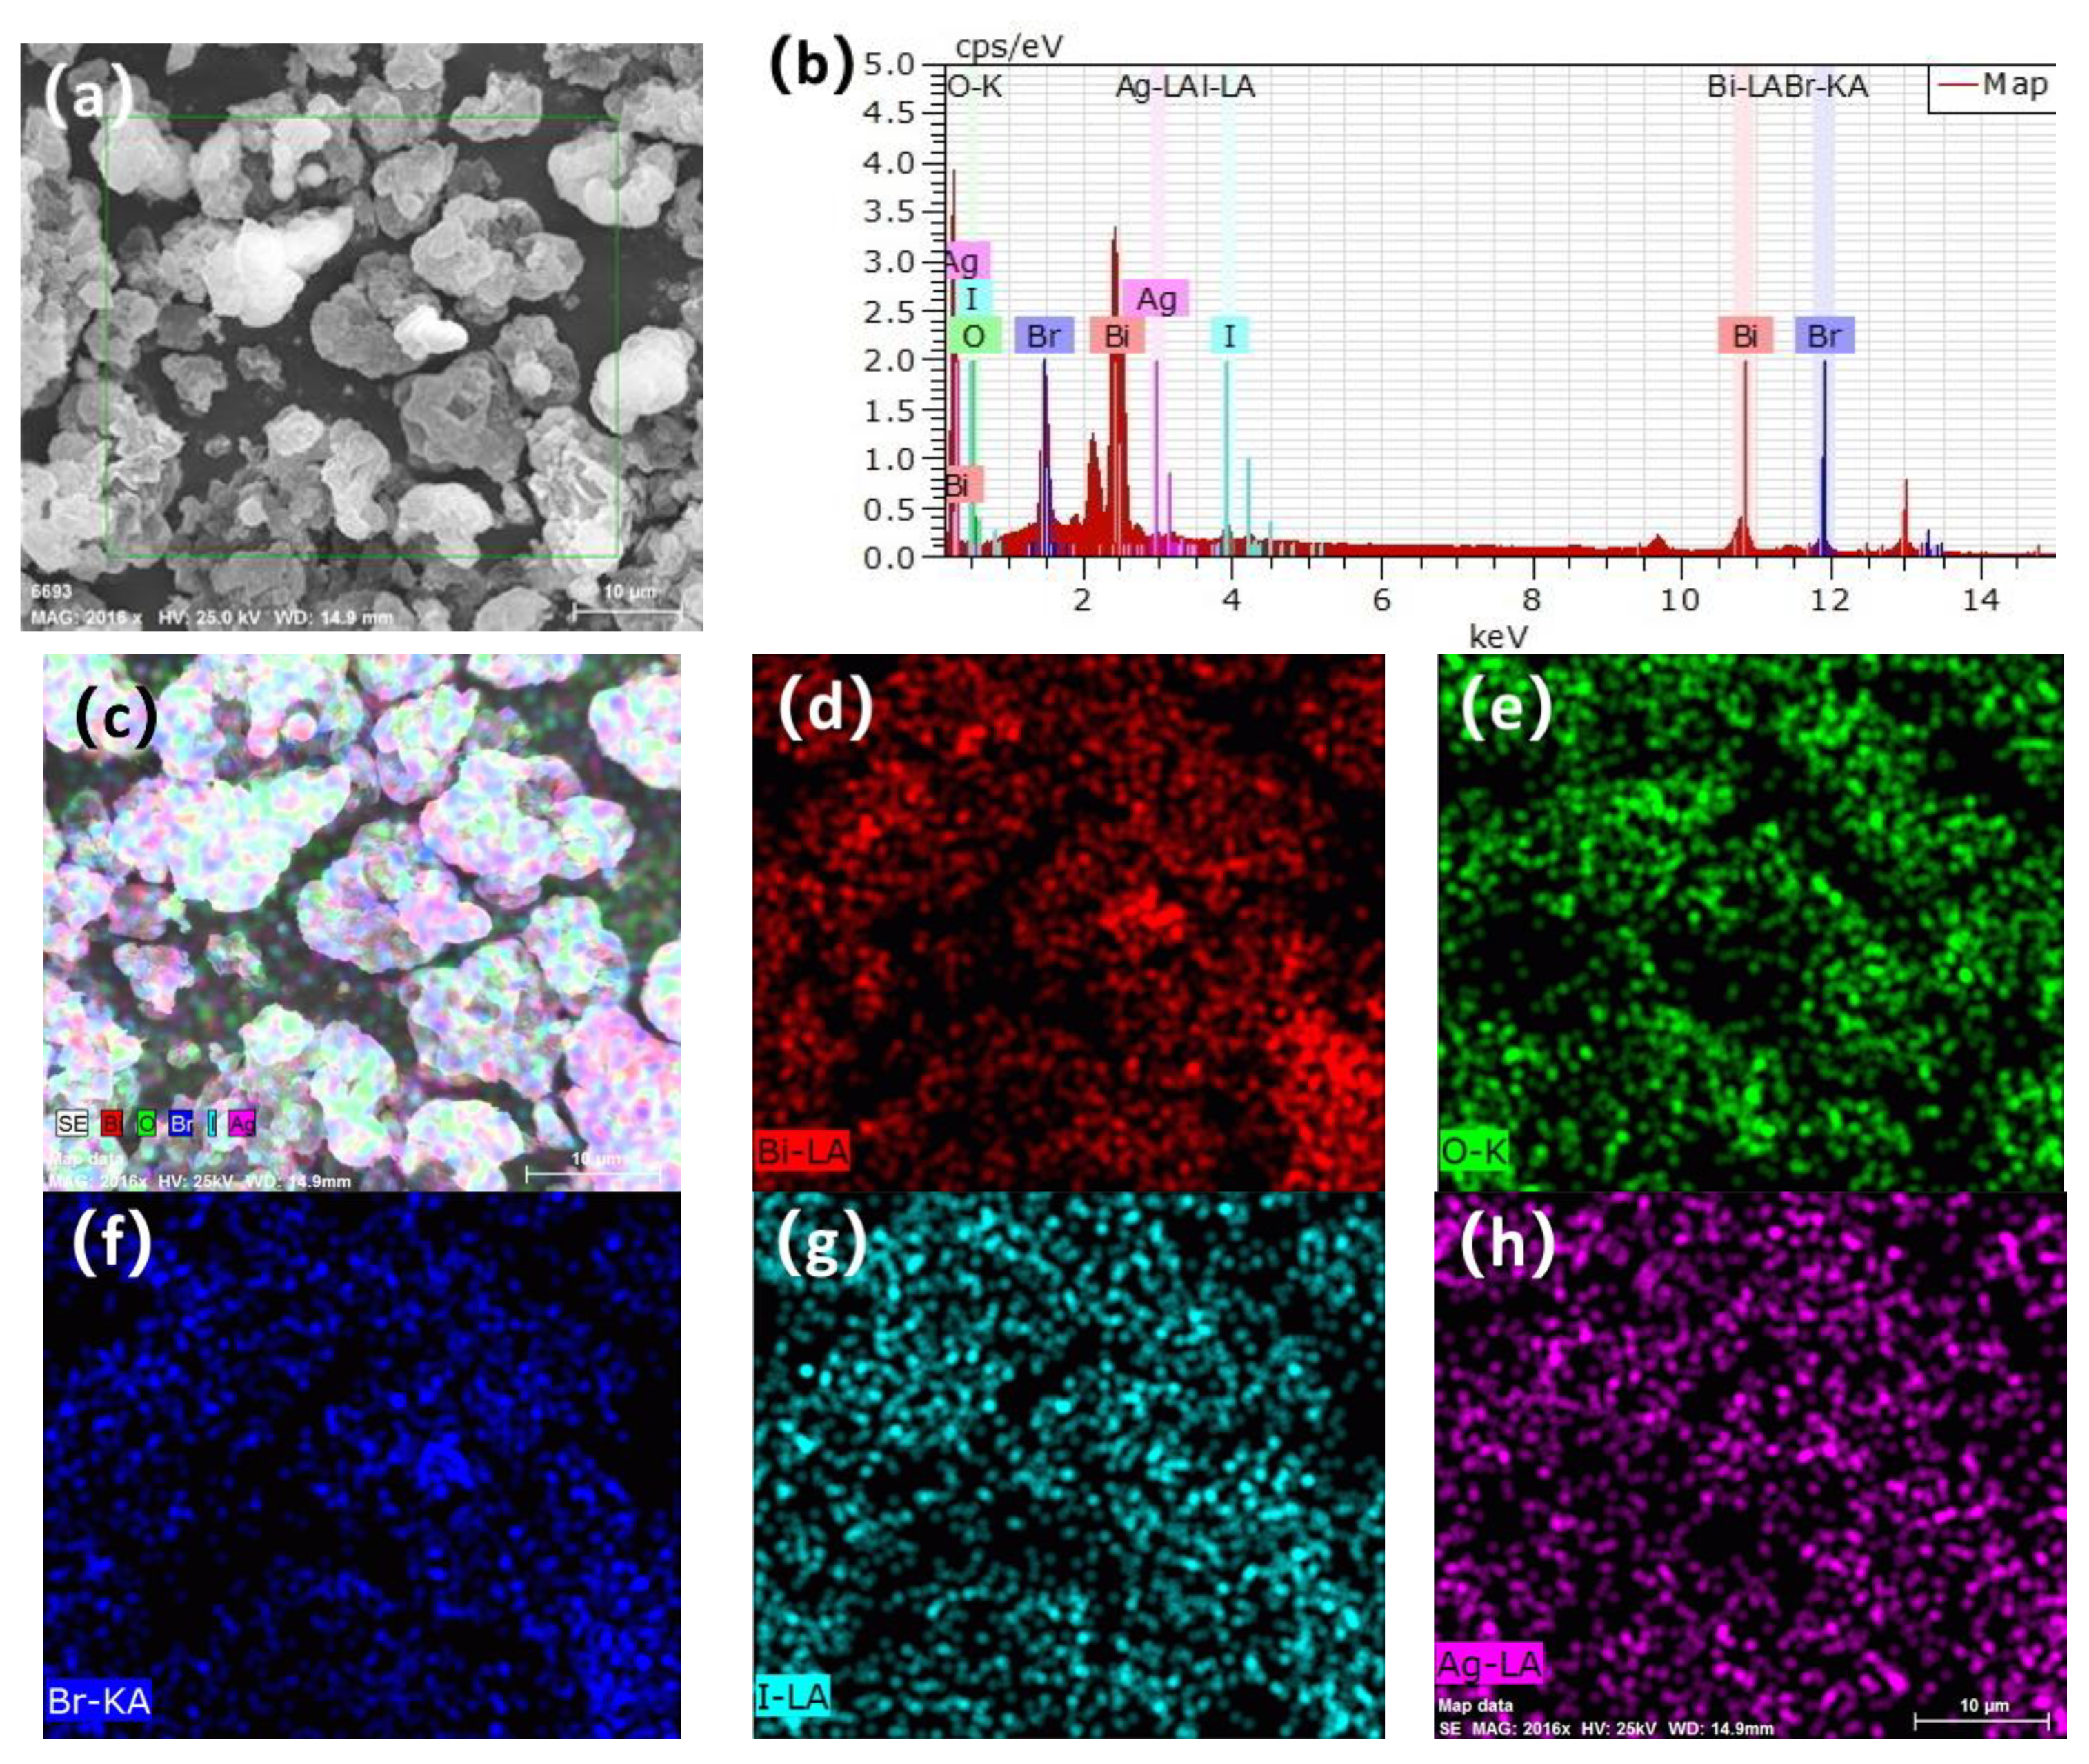
3.2. Scanning Electron Microscopy (SEM), Ttransmission Electron Microscopy (TEM), and Energy-Dispersive X-ray (EDX)

Because the SEM and TEM images of the as-prepared samples look very similar, only the pictures of the BiOBr0.85I0.15 and 1.0% Ag/BiOBr0.85I0.15 are presented. Figure 2a–c show the morphology and microstructure of the BiOBr0.85I0.15 composite catalyst. It can be seen from Figure 2a that the BiOBr0.85I0.15 is an irregular lump structure composed of many two-dimensional nanosheets with a width of 0.2~1.0 μm and a thickness of about 10~20 nm. Figure 2c shows that the width of the irregular lump structure is about 4.0~10.0 μm. Figure 2d–f show the morphology and microstructure of 1.0% Ag/BiOBr0.85I0.15 composite. In terms of morphology, 1.0% Ag/BiOBr0.85I0.15 has no obvious difference from BiOBr0.85I0.15, and also presents an irregular lump structure with a porous surface.
Figure 3a,b show the TEM and HRTEM images of the prepared BiOBr0.85I0.15 composite. Figure 3b shows the BiOBr0.85I0.15 with high crystallinity and clear lattice stripes. The continuous lattice stripes with a crystal plane spacing of 0.282 nm match well with the {110} plane of tetragonal-phase BiOBr (JCPDs No. 01-073-2061). Figure 3c,d show the TEM and HRTEM images of the prepared 1.0% Ag/BiOBr0.85I0.15 composite. Figure 3d also shows the continuous lattice stripes with a crystal plane spacing of 0.282 nm, which match well with the {110} crystal plane of tetragonal-phase BiOBr [45].
The elemental composition and distribution of the 1.0% Ag/BiOBr0.85I0.15 sample are presented in Figure 4. The composite catalyst only contains Bi, O, Br, I, and Ag elements, which is consistent with the theoretical element composition of the composite photocatalyst sample. In addition, the distribution of the above five elements is very uniform, which indicates that silver nanoparticles are uniformly loaded on BiOBr0.85I0.15 composite nanoparticles. According to the test results of EDX, the rough atomic concentrations of I and Br of the sample surface are 4.76% and 30.18%, respectively. The concentration ratio of I to Br is 15.77:100, which is close to 0.15:0.85 (17.65:100).

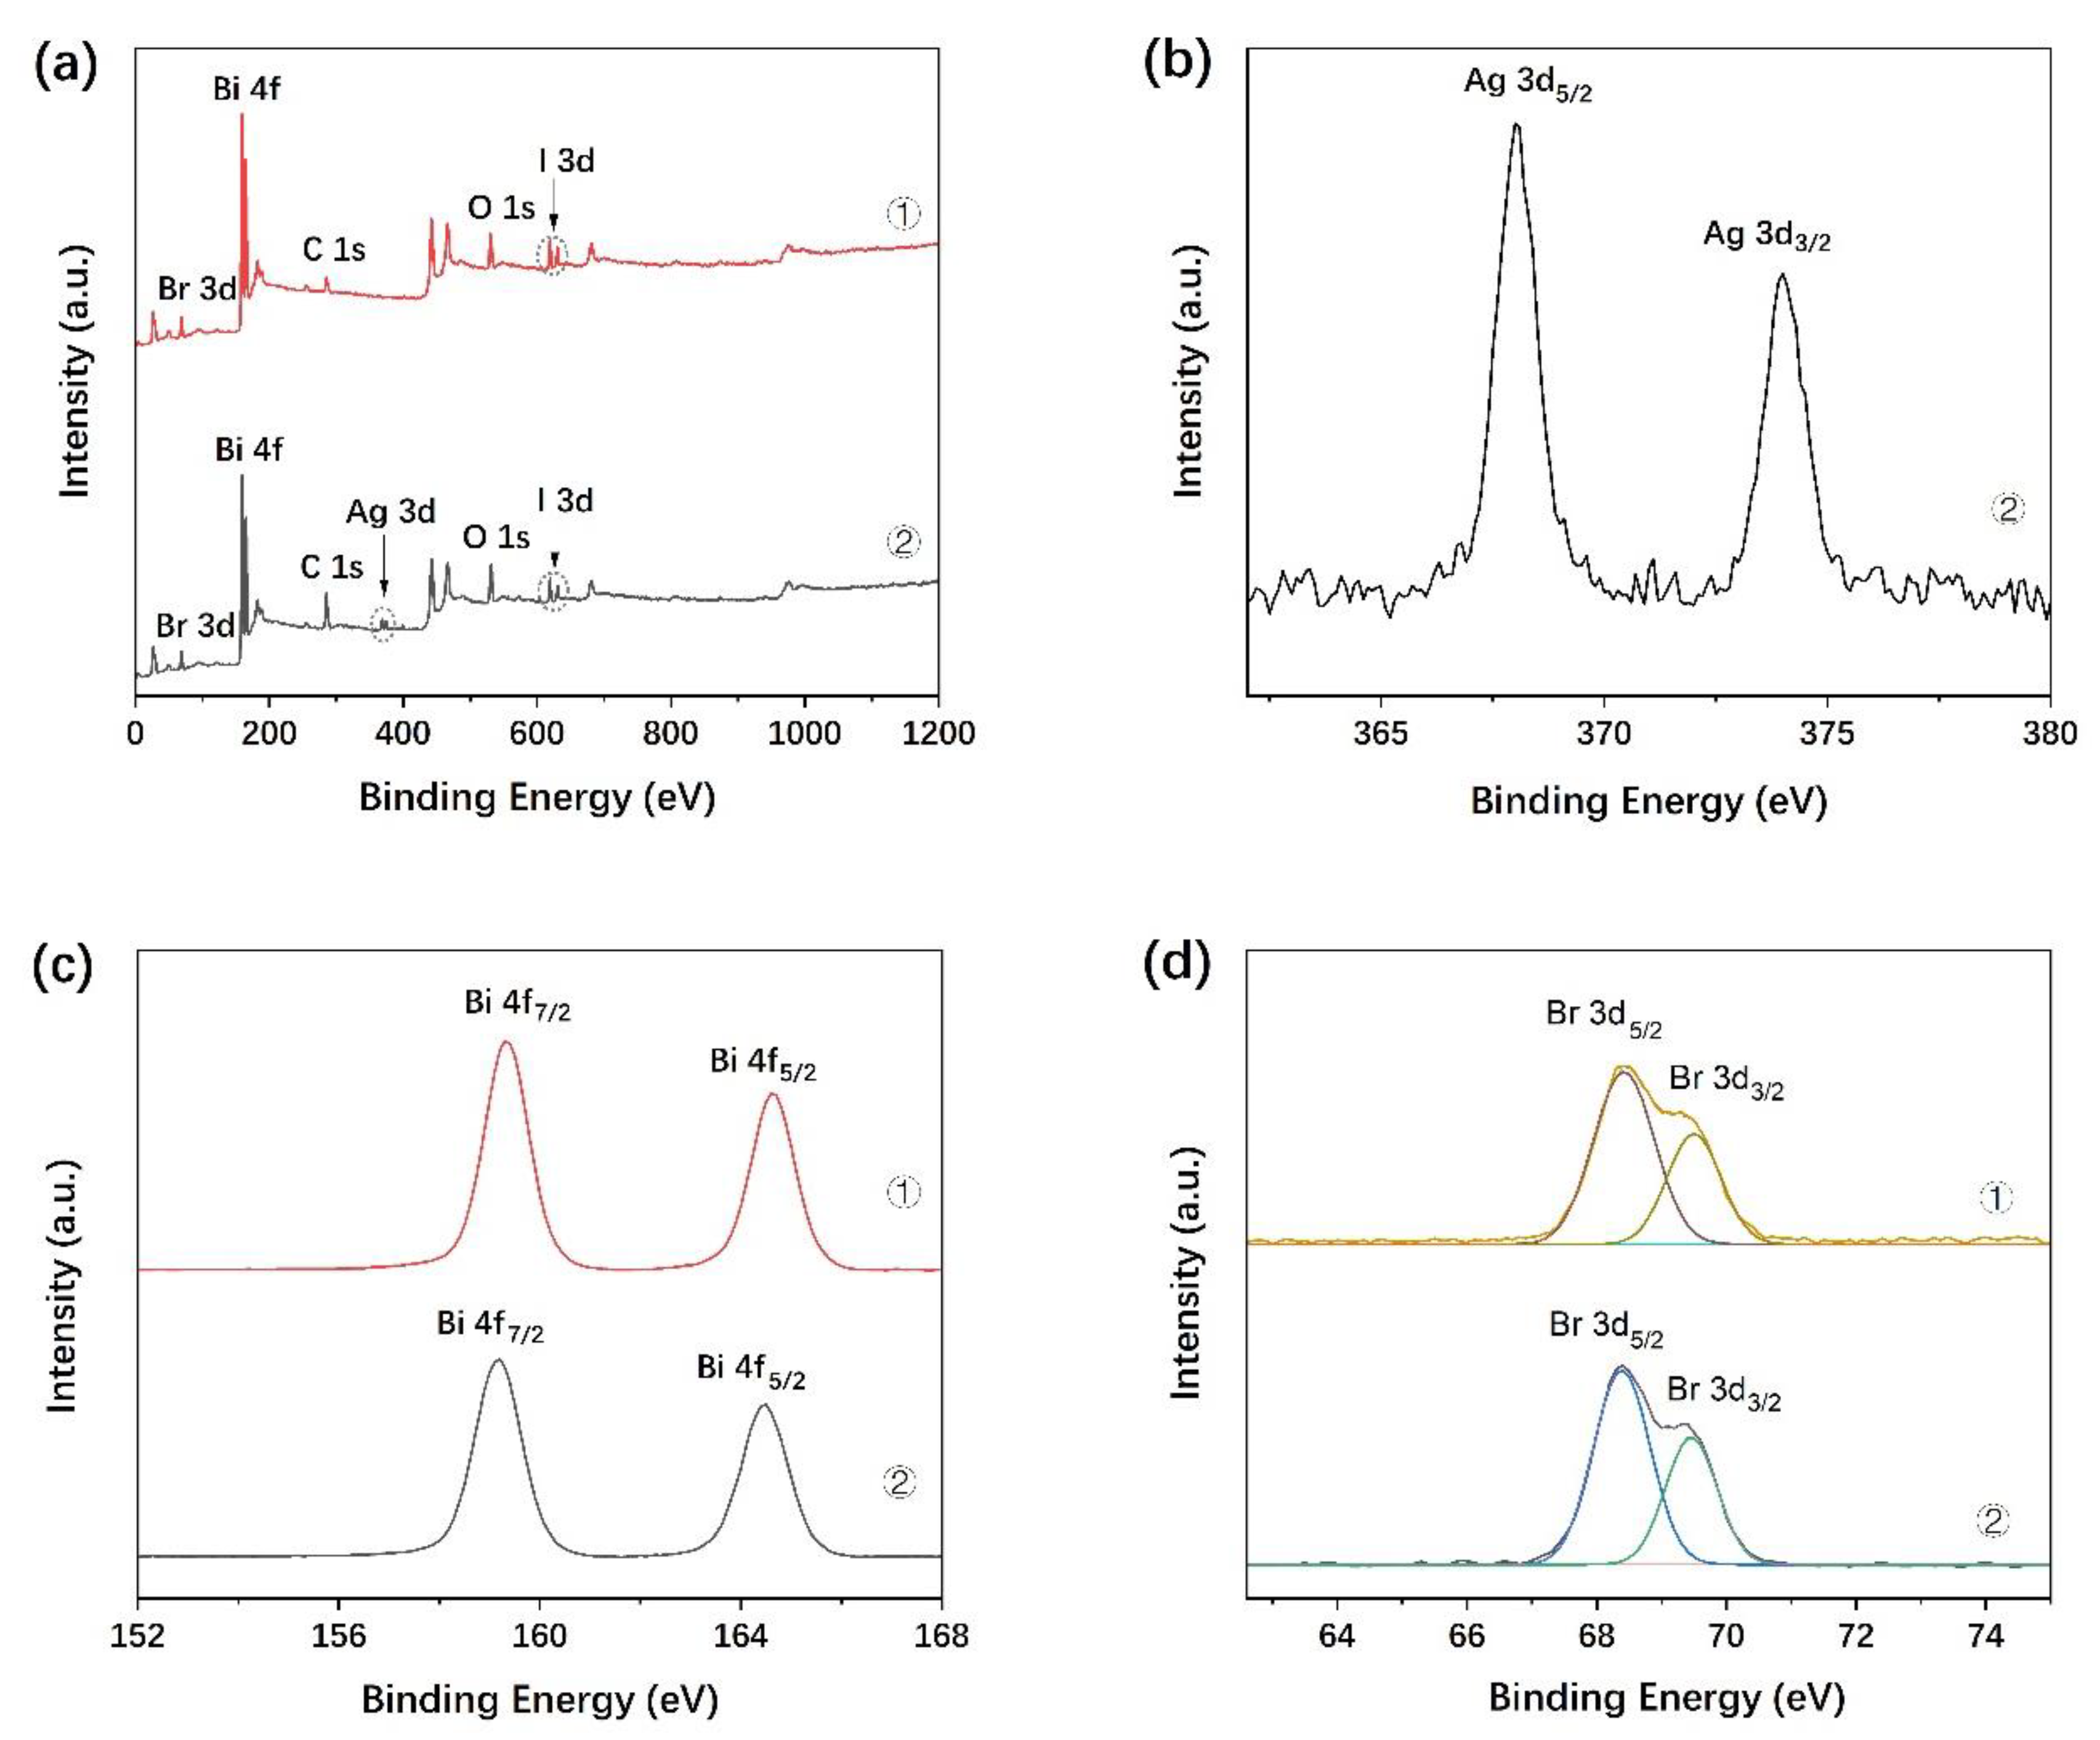
3.3. X-ray Photoelectron Spectroscopy (XPS)

The XPS spectra of the BiOBr0.85I0.15 and 1.0% Ag/BiOBr0.85I0.15 samples in Figure 5 provide the chemical composition and valence state of the surface elements. All the XPS peak positions are calibrated by C 1s as reference, with a binding energy of 284.8 eV. Figure 5a shows the survey spectra of the BiOBr0.85I0.15 and 1.0% Ag/BiOBr0.85I0.15. Only C, O, Bi, Br, and I are detected in BiOBr0.85I0.15, and C, O, Bi, Br, I, and Ag in 1.0% Ag/BiOBr0.85I0.15, which indicates the high purity of the samples. The Ag3d5/2 and Ag3d3/2 spin-orbital splitting photoelectrons for 1.0% Ag/BiOBr0.85I0.15 in Figure 5b are located at binding energies of 368.0 and 374.0 eV, respectively, which are assigned to metallic-state Ag [46]. As shown in Figure 5c, the two peaks at about 164.5 eV and 159.2 eV are attributed to Bi 4f5/2 and Bi 4f7/2, respectively, which are characteristic of Bi3+ in the BiOX material [47]. The two peaks in Figure 5d can be identified from the Br 3d spectra. The peak of 69.5 eV corresponds to the Br 3d3/2, whereas the peak located at 68.4 eV can be attributed to Br 3d5/2 in Ag/BiOBr0.85I0.15 and BiOBr0.85I0.15, respectively, indicating the presence of Br. Figure 5e shows the high-resolution XPS spectra of the O 1s, which can be fitted into two peaks. The main peaks at about 530.0 eV are attributed to the Bi-O bonds in [Bi2O2] slabs of the BiOX layered structure, and the small peaks at 531.2 eV are assigned to the hydroxyl groups on the surface in Ag/BiOBr0.85I0.15 and BiOBr0.85I0.15 samples, respectively. The two peaks located at 630.5 and 619.0 eV in Figure 5f correspond to I 3d3/2 and I 3d5/2 in the BiOBr0.85I0.15 structure, respectively [36]. As a result, the chemical compositions and valence states presented in the XPS spectra are consistent with the composition of the Ag/BiOBr0.85I0.15 and BiOBr0.85I0.15.

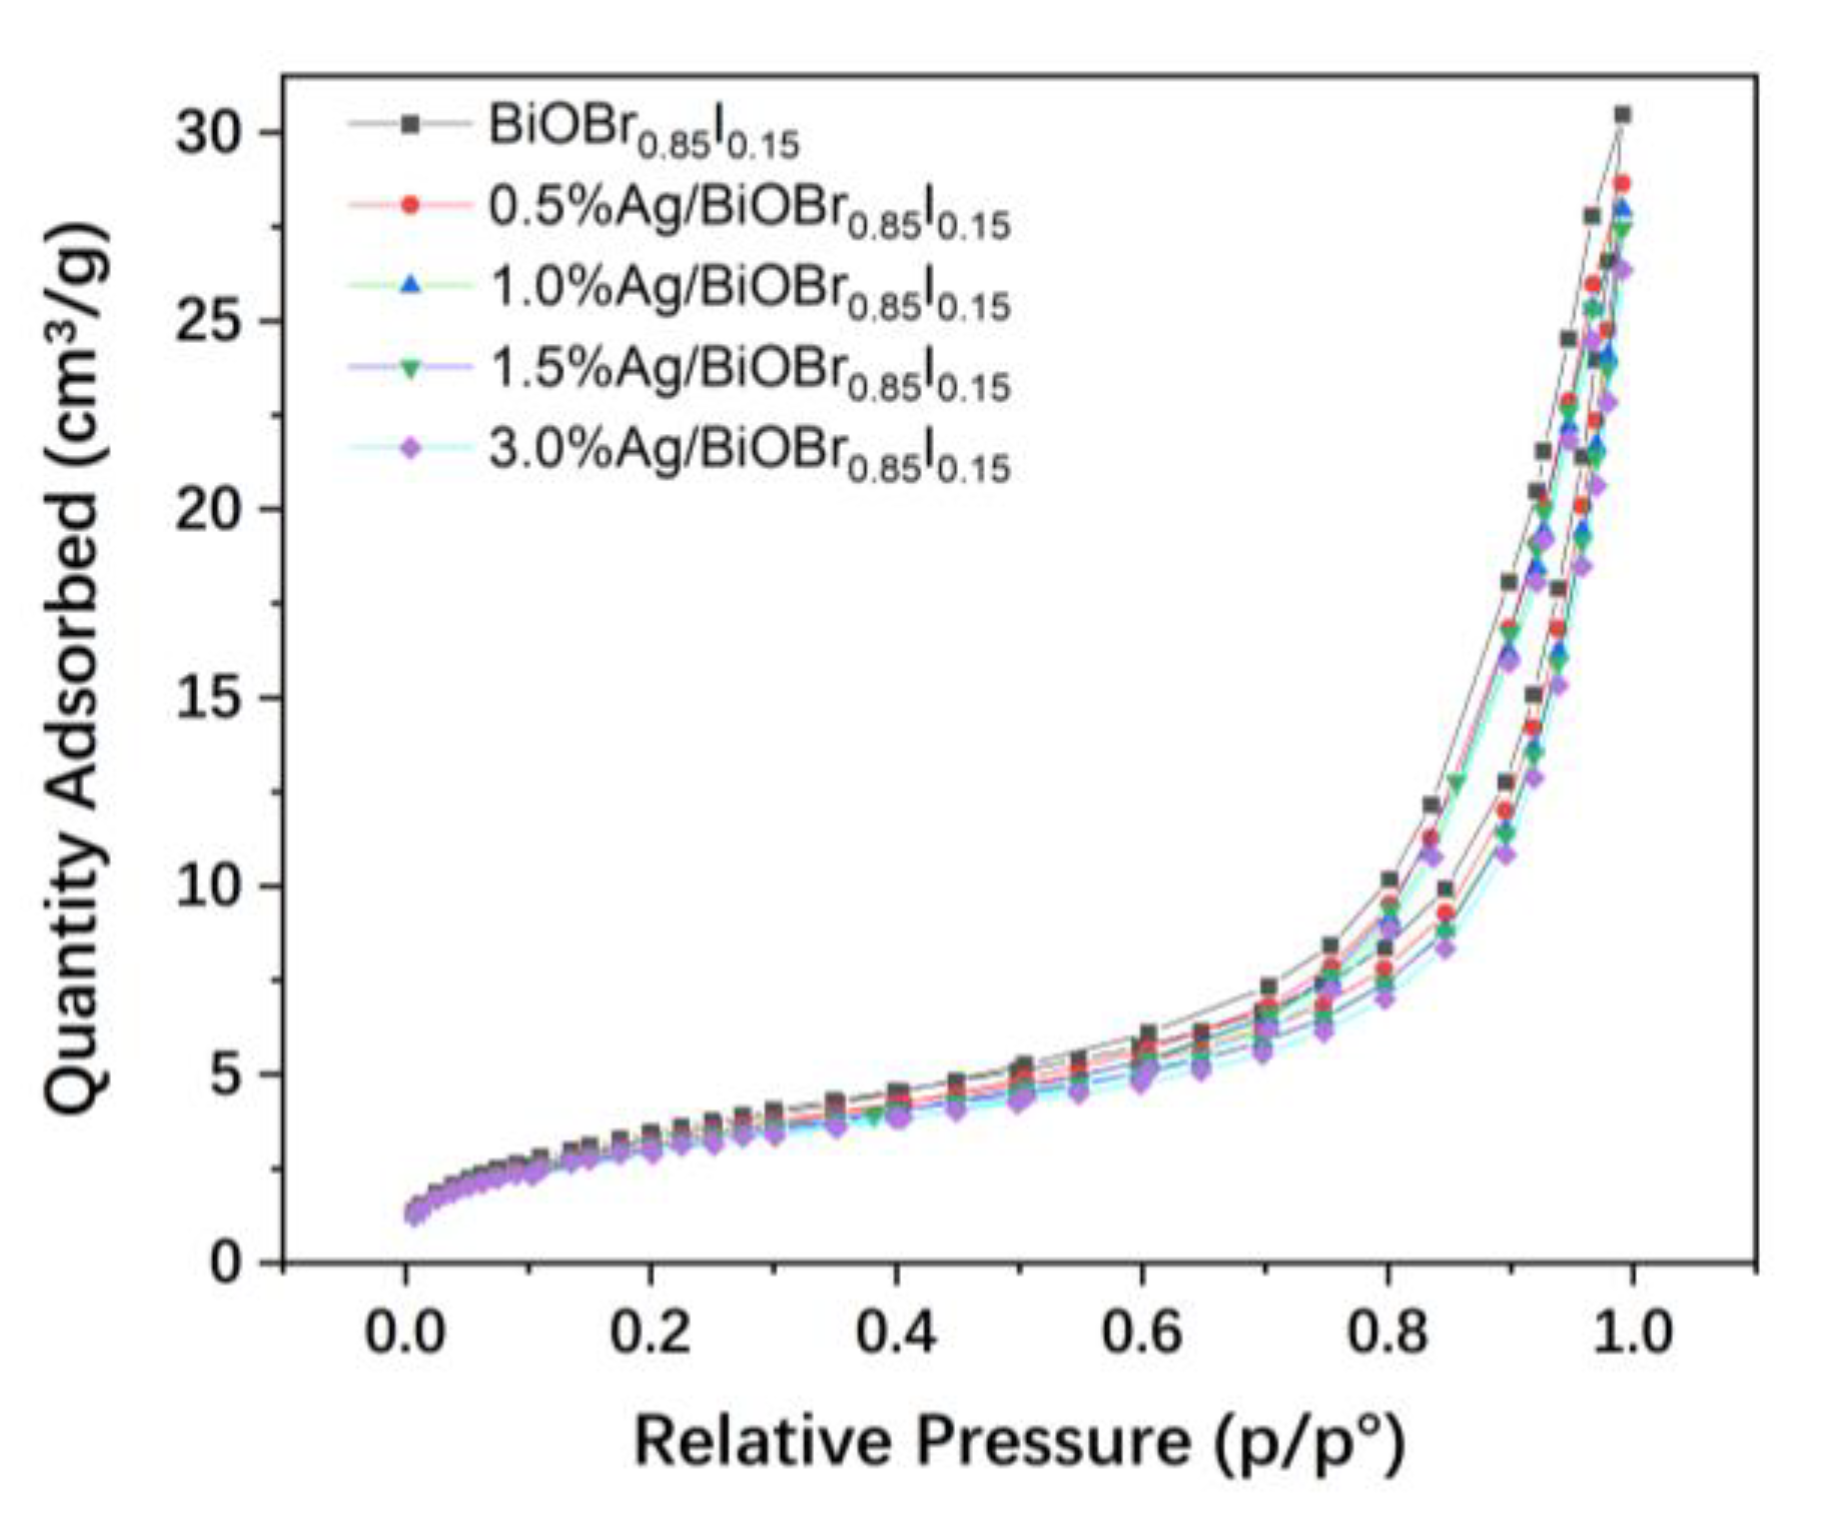
3.4. N2 Adsorption–Desorption Isotherms

The N2 adsorption–desorption isotherms of the samples are presented in Figure 6. The BET surface areas of the as-prepared samples were tested and calculated to be 13.30, 12.23, 11.89, 11.80, and 11.29 m2/g for the BiOBr0.85I0.15, 0.5% Ag/BiOBr0.85I0.15, 1.0% Ag/ BiOBr0.85I0.15, 1.5% Ag/BiOBr0.85I0.15, and 3.0% Ag/BiOBr0.85I0.15 samples, respectively. The BET surface areas of Ag/BiOBr0.85I0.15 samples are a little smaller than that of the BiOBr0.85I0.15 sample. With the increase of silver loading, the specific surface areas of the samples decreased slightly.

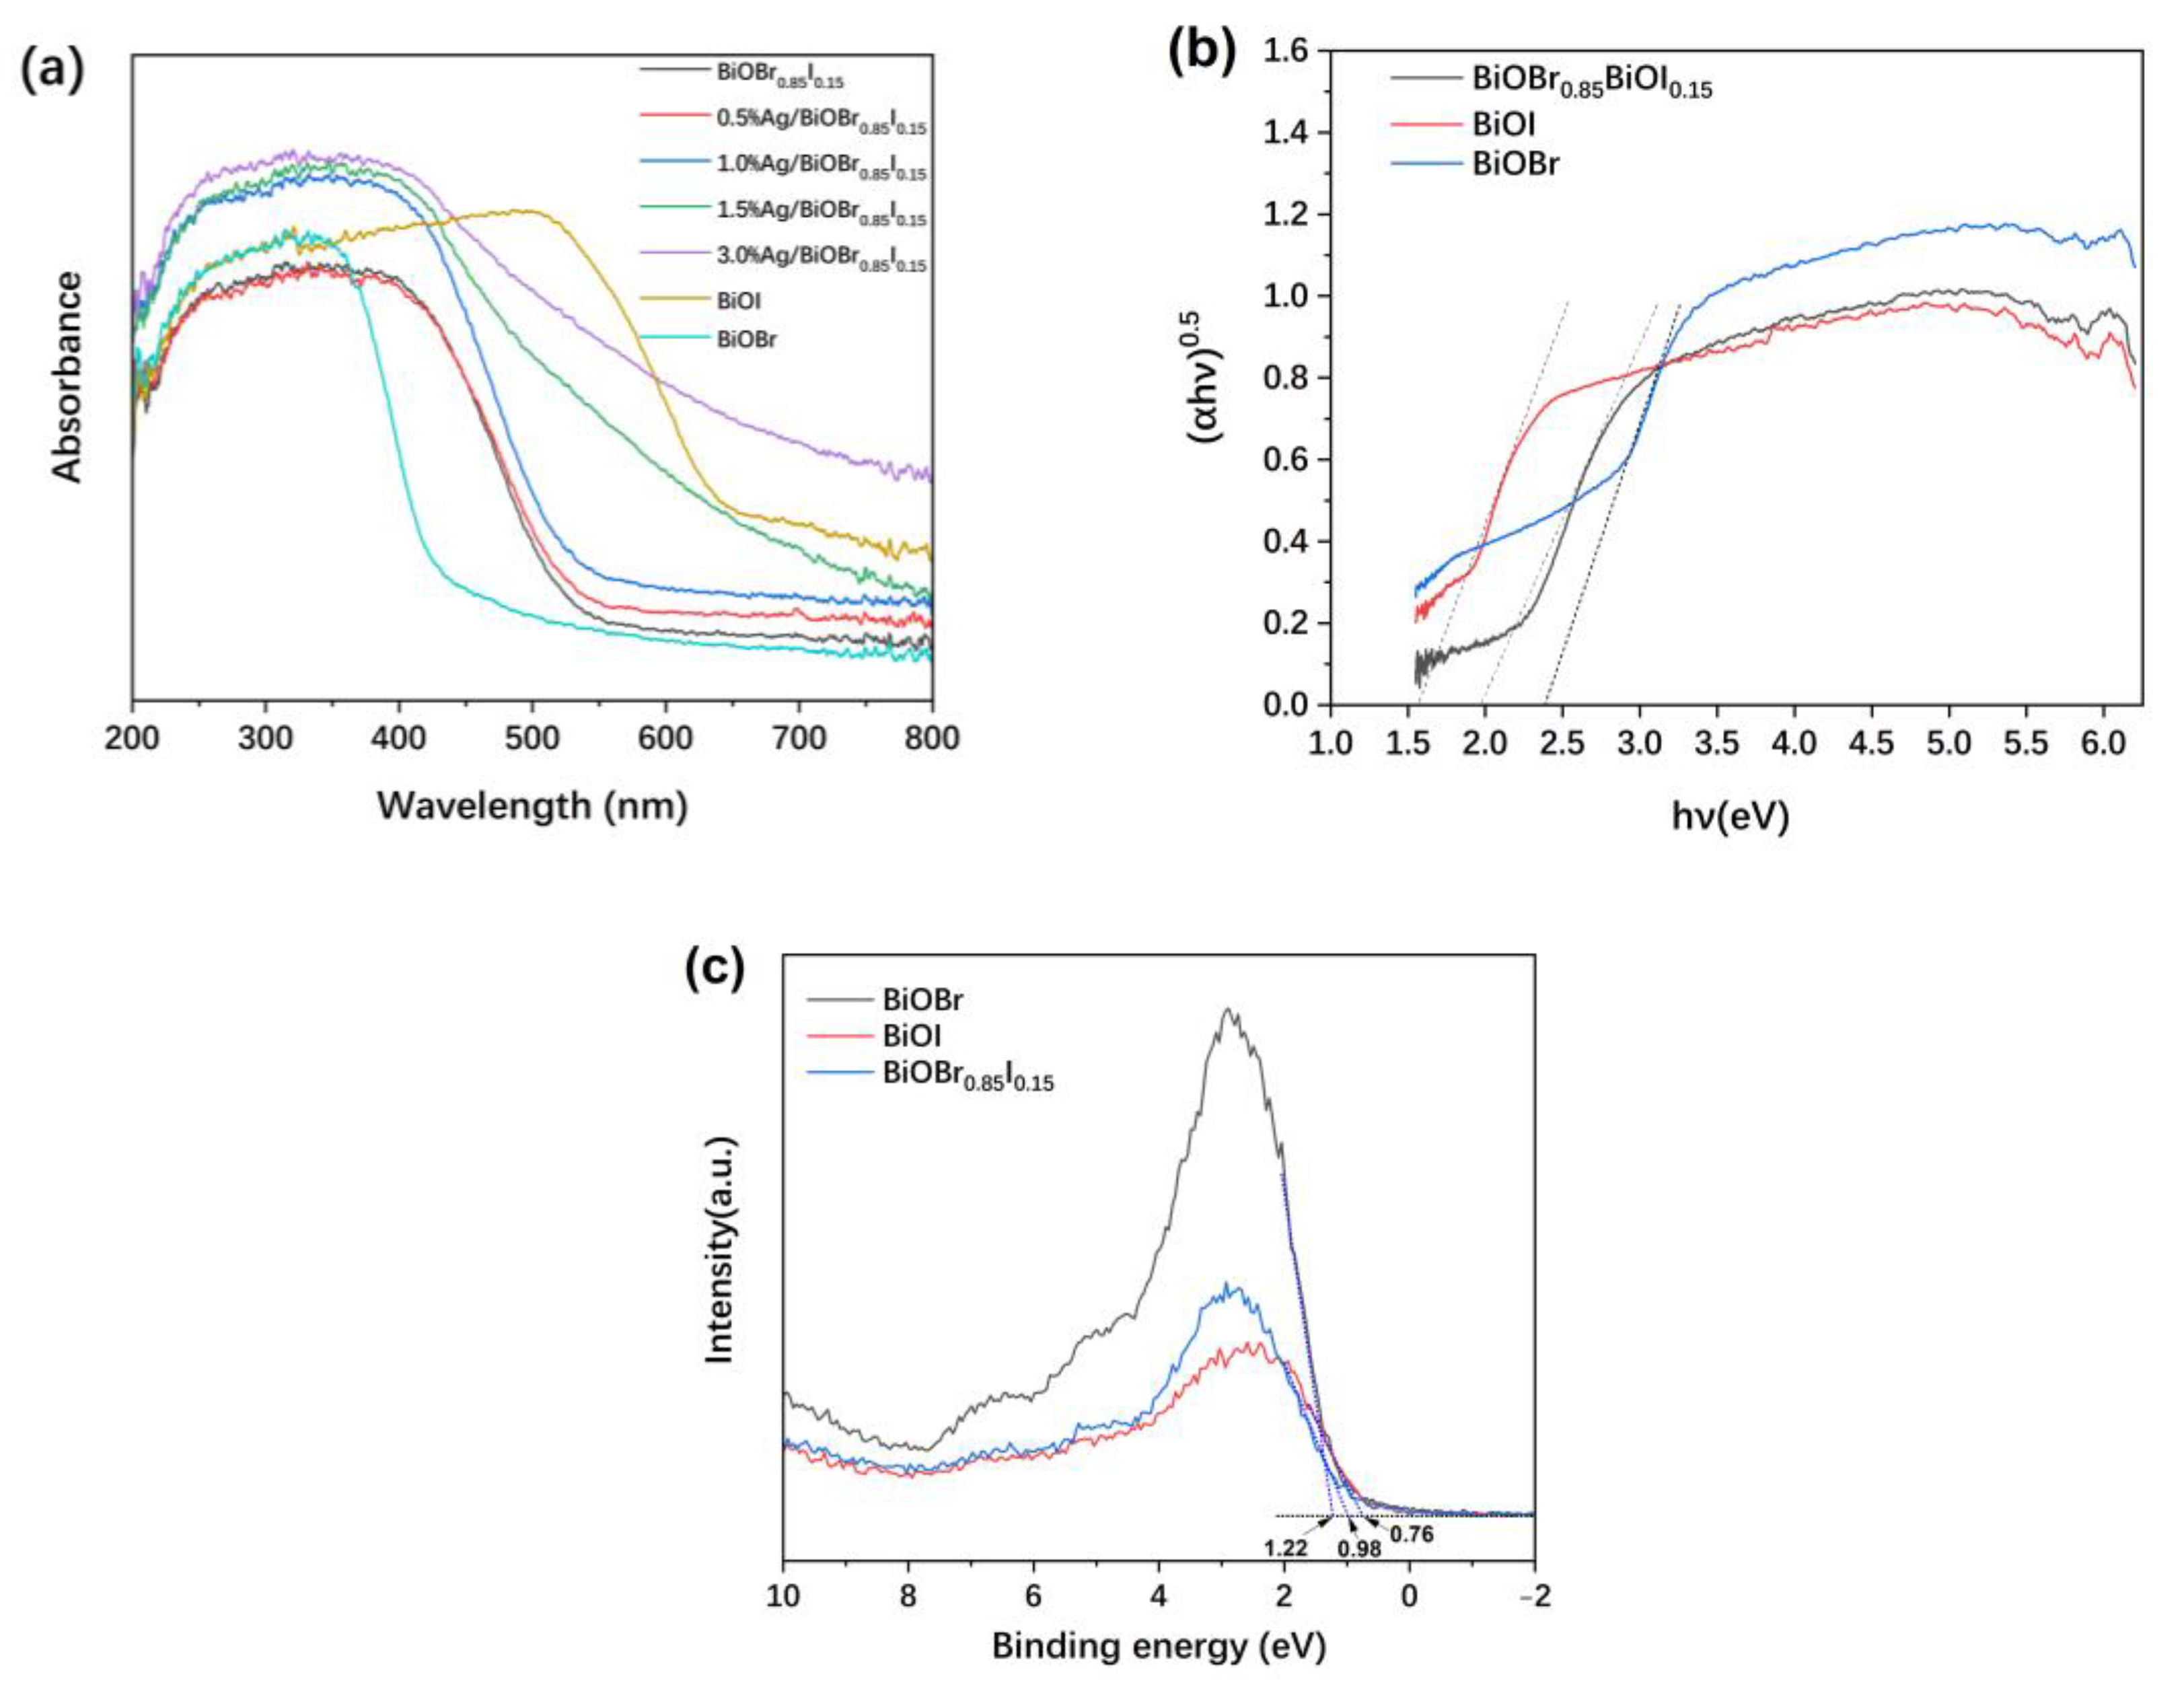
3.5. UV-Visible Diffuse Reflectance Spectra (UV-Vis DRS)

The UV-visible diffuse reflectance spectra of the samples in the range of 200~800 nm are shown in Figure 7a. The BiOBr0.85I0.15 sample has a stronger absorption of UV light than that of visible light. In the visible region, the light absorption capacity of the sample decreases significantly with the increase of wavelength. With the increase of the silver loading, the absorption of light, especially visible light by the Ag/BiOBr0.85I0.15 composite, increases significantly. In fact, the as-prepared BiOBr0.85I0.15 is orange-yellow. Silver nanoparticles are black, which is due to the absorption of visible light caused by surface plasmon resonance. The color of the Ag/BiOBr0.85I0.15 catalysts become darker with the increase of silver loading.
The bandgap value can be estimated by a related curve of (αhν)0.5 versus photon energy (hν) according to the Kubelka–Munk function, αhν = A(hν − Eg)n/2, where α, h, ν, and A stand for absorption coefficient, Planck constant, light frequency, and proportionality, respectively [48]. The value of n is determined by the optical transition mode of the semiconductor. For BiOBr and BiOI, the value of n is 4 [36].
It can be seen from Figure 7b that the band gap values of BiOBr and BiOI are estimated to be 2.39 eV and 1.58 eV, respectively, and the band gap of the BiOBr0.85I0.15 composite is 1.98 eV. The band gap energy of the composite is between the energy of BiOBr and BiOI, and is obviously smaller than that of BiOBr, which enhances its absorption of visible light, and is conducive to the photocatalytic reaction.
As shown in Figure 7c, the valence band X-ray photoelectron spectra (VB-XPS) of the samples were investigated. The valence band potential of BiOBr, BiOI, and BiOBr0.85I0.15 were found to be at 1.22, 0.76, and 0.98 eV, respectively. According to the equation of ECB = Eg − EVB [49], the conduction band (CB) edges of BiOBr, BiOI, and BiOBr0.85I0.15 are calculated to be −1.17, −0.82, and −1.00 eV, respectively; this indicates that BiOBr0.85I0.15 has elevated oxidizing ability compared to BiOI, through a higher VB position.

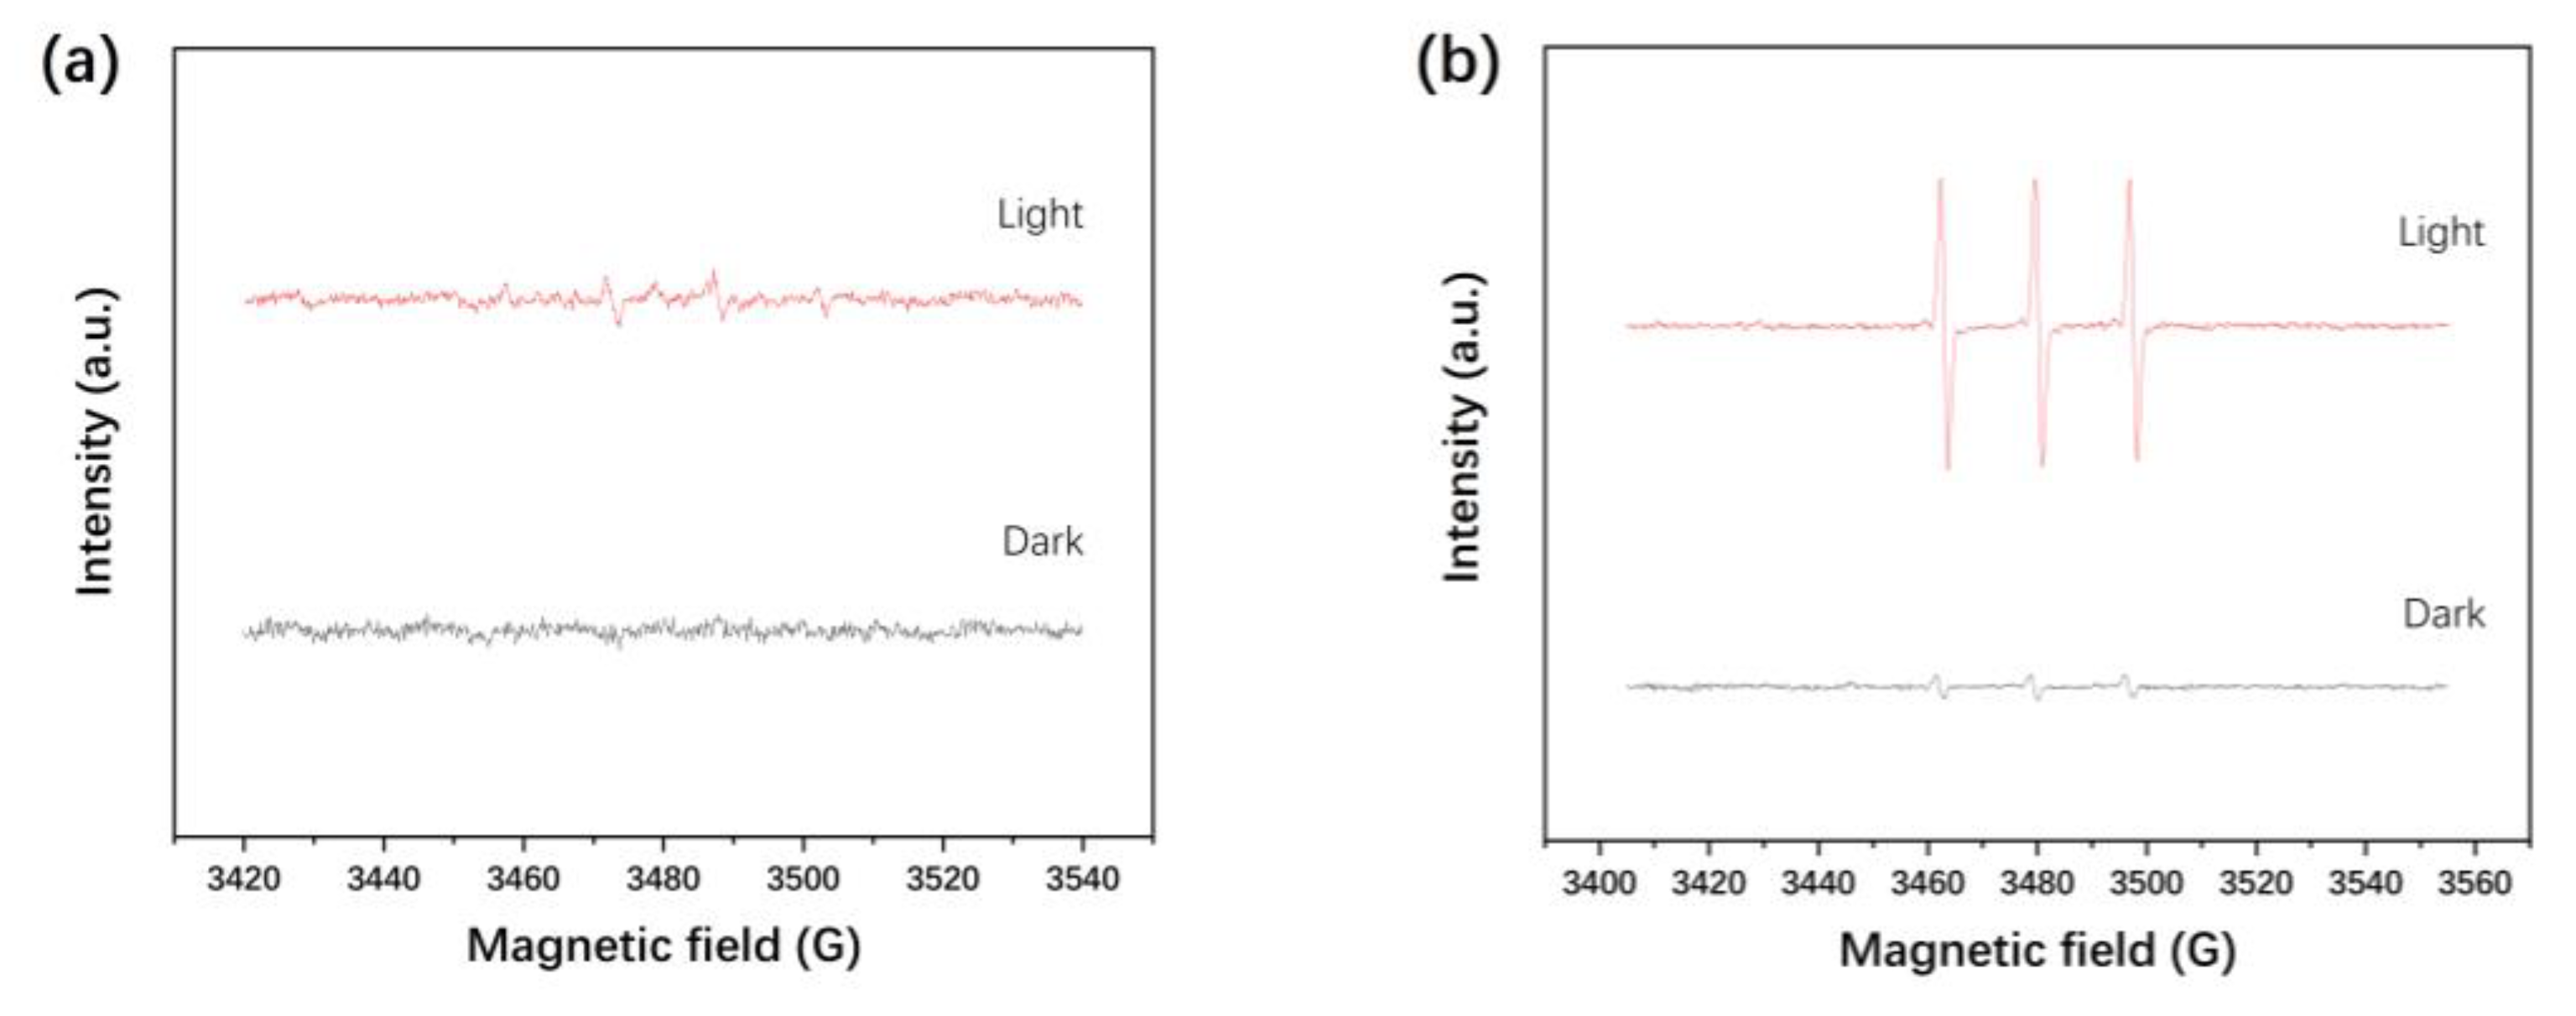
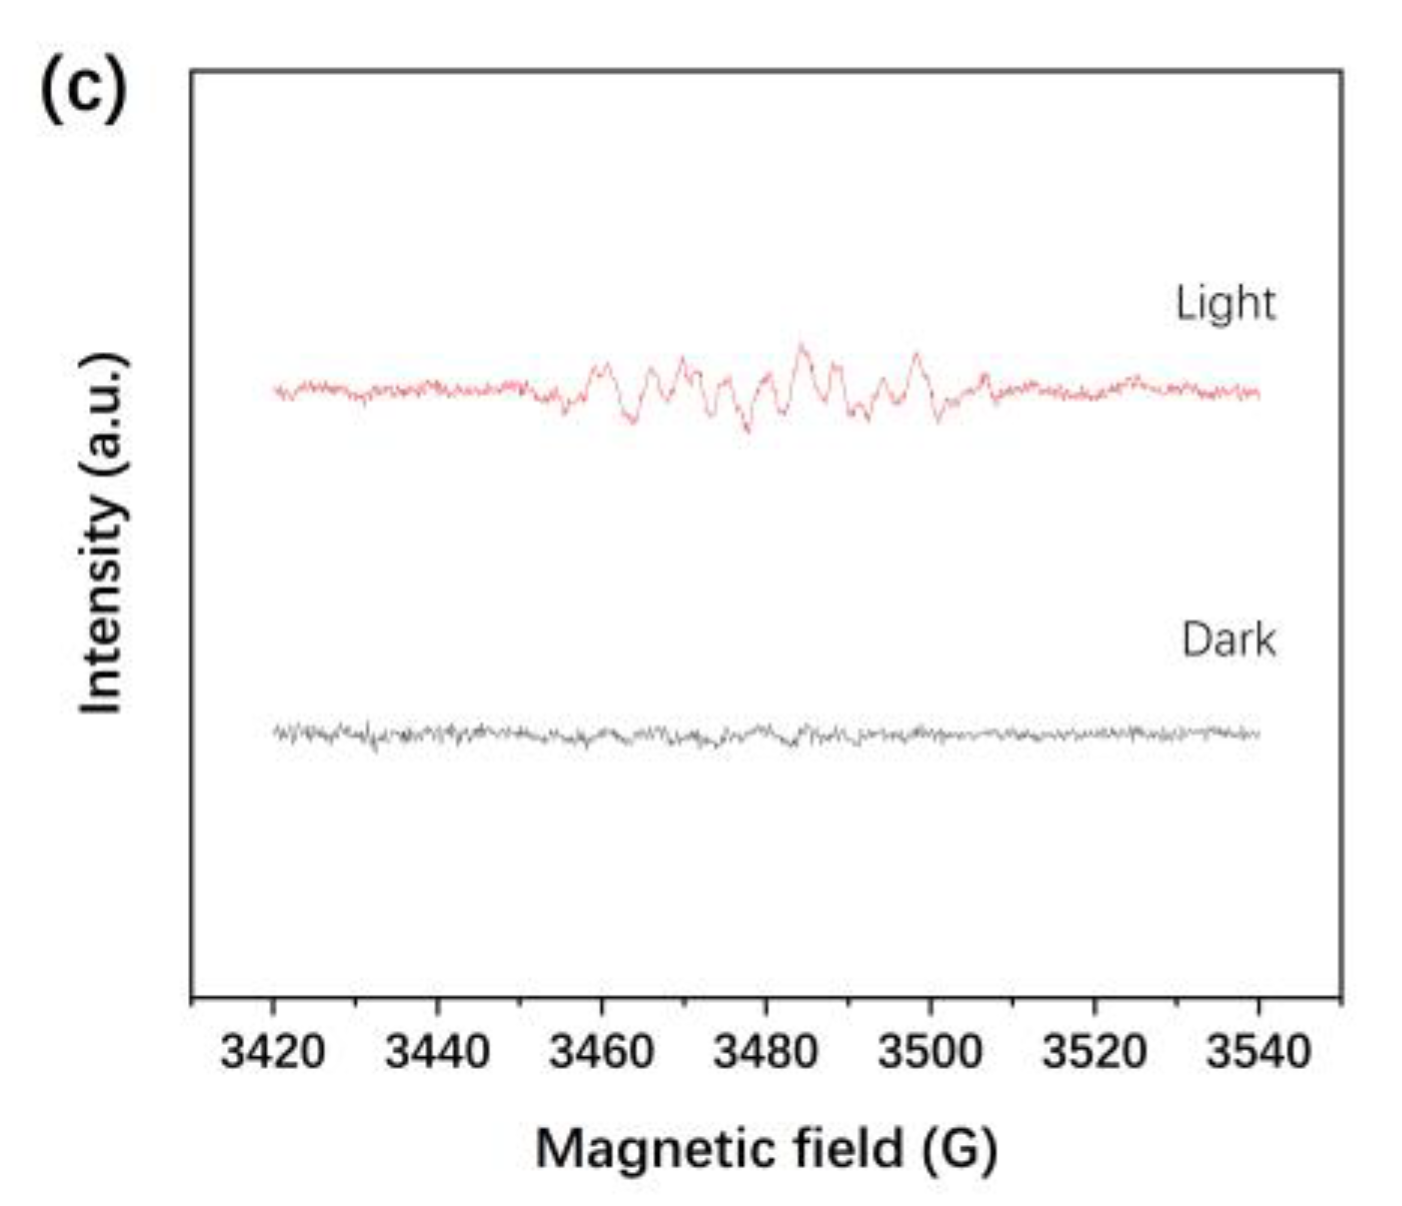
3.6. Electron Spin Resonance (ESR) Spectroscopy

ESR technology is used to detect reactive oxygen species (·OH, 1O2, and ·O2) during the photodegradation process. Figure 8a–c show the ESR signals of DMPO-·OH, TEMP-1O2, and DMPO-·O2 adduct with or without light irradiation, respectively. The signals of the reactive oxygen species are almost undetectable or not obvious in the dark. Under visible light irradiation, the six characteristic peaks of DMPO-·O2 and three characteristic peaks of TEMP-1O2 are very strong, but the four characteristic peaks of ·OH are not significant [36,50]. OH, 1O2, and ·O2 are detected in the visible photocatalytic degradation system, which confirmed that these free radicals are produced in the photocatalytic process over Ag/BiOBr0.85I0.15 nanoparticles. Moreover, 1O2 and ·O2 are the main oxidation species, whereas ·OH is not important under the reaction condition.
In photocatalysis, holes can oxidize H2O or OH to generate ·OH, whereas ·O2 is mainly generated by O2 capturing e. The generation of ·OH depends on whether the EVB is higher than the redox potential of ·OH/OH (1.99 eV), and the generation of ·O2 depends on whether the ECB of the semiconductor is lower than the redox potential of ·O2/O2 (−0.33 eV) [36]. As is stated above, the EVB and ECB of BiOBr0.85I0.15 are calculated to be 0.98 eV and −1.00 eV, respectively. Therefore, in the photocatalyst surface, ·O2 can be directly produced, but it is difficult to directly produce ·OH. However, ·OH can be generated by further reduction of ·O2, which is an indirect way to form ·OH. The 1O2 is likely to be formed by the oxidation of ·O2, which is generated by the reduction of surface-adsorbed O2 [51]. Moreover, semiconductor catalysts can produce photogenerated electron–hole pairs (excitons, e − h+) under UV or visible light radiation. The electrostatic Coulomb interaction of photogenerated exciton usually produces a strong exciton effect, and the accompanying energy transfer can excite O2 to produce 1O2 [52]. The relevant reactions are as follows.
e + O2 ⟶ ·O2
·O2 + e + 2H+ ⟶ H2O2
·O2 + H2O ⟶ ·OH + OH +O2
·O2 + h+1O2
Catalyst + hν ⟶ Catalyst*
Catalyst* + 3O2 ⟶ Catalyst + 1O2

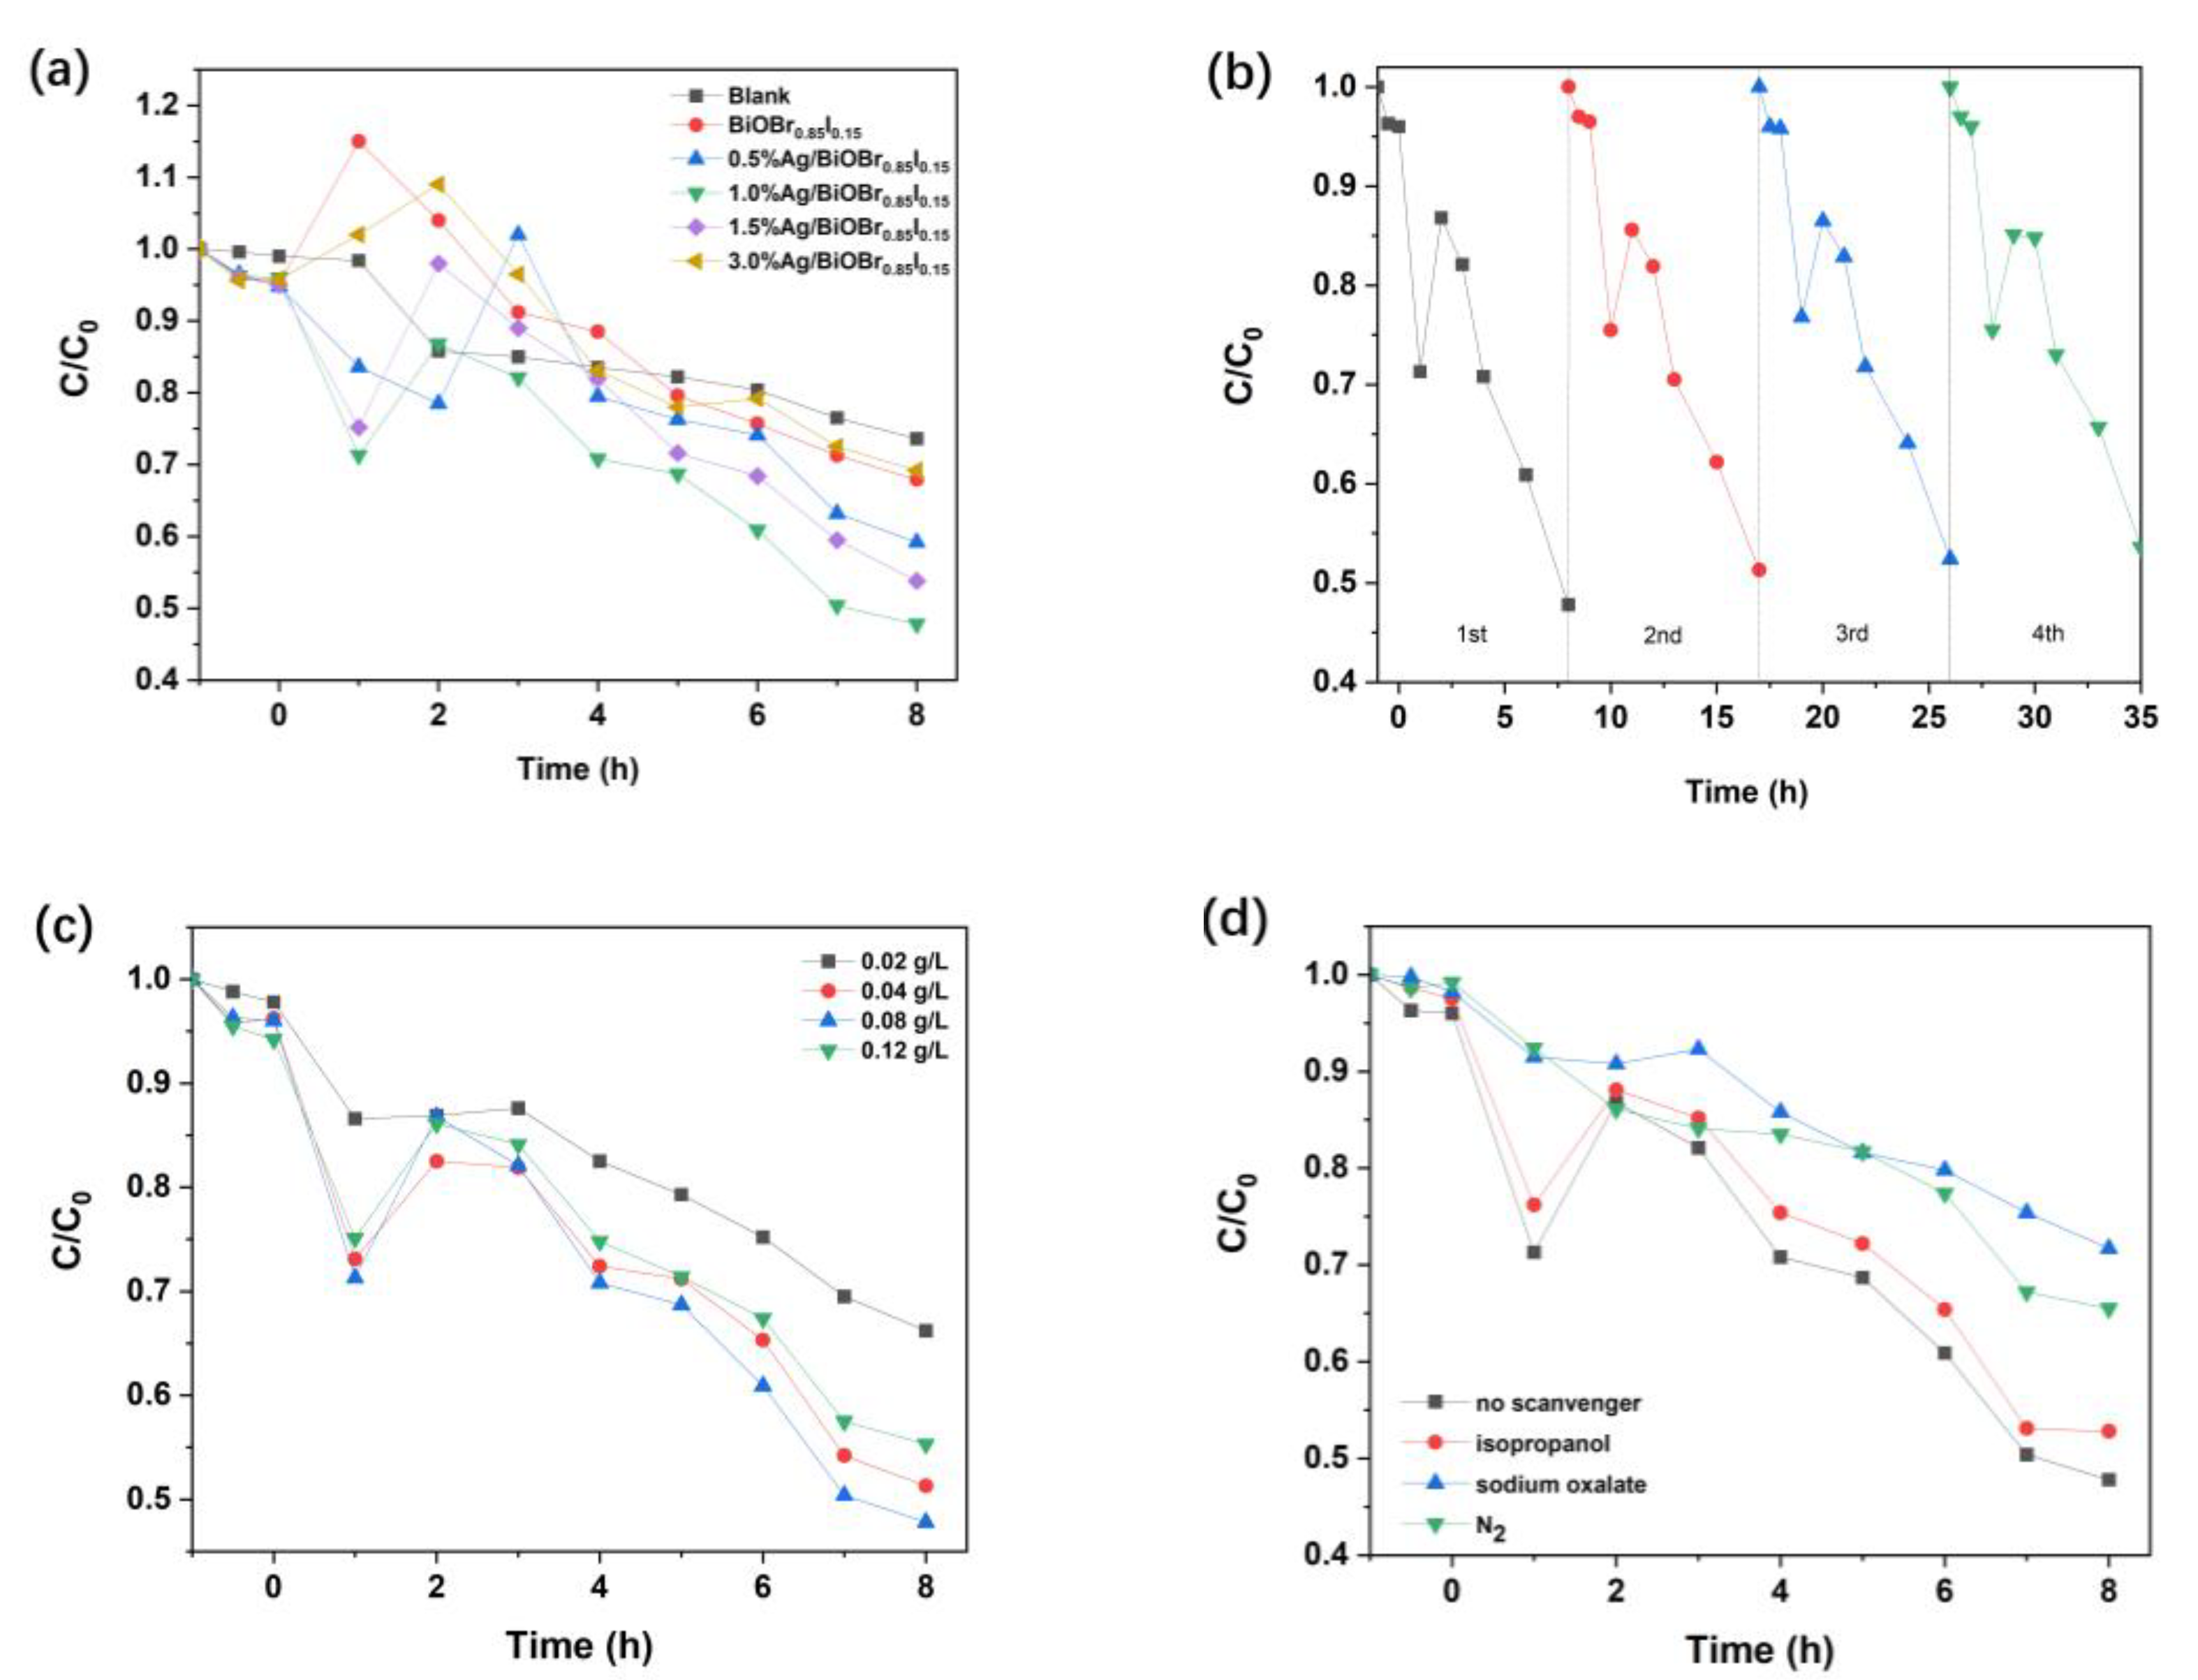
3.7. Photocatalytic Degradation of Ammonia Nitrogen

Figure 9 shows the ability of the as-prepared catalysts to degrade NH4+-N in the water sample from the recirculating aquaculture system. The photocatalytic capability comparison between BiOBr0.85I0.15 and Ag/BiOBr0.85I0.15 samples with different Ag loading is shown in Figure 9a. Under the blank condition, the NH4+-N value decreased slowly to 73.6% in 8 h under the light irradiation, which implied that the light radiation alone could degrade about 26% of NH4+-N in the water sample. In the presence of BiOBr0.85I0.15, about 32% NH4+-N was degraded within 8 h. Compared with the degradation result of the blank experiment, the addition of BiOBr0.85I0.15 did not obviously improve the degradation efficiency of NH4+-N. The degradation rates of NH4+-N in the presence of the photocatalysts, 0.5% Ag/ BiOBr0.85I0.15, 1.0% Ag/ BiOBr0.85I0.15, and 1.5% Ag/BiOBr0.85I0.15, were 40.8%, 52.2%, and 46.2%, respectively. However, the catalytic capacity of the photocatalyst did not continue to increase with the increase of silver loading. The degradation rate of NH4+-N with 3.0% Ag/ BiOBr0.85I0.15 was 30.8%, which is significantly lower than that of 1.0% Ag/BiOBr0.85I0.15. The 1.0% Ag/BiOBr0.85I0.15 showed the best photocatalytic ability.
Ag nanoparticles on the surface of semiconductors can become electron capture centers, which can improve the separation efficiency of carriers, effectively inhibit the recombination of photogenerated electrons–holes, thus accelerating the photocatalytic reaction rate and improving the photocatalytic activity of Ag/BiOBr0.85I0.15 nanoparticles. However, Ag nanoparticles may become the recombination center of carriers when the Ag loading is further increased. On the other hand, too many Ag nanoparticles covering the surface of the catalyst will also affect the effective absorption of light by the catalyst [53].
Figure 10 shows that the 1.0% Ag/BiOBr0.85I0.15 nanocomposite displays the highest photocurrent response. It proves that the loading of Ag nanoparticles could enhance the separation efficiency of photogenerated charges of the catalyst. The photocurrent of the 0.5% Ag/BiOBr0.85I0.15 sample is close to or slightly higher than that of BiOBr0.85I0.15. The photocurrent of 1.5% Ag/BiOBr0.85I0.15 is significantly lower than that of BiOBr0.85I0.15. The results are basically in line with the actual degradation performance of the catalysts. However, it is worth noting that the photocurrent of 3.0% Ag/BiOBr0.85I0.15 is higher than that of 1.5% Ag/BiOBr0.85I0.15, and also higher than that of BiOBr0.85I0.15 samples. This may be due to the significant increase of the photocurrent generated by the surface plasmon resonance of silver nanoparticles. The surface plasmon resonance photocurrent increases significantly with the increase of silver loading. However, since the oxidation of photogenerated holes on the surface of silver nanoparticles is not strong, although the actual photocurrent increases, it cannot effectively promote the degradation performance of the composite catalyst [54,55].
The results shown in Figure 9a indicate that the photocatalysts with different silver loading have different removal effects on NH4+-N. It is worth noting that the degradation curves of the experiments with catalysts show significant fluctuation within 8 h, especially a remarkable rise in the initial 1~3 h, whereas the whole degradation curve of the blank experiment shows a downward trend. The fluctuation of the degradation curve implies the complexity of the photodegradation process. The significant increase of the NH4+-N value in the degradation process may be related to the photocatalytic transformation of nitrogen-containing compounds. There are many complex nitrogen-containing organic compounds in the water of the recirculating aquaculture system, which mainly come from the feed, excreta, and secretions of fish. The existence of the photocatalyst makes the reaction system produce more active oxygen radicals and holes (h+), which leads to a series of subsequent reactions to convert organic nitrogen into NH4+-N. With the transformation of nitrogen-containing organic matter into NH4+-N under the photocatalytic condition, the NH4+-N value increased in the first a few hours, and then began to decline in a fluctuating way, and was, finally, significantly lower than the initial value [56]. Under the same photoreaction condition, different photocatalysts have different conversion rates of nitrogen-containing organic compounds and degradation rates of NH4+-N, so the fluctuation of their degradation curves is not completely synchronous.
Figure 9b shows the recycling stability of 1.0% Ag/BiOBr0.85I0.15 used for removing NH4+-N. It indicates that the 1.0% Ag/BiOBr0.85I0.15 sample kept stable photocatalytic activity after four-times cycling usage under the simulated sunlight radiation.
The effect of catalyst dosage on the NH4+-N degradation rate is shown in Figure 9c. The removing rates of NH4+-N are 33.8%, 48.7%, 52.2%, and 44.7%, respectively, when the photocatalyst dosage increased from 0.02 g/L to 0.12 g/L. With the increase of catalyst dosage, the final degradation rate of NH4+-N in 8 h increased first, and then decreased. This may be because when the separation efficiency of the photogenerated electron–hole pairs is certain, the greater the amount of the photocatalyst, and the greater the number of surface active sites involved in the catalytic reaction, so as to improve the degradation rate of NH4+-N. However, when the dosage increased to a certain amount, the removing rate of NH4+-N decreased. This may be due to the serious agglomeration of photocatalytic materials due to excessive dosage, resulting in the reduction of the surface area effectively used for the catalytic reaction. Moreover, it will also make the solution turbid, and the suspended particles in the solution will scatter the light to prevent the catalyst from making full use of light and to reduce the photocatalytic efficiency.
In order to investigate the main active species in the photocatalytic degradation of NH4+-N in recirculating aquaculture water under simulated sunlight, active species scavengers, sodium oxalate, isopropanol, and nitrogen (N2), were added to consume or reduce the active species hole (h+), ·OH, ·O2, and 1O2, respectively [36,57]. The concentration of ammonium oxalate and isopropanol is about 5 mM. In the beginning of degradation, the water sample was flushed with nitrogen to remove most of the oxygen. The effect of scavengers on NH4+-N degradation is presented in Figure 9d. The degradation rate of NH4+-N decreased from 52.2% to 41.2%, 34.5%, and 28.3% after aerating N2 or adding isopropanol and sodium oxalate, respectively, which indicated the degradation efficiency was obviously inhibited. The results suggest that in this degradation system, the important oxidation species are h+, ·O2, and 1O2. ·OH radicals make a minor contribution to NH4+-N degradation. This is consistent with the ESR characterization results.

4. Conclusions

In this work, a series of Ag/BiOBr0.85I0.15 photocatalysts with different Ag loading (0.5, 1.0, 1.5, and 3.0% mol%) were successfully synthesized through a solvothermal and photoreduction method. The as-prepared photocatalysts were applied to the photocatalytic degradation of NH4+-N in circulating aquaculture water. The influence of Ag loading on the photocatalytic activity of Ag/BiOBr0.85I0.15 photocatalysts was investigated. The ESR detection and free radical scavenging experiment results suggest that h+, 1O2, and ·O2 are the main oxidation species in the photocatalytic reaction system. The degradation results showed that the appropriate amount of silver loading (0.5, 1.0, and 1.5 mol%) could improve the catalytic activity of the catalyst, but a further increase of silver loading will inhibit the photocatalytic degradation ability of the catalyst. Among the synthesized photocatalysts, the 1.0% Ag/BiOBr0.85I0.15 sample showed the highest photoactivity for the NH4+-N degradation; this may be due to the inhibition of the recombination of photogenerated electrons–holes. The 1.0% Ag/BiOBr0.85I0.15 sample also displayed stable photocatalytic activity after four-times cycling usage under the simulated sunlight radiation. Therefore, 1.0% Ag/BiOBr0.85I0.15 nanocomposites are good candidates for applications as sunlight photocatalysts.

Author Contributions

Data curation, X.H.; Formal analysis, X.H.; Funding acquisition, J.Z.; Methodology, X.H., M.Z. and W.Z.; Resources, M.Z., W.Z. and J.Z.; Writing—original draft, X.H.; Writing—review & editing, X.H. All authors have read and agreed to the published version of the manuscript.

Funding

The present research is supported by the Key Research & Development Program of Department of Science and Technology of Zhejiang province. (Grant No. 2019C02082).

Data Availability Statement

The data presented in this study are available on request from the corresponding author or the first author.

Conflicts of Interest

The authors declare no conflict of interest.

References

  1. Serna-Galvis, E.A.; Maria Botero-Coy, A.; Martinez-Pachon, D.; Moncayo-Lasso, A.; Ibanez, M.; Hernandez, F.; Torres-Palma, R.A. Degradation of seventeen contaminants of emerging concern in municipal wastewater effluents by sonochemical advanced oxidation processes. Water Res. 2019, 154, 349–360. [Google Scholar] [CrossRef] [PubMed]
  2. Maria-Hormigos, R.; Pacheco, M.; Jurado-Sanchez, B.; Escarpa, A. Carbon nanotubes- ferrite- manganese dioxide micromotors for advanced oxidation processes in water treatment. Environ. Sci. Nano 2018, 5, 2993–3003. [Google Scholar] [CrossRef]
  3. Oller, I.; Malato, S.; Sanchez-Perez, J.A. Combination of Advanced Oxidation Processes and biological treatments for wastewater decontamination-A review. Sci. Total Environ. 2011, 409, 4141–4166. [Google Scholar] [PubMed]
  4. dos Santos, A.J.; Tossi de Araujo Costa, E.C.; da Silva, D.R.; Garcia-Segura, S.; Martinez-Huitle, C.A. Electrochemical advanced oxidation processes as decentralized water treatment technologies to remediate domestic washing machine effluents. Environ. Sci. Pollut. Res. 2018, 25, 7002–7011. [Google Scholar] [CrossRef] [PubMed]
  5. Ge, J.; Zhang, Y.; Heo, Y.-J.; Park, S.-J. Advanced Design and Synthesis of Composite Photocatalysts for the Remediation of Wastewater: A Review. Catalysts 2019, 9, 122. [Google Scholar] [CrossRef]
  6. Gogate, P.R.; Pandit, A.B. A review of imperative technologies for wastewater treatment I: Oxidation technologies at ambient conditions. Adv. Environ. Res. 2004, 8, 501–551. [Google Scholar]
  7. Oturan, M.A.; Aaron, J.-J. Advanced Oxidation Processes in Water/Wastewater Treatment: Principles and Applications. A Review. Crit. Rev. Environ. Sci. Technol. 2014, 44, 2577–2641. [Google Scholar] [CrossRef]
  8. Ahmed, S.N.; Haider, W. Heterogeneous photocatalysis and its potential applications in water and wastewater treatment: A review. Nanotechnology 2018, 29, 342001. [Google Scholar] [CrossRef]
  9. Noman, M.T.; Ashraf, M.A.; Ali, A. Synthesis and applications of nano-TiO2: A review. Environ. Sci. Pollut. Res. 2019, 26, 3262–3291. [Google Scholar]
  10. Shayegan, Z.; Lee, C.-S.; Haghighat, F. TiO2 photocatalyst for removal of volatile organic compounds in gas phase—A review. Chem. Eng. J. 2018, 334, 2408–2439. [Google Scholar]
  11. Guo, C.; Ge, M.; Liu, L.; Gao, G.; Feng, Y.; Wang, Y. Directed Synthesis of Mesoporous TiO2 Microspheres: Catalysts and Their Photocatalysis for Bisphenol A Degradation. Environ. Sci. Technol. 2010, 44, 419–425. [Google Scholar] [CrossRef]
  12. Theerthagiri, J.; Salla, S.; Senthil, R.A.; Nithyadharseni, P.; Madankumar, A.; Arunachalam, P.; Maiyalagan, T.; Kim, H.-S. A review on ZnO nanostructured materials: Energy, environmental and biological applications. Nanotechnology 2019, 30, 392001. [Google Scholar] [CrossRef] [PubMed]
  13. Yu, J.; Yu, X. Hydrothermal synthesis and photocatalytic activity of zinc oxide hollow spheres. Environ. Sci. Technol. 2008, 42, 4902–4907. [Google Scholar] [CrossRef] [PubMed]
  14. Cheng, L.; Xiang, Q.; Liao, Y.; Zhang, H. CdS-Based photocatalysts. Energy Environ. Sci. 2018, 11, 1362–1391. [Google Scholar] [CrossRef]
  15. Jing, D.; Guo, L. A novel method for the preparation of a highly stable and active CdS photocatalyst with a special surface nanostructure. J. Phys. Chem. B 2006, 110, 11139–11145. [Google Scholar] [CrossRef] [PubMed]
  16. Bantawal, H.; Shenoy, U.S.; Bhat, D.K. Tuning the Photocatalytic Activity of SrTiO3 by Varying the Sr/Ti Ratio: Unusual Effect of Viscosity of the Synthesis Medium. J. Phys. Chem. C 2018, 122, 20027–20033. [Google Scholar] [CrossRef]
  17. Wang, Y.; Wang, Q.; Zhan, X.; Wang, F.; Safdar, M.; He, J. Visible light driven type II heterostructures and their enhanced photocatalysis properties: A review. Nanoscale 2013, 5, 8326–8339. [Google Scholar] [CrossRef]
  18. Luo, W.; Chen, X.; Wei, Z.; Liu, D.; Yao, W.; Zhu, Y. Three-dimensional network structure assembled by g-C3N4 nanorods for improving visible-light photocatalytic performance. Appl. Catal. B Environ. 2019, 255, 117761. [Google Scholar] [CrossRef]
  19. Kumar, S.; Karthikeyan, S.; Lee, A.F. g-C3N4-Based Nanomaterials for Visible Light-Driven Photocatalysis. Catalysts 2018, 8, 74. [Google Scholar] [CrossRef]
  20. Kumar, S.G.; Rao, K.S.R.K. Tungsten-based nanomaterials (WO3 & Bi2WO6): Modifications related to charge carrier transfer mechanisms and photocatalytic applications. Appl. Surf. Sci. 2015, 355, 939–958. [Google Scholar]
  21. Huang, G.-F.; Ma, Z.-L.; Huang, W.-Q.; Tian, Y.; Jiao, C.; Yang, Z.-M.; Wan, Z.; Pan, A. Ag3PO4 Semiconductor Photocatalyst: Possibilities and Challenges. J. Nanomater. 2013, 2013, 371356. [Google Scholar] [CrossRef]
  22. Bi, Y.; Ouyang, S.; Umezawa, N.; Cao, J.; Ye, J. Facet Effect of Single-Crystalline Ag3PO4 Sub-microcrystals on Photocatalytic Properties. J. Am. Chem. Soc. 2011, 133, 6490–6492. [Google Scholar] [CrossRef] [PubMed]
  23. Gao, L.; Li, Z.; Liu, J. Facile synthesis of Ag3VO4/beta-AgVO3 nanowires with efficient visible-light photocatalytic activity. Rsc. Adv. 2017, 7, 27515–27521. [Google Scholar] [CrossRef]
  24. Wu, S.-Z.; Li, K.; Zhang, W.-D. On the heterostructured photocatalysts Ag3VO4/g-C3N4 with enhanced visible light photocatalytic activity. Appl. Surf. Sci. 2015, 324, 324–331. [Google Scholar] [CrossRef]
  25. Duy Trinh, N.; Hong, S.-S. Synthesis of Needle-Like BiVO4 with Improved Photocatalytic Activity Under Visible Light Irradiation. J. Nanosci. Nanotechnol. 2019, 19, 7696–7701. [Google Scholar]
  26. El-Hakam, S.A.; Alshorifi, F.T.; Salama, R.S.; Gamal, S.; El-Yazeed, W.S.A.; Ibrahim, A.A.; Ahmed, A.I. Application of nanostructured mesoporous silica/bismuth vanadate composite catalysts for the degradation of methylene blue and brilliant green. J. Mater. Res. Technol. 2022, 18, 1963–1976. [Google Scholar] [CrossRef]
  27. Zhang, W.; Gao, S.; Chen, D. Preparation of Ce3+ doped Bi2O3 hollow needle-shape with enhanced visible-light photocatalytic activity. J. Rare Earths 2019, 37, 726–731. [Google Scholar] [CrossRef]
  28. Liu, H.; Chen, Y.; Tian, G.; Ren, Z.; Tian, C.; Fu, H. Visible-Light-Induced Self-Cleaning Property of Bi2Ti2O7-TiO2 Composite Nanowire Arrays. Langmuir 2015, 31, 5962–5969. [Google Scholar] [CrossRef]
  29. Gao, H.; Liu, F.; Li, X.; Li, F.; Sui, X. Hydrangeas-Like Bi2WO6: Facile Synthesis, Visible-Light Driven Photocatalysis and Theoretical Analysis. J. Nanosci. Nanotechnol. 2012, 12, 6321–6326. [Google Scholar] [CrossRef]
  30. Yu, Z.; Bahnemann, D.; Dillert, R.; Lin, S.; Lu, L. Photocatalytic degradation of azo dyes by BiOX (X = Cl, Br). J. Mol. Catal. A Chem. 2012, 365, 1–7. [Google Scholar]
  31. Dong, F.; Sun, Y.; Fu, M.; Wu, Z.; Lee, S.C. Room temperature synthesis and highly enhanced visible light photocatalytic activity of porous BiOI/BiOCl composites nanoplates microflowers. J. Hazard. Mater. 2012, 219, 26–34. [Google Scholar] [CrossRef] [PubMed]
  32. Boruah, B.; Gupta, R.; Modak, J.M.; Madras, G. Novel insights into the properties of AgBiO3 photocatalyst and its application in immobilized state for 4-nitrophenol degradation and bacteria inactivation. J. Photochem. Photobiol. A Chem. 2019, 373, 105–115. [Google Scholar] [CrossRef]
  33. Kudo, A.; Omori, K.; Kato, H. A novel aqueous process for preparation of crystal form-controlled and highly crystalline BiVO4 powder from layered vanadates at room temperature and its photocatalytic and photophysical properties. J. Am. Chem. Soc. 1999, 121, 11459–11467. [Google Scholar] [CrossRef]
  34. Xu, X.; Lu, R.; Zhao, X.; Xu, S.; Lei, X.; Zhang, F.; Evans, D.G. Fabrication and photocatalytic performance of a ZnxCd1-xS solid solution prepared by sulfuration of a single layered double hydroxide precursor. Appl. Catal. B Environ. 2011, 102, 147–156. [Google Scholar] [CrossRef]
  35. Zhang, X.; Wang, L.-W.; Wang, C.-Y.; Wang, W.-K.; Chen, Y.-L.; Huang, Y.-X.; Li, W.-W.; Feng, Y.-J.; Yu, H.-Q. Synthesis of BiOClxBr1-x Nanoplate Solid Solutions as a Robust Photocatalyst with Tunable Band Structure. Chem. A Eur. J. 2015, 21, 11872–11877. [Google Scholar] [CrossRef]
  36. Wang, Q.; Liu, Z.; Liu, D.; Liu, G.; Yang, M.; Cui, F.; Wang, W. Ultrathin two-dimensional BiOBrxI1−x solid solution with rich oxygen vacancies for enhanced visible-light-driven photoactivity in environmental remediation. Appl. Catal. B Environ. 2018, 236, 222–232. [Google Scholar] [CrossRef]
  37. Bera, S.; Won, D.-I.; Rawal, S.B.; Kang, H.J.; Lee, W.I. Design of visible-light photocatalysts by coupling of inorganic semiconductors. Catal. Today 2019, 335, 3–19. [Google Scholar] [CrossRef]
  38. Wang, H.; Zhang, L.; Chen, Z.; Hu, J.; Li, S.; Wang, Z.; Liu, J.; Wang, X. Semiconductor heterojunction photocatalysts: Design, construction, and photocatalytic performances. Chem. Soc. Rev. 2014, 43, 5234–5244. [Google Scholar] [CrossRef]
  39. Wang, D.-J.; Zhang, J.; Guo, L.; Shen, H.-D.; Fu, F.; Xue, G.-L.; Fang, Y.-F. Modification Strategies for Semiconductor Photocatalyst Based on Energy Band Structure Theory. J. Inorg. Mater. 2015, 30, 683–693. [Google Scholar]
  40. Zhang, W.; Jia, B.; Wang, Q.; Dionysiou, D. Visible-light sensitization of TiO2 photocatalysts via wet chemical N-doping for the degradation of dissolved organic compounds in wastewater treatment: A review. J. Nanoparticle Res. 2015, 17, 1–12. [Google Scholar] [CrossRef]
  41. Liu, H.; Feng, J.; Jie, W. A review of noble metal (Pd, Ag, Pt, Au)-zinc oxide nanocomposites: Synthesis, structures and applications. J. Mater. Sci. -Mater. Electron. 2017, 28, 16585–16597. [Google Scholar] [CrossRef]
  42. Alshorifi, F.T.; Alswat, A.A.; Salama, R.S. Gold-selenide quantum dots supported onto cesium ferrite nanocomposites for the efficient degradation of rhodamine B. Heliyon 2022, 8, e09652. [Google Scholar] [CrossRef] [PubMed]
  43. Yao, F.F.; Fu, W.Z.; Ge, X.H.; Wang, L.S.; Wang, J.H.; Zhong, W.Z. Preparation and characterization of a copper phosphotungstate/titanium dioxide (Cu-H3PW12O40/TiO2) composite and the photocatalytic oxidation of high-concentration ammonia nitrogen. Sci. Total Environ. 2020, 727, 138425. [Google Scholar] [CrossRef] [PubMed]
  44. Hou, R.; Gao, Y.; Zhu, H.; Yang, G.; Liu, W.; Huo, Y.; Xie, Z.; Li, H. Coupling system of Ag/BiOBr photocatalysis and direct contact membrane distillation for complete purification of N-containing dye wastewater. Chem. Eng. J. 2017, 317, 386–393. [Google Scholar] [CrossRef]
  45. Zhang, X.; Wang, C.Y.; Wang, L.W.; Huang, G.X.; Wang, W.K.; Yu, H.Q. Fabrication of BiOBrxI1−x photocatalysts with tunable visible light catalytic activity by modulating band structures. Sci. Rep. 2016, 6, 22800. [Google Scholar] [CrossRef]
  46. Park, M.-S.; Kang, M. The preparation of the anatase and rutile forms of Ag–TiO2 and hydrogen production from methanol/water decomposition. Mater. Lett. 2008, 62, 183–187. [Google Scholar] [CrossRef]
  47. Di, J.; Xia, J.; Ji, M.; Yin, S.; Li, H.; Xu, H.; Zhang, Q.; Li, H. Controllable synthesis of Bi4O5Br2 ultrathin nanosheets for photocatalytic removal of ciprofloxacin and mechanism insight. J. Mater. Chem. A 2015, 3, 15108–15118. [Google Scholar] [CrossRef]
  48. Ji, L.; Wang, H.; Yu, R. Preparation, Characterization and Visible-light Photocatalytic Activities of p-n Heterojunction BiOBr/NaBiO3 Composites. Chem. J. Chin. Univ. Chin. 2014, 35, 2170–2176. [Google Scholar]
  49. Wang, Q.; Wang, W.; Zhong, L.; Liu, D.; Cao, X.; Cui, F. Oxygen vacancy-rich 2D/2D BiOCl-g-C3N4 ultrathin heterostructure nanosheets for enhanced visible-light-driven photocatalytic activity in environmental remediation. Appl. Catal. B: Environ. 2018, 220, 290–302. [Google Scholar] [CrossRef]
  50. Fan, J.; Qin, H.; Jiang, S. Mn-doped g-C3N4 composite to activate peroxymonosulfate for acetaminophen degradation: The role of superoxide anion and singlet oxygen. Chem. Eng. J. 2019, 359, 723–732. [Google Scholar] [CrossRef]
  51. Hong, Y.; Jiang, Y.; Li, C.; Fan, W.; Yan, X.; Yan, M.; Shi, W. In-situ synthesis of direct solid-state Z-scheme V2O5/g-C3N4 heterojunctions with enhanced visible light efficiency in photocatalytic degradation of pollutants. Appl. Catal. B Environ. 2016, 180, 663–673. [Google Scholar] [CrossRef]
  52. Wang, H.; Jiang, S.; Chen, S.; Li, D.; Zhang, X.; Shao, W.; Sun, X.; Xie, J.; Zhao, Z.; Zhang, Q.; et al. Enhanced Singlet Oxygen Generation in Oxidized Graphitic Carbon Nitride for Organic Synthesis. Adv. Mater. 2016, 28, 6940–6945. [Google Scholar] [CrossRef] [PubMed]
  53. Espino-Estévez, M.R.; Fernández-Rodríguez, C.; González-Díaz, O.M.; Araña, J.; Espinós, J.P.; Ortega-Méndez, J.A.; Doña-Rodríguez, J.M. Effect of TiO2–Pd and TiO2–Ag on the photocatalytic oxidation of diclofenac, isoproturon and phenol. Chem. Eng. J. 2016, 298, 82–95. [Google Scholar] [CrossRef]
  54. Wang, S.Y.; Gao, Y.Y.; Miao, S.; Liu, T.F.; Mu, L.C.; Li, R.G.; Fan, F.T.; Li, C. Positioning the Water Oxidation Reaction Sites in Plasmonic Photocatalysts. J. Am. Chem. Soc. 2017, 139, 11771–11778. [Google Scholar] [CrossRef]
  55. Choudhary, M.K.; Kataria, J.; Bhardwaj, V.K.; Sharma, S. Green biomimetic preparation of efficient Ag-ZnO heterojunctions with excellent photocatalytic performance under solar light irradiation: A novel biogenic-deposition-precipitation approach. Nanoscale Adv. 2019, 1, 1035–1044. [Google Scholar] [CrossRef] [Green Version]
  56. Shi, Z.; Shen, Z.; Wu, Y.; Wang, J.; Yang, L. Photocatalytic degradation of organics and germicidal treatment of shrimp breeding wastewater. Acta Sci. Nat. Univ. Sunyatseni 2009, 48, 60–64. [Google Scholar]
  57. Lu, K.; Zhang, X.; Wang, Y.; Wang, Y.; Fan, C. Fabrication, Characterization and Photocatalytic Performance of Au/BiOBr Nanosheets. J. Synth. Cryst. 2015, 44, 2095–2100. [Google Scholar]
Figure 1. XRD patterns of BiOI, BiOBr, BiOBr0.85I0.15, and Ag/BiOBr0.85I0.15 with different Ag loading.
Materials 15 06022 g001
Figure 2. SEM images of BiOBr0.85I0.15, (ac); 1.0% Ag/BiOBr0.85I0.15, (df).
Materials 15 06022 g002
Figure 3. TEM images of BiOBr0.85I0.15, (a,b); 1.0% Ag/BiOBr0.85I0.15, (c,d).
Materials 15 06022 g003aMaterials 15 06022 g003b
Figure 4. EDS mapping of 1.0% Ag/BiOBr0.85I0.15: SEM image (a), EDS spectrum (b), map of Bi, O, Br, I and Ag (c), map of Bi (d), map of O (e), map of Br (f), map of I (g), map of Ag (h).
Materials 15 06022 g004
Figure 5. XPS spectra of BiOBr0.85I0.15 (sample ①) and 1.0% Ag/BiOBr0.85I0.15 (sample ②): survey spectra (a), Ag 3d (b), Bi 4f (c), Br 3d (d), O 1s (e), and I 3d (f).
Materials 15 06022 g005aMaterials 15 06022 g005b
Figure 6. N2 adsorption–desorption isotherms.
Materials 15 06022 g006
Figure 7. UV-vis diffuse reflectance spectra (a); the bandgap value, estimated by a related curve of (αhν)0.5 versus photon energy (b); and the VB-XPS spectra of BiOBr, BiOI, and BiOBr0.85I0.15 (c).
Materials 15 06022 g007
Figure 8. The ESR spetra of DMPO-·OH (a), the ESR spetra of TEMP-1O2 (b), and the ESR spetra of DMPO-·O2 (c) (the sample is 1.0% Ag/BiOBr0.85I0.15 irradiated under the xenon lamp light for 80 s).
Materials 15 06022 g008aMaterials 15 06022 g008b
Figure 9. Photocatalytic activities of different catalysts (a), cycling runs of 1.0% Ag/BiOBr0.85I0.15 sample for the removal of NH4+-N (b), effect of catalyst dosage on NH4+-N degradation rate (c), and the NH4+-N degradation efficiencies of 1.0% Ag/BiOBr0.85I0.15 under different scavengers (d).
Materials 15 06022 g009
Figure 10. Transient photocurrent response for BiOBr0.85I0.15 and Ag/BiOBr0.85I0.15 photocatalysts.
Materials 15 06022 g010
Publisher’s Note: MDPI stays neutral with regard to jurisdictional claims in published maps and institutional affiliations.

