
Seismic Damage Evaluation of Beam-Column Joints in Monolithic Precast Concrete Frame Structures

Abstract
:1. Introduction
2. Experiment Design
2.1. Materials
2.2. Specimen Design and Fabrication
 12, and the reinforcement ratio was 1.63%; the longitudinal reinforcements of the beams are all 6
 12, and the reinforcement ratio is 2.14%; the stirrup is 8 mm in diameter, and 100 mm in spacing, but in beam end encryption area is 50 mm in spacing. The size and reinforcement of the precast joint specimens are shown in Figure 1. The size and reinforcement of cast-in-place joint specimens are the same as the precast ones.
2.3. Test Device and Test Method
3. Test Results
3.1. Damage Process of Specimen
- (1)
- Non-damage stage: At the initial stage of loading (the displacement is less than Δy), small cracks appear in the concrete at the beam end of specimen ZJ0 and specimen ZJ2 and tend to be stable. The strain of steel bars in the core area of the beam, column, and the joint is small and in the elastic stage. At this time, the deformation of the beam and column is very small, and the strength and stiffness of the specimens have no obvious change.
- (2)
- Initial damage stage: When the cyclic loading displacement is continued to Δy, the fine bending cracks of concrete at the beam end of ZJ0 gradually develop into long oblique cracks. The growth rate of stress and strain of the steel bar in the core area of specimen ZJ2 is accelerated, and the concrete strain in the plastic hinge area of the beams increases sharply, resulting in microcracks, and several equal spacing vertical cracks appear one after another. The cracks of both joints begin at the beam end, which is consistent with the damage characteristics of a strong column and weak beam joints.
- (3)
- Mixed damage development stage: multiple diagonal cracks appeared in the core area of specimen ZJ0 under 2Δy cyclic loading. Similarly, the stress and strain of the steel bar in the core area of specimen ZJ2 continued to increase, and the cracks in the plastic hinge area of the beams extended to the joint core area and developed from vertical cracks to oblique cracks. When the loading is continued to 3Δy, the diagonal cracks of specimen ZJ0 develop to be the main cracks through the core area, and new diagonal cracks appear at the beam end. As to specimen ZJ2, new cracks began to appear at the far end of the left and right beams, old cracks continued to extend, and the width gradually increased. At the same time, the inclined cross cracks appear in the core area of the joint, and then the inclined cracks divide the concrete in the core area into several diamond blocks and extend to the lower column.
- (4)
- Stable damage development stage: When the cyclic loading is continued to 4Δy, the main crack of specimen ZJ0 widens, and the cracks in the core area and beam end increase. As to specimen ZJ2, the longitudinal reinforcement in the core area is close to yielding, the cross diagonal crack in the core area extends to the end of the lower column, and the concrete peels in a large area. Subsequently, there is a separation between the beam end, the column end, and the core area of the joint.
- (5)
- Damage failure stage: When loading continues to the 5Δy and 6Δy cycles, the concrete at the core area and beam end of specimen ZJ0 fall off in a large area, and the bearing capacity decreases suddenly, and finally, the concrete is crushed and destroyed. As to specimen ZJ2, the longitudinal reinforcement in the core area entered the strengthening stage, and the stirrup gradually yielded. The cracks at the connection seams between the left and right beams and the upper column continue to extend, but the crack width is small, the crack width at the seams with the lower column gradually increases, and the concrete continues to peel off, and the damage continues to grow. Finally, a through-and-wide crack is formed (Figure 4c,d). At this time, the beam-column joint loses its bearing capacity.
3.2. Load-Deformation Curve
- (1)
- Before the specimen yields, the initial horizontal load is small, the hysteresis loop is a spike-type, the enclosure area is small, and the skeleton curve changes linearly. At this time, the specimen damage is small. With the increase in the hysteretic curve bending, the hysteretic loop area also increases. The specimen enters the elastoplastic stage, and the concrete cracks appear in the closure and the opening phenomenon and gradually appear obvious damage. The skeleton curves show that specimen ZJ1 (axial compression ratio is 0.2), specimen ZJ2 (axial compression ratio is 0.3), and specimen ZJ3 (axial compression ratio of 0.4) yield 25.71 kN, 42.33 kN, and 46.64 kN, and the corresponding yielding displacements are 10.2 mm, 10.53 mm and 10.84 mm separately. The yielding load increases with the axial compression ratio, and the yielding displacement is similar.
- (2)
- After the specimen yields, as the cyclic load increases continuously, both the slopes of the hysteresis curve and skeleton curve decrease. Due to the slip of the steel bar, the stiffness of the specimen degenerates, and the hysteresis curve appears to be a pinching phenomenon, and there is an obvious yield point on the skeleton curve. As concrete cracks continue to expand, the specimen damage begins to increase. The larger the axial compression ratio is, the larger the initial secant modulus and the more saturated the hysteresis loop. The skeleton curves show that the peak loads of specimen ZJ1 (axial compression ratio is 0.2), specimen ZJ2 (axial compression ratio is 0.3), and specimen ZJ3 (axial compression ratio is 0.4) reach 50.04 kN, 65.11 kN, and 71.50 kN, respectively, and the corresponding peak displacements are 54.21 mm, 43.83 mm and 36.10 mm. Compared with specimen ZJ1, the ultimate bearing capacity of specimen ZJ2 and specimen ZJ3 are increased by 30.1% and 42.9%. This is because the pressure applied to the core area of the joint can improve the strength of the concrete in the core area and can also provide a good constraint on the longitudinal reinforcement, thereby improving the bearing capacity of the joint [40]. Thus, the greater the axial compression ratio, the greater the above effect.
- (3)
- After the specimen reaches the peak load, the hysteretic loop area increases continuously with the increase in the loading displacement, showing a good capacity for dissipating energy. Under the same cyclic load, the hysteresis loop of the previous loading is larger than that of the latter, and the maximum load in the latter loading is also reduced, indicating that the specimen has strength degradation and energy dissipation capacity reduction. The sliding section of the skeletal curve is steeper due to the reduced deformation capacity. The damage to the specimen continues to accumulate until the specimen is destroyed.
3.3. Stiffness Degradation Curve
- (1)
- The larger the axial compression ratio, the greater the initial stiffness of the specimen. When loading displacement reaches the yield displacement, the stiffness of specimens ZJ1, ZJ2, and ZJ3 are 2.54 kN/mm, 3.90 kN/mm, and 4.83 kN/mm, respectively, and the stiffness of ZJ3 (axial compression ratio is 0.4) is about 1.9 times higher than that of ZJ1(axial compression ratio is 0.2). This is also due to the beneficial effect of axial pressure on the strength of concrete in the core area and longitudinal reinforcement constraints.
- (2)
- After the precast specimens yield, the stiffness decreases rapidly, and the larger the axial compression ratio, the faster the stiffness degradation rate. As the loading displacement continues to increase, the stiffness degradation tends to be gentle, but the specimen with a larger axial compression ratio still has higher stiffness. For specimens with faster stiffness degradation, the load increases more slowly under the same loading displacement.
- (3)
- When the stiffness of specimens ZJ1, ZJ2, and ZJ3 is 0.92 kN/mm, 1.49 kN/mm, and 1.98 kN/mm, respectively, the load reaches the peak value, and the corresponding stiffness of the specimens at this time decreases 36.4%, 37.1% and 46.0% of the yield stiffness, respectively. Afterward, the stiffness degradation of the three specimens tends to be gentle, and the stiffness of specimen ZJ1 decreases more slowly than that of specimens ZJ2 and ZJ3. The above phenomenon shows that the increase in the axial compression ratio will aggravate the development of damage in the core area and the connection surfaces, resulting in a more rapid decrease in the stiffness of the joint specimen.
3.4. Damage Analysis Based on Modified Park–Ang Model
3.5. Damage States
4. Conclusions
- The damage process of precast joints can be divided into five stages, and the connection seam in precast joints can significantly affect damage development. Compared with the shear failure of the core area in the cast-in-situ specimen, the failure mode of the precast joint is mainly the connection seam failure. While for the precast joints, the axial compression ratio has no obvious effect on the failure modes.
- Compared with the cast-in-situ joint, the pinching phenomenon of the monolithic precast joint is improved a little, but the ultimate displacement is smaller, and the peak load is only 92% of the cast-in-situ one. As for precast joints, a certain amount of axial pressure can effectively improve the bearing capacity. Both the yielding load and peak load of the precast joints increase obviously with the increase in axial compression ratio. Compared with specimen ZJ1, the peak load of specimens ZJ2 and ZJ3 increased by 30.1% and 42.9%, respectively.
- The stiffness degradation of precast joints is basically consistent with that of cast-in-situ joints, but when the loading reaches a certain degree, the stiffness degradation of precast components will be faster due to the accumulation of damage at the connection seams. As for the precast joints, a larger axial compression ratio can bring higher initial stiffness but faster stiffness degradation. When reaching peak load, the stiffness of ZJ3 with the highest axial compression ratio decreases 46.0% compared with the yielding stiffness, while ZJ1 only decreases 36.4%.
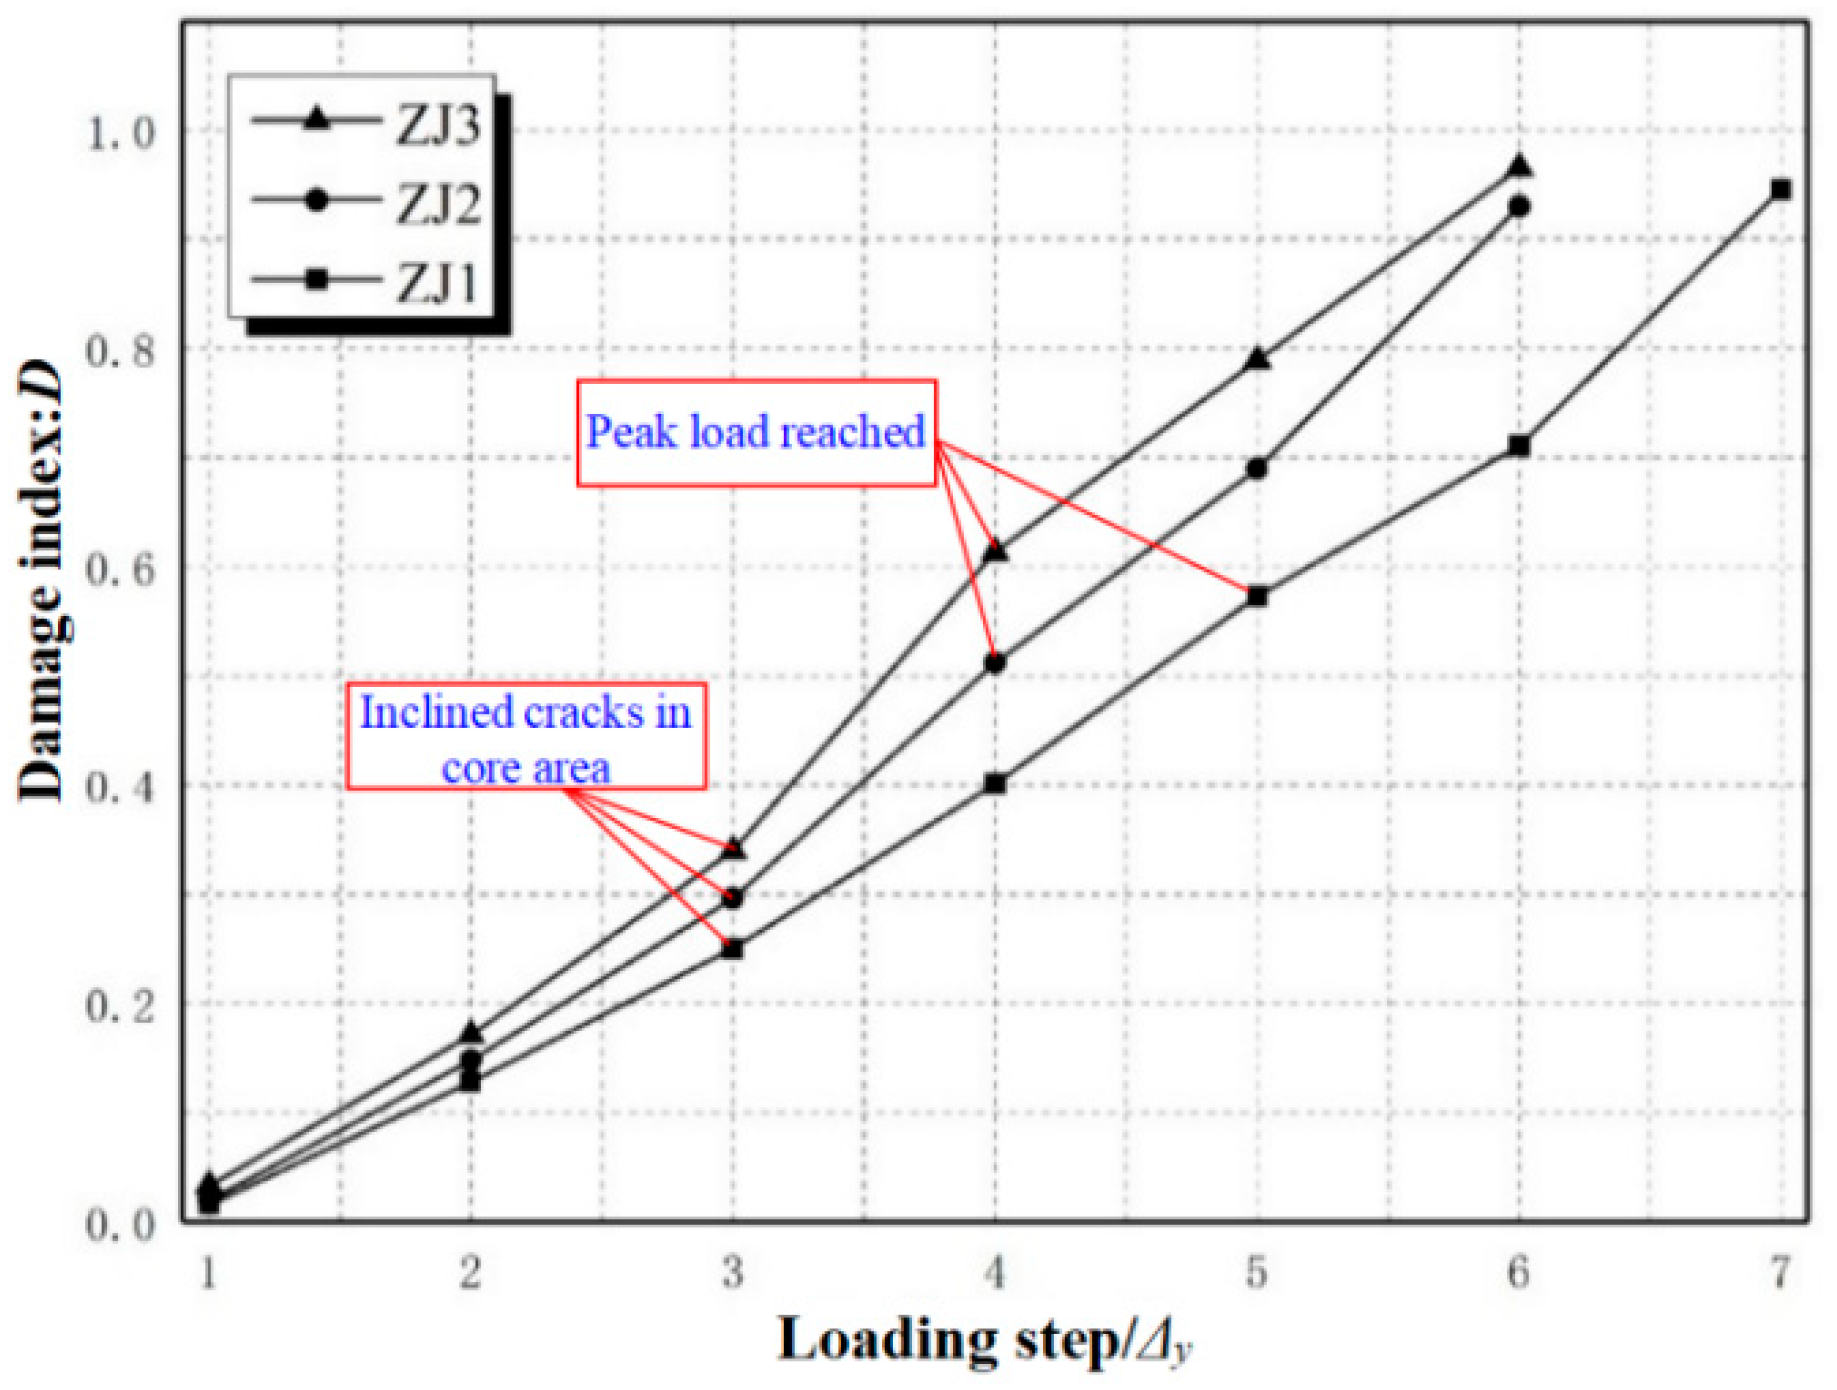
- The damage index model adopted in this paper can accurately reflect the damage characteristics of the monolithic precast joints. The damage indexes are all smaller than 0.1 before the joints yield, while the indexes are beyond 0.8 when the joints enter the failure stage. The damage states of the precast beam-column joints can be defined as five levels according to a different damage index value. The presented quantitative evaluation table established the corresponding relationship between damage states and damage characteristics, thus realizing the quantitative damage evaluation of this kind of joint.
Author Contributions
Funding
Institutional Review Board Statement
Informed Consent Statement
Data Availability Statement
Conflicts of Interest
References
- Mahin, S.A.; Bertero, V.V. An evaluation of inelastic seismic design spectra. J. Struct. Div. 1981, 107, 1777–1795. [Google Scholar] [CrossRef]
- Krawinkler, H.; Zohrei, M. Cumulative damage in steel structures subjected to earthquake ground motions. Comput. Struct. 1983, 16, 531–541. [Google Scholar] [CrossRef]
- Newmark, B.N.M.; Hall, W.J. Earthquake Spectra and Design; Earthquake Engineering Research Institute: Berkeley, CA, USA, 1982. [Google Scholar]
- Rao, P.S.; Sarma, B.S.; Lakshmanan, N.; Stangenberg, F. Damage model for reinforced concrete elements under cyclic loading. ACI Mater. J. 1998, 95, 682–690. [Google Scholar]
- Lybas, J.M.; Sozen, M.A. Effect of Beam Strength and Stiffness on Dynamic Behavior of Reinforced Concrete Coupled Walls; University of Illinois at Urbana-Champaign: Champaign, IL, USA, 1977. [Google Scholar]
- Banon, H.; Veneziano, D. Seismic safety of reinforced concrete members and structures. Earthq. Eng. Struct. Dyn. 1982, 10, 179–193. [Google Scholar] [CrossRef]
- Chung, Y.S.; Meyer, C.; Shinozuka, M. Modeling of concrete damage. Struct. J. 1989, 86, 259–271. [Google Scholar]
- Park, Y.J.; Ang, H.S. Seismic damage analysis of reinforced concrete buildings. J. Struct. Eng. 1985, 111, 722–739. [Google Scholar] [CrossRef]
- Jiang, H.J.; Chen, L.Z.; Chen, Q. Seismic damage assessment and performance levels of reinforced concrete members. Procedia Eng. 2011, 14, 939–945. [Google Scholar] [CrossRef]
- Rajabi, R.; Barghi, M.; Rajabi, R. Investigation of Park–Ang damage index model for flexural behavior of reinforced concrete columns. Struct. Des. Tall Spec. Build. 2013, 22, 1350–1358. [Google Scholar] [CrossRef]
- Jiang, H.; Fu, B.; Chen, L. Constant-Damage Yield Strength Spectra for RC Structures Using Modified Park-Ang Damage Model. Adv. Struct. Eng. 2015, 18, 837–851. [Google Scholar] [CrossRef]
- Tang, H.; Li, D.; Deng, L.; Xue, S. Evidential uncertainty quantification of the Park–Ang damage model in performance based design. Eng. Comput. 2018, 35, 2480–2501. [Google Scholar] [CrossRef]
- Jiang, H.; Fu, B.; Lu, X.; Chen, L. Seismic Damage Assessment of RC Members by a Modified Park-Ang Model. Adv. Struct. Eng. 2015, 18, 353–364. [Google Scholar] [CrossRef]
- Yue, J.; Qian, J.; Beskos, D.E. A generalized multi-level seismic damage model for RC framed structures. Soil Dyn. Earthq. Eng. 2016, 80, 25–39. [Google Scholar] [CrossRef]
- Huang, W.; Zou, M.; Qian, J.; Zhou, Z. Consistent damage model and performance-based assessment of structural members of different materials. Soil Dyn. Earthq. Eng. 2018, 109, 266–272. [Google Scholar] [CrossRef]
- Carrillo, J.; Oyarzo-Vera, C.; Blandón, C. Damage assessment of squat, thin and lightly-reinforced walls by the Park & Ang damage index. J. Build. Eng. 2019, 26, 100921. [Google Scholar]
- Xing, G.; Ozbulut, O.E.; Lei, T.; Liu, B. Cumulative seismic damage assessment of reinforced concrete columns through cyclic and pseudo-dynamic tests. Struct. Des. Tall Spéc. Build. 2016, 26, e1308. [Google Scholar] [CrossRef]
- Perera, R.; Carnicero, A.; Alarcon, E.; Gomez, S. A fatigue damage model for seismic response of RC structures. Comput. Struct. 2000, 78, 293–302. [Google Scholar] [CrossRef]
- Zhai, C.-H.; Wen, W.-P.; Zhu, T.-T.; Li, S.; Xie, L.-L. Inelastic displacement ratios for design of structures with constant damage performance. Eng. Struct. 2013, 52, 53–63. [Google Scholar] [CrossRef]
- Lin, H.; Tang, S.; Lan, C. Control Parametric Analysis on Improving Park Restoring Force Model and Damage Evaluation of High-Strength Structure. Adv. Mater. Sci. Eng. 2016, 2016, 3696418. [Google Scholar] [CrossRef]
- Guo, J.; Wang, J.; Li, Y.; Zhao, W.; Du, Y. Three Dimensional Extension for Park and Ang Damage Model. Structures 2016, 7, 184–194. [Google Scholar] [CrossRef]
- Wu, G.; Feng, D. Research progress on fundamental performance of precast concrete frame beam-to-column connections. J. Build. Struct. 2018, 39, 1–16. (In Chinese) [Google Scholar]
- JGJ 1-2014; Technical Specification for Precast Concrete Structures. China Building Industry Press: Beijing, China, 2014. (In Chinese)
- Adibi, M.; Talebkhah, R.; Yahyaabadi, A. Simulation of cyclic response of precast concrete beam-column joints. Comput. Concr. 2019, 24, 223–236. [Google Scholar]
- Gombosuren, D.; Maki, T. Prediction of Joint Shear Deformation Index of RC Beam–Column Joints. Buildings 2020, 10, 176. [Google Scholar] [CrossRef]
- Santarsiero, G. FE Modelling of the Seismic Behavior of Wide Beam-Column Joints Strengthened with CFRP Systems. Buildings 2018, 8, 31. [Google Scholar] [CrossRef]
- Araby, M.Z.; Rizal, S.; Abdullah; Afifuddin, M.; Hasan, M. Deformation Capacity of RC Beam-Column Joints Strengthened with Ferrocement. Sustainability 2022, 14, 4398. [Google Scholar] [CrossRef]
- Qin, C.-G.; Bai, G.-L.; Xu, Y.-Z.; Su, N.-F.; Wu, T. Comparative Study of Seismic Behavior between Monolithic Precast Concrete Structure and Cast-in-Place Structure. Shock Vib. 2018, 2018, 7029287. [Google Scholar] [CrossRef] [Green Version]
- Liu, H.; Wang, Z.; Du, X.; Shen, G.Q. The seismic behaviour of precast concrete interior joints with different connection methods in assembled monolithic subway station. Eng. Struct. 2021, 232, 111799. [Google Scholar] [CrossRef]
- Feng, B.; Xiong, F.; Chen, J.; Chen, W.; Zhang, Y. Effects of postcast connection locations on the seismic performance of precast concrete frame joints. Struct. Des. Tall Spec. Build. 2018, 27, e1544. [Google Scholar] [CrossRef]
- Zhang, J.; Pei, Z.; Rong, X. Experimental seismic study of an innovative precast steel–concrete composite beam–column joint. Soil Dyn. Earthq. Eng. 2022, 161, 107420. [Google Scholar] [CrossRef]
- Chen, J.; Liu, J.; Hu, P.; Sun, H.; Hu, X. Experimental and numerical investigation on seismic behavior of detachable precast concrete column joints with bolted flange plate. J. Build. Eng. 2022, 49, 104077. [Google Scholar] [CrossRef]
- Farhangi, V.; Karakouzian, M. Effect of Fiber Reinforced Polymer Tubes Filled with Recycled Materials and Concrete on Structural Capacity of Pile Foundations. Appl. Sci. 2020, 10, 1554. [Google Scholar] [CrossRef]
- Ma, F.; Deng, M.; Yang, Y. Experimental study on internal precast beam–column ultra-high-performance concrete connection and shear capacity of its joint. J. Build. Eng. 2021, 44, 103204. [Google Scholar] [CrossRef]
- Yang, Y.; Ding, X.; Liu, Y.; Deng, L.; Lv, F.; Zhao, S. Lateral Pressure Test of Vertical Joint Concrete and Formwork Optimization Design for Monolithic Precast Concrete Structure. Buildings 2022, 12, 261. [Google Scholar] [CrossRef]
- Ghayeb, H.H.; Ramli Sulong, N.H.; Razak, H.A.; Mo, K.H. Enhancement of seismic behaviour of precast beam-to-column joints using engineered cementitious composite. Eng. Struct. 2022, 255, 113932. [Google Scholar] [CrossRef]
- GB 50011-2010; Code for Seismic Design of Buildings. China Building Industry Press: Beijing, China, 2010. (In Chinese)
- Borrero, E.L.S.; Farhangi, V.; Jadidi, K.; Karakouzian, M. An Experimental Study on Concrete’s Durability and Mechanical Characteristics Subjected to Different Curing Regimes. Civ. Eng. J. 2021, 7, 676–689. [Google Scholar] [CrossRef]
- Yang, H.; Zhao, W.; Zhu, Z.; Fu, J. Seismic behavior comparison of reinforced concrete interior beam-column joints based on different loading methods. Eng. Struct. 2018, 166, 31–45. [Google Scholar] [CrossRef]
- Liu, H.; Yan, Q.; Du, X. Seismic performance comparison between precast beam joints and cast-in-place beam joints. Adv. Struct. Eng. 2016, 20, 1299–1314. [Google Scholar] [CrossRef]
- Fan, G.; Song, Y. Effect of axial compression ratio on dynamic mechanical properties of RC beam–column joints. Mag. Concr. Res. 2014, 66, 1219–1236. [Google Scholar] [CrossRef]
- Liao, X.; Hu, X.; Ma, R.; Miao, D.; Xue, W. Experimental studies on seismic performance of monolithicprecast prestressed concrete frame interior connectionsunder high axial compression ratio. J. Build. 2016, 37, 82–89. (In Chinese) [Google Scholar]
- Kunnath, S.K.; Reinhorn, A.M.; Park, Y.J. Analytical modeling of inelastic seismic response of R/C structures. J. Struct. Eng. 1990, 116, 996–1017. [Google Scholar] [CrossRef]
- Zhang, Y.B.; Zhou, Z.B.; Pan, Z.H.; Song, H.F. Damage model study of single-sided joint of the RC column-steel beam hybrid structure. Build. Struct. 2014, 44, 70–73. (In Chinese) [Google Scholar]
- Makhloof, D.A.; Ibrahim, A.R.; Ren, X. Damage Assessment of Reinforced Concrete Structures through Damage Indices: A State-of-the-Art Review. Comput. Modeling Eng. Sci. 2021, 128, 849–874. [Google Scholar] [CrossRef]


| Concrete Grade | fcu/MPa | fc/MPa | ft/MPa | Ec/MPa |
|---|---|---|---|---|
| C30 | 38.6 | 25.4 | 2.31 | 30,218 |
| Grade | fy/MPa | fu/MPa | Es/GPa | δgt/% | εy/10−6 |
|---|---|---|---|---|---|
| HRB400 | 396 | 510 | 201 | 23.2 | 2113 |
| HPB300 | 342 | 425 | 200 | 22.8 | 2080 |
| Specimen | Loading Direction | Loading Displacement | ||||||
|---|---|---|---|---|---|---|---|---|
| 1Δy | 2Δy | 3Δy | 4Δy | 5Δy | 6Δy | 7Δy | ||
| ZJ0 | Positive | 4.02 | 2.54 | 1.88 | 1.49 | 1.16 | 1.02 | 0.72 |
| Negtive | 4.21 | 2.65 | 1.99 | 1.51 | 1.19 | 0.96 | 0.72 | |
| ZJ1 | Positive | 2.54 | 1.82 | 1.35 | 1.12 | 0.92 | 0.72 | 0.53 |
| Negtive | 3.07 | 1.77 | 1.42 | 1.08 | 0.92 | 0.72 | 0.53 | |
| ZJ2 | Positive | 3.9 | 2.52 | 1.88 | 1.49 | 1.11 | 0.85 | 0.63 |
| Negtive | 4.18 | 2.64 | 1.96 | 1.48 | 1.09 | 0.83 | 0.62 | |
| ZJ3 | Positive | 4.83 | 2.97 | 2.21 | 1.58 | 1.16 | 0.85 | 0.68 |
| Negtive | 4.85 | 3.08 | 2.26 | 1.52 | 1.17 | 0.90 | 0.67 | |
| Specimen | 1Δy | 2Δy | 3Δy | 4Δy | 5Δy | 6Δy | 7Δy |
|---|---|---|---|---|---|---|---|
| ZJ1 | 0.016 | 0.128 | 0.25 | 0.401 | 0.573 | 0.711 | 0.925 |
| ZJ2 | 0.021 | 0.148 | 0.296 | 0.498 | 0.75 | 0.92 | / |
| ZJ3 | 0.033 | 0.171 | 0.375 | 0.614 | 0.79 | 0.93 | / |
| Damage States | Damage Index | Structure State | Damage Feature |
|---|---|---|---|
| Basically intact | 0~0.1 | Serviceable | / |
| Slight damage | 0.1~0.2 | Repairable | small cracks in the plastic hinge zone of the beam; long oblique cracks at beam end; obvious stiffness degradation. |
| Moderate damage | 0.2~0.4 | Repairable | vertical and oblique cracks in the core area of the joint; cracks expanding in the connection interface; stiffness is less than the yielding stiffness. |
| Severe damage | 0.4~0.8 | Irreparable | wide main cracks; longitudinal reinforcement in the core area yields; concrete is spalling off in a large area; connection between beam end, column end and core area is separated; smaller structure stiffness and slower stiffness degradation. |
| Complete failure | 0.8~1.0 | Total loss | concrete in the core area is crushed; stirrup yields, throughout diagonal crack formed. |
Publisher’s Note: MDPI stays neutral with regard to jurisdictional claims in published maps and institutional affiliations. |
© 2022 by the authors. Licensee MDPI, Basel, Switzerland. This article is an open access article distributed under the terms and conditions of the Creative Commons Attribution (CC BY) license (https://creativecommons.org/licenses/by/4.0/).
Share and Cite
Cao, Y.; Yang, Z. Seismic Damage Evaluation of Beam-Column Joints in Monolithic Precast Concrete Frame Structures. Materials 2022, 15, 6038. https://doi.org/10.3390/ma15176038
Cao Y, Yang Z. Seismic Damage Evaluation of Beam-Column Joints in Monolithic Precast Concrete Frame Structures. Materials. 2022; 15(17):6038. https://doi.org/10.3390/ma15176038
Chicago/Turabian StyleCao, Yan, and Zhao Yang. 2022. "Seismic Damage Evaluation of Beam-Column Joints in Monolithic Precast Concrete Frame Structures" Materials 15, no. 17: 6038. https://doi.org/10.3390/ma15176038