
Recycling of Flexible Polyurethane Foams by Regrinding Scraps into Powder to Replace Polyol for Re-Foaming


Abstract
:
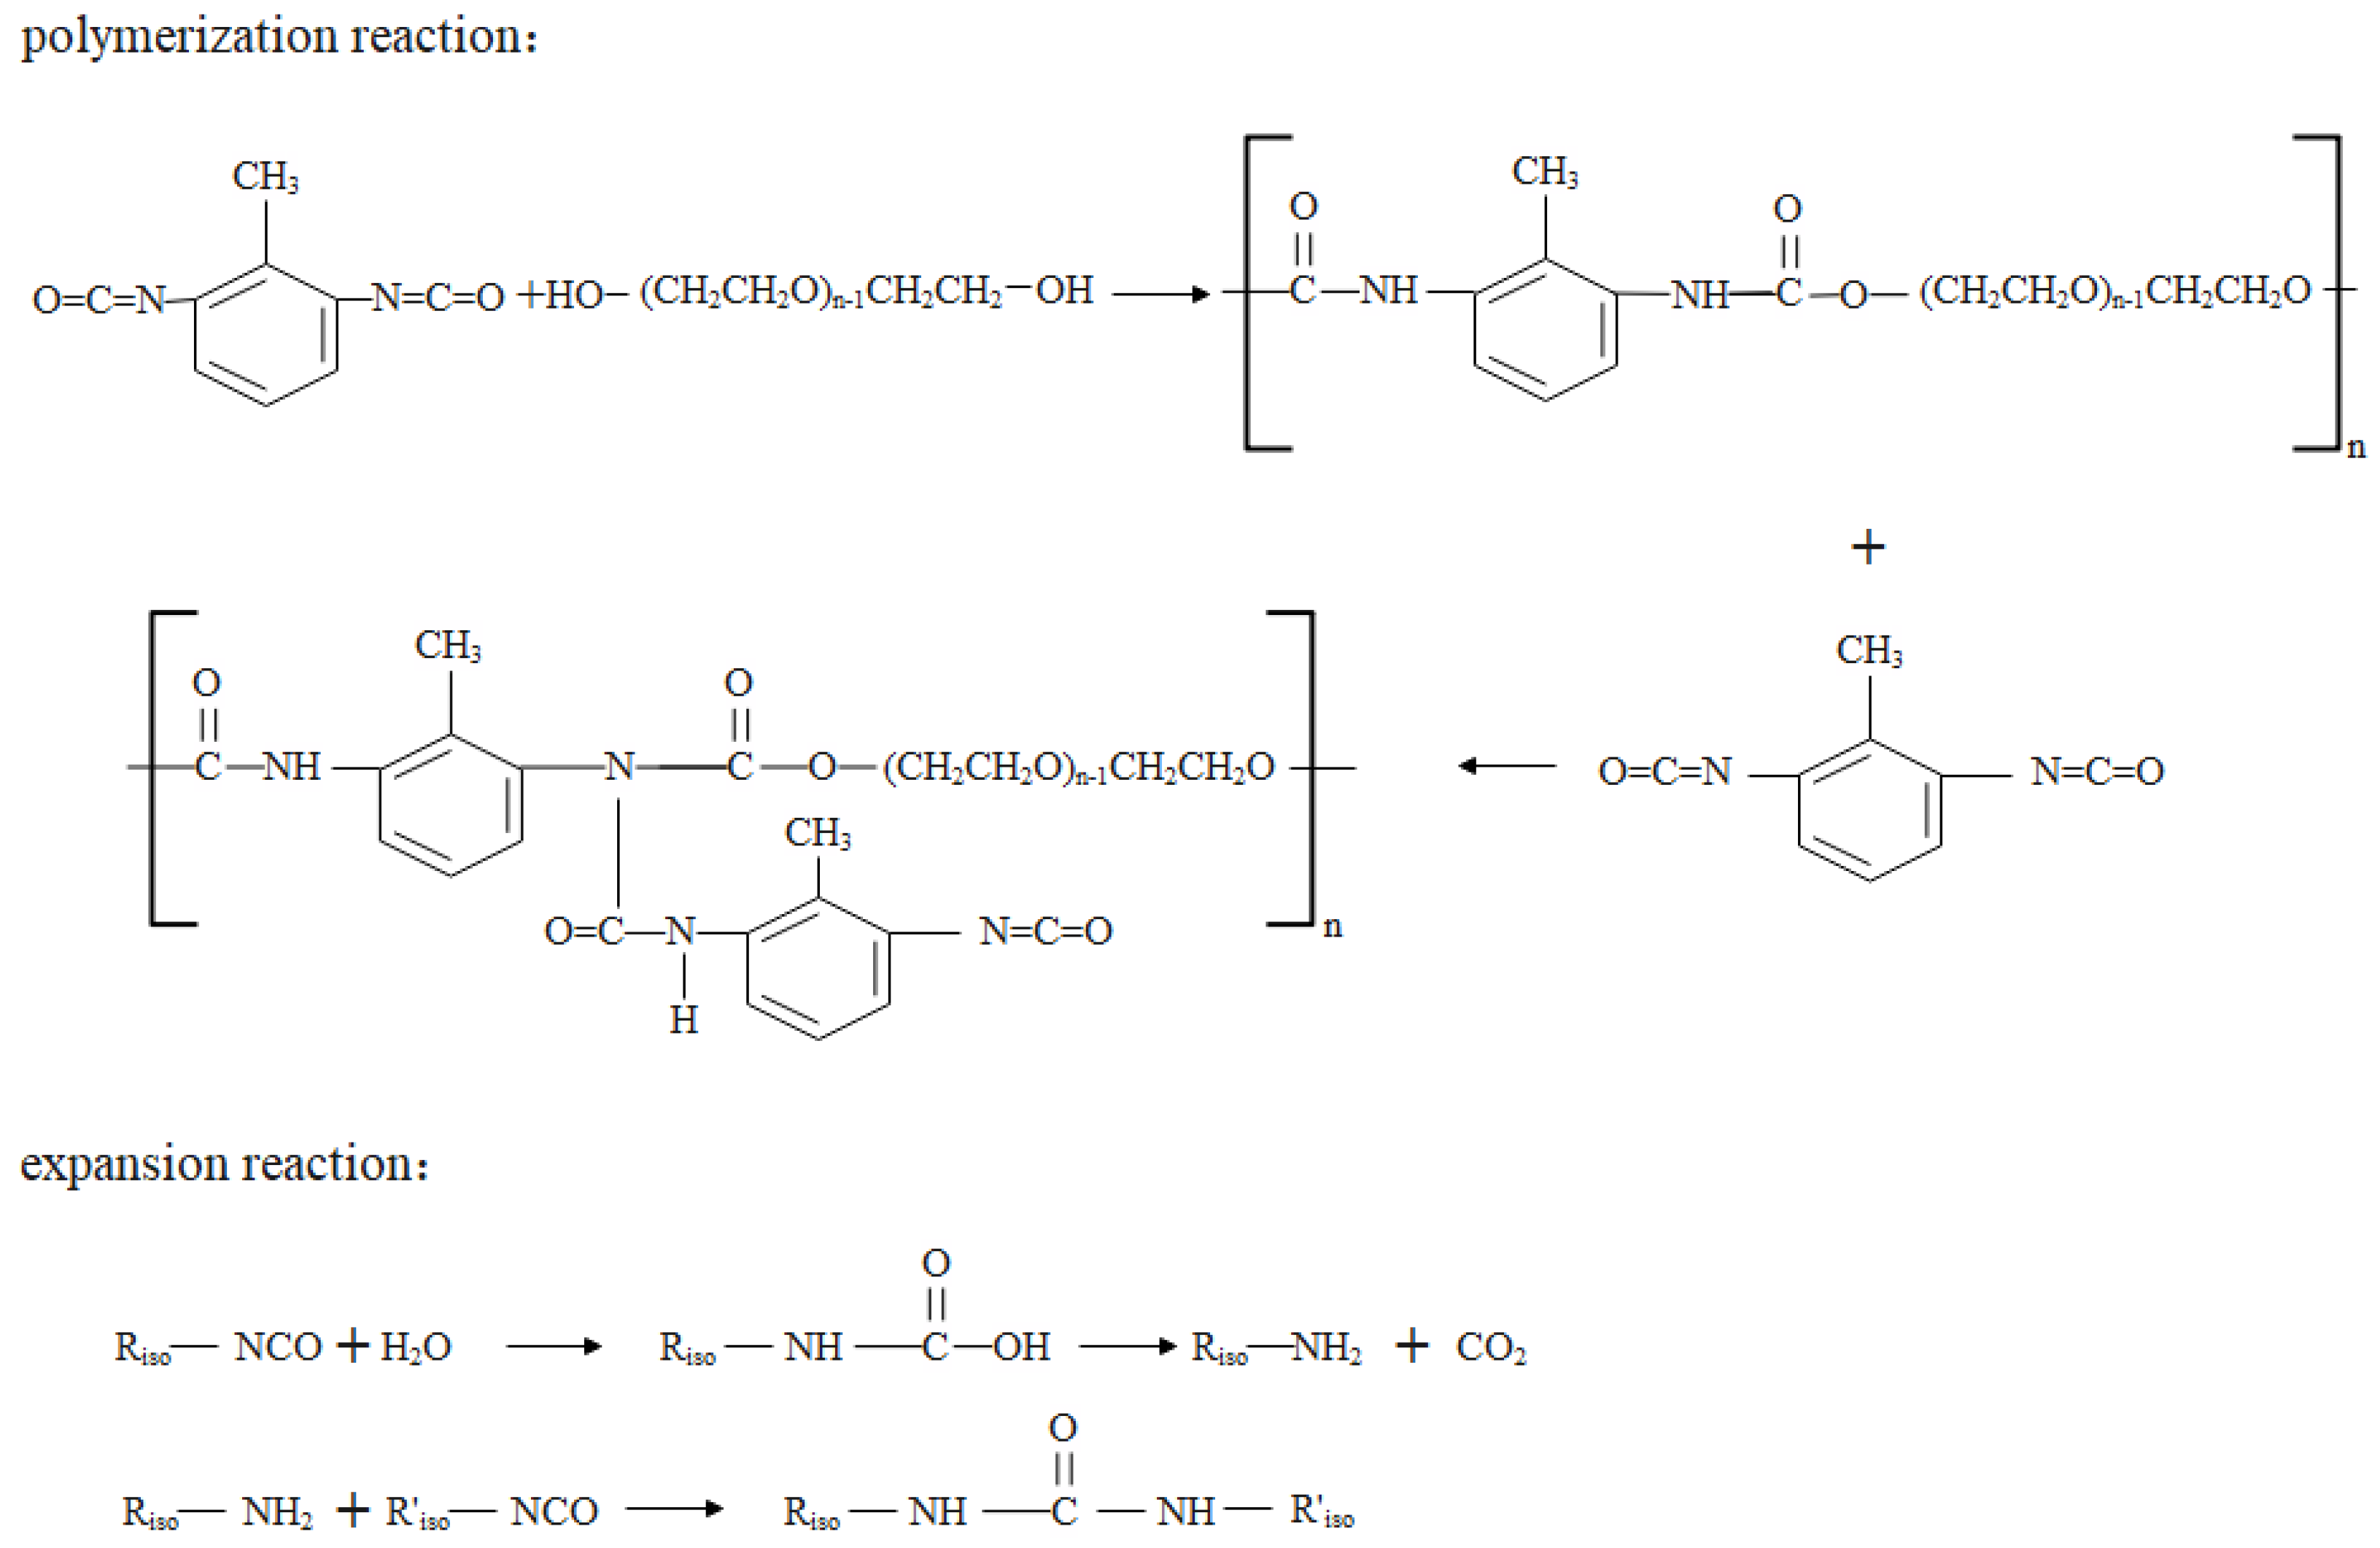
1. Introduction
2. Materials and Methods
2.1. Materials
2.2. Preparation of Samples
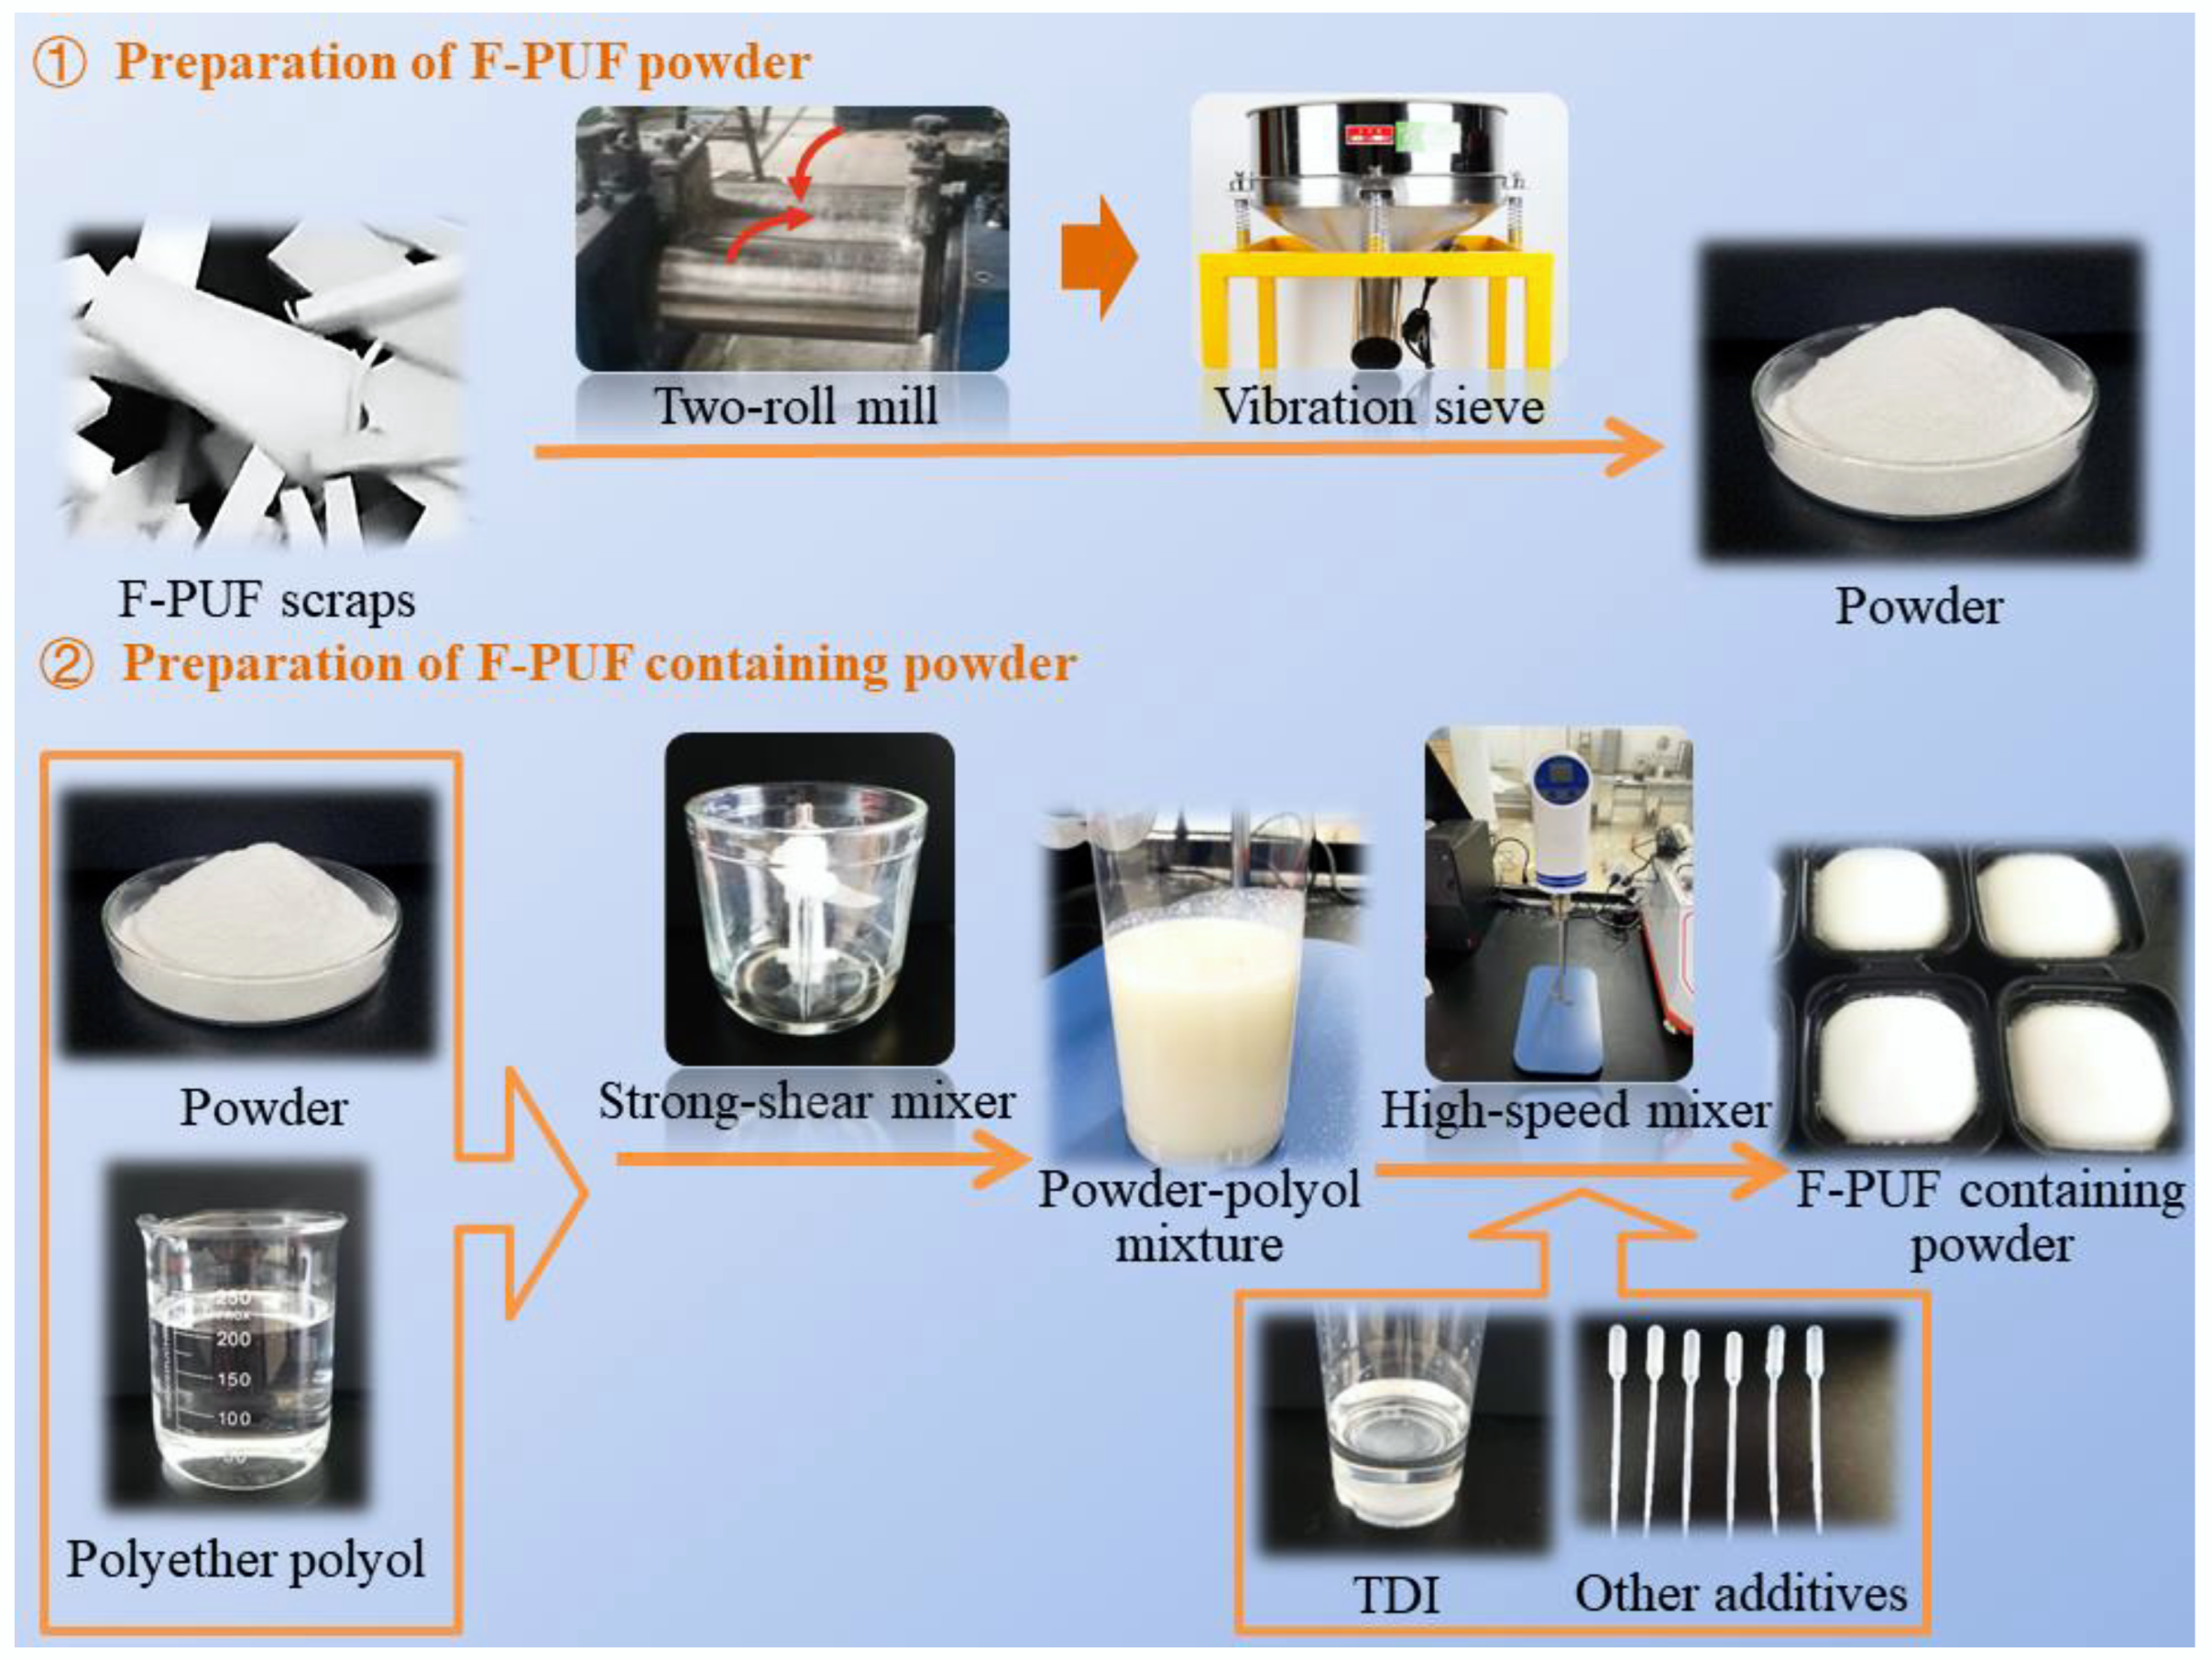
2.2.1. Preparation of F-PUF Powder
2.2.2. Preparation of F-PUF Containing Powder
2.3. Measurements and Characterization
2.3.1. Characterization of Powder
2.3.2. Characterization of F-PUF Containing Powder
3. Results and Discussion
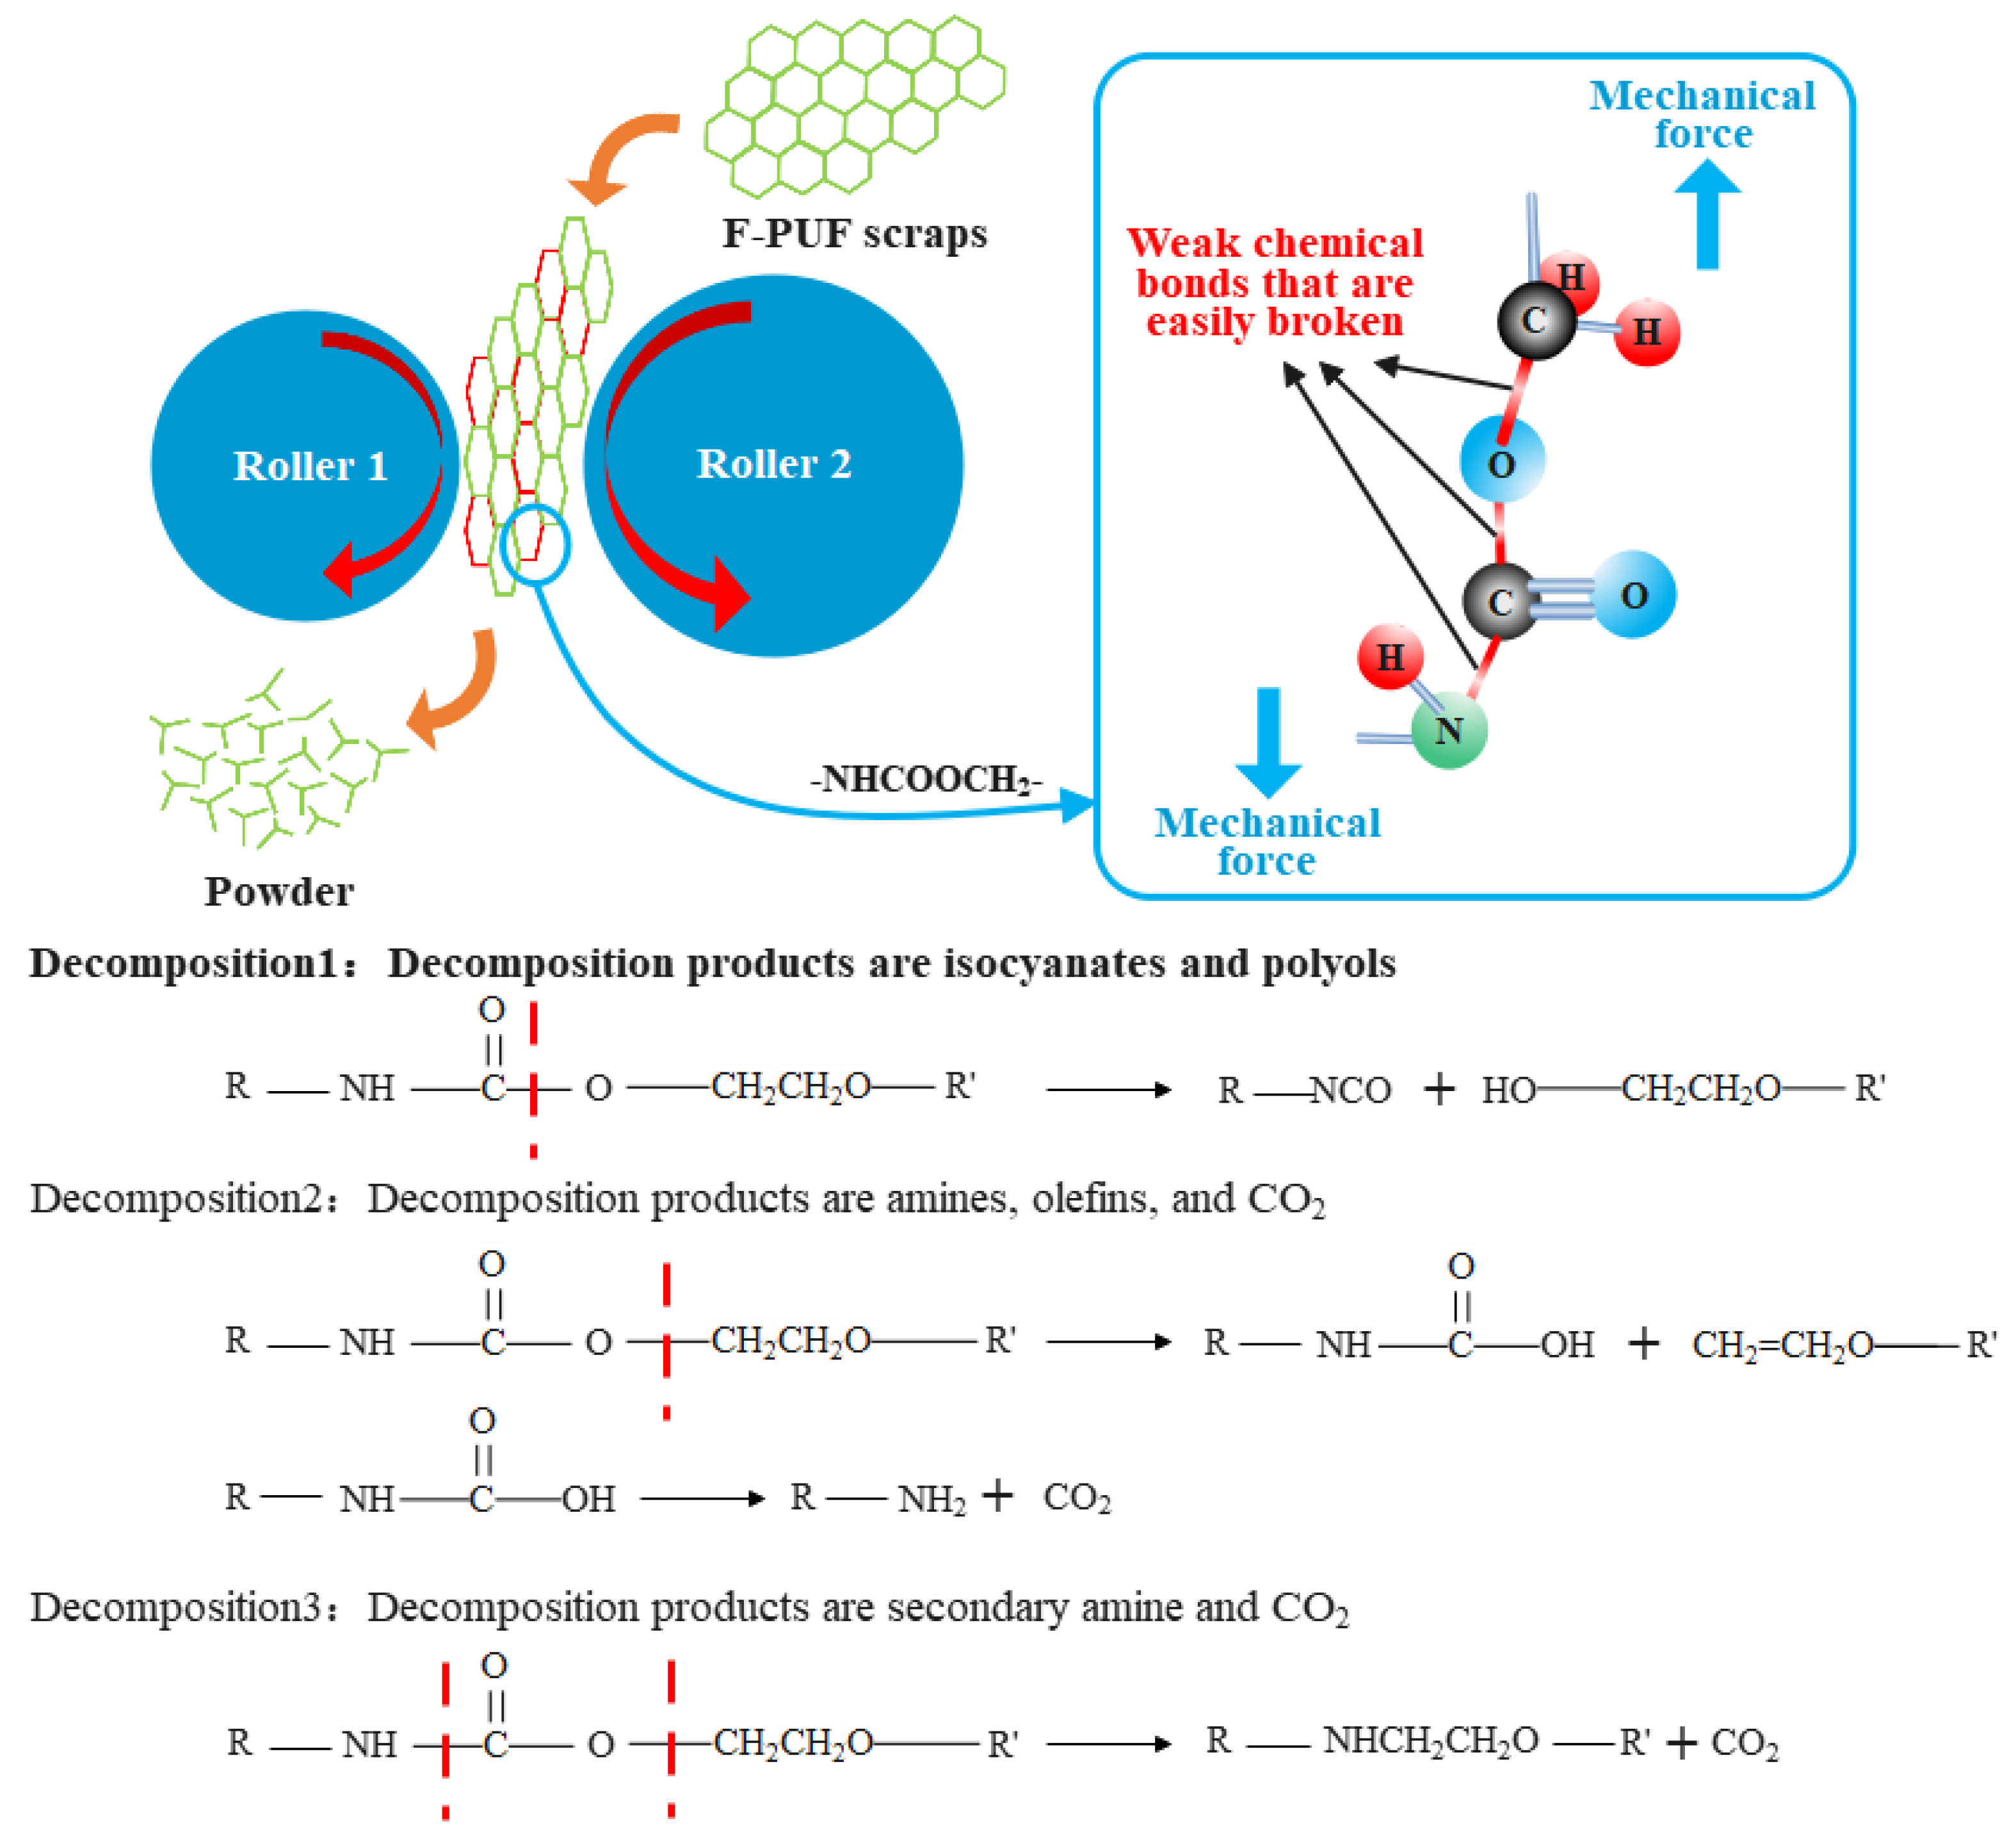
3.1. The Activation Mechanism of the Powder
3.2. Properties of the Powder
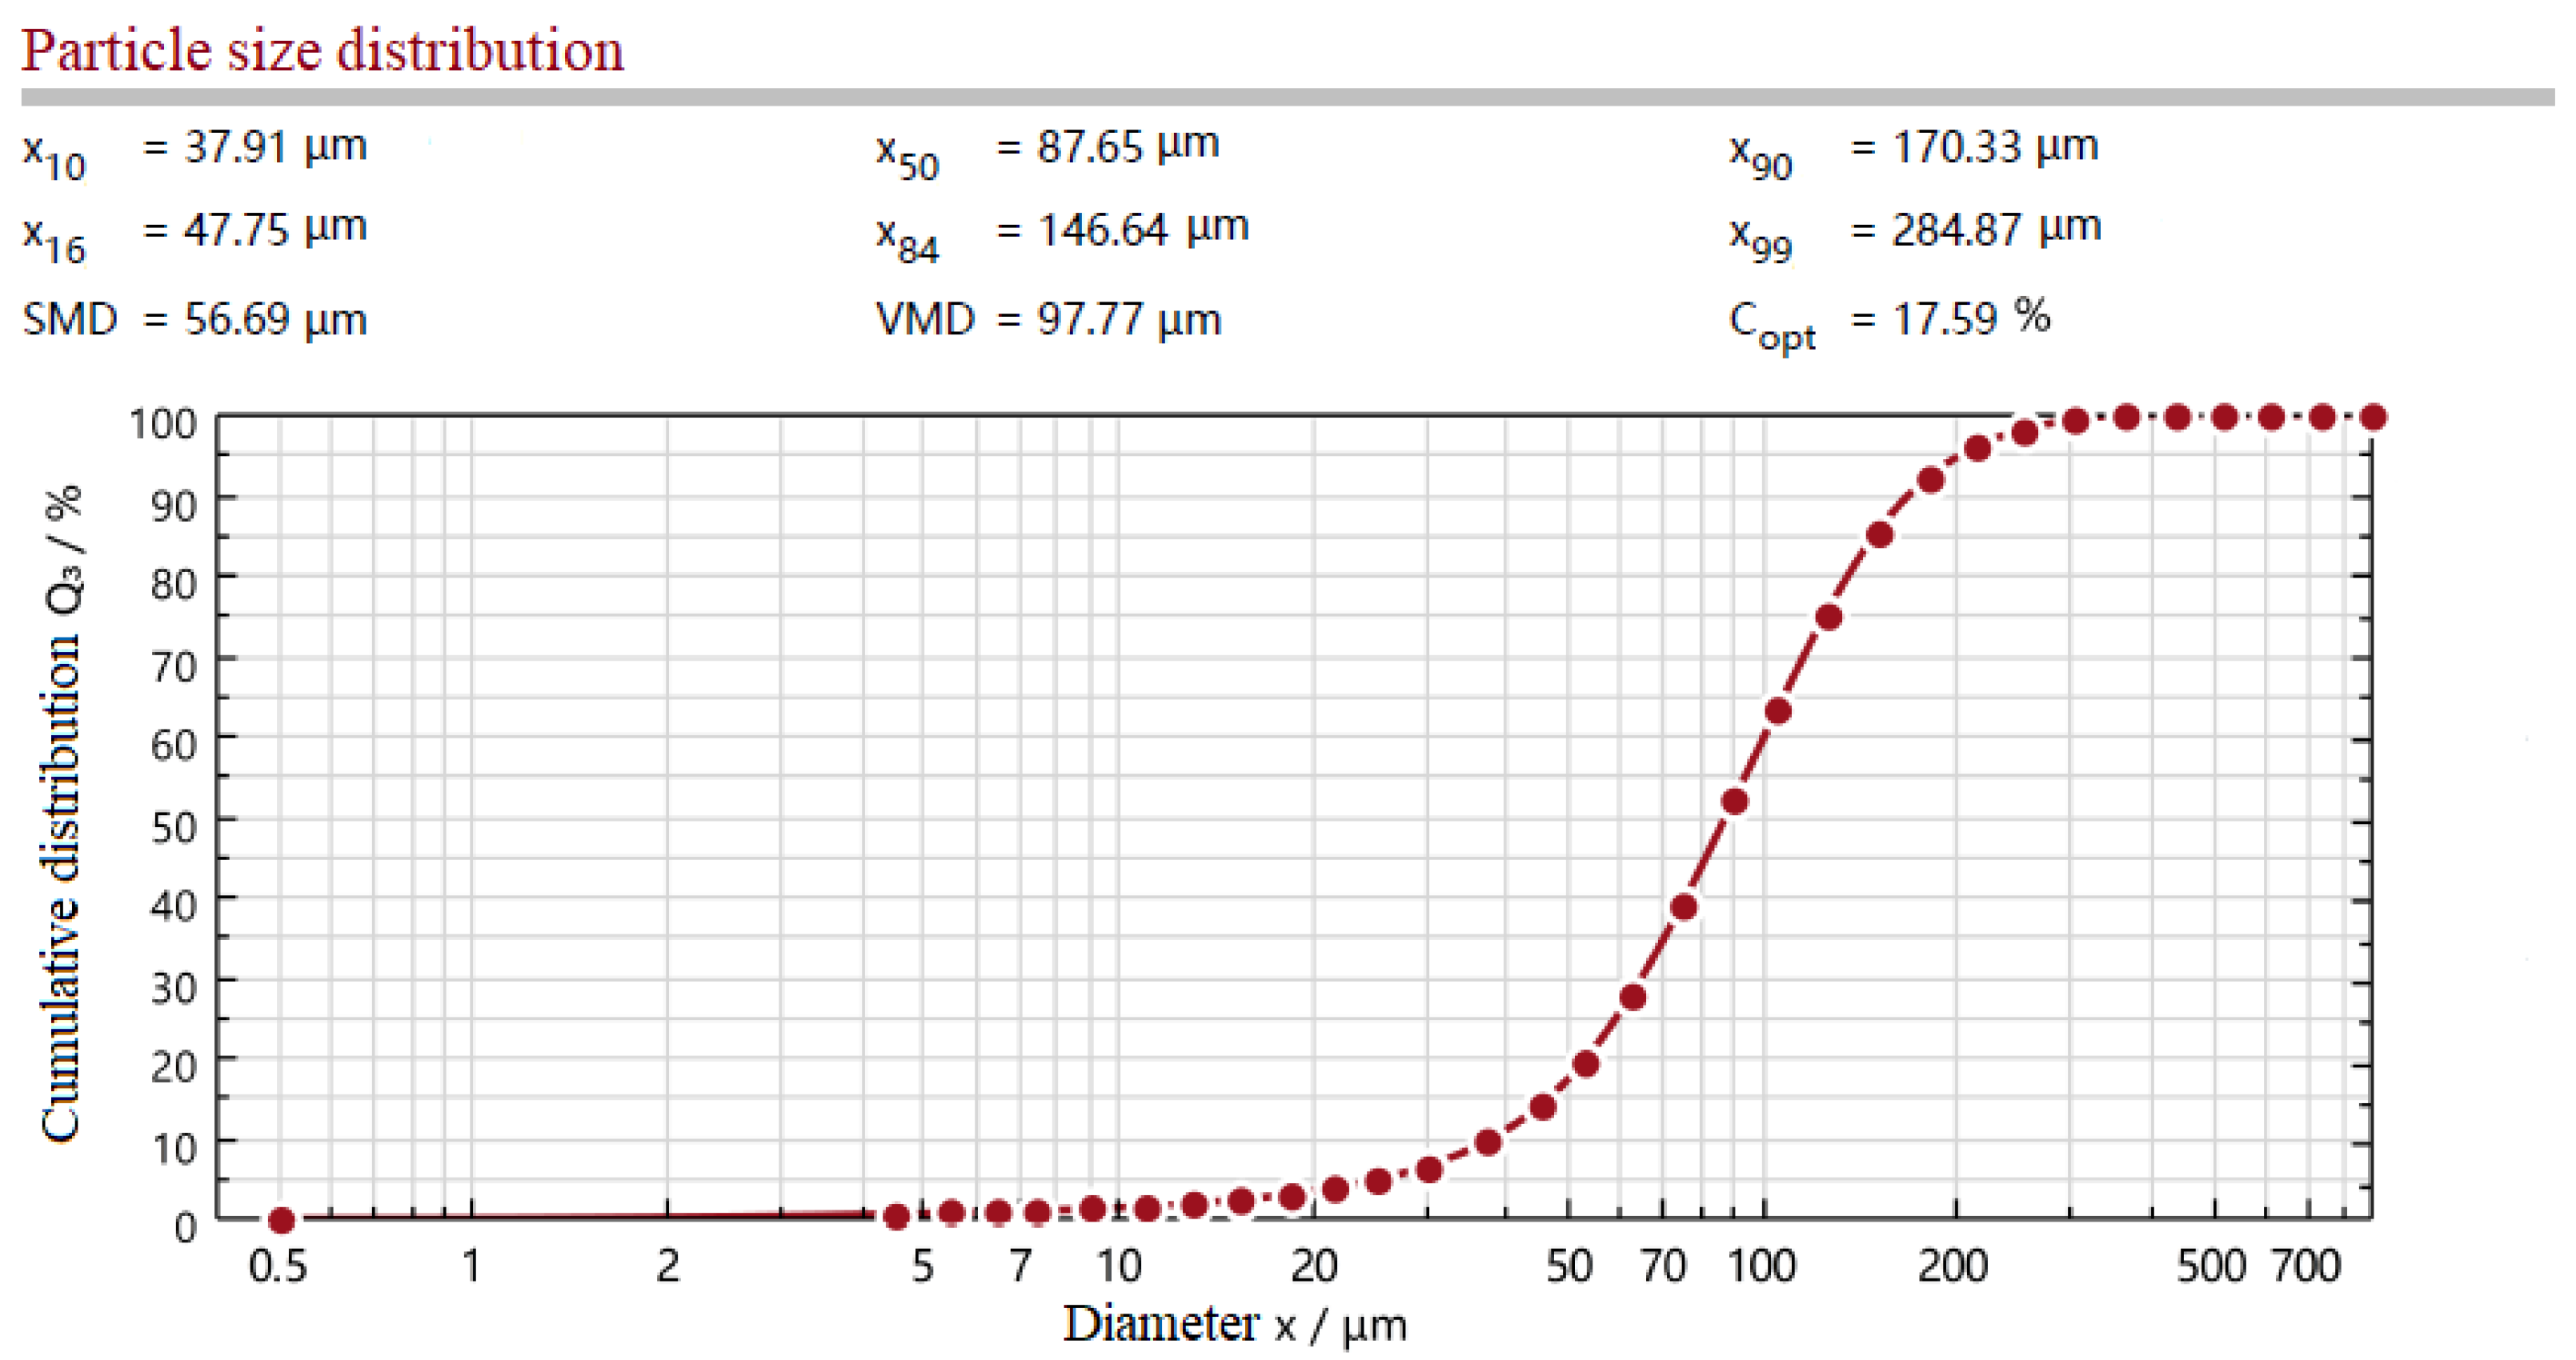
3.2.1. Particle Size and Particle Temperature
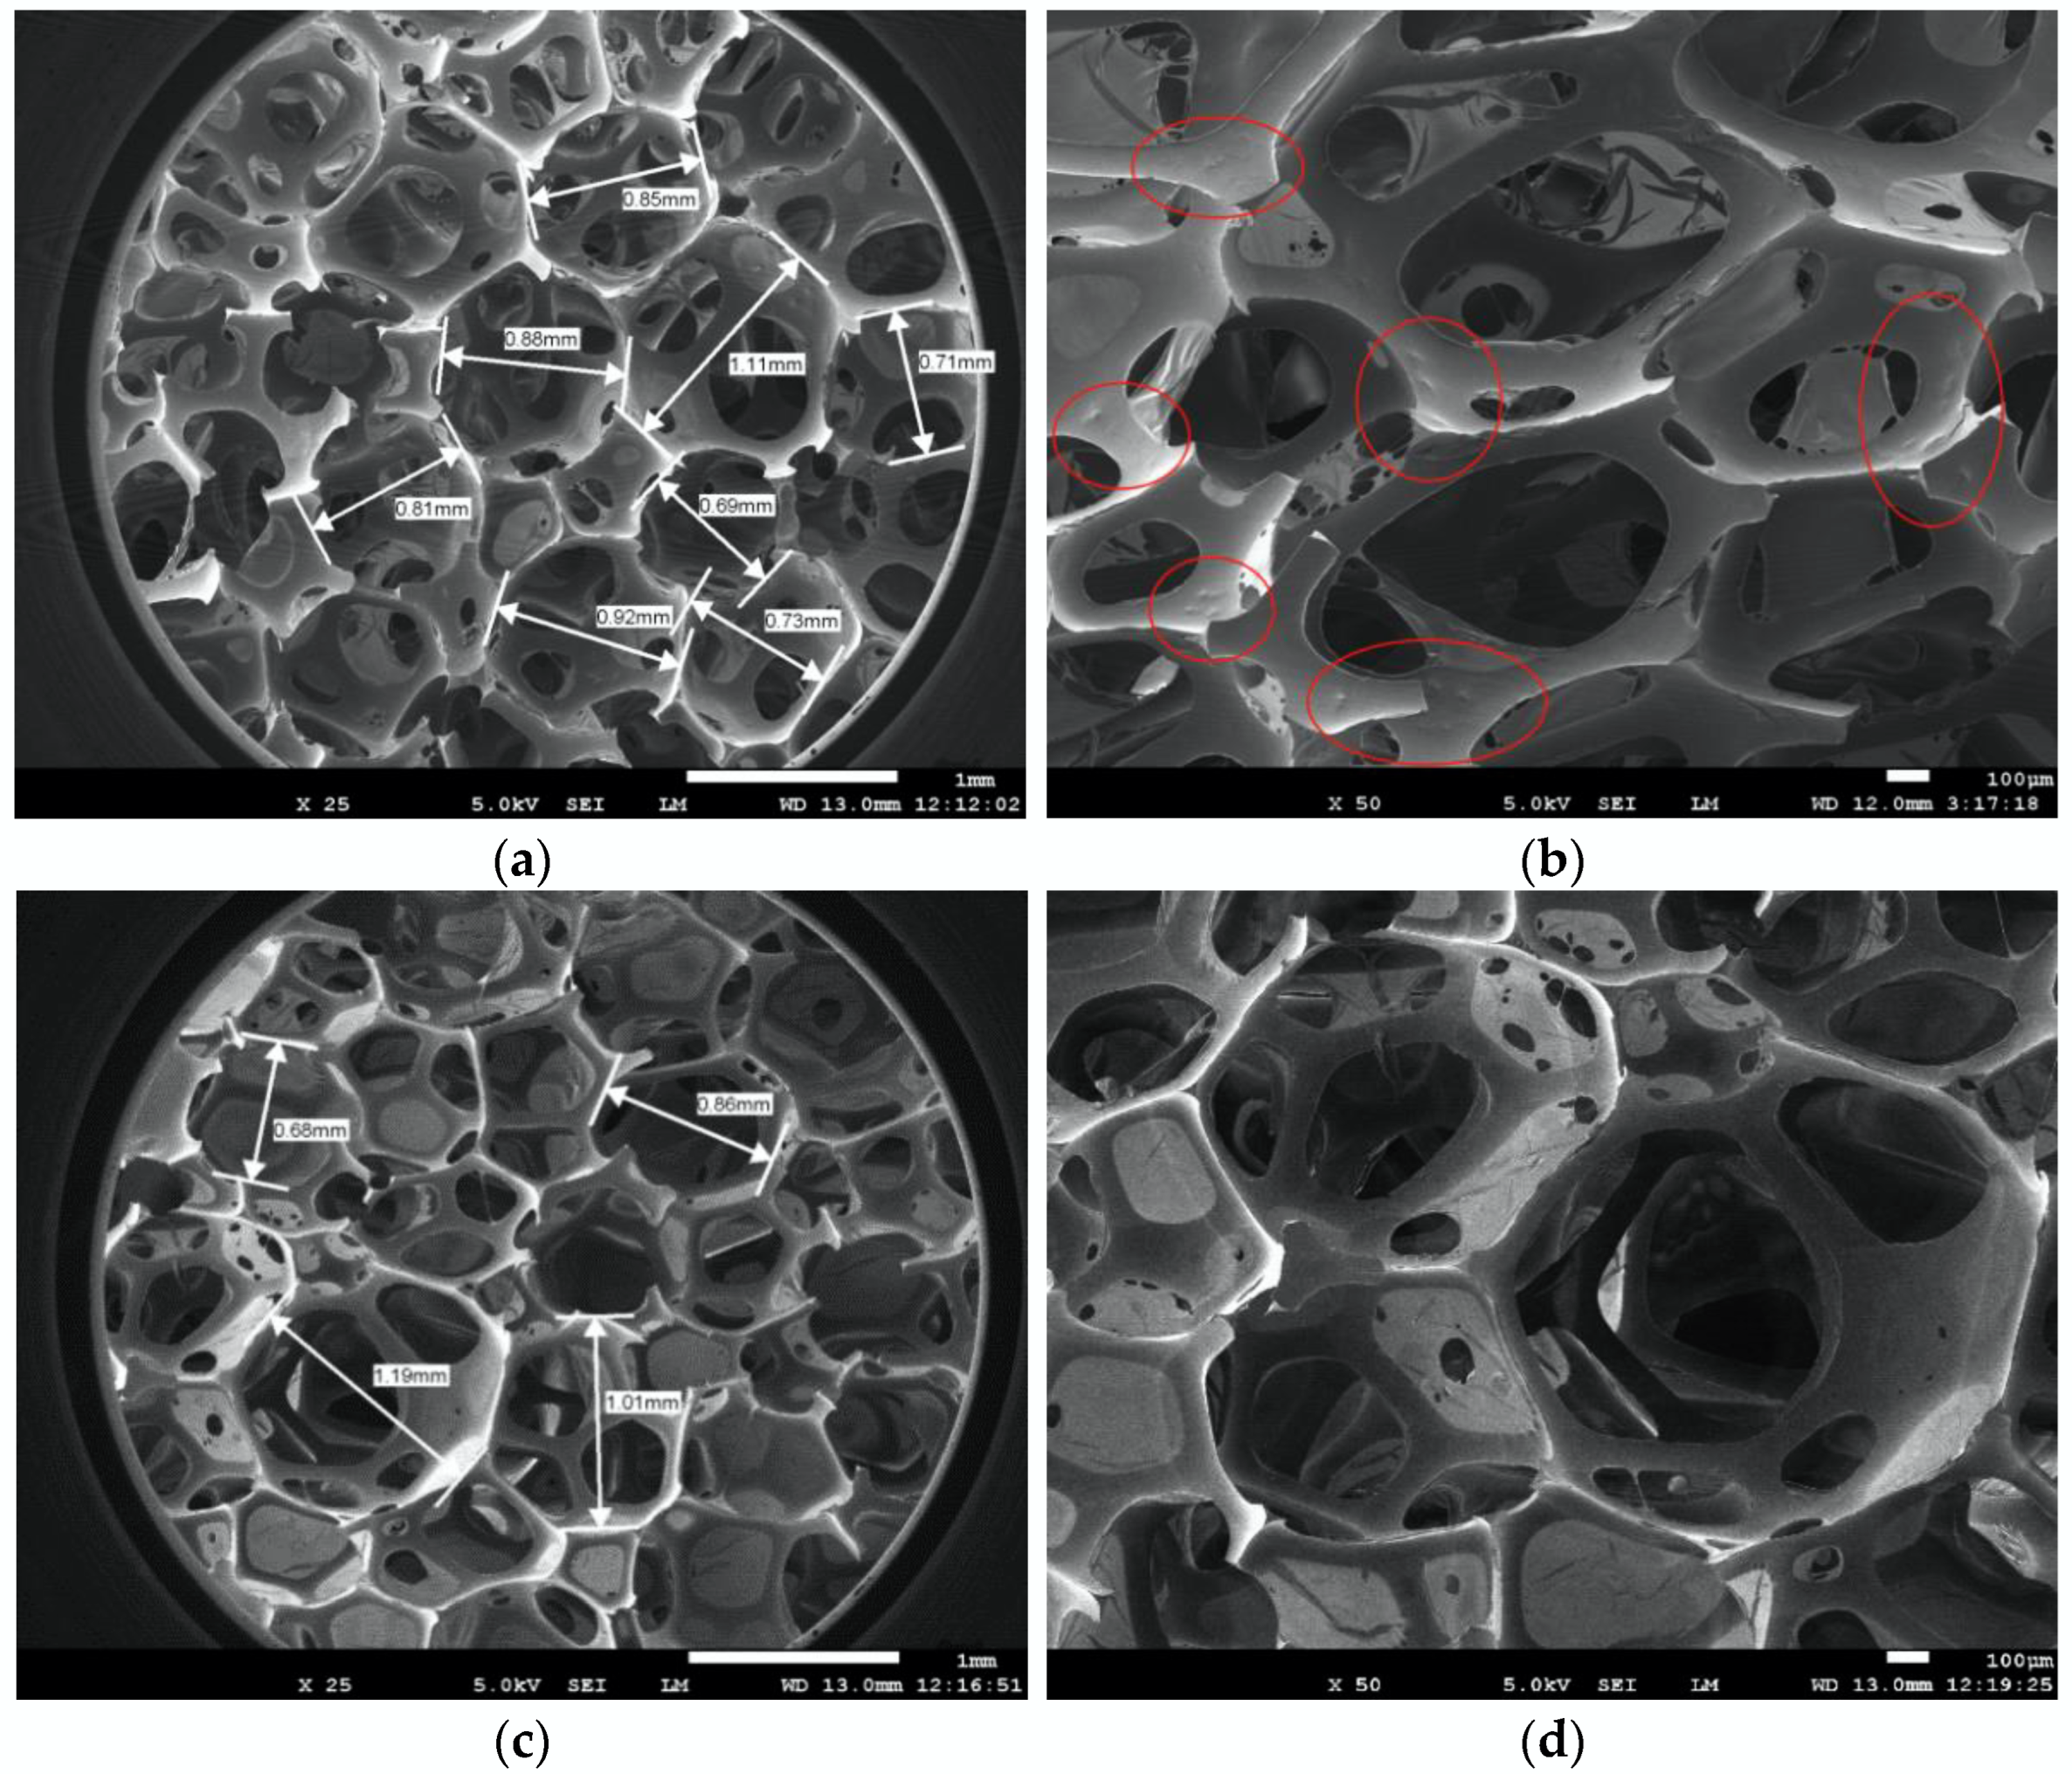
3.2.2. Morphologies
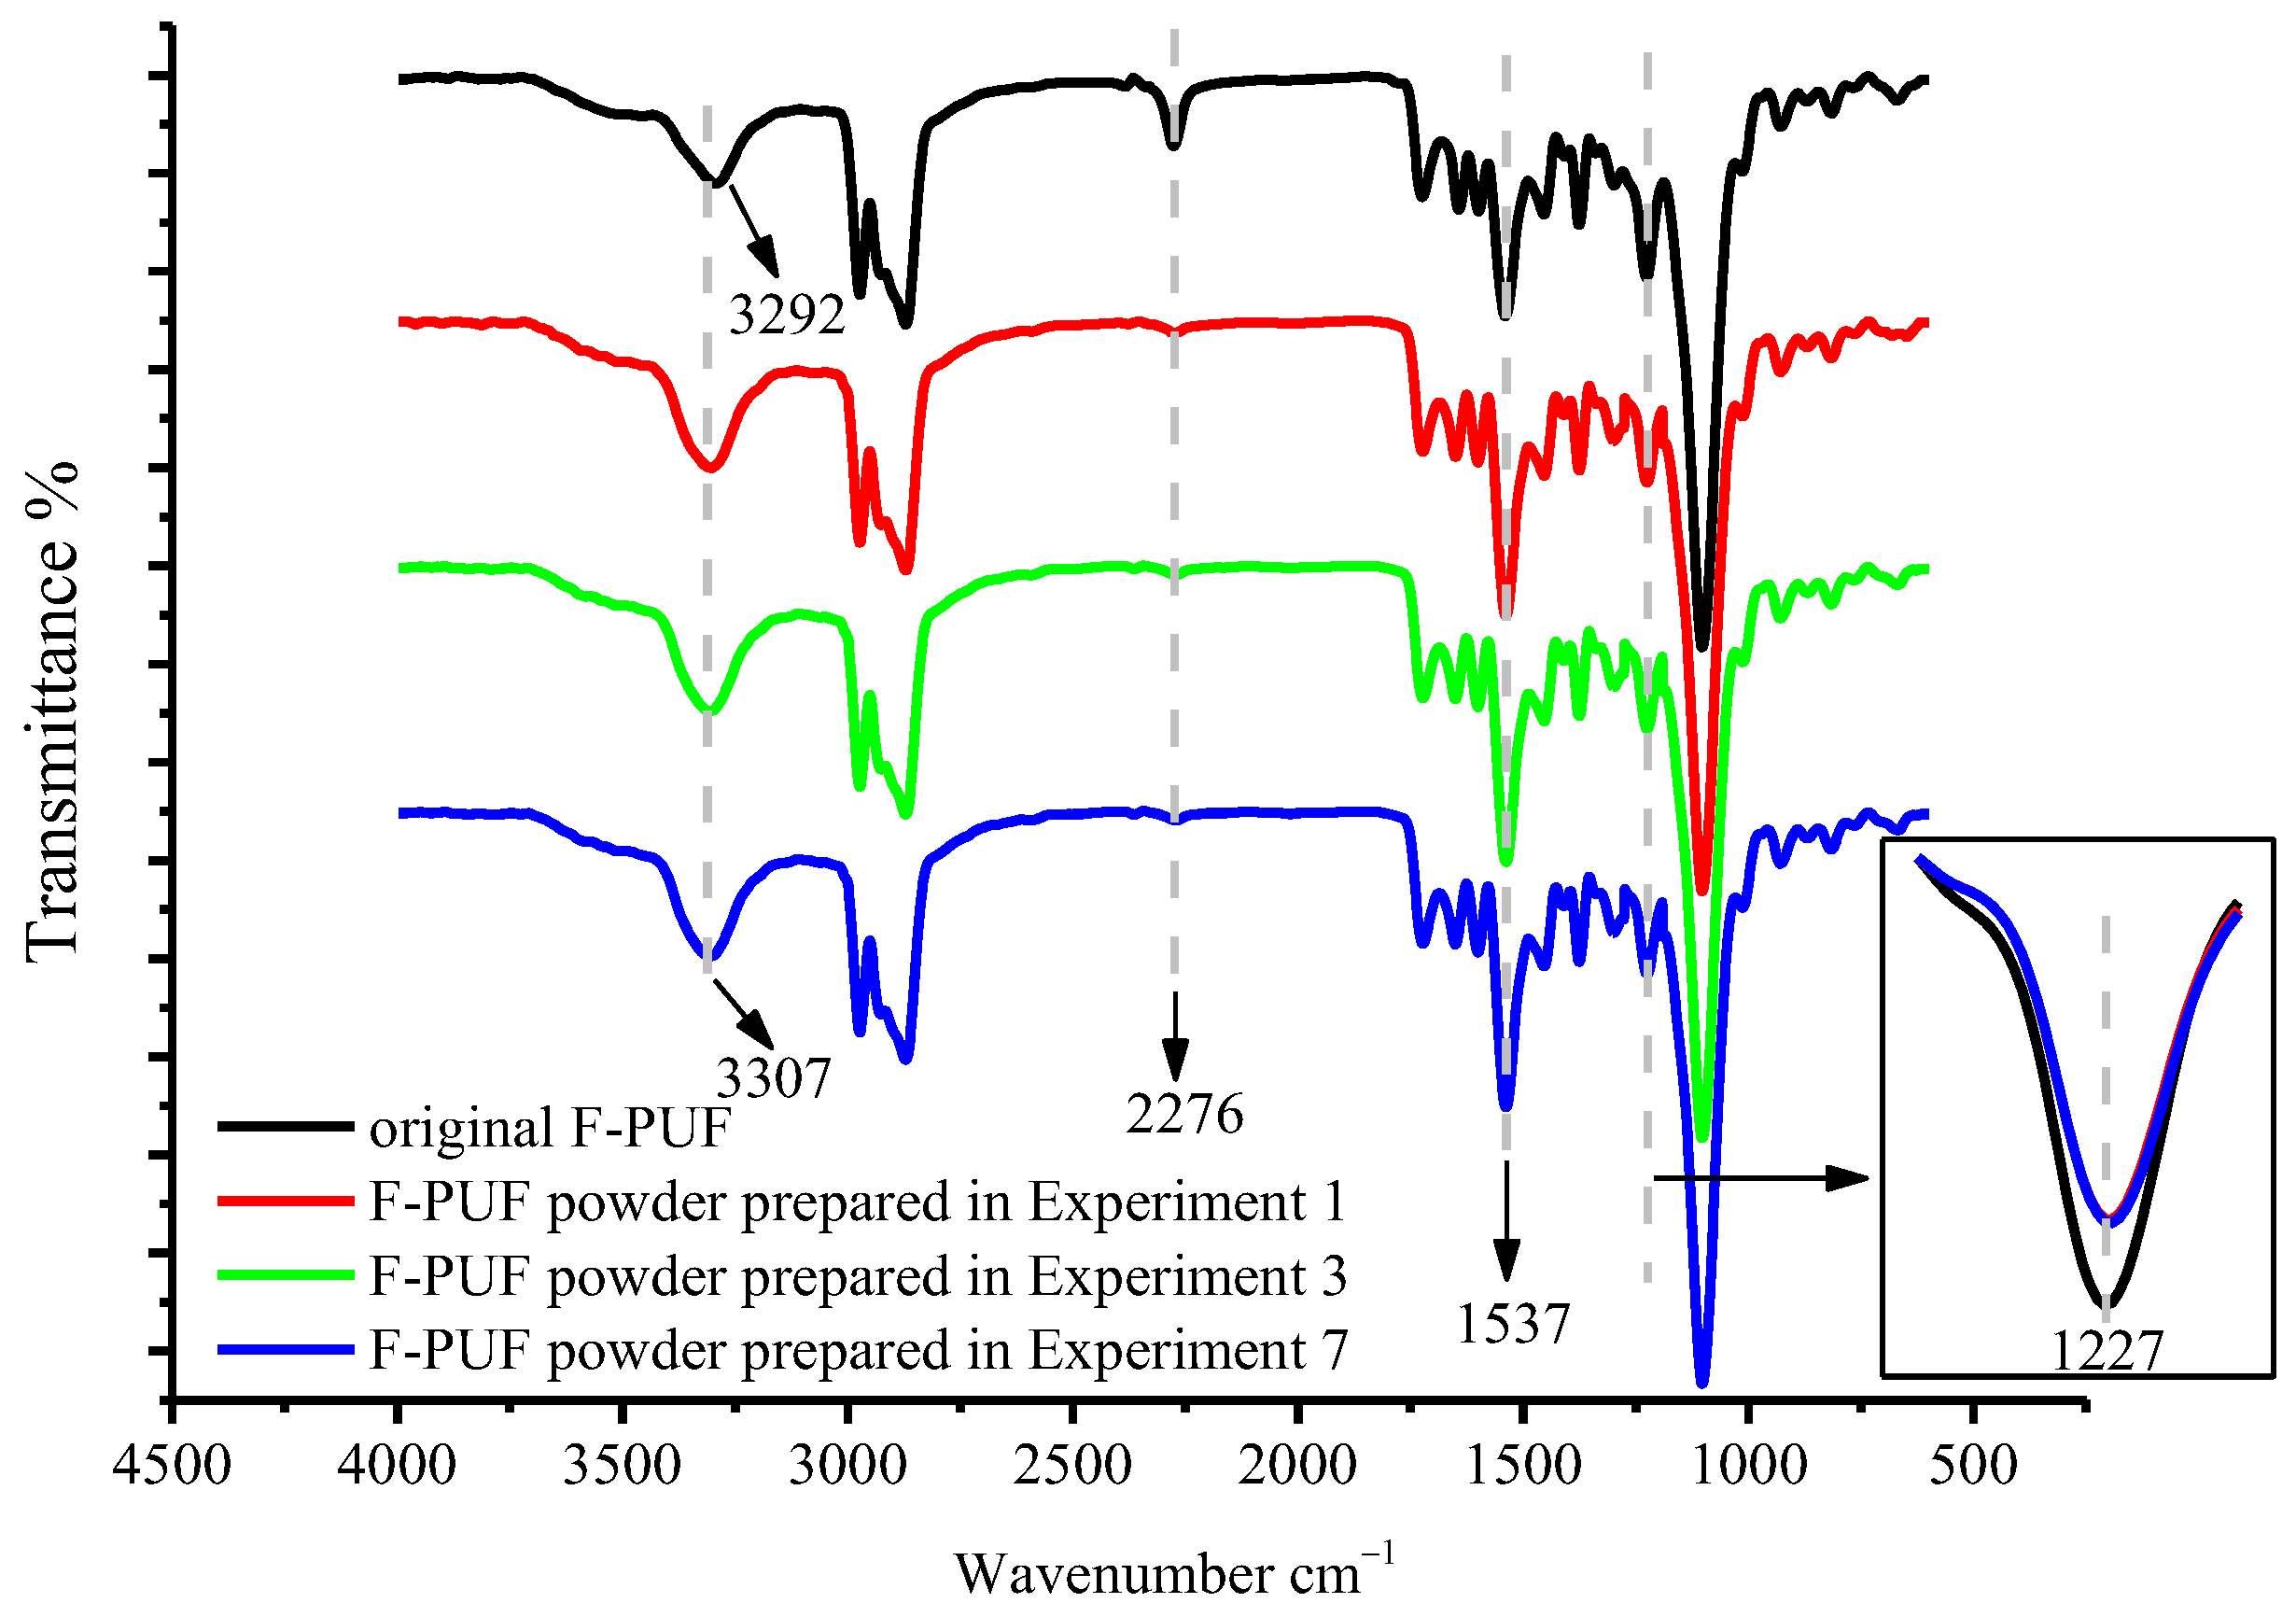
3.2.3. FTIR Analysis
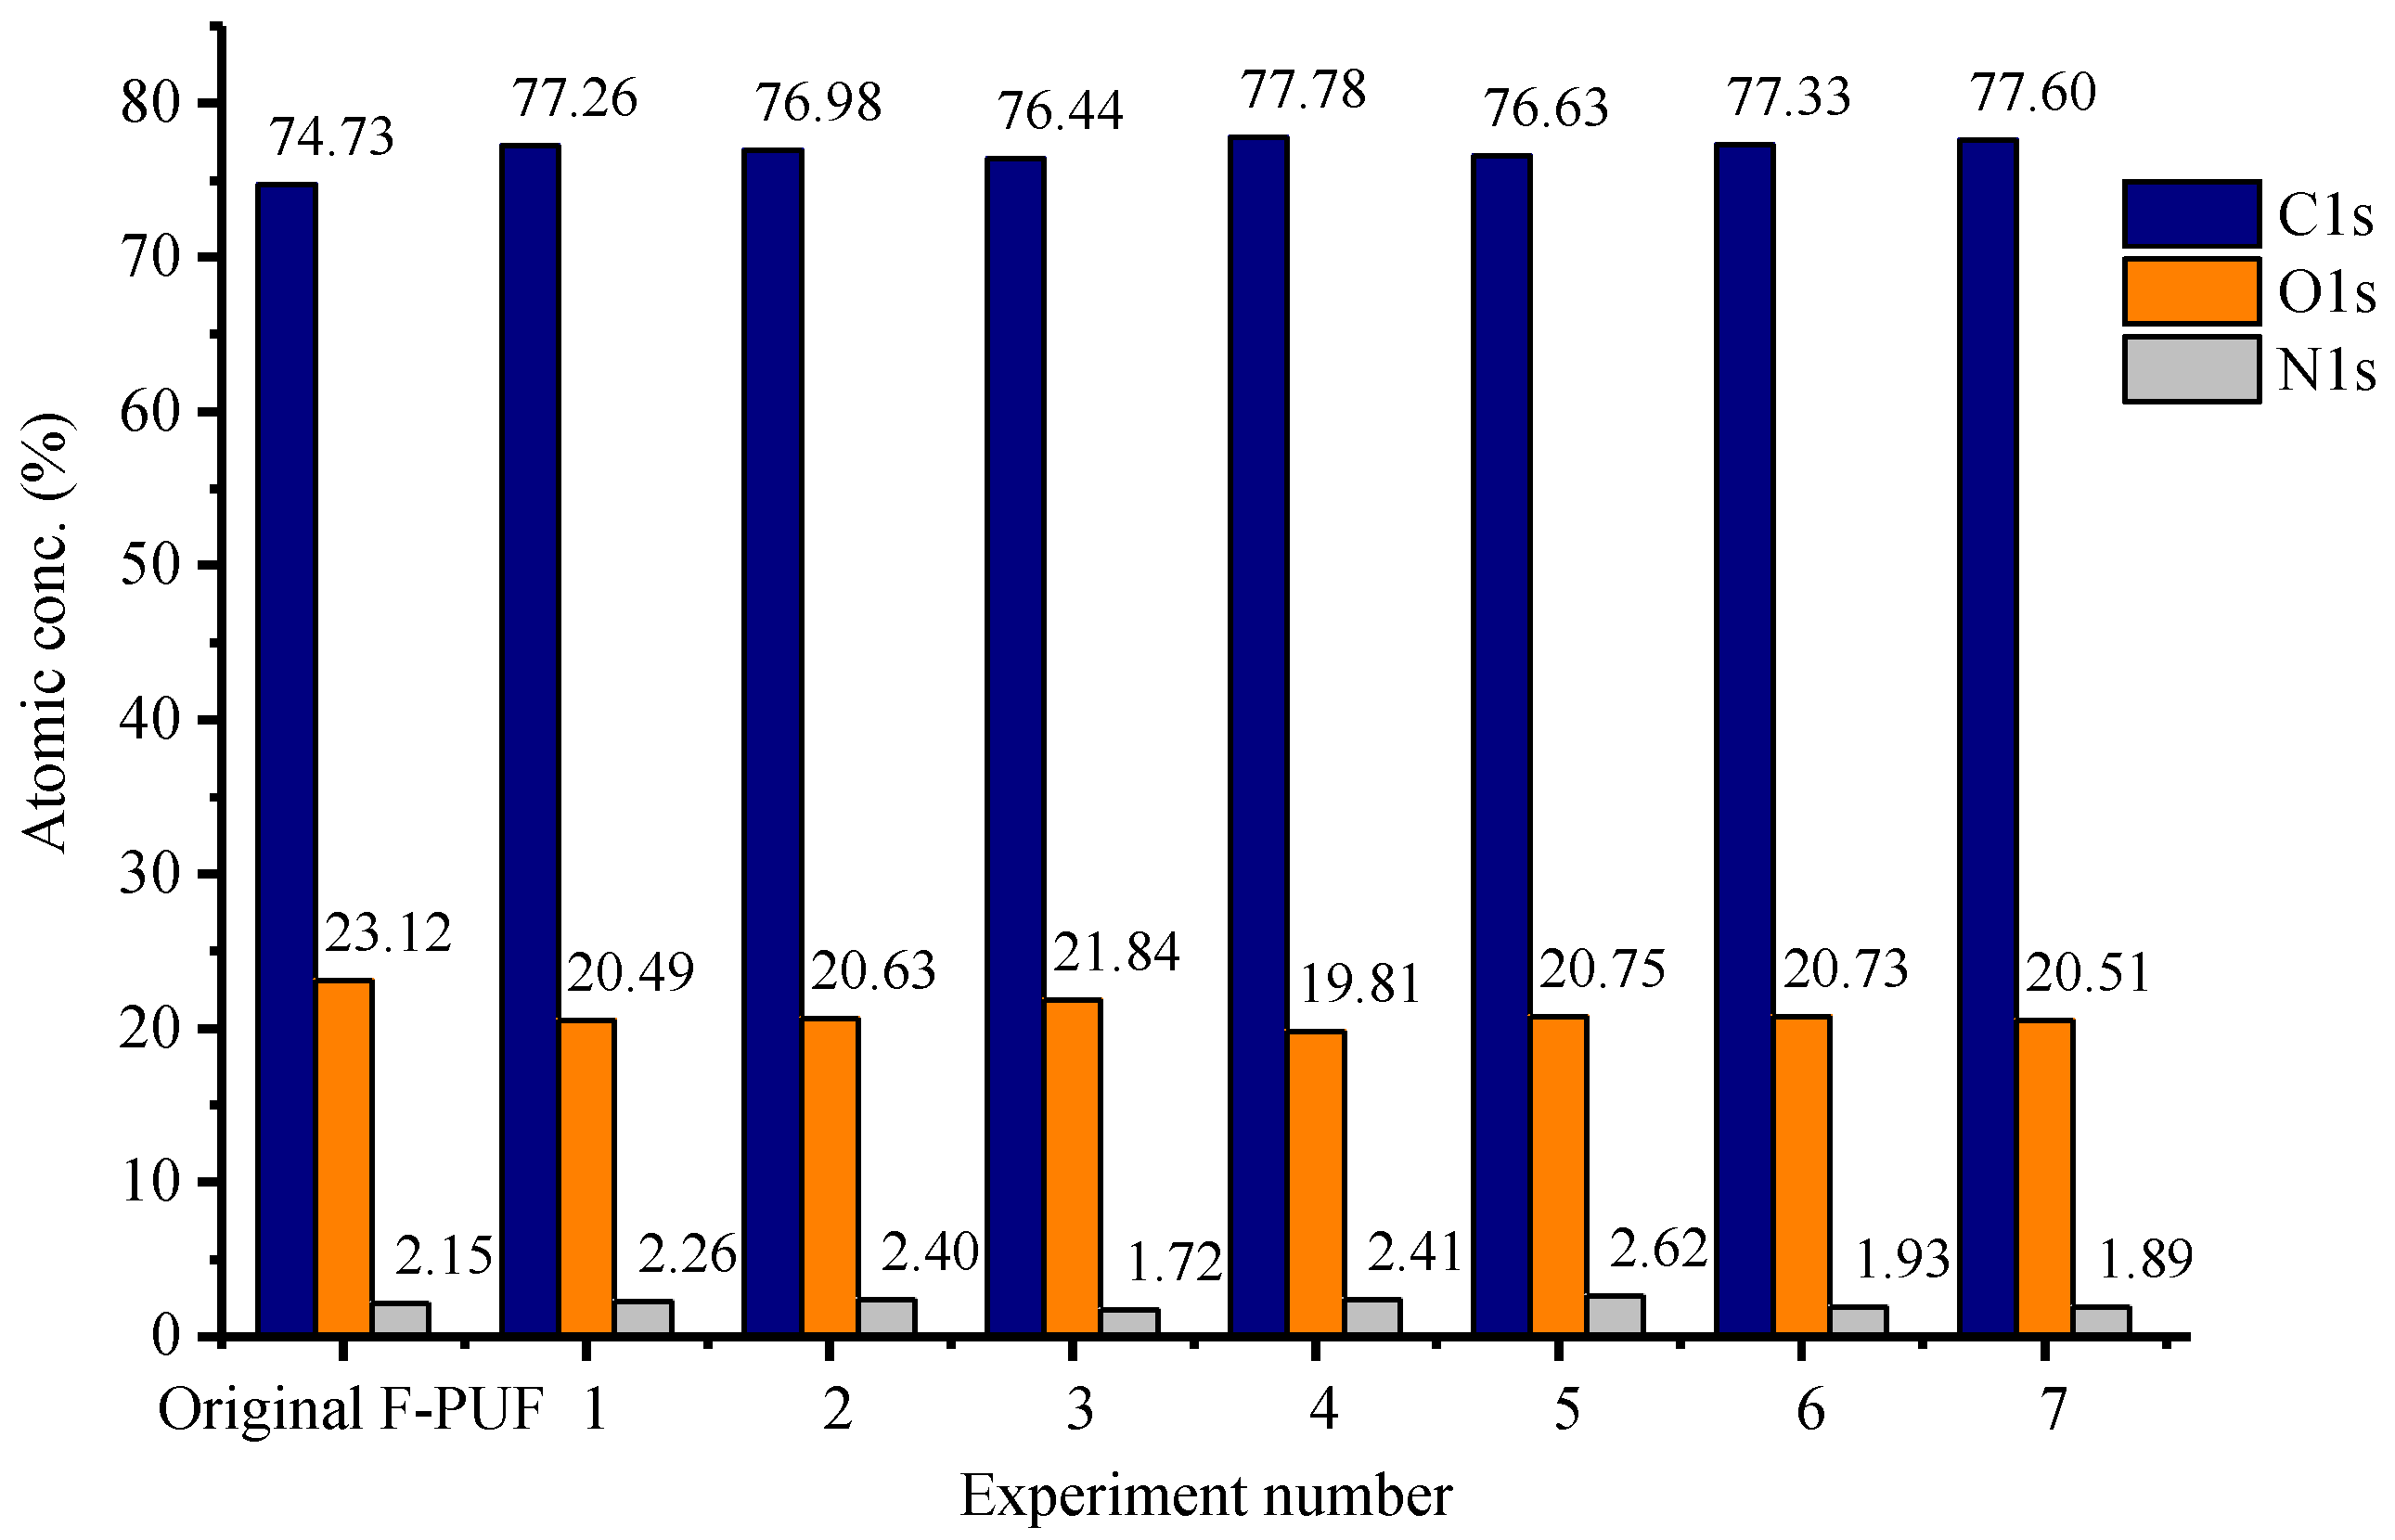
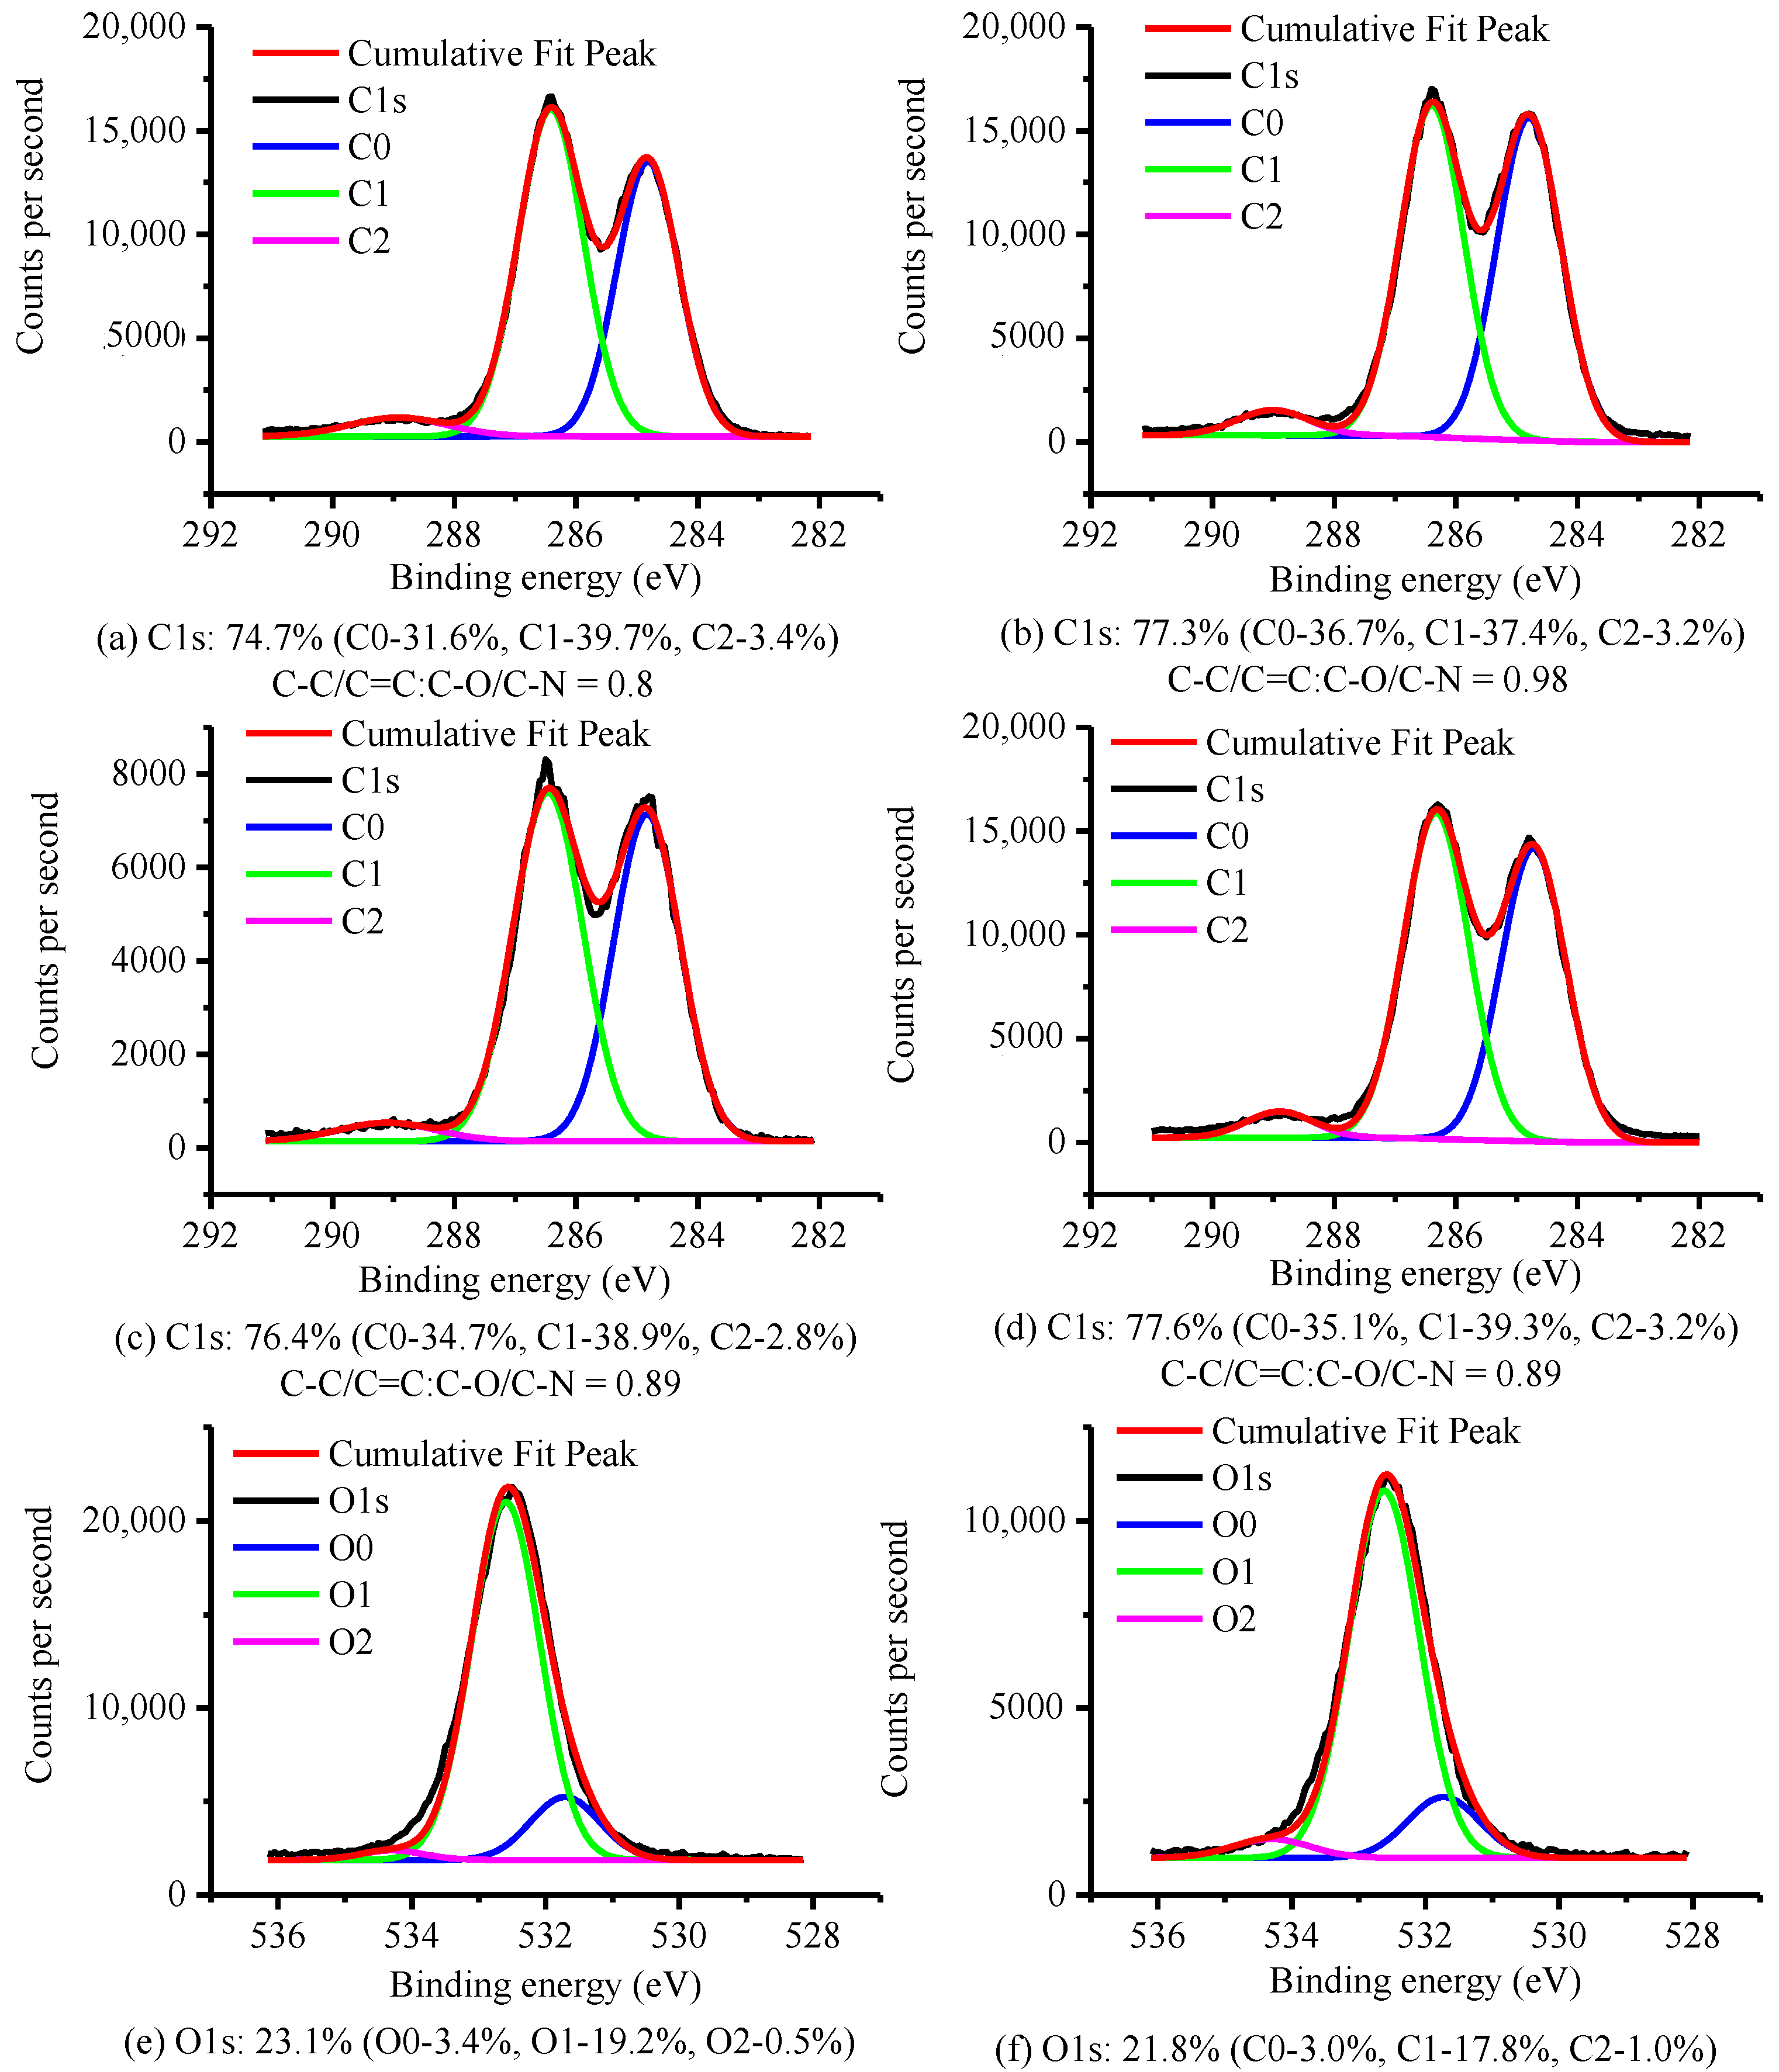
3.2.4. XPS Analysis
3.3. Properties of F-PUF Containing Powder
3.3.1. Morphologies
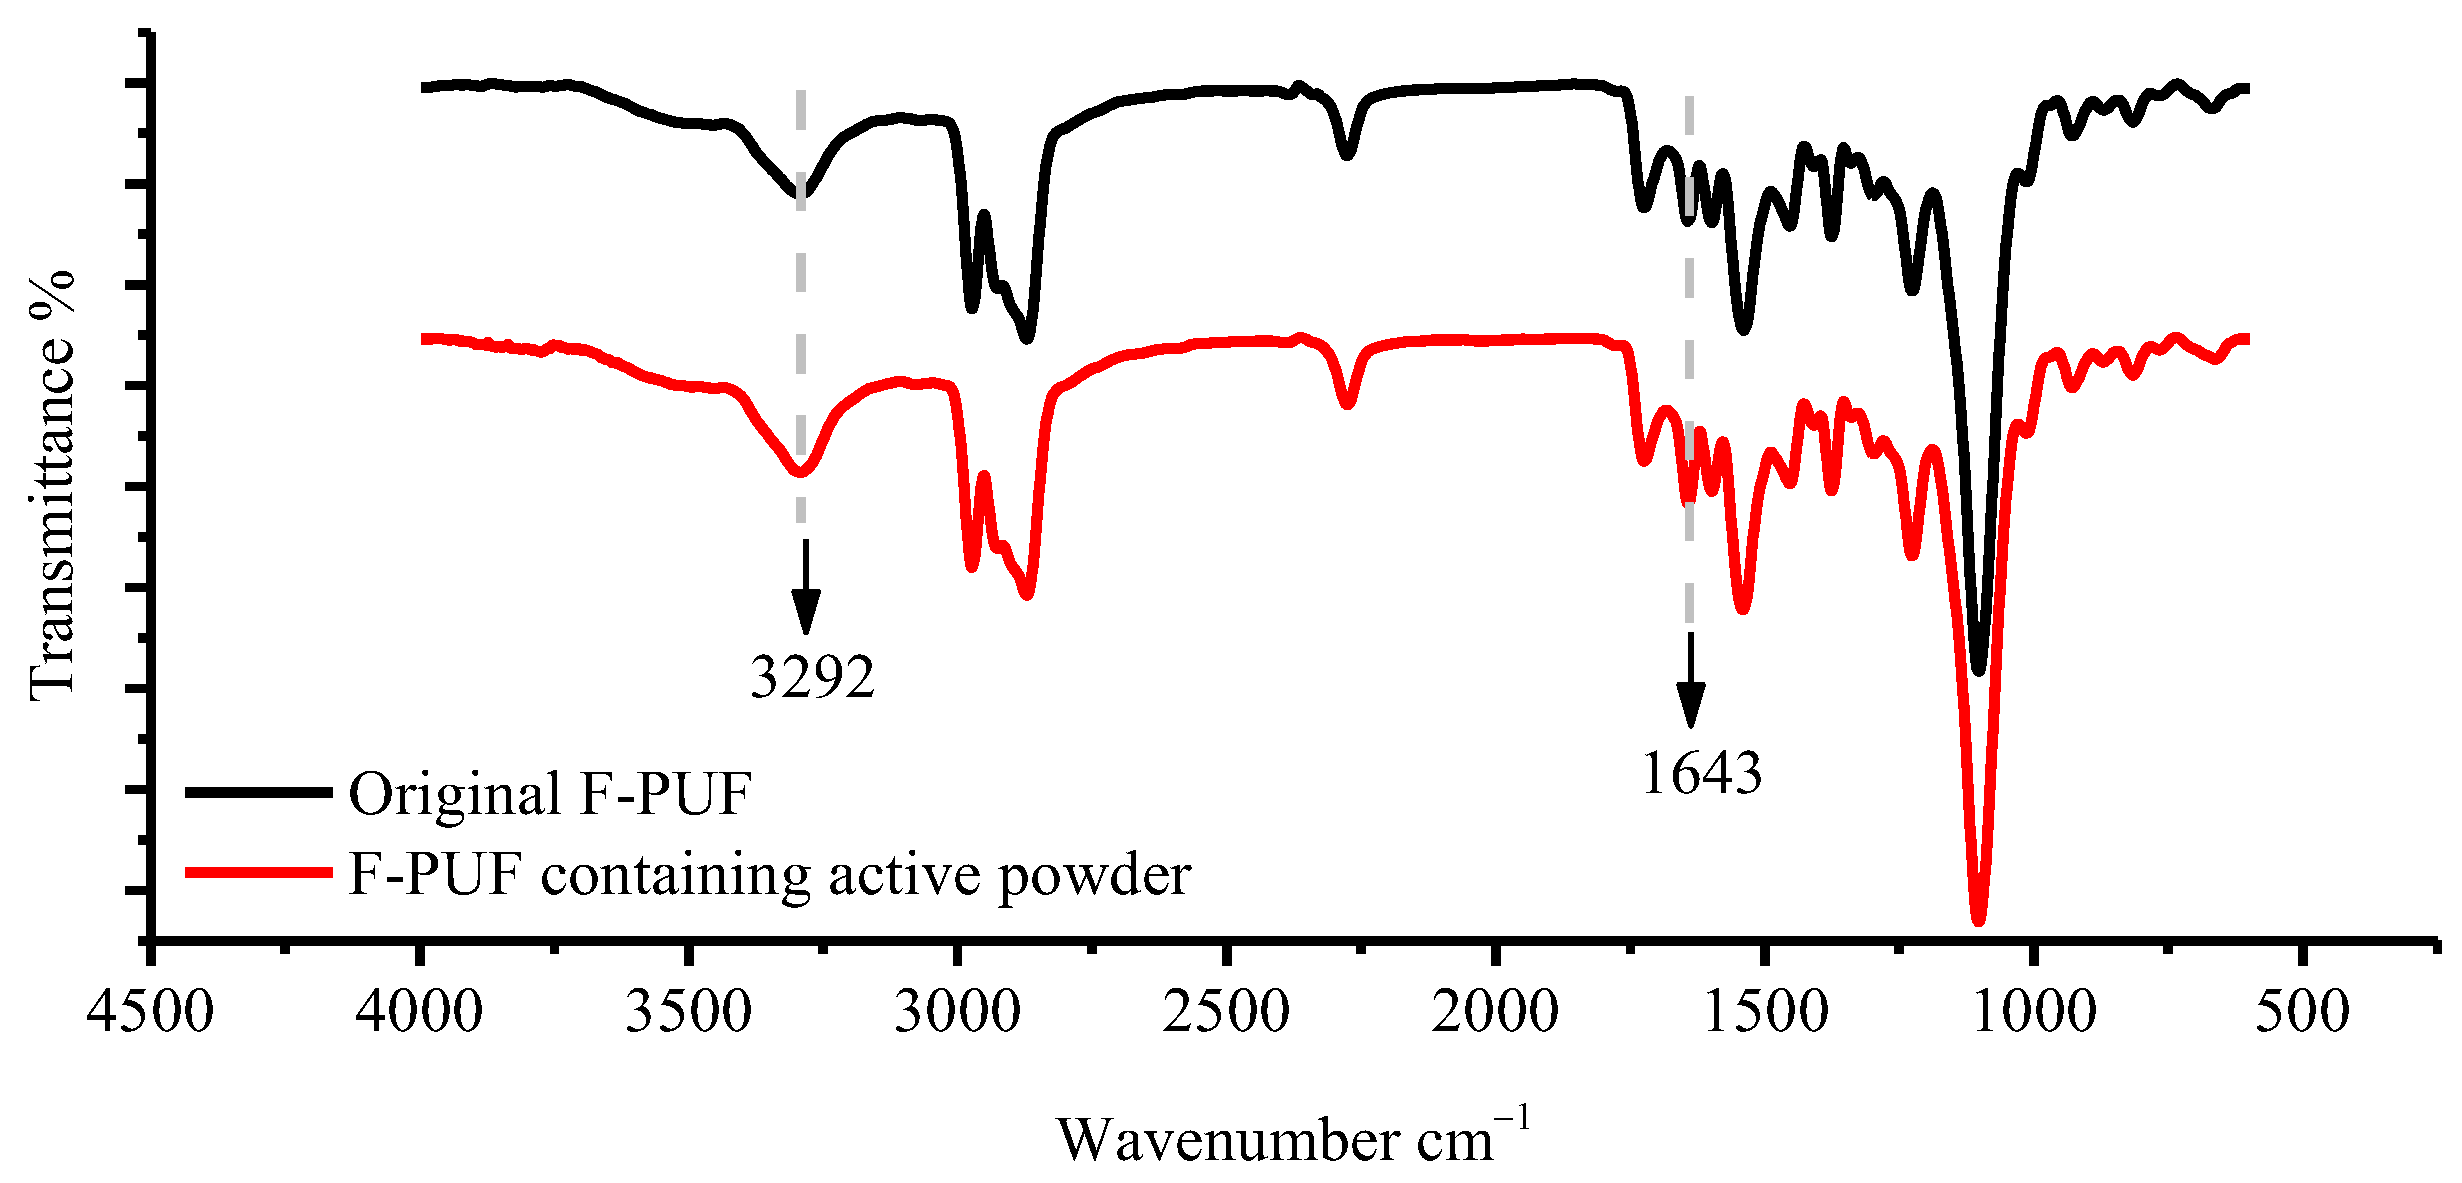
3.3.2. FTIR Analysis
3.3.3. Density, Resilience and Compression Set
4. Conclusions
Author Contributions
Funding
Data Availability Statement
Conflicts of Interest
References
- Eling, B.; Tomović, Ž.; Schädler, V. Current and future trends in polyurethanes: An industrial perspective. Macromol. Chem. Phys. 2020, 221, 2000114. [Google Scholar] [CrossRef]
- Deng, Y.; Dewil, R.; Appels, L.; Ansart, R.; Baeyens, J.; Kang, Q. Reviewing the thermo-chemical recycling of waste polyurethane foam. J. Environ. Manag. 2021, 278, 111527. [Google Scholar] [CrossRef] [PubMed]
- Kazemi, M.; Kabir, S.F.; Fini, E.H. State of the art in recycling waste thermoplastics and thermosets and their applications in construction. Resour. Conserv. Recycl. 2021, 174, 105776. [Google Scholar] [CrossRef]
- Peyrton, J.; Avérous, L. Structure-properties relationships of cellular materials from biobased polyurethane foams. Mater. Sci. Eng. R 2021, 145, 100608. [Google Scholar] [CrossRef]
- Simón, D.; Borreguero, A.M.; De Lucas, A.; Gutiérrez, C.; Rodríguez, J.F. Sustainable Polyurethanes: Chemical Recycling to Get It. In Environment, Energy and Climate Change I, 1st ed.; Jiménez, E., Cabañas, B., Lefebvre, G., Eds.; Springer: Cham, Switzerland, 2014; Volume 32, pp. 229–260. [Google Scholar] [CrossRef]
- Modesti, M.; Costantini, F.; dal Lago, E.; Piovesan, F.; Roso, M.; Boaretti, C.; Lorenzetti, A. Valuable secondary raw material by chemical recycling of polyisocyanurate foams. Polym. Degrad. Stab. 2018, 156, 151–160. [Google Scholar] [CrossRef]
- Beran, R.; Zárybnická, L.; Machová, D.; Večeřa, M.; Kalenda, P. Wood adhesives from waste-free recycling depolymerisation of flexible polyurethane foams. J. Clean. Prod. 2021, 305, 27142. [Google Scholar] [CrossRef]
- Kairytė, A.; Kirpluks, M.; Ivdre, A.; Cabulis, U.; Vaitkus, S.; Pundienė, I. Cleaner production of polyurethane foam: Replacement of conventional raw materials, assessment of fire resistance and environmental impact. J. Clean. Prod. 2018, 183, 760–771. [Google Scholar] [CrossRef]
- Günther, M.; Lorenzetti, A.; Schartel, B. Fire phenomena of rigid polyurethane foams. Polymers 2018, 10, 1166. [Google Scholar] [CrossRef]
- Wang, Y.; Song, H.; Ge, H.; Wang, J.; Wang, Y.; Jia, S.; Deng, T.; Hou, X. Controllable degradation of polyurethane elastomer via selective cleavage of C-O and C-N bonds. J. Clean. Prod. 2018, 176, 873–879. [Google Scholar] [CrossRef]
- Kemona, A.; Piotrowska, M. Polyurethane recycling and disposal: Methods and prospects. Polymers 2020, 12, 1752. [Google Scholar] [CrossRef]
- Gama, N.V.; Godinho, B.; Marques, G.; Silva, R.; Barros-Timmons, A.; Ferreira, A. Recycling of polyurethane scraps via acidolysis. Chem. Eng. J. 2020, 395, 125102. [Google Scholar] [CrossRef]
- Yang, W.; Dong, Q.; Liu, S.; Xie, H.; Liu, L.; Li, J. Recycling and disposal methods for polyurethane foam wastes. Procedia Environ. Sci. 2012, 16, 167–175. [Google Scholar] [CrossRef]
- Simón, D.; Rodríguez, J.F.; Carmona, M.; Serrano, A.; Borreguero, A.M. Glycolysis of advanced polyurethanes composites containing thermoregulating microcapsules. Chem. Eng. J. 2018, 350, 300–311. [Google Scholar] [CrossRef]
- Simón, D.; Borreguero, A.M.; De Lucas, A.; Rodríguez, J.F. Glycolysis of flexible polyurethane wastes containing polymeric polyols. Polym. Degrad. Stab. 2014, 109, 115–121. [Google Scholar] [CrossRef]
- Calvo-Correas, T.; Ugarte, L.; Trzebiatowska, P.J.; Sanzberro, R.; Datta, J.; Corcuera, M.Á.; Eceiza, A. Thermoplastic polyurethanes with glycolysate intermediates from polyurethane waste recycling. Polym. Degrad. Stab. 2017, 144, 411–419. [Google Scholar] [CrossRef]
- Simón, D.; Borreguero, A.M.; De Lucas, A.; Rodríguez, J.F. Recycling of polyurethanes from laboratory to industry, a journey towards the sustainability. Waste Manag. 2018, 76, 147–171. [Google Scholar] [CrossRef]
- Gama, N.V.; Ferreira, A.; Barros-Timmons, A. Polyurethane foams: Past, present, and future. Materials 2018, 11, 1841. [Google Scholar] [CrossRef]
- Durand-Silva, A.; Smaldone, R.A. Recycling the unrecyclable with dynamic covalent chemistry. ACS Cent. Sci. 2020, 6, 836–838. [Google Scholar] [CrossRef]
- Zevenhoven, R. Treatment and Disposal of Polyurethane Wastes: Options for Recovery and Recycling, 1st ed.; Helsinki University of Technology: Espoo, Finland, 2004; pp. 25–29. Available online: http://users.abo.fi/rzevenho/tkk-eny-19.pdf (accessed on 28 August 2022).
- Mark, F.E.; Kamprath, A. Recycling & Recovery Options for PU Seating Material: A Joint Study of ISOPA/Euro-Moulders. SAE Tech. Pap. Ser. 2000, 1, 1514. [Google Scholar] [CrossRef]
- Zia, K.M.; Bhatti, H.N.; Bhatti, I.A. Methods for polyurethane and polyurethane composites, recycling and recovery: A review. React. Funct. Polym. 2007, 67, 675–692. [Google Scholar] [CrossRef]
- Hulme, A.J.; Goodhead, T.C. Cost effective reprocessing of polyurethane by hot compression moulding. J. Mater. Process. Technol. 2003, 139, 322–326. [Google Scholar] [CrossRef]
- Chen, S.; Wang, F.; Peng, Y.; Chen, T.; Wu, Q.; Sun, P. A Single Molecular Diels–Alder Crosslinker for Achieving Recyclable Cross-Linked Polymers. Macromol. Rapid Commun. 2015, 36, 1687–1692. [Google Scholar] [CrossRef]
- Mao, A.; Shmulsky, R.; Li, Q.; Wan, H. Recycling polyurethane materials: A comparison of polyol from glycolysis with micronized polyurethane powder in particleboard applications. BioResources 2014, 9, 4253–4265. [Google Scholar] [CrossRef]
- Nikje, M.M.A.; Garmarudi, A.B.; Idris, A.B. Polyurethane waste reduction and recycling: From bench to pilot scales. Des. Monomers Polym. 2011, 14, 395–421. [Google Scholar] [CrossRef]
- Datta, J.; Głowińska, E.; Włoch, M. Mechanical Recycling via Regrinding, Rebonding, Adhesive Pressing, and Molding. In Recycling of Polyurethane Foams, 1st ed.; Sabus, T., Ajay, V.R., Krishnan, K., Abitha, V.K., Martin, G.T., Eds.; William Andrew Publishing: New York, NY, USA, 2018; pp. 57–65. [Google Scholar] [CrossRef]
- Beran, R.; Zarybnicka, L.; Machova, D. Recycling of rigid polyurethane foam: Micro-milled powder used as active filler in polyurethane adhesives. J. Appl. Polym. Sci. 2020, 137, 49095. [Google Scholar] [CrossRef]
- Prisacariu, C.; Scortanu, E. Sensitivity to the physical and chemical structure of hard-segment-reinforced polyurethane elastomers with variable percentage of hydrogen bonding. J. Appl. Polym. Sci. 2011, 122, 3544–3550. [Google Scholar] [CrossRef]
- Gajewski, V.J.R.W. Chemical degradation of polyurethane. Rubber World 1990, 202, 15–18. [Google Scholar]
- Vale, M.; Mateus, M.M.; dos Santos, R.G.; De Castro, C.N.; De Schrijver, A.; Bordado, J.C.; Marques, A.C. Replacement of petroleum-derived diols by sustainable biopolyols in one component polyurethane foams. J. Clean. Prod. 2019, 212, 1036–1043. [Google Scholar] [CrossRef]
- Harris, D.J.; Assink, R.A.; Celina, M. NMR analysis of oxidatively aged HTPB/IPDI polyurethane rubber: Degradation products, dynamics, and heterogeneity. Macromolecules 2001, 34, 6695–6700. [Google Scholar] [CrossRef]
- Pellizzi, E.; Lattuati-Derieux, A.; Lavédrine, B.; Cheradame, H. Degradation of polyurethane ester foam artifacts: Chemical properties, mechanical properties and comparison between accelerated and natural degradation. Polym. Degrad. Stab. 2014, 107, 255–261. [Google Scholar] [CrossRef]
- Li, Y.; Li, J.; Ma, S.; Luo, Y. Different catalytic systems on hydroxyl-terminated GAP and PET with poly-isocyanate: Curing kinetics study using dynamic in situ IR spectroscopy. Int. J. Polym. Anal. Charact. 2016, 21, 495–503. [Google Scholar] [CrossRef]
- Jagodzińska, K.; Garcia-Lopez, C.; Yang, W.; Jönsson, P.G.; Pretz, T.; Raulf, K. Characterisation of excavated landfill waste fractions to evaluate the energy recovery potential using Py-GC/MS and ICP techniques. Resour. Conserv. Recycl. 2021, 168, 105446. [Google Scholar] [CrossRef]
- Sportelli, M.C.; Picca, R.A.; Ronco, R.; Bonerba, E.; Tantillo, G.; Pollini, M.; Sannino, A.; Valentini, A.; Cataldi, T.R.I.; Cioffi, N. Investigation of industrial polyurethane foams modified with antimicrobial copper nanoparticles. Materials 2016, 9, 544. [Google Scholar] [CrossRef] [PubMed]
- He, M.; Gu, K.; Wang, Y.; Li, Z.; Shen, Z.; Liu, S.; Wei, J. Development of high-performance thermoplastic composites based on polyurethane and ground tire rubber by in-situ synthesis. Resour. Conserv. Recycl. 2021, 173, 105713. [Google Scholar] [CrossRef]
- Tanobe, V.O.A.; Sydenstricker, T.H.D.; Amico, S.C.; Vargas, J.V.C.; Zawadzki, S.F. Evaluation of flexible postconsumed polyurethane foams modified by polystyrene grafting as sorbent material for oil spills. J. Appl. Polym. Sci. 2009, 111, 1842–1849. [Google Scholar] [CrossRef]
- Hu, G.; Sun, Y.; Xie, Y.; Wu, S.; Zhang, X.; Zhuang, J.; Hu, C.; Lei, B.; Liu, Y. Synthesis of silicon quantum dots with highly efficient full-band UV absorption and their applications in antiyellowing and resistance of photodegradation. ACS Appl. Mater. Interfaces 2019, 11, 6634–6643. [Google Scholar] [CrossRef]


| Component | Powder-Polyol Mixture | TDI | A33 | D19 | L618 | A1 | MC | Deionized Water |
|---|---|---|---|---|---|---|---|---|
| Mass Fraction (phr) | 100 | 32.8 | 0.3 | 0.17 | 1.2 | 0.05 | 10 | 2.2 |
| Experiment Number | Milling Cycles | Roller Temperature | VMD μm | Particle Temperature °C |
|---|---|---|---|---|
| 1 | 3 | Room temperature | 165.58 ± 2.58 | 70.0 ± 0.4 |
| 2 | 5 | Room temperature | 103.15 ± 2.33 | 76.1 ± 0.2 |
| 3 | 7 | Room temperature | 97.73 ± 2.06 | 79.3 ± 0.3 |
| 4 | 9 | Room temperature | 76.82 ± 3.06 | 78.0 ± 0.3 |
| 5 | 7 | 40 °C | 97.14 ± 2.13 | 80.5 ± 0.4 |
| 6 | 7 | 60 °C | 94.87 ± 1.55 | 85.5 ± 0.2 |
| 7 | 7 | 80 °C | 92.16 ± 1.03 | 93.2 ± 0.2 |
| Sample | Powder Content in Powder-Polyol Mixture% | Density Kg/m3 | Resilience % | Compression Set % |
|---|---|---|---|---|
| Powder prepared in Experiment 1 | 5 | 26.70 ± 0.21 | 48.46 ± 0.30 | 7.4 ± 0.3 |
| 10 | 26.14 ± 0.17 | 48.25 ± 0.41 | 7.7 ± 0.2 | |
| 15 | 28.32 ± 0.24 | 47.43 ± 0.32 | 7.9 ± 0.4 | |
| 20 | 28.72 ± 0.22 | 42.74 ± 0.43 | 8.4 ± 0.3 | |
| Powder prepared in Experiment 3 | 5 | 26.48 ± 0.12 | 50.08 ± 0.24 | 7.2 ± 0.4 |
| 10 | 25.12 ± 0.21 | 49.22 ± 0.22 | 7.5 ± 0.2 | |
| 15 | 25.26 ± 0.23 | 49.08 ± 0.27 | 7.8 ± 0.3 | |
| 20 | 25.47 ± 0.22 | 43.50 ± 0.33 | 8.2 ± 0.2 | |
| Powder prepared in Experiment 7 | 5 | 26.50 ± 0.18 | 50.43 ± 0.43 | 7.3 ± 0.3 |
| 10 | 26.10 ± 0.13 | 49.17 ± 0.25 | 7.7 ± 0.5 | |
| 15 | 25.80 ± 0.10 | 48.56 ± 0.42 | 7.9 ± 0.2 | |
| 20 | 25.26 ± 0.13 | 43.53 ± 0.35 | 8.3 ± 0.5 | |
| original F-PUF | 0 | 24.00 ± 0.20 | 50.00 ± 0.32 | 7.2 ± 0.2 |
Publisher’s Note: MDPI stays neutral with regard to jurisdictional claims in published maps and institutional affiliations. |
© 2022 by the authors. Licensee MDPI, Basel, Switzerland. This article is an open access article distributed under the terms and conditions of the Creative Commons Attribution (CC BY) license (https://creativecommons.org/licenses/by/4.0/).
Share and Cite
Guo, L.; Wang, W.; Guo, X.; Hao, K.; Liu, H.; Xu, Y.; Liu, G.; Guo, S.; Bai, L.; Ren, D.; et al. Recycling of Flexible Polyurethane Foams by Regrinding Scraps into Powder to Replace Polyol for Re-Foaming. Materials 2022, 15, 6047. https://doi.org/10.3390/ma15176047
Guo L, Wang W, Guo X, Hao K, Liu H, Xu Y, Liu G, Guo S, Bai L, Ren D, et al. Recycling of Flexible Polyurethane Foams by Regrinding Scraps into Powder to Replace Polyol for Re-Foaming. Materials. 2022; 15(17):6047. https://doi.org/10.3390/ma15176047
Chicago/Turabian StyleGuo, Lei, Wenchao Wang, Xiurui Guo, Kuanfa Hao, Haichao Liu, Yuan Xu, Gongxu Liu, Shouyun Guo, Lichen Bai, Donghui Ren, and et al. 2022. "Recycling of Flexible Polyurethane Foams by Regrinding Scraps into Powder to Replace Polyol for Re-Foaming" Materials 15, no. 17: 6047. https://doi.org/10.3390/ma15176047
APA StyleGuo, L., Wang, W., Guo, X., Hao, K., Liu, H., Xu, Y., Liu, G., Guo, S., Bai, L., Ren, D., & Liu, F. (2022). Recycling of Flexible Polyurethane Foams by Regrinding Scraps into Powder to Replace Polyol for Re-Foaming. Materials, 15(17), 6047. https://doi.org/10.3390/ma15176047