
Adsorption of Non-Steroidal Anti-Inflammatory Drugs on Alginate-Carbon Composites—Equilibrium and Kinetics

Abstract
:1. Introduction
2. Materials and Methods
2.1. Chemicals
2.2. Material Preparation
2.3. Methods
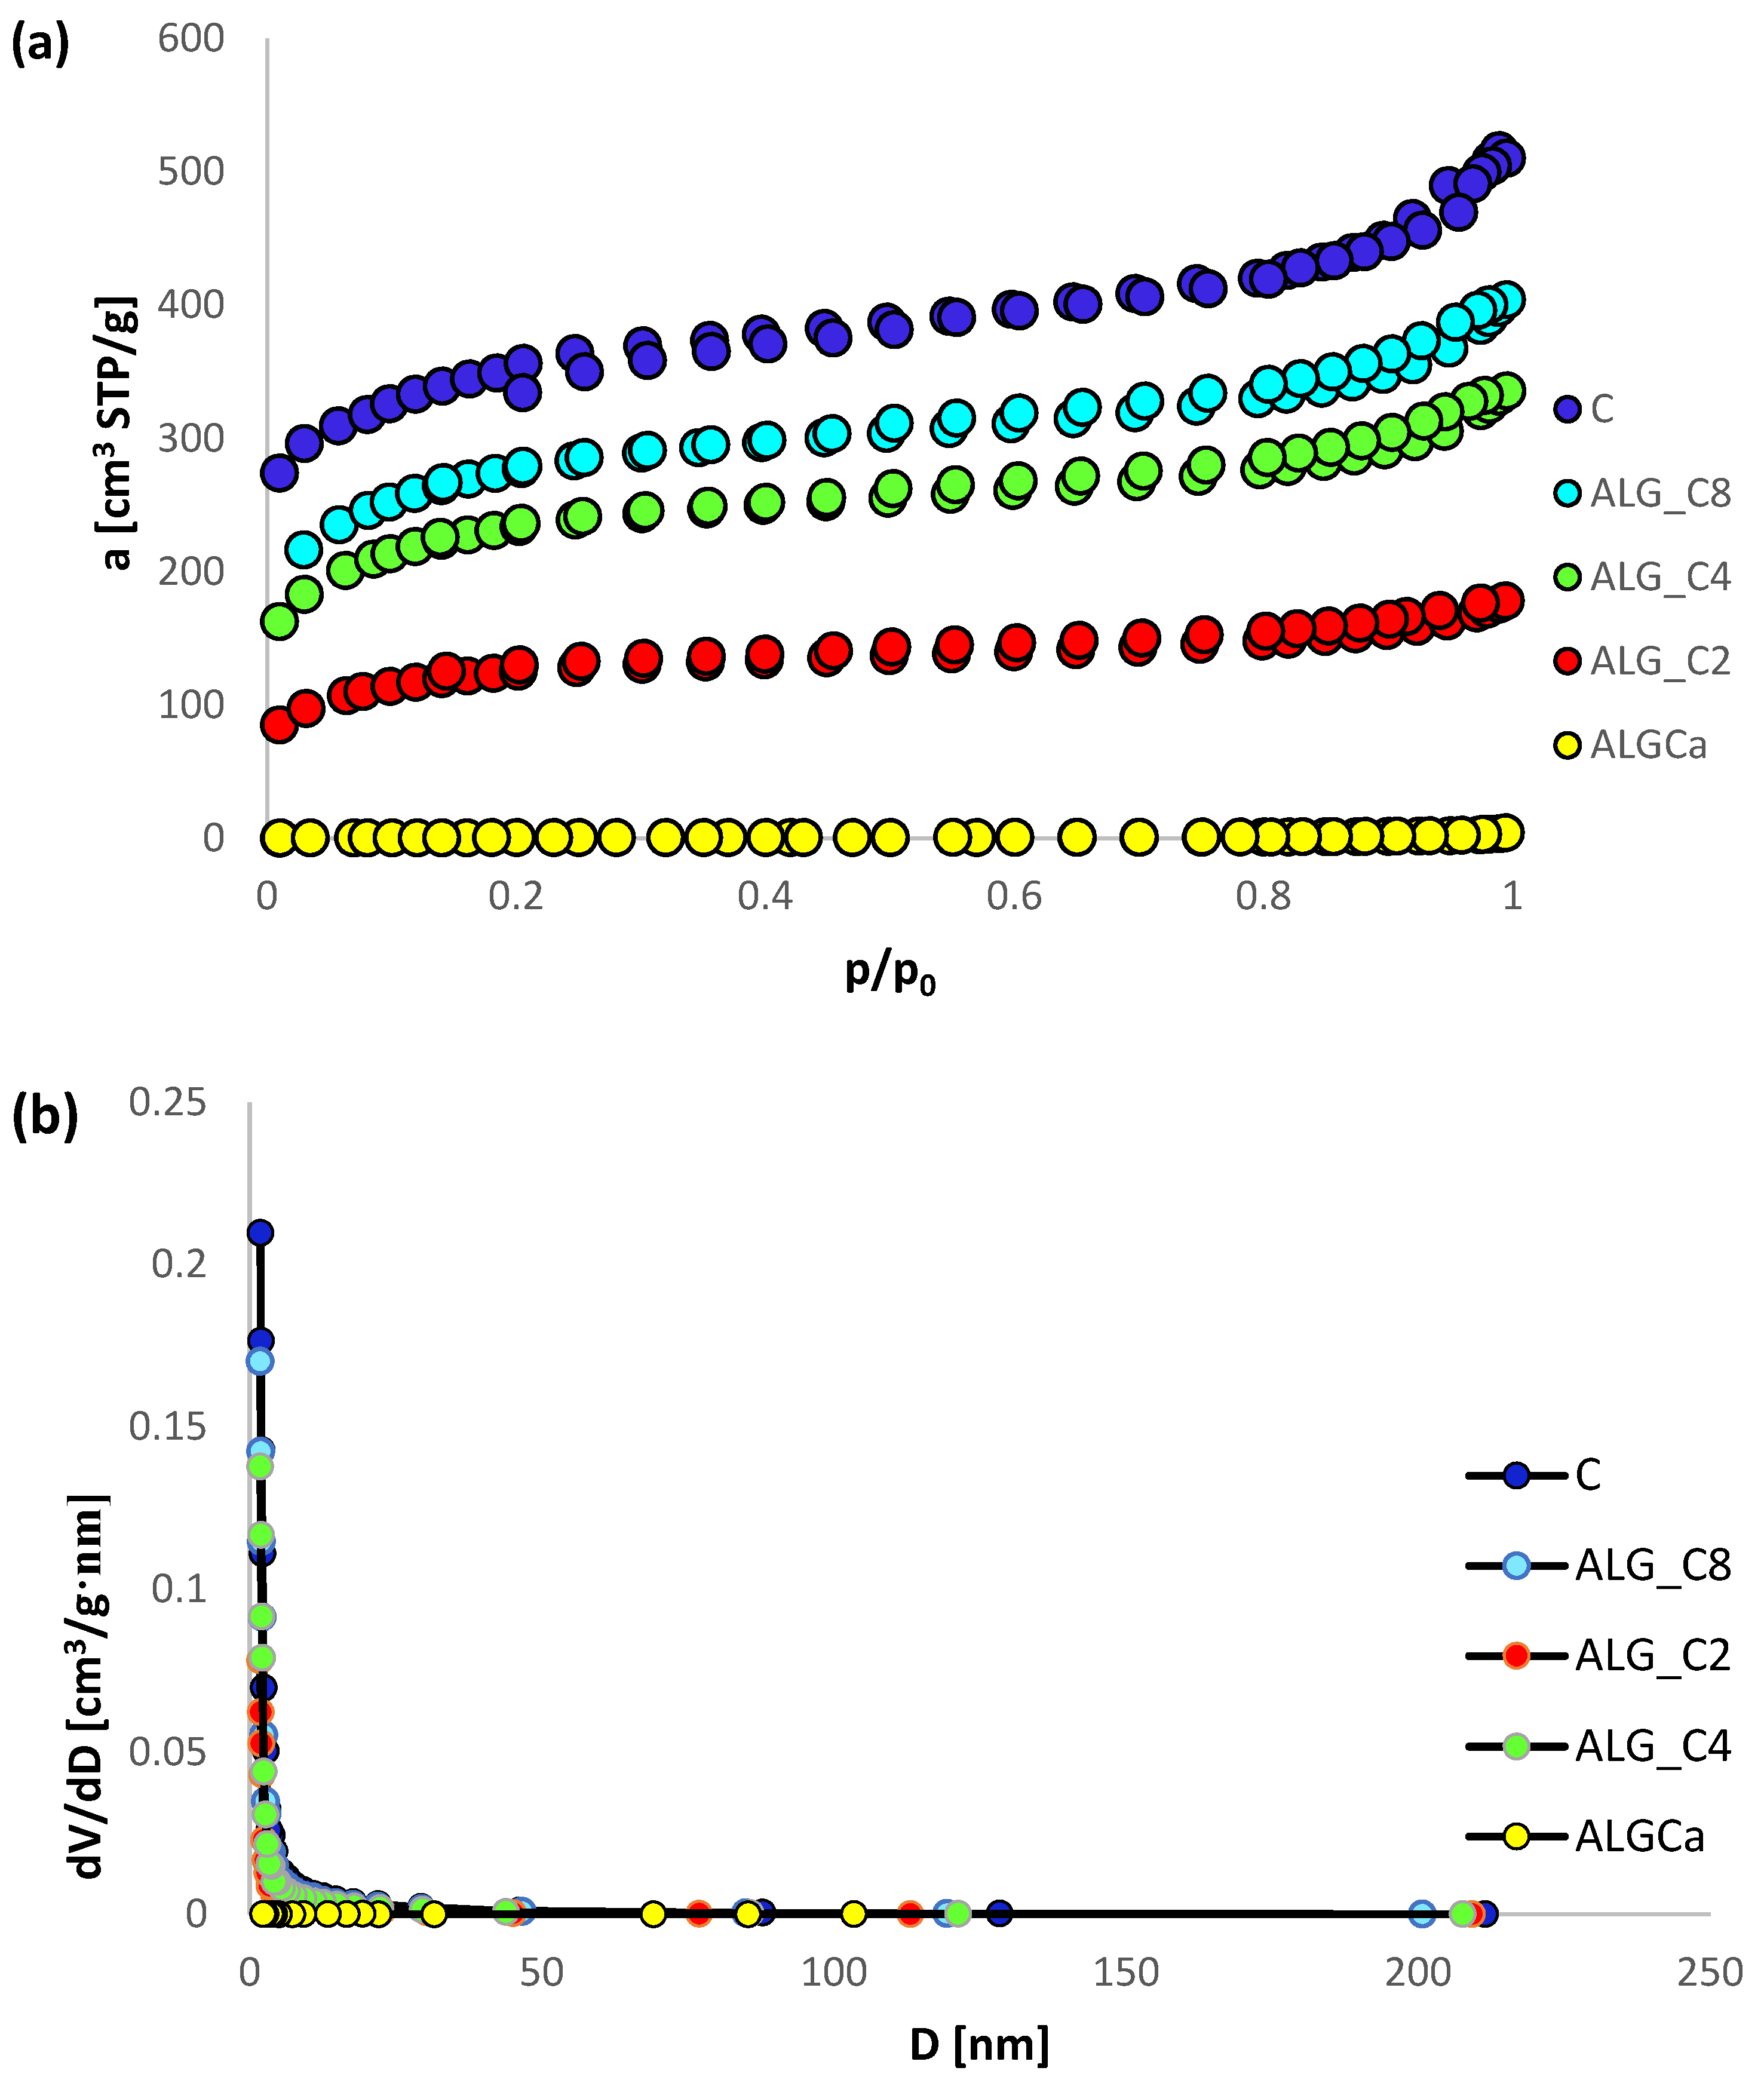
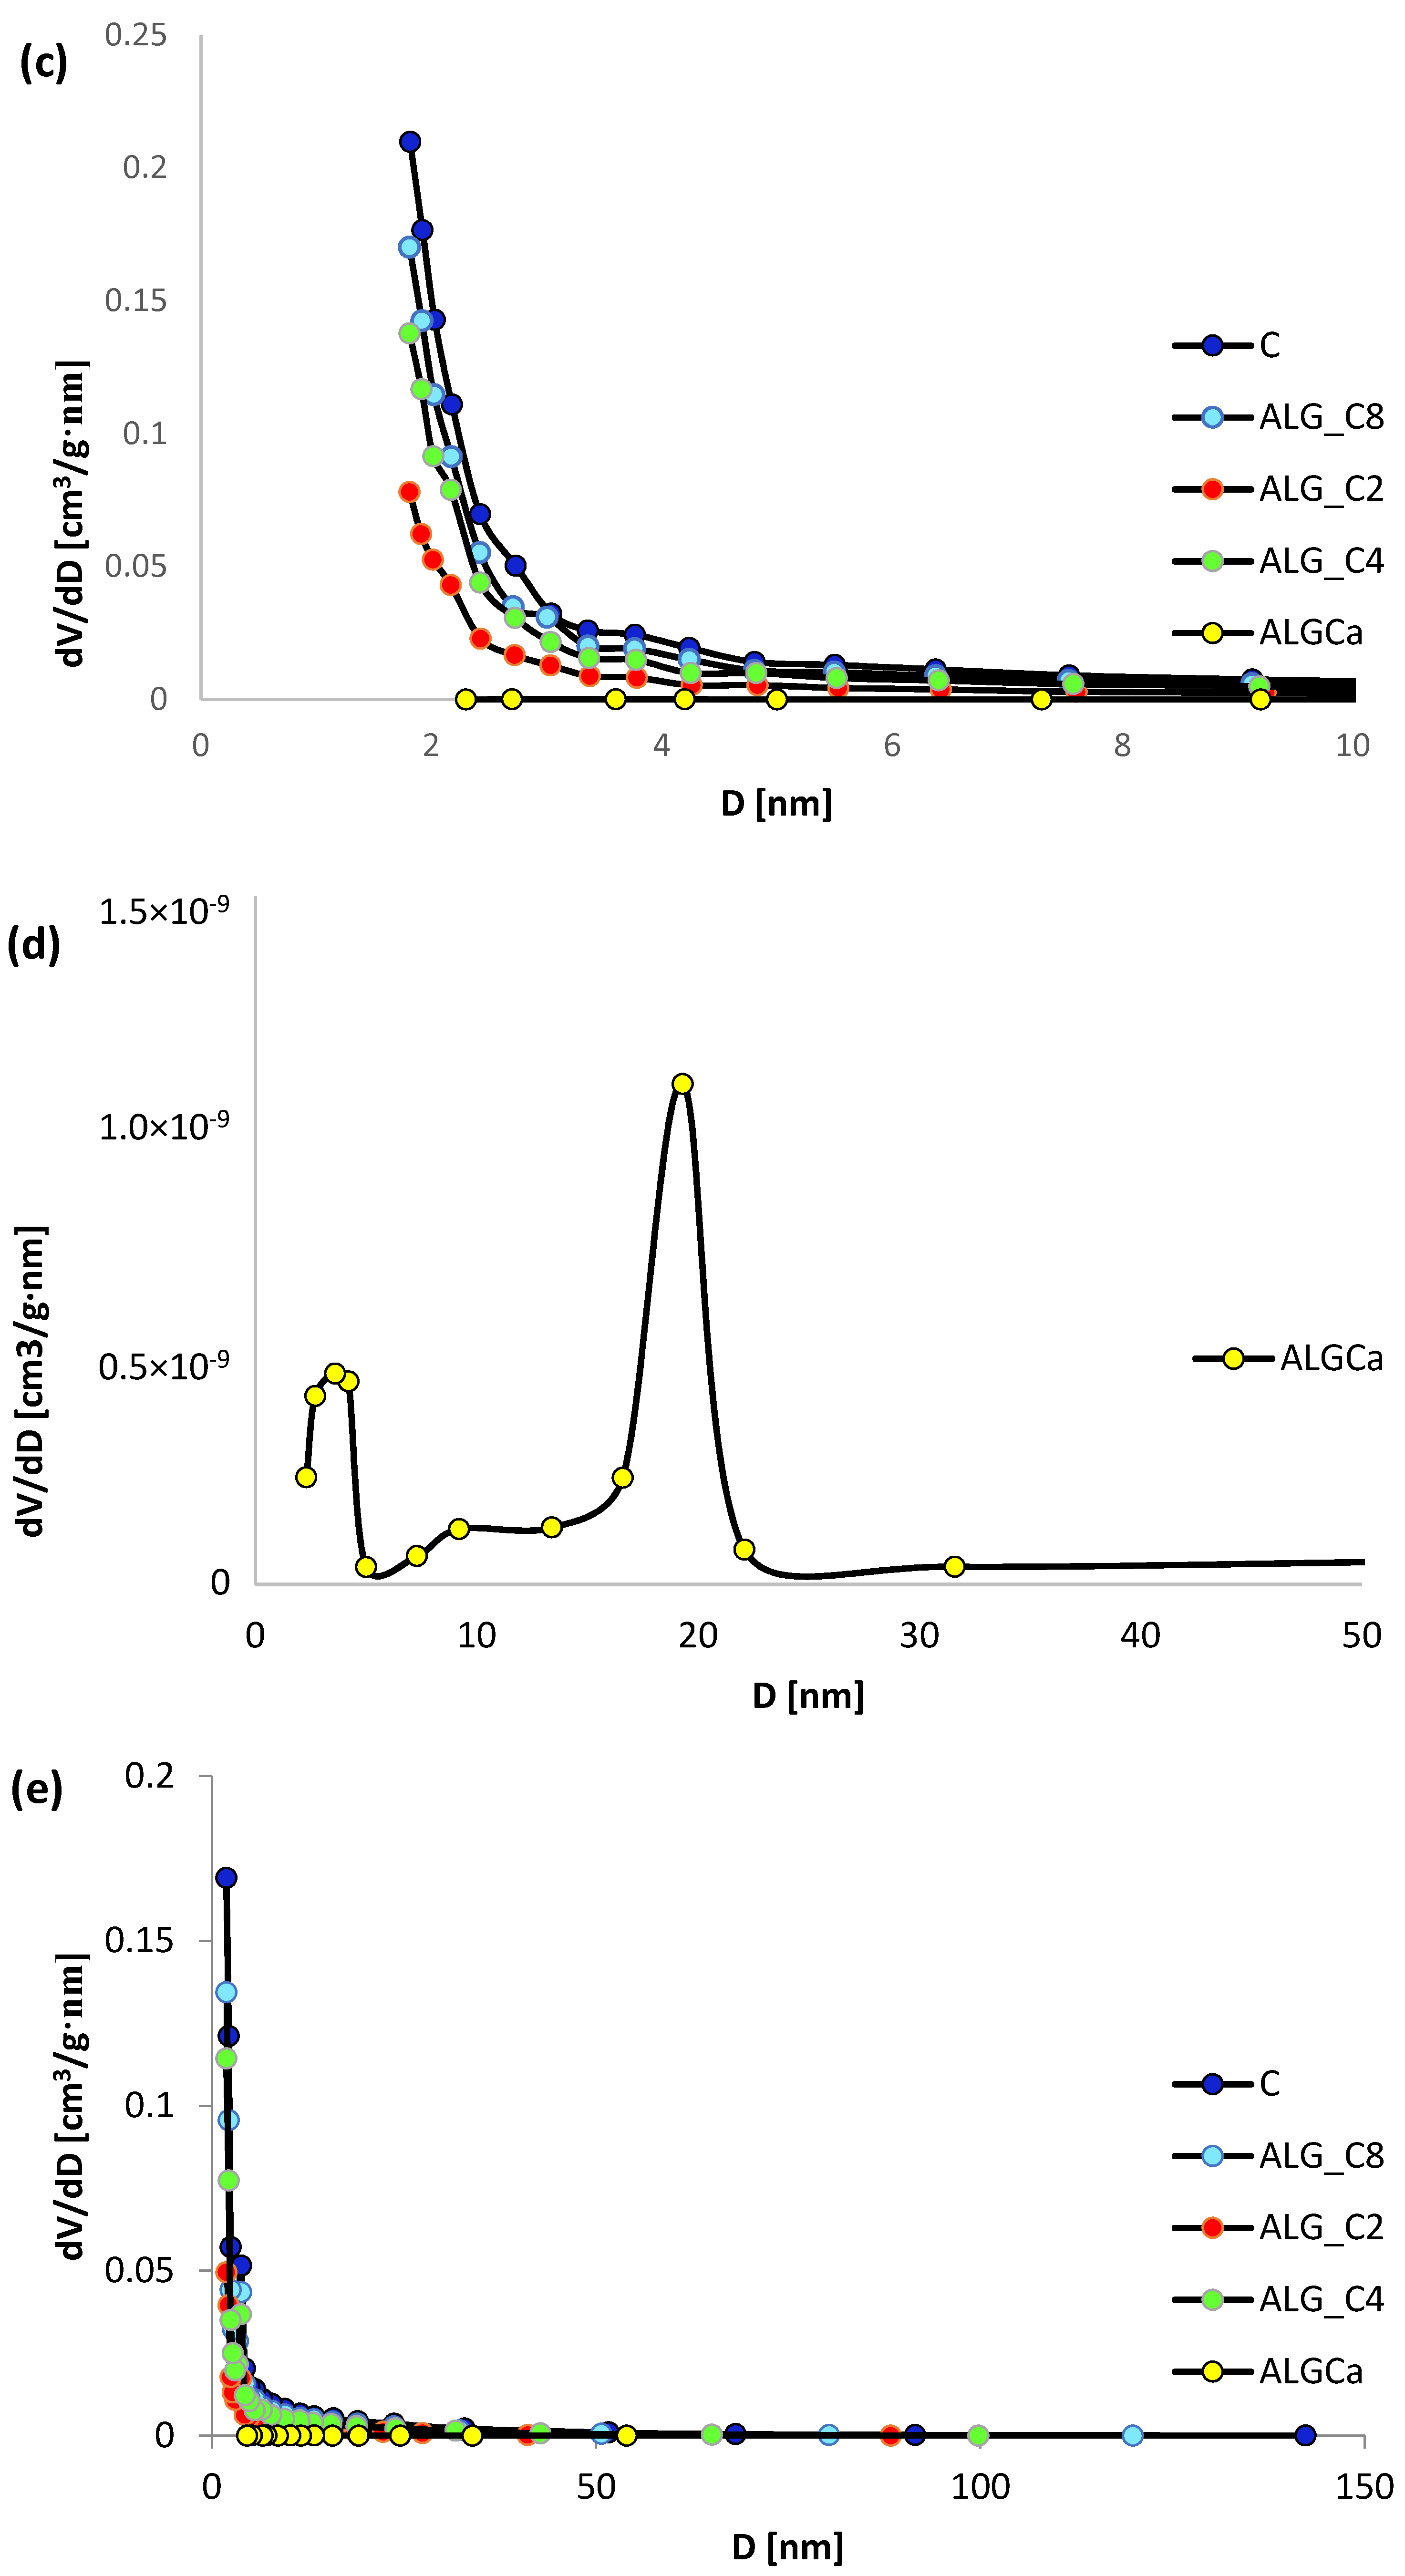
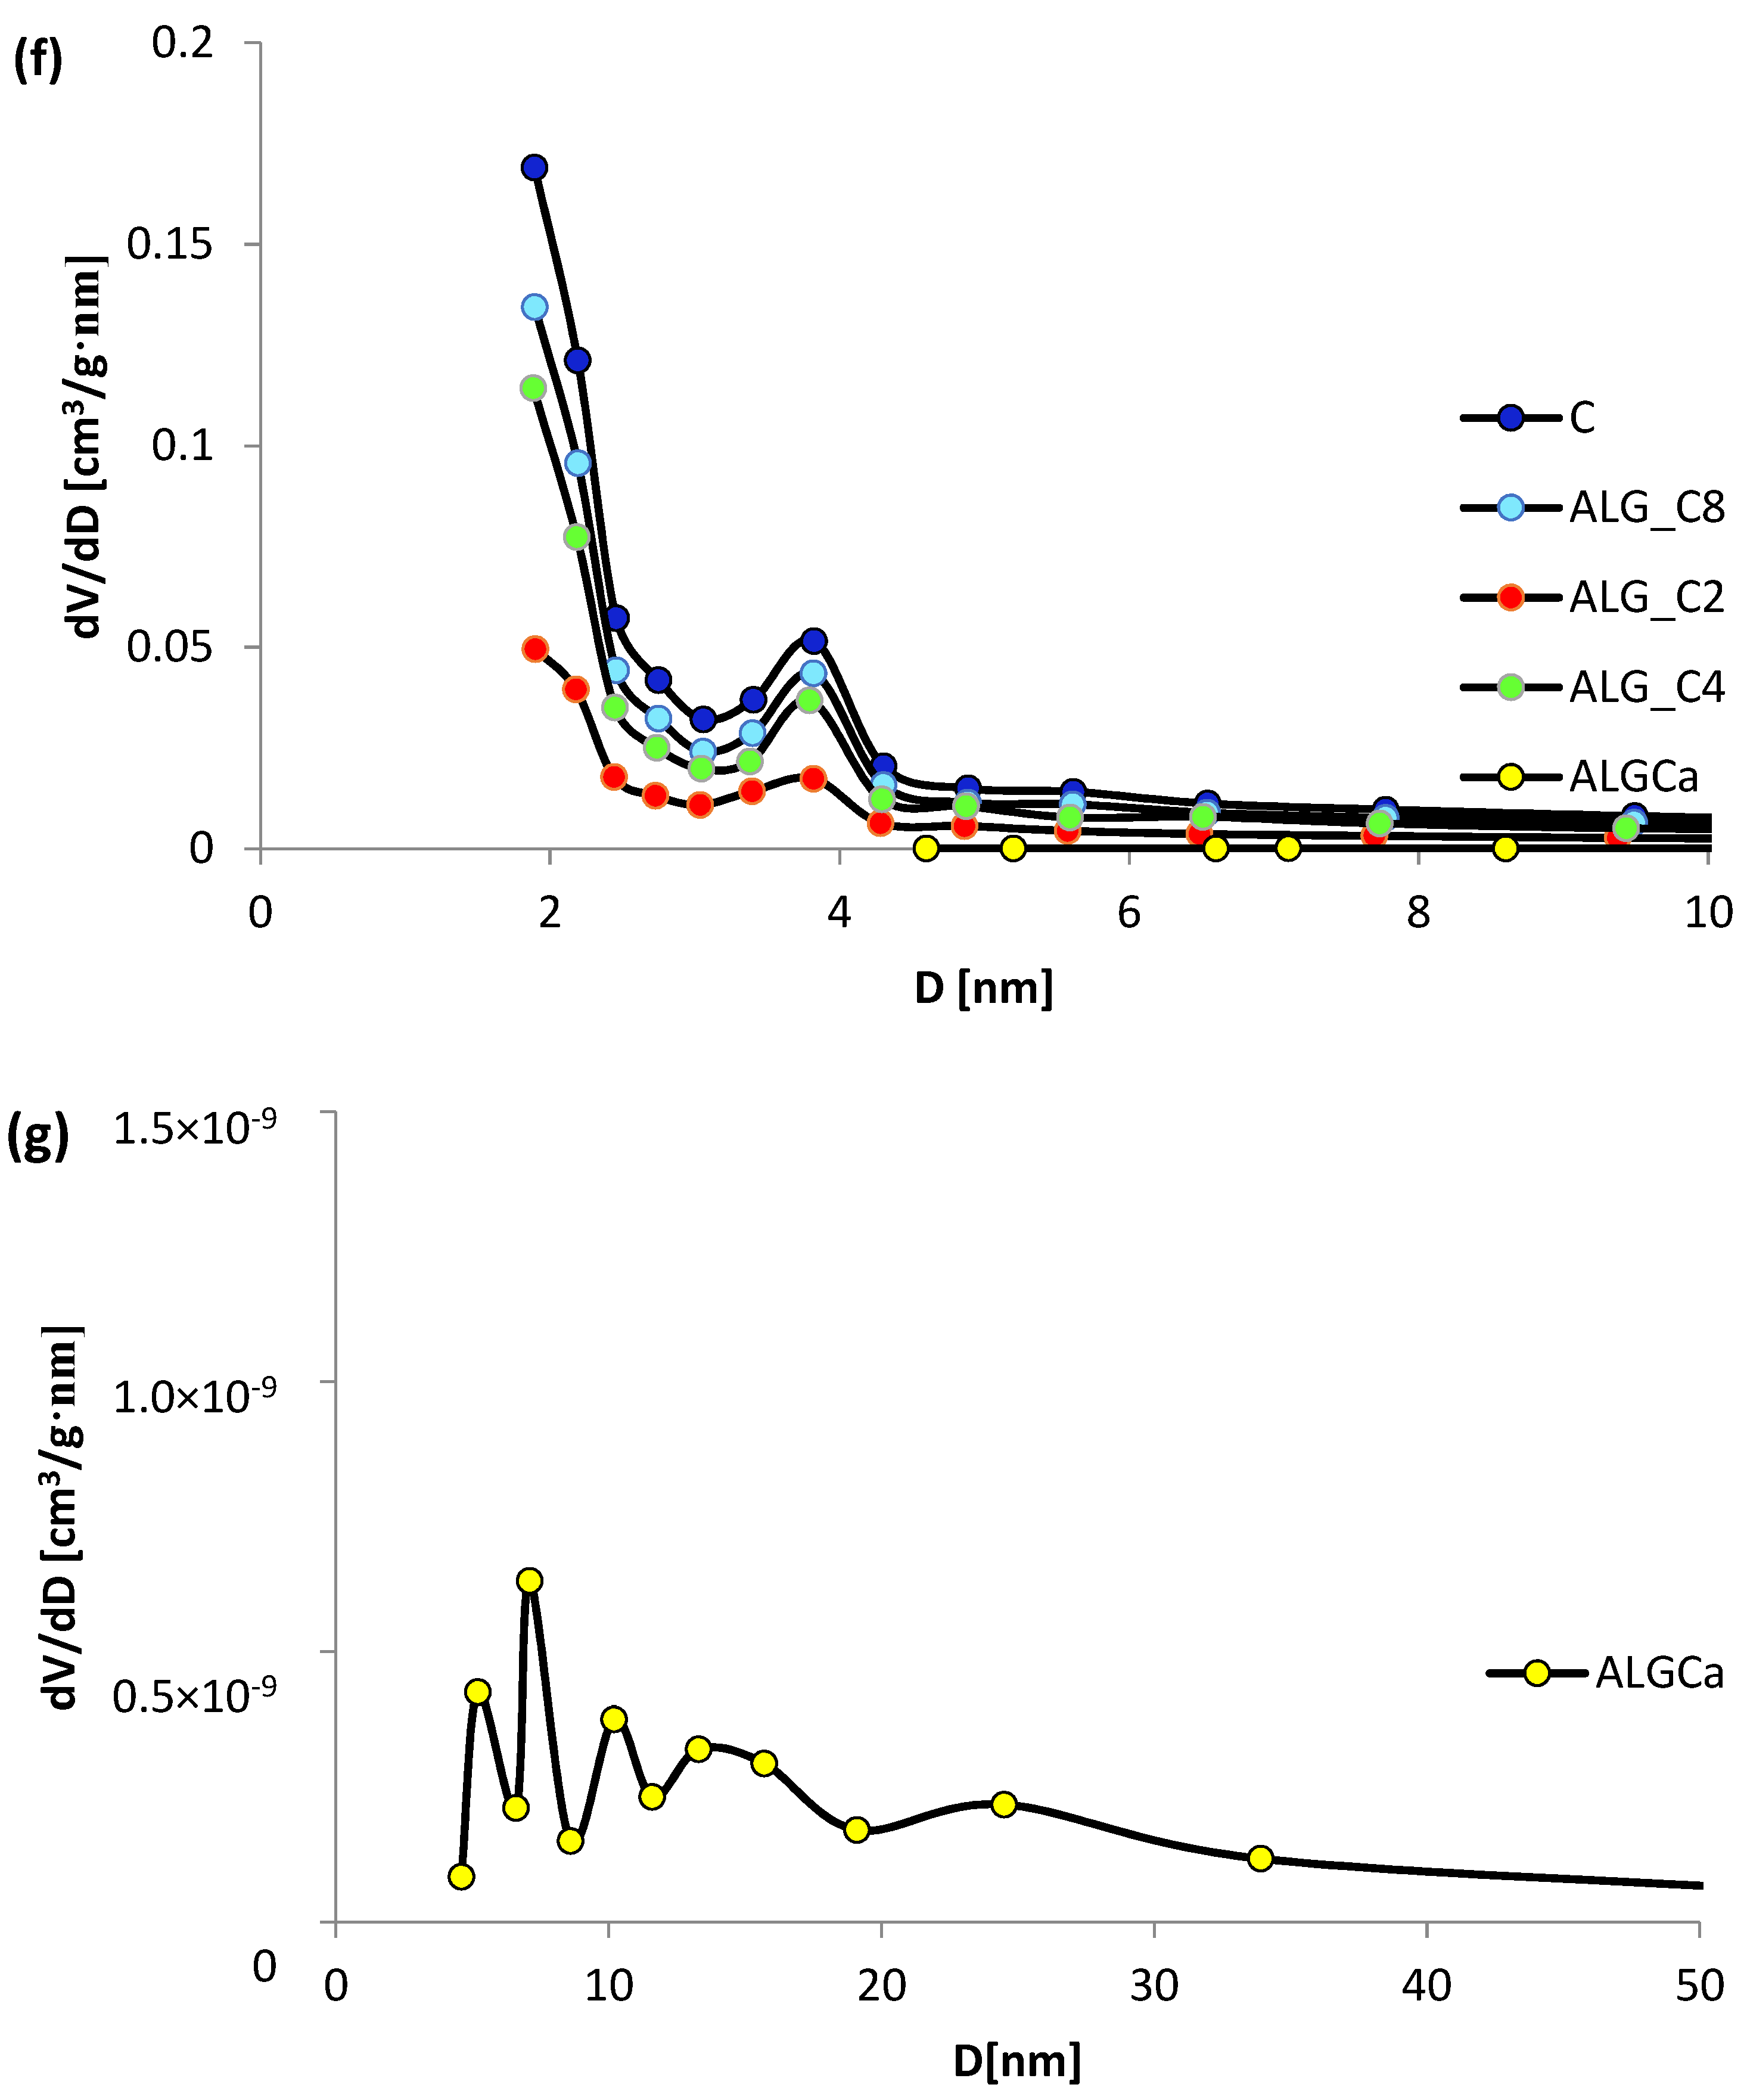
2.3.1. Nitrogen Adsorption/Desorption Studies
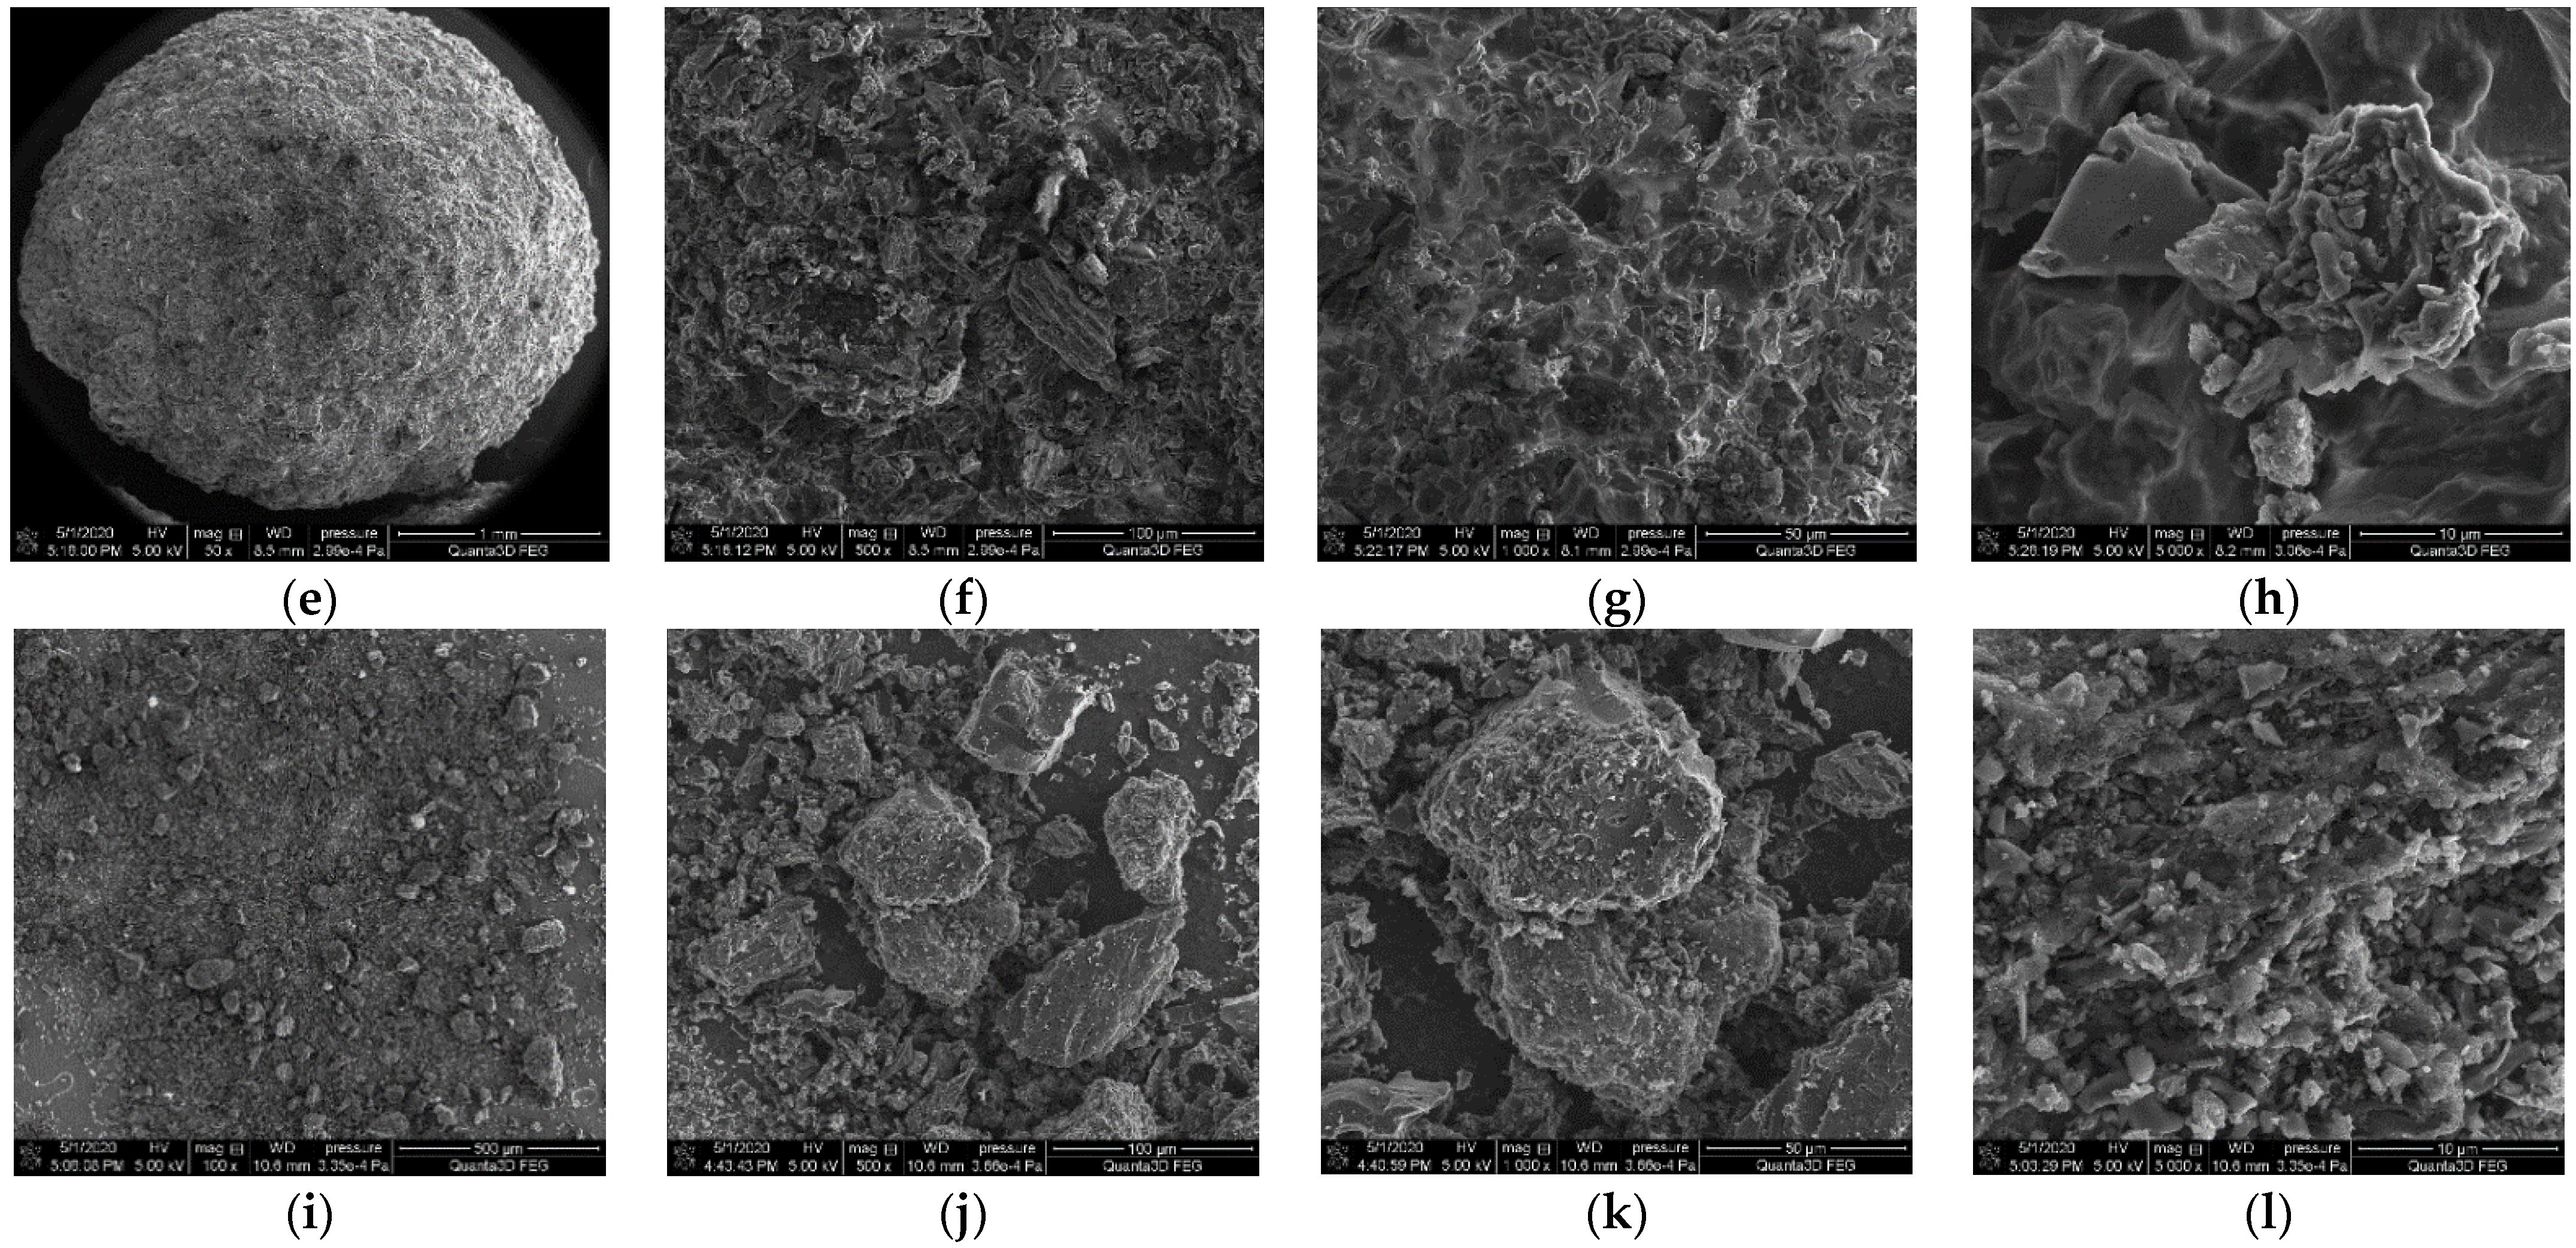
2.3.2. SEM
2.3.3. Adsorption Equilibrium
2.3.4. Adsorption Kinetics
2.3.5. Thermal Analysis
3. Results
3.1. Nitrogen Adsorption/Desorption Studies
3.2. SEM
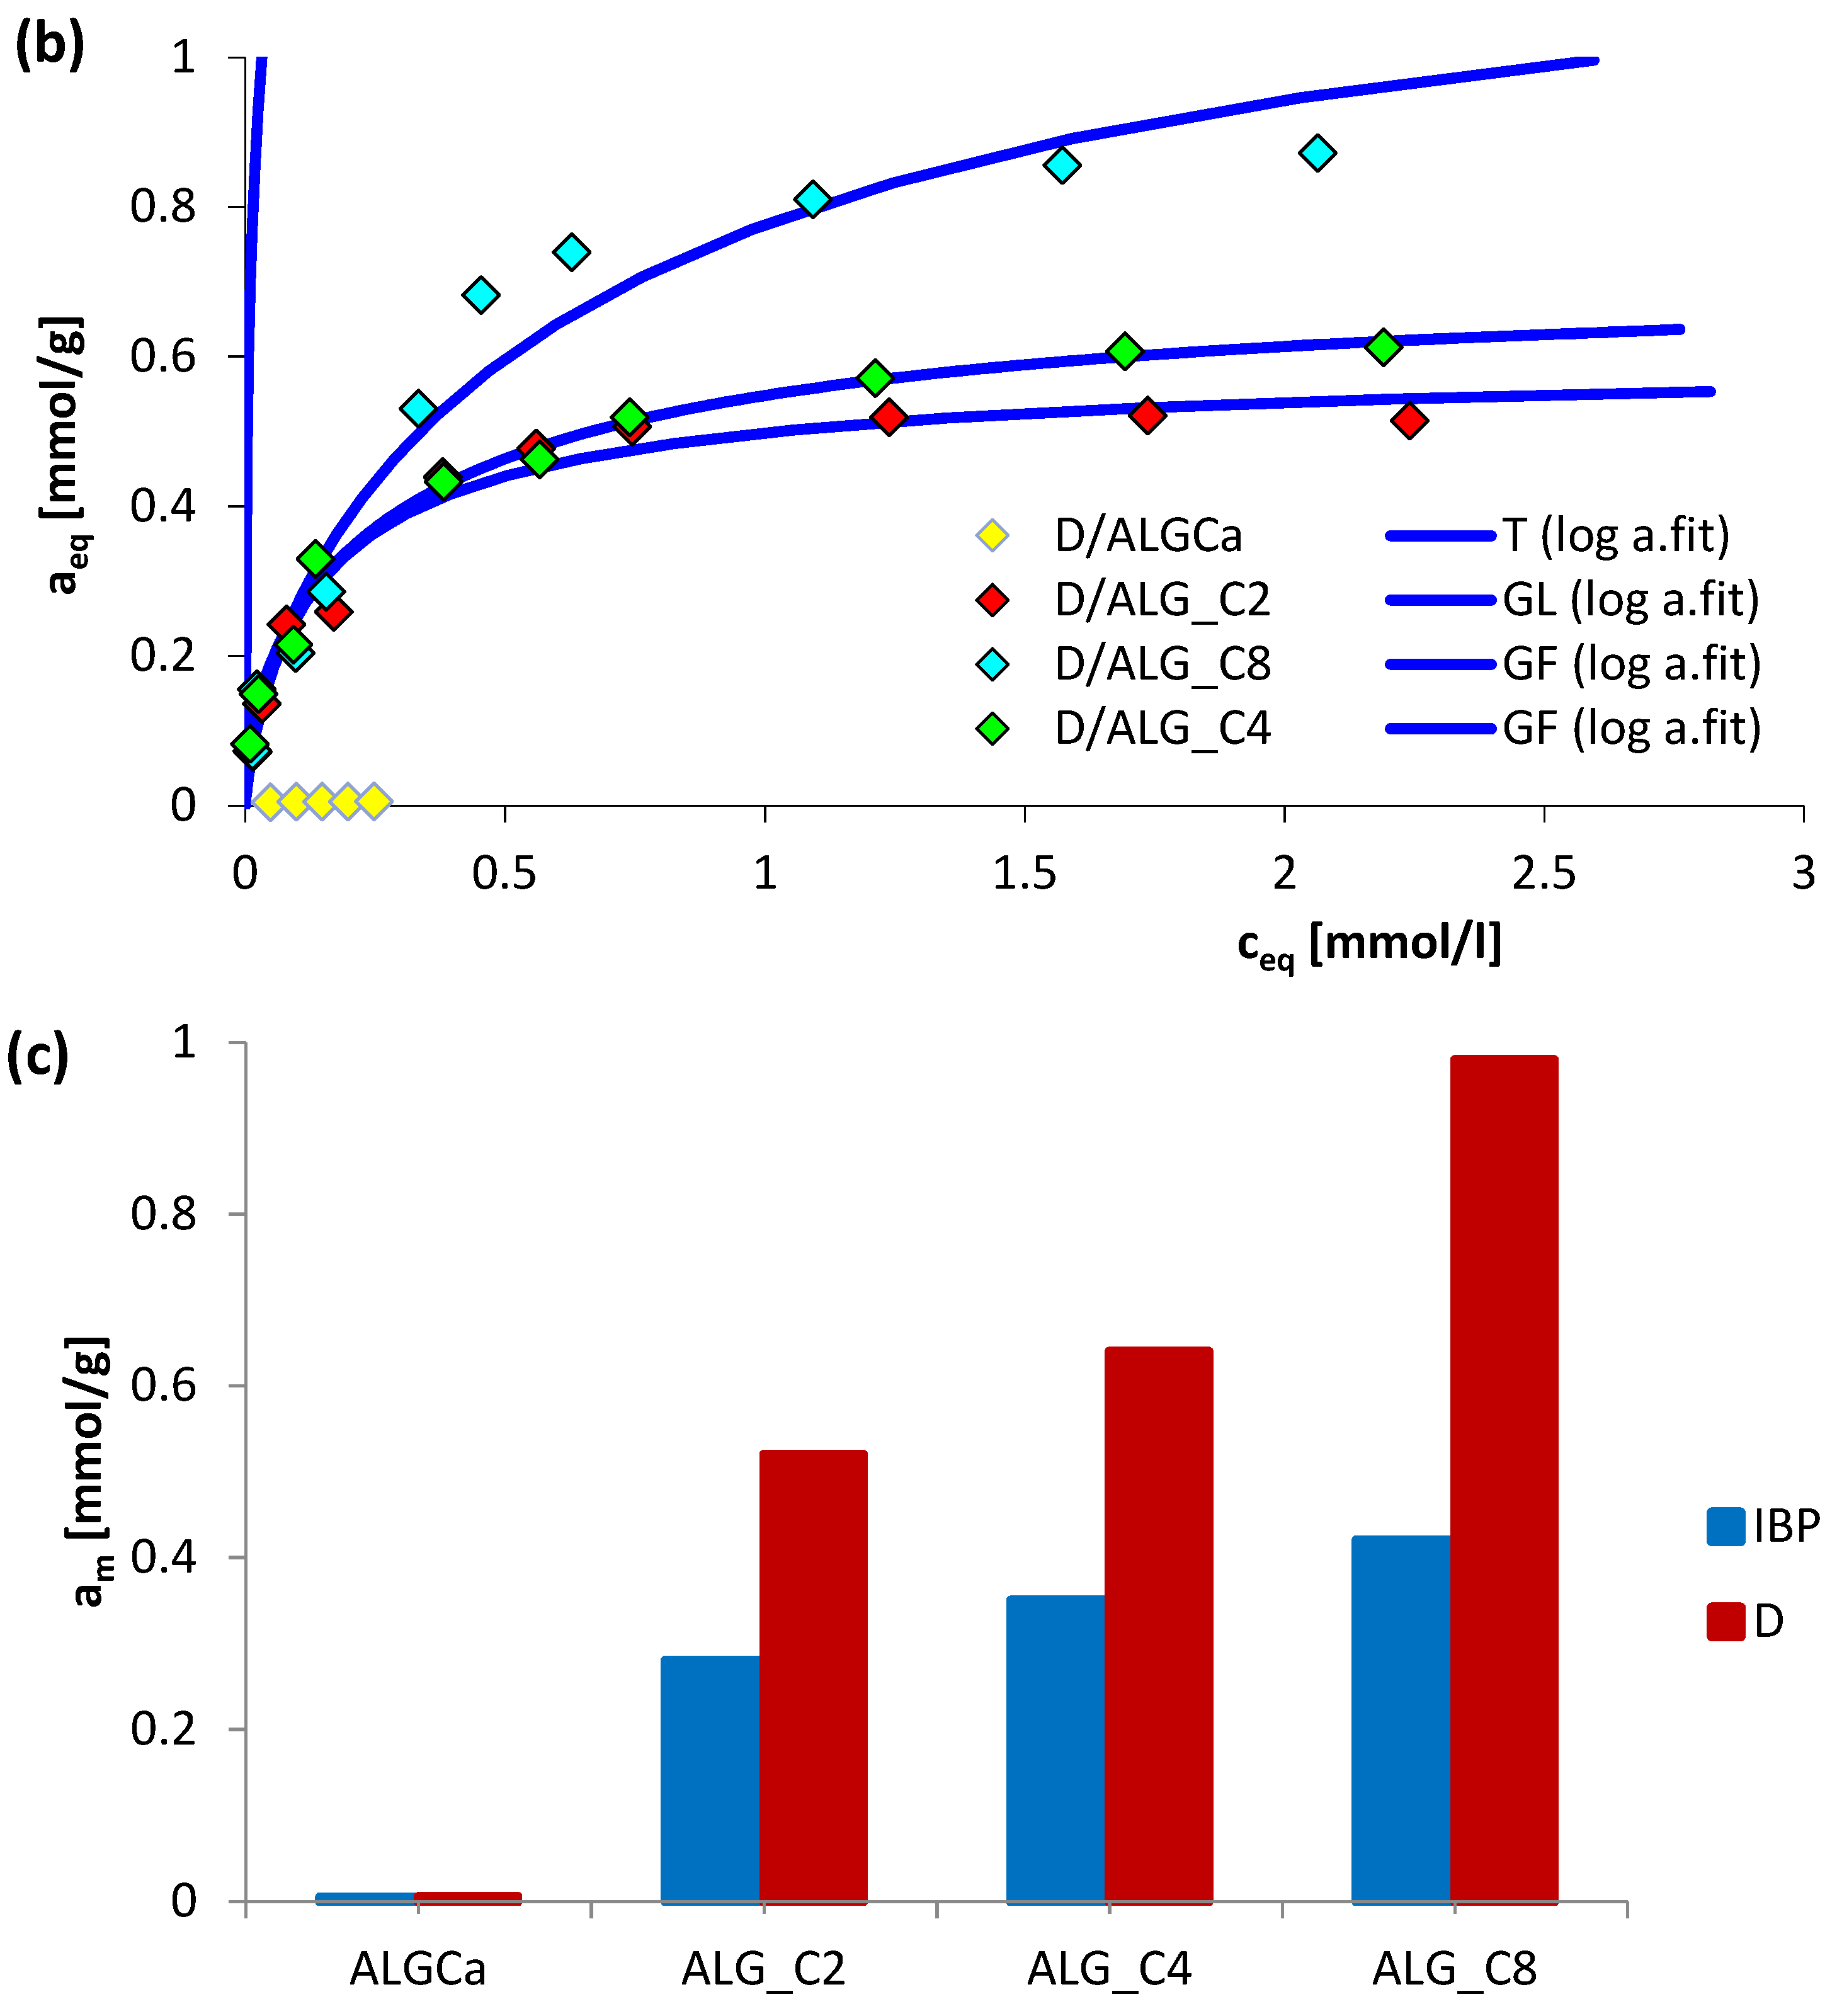
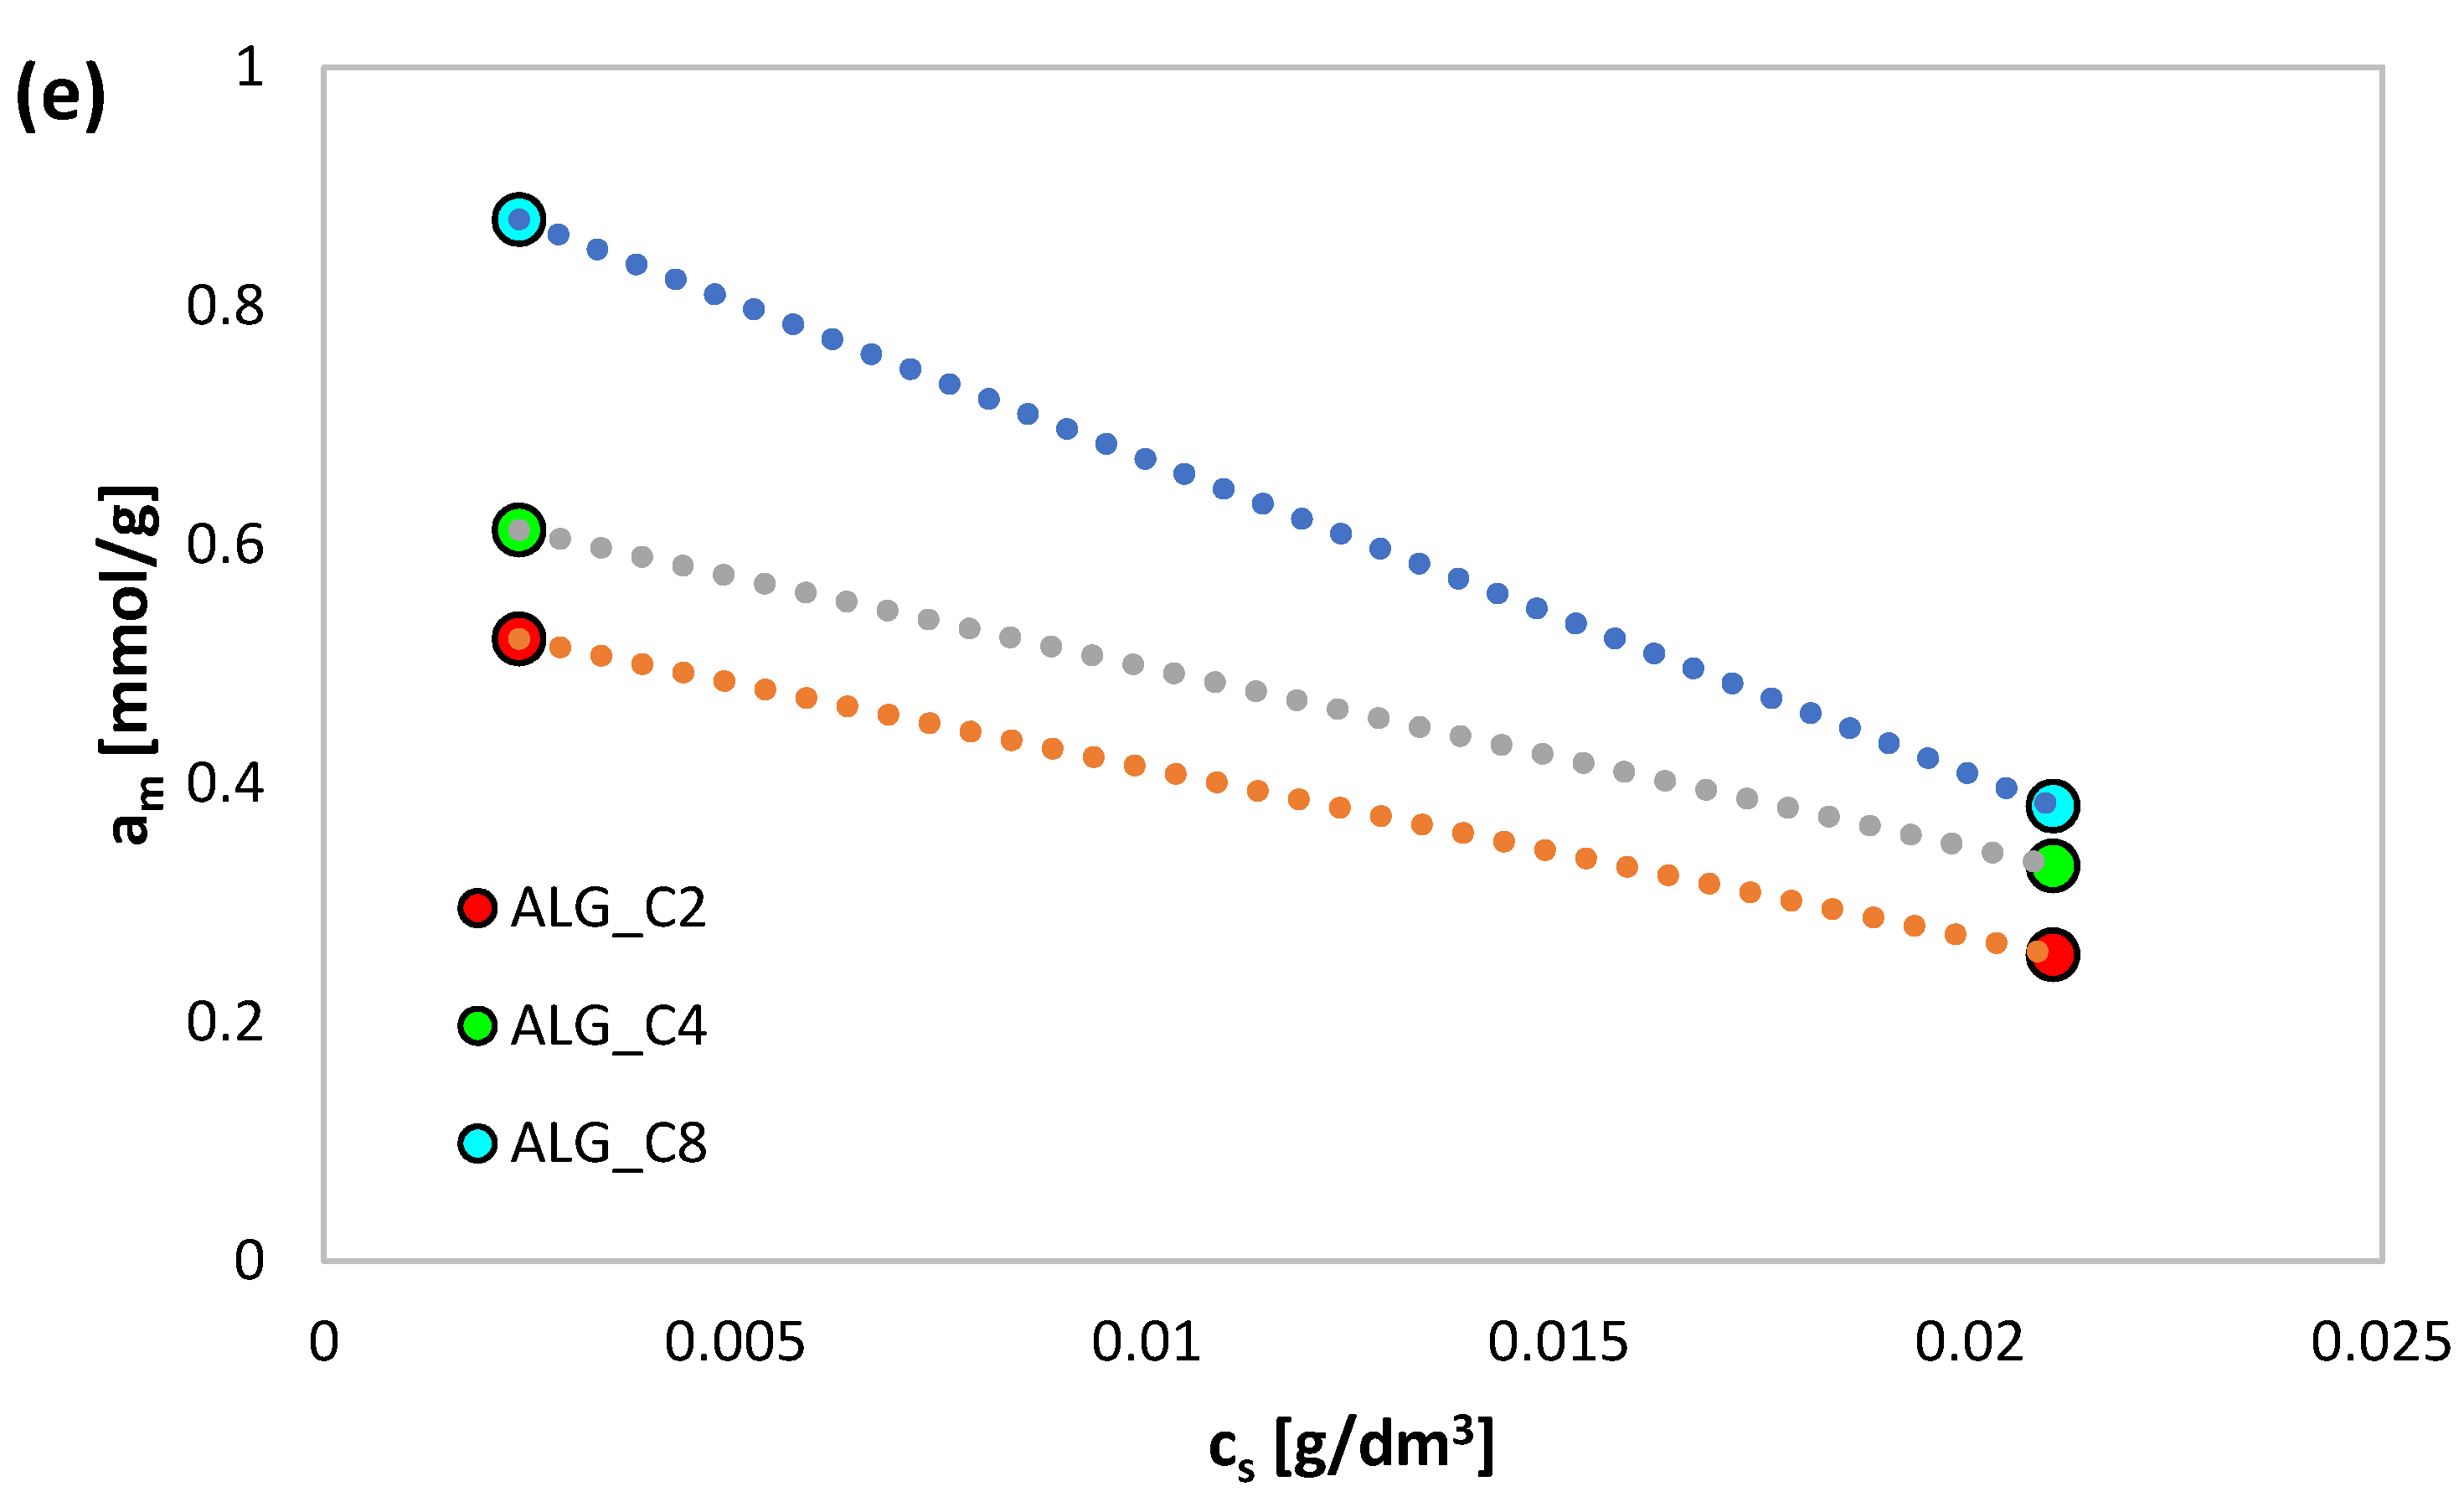
3.3. Adsorption Equilibrium
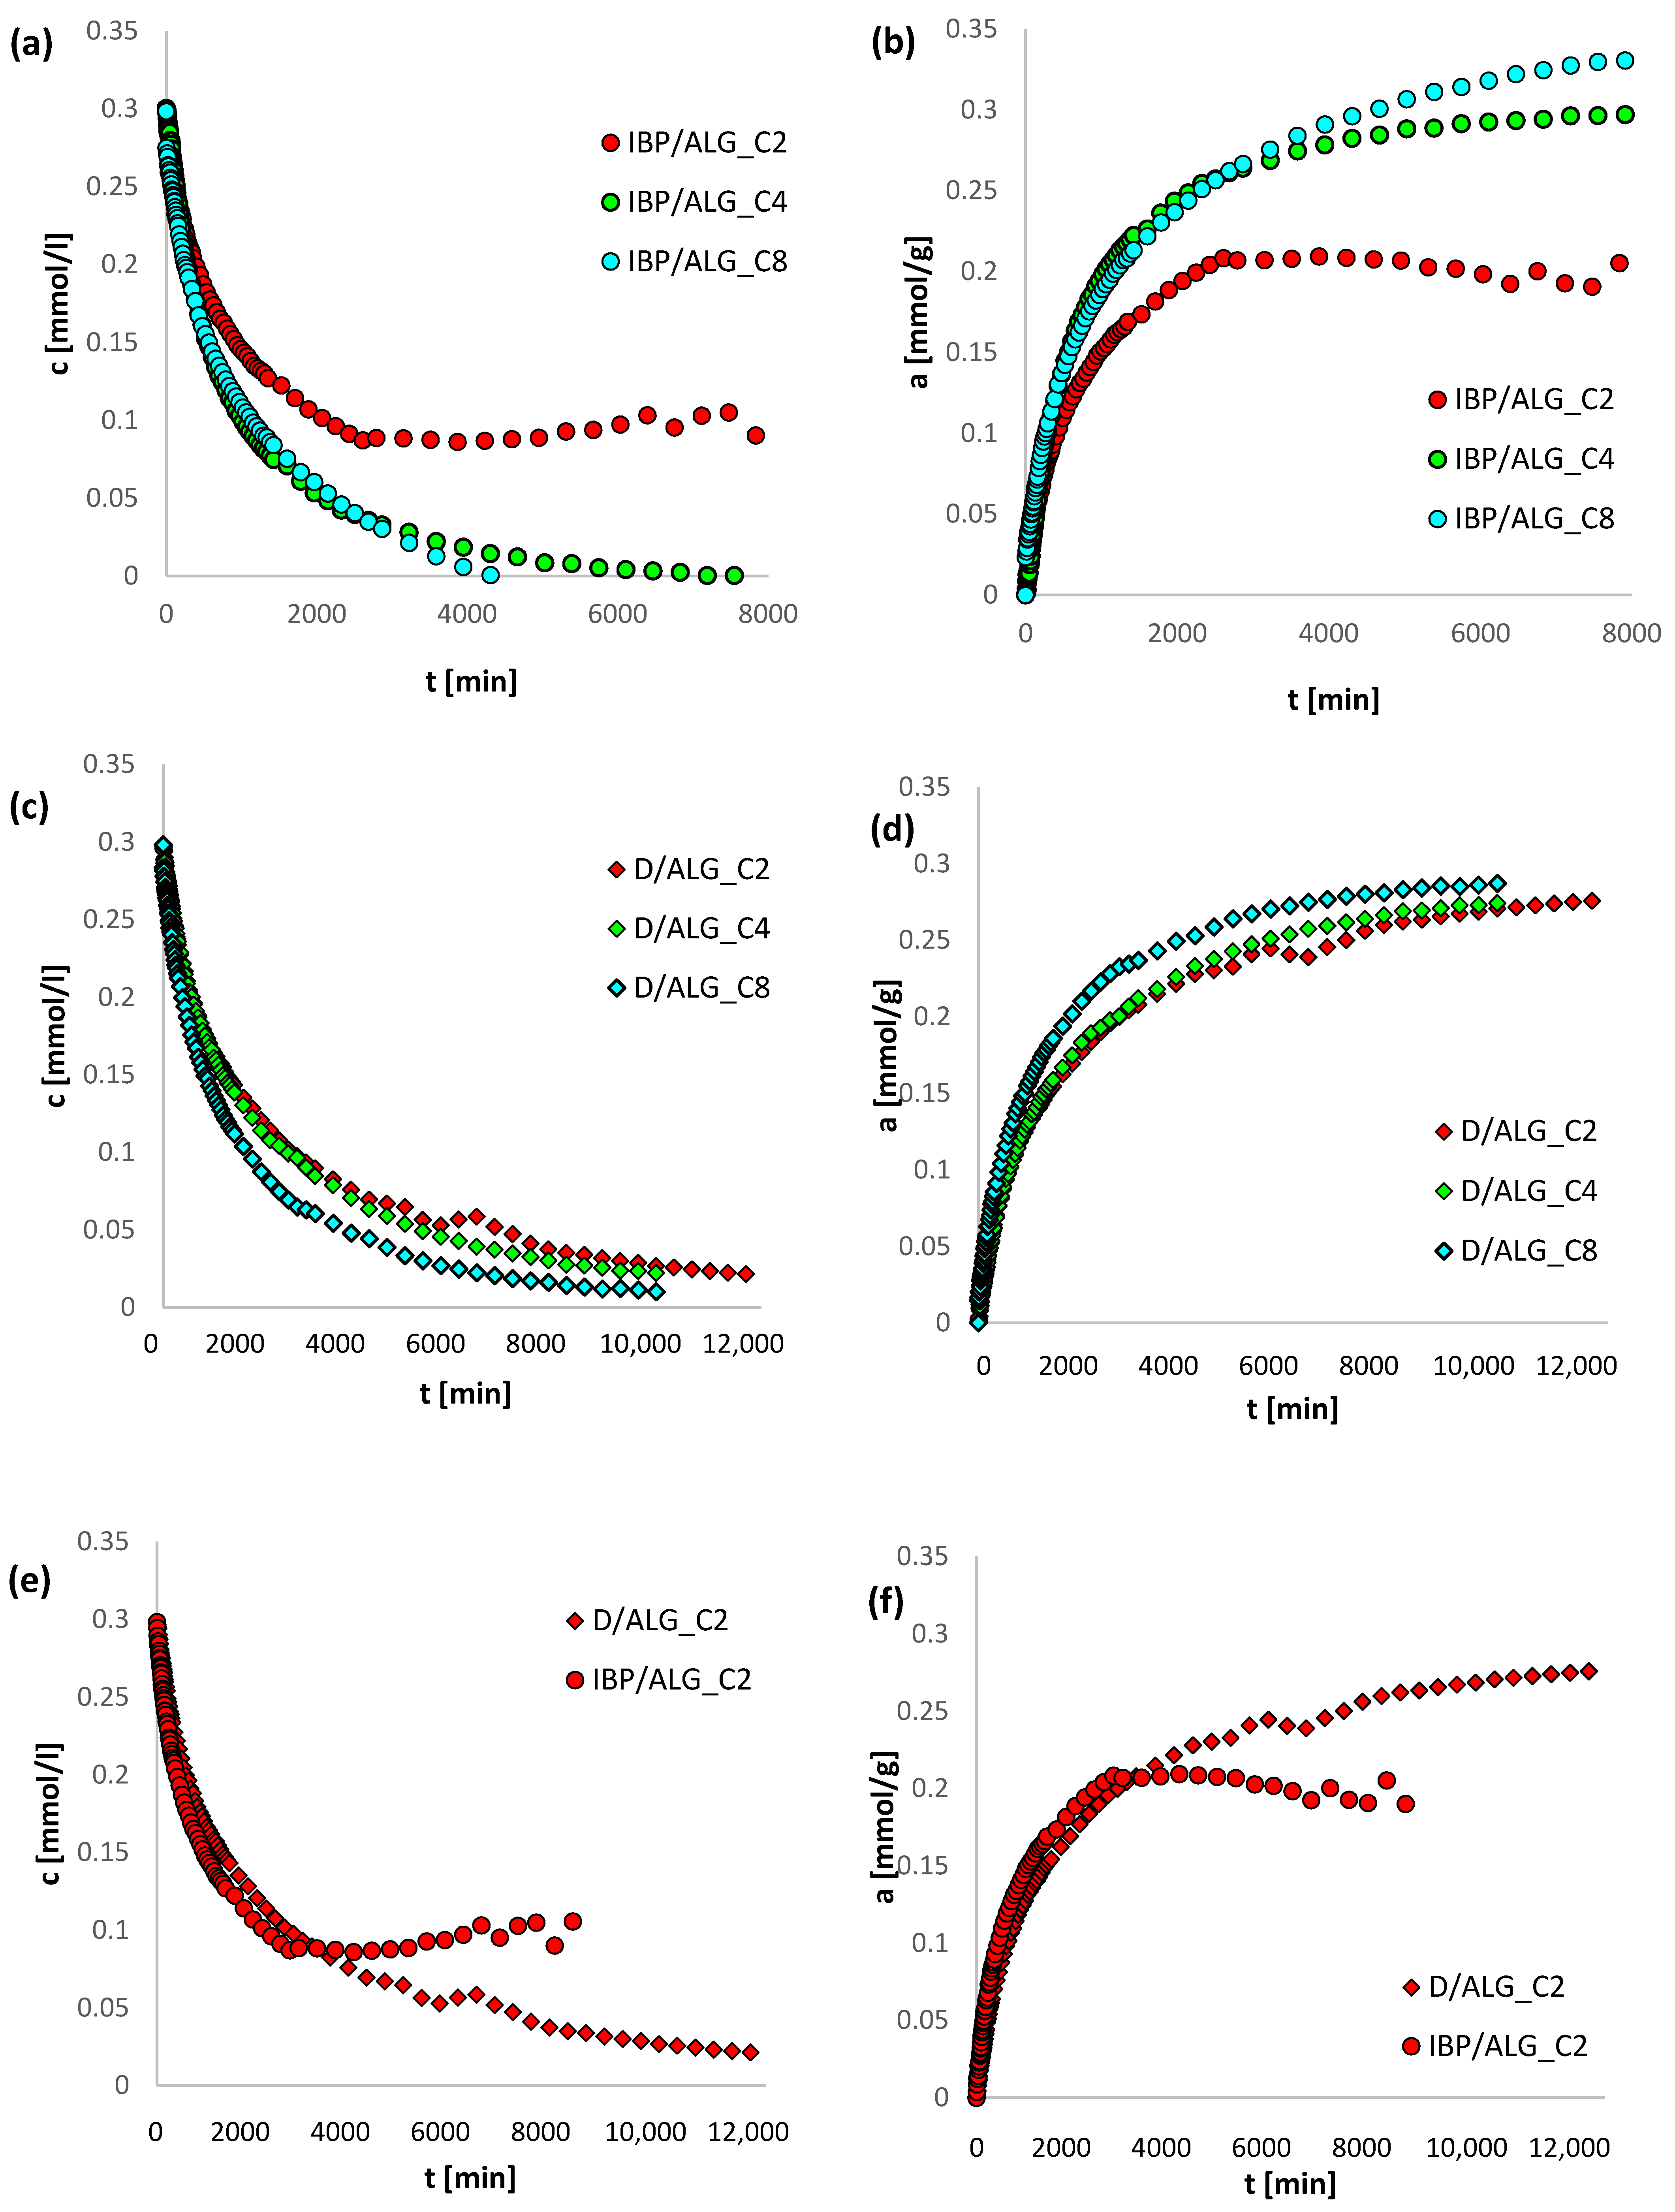
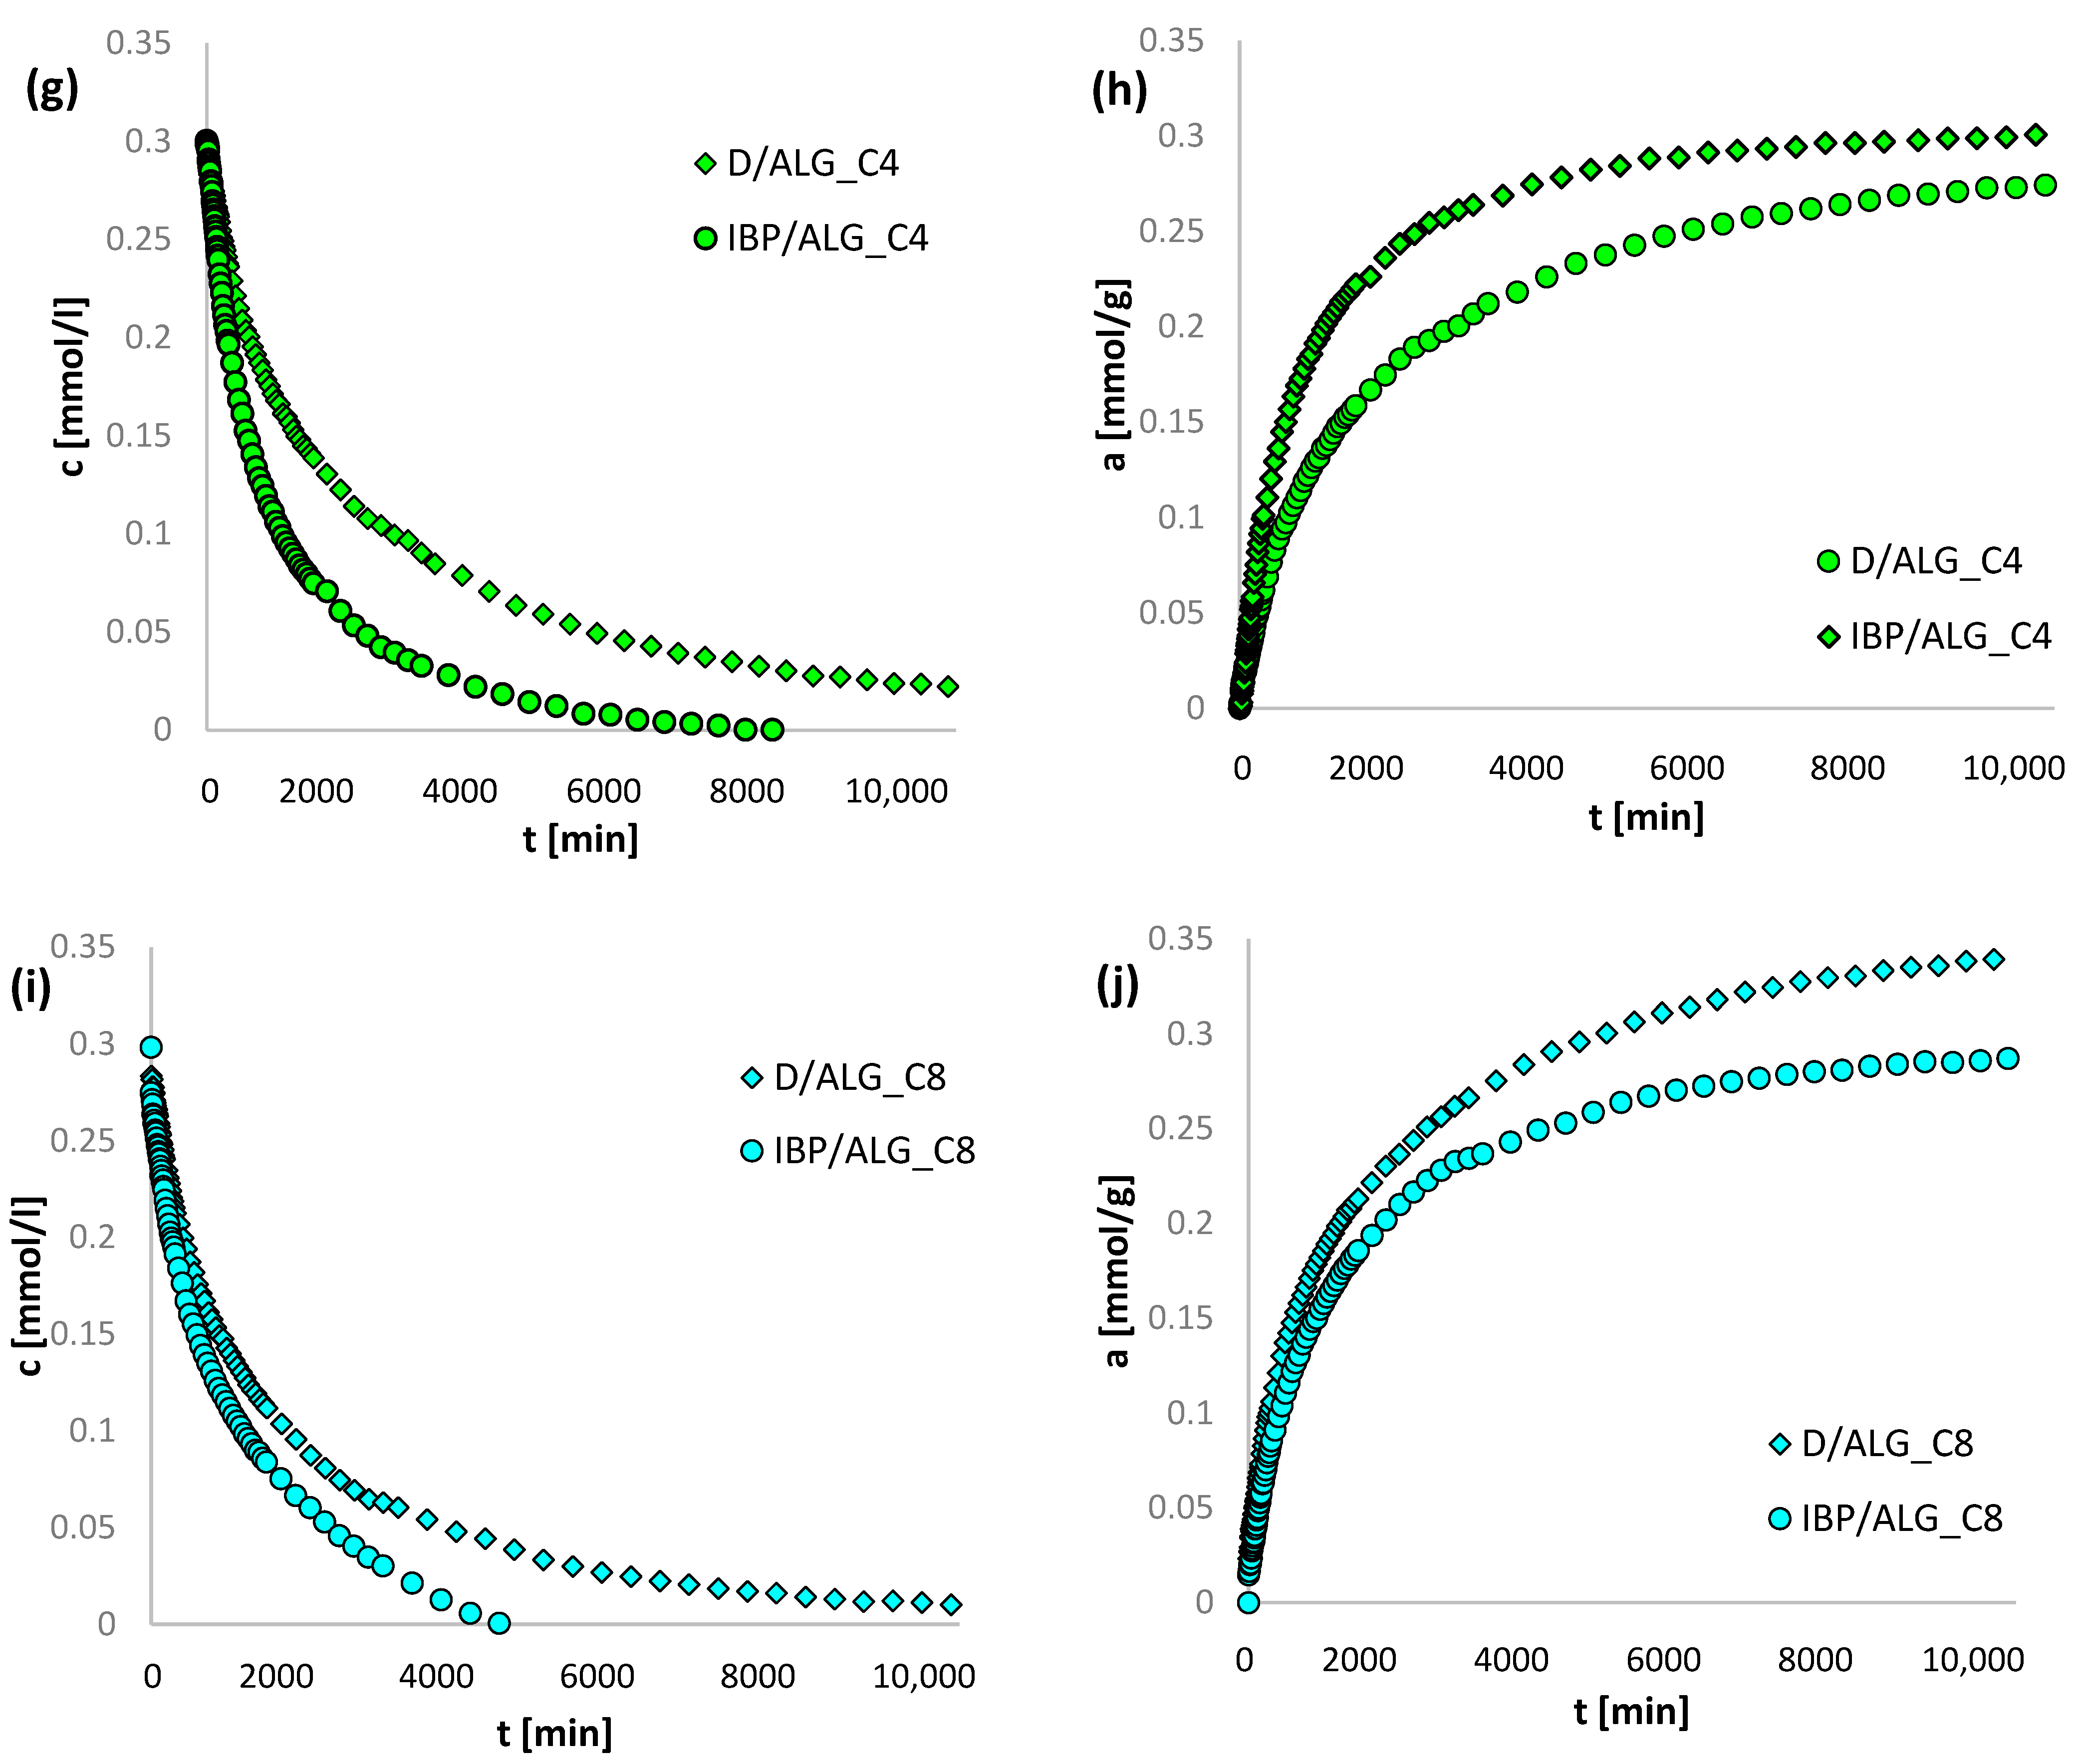
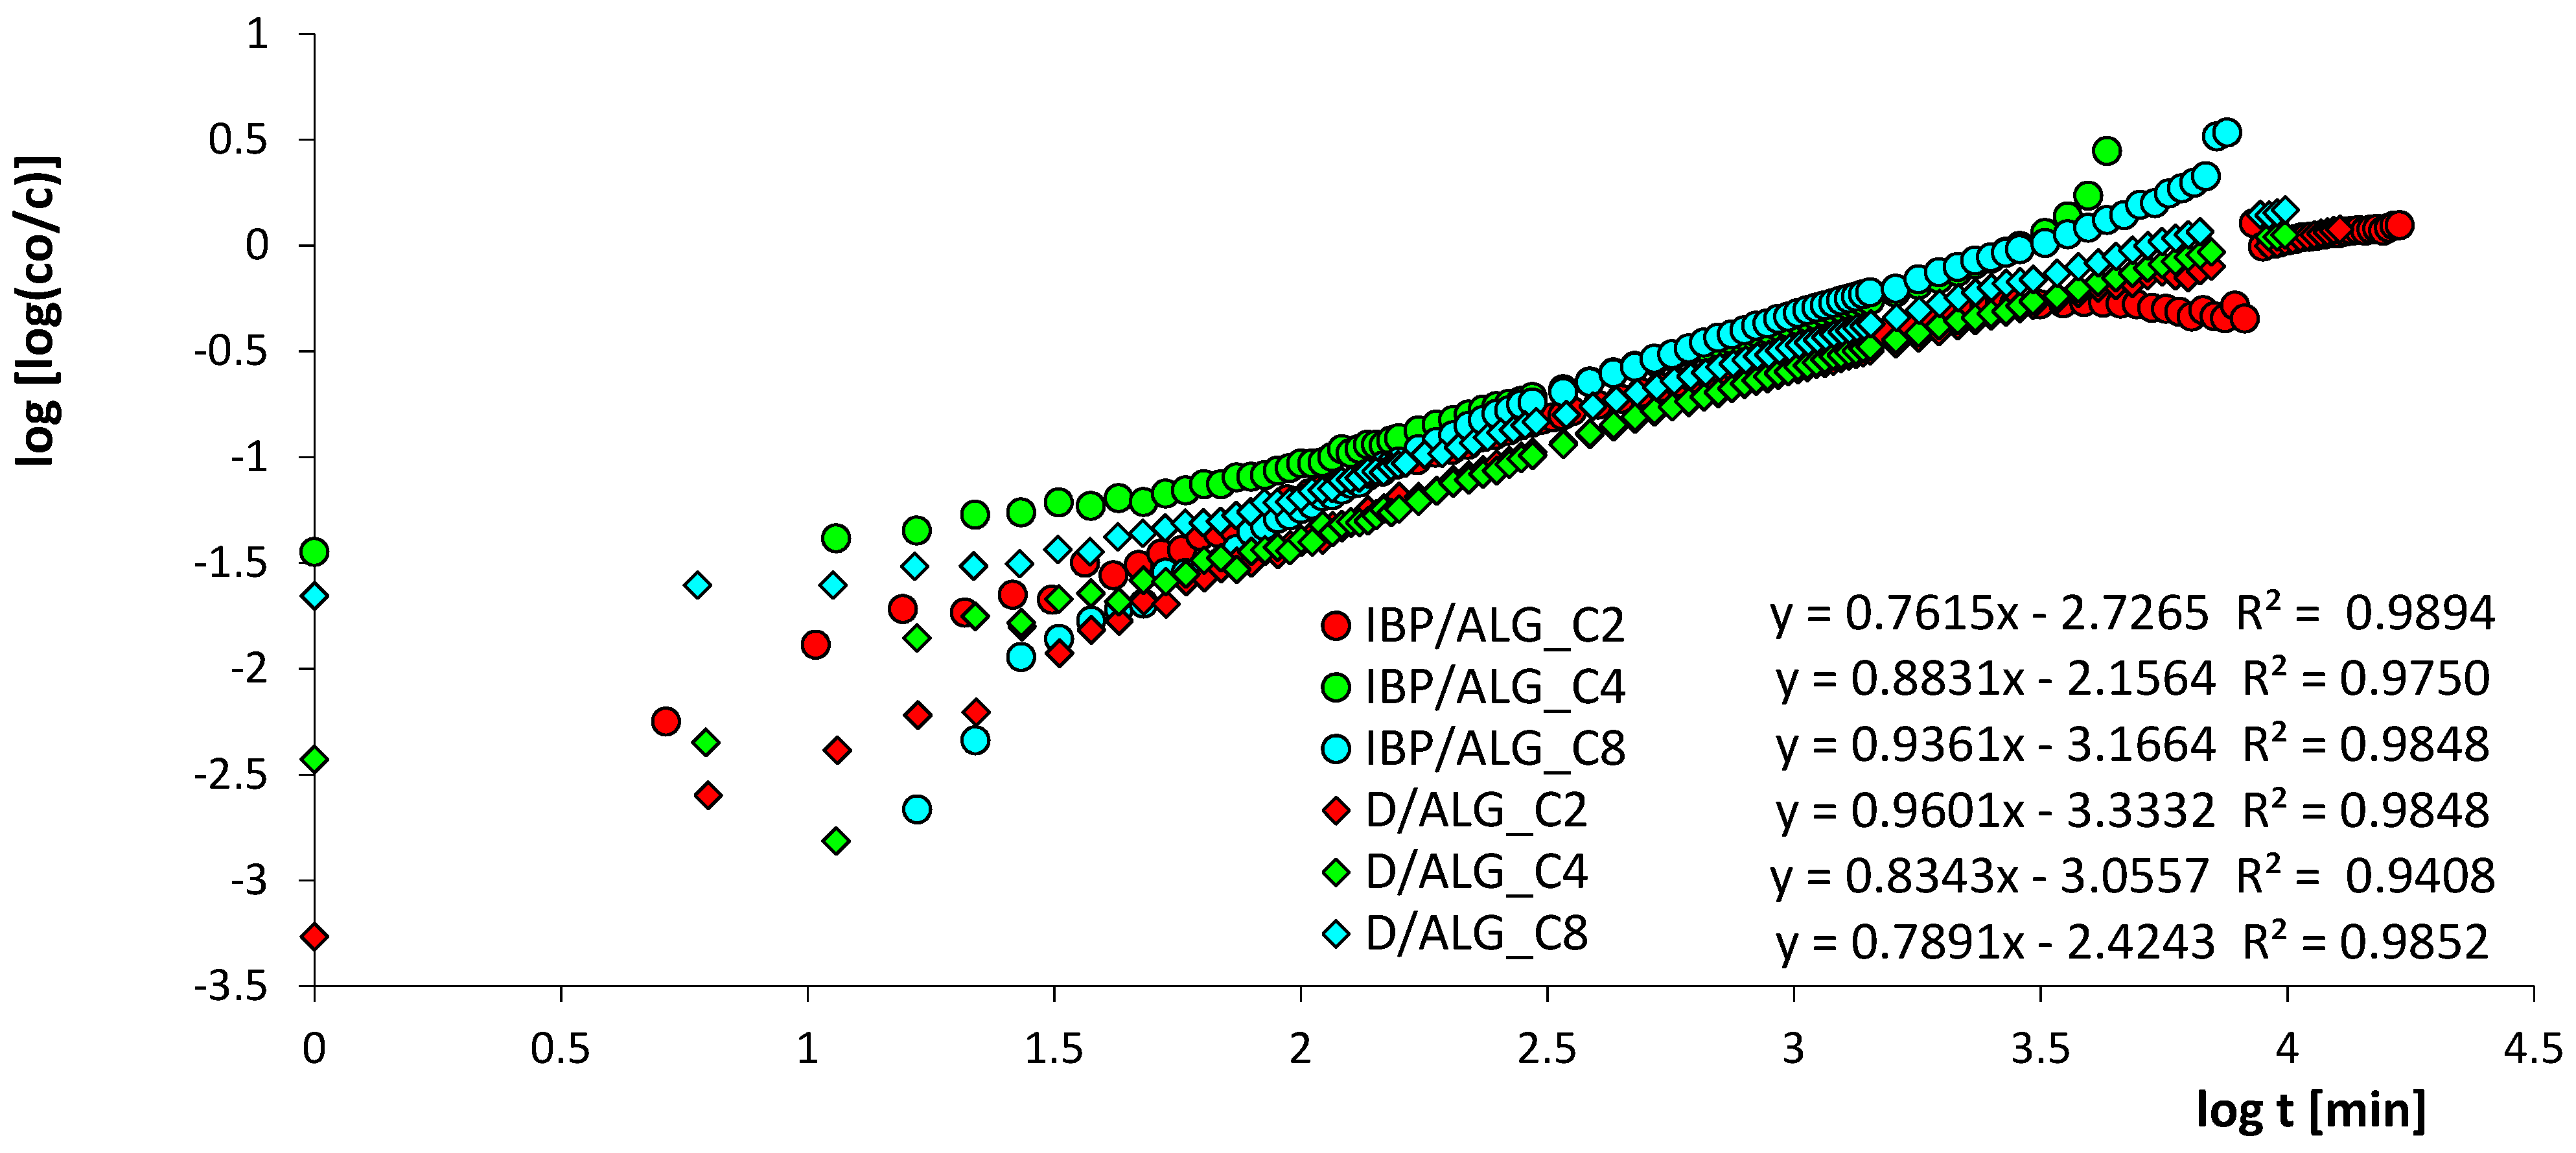
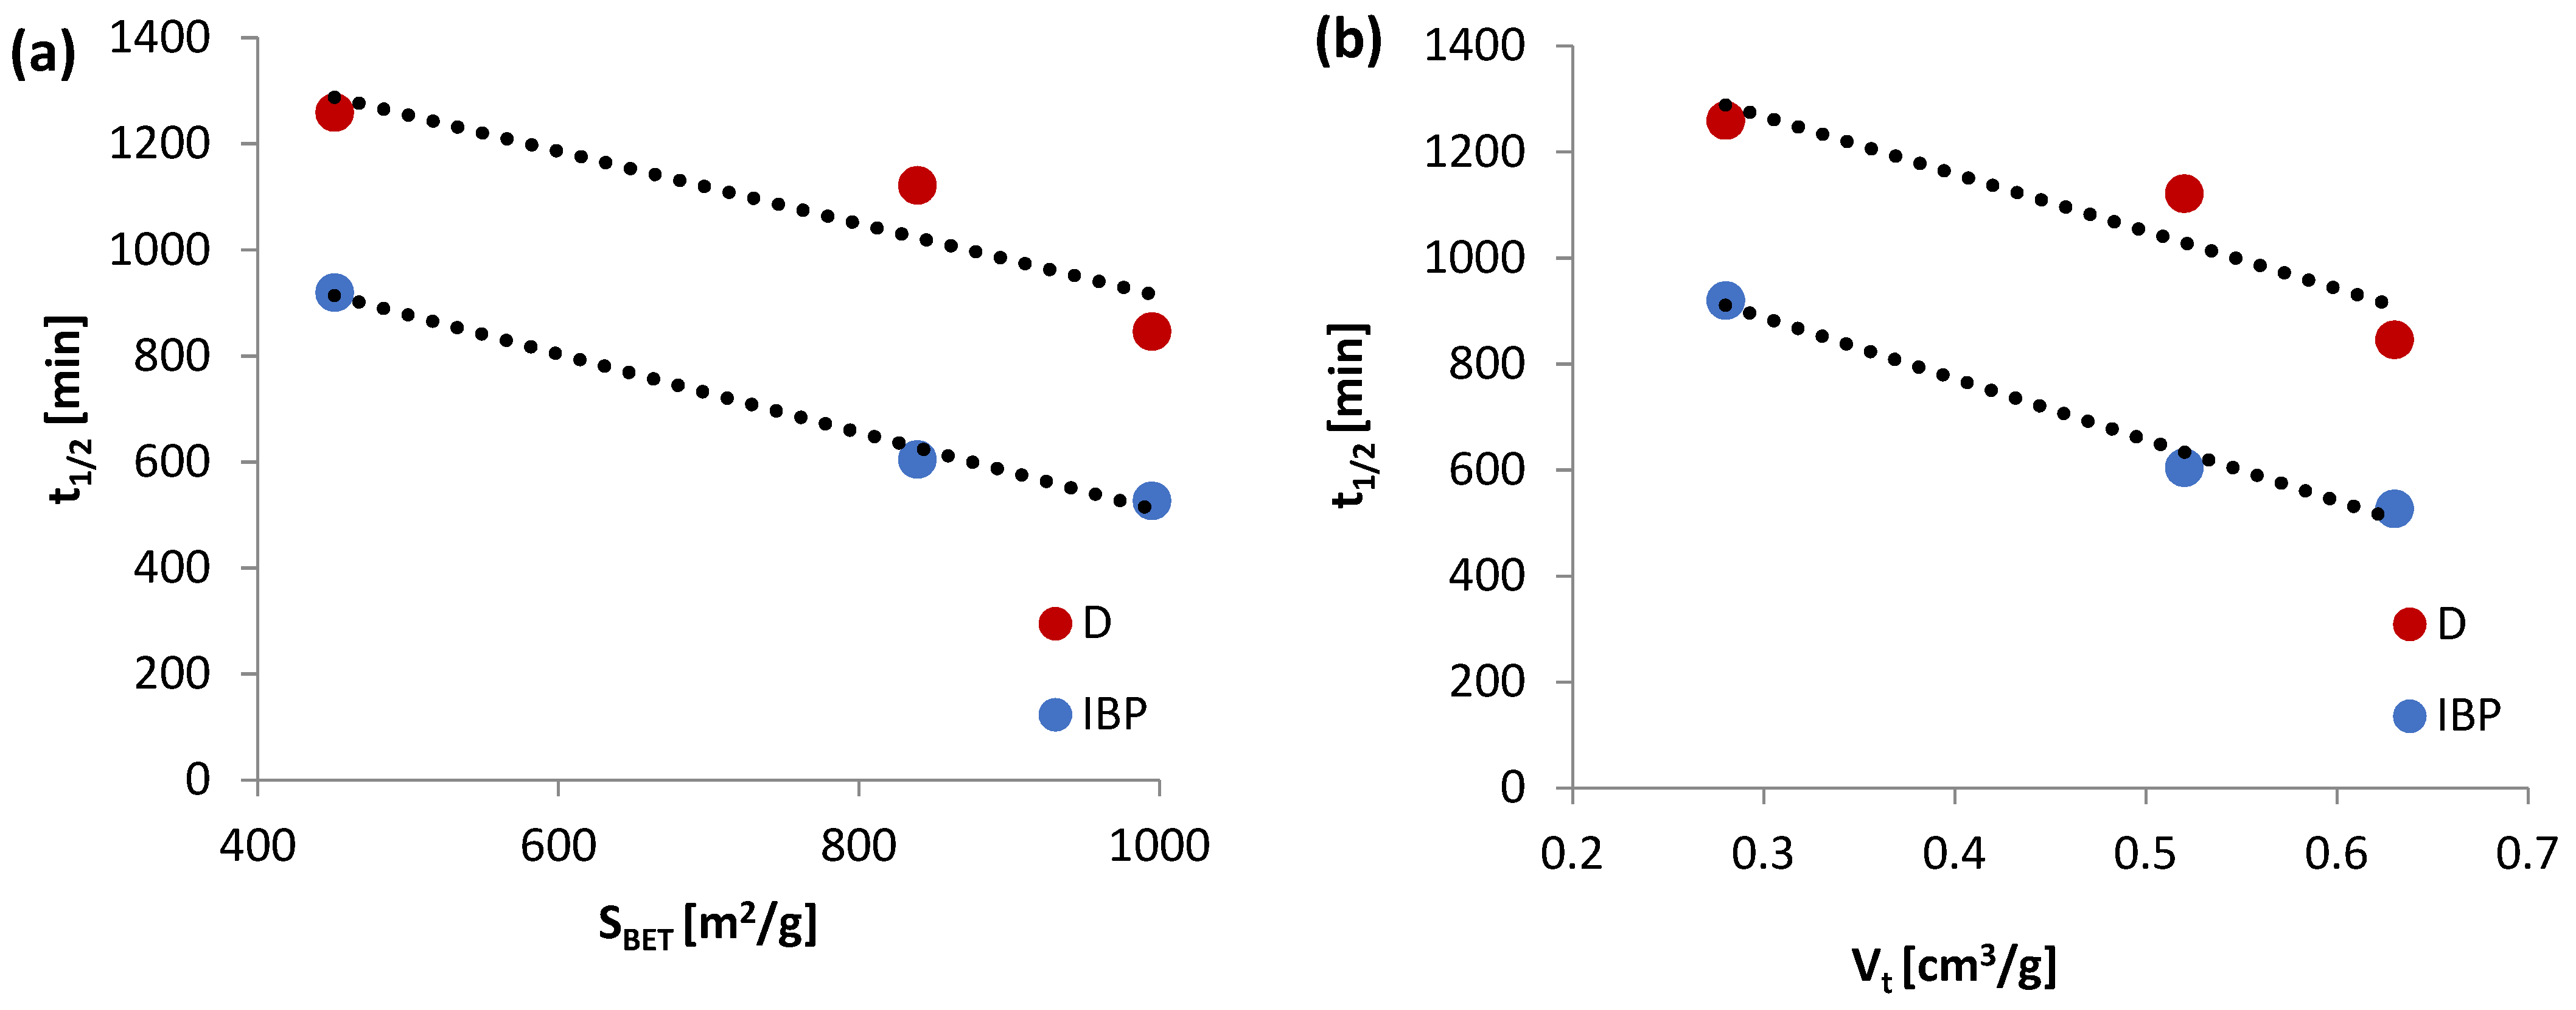
3.4. Adsorption Kinetics
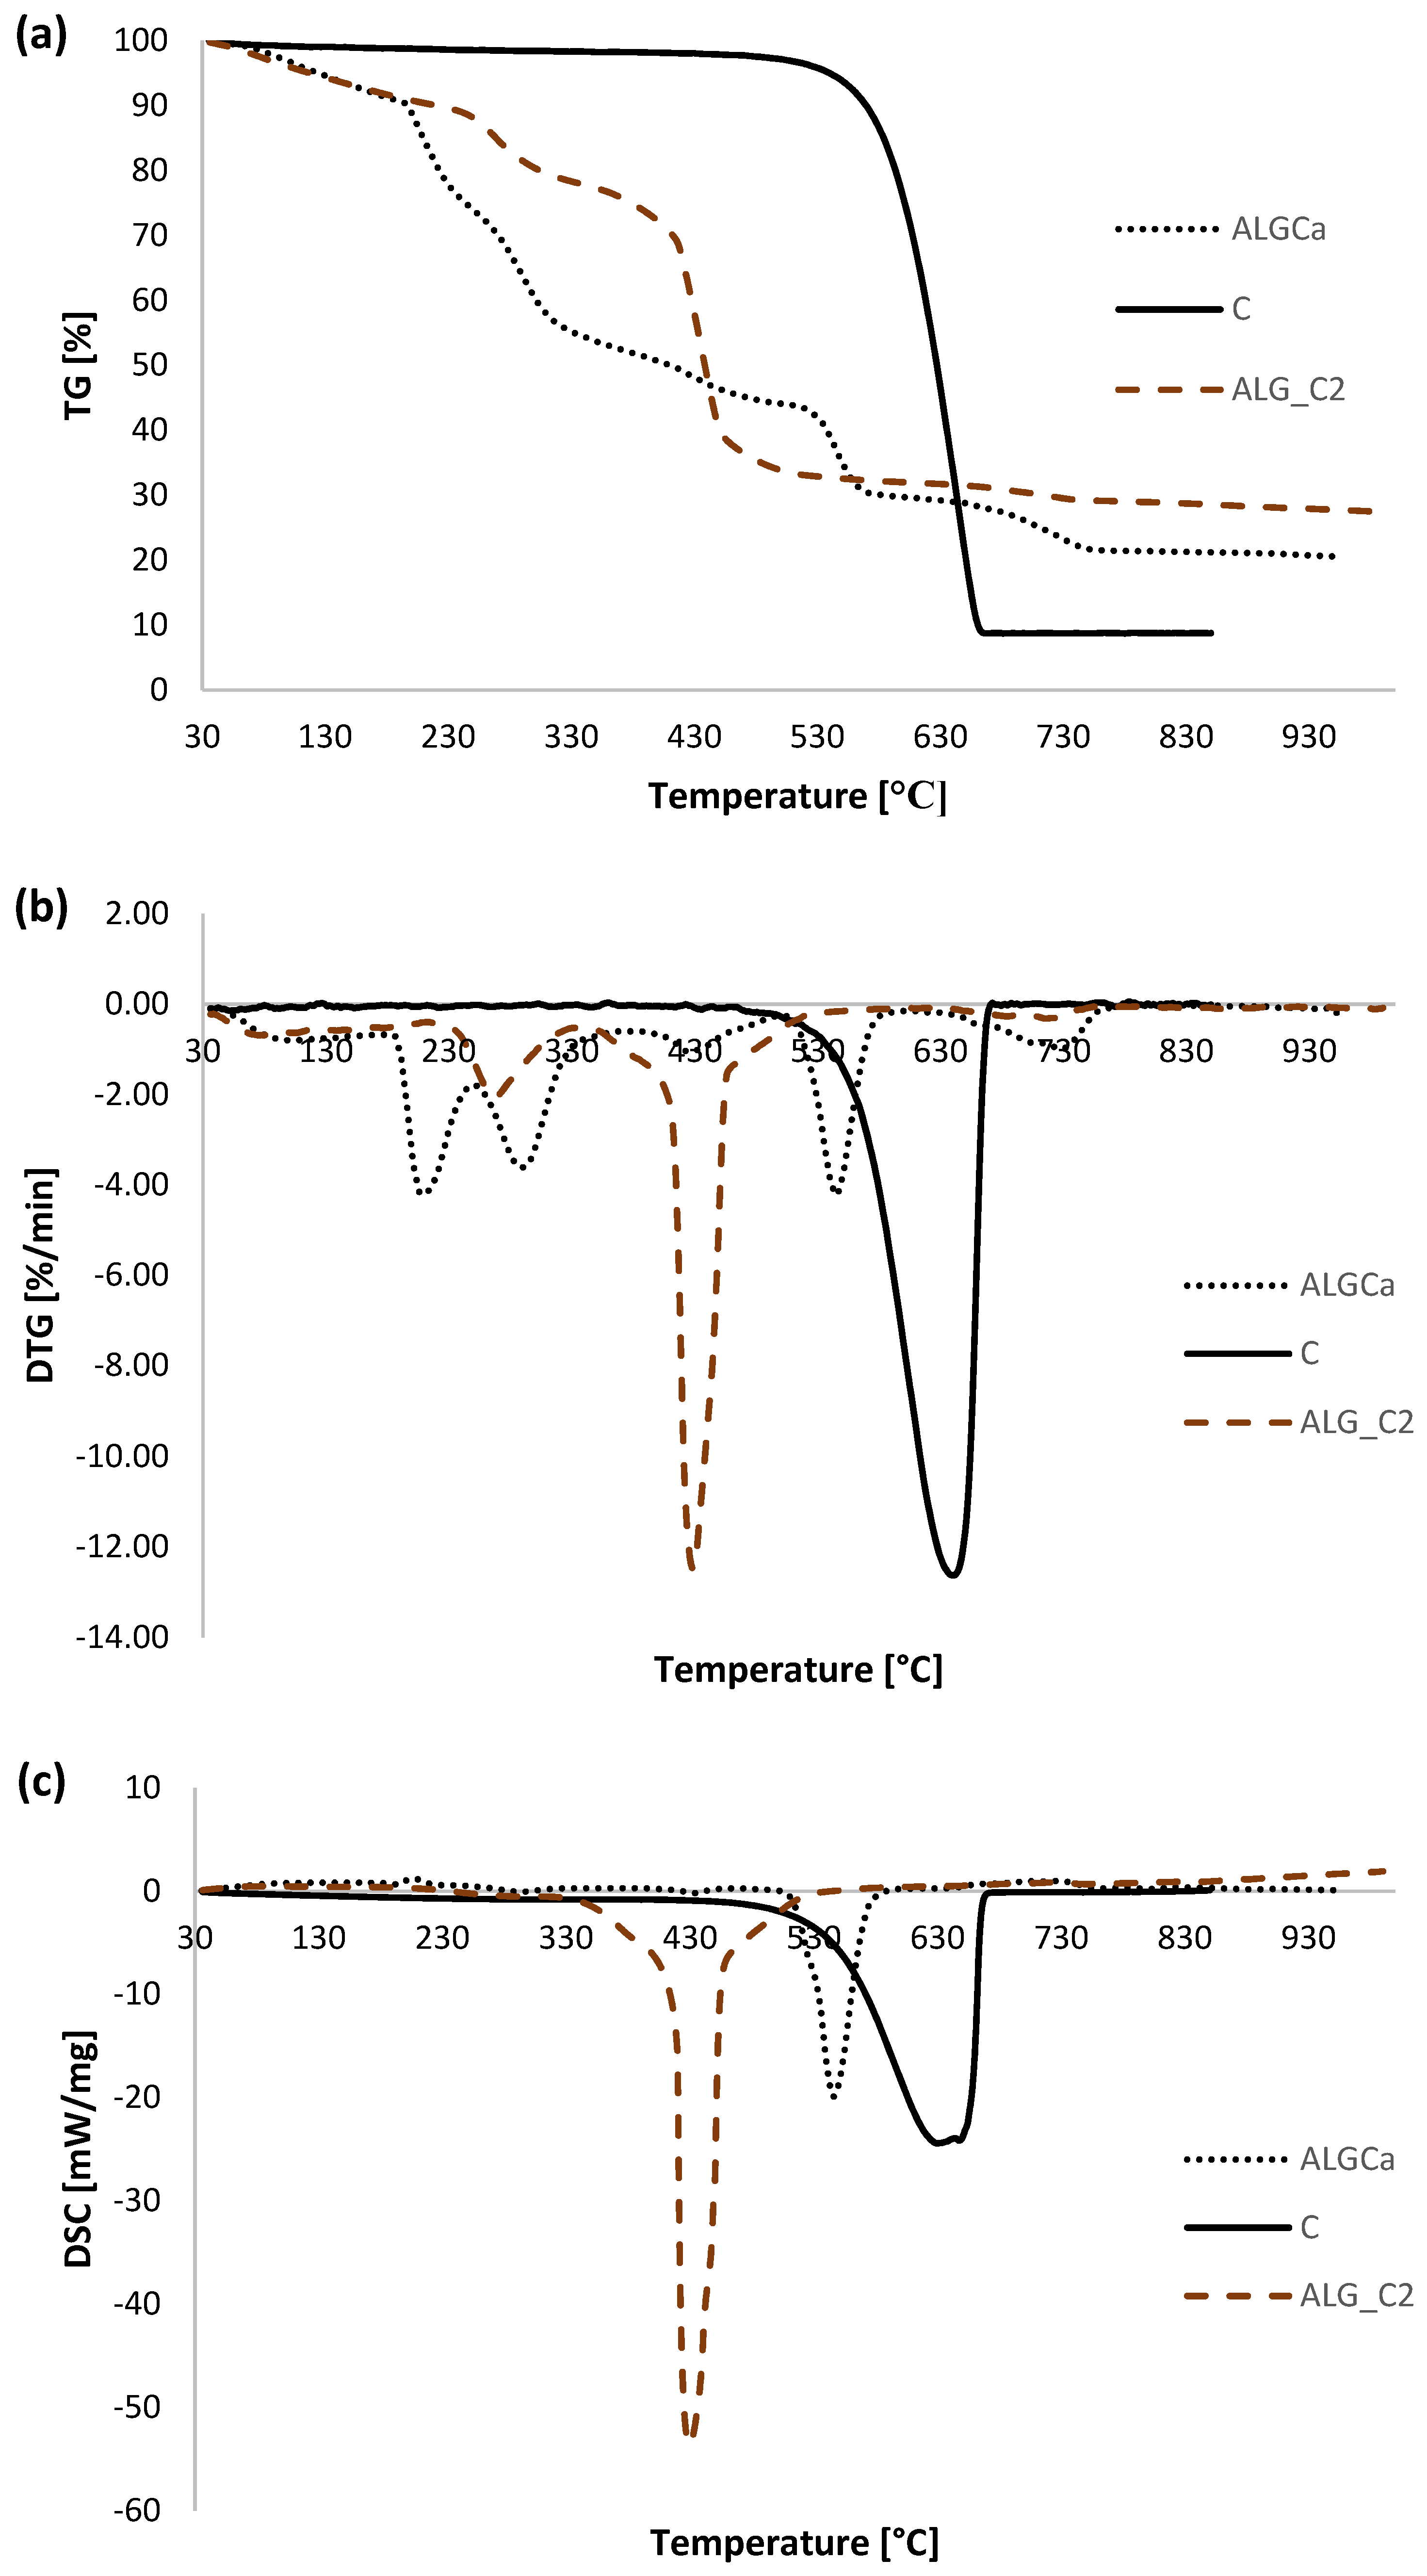
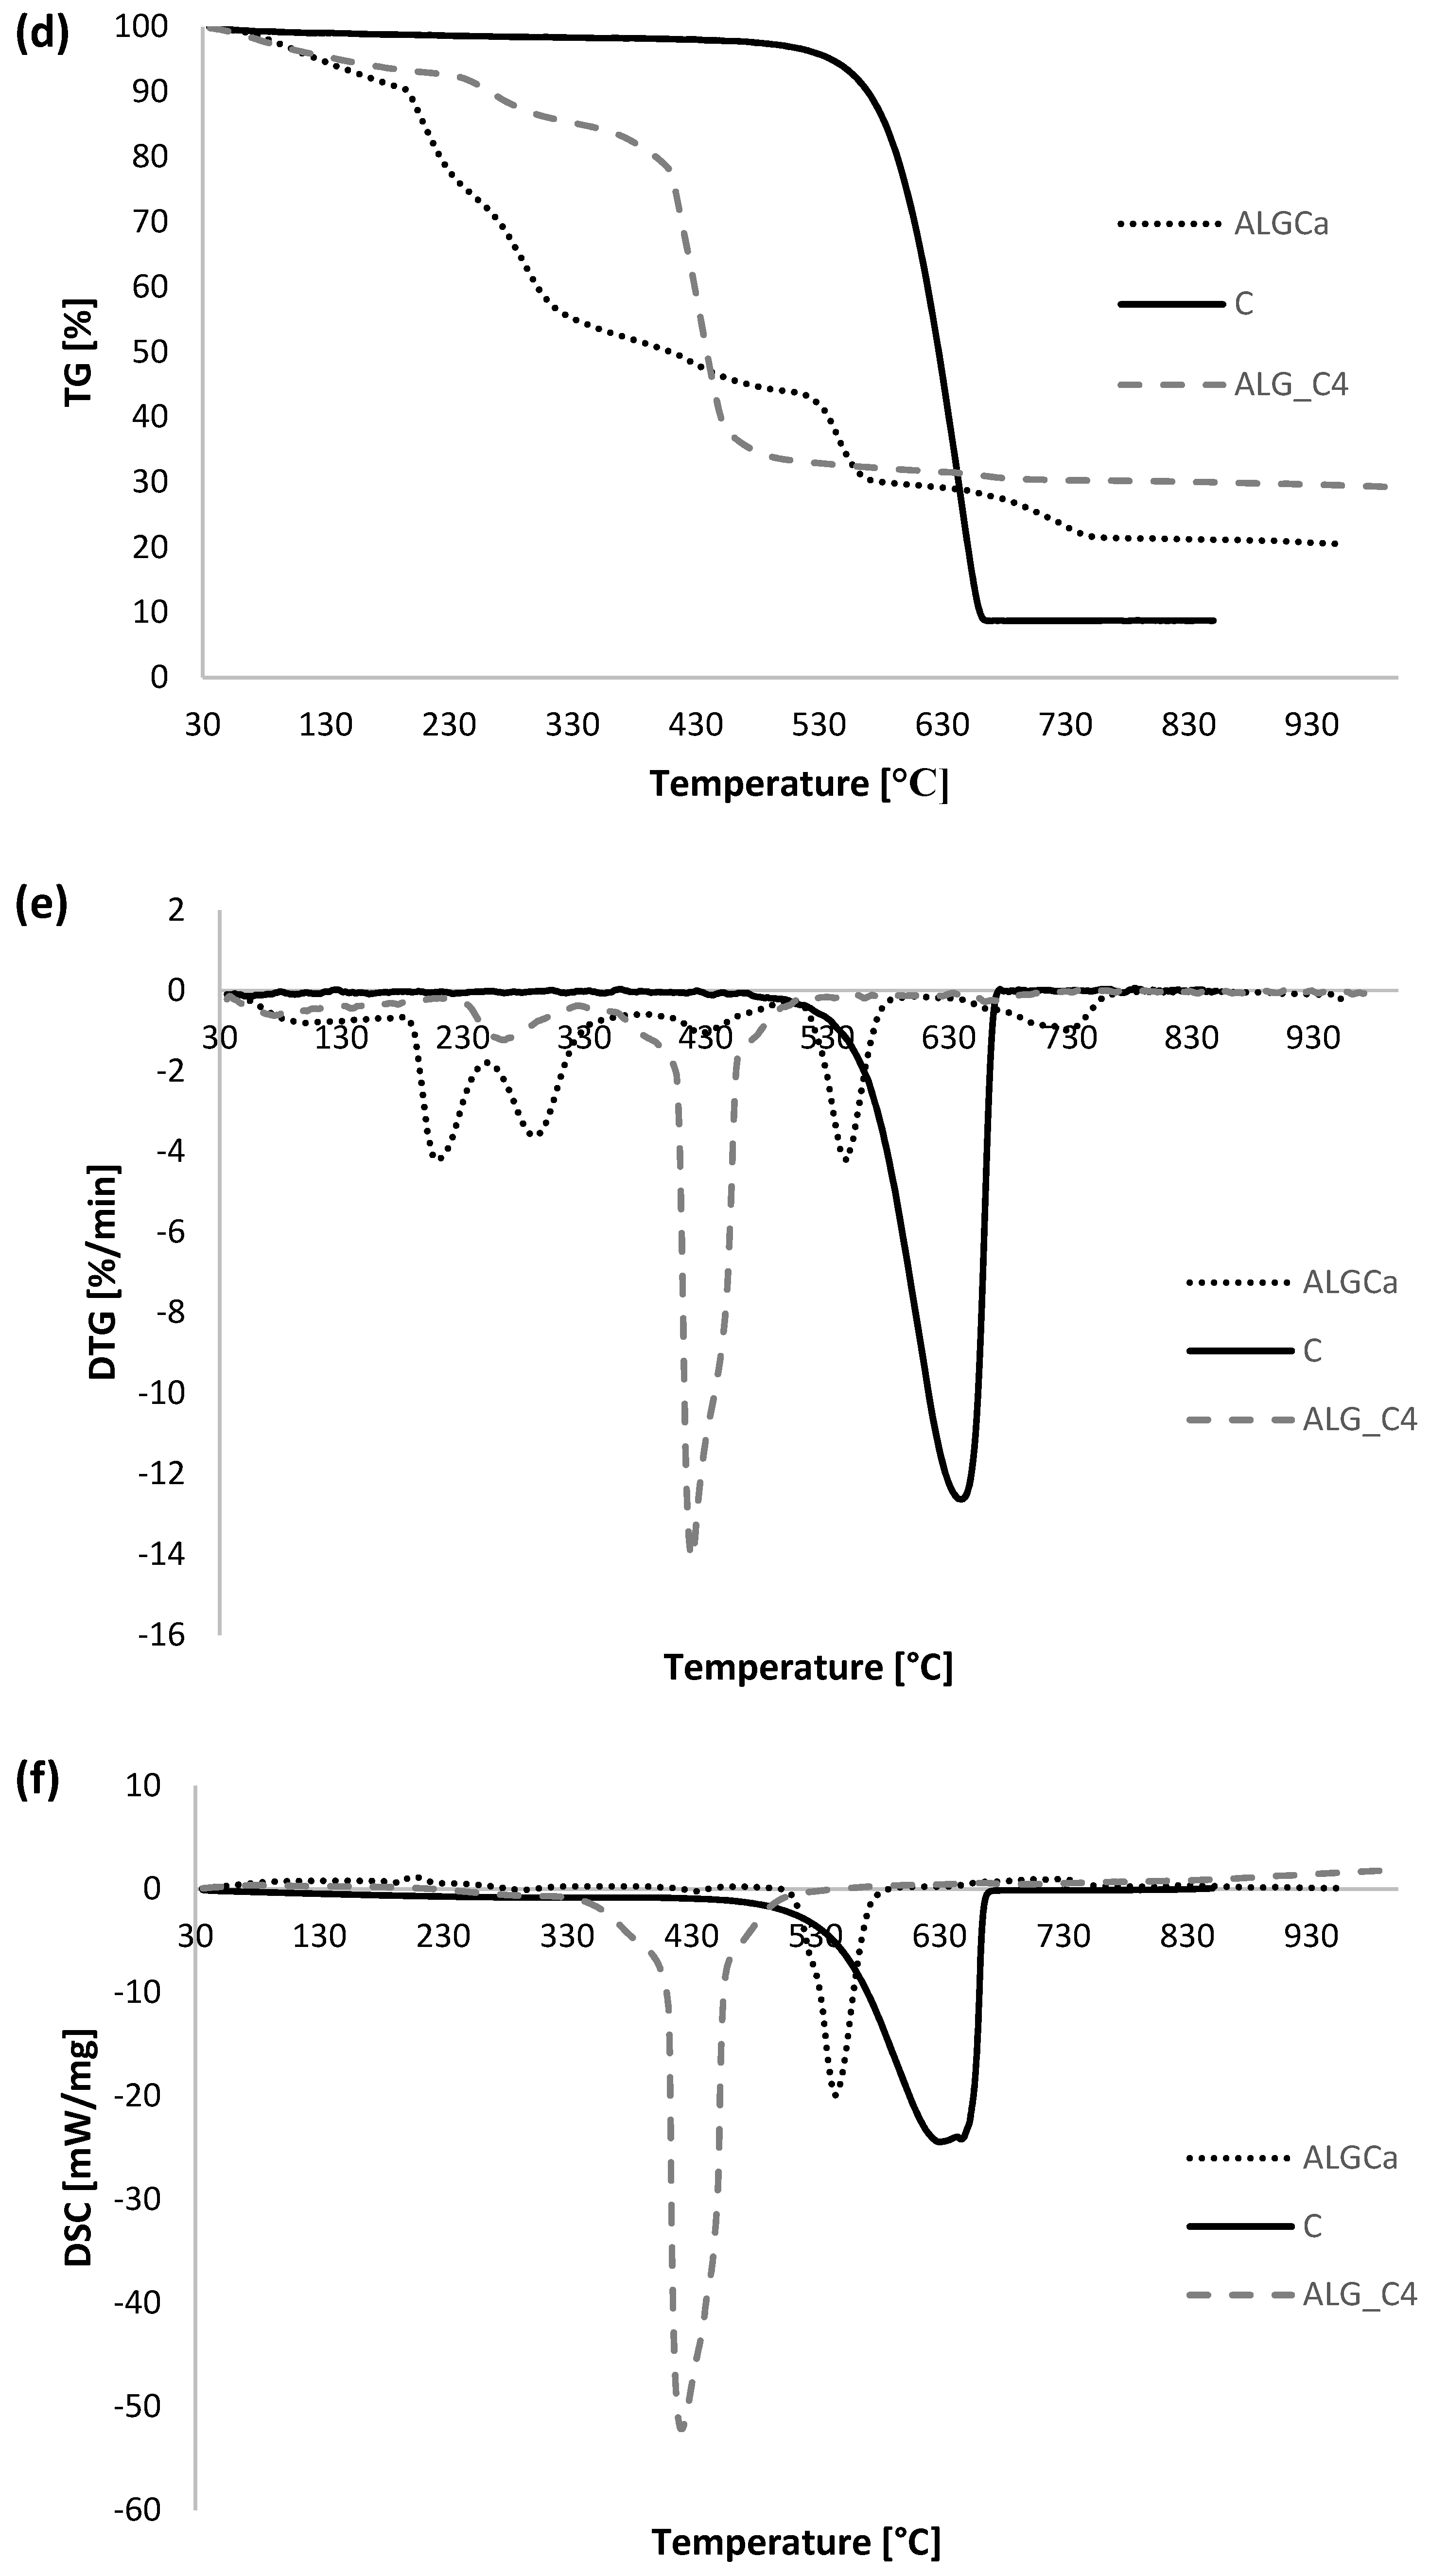
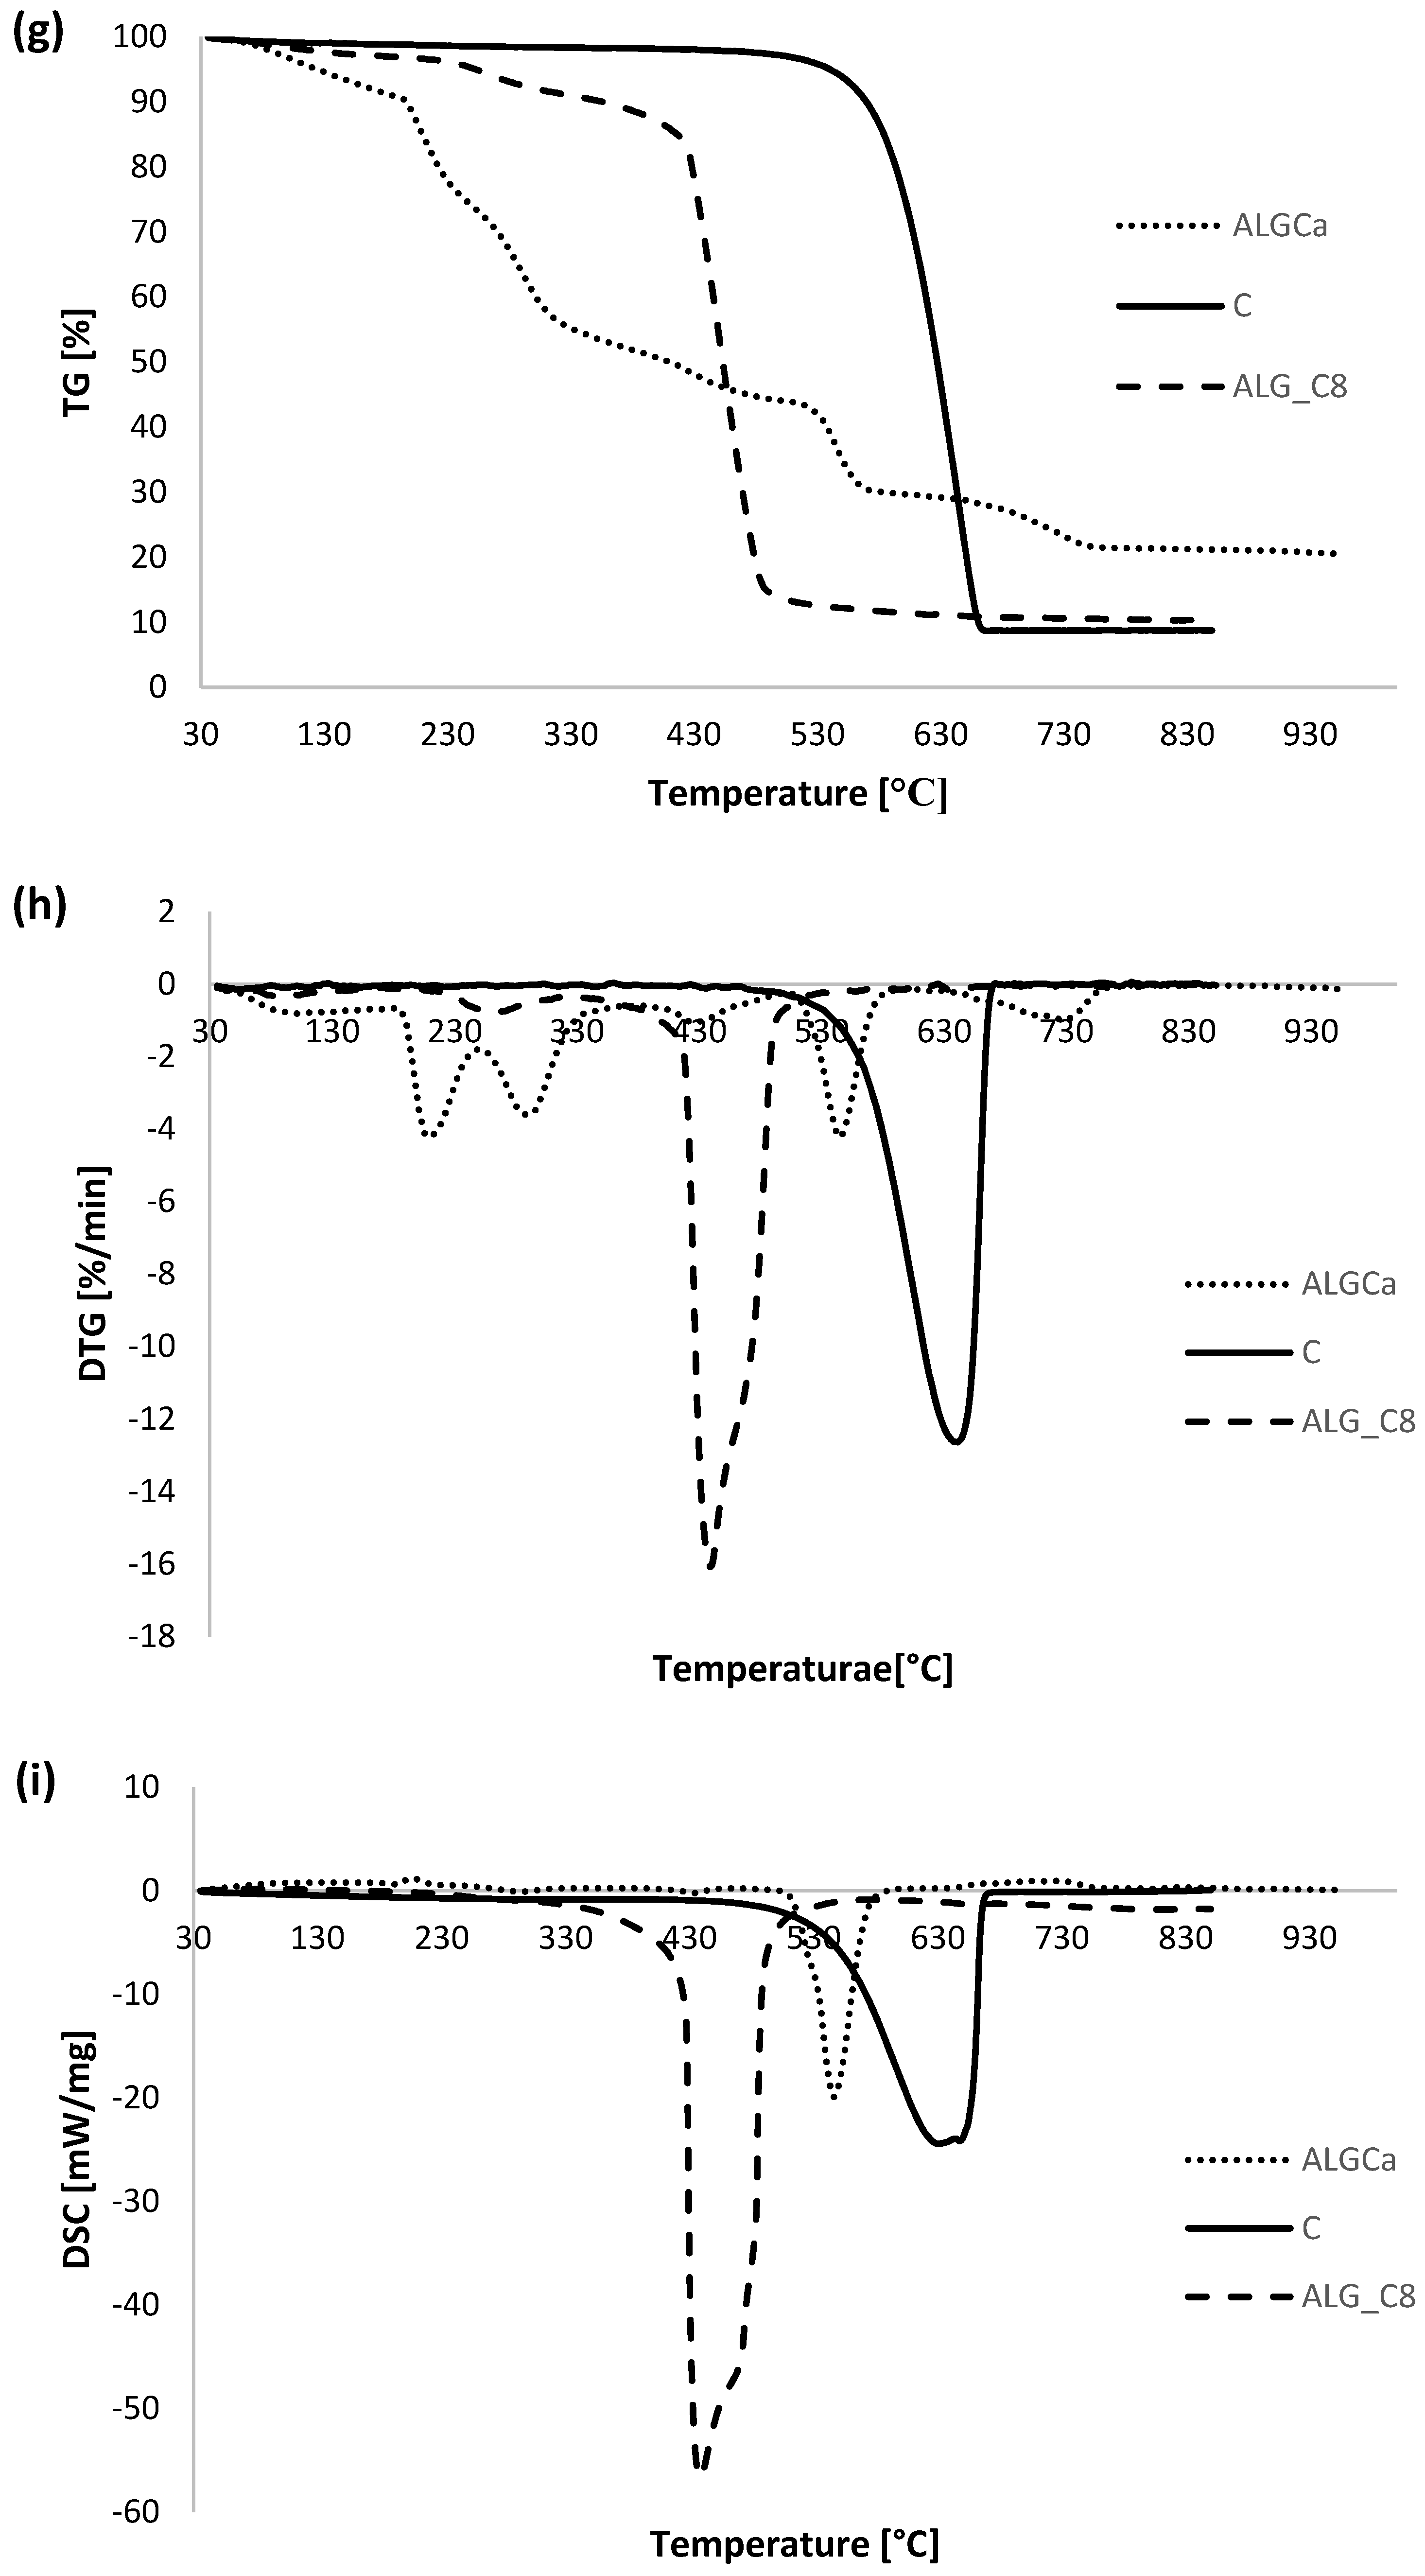
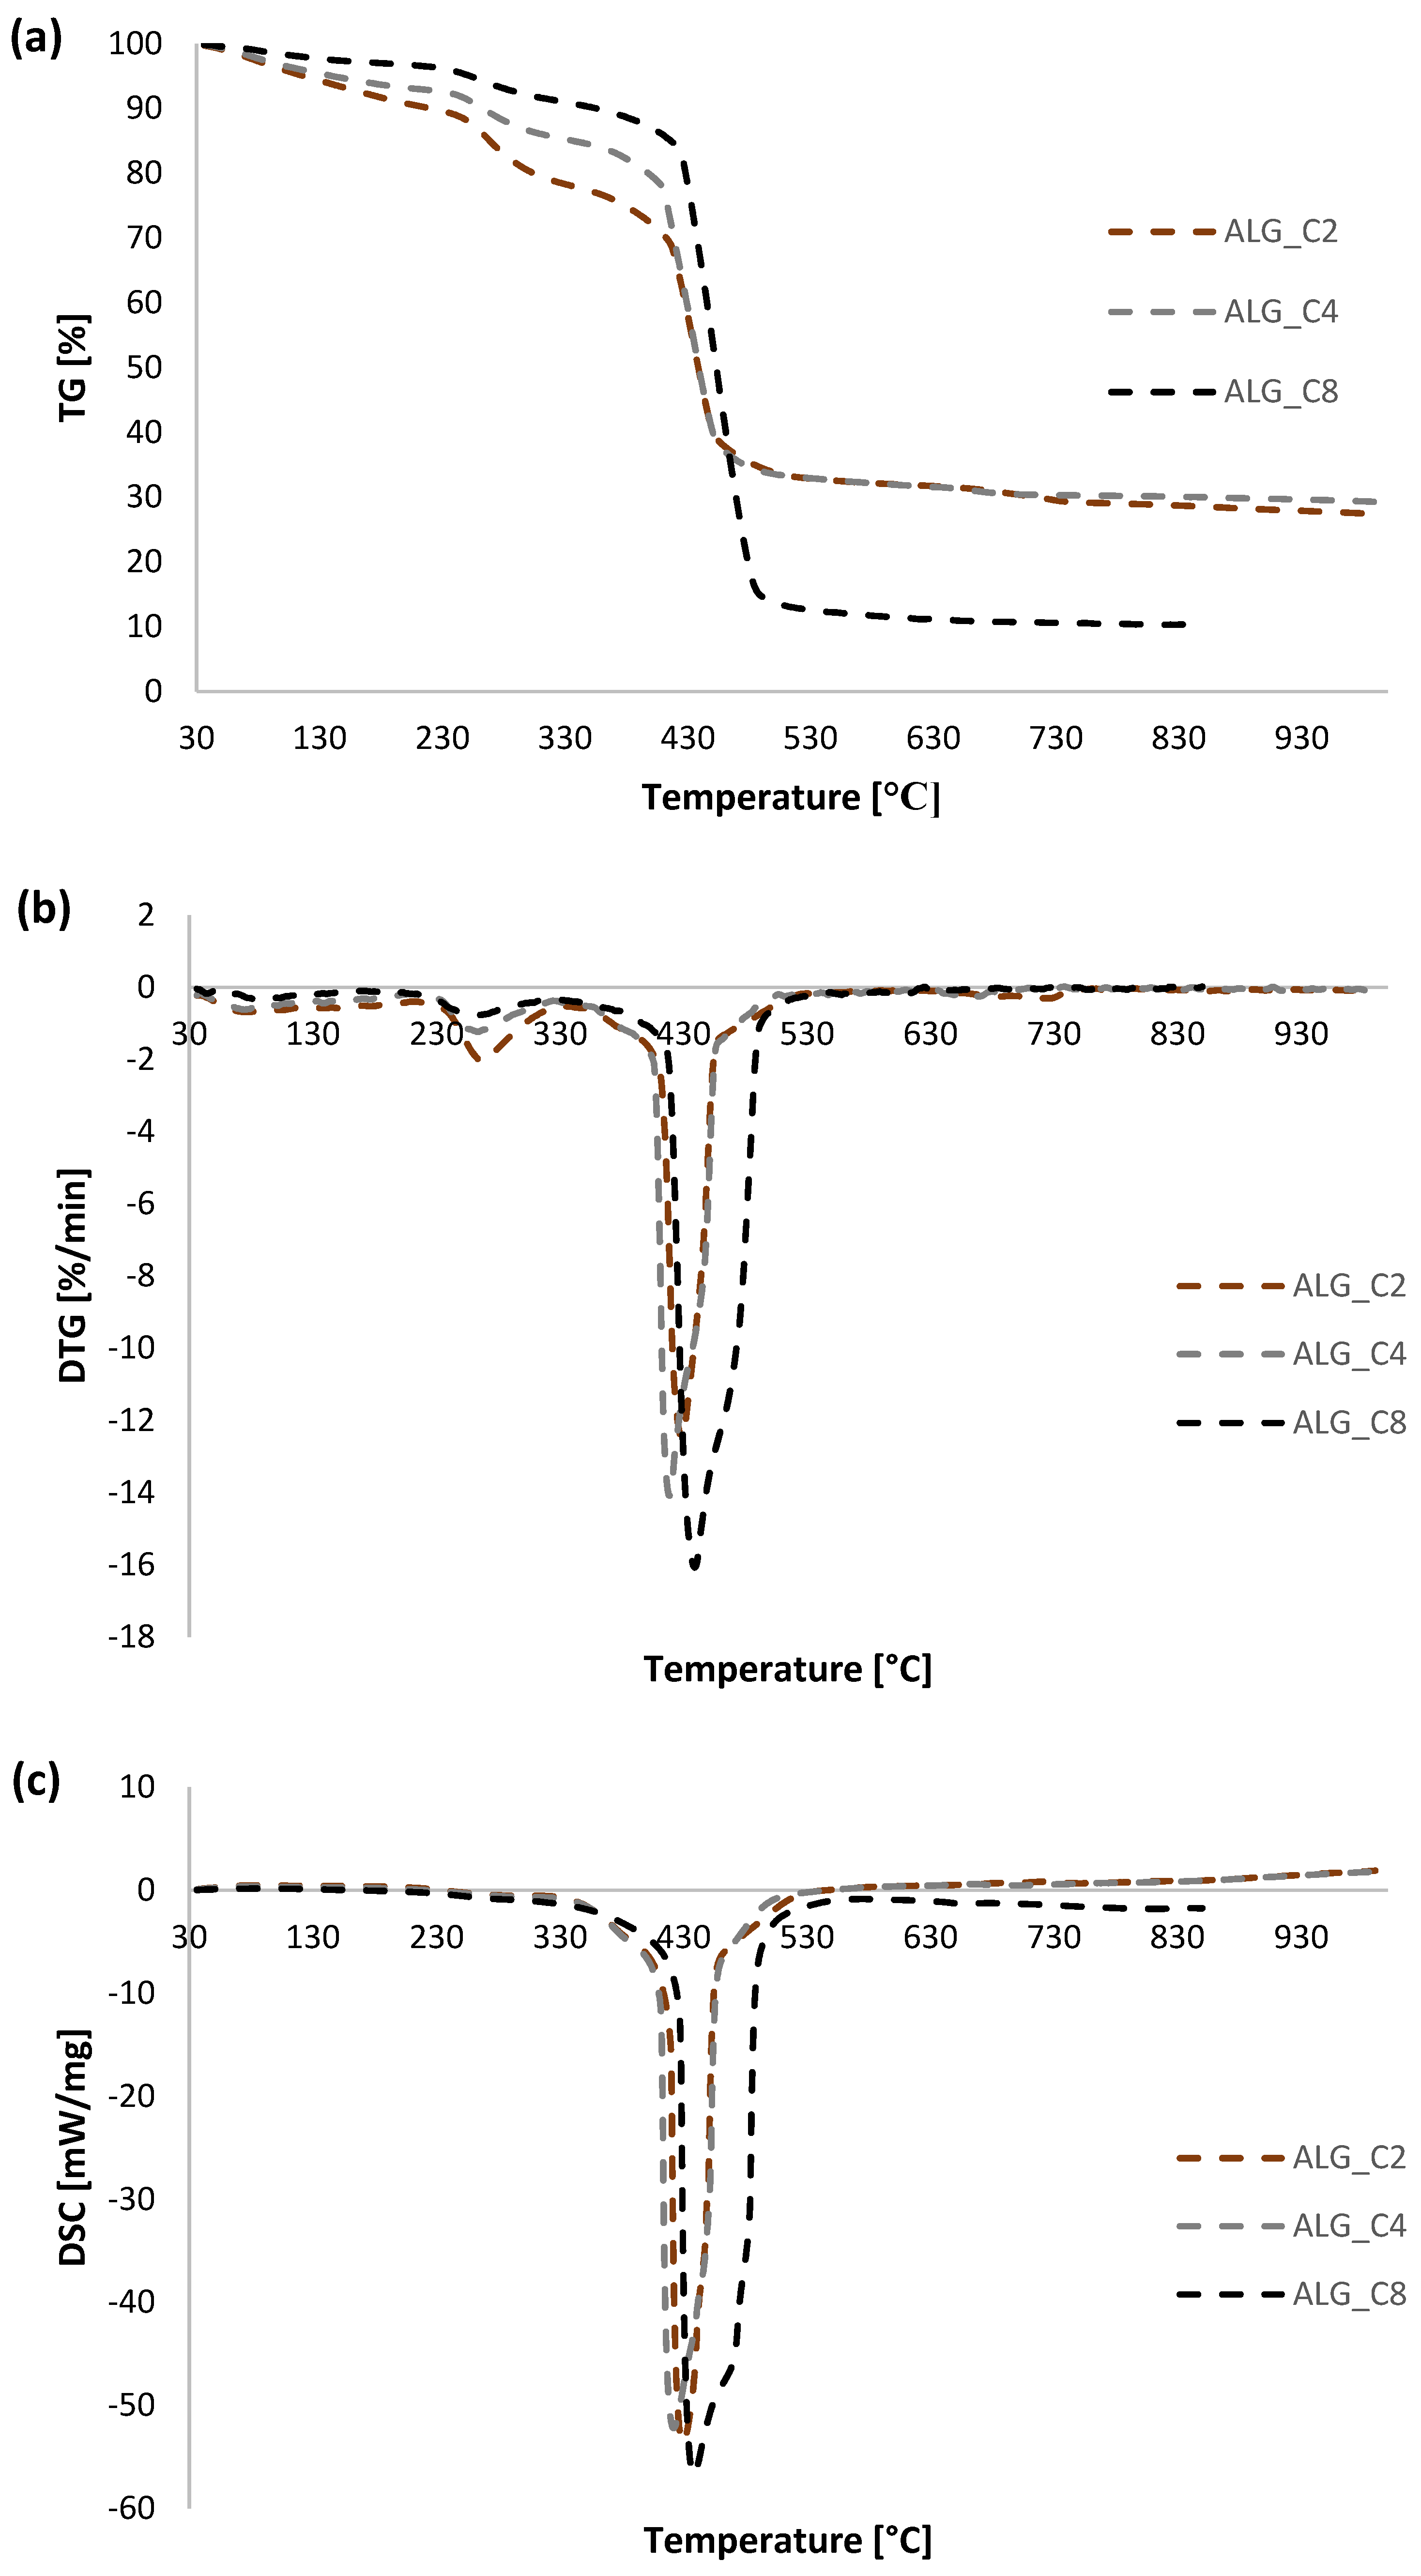
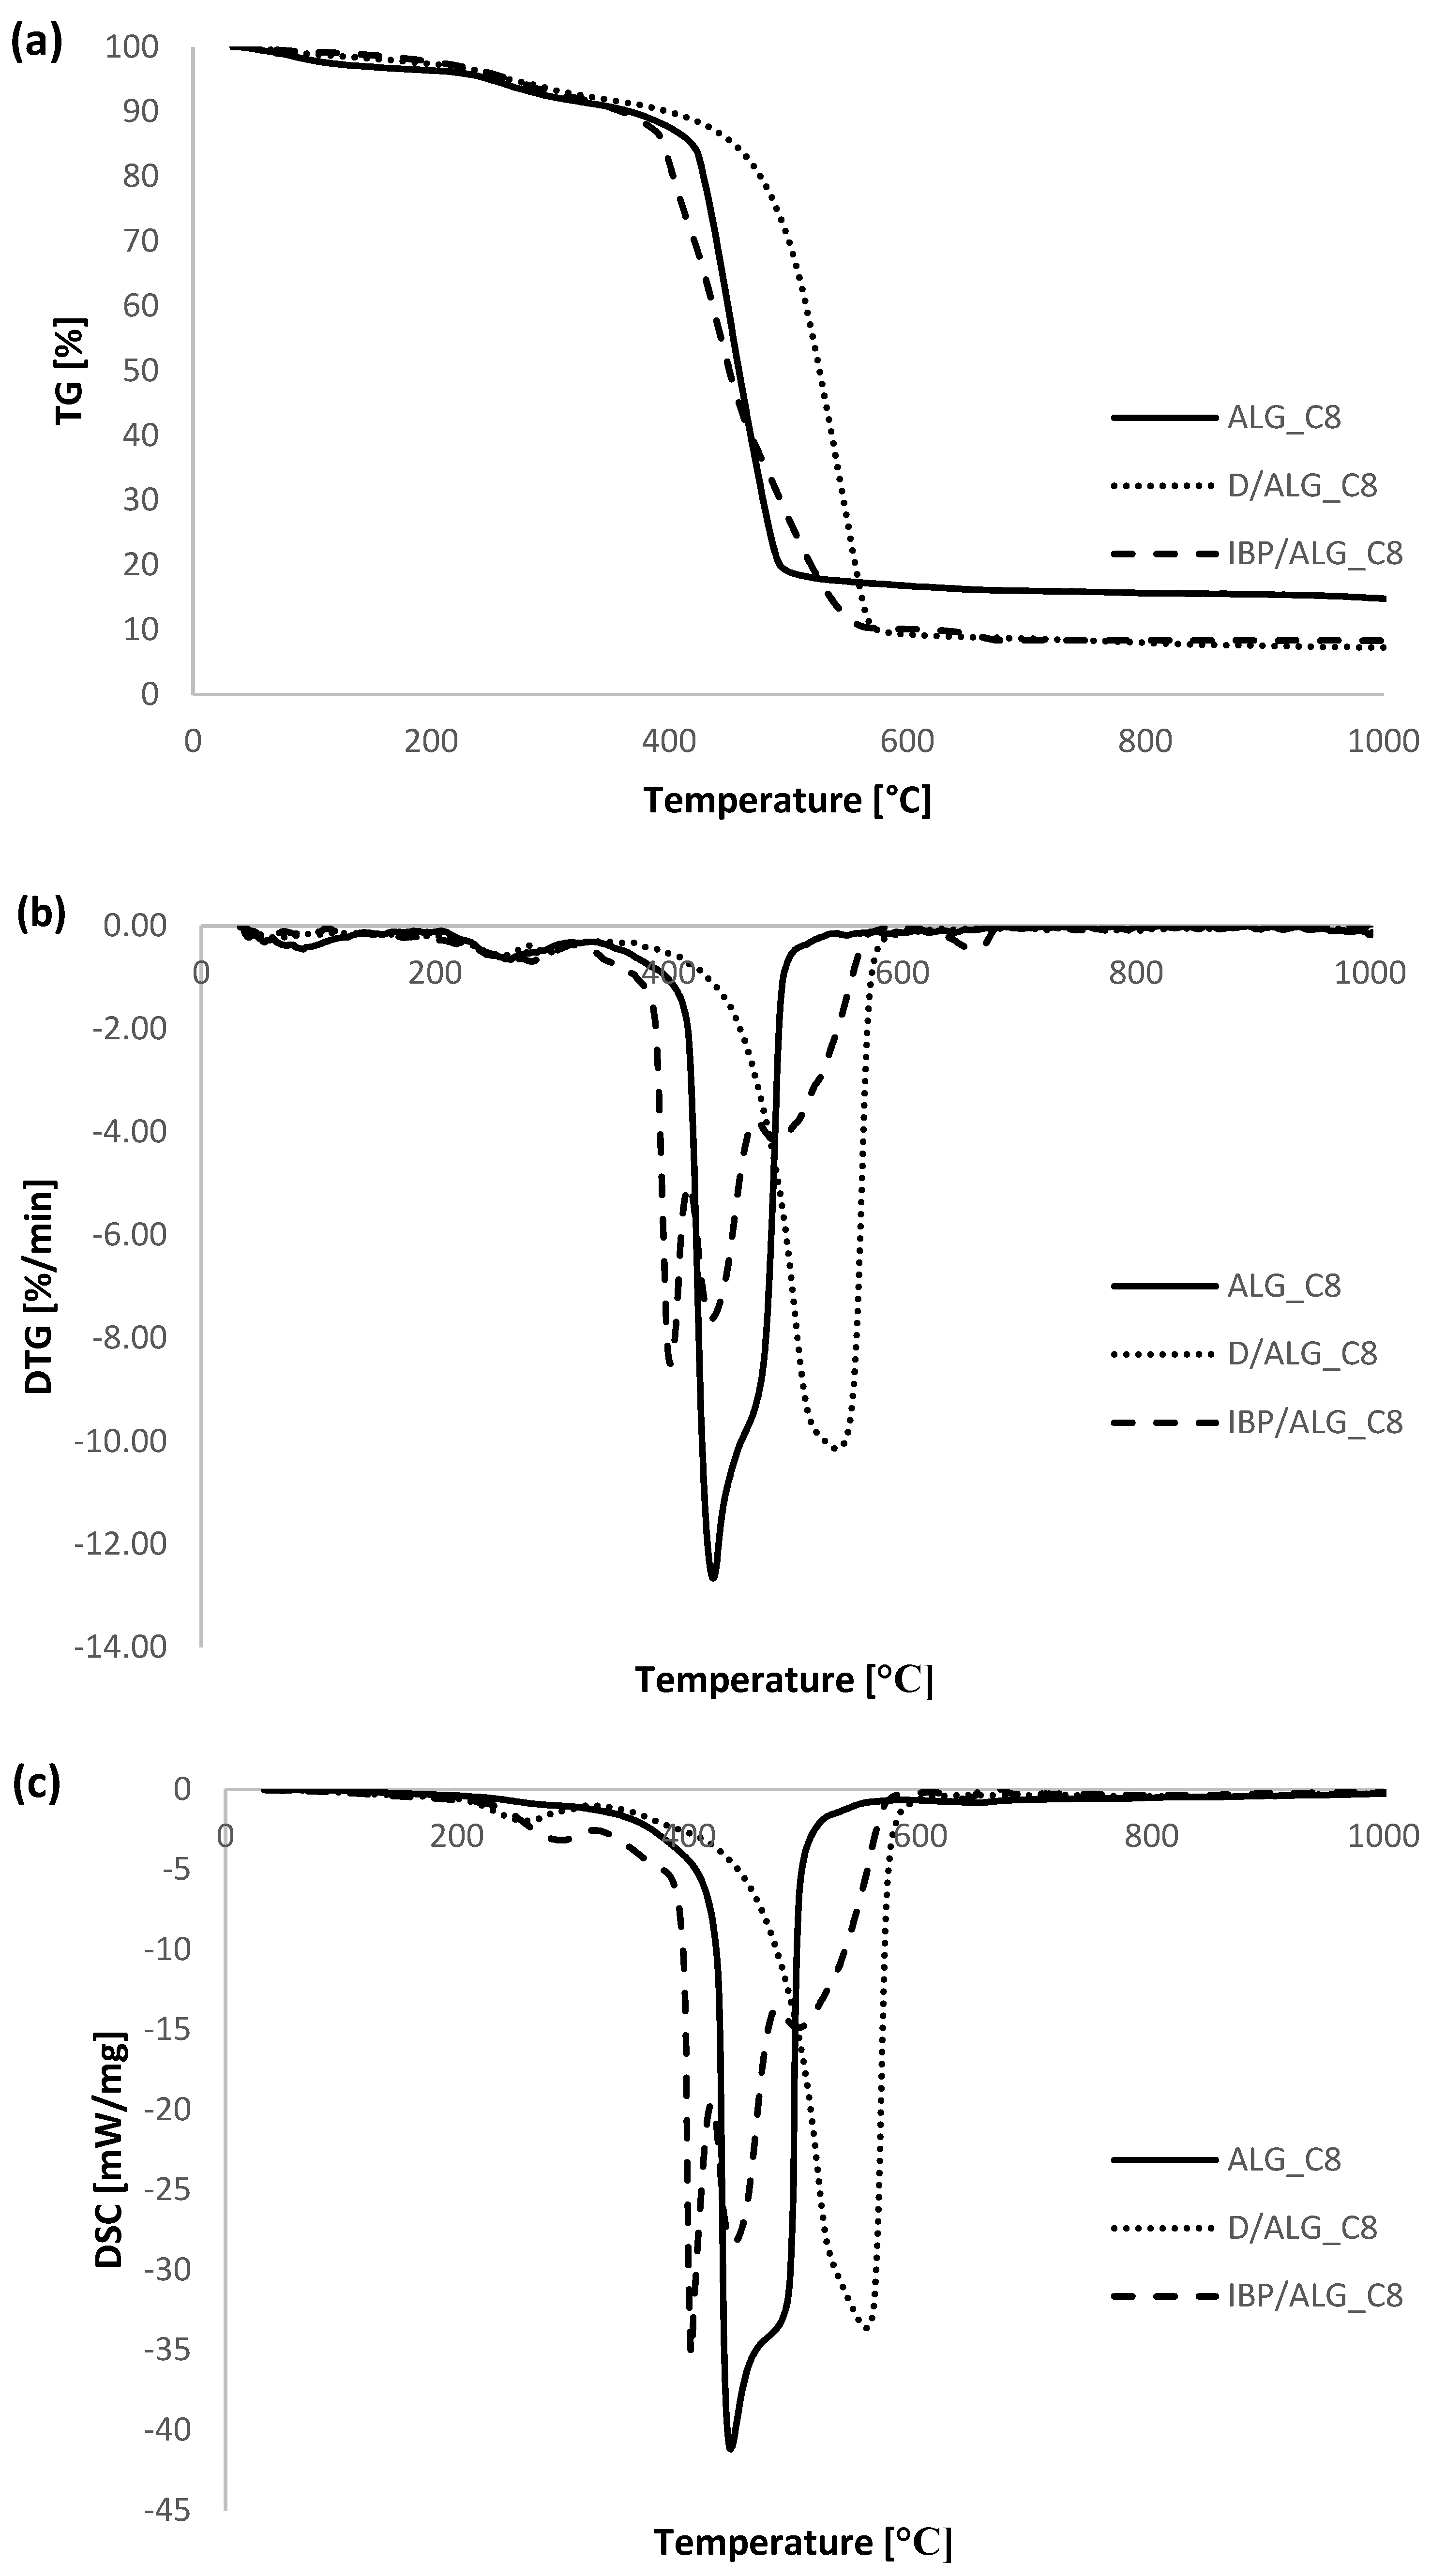
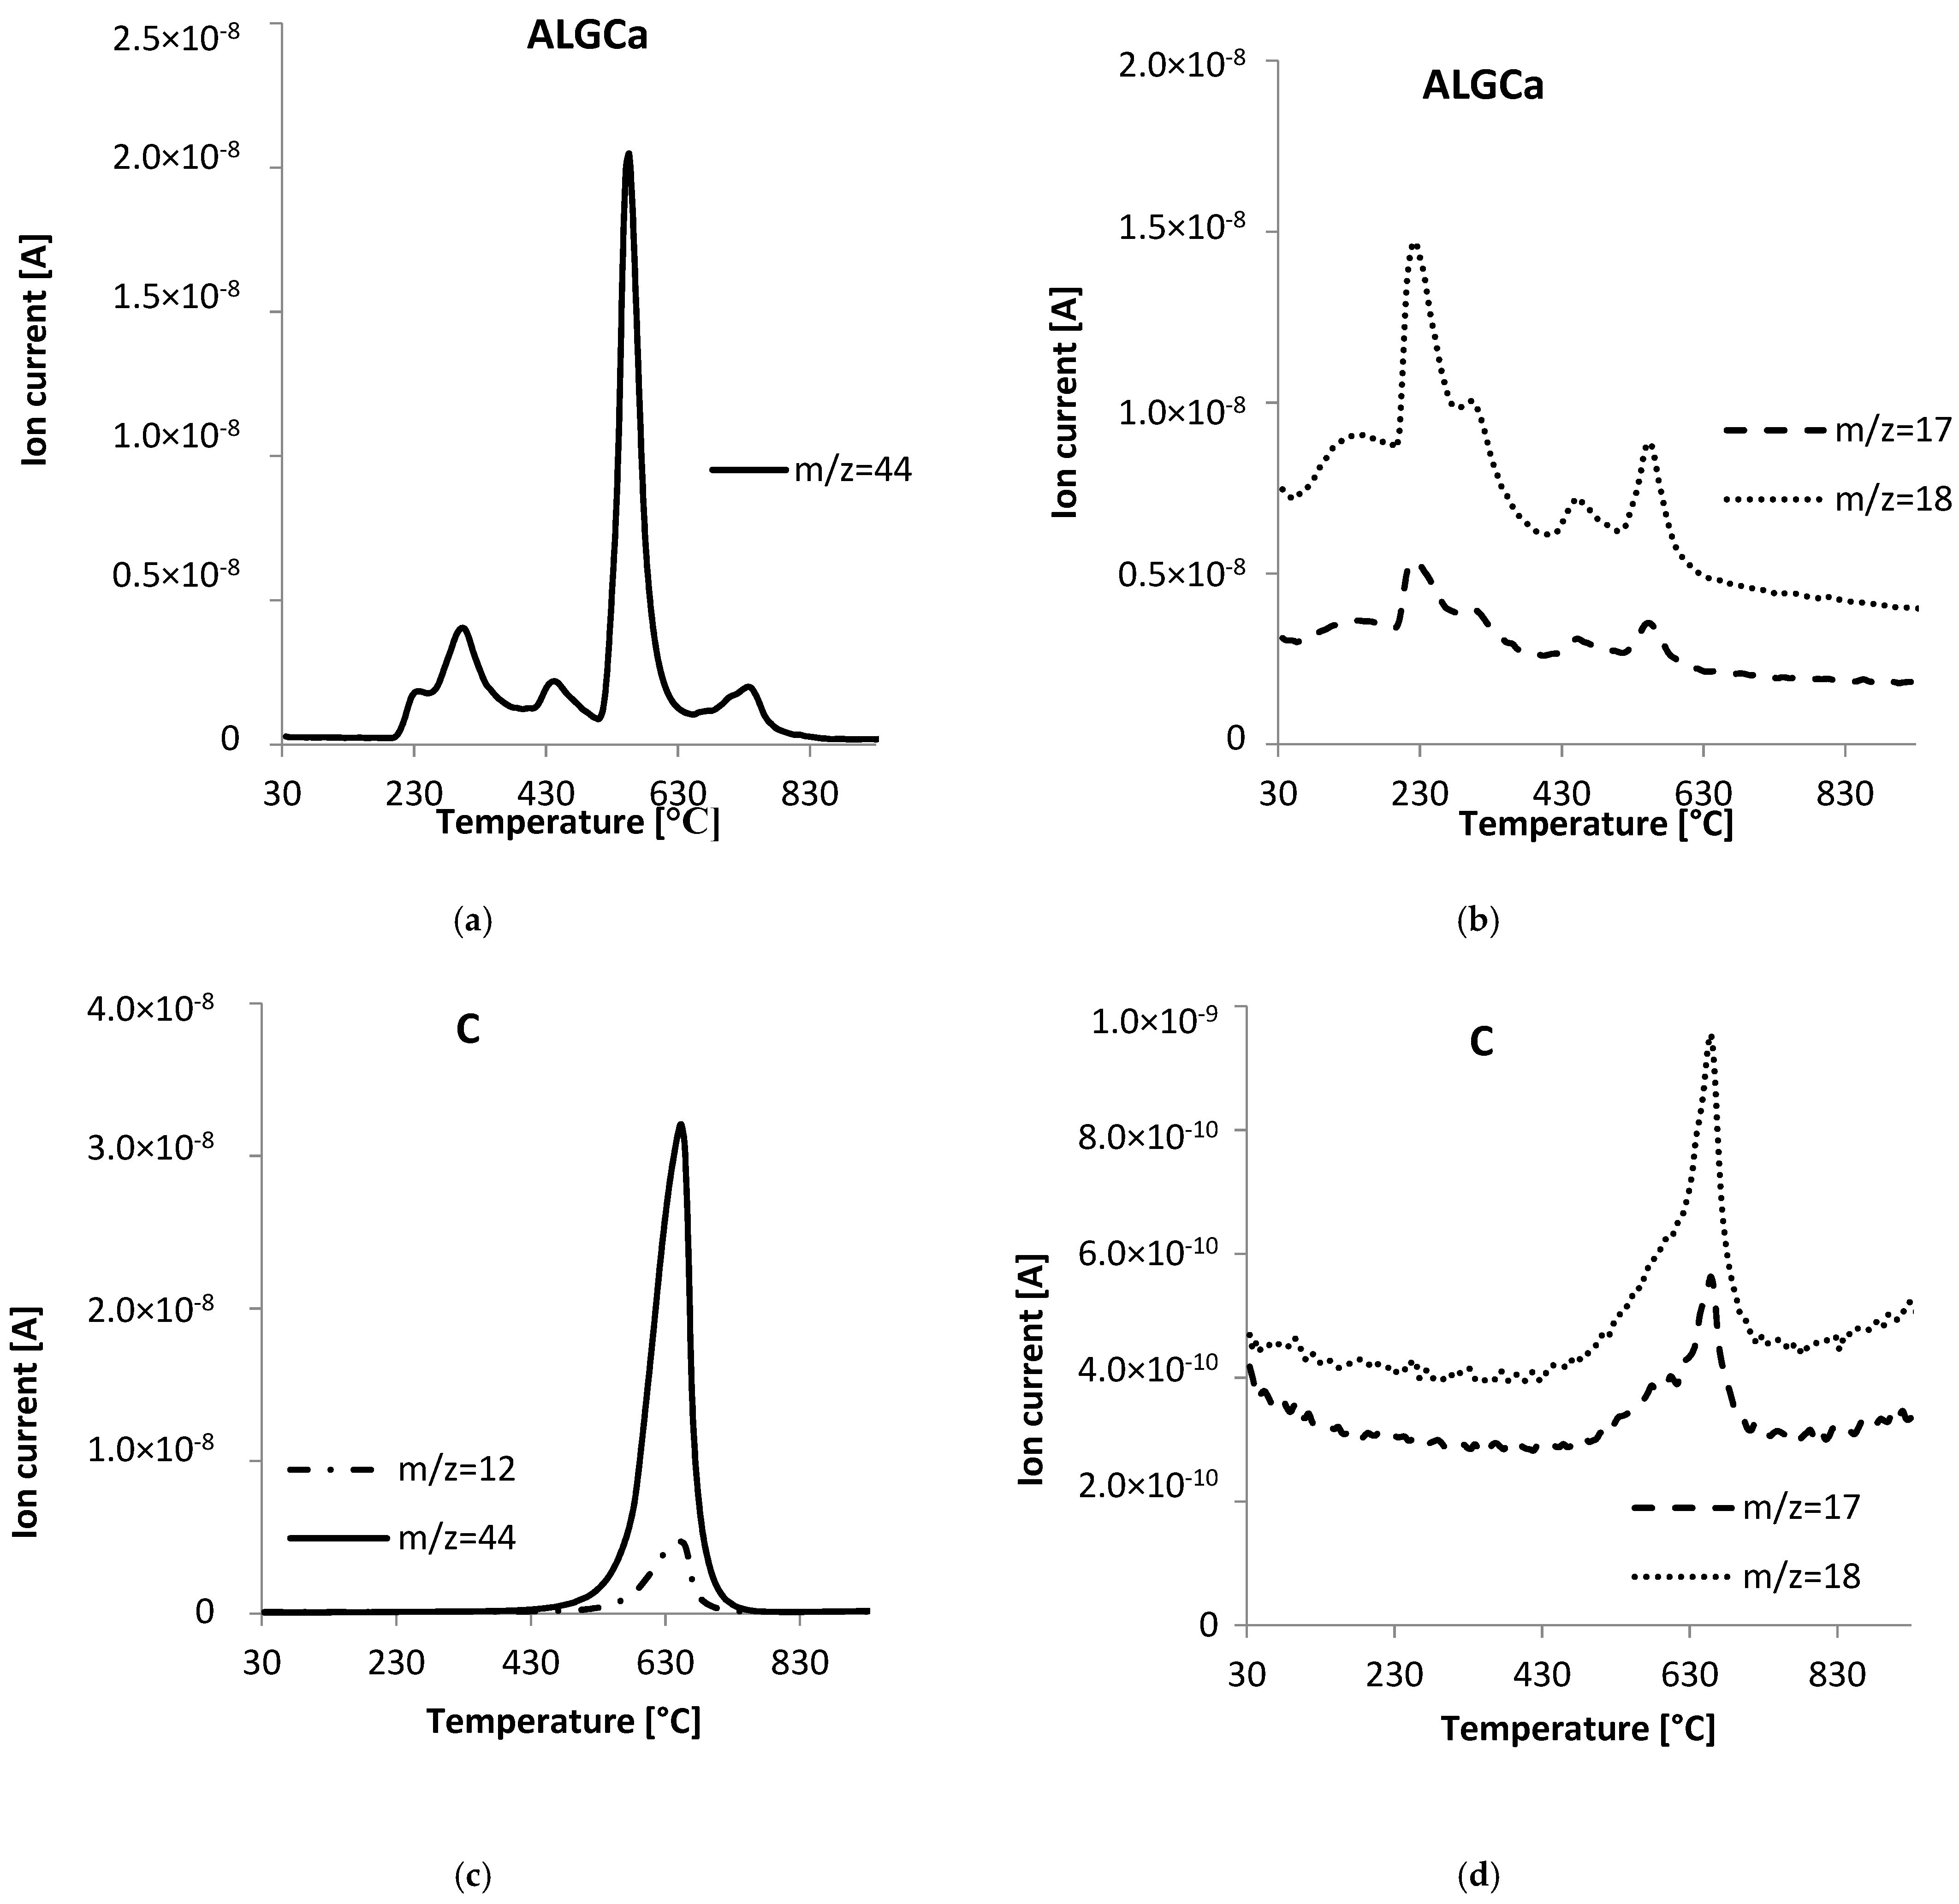
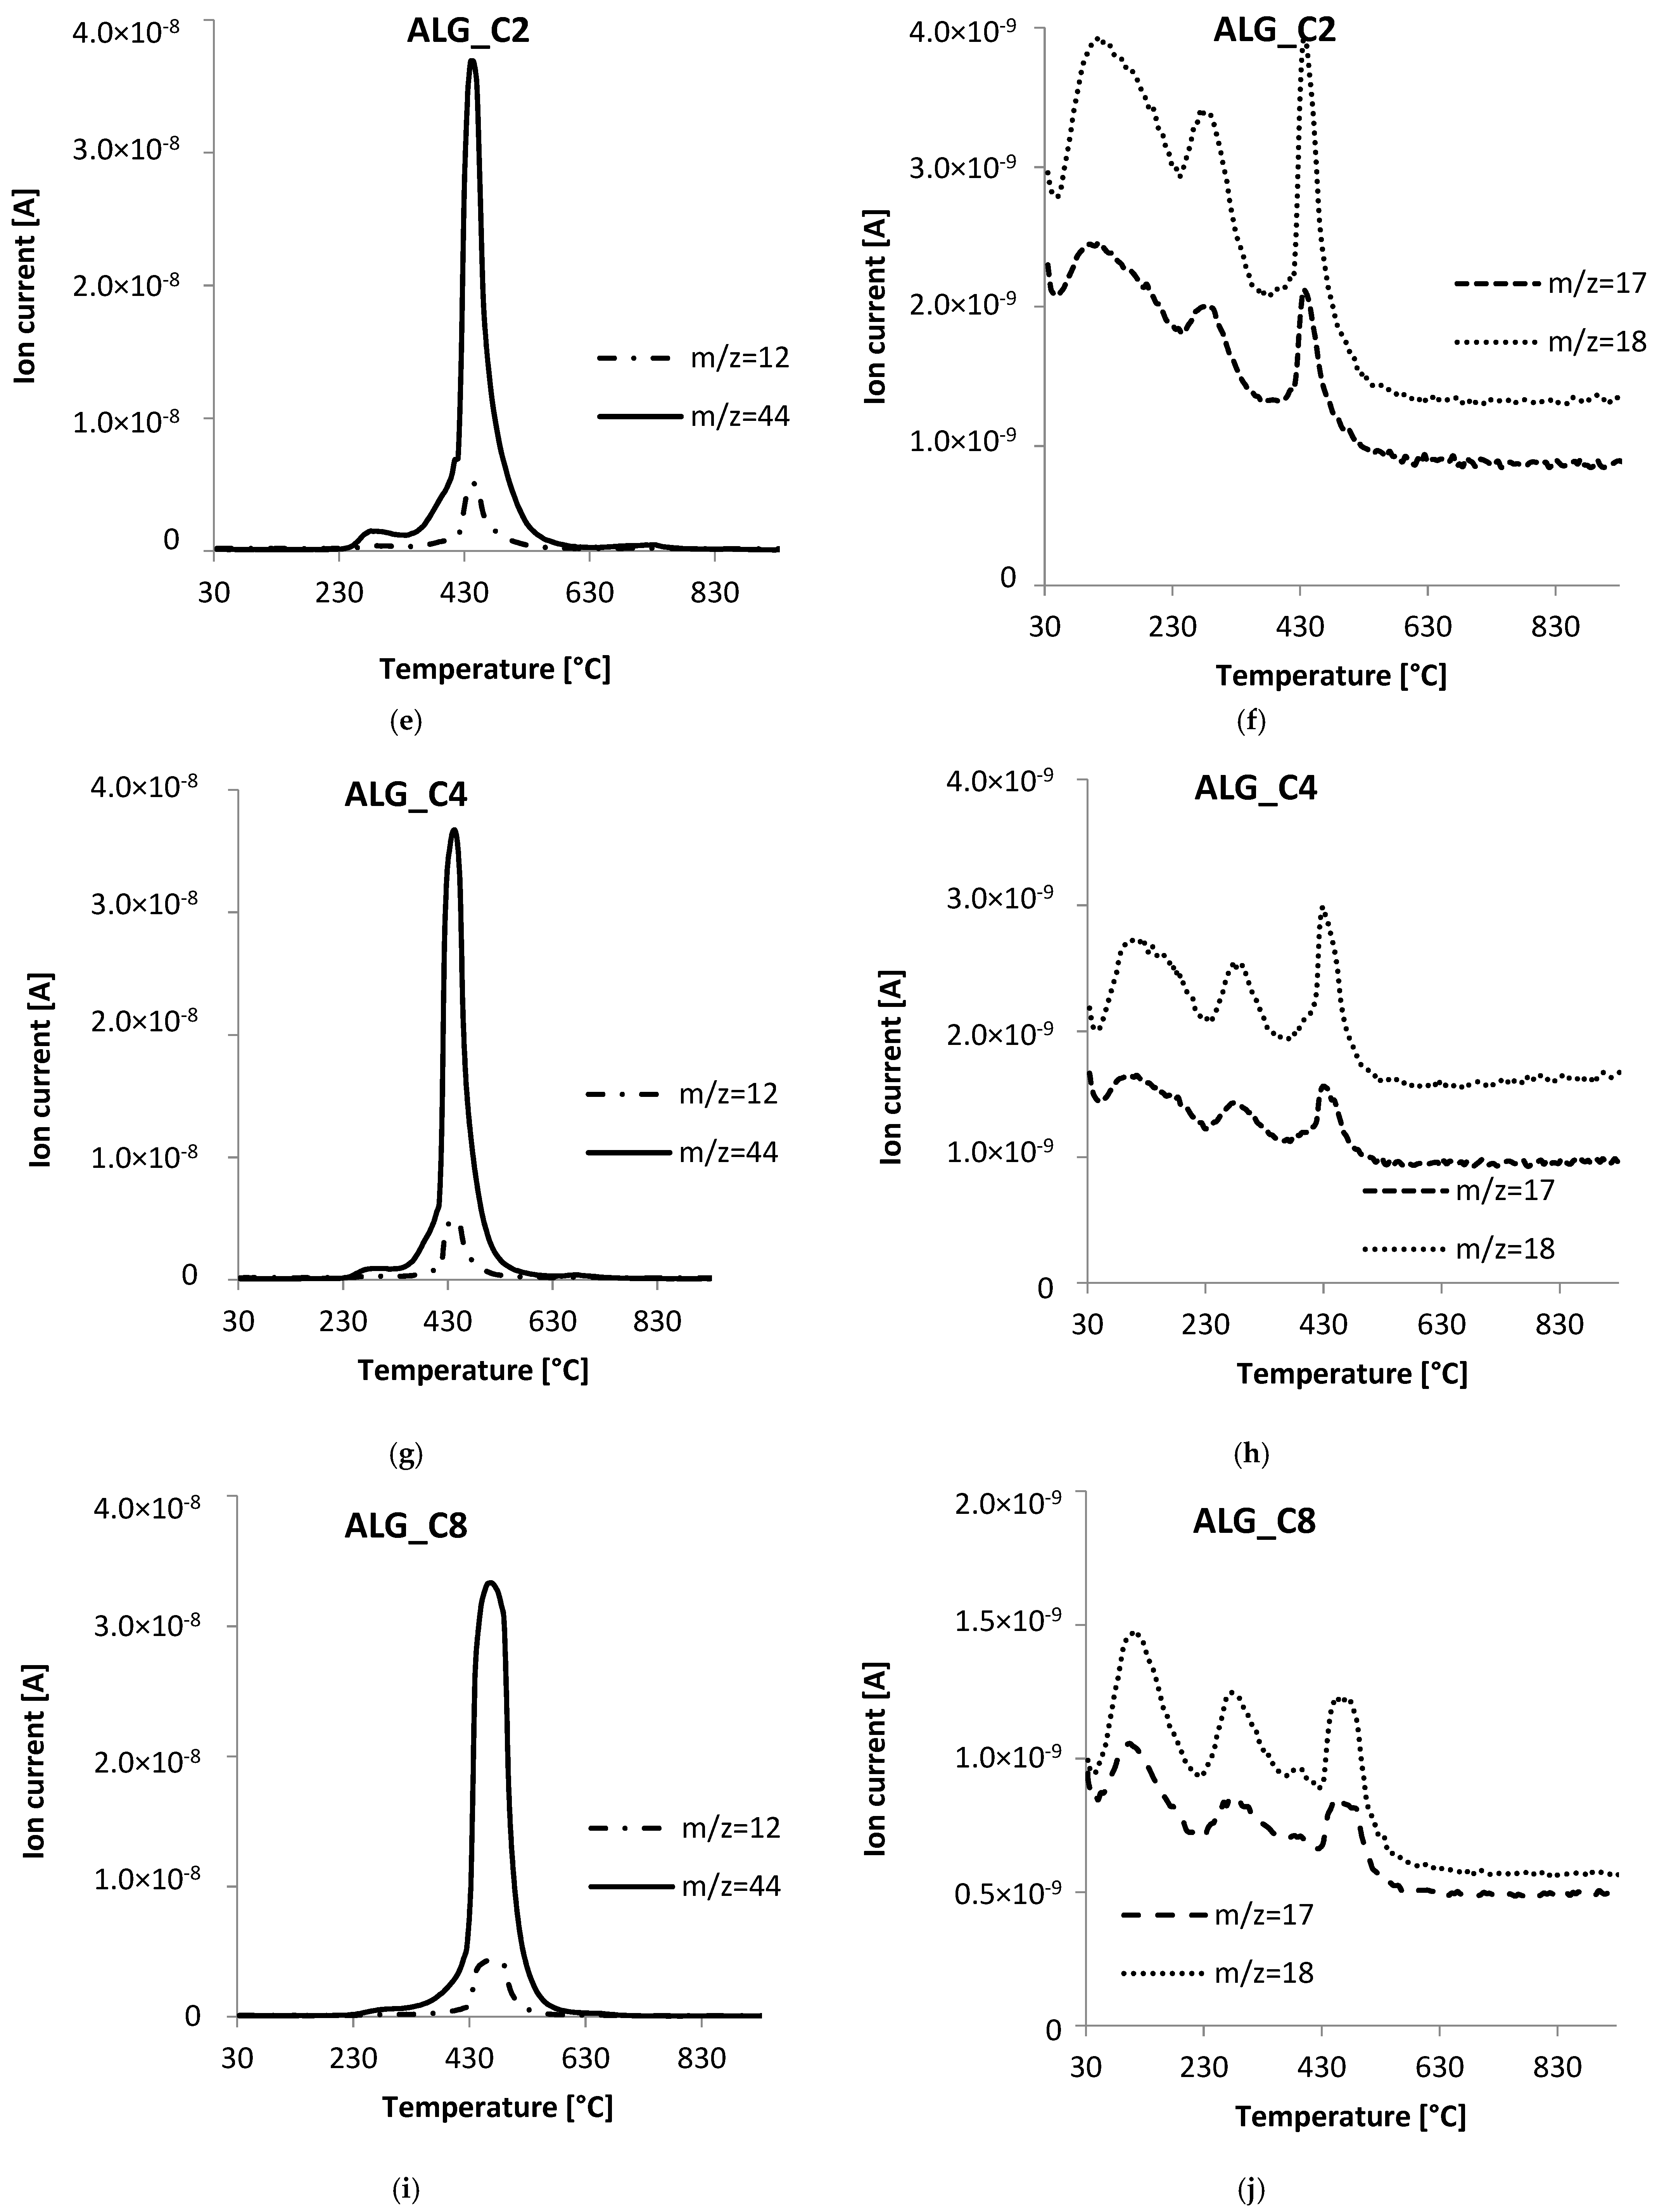
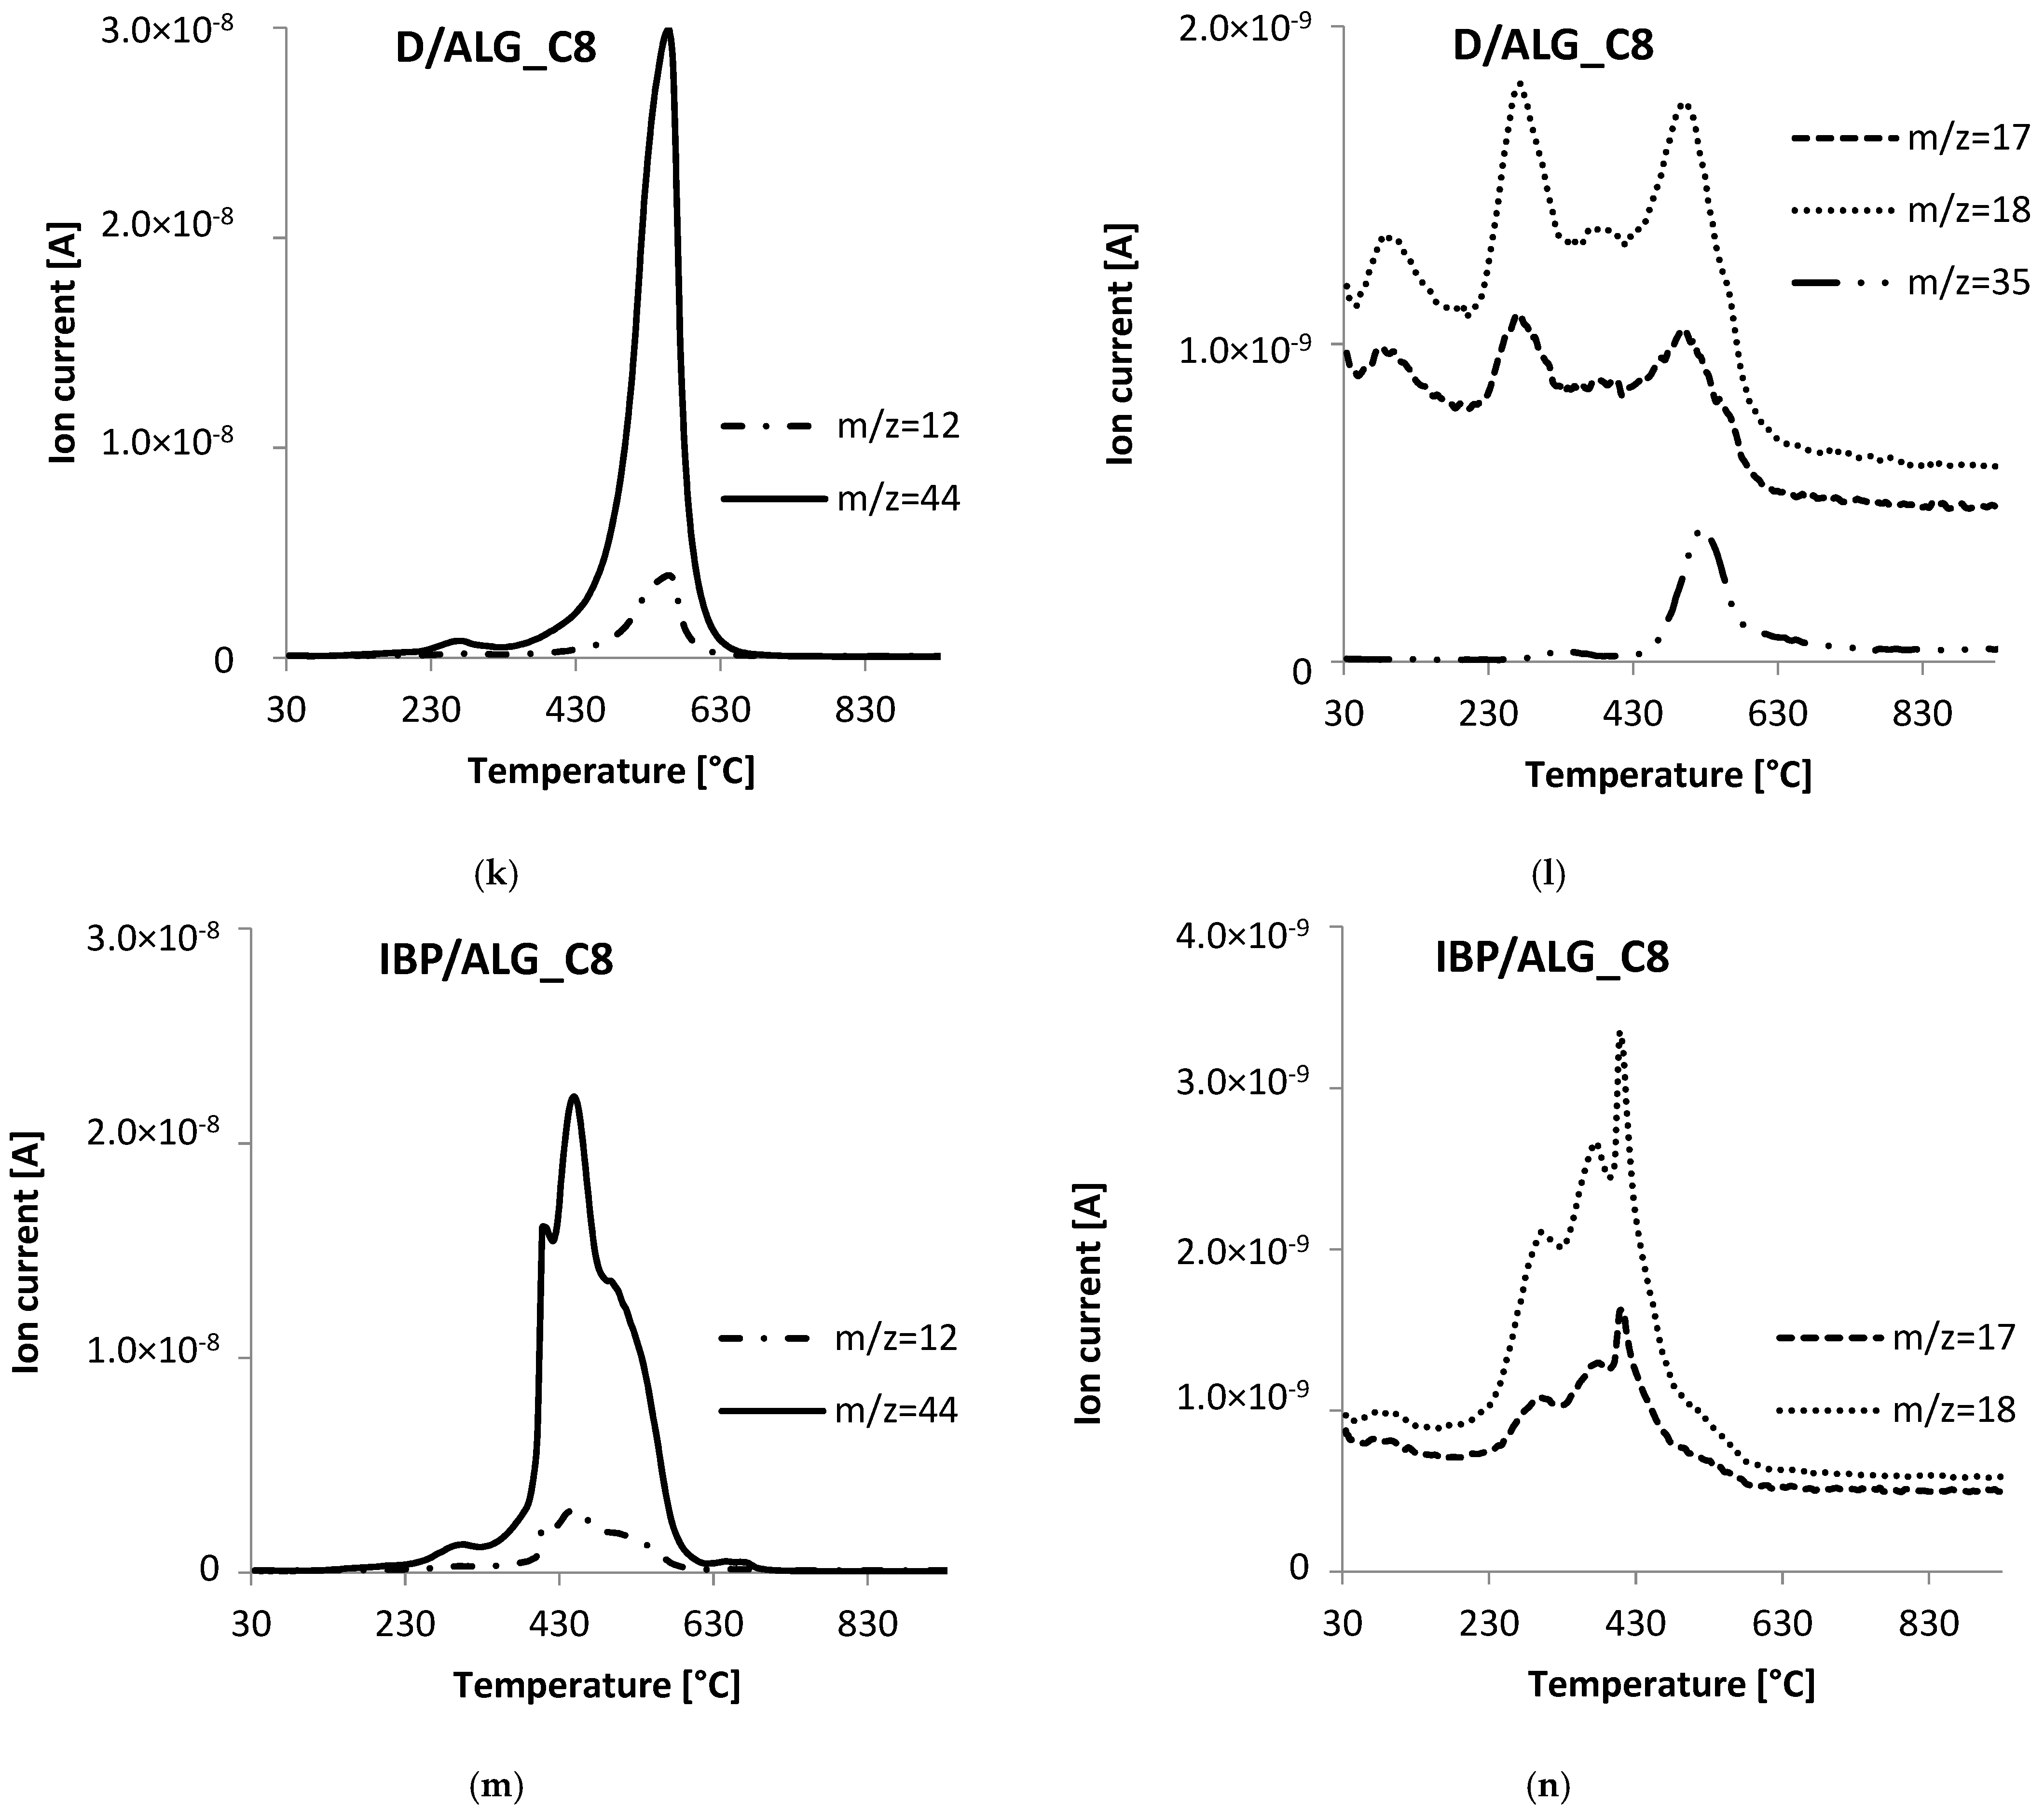
3.5. Thermal Analysis
4. Discussion
5. Conclusions
Author Contributions
Funding
Institutional Review Board Statement
Informed Consent Statement
Data Availability Statement
Conflicts of Interest
References
- Wasilewska, M.; Marczewski, A.W.; Deryło-Marczewska, A.; Sternik, D. Nitrophenols removal from aqueous solutions by activated carbon—Temperature effect of adsorption kinetics and equilibrium. J. Environ. Chem. Eng. 2021, 9, 105459–105478. [Google Scholar] [CrossRef]
- Ghemit, R.; Makhloufi, A.; Djebri, N.; Flilissa, A.; Zerrual, L.; Boutahala, M. Adsorptive removal of diclofenac and ibuprofen from aqueous solution by organo-bentonites: Study in single and binary systems. Groundw. Sustain. Dev. 2019, 8, 520–529. [Google Scholar] [CrossRef]
- Martín, J.; del Mar Orta, M.; Medina-Carrasco, S.; Santos, J.L.; Aparicio, I.; Alonso, E. Evaluation of a modified mica and montmorillonite for the adsorption of ibuprofen from aqueous media. Appl. Clay Sci. 2019, 171, 29–37. [Google Scholar] [CrossRef]
- Malvar, J.L.; Martin, J.; del Mar Orta, M.; Medina-Carrasco, S.; Santos, J.L.; Aparicio, I.; Alonso, E. Simultaneous and individual adsorption of ibuprofen metabolites by modified montmorillonite. Appl. Clay Sci. 2020, 189, 105529–105537. [Google Scholar] [CrossRef]
- De Oliveira, T.; Guégan, R.; Thiebault, T.; Le Milbeau, C.; Muller, F.; Teixeira, V.; Giovanela, M.; Boussafir, M. Adsorption of diclofenac onto organoclays: Effects of surfactant and environmental (pH and temperature) conditions. J. Hazard. Mater. 2017, 323, 558–566. [Google Scholar] [CrossRef] [PubMed]
- Sun, K.; Shi, Y.; Chen, H.; Wang, X.; Li, Z. Extending surfactant-modified 2:1 clay minerals for the uptake and removal of diclofenac from water. J. Hazard. Mater. 2017, 323, 567–574. [Google Scholar] [CrossRef] [PubMed]
- Sun, K.; Shi, Y.; Wang, X.; Rasmussen, J.; Li, Z.; Zhu, J. Organokaolin for uptake of pharmaceuticals diclofenac and chloramphenicol diclofenac from water. Chem. Eng. J. 2017, 330, 1128–1136. [Google Scholar] [CrossRef]
- Smiljanić, D.; de Gennaro, B.; Izzo, F.; Langella, A.; Daković, A.; Germinario, C.; Rottinghaus, G.E.; Spasojević, M.; Mercurio, M. Removal of emerging contaminants from water by zeolite-rich composites: A first approach aiming at diclofenac and ketoprofen. Microporous Mesoporous Mater. 2020, 298, 110057–110068. [Google Scholar] [CrossRef]
- Smiljanić, D.; de Gennaro, B.; Daković, A.; Galzerano, B.; Germinario, C.; Izzo, F.; Rottinghaus, G.E.; Langella, A. Removal of non-steroidal anti-inflammatory drugs from water by zeolite-rich composites: The interference of inorganic anions on the ibuprofen and naproxen adsorption. J. Environ. Manag. 2021, 286, 112168–112177. [Google Scholar] [CrossRef]
- Cao, Y.; Nakhjiri, A.T.; Ghadiri, M. Numerical investigation of ibuprofen removal from pharmaceutical wastewater using adsorption process. Sci. Rep. 2021, 11, 24478–24488. [Google Scholar] [CrossRef]
- Yang, Y.; Ok, Y.S.; Kim, K.-H.; Kwon, E.E.; Tsang, Y.F. Occurrences and removal of pharmaceuticals and personal care products (PPCPs) in drinking water and water/sewage treatment plants: A review. Sci. Total Environ. 2017, 596–597, 303–320. [Google Scholar] [CrossRef] [PubMed]
- Montes-Grajales, D.; Fennix-Agudelo, M.; Miranda-Castro, W. Occurrence of personal care products as emerging chemicals of concern in water resources: A review. Sci. Total Environ. 2017, 595, 601–614. [Google Scholar] [CrossRef] [PubMed]
- Arafa, E.G.; Saba, M.W.; Mohad, R.R.; Kamel, E.M.; Elzanty, A.M.; Mohmound, A.M.; Abdel-Gawad, O.F. Eco-friendly and biodegradable sodium alginate/quaternized chitosan hydrogel for controlled release of urea and its antimicrobial activity. Carbohydr. Polym. 2022, 291, 119555–119568. [Google Scholar] [CrossRef]
- Quesada, H.B.; de Araújo, T.P.; Cusioi, L.F.; de Barros, M.A.S.D.; Gmes, R.G.; Bergamasco, R. Chitosan, alginate and other macromolecules as activated carbon immobilizing agents: A review on composite adsorbents for the removal of water contaminants. Int. J. Biol. Macromol. 2020, 1640, 2535–2549. [Google Scholar] [CrossRef] [PubMed]
- Fila, D.; Hubicki, Z.; Kołodyńska, D. Fabrication, characterization and evaluation of an alginate—Lignin composite for rare—Earth elements recovery. Materials 2022, 15, 944. [Google Scholar] [CrossRef]
- Sukmana, H.; Bellahsen, N.; Pantoja, F.; Hodur, C. Adsorption and coagulation in wastewater treatment—Review. Prog. Agric. Eng. Sci. 2021, 17, 49–68. [Google Scholar] [CrossRef]
- Hamad, H.N.; Idrus, S. Recent Developments in the Application of Bio-Waste-Derived Adsorbents for the Removal of Methylene Blue from Wastewater: A Review. Polymers 2022, 14, 783. [Google Scholar] [CrossRef]
- Oba, O.A.; Pasaoglulari Aydinlik, N. Preparation of mesoporous activated carbon from novel African walnut shells (AWS) for deltamethrin removal: Kinetics and equilibrium studies. Appl. Water Sci. 2022, 12, 149–168. [Google Scholar] [CrossRef]
- Bosacka, A.; Zienkiewicz-Strzałka, M.; Deryło-Marczewska, A.; Chrzanowska, A.; Wasilewska, M.; Sternik, D. Physicochemical, structural, and adsorption properties of chemically and thermally modified activated carbons. Colloids Surf. A Physicochem. Eng. Asp. 2022, 647, 129130–129147. [Google Scholar] [CrossRef]
- Ibrahim, S.M.; Bin Jumah, M.N.; Othman, S.I.; Alruhaimi, R.S.; Al-Khalawi, N.; Salama, Y.F.; Allam, A.; Abukhadra, M.R. Synthesis of Chitosan/Diatomite Composite as an Advanced Delivery System for Ibuprofen Drug; Equilibrium Studies and the Release Profile. ACS Omega 2021, 20, 13406–13416. [Google Scholar] [CrossRef]
- Legnani, L.; Iannazzo, D.; Pistone, A.; Celesti, C.; Giofrè, S.; Romeo, R.; Di Pietro, A.; Visalli, G.; Monica Fresta, M.; Bottino, P.; et al. Functionalized polyhedral oligosilsesquioxane (POSS) based composites for bone tissue engineering: Synthesis, computational and biological studies. RSC Adv. 2020, 10, 11325–113634. [Google Scholar] [CrossRef] [PubMed]
- Gull, N.; Khan, S.M.; Butt, O.M.; Islam, A.; Shah, A.; Jabeen, S.; Khan, S.U.; Khan, A.; Khan, R.U.; Butt, M.T.Z. Inflammation targeted chitosan-based hydrogel for controlled release of diclofenac sodium. Int. J. Biol. Macromol. 2020, 162, 175–187. [Google Scholar] [CrossRef] [PubMed]
- JayasanthaKumari, H.; Krishnamoorthy, P.; Arumugam, T.K.; Radhakrishnan, S.; Vasudevan, D. An efficient removal of crystal violet dye from waste water by adsorption onto TLAC/Chitosan composite: A novel low cost adsorbent. Int. J. Biol. Macromol. 2017, 96, 324–333. [Google Scholar] [CrossRef] [PubMed]
- Li, J.; Jiang, B.; Liu, Y.; Qiu, C.; Hu, J.; Qian, G.; Guo, W.; Ngo, H.H. Preparation and adsorption properties of magnetic chitosan composite adsorbent for Cu2+ removal. J. Clean. Prod. 2017, 158, 51–58. [Google Scholar] [CrossRef]
- Elwakeel, K.Z.; Aly, M.H.; El-Howety, M.A.; El-Fadaly, E.; Al-Said, A. Synthesis of chitosan@activated carbon beads with abundant amino groups for capture of Cu(II) and Cd(II) from aqueous solutions. J. Polym. Environ. 2018, 26, 3590–3602. [Google Scholar] [CrossRef]
- Rahmi, R.; Lelifajri, L.; Nurfatimah, R. Preparation of polyethylene glycol diglycidyl ether (PEDGE) crosslinked chitosan/activated carbon composite film for Cd2+ removal. Carbohydr. Polym. 2018, 199, 499–505. [Google Scholar] [CrossRef] [PubMed]
- Banu, H.T.; Karthikeyan, P.; Meenakshi, S. Zr4+ ions embedded chitosan-soya bean husk activated bio-char composite beads for the recovery of nitrate and phosphate ions from aqueous solution. Int. J. Biol. Macromol. 2019, 130, 573–583. [Google Scholar] [CrossRef]
- Han, X.; Li, R.; Miao, P.; Gao, J.; Hu, G.; Zhao, Y.; Chen, T. Design, Synthesis and Adsorption Evaluation of Bio-Based Lignin/Chitosan Beads for Congo Red Removal. Materials 2022, 15, 2310. [Google Scholar] [CrossRef]
- Arumugam, T.K.; Krishnamoorthy, P.; Rajagopalan, N.R.; Nanthini, S.; Vasudevan, D. Removal of malachite green from aqueous solutions using a modified chitosan composite. Int. J. Biol. Macromol. 2019, 128, 655–664. [Google Scholar] [CrossRef]
- Chen, X.; He, L. Microwave irradiation assisted preparation of chitosan composite microsphere for dye adsorption. Int. J. Polym. Sci. 2017, 2017, 2672597. [Google Scholar] [CrossRef] [Green Version]
- Fatombi, J.K.; Idohou, E.A.; Osseni, S.A.; Agani, I.; Neumeyer, D.; Verelst, M.; Mauricot, R.; Aminou, T. Adsorption of indigo carmine from aqueous solution by chitosan and chitosan/activated carbon composite: Kinetics, isotherms and thermodynamics studies. Fibers Polym. 2019, 20, 1820–1832. [Google Scholar] [CrossRef]
- Gonçalves, J.O.; da Silva, K.A.; Rios, E.C.; Crispim, M.M.; Dotto, G.L.; de Almeida Pinto, L.A. Single and binary adsorption of food dyes on chitosan/activated carbon hydrogels. Chem. Eng. Technol. 2019, 42, 454–464. [Google Scholar] [CrossRef]
- Bouyahmed, F.; Cai, M.; Reinert, L.; Duclaux, L.; Dey, R.; Youcef, H.; Lahcini, M.; Muller, F.; Delpeux-Ouldriane, S. A wide adsorption range hybrid material based on chitosan, activated carbon and montmorillonite for water treatment. C J. Carbon Res. 2018, 4, 35. [Google Scholar] [CrossRef]
- Amouzgar, P.; Chan, E.S.; Salamatinia, B. Effects of ultrasound on development of Cs/NAC nano composite beads through extrusion dripping for acetaminophen removal from aqueous solution. J. Clean. Prod. 2017, 165, 537–551. [Google Scholar] [CrossRef]
- Danalıoğlu, S.T.; Bayazit, Ş.S.; Kerkez Kuyumcu, Ö.; Salam, M.A. Efficient removal of antibiotics by a novel magnetic adsorbent: Magnetic activated carbon/chitosan (MACC) nanocomposite. J. Mol. Liq. 2017, 240, 589–596. [Google Scholar] [CrossRef]
- Gao, J.; Li, Z.; Wang, Z.; Chen, T.; Hu, G.; Zhao, Y.; Han, X. Facile Synthesis of Sustainable Tannin/Sodium Alginate Composite Hydrogel Beads for Efficient Removal of Methylene Blue. Gels 2022, 8, 486. [Google Scholar] [CrossRef]
- Chen, T.; Liu, H.; Gao, J.; Hu, G.; Zhao, Y.; Tang, X.; Han, X. Efficient Removal of Methylene Blue by Bio-Based Sodium Alginate/Lignin Composite Hydrogel Beads. Polymers 2022, 14, 2917. [Google Scholar] [CrossRef]
- Aziz, F.; El Achaby, M.; Lissaneddine, A.; Aziz, K.; Ouazzani, N.; Mamouni, R.; Mandi, L. Composites with alginate beads: A novel design of nano-adorbents impregnation for large scale continuous flow wastewater treatment pilots. Saudi J. Biol. Sci. 2020, 27, 2499–2508. [Google Scholar] [CrossRef]
- Iqbal, J.; Shah, N.S.; Sayed, M.; Irman, M.; Muhammad, N.; Howari, F.M.; Alkhoori, J.A.; Khan, Z.U.; Haq Khan, Z.U.; Bhatnagar, A.; et al. Synergistic effects of activated carbon and nano-zerovalent copper on the performance of hydroxyapatite-alginate beads for the removal of As3+ from aqueous solution. J. Clean. Prod. 2019, 235, 875–886. [Google Scholar] [CrossRef]
- Available online: pubchem.ncbi.nlm.nih.gov (accessed on 18 July 2022).
- Barrett, E.P.; Joyner, L.G.; Halenda, P.P. The Determination of Pore Volume and Area Distributions in Porous Substances. I. Computations from Nitrogen Isotherms. J. Am. Chem. Soc. 1951, 73, 373–380. [Google Scholar] [CrossRef]
- Marczewski, A.W.; Sęczkowska, M.; Deryło-Marczewska, A.; Błachnio, M. Adsorption equilibrium and kinetics of selected phenoxyacid pesticides on activated carbon—Effect of temperature. Adsorption 2016, 22, 777–790. [Google Scholar] [CrossRef]
- Deryło-Marczewska, A.; Miroslaw, K.; Marczewski, A.W.; Sternik, D. Studies of adsorption equilibria and kinetics of o-, m-, p-nitro- and chlorophenols on microporous carbons from aqueous solutions. Adsorption 2010, 16, 359–375. [Google Scholar] [CrossRef]
- Marczewski, A.W.; Jaroniec, M. A new isotherm equation for single-solute adsorption from dilute solutions on energetically heterogeneous solids—Short communication. Monatshefte Chemie Chem. Mon. 1983, 114, 711–715. [Google Scholar] [CrossRef]
- Jaroniec, M.; Marczewski, A.W. Physical adsorption of gases on energetically heterogeneous solids I. Generalized Langmuir equation and its energy distribution. Monatshefte Chemie Chem. Mon. 1984, 115, 997–1012. [Google Scholar] [CrossRef]
- Lagergren, S. Zur Theorie der Sogenannten Adsorption Geloster Stoffe. K. Sven. Vetensk. Akad. Handl. 1898, 24, 1–39. [Google Scholar] [CrossRef]
- Azizian, S. Kinetic models of sorption: A theoretical analysis. J. Colloid Interface Sci. 2004, 276, 47–52. [Google Scholar] [CrossRef]
- Marczewski, A.W. Kinetics and equilibrium of adsorption of organic solutes on mesoporous carbons. Appl. Surf. Sci. 2007, 253, 5818–5826. [Google Scholar] [CrossRef]
- Ho, Y.S.; McKay, G. Sorption of dye from aqueous solution by peat. Chem. Eng. J. 1988, 70, 115–124. [Google Scholar] [CrossRef]
- Marczewski, A.W. Application of mixed order rate equations to adsorption of methylene blue on mesoporous carbons. Appl. Surf. Sci. 2010, 256, 5145–5152. [Google Scholar] [CrossRef]
- Marczewski, A.W. Analysis of kinetic Langmuir model. Part I: Integrated kinetic Langmuir equation (IKL): A new complete analytical solution of the Langmuir rate equation. Langmuir 2010, 26, 15229–15238. [Google Scholar] [CrossRef]
- Marczewski, A.W.; Deryło-Marczwska, A.; Słota, A. Adsorption and desorption kinetics of benzene derivatives on mesoporous carbons. Adsorption 2013, 19, 391–406. [Google Scholar] [CrossRef]
- Haerifar, M.; Azizian, S. Fractal-like adsorption kinetics at the solid/solution interface. J. Phys. Chem. C 2012, 116, 13111–13119. [Google Scholar] [CrossRef]
- Crank, J. The Mathematics of Diffusion, 2nd ed.; Oxford University Press: Oxford, UK, 1975. [Google Scholar]
- Mckay, G.; Geundi, M.E.L.; Nassar, M.M. Pore diffusion during the adsorption of dyes onto bagasse pith. Process Saf. Environ. Prot. 1996, 74B, 277–288. [Google Scholar] [CrossRef]
- Alothman, Z.A. A review: Fundamental aspects of silicate mesoporous materials. Materials 2012, 5, 2874–2902. [Google Scholar] [CrossRef]
- Sing, K.S.W.; Williams, R.T. Physisorption hysteresis loops and the characterization of nanoporous materials. Adsorpt. Sci. Technol. 2004, 22, 772–782. [Google Scholar] [CrossRef]
- Bosacka, A.; Zienkiewicz-Strzalka, M.; Wasilewska, M.; Derylo-Marczewska, A.; Podkościelna, B. Physicochemical and Adsorption Characteristics of Divinylbenzene-co-Triethoxyvinylsilane Microspheres as Materials for the Removal of Organic Compounds. Molecules 2021, 26, 2396. [Google Scholar] [CrossRef]
- Aharoni, C.; Sideman, S.; Hoffer, E. Adsorption of phosphate ions by collodion-coated alumina. J. Chem. Technol. Biotechnol. 1979, 29, 404–412. [Google Scholar] [CrossRef]
- Soares, J.P.; Santos, J.E.; Chierice, G.O.; Cavalheiro, E.T.G. Thermal behavior of alginic acid and its sodium salt. Eclét. Quim. 2004, 29, 57–63. [Google Scholar] [CrossRef]
- Zhao, W.; Qi, Y.; Wang, Y.; Xue, Y.; Xu, P.; Li, Z.; Li, Q. Morphology and Thermal Properties of Calcium Alginate/Reduced Graphene Oxide Composites. Polymers 2018, 10, 990. [Google Scholar] [CrossRef]
- Liu, Y.; Li, Z.; Wang, J.; Zhu, P.; Zhao, J.; Zhang, C.; Guo, Y.; Jin, X. Thermal degradation and pyrolysis behavior of aluminum alginate investigated by TG-FTIR-MS and Py-GC-MS. Polym. Degrad. Stab. 2015, 118, 59–68. [Google Scholar] [CrossRef]
- Pathak, T.S.; Yun, J.-H.; Lee, S.J.; Baek, D.K.; Paeng, K.J. Effect of Solvent Composition on Porosity, Surface Morphology and Thermal Behavior of Metal Alginate Prepared from Algae (Undaria pinnatifida). J. Polym. Environ. 2010, 18, 45–56. [Google Scholar] [CrossRef]
- Tian, G.; Ji, Q.; Xu, D.; Tan, L.; Quan, F.; Xia, Y. The Effect of Zinc Ion Content on Flame Retardance and Thermal Degradation of Alginate Fibers. Fibers Polym. 2013, 14, 767–771. [Google Scholar] [CrossRef]
- Ross, A.B.; Hall, C.; Anastasakis, K.; Westwood, A.; Jones, J.M.; Crewe, R.J. Influence of cation on the pyrolysis and oxidation of alginates. J. Anal. Appl. Pyrolysis. 2011, 91, 344–351. [Google Scholar] [CrossRef]
- Alsohaimi, I.H.; El-Aassar, M.R.; Elzain, A.A.; Alshammari, M.S.; Ali, A.S.M. Development of activated carbon-impregnated alginate*β-cyclodextrin/gelatin beads for highly performance sorption of 2,4-dichlorophenol from wastewater. J. Mater. Res. Technol. 2020, 9, 5144–5153. [Google Scholar] [CrossRef]
- Garg, D.; Majumder, C.B.; Kumar, S.; Sarkar, B. Removal of Direct Blue-86 dye from aqueous solution using alginate encapsulated activated carbon (PnsAC-alginate) prepared from waste peanut Shell. J. Environ. Chem. Eng. 2019, 7, 103365–103378. [Google Scholar] [CrossRef]
- Hassan, A.F.; Abdel-Mohsen, A.M.; Elhadidy, H. Adsorption of arsenic by activated carbon, calcium alginate and their composite beads. Int. J. Biol. Macromol. 2014, 68, 125–130. [Google Scholar] [CrossRef]
- Jung, K.-W.; Choi, B.H.; Hwang, M.-J.; Jeong, T.-U.; Ahn, K.-H. Fabrication of granular activated carbons derived from spent coffee grounds by entrapment in calcium alginate beads for adsorption of acid orange 7 and methylene blue. Bioresour. Technol. 2016, 219, 185–195. [Google Scholar] [CrossRef]
- Shim, J.; Kumar, M.; Goswami, R.; Mazumder, P.; Oh, B.T.; Shea, P.J. Removal of p-cresol and tylosin from water using novel composite of alginate, recycled MnO2 and activated carbon. J. Hazard. Mater. 2019, 364, 419–428. [Google Scholar] [CrossRef]
- Shamsudin, M.S.; Aza, S.F.; Sellaaouti, L.; Badawi, M.; Bonilla-Petriciolet, A.; Ismail, S. Performance and interactions of diclofenac adsorption using Alginate/ Carbon-based Films: Experimental investigation and statistical physics modeling. Chem. Eng. J. 2022, 428, 131929–131940. [Google Scholar] [CrossRef]
- Marrakchi, F.; Zafar, F.F.; Wei, M.; Wang, S. Cross-linked FeCl3-activated seaweed carbon/MCM-41/alginate hydrogel composite for effective biosorption of bisphenol A plasticizer and basic dye from aqueous solution. Bioresour. Technol. 2021, 331, 125046–125053. [Google Scholar] [CrossRef]
- Ragab, A.H.; Hussein, H.S.; Ahmed, I.A.; Abualnaja, K.M.; AlMasoud, N. An Efficient Strategy for Enhancing the Adsorption of Antibiotics and Drugs from Aqueous Solutions Using an Effective Limestone-Activated Carbon–Alginate Nanocomposite. Molecules 2021, 26, 5180. [Google Scholar] [CrossRef] [PubMed]
- Fei, Y.; Yong, L.; Sheng, H.; Jie, M. Adsorptive removal of ciprofloxacin by sodium alginate/grapheme oxide composite beads from aqueous solution. J. Colloid Interface Sci. 2016, 484, 196–204. [Google Scholar] [CrossRef] [PubMed]
- Ionita, M.; Pandele, M.A.; Iovu, H. Sodium alginate/grapheme oxide composite films with enhanced thermal and mechanical properties. Carbohydr. Polym. 2013, 94, 339–344. [Google Scholar] [CrossRef] [PubMed]


| Adsorbate | Chemical Formula | Molecular Weight [g/mol] | Water Solubility [mg/L at 25 °C] | Ionization Constant pKa | Melting Point [°C] | Boiling Point [°C] | Chemical Safety |
|---|---|---|---|---|---|---|---|
| Ibuprofen |  | 206.28 | 21 | 5.3 | 76 | 157 | Irritant Health Hazard |
| Diclofenac |  | 296.1 | 2.37 | 4.2 | 284 | - | Acute Toxic Irritant |
| Adsorbent | Surface Area [m2/g] | Pore Volume [cm3/g] | Pore Size [nm] | ||||
|---|---|---|---|---|---|---|---|
| SBET a | Sext b | Vt c | Vmic d | dh e | BJHADS f | BJHDES g | |
| ALG_Ca | 0.15 | 0.15 | 0.0011 | - | 29.33 | 19.70 | 17.16 |
| ALG_C2 | 451 | 214 | 0.28 | 0.10 | 2.44 | 4.60 | 4.50 |
| ALG_C4 | 839 | 416 | 0.52 | 0.18 | 2.47 | 4.75 | 4.54 |
| ALG_C8 | 995 | 509 | 0.63 | 0.20 | 2.51 | 4.78 | 4.64 |
| C | 1250 | 632 | 0.80 | 0.26 | 2.55 | 4.94 | 4.77 |
| System | Isotherm Type | am | m | n | logK | R2 | SD (a) |
|---|---|---|---|---|---|---|---|
| IBP/ALGCa | GL | 0.01 | 0.36 | 0.05 | 0.87 | 0.948 | 0.902 |
| IBP/ALG_C2 | GF | 0.28 | 0.69 | 1 | −8.46 | 0.985 | 0.056 |
| IBP/ALG_C4 | GF | 0.35 | 0.96 | 1 | −5.94 | 0.986 | 0.047 |
| IBP/ALG_C8 | GF | 0.42 | 0.20 | 1 | −4.92 | 0.974 | 0.601 |
| D/ALGCa | GL | 0.01 | 0.38 | 0.05 | 0.91 | 0.962 | 0.813 |
| D/ALG_C2 | GL | 0.52 | 0.87 | 0.80 | 0.90 | 0.984 | 0.046 |
| D/ALG_C4 | GF | 0.64 | 0.48 | 1 | 0.14 | 0.990 | 0.034 |
| D/ALG_C8 | GF | 0.98 | 0.59 | 1 | −0.10 | 0.960 | 0.086 |
| System | m-exp [%] | FOE [%] | SOE [%] | MOE [%] | f-FOE [%] | f-SOE [%] | f-MOE [%] | IDM [%] | PDM [%] |
|---|---|---|---|---|---|---|---|---|---|
| IBP/ALG_C2 | 0.282 | 7.220 | 5.532 | 5.558 | 5.262 | 5.012 | 4.979 | 8.440 | 1.009 |
| IBP/ALG_C4 | 0.946 | 5.751 | 7.505 | 0.939 | 5.146 | 6.817 | 1.076 | 10.215 | 2.389 |
| IBP/ALG_C8 | 0.739 | 3.008 | 3.134 | 0.941 | 11.041 | 1.935 | 1.073 | 11.113 | 1.189 |
| D/ALG_C2 | 0.976 | 3.190 | 1.315 | 0.894 | 1.055 | 1.310 | 0.681 | 15.014 | 1.062 |
| D/ALG_C4 | 0.493 | 2.505 | 1.366 | 0.889 | 0.848 | 1.247 | 0.570 | 9.593 | 0.694 |
| D/ALG_C8 | 0.879 | 5.426 | 2.045 | 1.095 | 0.703 | 1.806 | 0.651 | 8.731 | 0.344 |
| System | f1, log k1 | f2, log k2 | f3, log k3 | ueq | t1/2 [min] | SD(c)/co [%] | 1-R2 |
|---|---|---|---|---|---|---|---|
| IBP/ALG_C2 | 0.473, −3.728 | 0.475, −2.700 | 0.052, −1.808 | 0.712 | 920.1 | 0.282 | 1.8 × 10⁻² |
| IBP/ALG_C4 | 0.790, −3.243 | 0.210, −2.582 | - | 0.890 | 605.1 | 0.946 | 1.7 × 10⁻² |
| IBP/ALG_C8 | 0.540, −3.120 | 0.460, −2.500 | - | 1 | 527.3 | 0.739 | 3.9 × 10⁻⁴ |
| D/ALG_C2 | 0.559, −3.934 | 0.441, −2.760 | - | 1 | 1259.5 | 0.976 | 8.6 × 10⁻⁴ |
| D/ALG_C4 | 0.676, −3.489 | 0.324, −2.677 | - | 1 | 1122.0 | 0.493 | 2.4 × 10⁻⁴ |
| D/ALG_C8 | 0.707, −3.339 | 0.293, −2.540 | - | 1 | 846.1 | 0.879 | 7.2 × 10⁻⁴ |
| Sample | TG | DTG | DSC | ||
|---|---|---|---|---|---|
| ΔT [°C] | Mass Loss [%] | Total Mass Loss [%] | Tmin [°C] | endo/exo | |
| ALGCa | 30–190 | 9.77 | 80.54 | 99.1 | endo |
| 190–600 | 61.10 | 210.1 | exo | ||
| 289.3 | exo | ||||
| 428.3 | exo | ||||
| 545.3 | exo | ||||
| 600–800 | 8.61 | 726.8 | endo | ||
| 800–930 | 1.06 | - | - | ||
| C | 30–480 | 1.99 | 91.09 | - | - |
| 480–930 | 89.10 | 640.7 | exo | ||
| ALG_C2 | 30–200 | 9.02 | 72.63 | 79.7 | endo |
| 200–600 | 58.81 | 267.9 | exo | ||
| 426.4 | exo | ||||
| 600–800 | 3.06 | 714.6 | endo | ||
| 800–930 | 1.55 | - | - | ||
| ALG_C4 | 30–200 | 6.69 | 70.67 | 74.9 | endo |
| 200–600 | 61.32 | 263.4 | exo | ||
| 418.5 | exo | ||||
| 600–800 | 1.74 | 659.7 | exo | ||
| 800–930 | 0.93 | - | - | ||
| ALG_C8 | 30–200 | 3.74 | 85.34 | 90.2 | endo |
| 200–600 | 79.65 | 282.4 | exo | ||
| 440.6 | exo | ||||
| 600–800 | 1.01 | 630.1 | exo | ||
| 800–930 | 0.90 | - | - | ||
| D/ALG_C8 | 30–200 | 2.64 | 92.71 | 65.6 | endo |
| 200–600 | 88.14 | 256.1 | exo | ||
| 296.6 | exo | ||||
| 542.5 | exo | ||||
| 600–800 | 0.67 | - | - | ||
| 800–930 | 1.26 | - | - | ||
| IBP/ALG_C8 | 30–200 | 2.27 | 91.70 | 61.3 | endo |
| 200–600 | 87.67 | 282.3 | exo | ||
| 401.3 | exo | ||||
| 436.9 | exo | ||||
| 493.3 | exo | ||||
| 600–800 | 1.75 | 660.4 | endo | ||
| 800–930 | 0.01 | - | - |
Publisher’s Note: MDPI stays neutral with regard to jurisdictional claims in published maps and institutional affiliations. |
© 2022 by the authors. Licensee MDPI, Basel, Switzerland. This article is an open access article distributed under the terms and conditions of the Creative Commons Attribution (CC BY) license (https://creativecommons.org/licenses/by/4.0/).
Share and Cite
Wasilewska, M.; Deryło-Marczewska, A. Adsorption of Non-Steroidal Anti-Inflammatory Drugs on Alginate-Carbon Composites—Equilibrium and Kinetics. Materials 2022, 15, 6049. https://doi.org/10.3390/ma15176049
Wasilewska M, Deryło-Marczewska A. Adsorption of Non-Steroidal Anti-Inflammatory Drugs on Alginate-Carbon Composites—Equilibrium and Kinetics. Materials. 2022; 15(17):6049. https://doi.org/10.3390/ma15176049
Chicago/Turabian StyleWasilewska, Małgorzata, and Anna Deryło-Marczewska. 2022. "Adsorption of Non-Steroidal Anti-Inflammatory Drugs on Alginate-Carbon Composites—Equilibrium and Kinetics" Materials 15, no. 17: 6049. https://doi.org/10.3390/ma15176049