
Research on the General Failure Law of a CTRC Column by Modeling FEM Output Data
Abstract
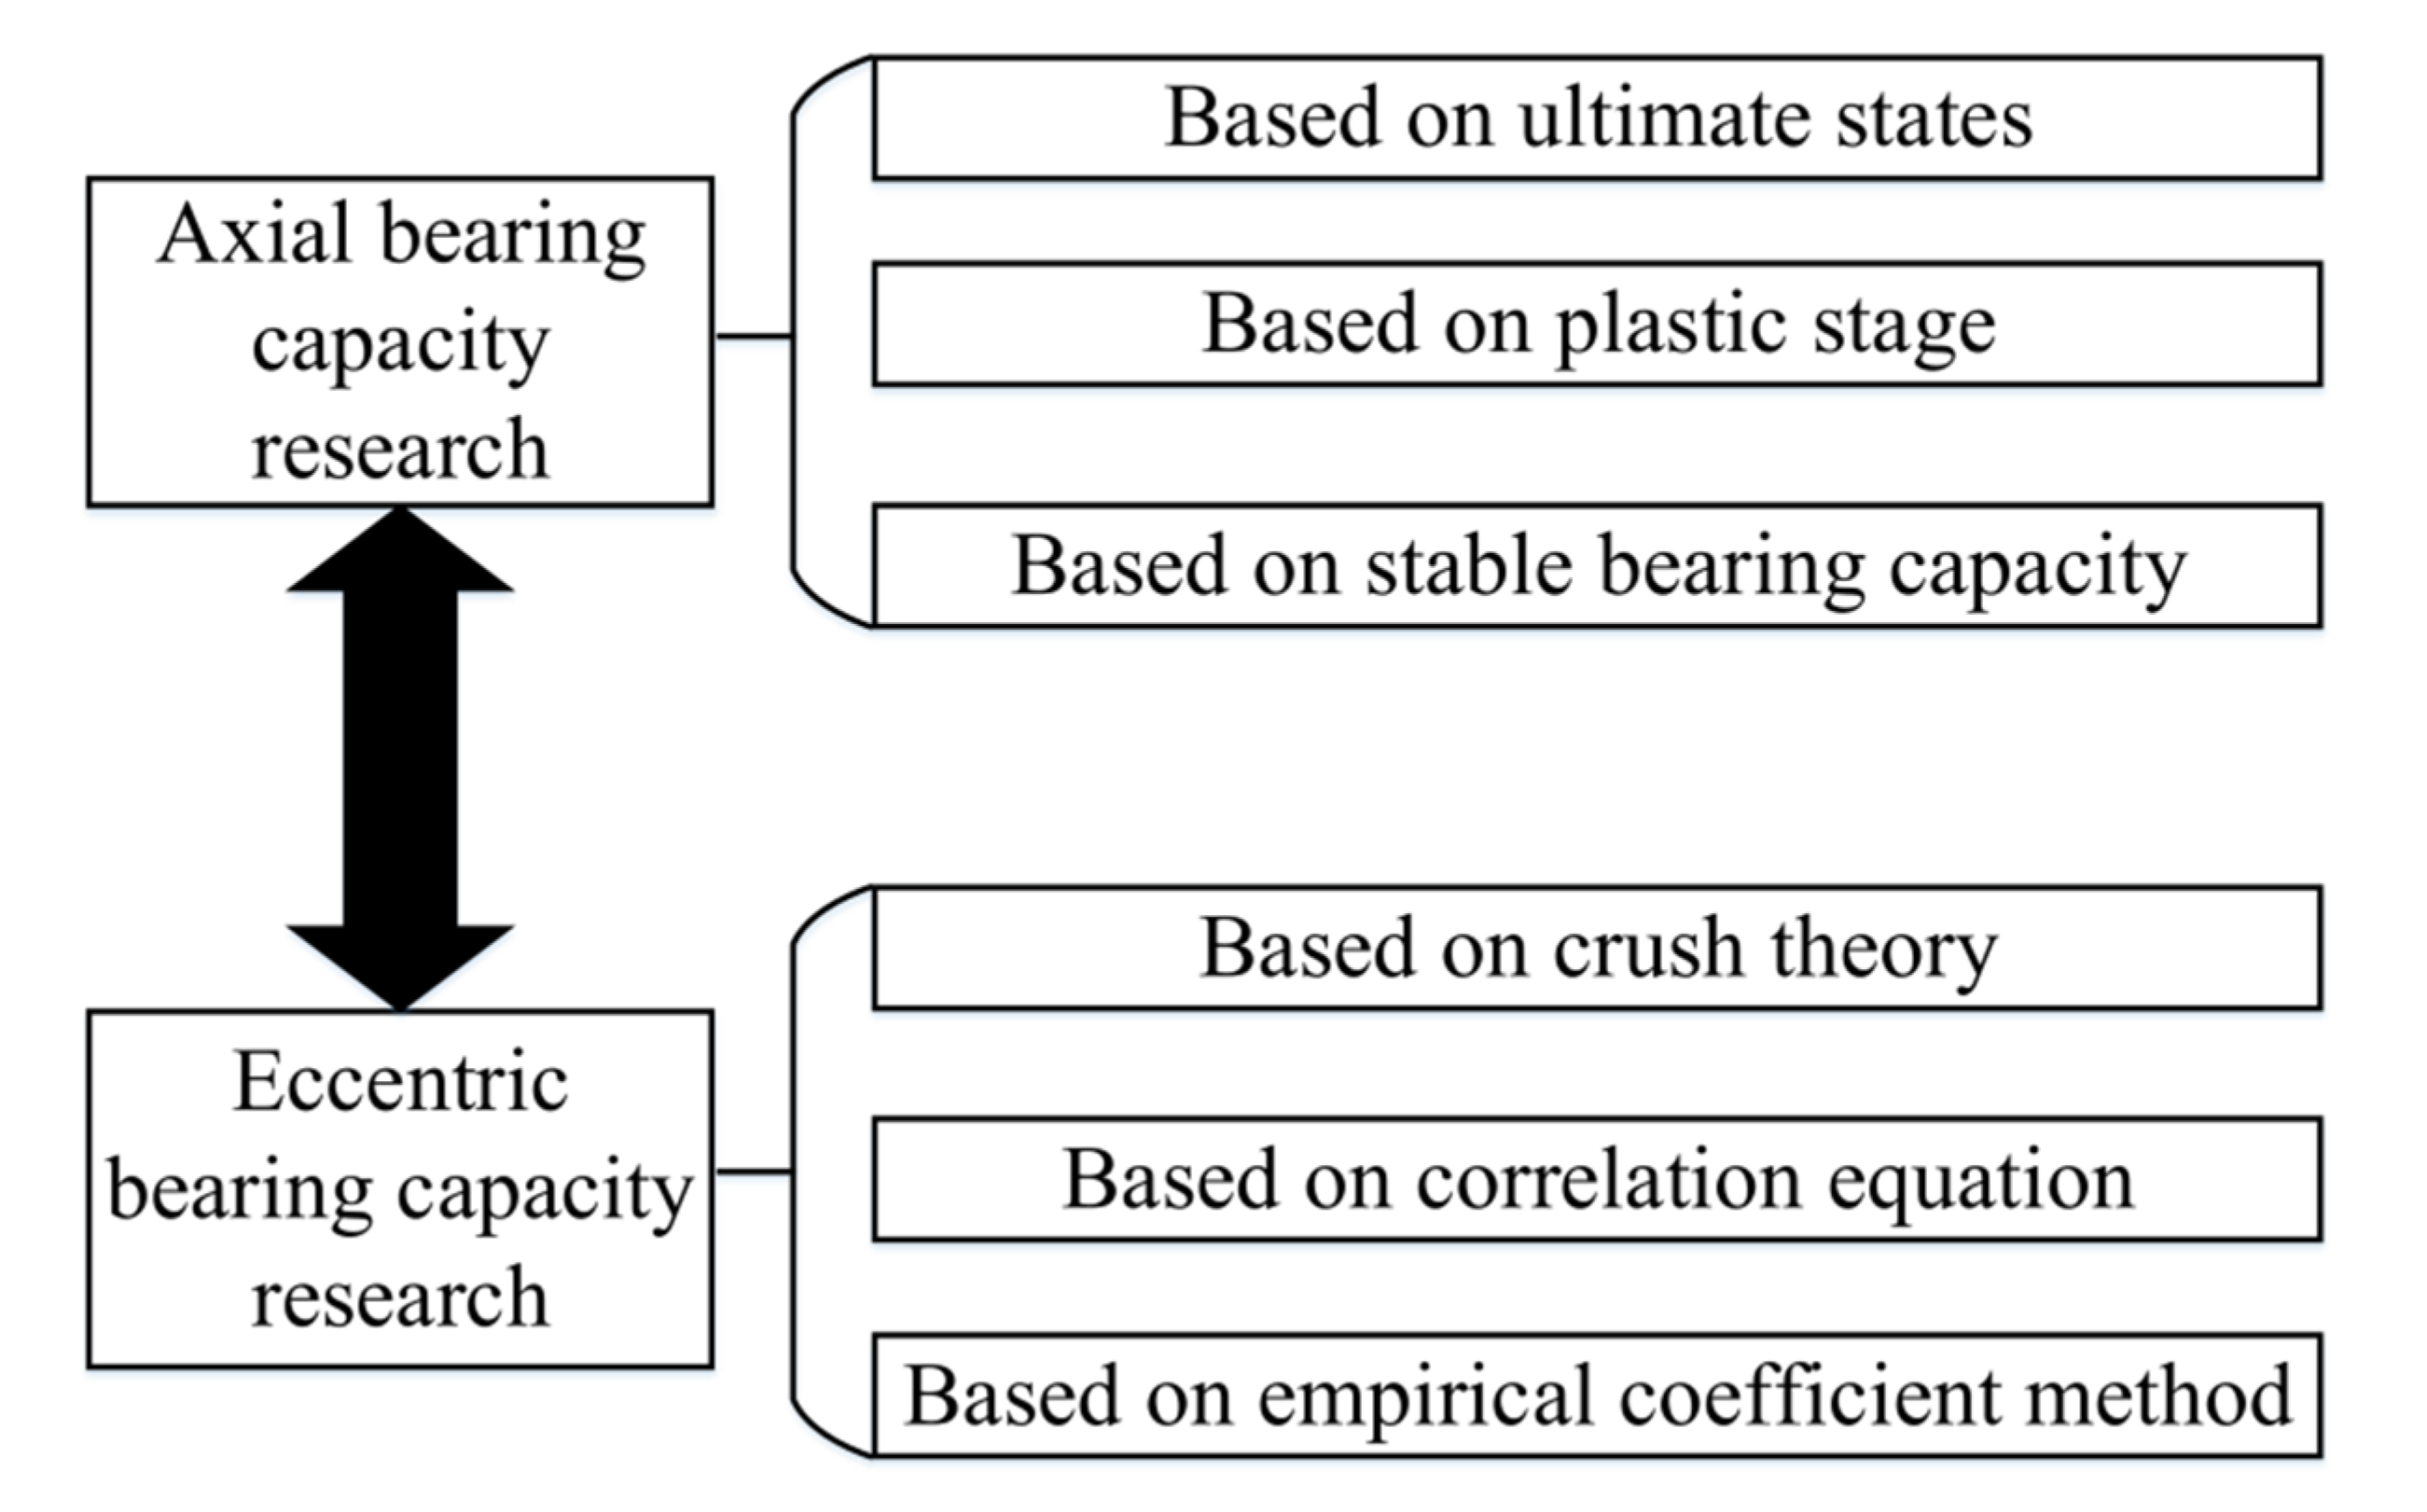
:1. Introduction
- (1)
- The choice of the k value is based on the researcher’s experience, generally k = 4.
- (2)
- The hardening of steel is considered according to the ultimate state, and there are limitations. The expression uses the concrete strength enhancement factor multiplied by the load-bearing capacity of the steel tube, so the mechanics are unclear.
- (3)
- The moment when the vertical stress of the steel tube reaches the uniaxial yield point is defined as the moment when the strength of the steel tube changes from elastic to plastic, which is inconsistent with the actual situation.
- (4)
- The load-bearing capacity calculation process ignores the interaction between steel tubes and concrete.
- (1)
- The expression is derived from the internal force equilibrium condition, which needs to be adjusted manually when calculating the bearing capacity of a small eccentric.
- (2)
- The relevant equation of the linear expression does not consider the plastic development of the cross-section.
- (3)
- The calculation results have the same effect on various slenderness ratio members with different load eccentricities, which is inconsistent with the actual situation.
2. Outline of Structural Stressing State Theory
2.1. Stressing State Theory
2.2. Correlation Modeling Methods
2.3. Slope Increment Criterion
3. Brief of Test/FEM
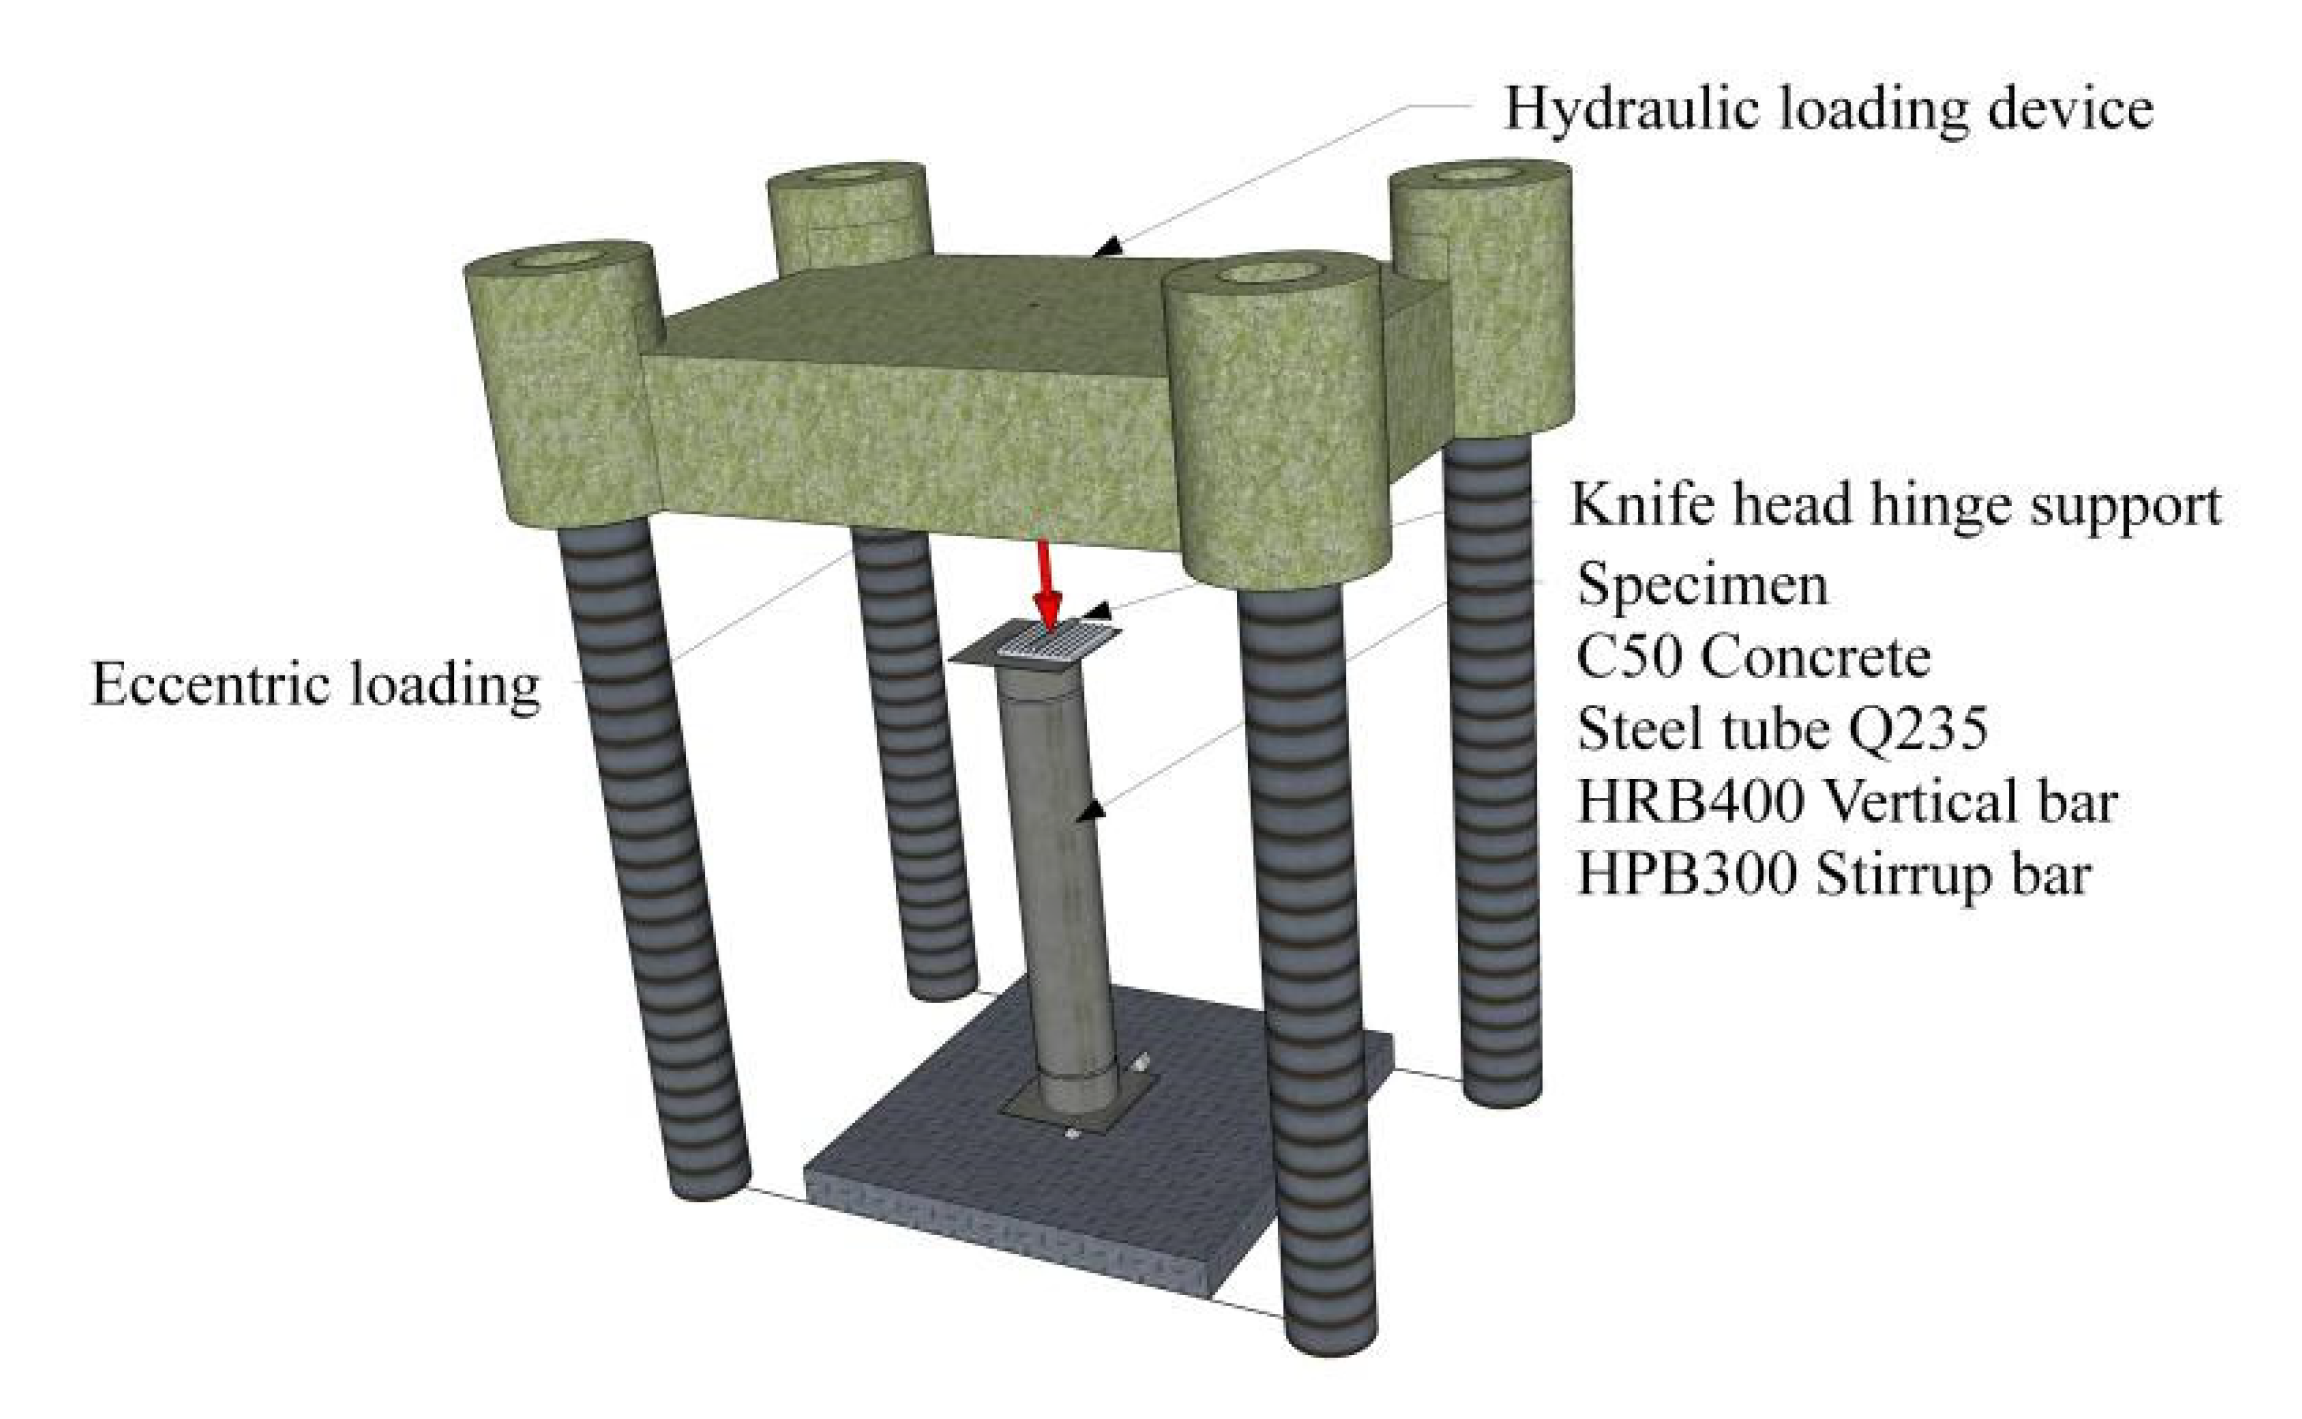
3.1. Test Overview
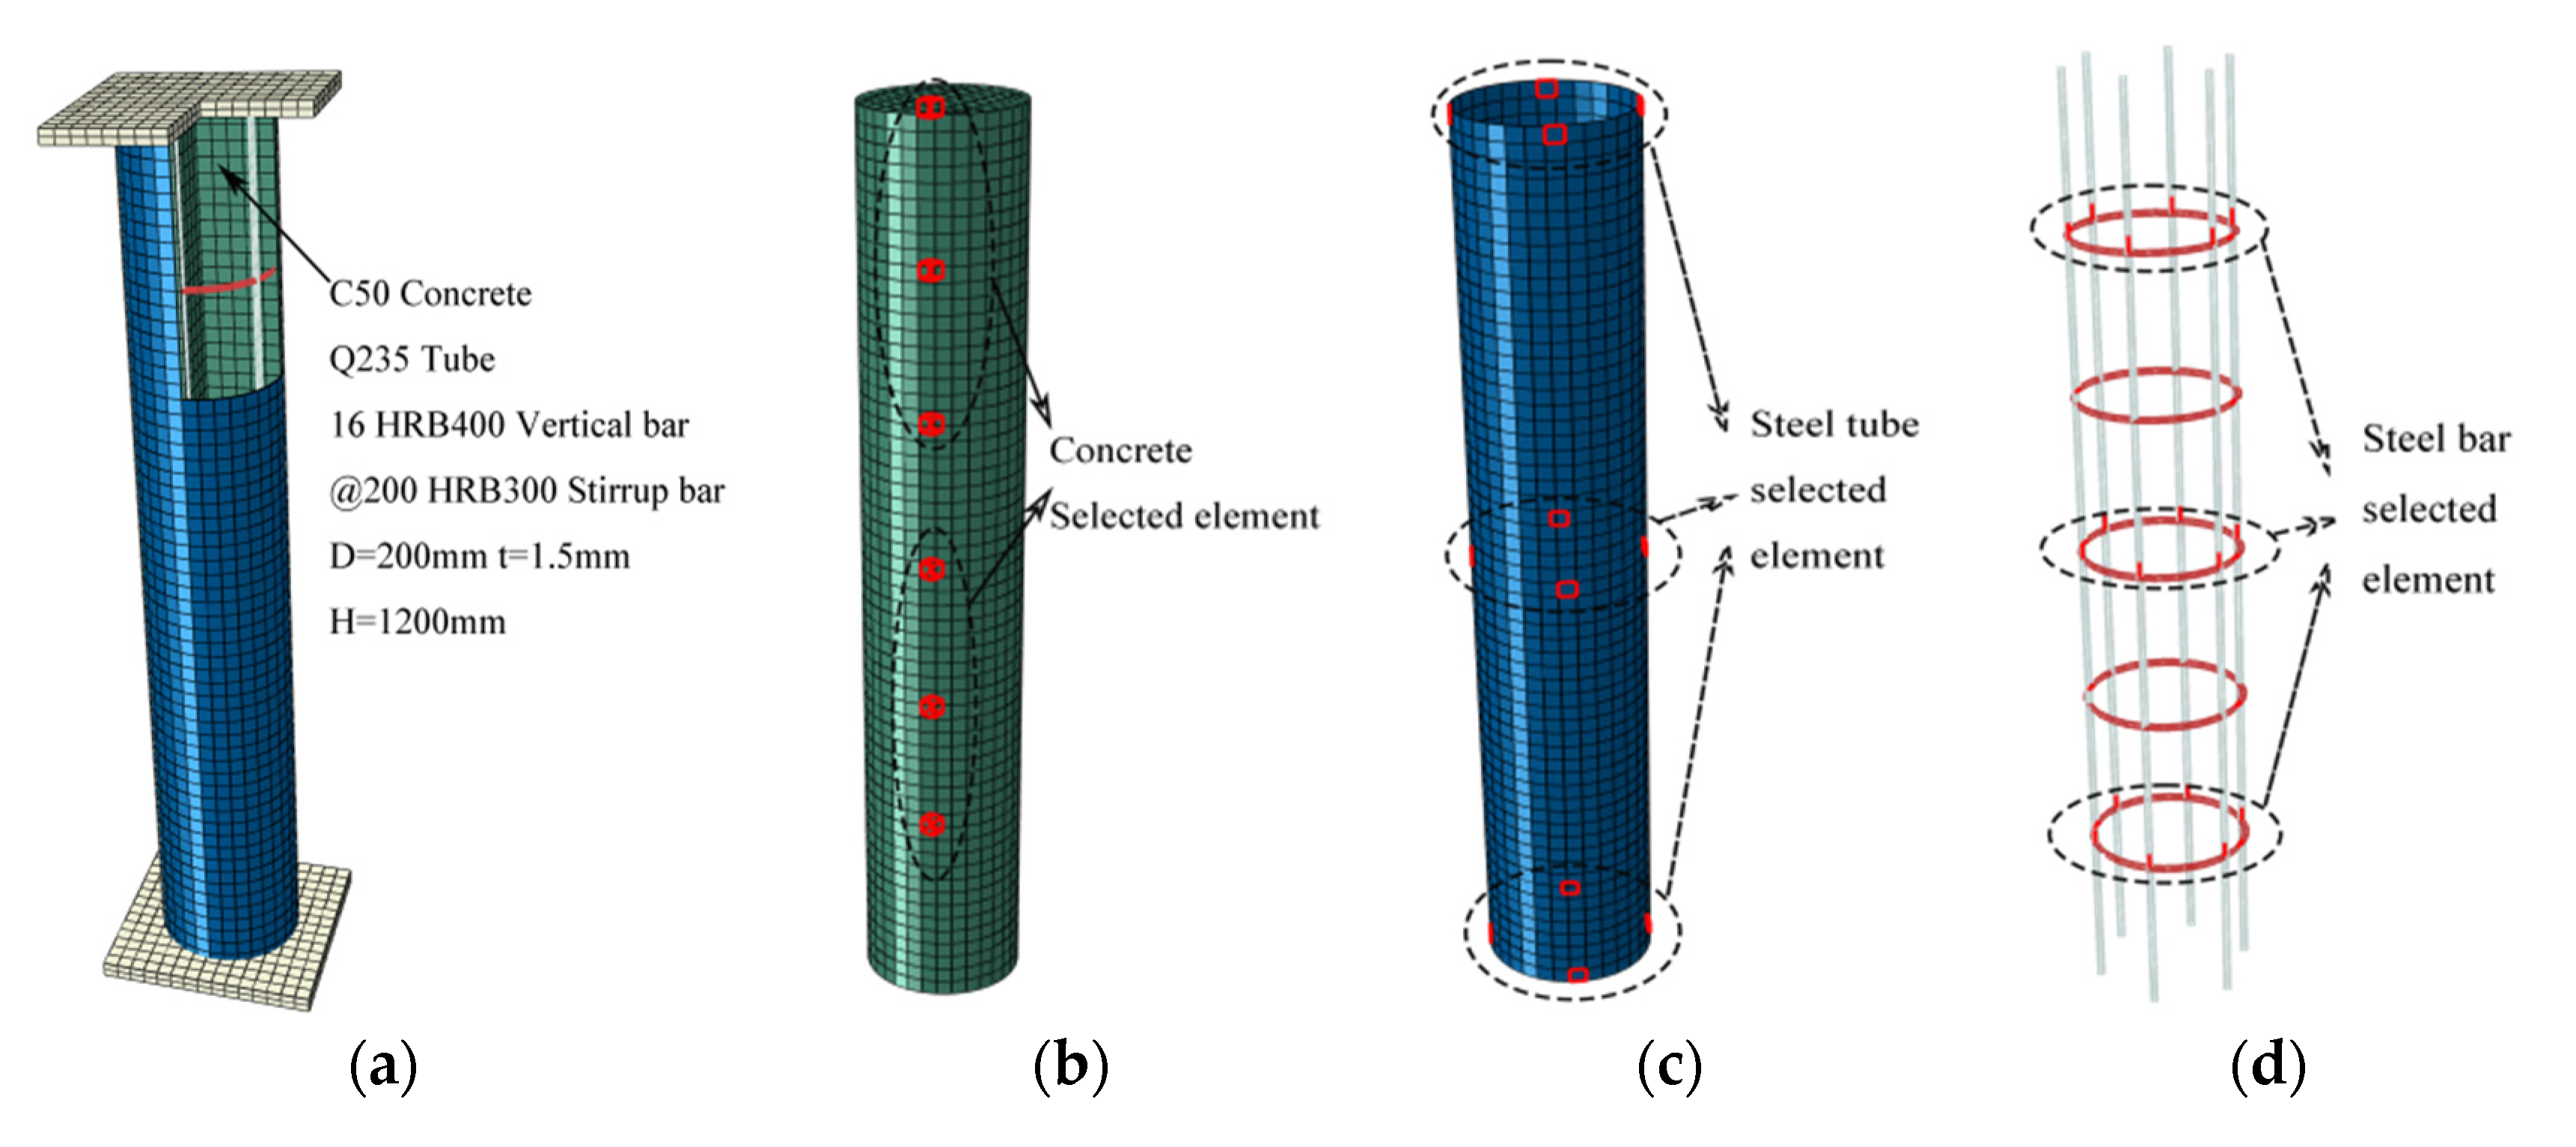
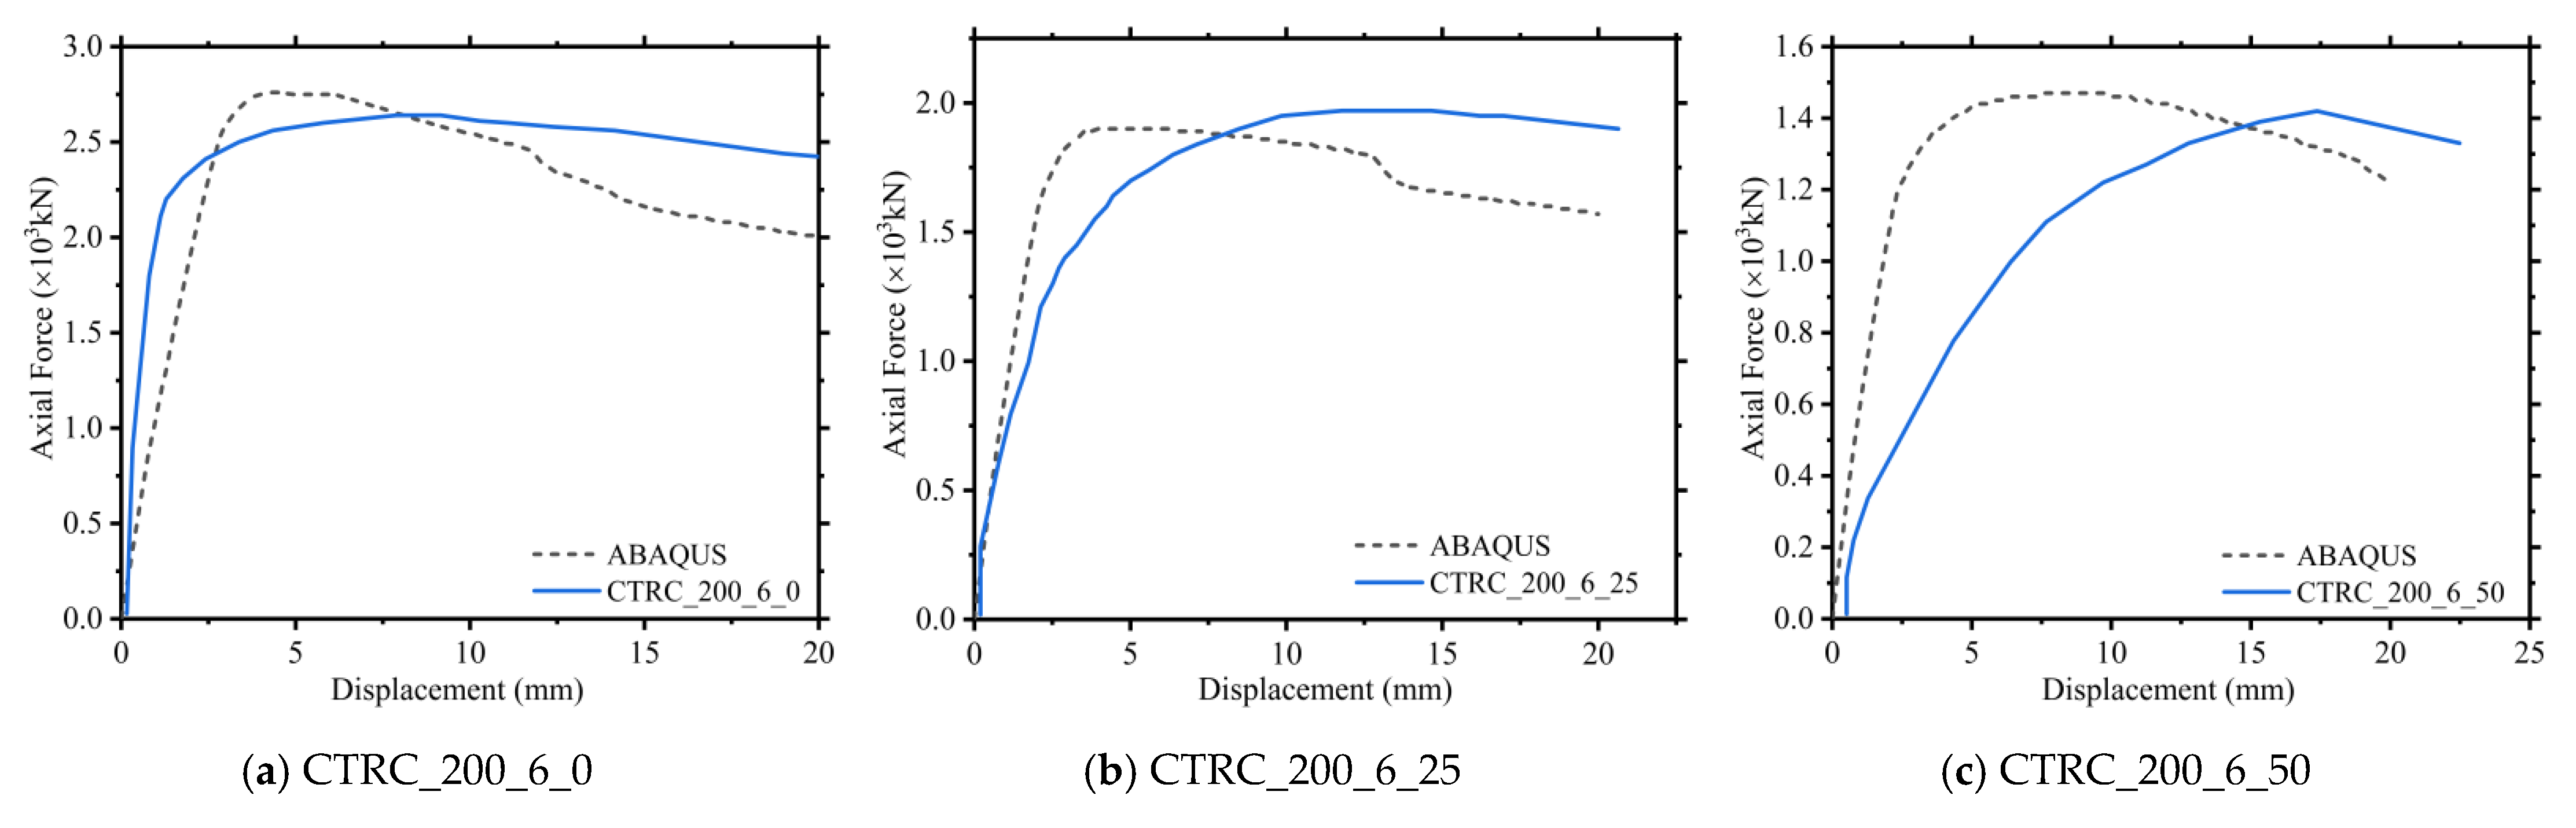
3.2. Finite Element Model
4. Stressing State Analysis
4.1. Overall Characteristic Pairs
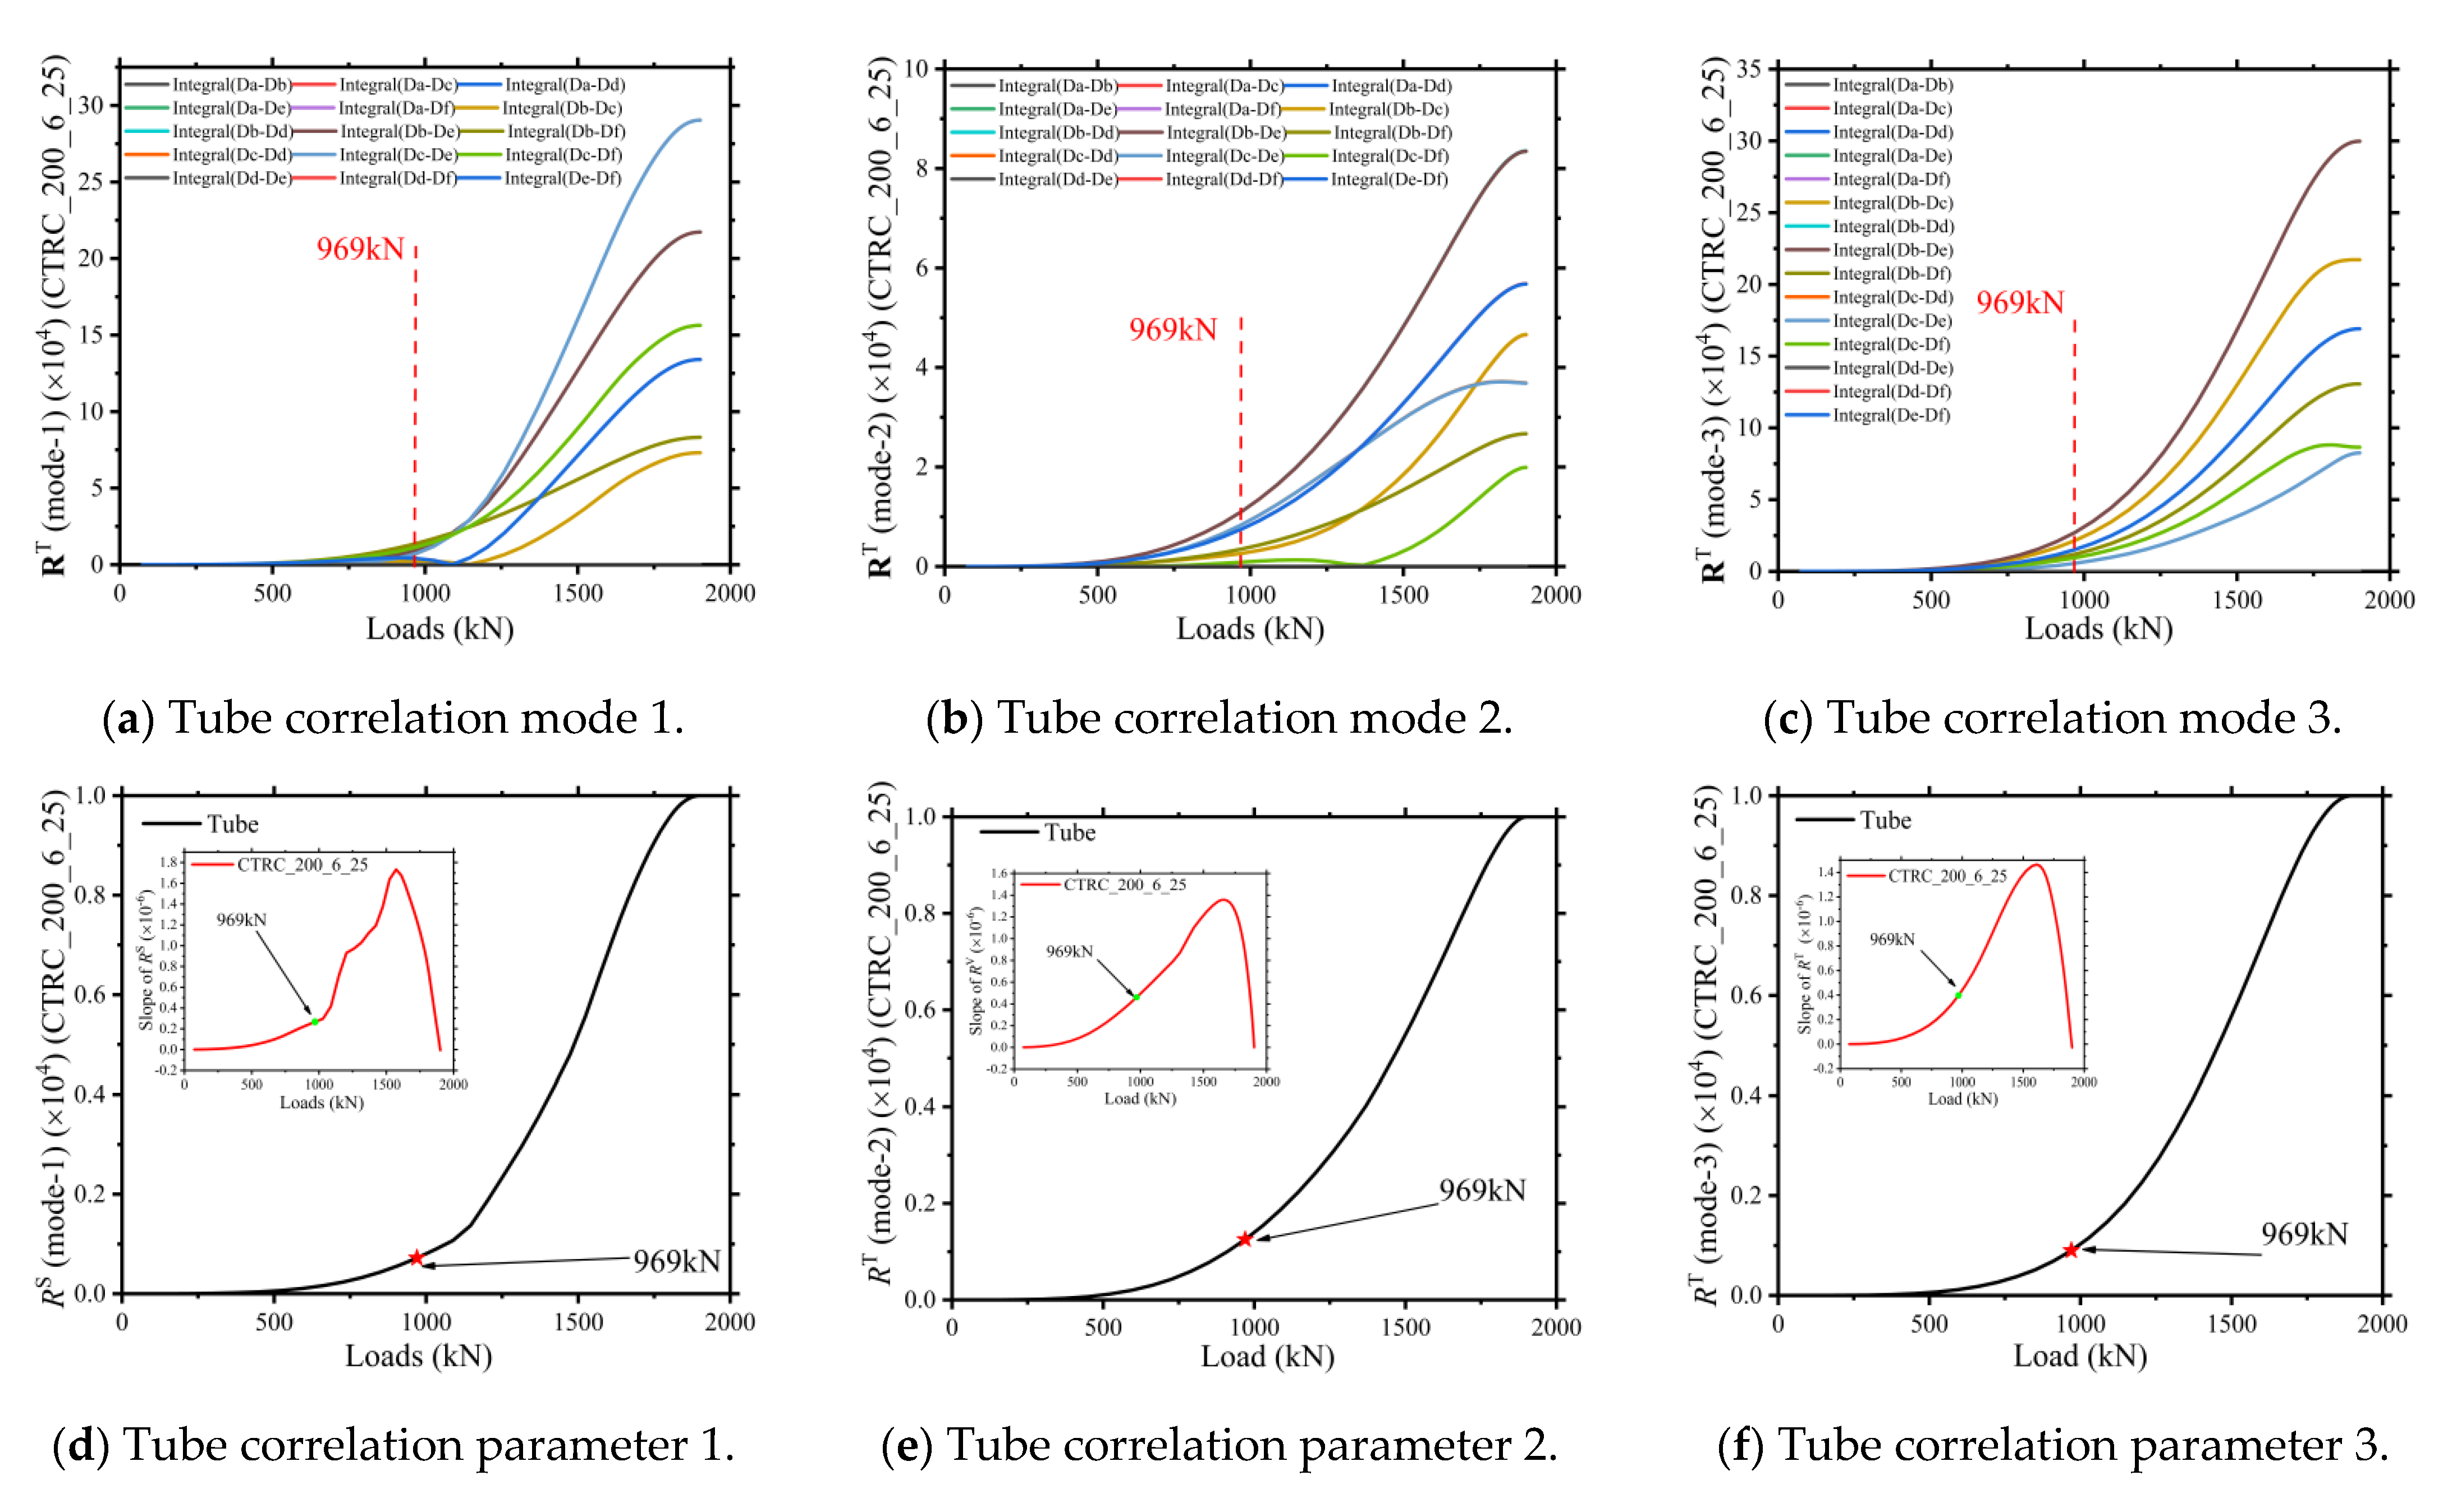
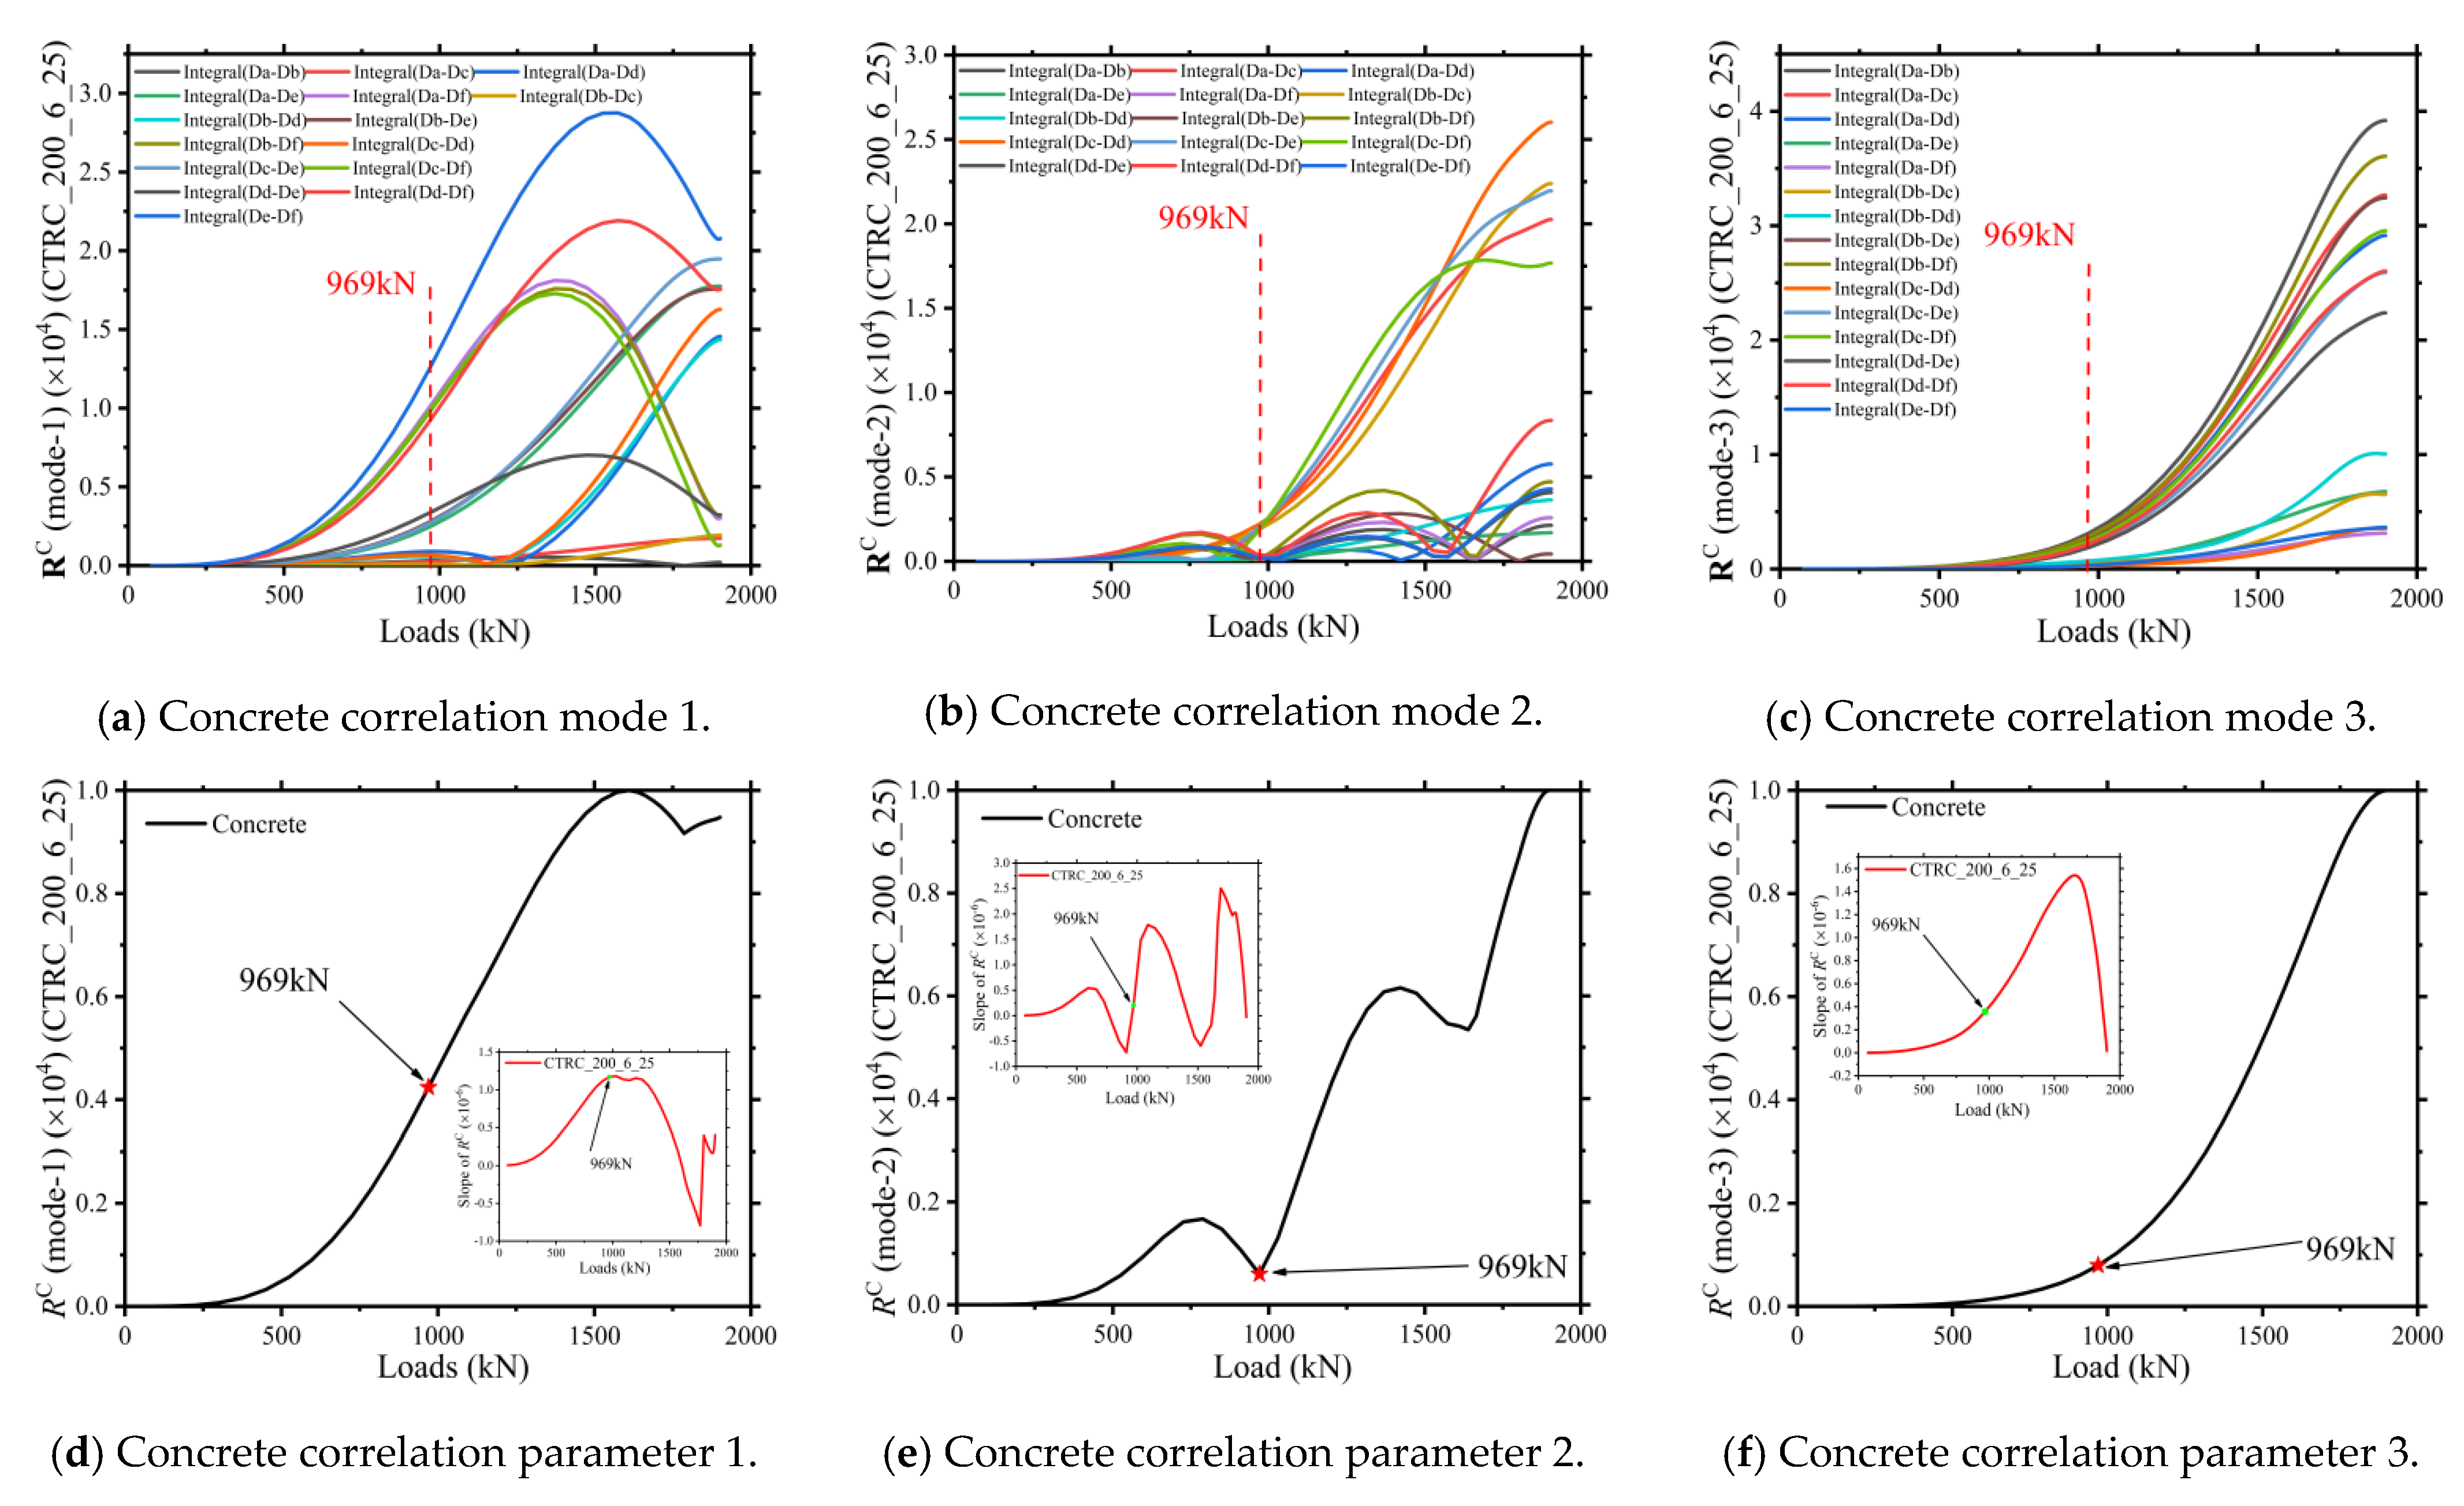
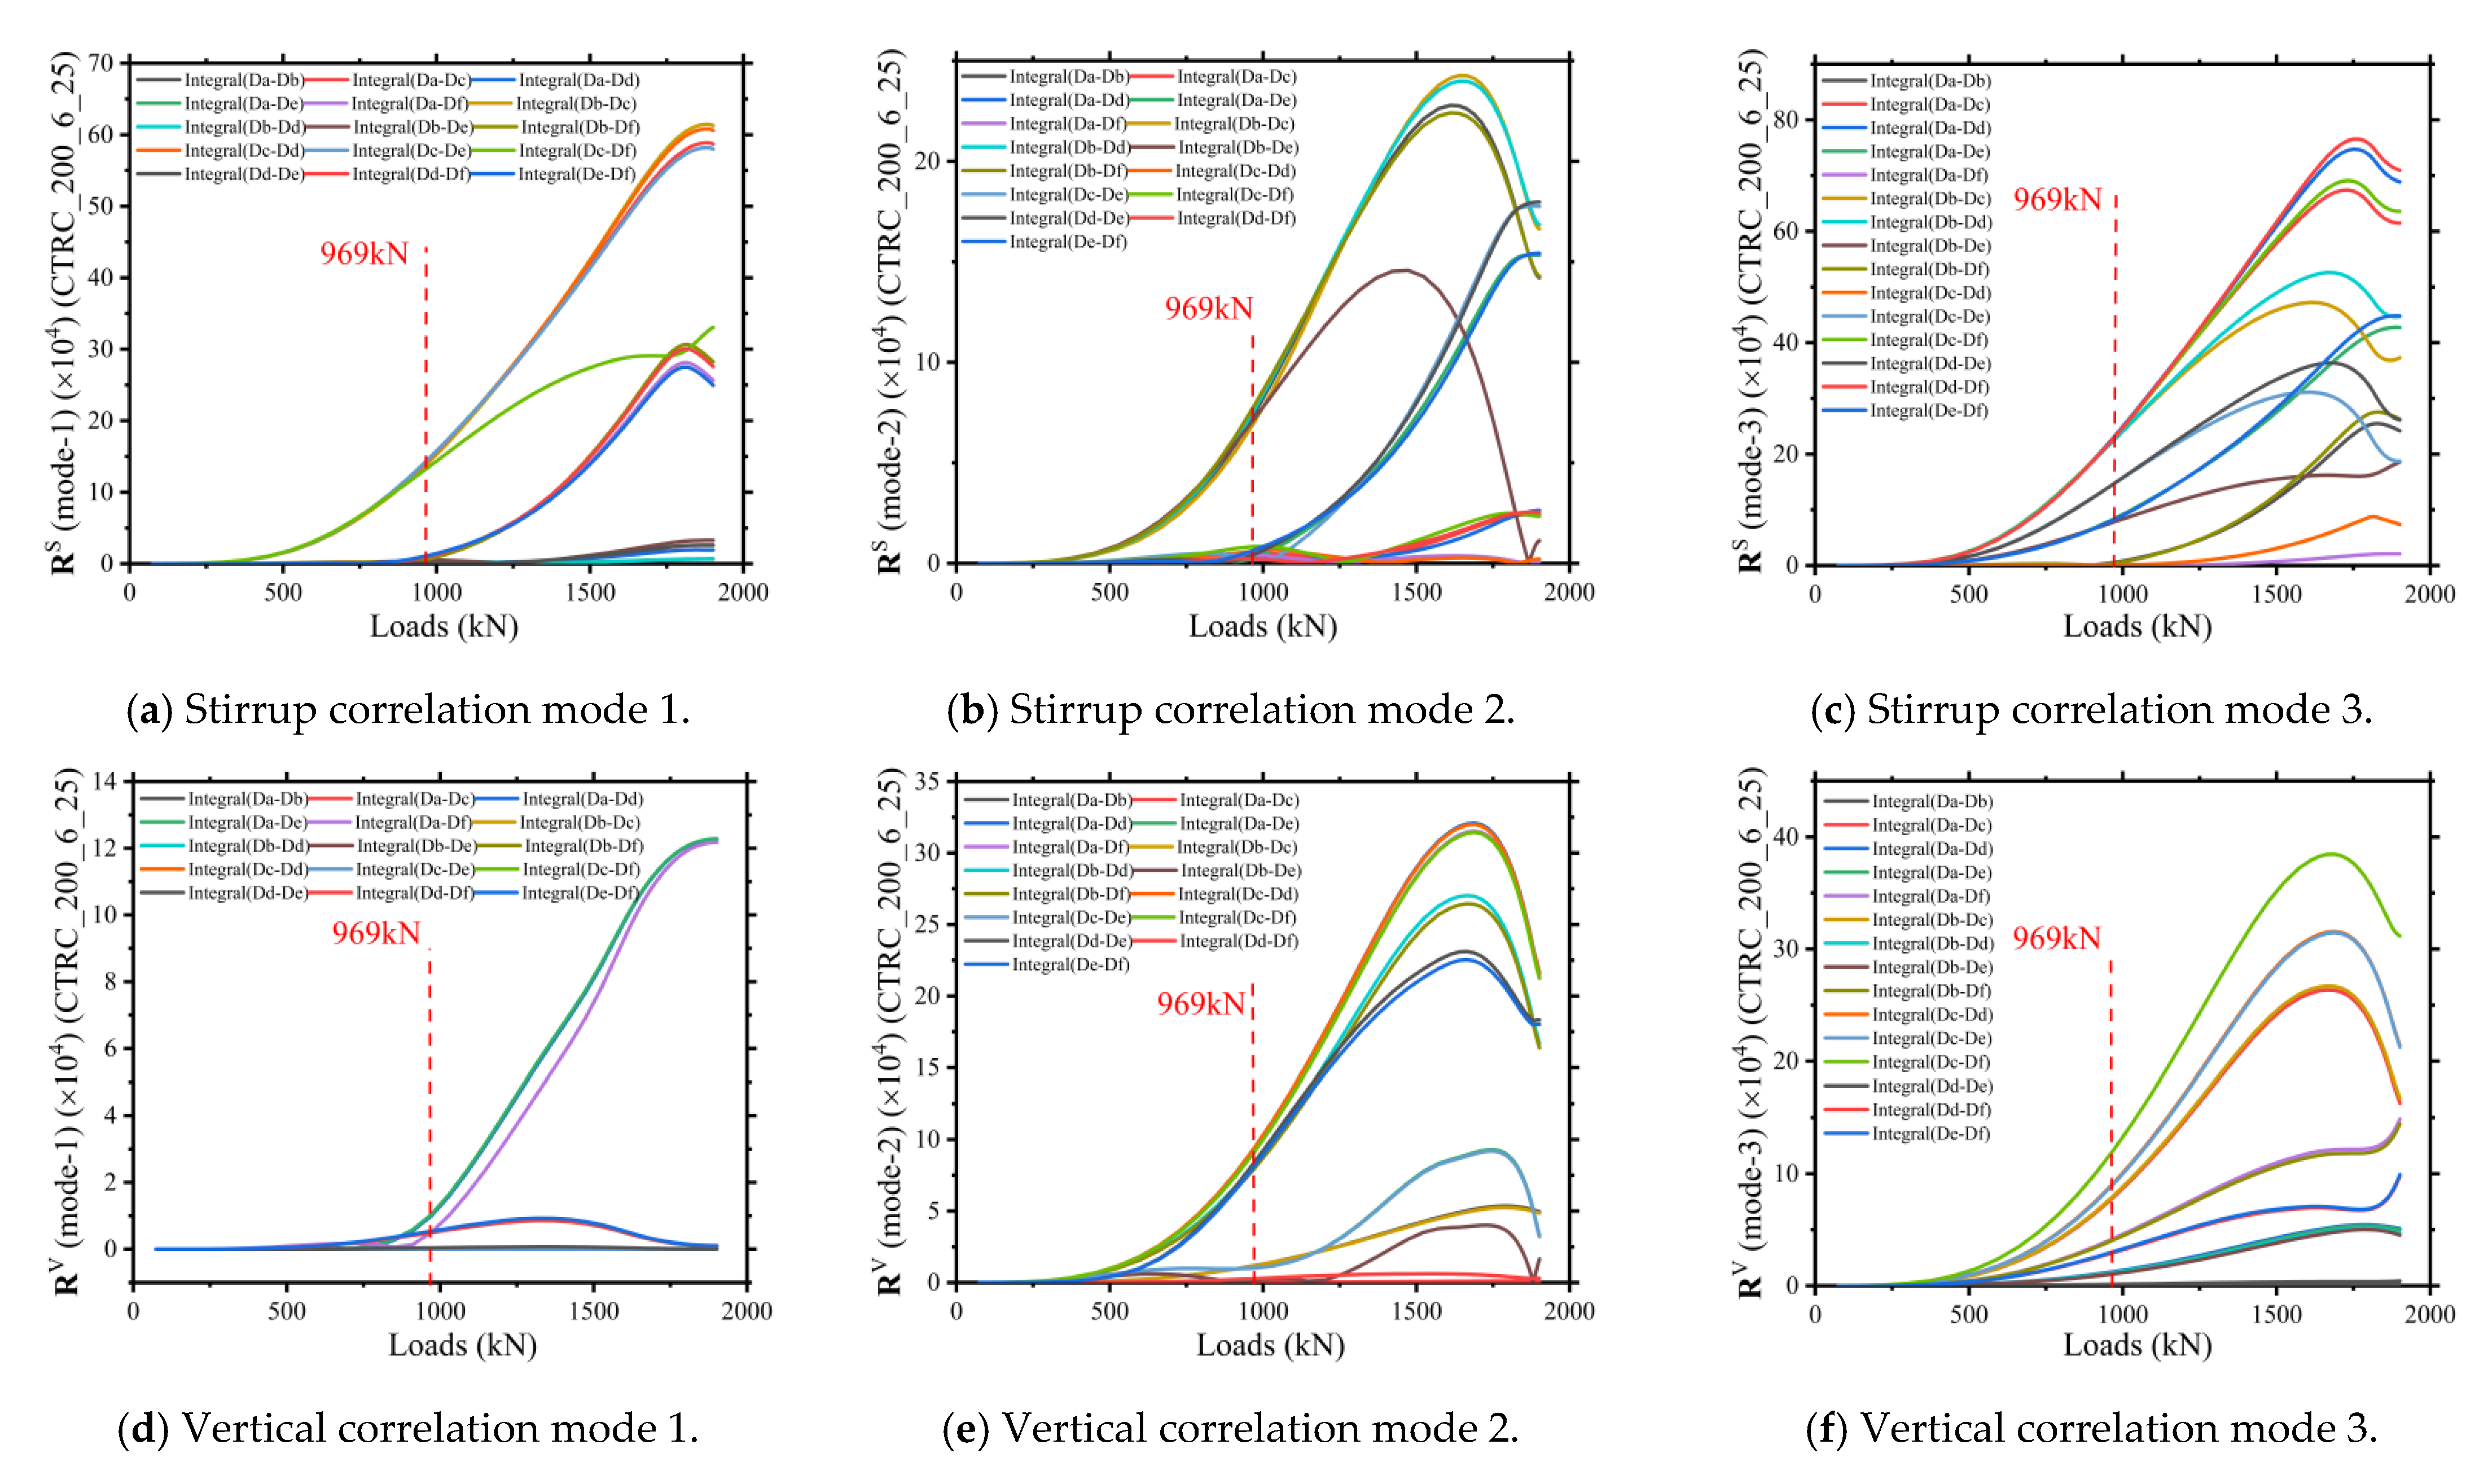
4.2. Part Characteristic Pair
5. Conclusions
- (1)
- The applicability of the structural stressing state theory to CTRC columns was verified. A correlation modeling analysis method was proposed to establish the stressing state mode and characteristic parameters of CTRC columns to characterize the evolution of their stressing states. In addition, the location of the characteristic point was determined by the slope increment criterion, and the rationality of the modeling method was verified by the mutation of the correlation model and characteristic parameters near the characteristic point.
- (2)
- The damage starting point of the CTRC column had a very stable value. The mode and characteristic parameters obtained by the correlation modeling analysis of the finite element model of the CTRC column well characterized the evolution of the stressing state of the CTRC column. Moreover, applying the slope increment criterion to the correlation characteristic parameter curves revealed the location of the characteristic points.
- (3)
- The finite element model of the CTRC column was divided according to the core concrete, steel tube, vertical reinforcement, and stirrup reinforcement. The correlation stressing state modes of each part of the CTRC column obtained by different element selection methods can be a very obvious bifurcation or turning phenomenon near the characteristic points. Moreover, the slope increment curves of the correlation characteristic parameter curves show the mutation characteristic near the characteristic point especially.
Author Contributions
Funding
Institutional Review Board Statement
Informed Consent Statement
Data Availability Statement
Conflicts of Interest
References
- Knowles, B.; Park, R. Axial Load Design for Conerete Filled Steel Tubes. J. Struct. Div. 1970, 96, 2125–2153. [Google Scholar] [CrossRef]
- Sen H, K. Triaxial stresses in short circular concrete filled tubular steel columns. In Proceedings of the RILEM-Conference, Cannes, France, 5–7 October 1972. [Google Scholar]
- Neogi P, K. Concrete-filled tubular steel columns under eccentric loading. Struct. Eng. 1969, 47, 187–195. [Google Scholar]
- Cai, S.H.; Di, X.T. Research on the performance and strength calculation of concrete-filled steel tube columns under eccentric compression. In Strength Calculation of Concrete-Filled Steel Tube Structure; Institute of Structure, Chinese Academy of Building Sciences: Beijing, China, 1984. [Google Scholar]
- Cai, S.H.; Jiao, Z.S. Research on the basic performance and strength calculation of concrete-filled steel tube short columns. In The Strength of the Concrete-Filled Steel Tube Structure Degree Calculation; Institute of Structure, China Academy of Building Research: Beijing, China, 1984. [Google Scholar]
- Zhong, S. Steel Tube Concrete Structure; Heilongjiang Science and Technology Press: Daqing, China, 1988. [Google Scholar]
- Furlong, W. Design of Steel Eneased Conerete Beam-Column. J. Struetural Div. 1968, 94, 267–281. [Google Scholar] [CrossRef]
- Furlong R, W. Concrete encased steel columns—Design tables. J. Struct. Div. 1974, 100, 1865–1882. [Google Scholar] [CrossRef]
- Chen, Z.; Zhao, Y.; Shao, Y.; Zhou, G. Essential state-of-stress features of hbbc connections revealed by modeling simulative strain energy. Eng. Struct. 2021, 230, 111463. [Google Scholar] [CrossRef]
- Liu, B.; Zhao, Y.; Liu, H.B.; Zhou, G.C. The Hysteretic Failure Features of Reinforced Masonry Shear Walls Revealed by Modeling Experimental Residual Strain Data. J. Earthq. Eng. 2021. [Google Scholar] [CrossRef]
- Zhao, Y.; Liu, B.; Li, H.; Liu, H.; Zhou, G. Hysteretic stressing state features of RCB shear walls revealed by structural stressing state theory. Case Stud. Constr. Mater. 2021, 15, e00674. [Google Scholar] [CrossRef]
- Zhou, G.; Shi, J.; Li, P.; Li, H. Characteristics of structural state of stress for steel frame in progressive collapse. J. Constr. Steel. Res. 2019, 160, 444–456. [Google Scholar] [CrossRef]
- Shi, J.; Li, P.; Chen, W.; Zheng, K.; Zhou, G. Structural state of stress analysis of concrete-filled stainless steel tubular short columns. Stahlbau 2018, 87, 600–610. [Google Scholar] [CrossRef]
- Liu, B.; Zhang, Y.; Li, R.; Zhou, G.; Zhao, Y. Essential stressing state features of spirally reinforced concrete short columns revealed by modeling experimental strain data. Structures 2020, 25, 1–7. [Google Scholar] [CrossRef]
- Shen, J.; Huang, W.; Yang, X.; Shi, J.; Zheng, K. Stressing state analysis of cfst arch supports in deep roadway based on nsf method. Appl. Sci. 2019, 9, 4238. [Google Scholar] [CrossRef] [Green Version]
- Yang, X.; Shen, J.; Shi, J.; Zhou, G. Essential working characteristics of concrete-filled steel tubular arch supports discovered by modeling experimental strains. Structures 2021, 29, 806–813. [Google Scholar] [CrossRef]
- Shi, J.; Yang, K.; Zheng, K.; Shen, J.; Zhou, G.; Huang, Y. An investigation into working behavior characteristics of parabolic CFST arches applying structural stressing state theory. J. Civ. Eng. Manag. 2019, 25, 215–227. [Google Scholar] [CrossRef]
- Shi, J.; Xiao, H.; Zheng, K.; Shen, J.; Zhou, G. Essential stressing state features of a large-curvature continuous steel box- girder bridge model revealed by modeling experimental data. Thin. Wall. Struct. 2019, 143, 106247. [Google Scholar] [CrossRef]
- Zhang, M.; Zhou, G.; Huang, Y.; Zhi, X.; Zhang, D.Y. An ESED method for investigating seismic behavior of single-layer spherical reticulated shells. Earthq. Struct. 2017, 13, 455–464. [Google Scholar] [CrossRef]
- Qi, H.T. Research on Static Performance of Steel Tube Confined Concrete Members under Axial and Eccentric Compression. Ph.D. Thesis, Harbin Institute of Technology, Harbin, China, 2014. [Google Scholar]
- GB 50010-2010; Code for Design of Concrete Structures. China Building Industry Press: Beijing, China, 2015.


| Researchers | Foothold | Expression |
|---|---|---|
| Knowles, B. et al. [1] | Ultimate states | |
| Sen, H.K. [2] | ||
| Neogi, P.K. [3] | Plasticity stage | |
| Cai, S.H. [4,5] | Stable bearing capacity |
| Researchers | Foothold | Expression |
|---|---|---|
| Zhong Shantong [6] | Crush theory | |
| W. Furlong [7] | Correlation equation | |
| W. Furlong [8] | Empirical coefficient method |
| Specimen Number | D (mm) | t (mm) | L (mm) | (Slenderness Ratio) |
|---|---|---|---|---|
| CTRC-200-6-0 | 200 | 1.5 | 1200 | 24 |
| CTRC-200-6-25 | 200 | 1.5 | 1200 | 24 |
| CTRC-200-6-50 | 200 | 1.5 | 1200 | 24 |
| CTRC-240-6-0 | 240 | 1.5 | 1440 | 24 |
| CTRC-240-6-25 | 240 | 1.5 | 1440 | 24 |
| CTRC-240-6-50 | 240 | 1.5 | 1440 | 24 |
| CTRC-200-10-0 | 200 | 1.5 | 2000 | 40 |
| CTRC-200-10-25 | 200 | 1.5 | 2000 | 40 |
| CTRC-200-10-50 | 200 | 1.5 | 2000 | 40 |
| CTRC-240-10-0 | 240 | 1.5 | 2400 | 40 |
| CTRC-240-10-25 | 240 | 1.5 | 2400 | 40 |
| CTRC-240-10-50 | 240 | 1.5 | 2400 | 40 |
| Steel Tube | Confined Concrete |
|---|---|
| Steel Tube | Confined Concrete |
|---|---|
| |
Publisher’s Note: MDPI stays neutral with regard to jurisdictional claims in published maps and institutional affiliations. |
© 2022 by the authors. Licensee MDPI, Basel, Switzerland. This article is an open access article distributed under the terms and conditions of the Creative Commons Attribution (CC BY) license (https://creativecommons.org/licenses/by/4.0/).
Share and Cite
Shen, Z.; Liu, B.; Zhou, G. Research on the General Failure Law of a CTRC Column by Modeling FEM Output Data. Materials 2022, 15, 6058. https://doi.org/10.3390/ma15176058
Shen Z, Liu B, Zhou G. Research on the General Failure Law of a CTRC Column by Modeling FEM Output Data. Materials. 2022; 15(17):6058. https://doi.org/10.3390/ma15176058
Chicago/Turabian StyleShen, Zijie, Bai Liu, and Guangchun Zhou. 2022. "Research on the General Failure Law of a CTRC Column by Modeling FEM Output Data" Materials 15, no. 17: 6058. https://doi.org/10.3390/ma15176058