
Transport and Electrochemical Properties of Li4Ti5O12-Li2TiO3 and Li4Ti5O12-TiO2 Composites


Abstract
:1. Introduction
2. Materials and Methods
2.1. Synthesis
2.2. Characterization
3. Results
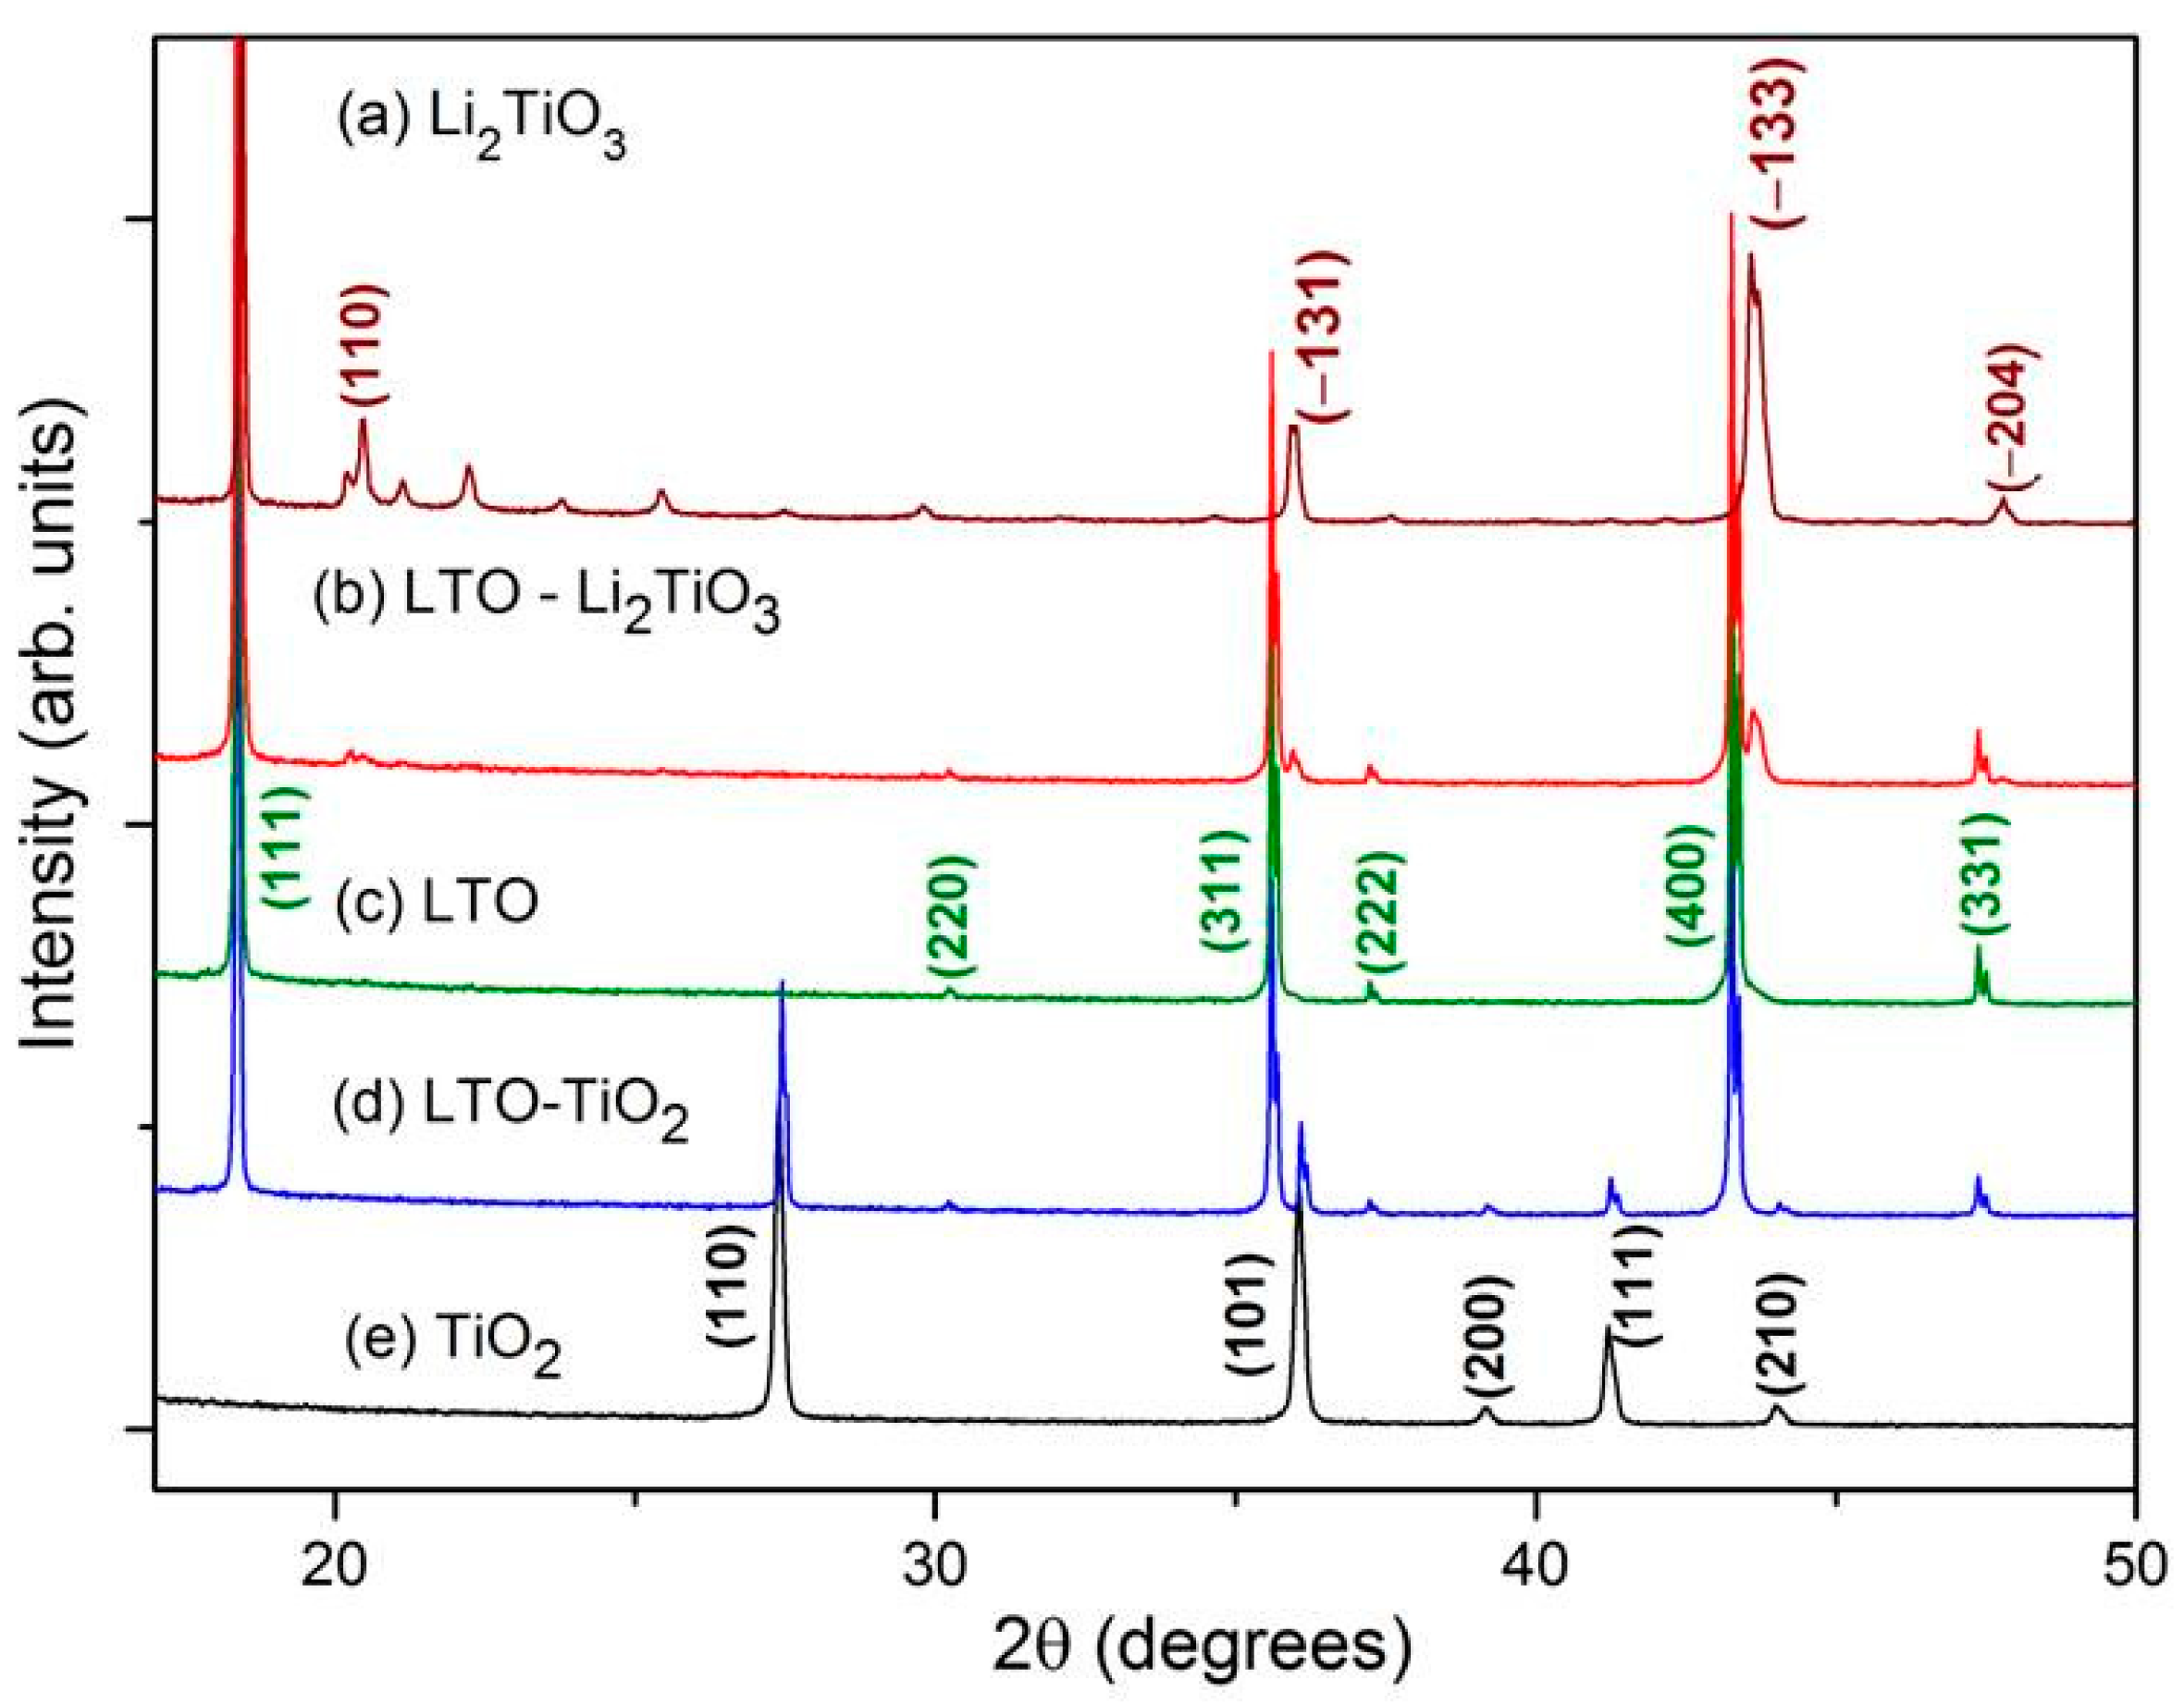
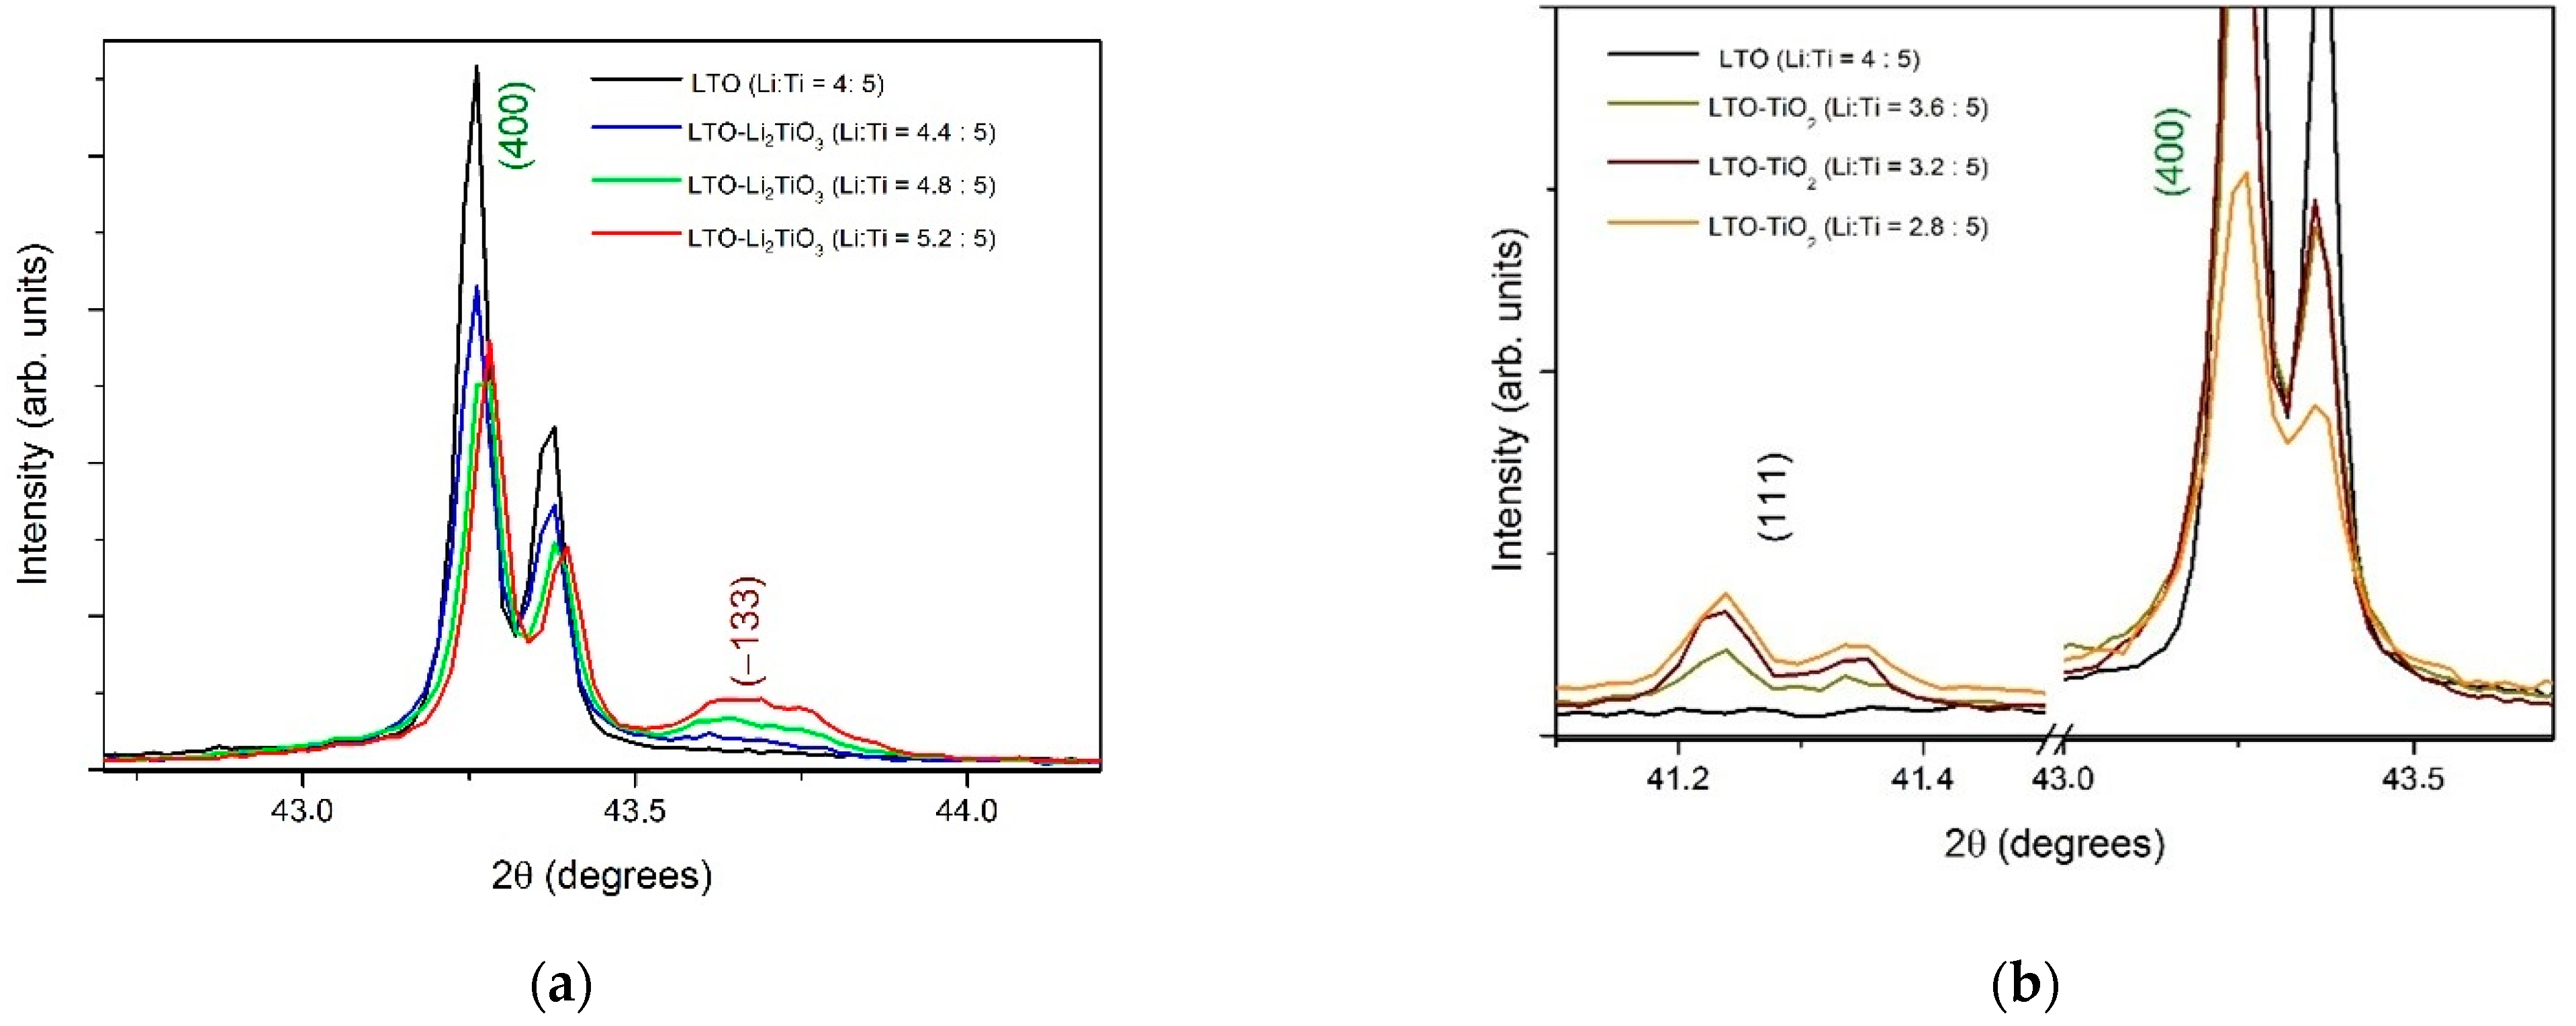
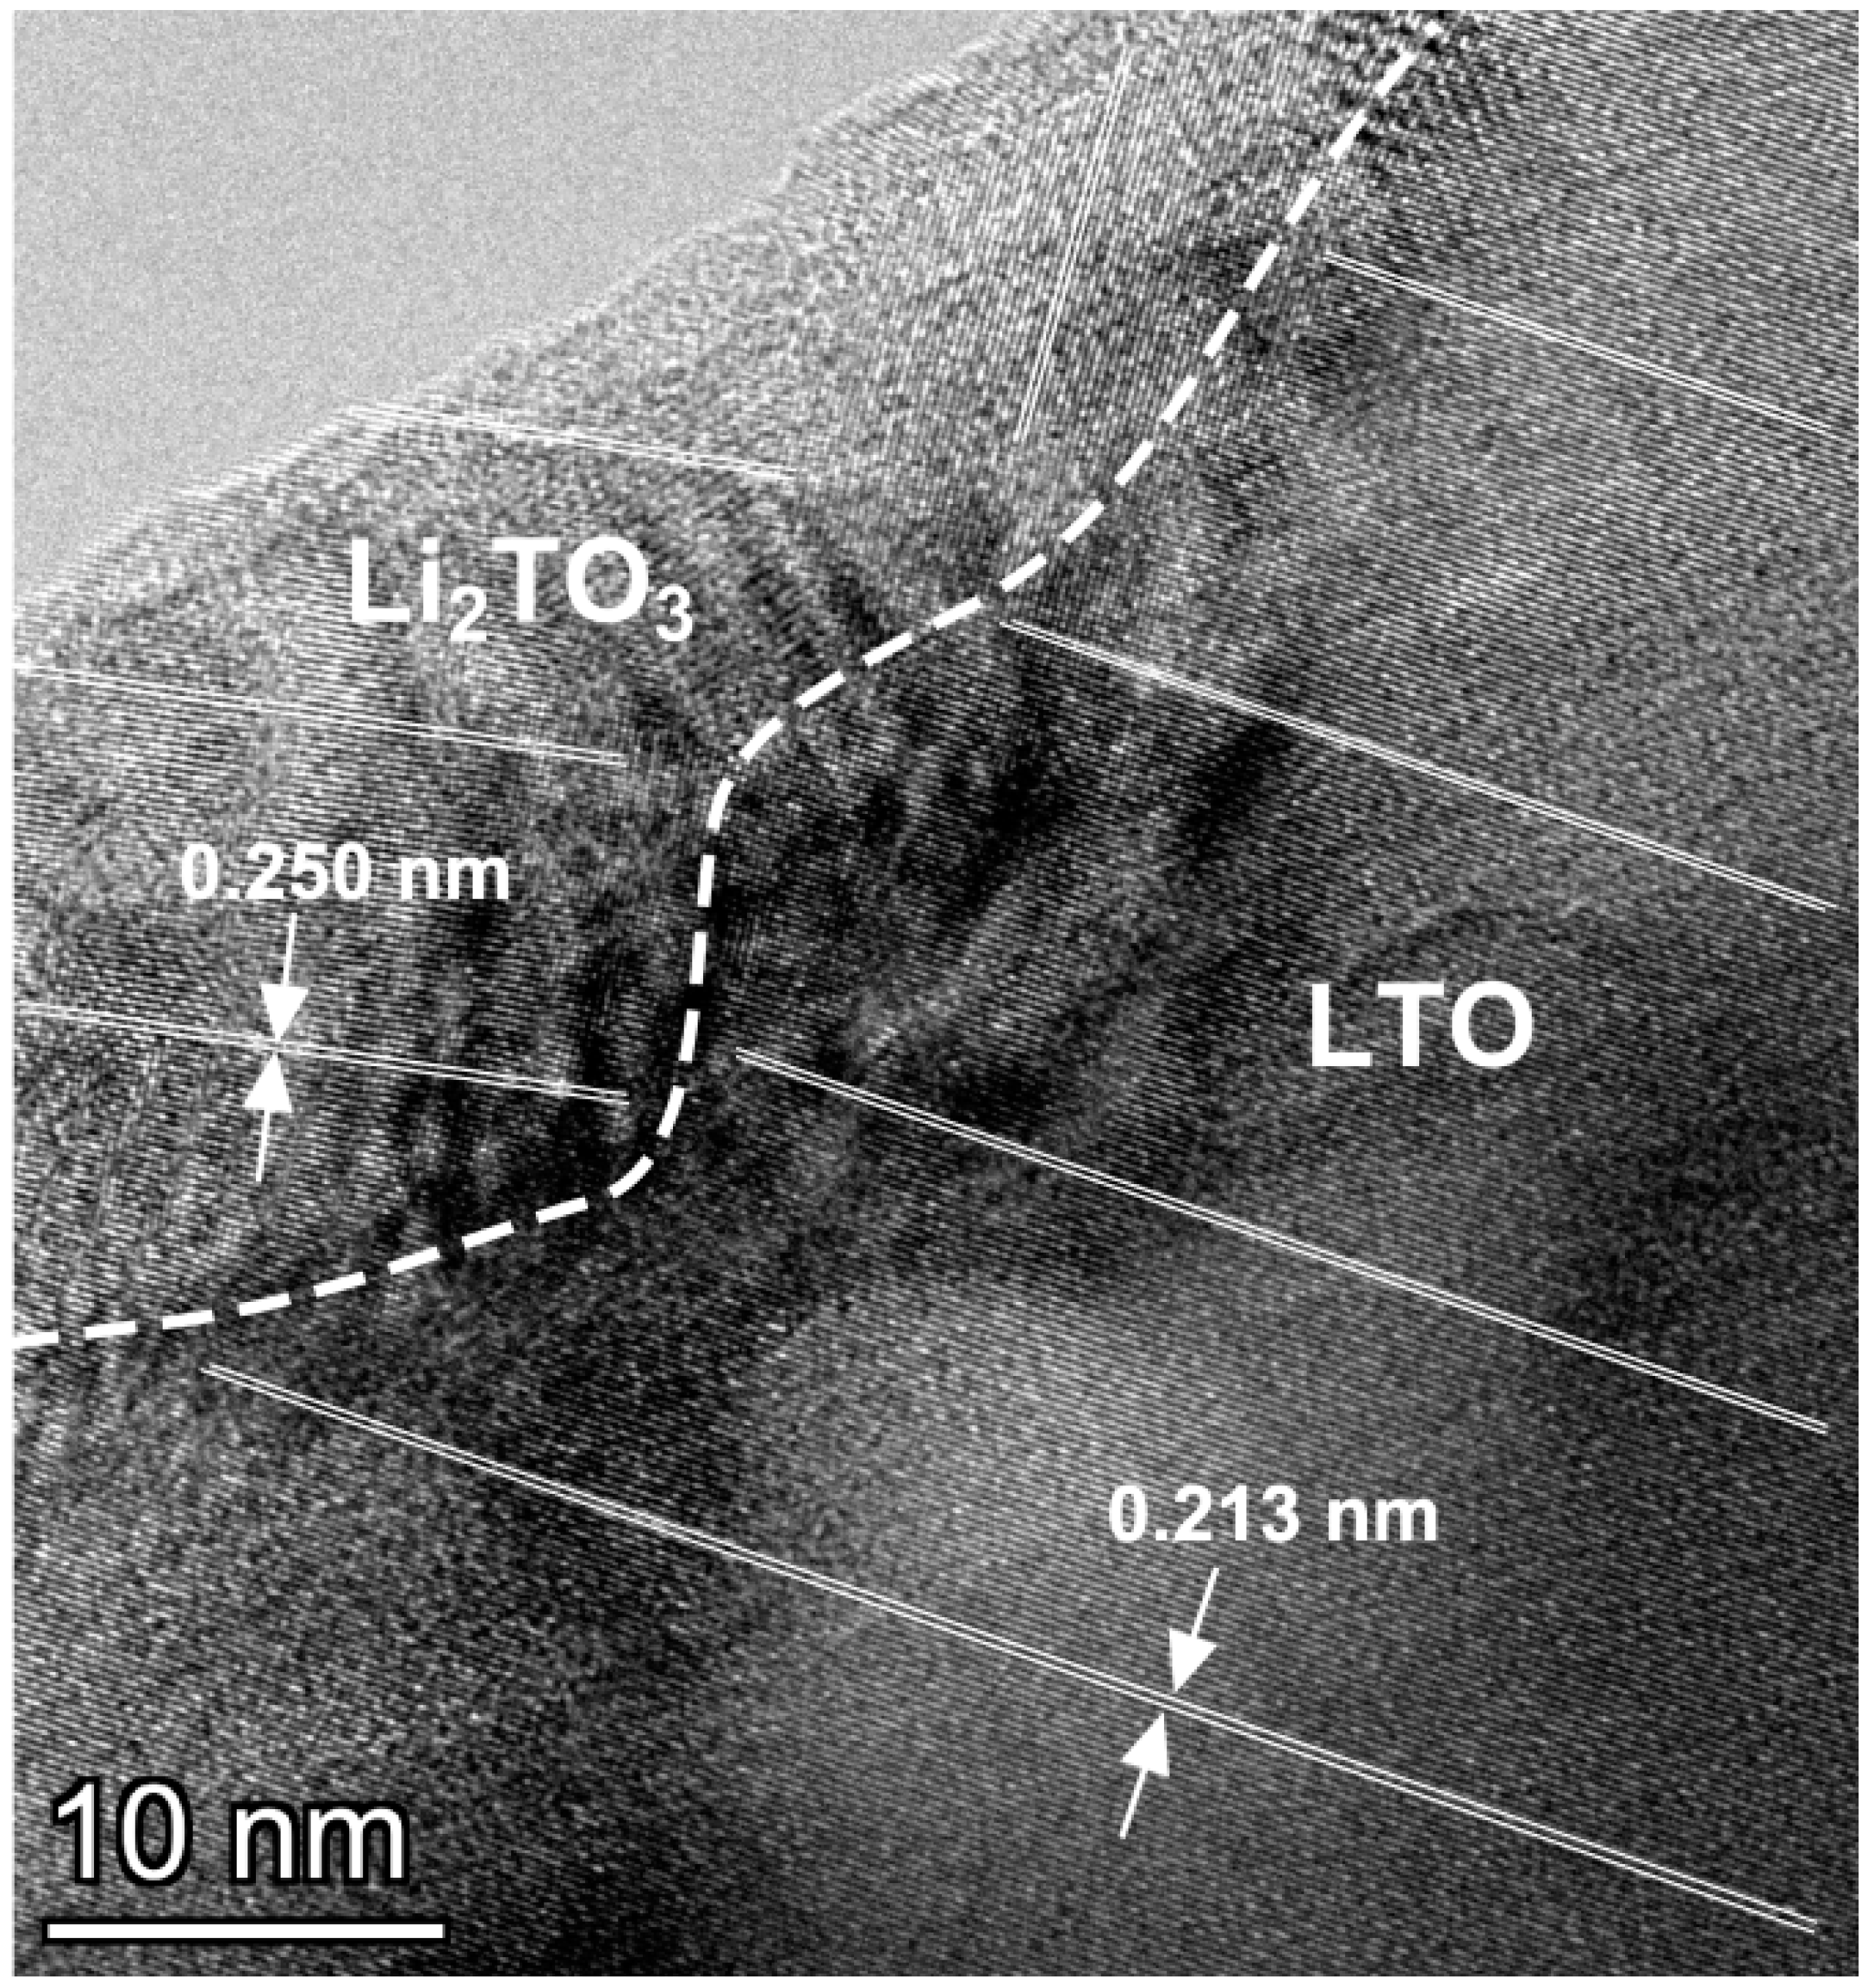
3.1. Structural Studies
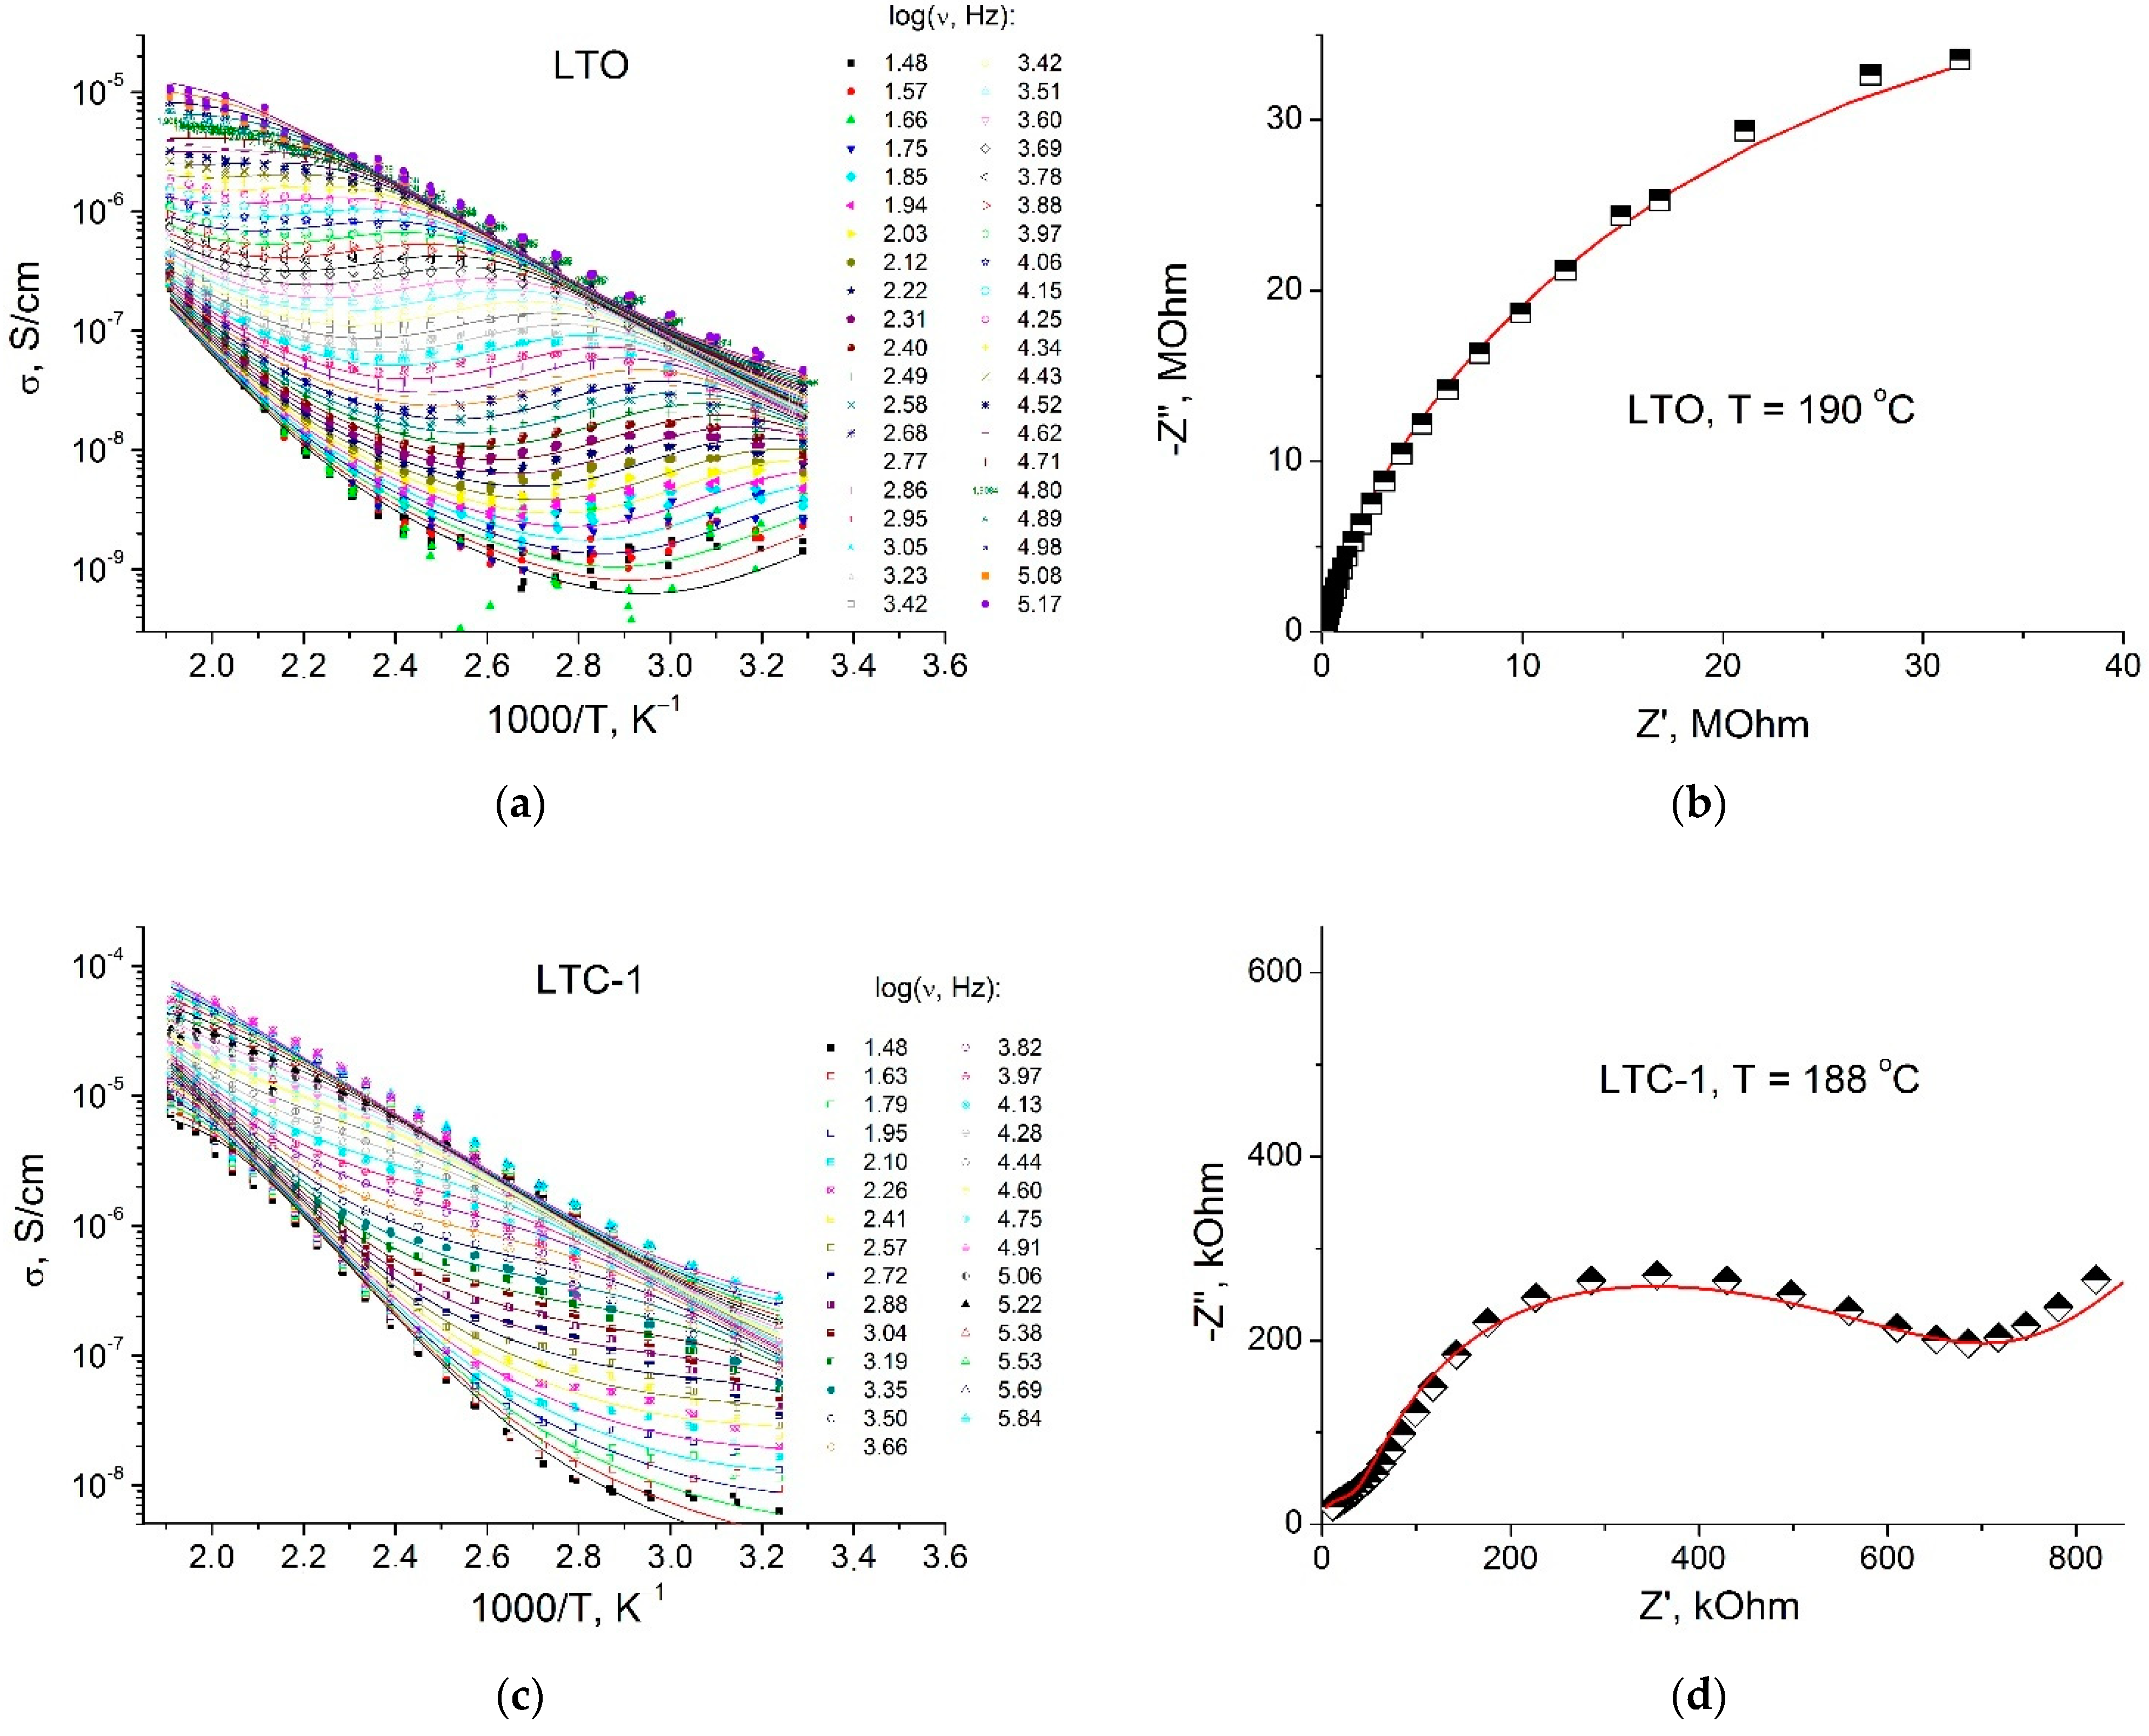
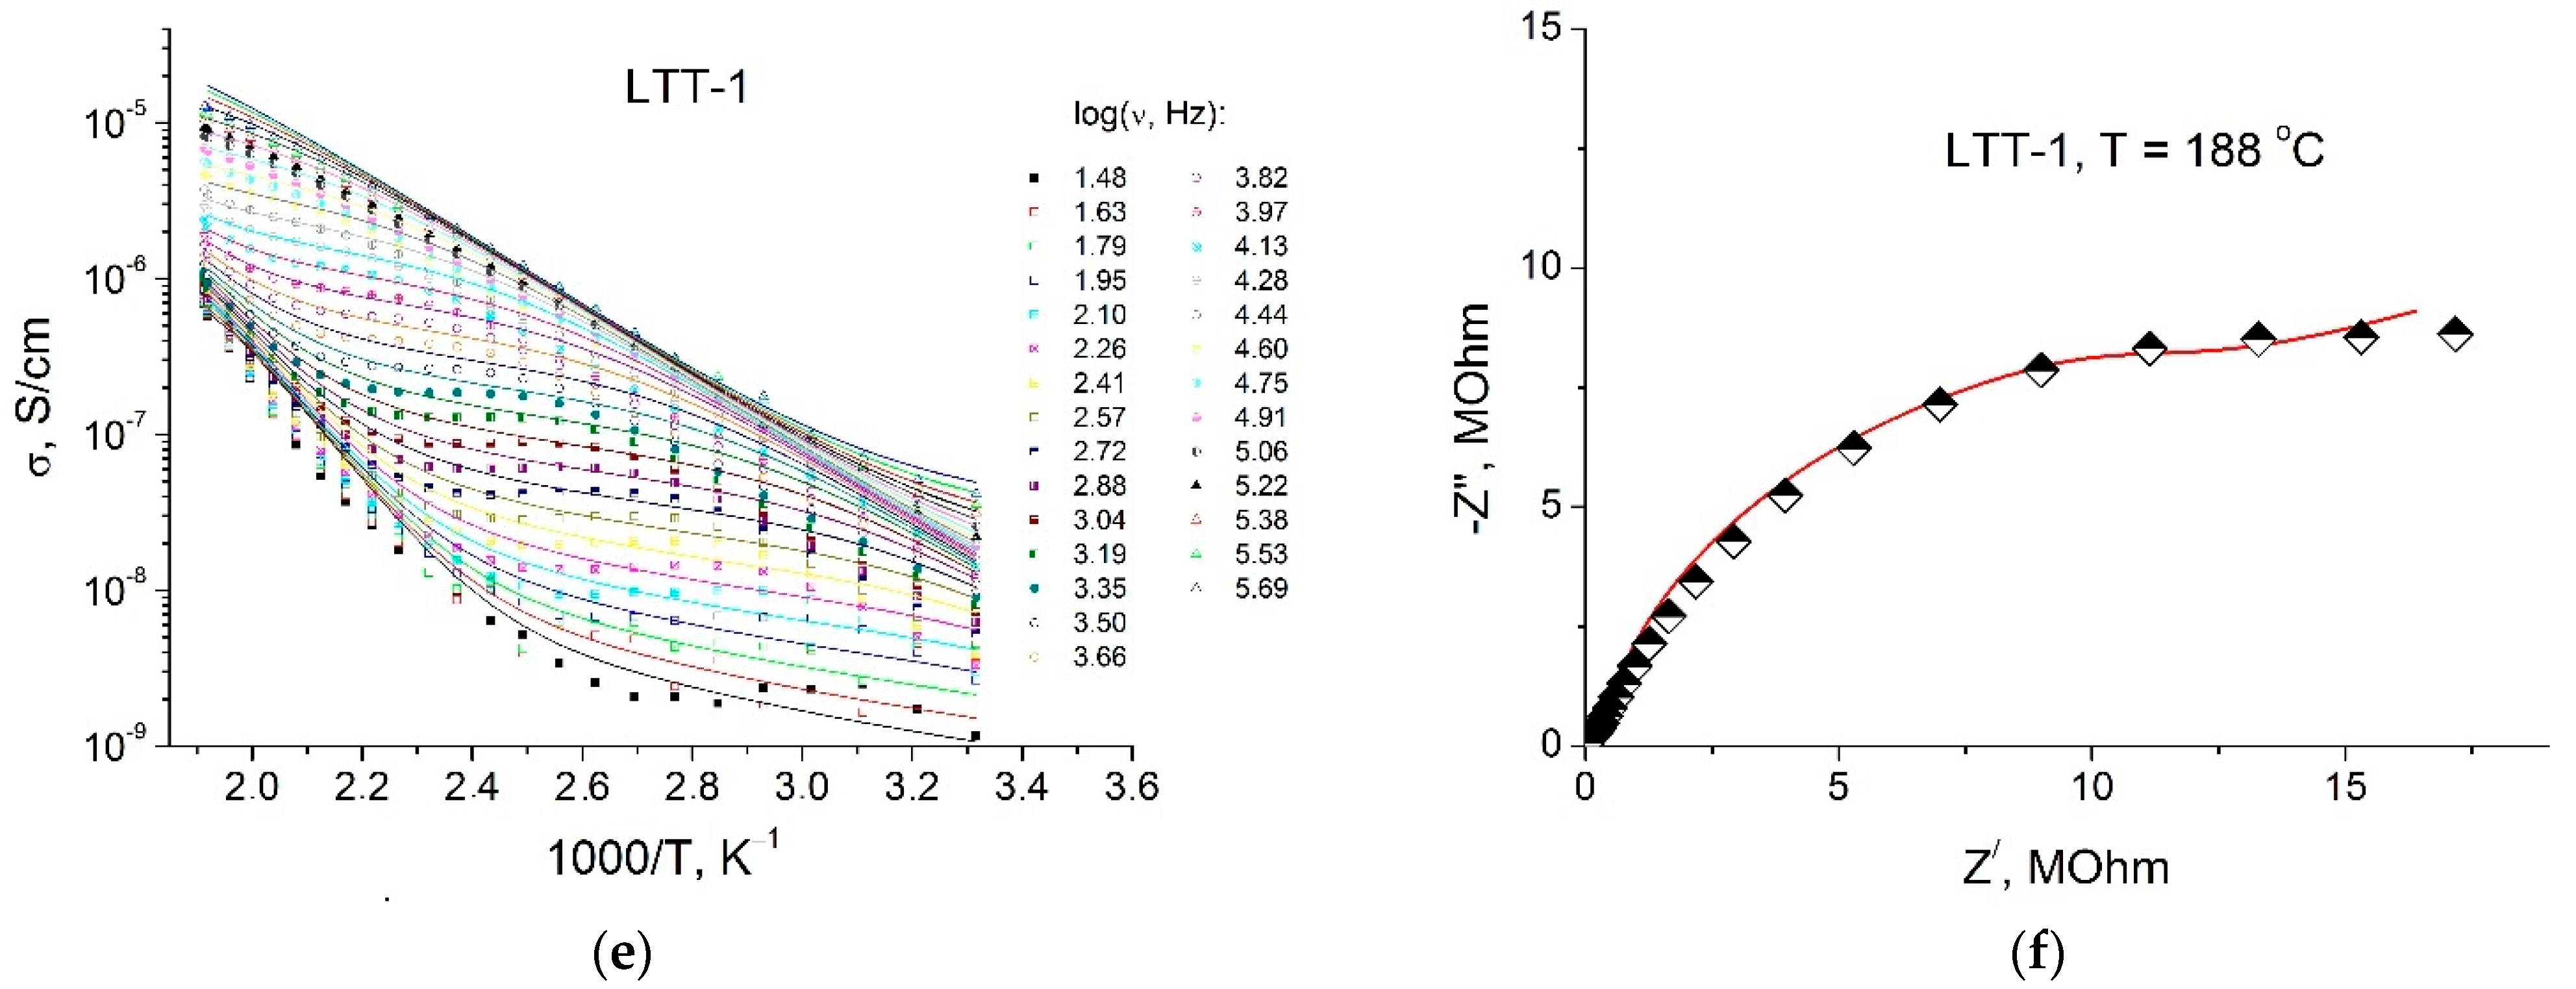
3.2. Ionic Conductivity
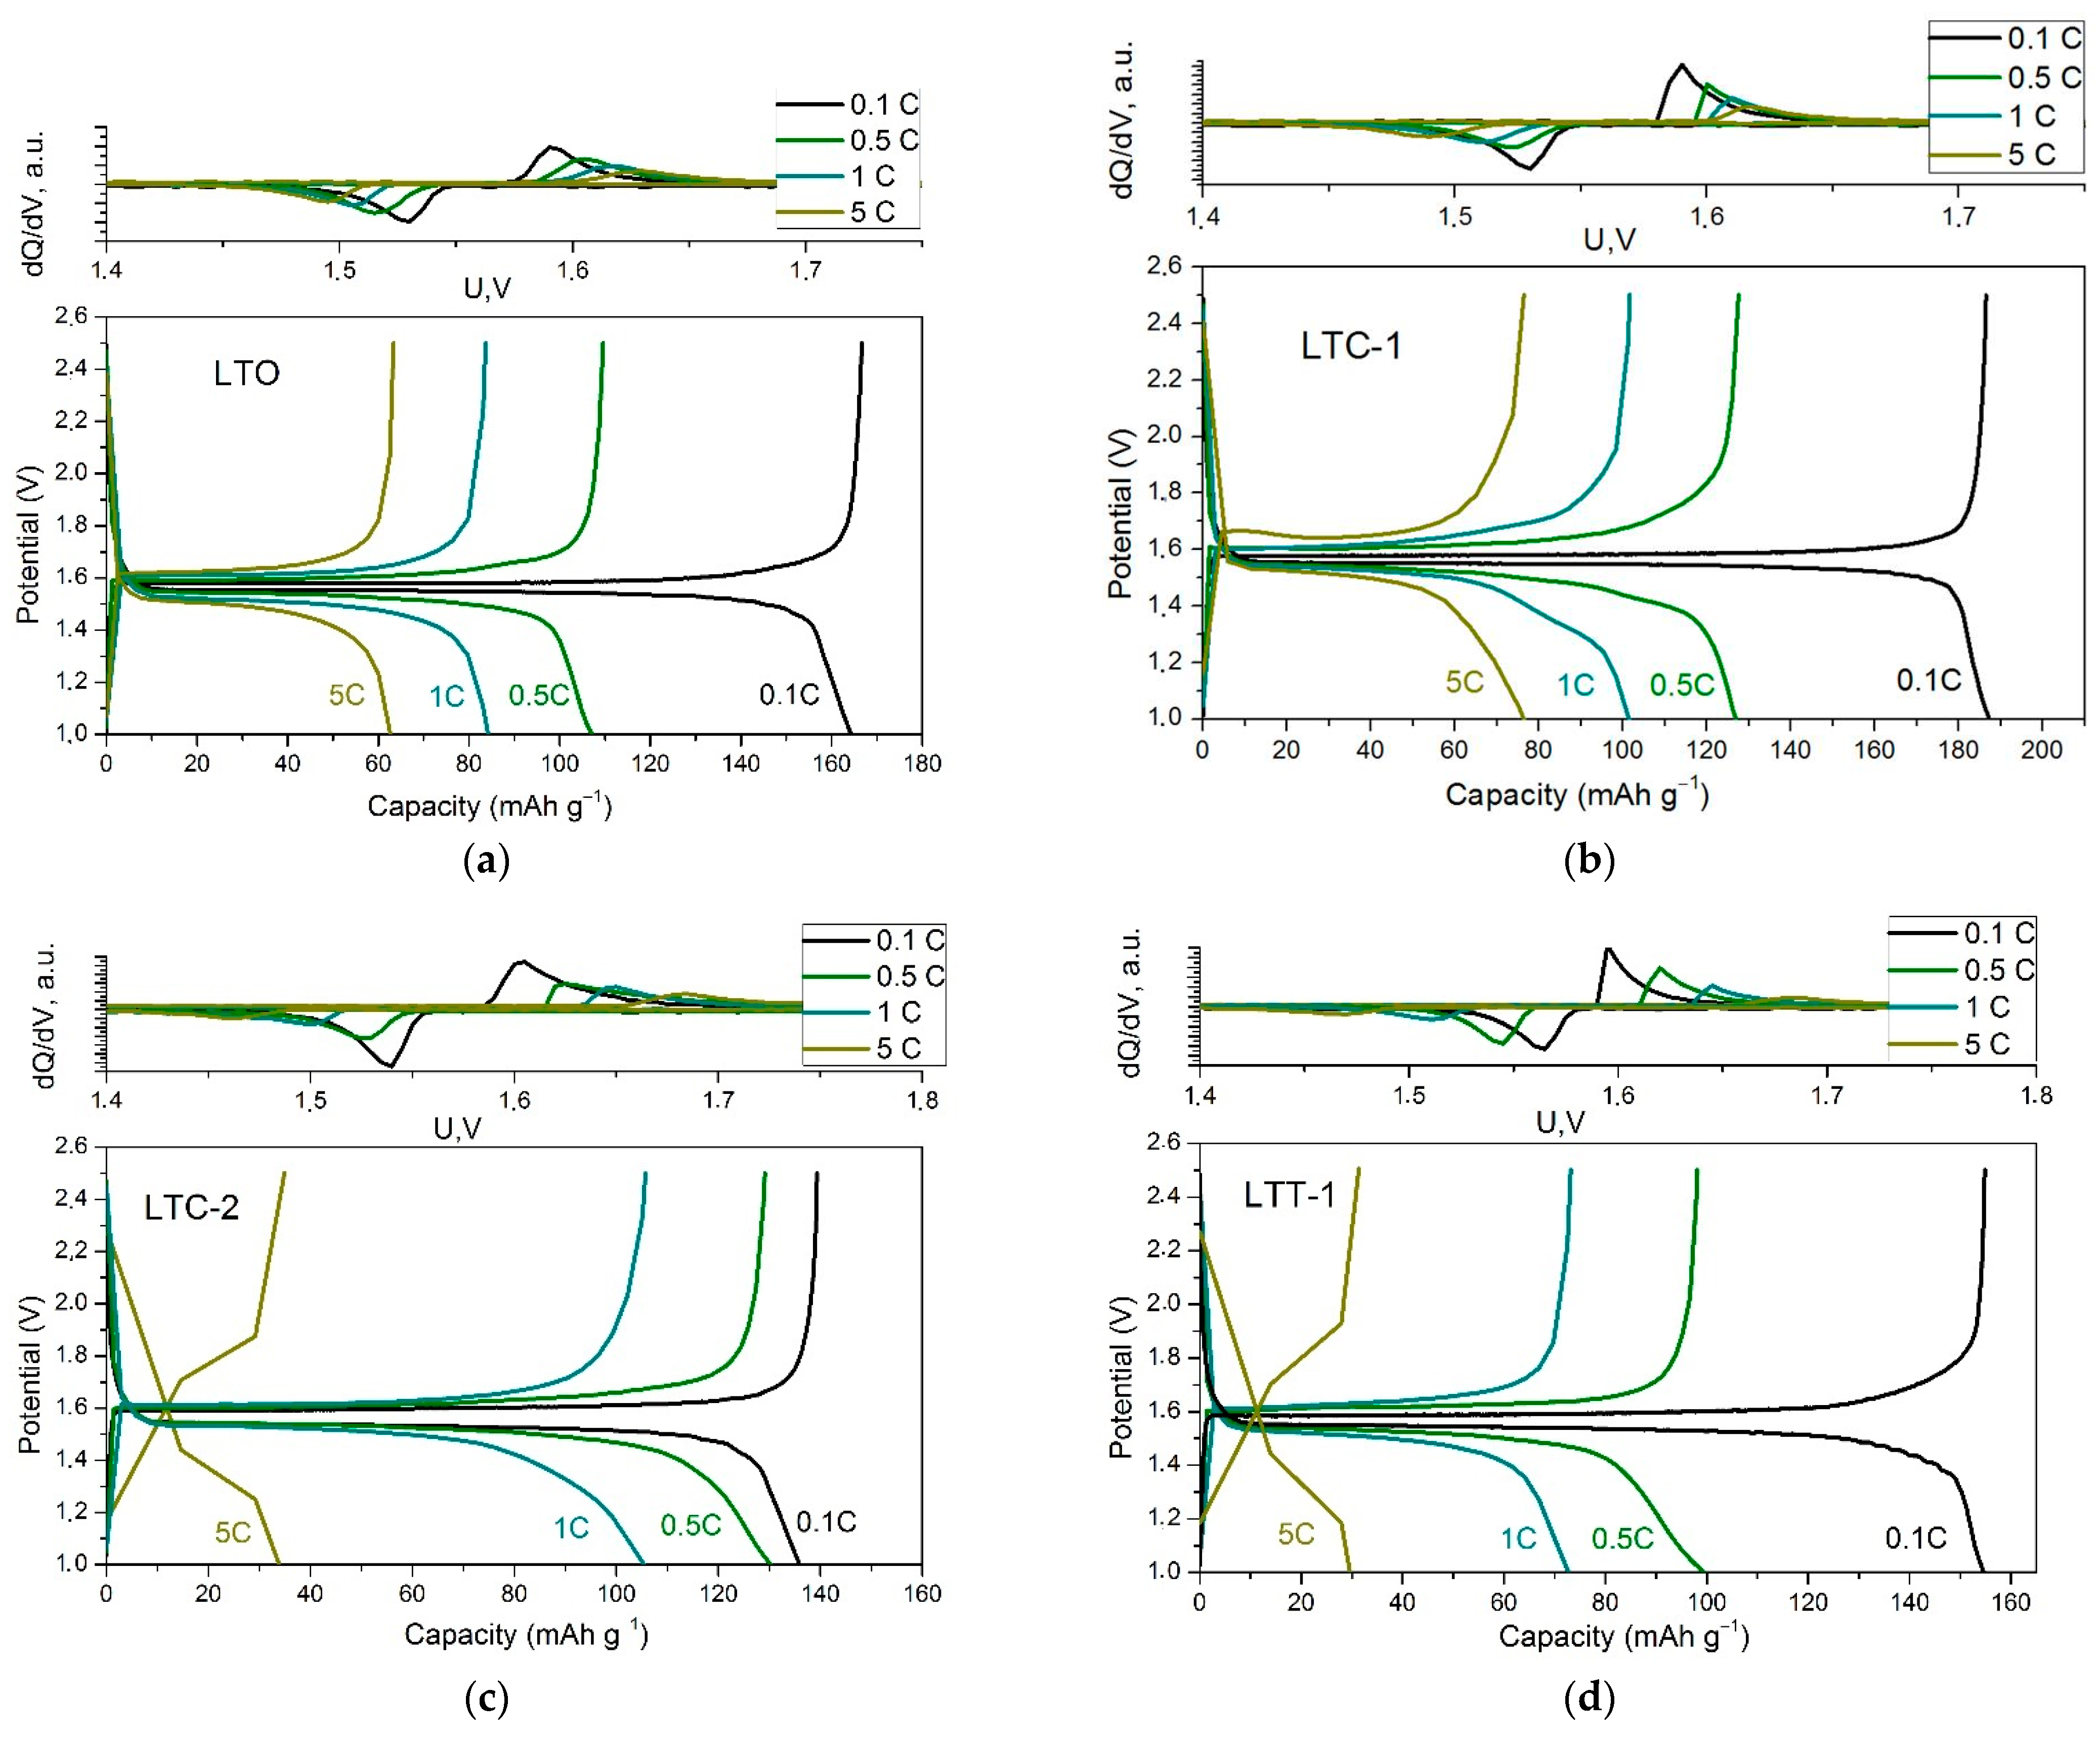
3.3. Electrochemical Properties
4. Discussion
5. Conclusions
- (i)
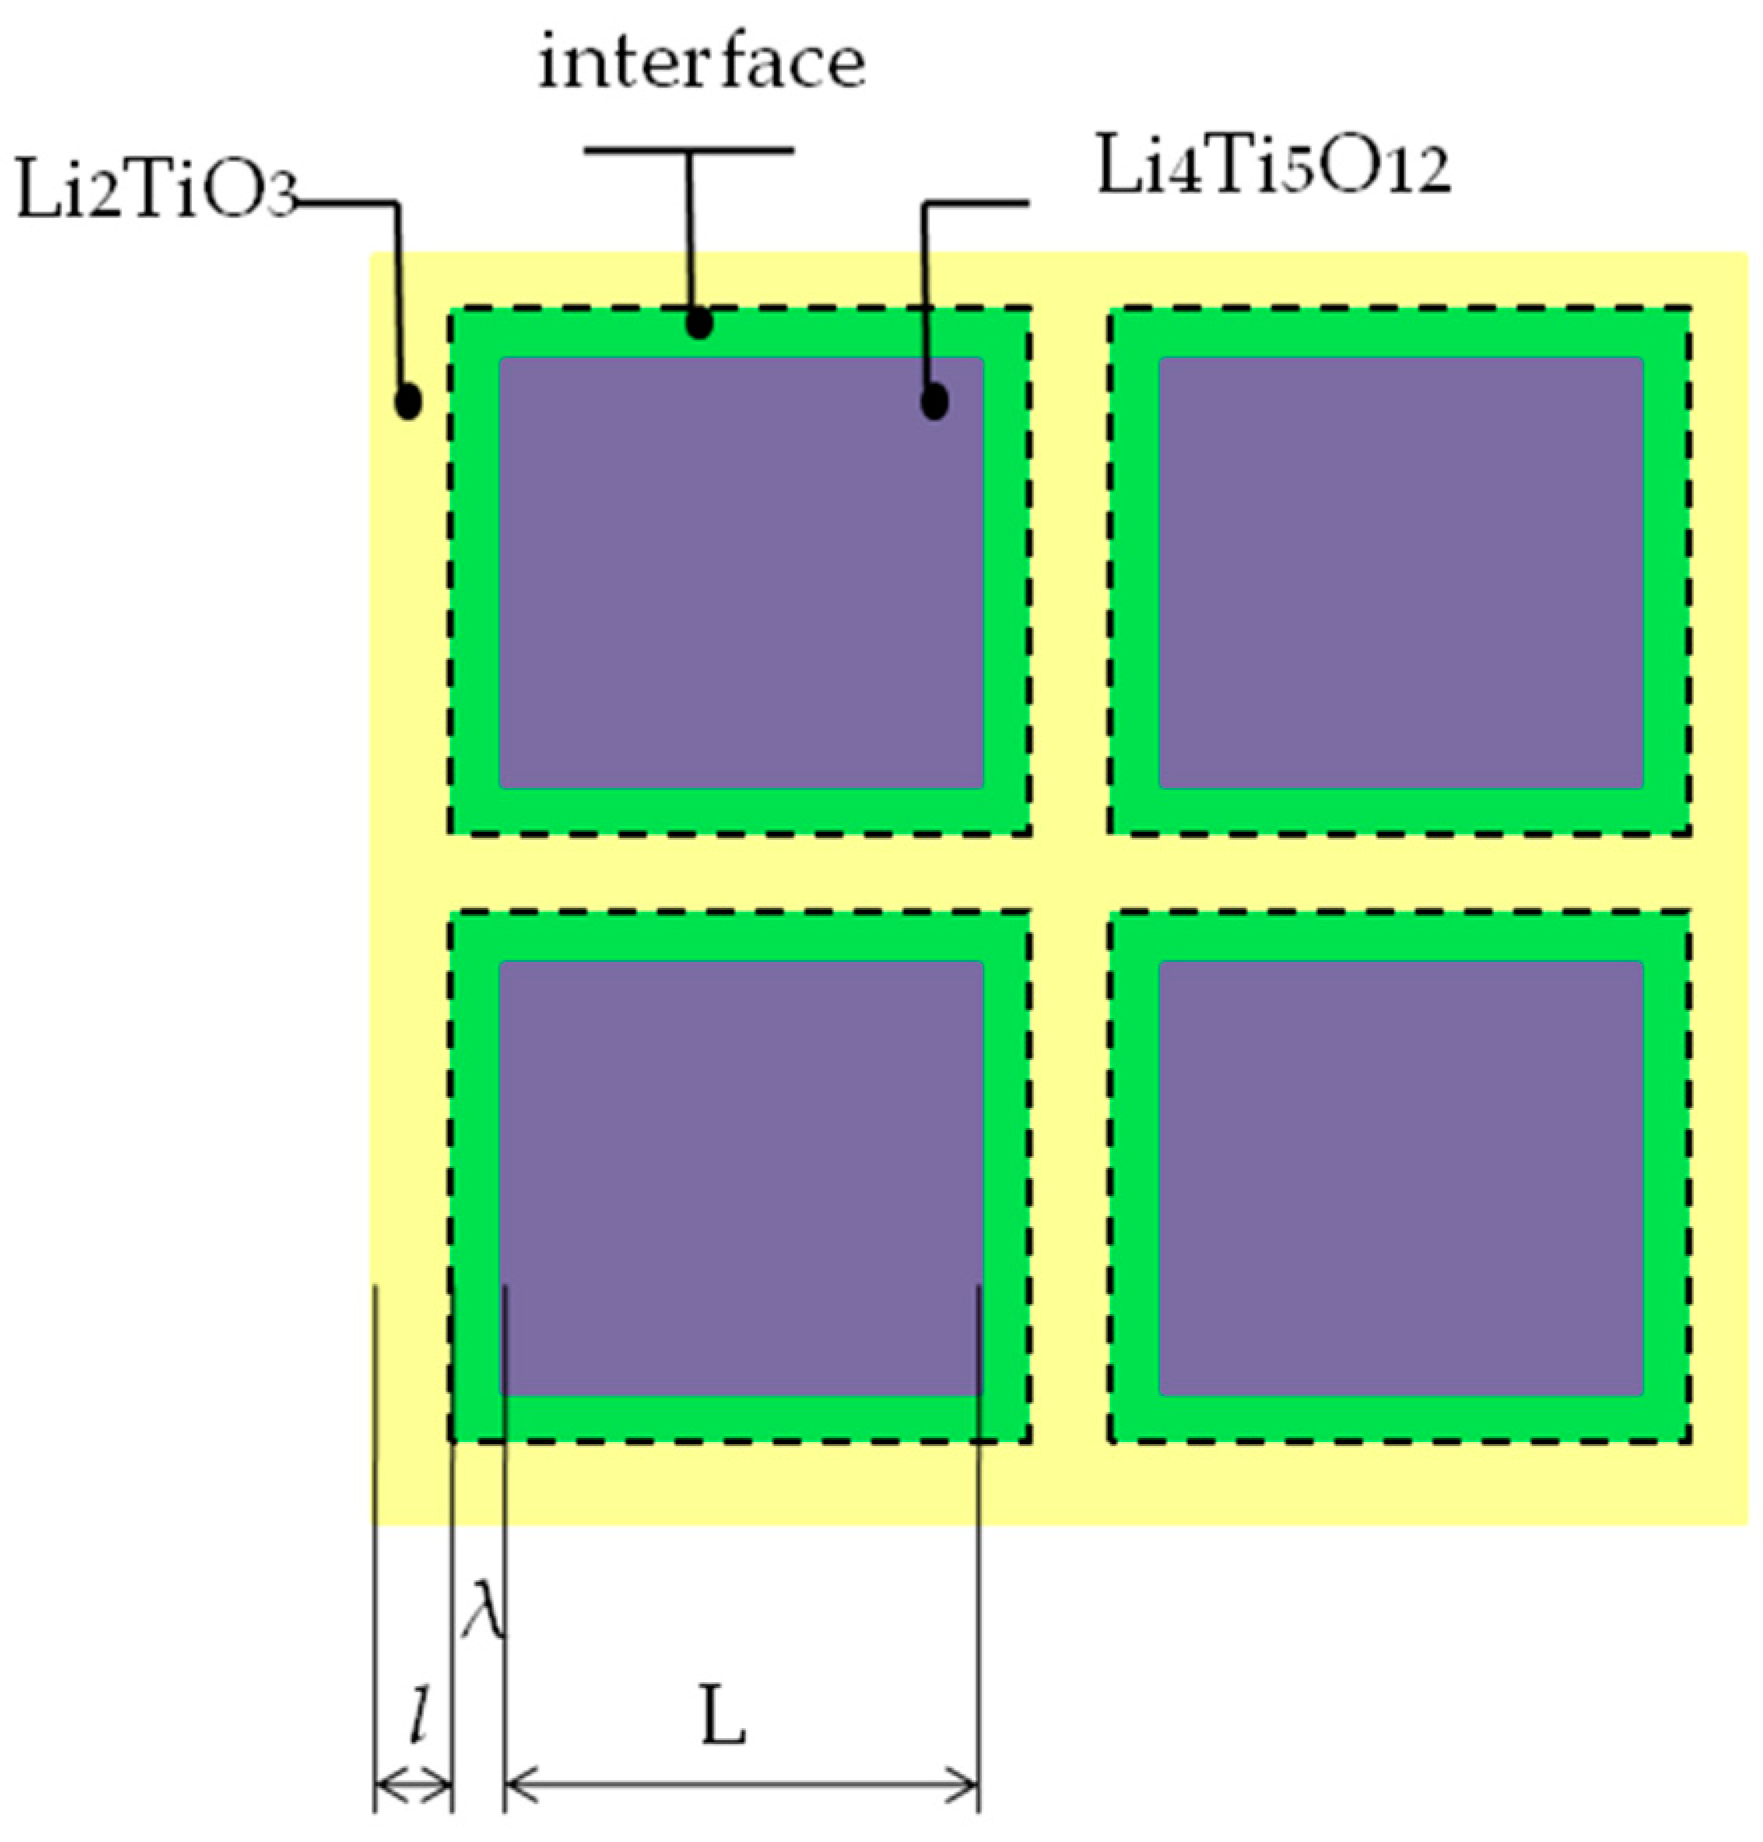
- A strong decrease in the grain boundary resistance of LTC composites at low concentration of Li2TiO3. The effect may be caused by easy formation of coherent interfaces between structurally similar phases Li2TiO3 and LTO leading to redistribution of lithium ions in the vicinity of the interfaces. With the increase of the concentration of Li2TiO3 in LTC composites, the grain boundary resistance goes through a minimum and increases again due to growth insulation layer of small Li2TiO3 particles around LTO grains. For LTT composites, a similar effect was observed, albeit not as strong.
- (ii)
- Unusually high charge–discharge capacity of LTC composites at a low concentration of electrochemically inactive phase Li2TiO3 exceeding the theoretical value for pure LTO. This effect is likely to be caused by the appearance of the electrochemical activity of Li2TiO3 in the composite. This effect results from the interface interaction between LTO and Li2TiO3 taking place due to formation of coherent interfaces between structurally similar phases. The increase in the capacity may be qualitatively described in terms of a two-phase composite model with the interface layer of a high capacity. In addition, LTC composites have a better cycling rate and stability compared to LTO. This effect is caused by a higher ionic conductivity of the composites, as demonstrated in the impedance measurements above. Due to a noticeable difference in crystal structures of LTO and TiO2, no strong interface interaction occurs in LTT composites.
Author Contributions
Funding
Informed Consent Statement
Conflicts of Interest
References
- Lu, J.; Chen, Z.; Pan, F.; Cui, Y.; Amine, K. High-Performance Anode Materials for Rechargeable Lithium-Ion Batteries. Electrochem. Energy Rev. 2018, 1, 35–53. [Google Scholar] [CrossRef]
- Ferg, E.; Gummow, R.J.; Kock, A.; Thackeray, M. Spinel anode for lithium-ion batteries. J. Electrochem. Soc. 1994, 11, L147. [Google Scholar] [CrossRef]
- Colbow, M.; Dahn, J.R.; Haering, R.R. Structure and electrochemistry of the spinel oxides LiTi2O4 and Li4/3Ti5/3O4/K. J. Power Sources 1989, 26, 397–402. [Google Scholar] [CrossRef]
- Sun, Y.-K.; Jung, D.-J.; Lee, Y.S.; Nahm, K.S. Synthesis and electrochemical characterization of spinel Li[Li(1-x)/3CrxTi(5-2x)/3]O4 anode materials. J. Power Sources 2004, 125, 242–245. [Google Scholar] [CrossRef]
- Murphy, D.W.; Cava, R.J.; Zahurak, S.M.; Santoro, A. Ternary LixTiO2 phases from insertion reactions. Solid State Ion. 1983, 9, 413–418. [Google Scholar] [CrossRef]
- Shu, J. Electrochemical behavior and stability of Li4Ti5O12 in a broad voltage window. J. Solid State Electrochem. 2009, 13, 1535–1539. [Google Scholar] [CrossRef]
- Borghols, W.J.H.; Wagemaker, M.; Lafont, U.; Kelder, E.M.; Mulder, F.M. Size effects in the Li4+xTi5O12 spinel. J. Am. Chem. Soc. 2009, 131, 17786–17792. [Google Scholar] [CrossRef]
- Pelegov, D.V.; Slautin, B.N.; Gorshkov, V.S.; Zelenovskiy, P.S.; Kiselev, E.A.; Kholkin, A.L.; Shur, V.Y. Raman spectroscopy, «big data», and local heterogeneity of solid state synthesized lithium titanate. J. Power Sources 2017, 346, 143–150. [Google Scholar] [CrossRef]
- Shen, L.; Ding, B.; Nie, P.; Cao, G.; Zhang, X. Advanced Energy-Storage Architectures Composed of Spinel Lithium Metal Oxide Nanocrystal on Carbon Textiles. Adv. Energy Mater. 2013, 3, 1484–1489. [Google Scholar] [CrossRef]
- Wolfenstine, J.; Lee, U.; Allen, J.L. Electrical conductivity and rate-capability of Li4Ti5O12 as a function of heat-treatment atmosphere. J. Power Sources 2006, 154, 287–289. [Google Scholar] [CrossRef]
- Wagner, J.B., Jr. High Conductivity Conductors: Solid Ionic Conductors; Takahashi, T., Ed.; World Scientific: Singapore, 1989; p. 102. [Google Scholar]
- Maier, J. Ionic conduction in space charge regions. J. Prog. Solid State Chem. 1995, 23, 171–263. [Google Scholar] [CrossRef]
- Uvarov, N.F. Composite solid electrolytes: Recent advances and design strategies. J. Solid State Electrochem. 2011, 15, 367–389. [Google Scholar] [CrossRef]
- Liang, C.C. Conduction Characteristics of the Lithium Iodide-Aluminum Oxide Solid Electrolytes. J. Eleetrochem. Soc. Electrochem. Sci. Technol. 1973, 120, 1289–1292. [Google Scholar] [CrossRef]
- Krajewski, M.; Hamankiewicz, B.; Czerwinski, A. Voltammetric and impedance characterization of Li4Ti5O12/n-Ag composite for lithium-ion batteries. Electrochim. Acta. 2016, 219, 277–283. [Google Scholar] [CrossRef]
- Krajewski, M.; Hamankiewicz, B.; Michalska, M.; Andrzejczuk, M.; Lipinska, L.; Czerwinski, A. Electrochemical properties of lithium–titanium oxide, modified with Ag–Cu particles, as a negative electrode for lithium-ion batteries, J. RSC Adv. 2017, 7, 52151–52164. [Google Scholar] [CrossRef]
- Wang, Y.; Zhou, A.; Dai, X.; Feng, L.; Li, J. Solid-state synthesis of submicron-sized Li4Ti5O12/Li2TiO3 composites with rich grain boundaries for lithium ion batteries. J. Power Sources 2014, 266, 114–120. [Google Scholar] [CrossRef]
- Masoud, E.; Indrisb, S. Block-shaped pure and doped Li4Ti5O12 containing a high content of a Li2TiO3 dual phase: An anode with excellent cycle life for high rate performance lithium-ion batteries. RSC Adv. 2015, 5, 108058–108066. [Google Scholar] [CrossRef]
- Dorrian, J.F.; Newnham, R.E. Refinement of the structure of Li2TiO3. Mater. Res. Bull. 1969, 4, 179–183. [Google Scholar]
- Laumann, A.; Fehr, K.T.; Wachsmann, M.; Holzapfel, M.; Iversen, B.B. Metastable formation of low temperature cubic Li2TiO3 under hydrothermal conditions—Its stability and structural properties. Solid State Ion. 2010, 181, 1525–1529. [Google Scholar] [CrossRef]
- Lakshmi-Narayana, A.; Hussain, O.; Mauger, A.; Julien, C.M. Transport Properties of Nanostructured Li2TiO3 Anode Material Synthesized by Hydrothermal Method. Sci 2019, 1, 56. [Google Scholar] [CrossRef]
- Tabuchi, M.; Nakashima, A.; Shigemura, H.; Ado, K.; Kobayashi, H.; Sakaebe, H.; Tatsumi, K.; Kageyama, H.; Nakamurab, T.; Kanno, R. Fine Li(4-x)/3Ti (2-2x)/3FexO 2 (0.18 < x < 0.67) powder with cubic rock-salt structure as a positive electrode material for rechargeable lithium batteries. J. Mater. Chem. 2003, 13, 1747–1757. [Google Scholar] [CrossRef]
- Li, J.; Guo, J.; Ma, Q.; Yang, Y.; Dong, X.; Yang, M.; Yu, W.; Wang, J.; Liu, G. Electrospun Li4Ti5O12/Li2TiO3 composite nanofibers for enhanced high-rate lithium ion batteries. J. Solid State Electrochem. 2017, 21, 2779–2790. [Google Scholar] [CrossRef]
- Bhatti, H.; Anjum, D.; Ullah, S.; Ahmed, B.; Habib, A.; Karim, A.; Hasanain, S.K. Electrochemical Characteristics and Li+ Ion Intercalation Kinetics of Dual-Phase Li4Ti5O12/Li2TiO3 Composite in the Voltage Range 0−3 V. J. Phys. Chem. C. 2016, 120, 9553–9561. [Google Scholar] [CrossRef]
- Hayashi, S.; Hatano, H. Ionic Conduction of Li2Ti3O7 and Li4Ti5O12. J. Ceram. Soc. Jpn. 1994, 102, 378–382. [Google Scholar] [CrossRef]
- Leonidov, I.A.; Leonidova, O.N.; Perelyaeva, L.A.; Samigullina, R.F.; Kovyazina, S.A.; Patrakeyev, M.V. Structure, Ionic Conduction, and Phase Transformations in Lithium Titanate Li4Ti5O12. Phys. Solid State 2003, 45, 2079–2084. [Google Scholar] [CrossRef]
- Zhong, Z.; Ouyang, C.; Shi, S.; Lei, M. Ab initio Studies on Li4+xTi5O12 Compounds as Anode Materials for Lithium-Ion Batteries. J. ChemPhysChem. 2008, 9, 2104–2108. [Google Scholar] [CrossRef]
- Wilkening, M.; Amade, R.; Iwaniak, W.; Heitjans, P. Ultraslow Li diffusion in spinel-type structured Li4Ti5O12. Phys. Chem. Chem. Phys. 2007, 9, 1239–1246. [Google Scholar] [CrossRef]
- Wolfenstine, J.; Allen, J.L. Electrical conductivity and charge compensation in Ta doped Li4Ti5O12. J. Power Sources 2008, 180, 582–585. [Google Scholar] [CrossRef]
- Xiea, Y.; Wanga, Q.; Gua, F.; Daia, K.; Shuia, M.; Shua, J. The electrochemical properties and intercalation mechanism of low strain Li2TiO3 as a high-performance anode material for lithium-ion batteries. J. Alloys Compd. 2021, 893, 162348–162360. [Google Scholar] [CrossRef]
- Koudriachova, M.; Harrison, N.; Leeuw, S. Effect of Diffusion on Lithium Intercalation in Titanium Dioxide. Phys. Rev. Letters 2001, 86, 1275–1278. [Google Scholar] [CrossRef]
- Hu, Y.; Kienle, L.; Guo, Y.; Maier, J. High Lithium Electroactivity of Nanometer-Sized Rutile TiO2. Adv. Mater. 2006, 18, 1421–1426. [Google Scholar] [CrossRef]
- Baudrin, E.; Cassaignon, S.; Koelsch, M.; Jolivet, J.-P.; Dupont, L.; Tarascon, J.-M. Structural evolution during the reaction of Li with nano-sized rutile type TiO2 at room temperature. Electrochem. Commun. 2007, 337–342. [Google Scholar] [CrossRef]


| Sample | Atomic Ratio Li:Ti | Mass Fraction of TiO2 or Li2TiO3 | Volume Fraction of TiO2 or Li2TiO3 |
|---|---|---|---|
| LTT-3 | 2.8:5 | 0.272 | 0.235 |
| LTT-2 | 3.2:5 | 0.179 | 0.152 |
| LTT-1 | 3.6:5 | 0.088 | 0.074 |
| LTO | 4:5 | 0 | 0 |
| LTC-05 | 4.2:5 | 0.040 | 0.032 |
| LTC-1 | 4.4:5 | 0.079 | 0.064 |
| LTC-15 | 4.6:5 | 0.117 | 0.097 |
| LTC-2 | 4.8:5 | 0.155 | 0.129 |
| LTC-3 | 5.2:5 | 0.230 | 0.194 |
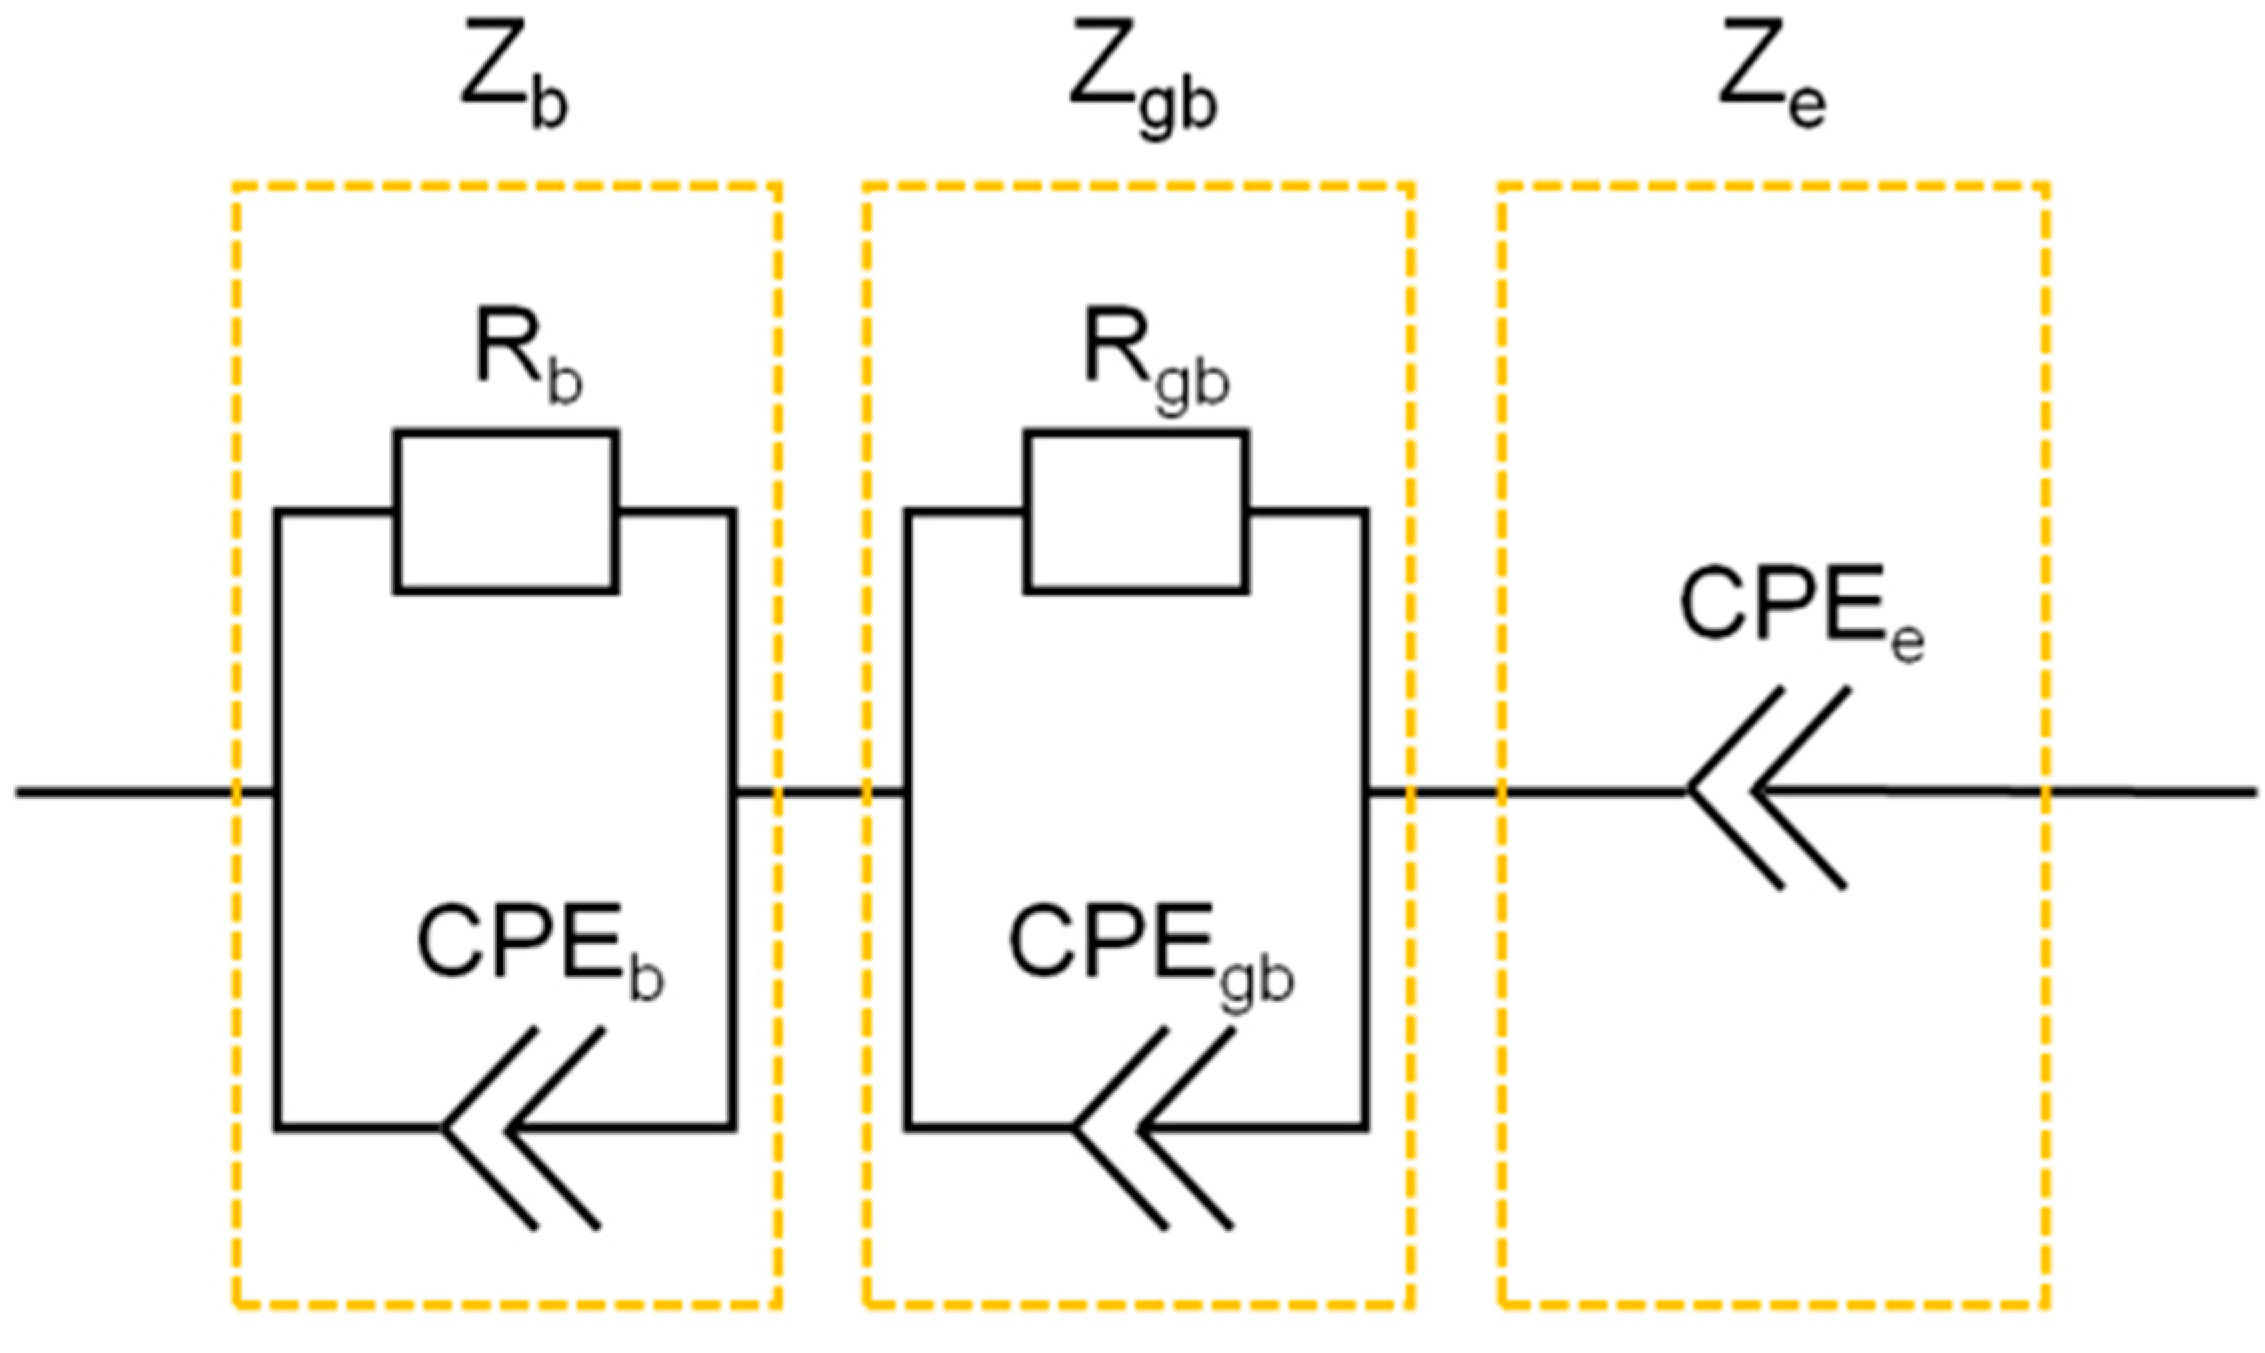
| Impedance | Parameters of the Equivalent Circuit | Sample | |||||
|---|---|---|---|---|---|---|---|
| LTO | LTC-1 | LTC-2 | LTC-3 | LTT-1 | LTT-3 | ||
| Zb | Ab, S·K·cm−1 | 7 × 10² | 2 × 10³ | 2 × 10³ | 6 × 10³ | 0.5 × 10³ | 1.2 × 10³ |
| Eb,eV | 0.47 | 0.48 | 0.48 | 0.53 | 0.48 | 0.48 | |
| CPEb, S·cm−1·(Hz)αb | 3 × 10⁻¹¹ | 9 × 10⁻¹⁰ | 5 × 10⁻¹⁰ | 1 × 10⁻¹¹ | 4 × 10⁻¹² | 1.5 × 10⁻¹⁰ | |
| αb | 0.6 | 0.5 | 0.4 | 0.6 | 0.65 | 0.5 | |
| Zgb | Agb, S·K·cm−1 | 2.0 × 10⁵ | 5.7 × 10⁶ | 5.6 × 10⁶ | 3.3 × 10⁷ | 1.6 × 10⁶ | 3.7 × 10⁶ |
| Egb, eV | 0.97 | 0.90 | 0.90 | 1.02 | 0.98 | 0.91 | |
| CPEgb, S·cm−1·(Hz)αgb | 3 × 10⁻⁶ | 1.2 × 10⁻⁴ | 2.4 × 10⁻⁴ | 9 × 10⁻⁷ | 2.2 × 10⁻⁵ | 8 × 10⁻⁴ | |
| αgb | 0.85 | 0.77 | 0.75 | 0.91 | 0.80 | 0.71 | |
| Ze | CPEe, S·cm−1·(Hz)αgb | 4 × 10⁻⁸ | 8 × 10⁻⁷ | 8 × 10⁻⁷ | 3.5 × 10⁻⁷ | 1.1 × 10⁻⁷ | 5 × 10⁻⁷ |
| αe | 0.5 | 0.5 | 0.5 | 0.5 | 0.5 | 0.5 | |
| σbat 25 °C, S·cm−1 | 3 × 10⁻⁸ | 5 × 10⁻⁸ | 5 × 10⁻⁸ | 2 × 10⁻⁸ | 4 × 10⁻⁸ | 1 × 10⁻⁸ | |
| σdc at 25 °C, S·cm−1 * | 2 × 10⁻¹³ | 1 × 10⁻¹¹ | 1 × 10⁻¹¹ | 1 × 10⁻¹³ | 6 × 10⁻¹² | 5 × 10⁻¹³ | |
Publisher’s Note: MDPI stays neutral with regard to jurisdictional claims in published maps and institutional affiliations. |
© 2022 by the authors. Licensee MDPI, Basel, Switzerland. This article is an open access article distributed under the terms and conditions of the Creative Commons Attribution (CC BY) license (https://creativecommons.org/licenses/by/4.0/).
Share and Cite
Kozlova, A.; Uvarov, N.; Ulihin, A. Transport and Electrochemical Properties of Li4Ti5O12-Li2TiO3 and Li4Ti5O12-TiO2 Composites. Materials 2022, 15, 6079. https://doi.org/10.3390/ma15176079
Kozlova A, Uvarov N, Ulihin A. Transport and Electrochemical Properties of Li4Ti5O12-Li2TiO3 and Li4Ti5O12-TiO2 Composites. Materials. 2022; 15(17):6079. https://doi.org/10.3390/ma15176079
Chicago/Turabian StyleKozlova, Anna, Nikolai Uvarov, and Artem Ulihin. 2022. "Transport and Electrochemical Properties of Li4Ti5O12-Li2TiO3 and Li4Ti5O12-TiO2 Composites" Materials 15, no. 17: 6079. https://doi.org/10.3390/ma15176079