
Carbonate Lake Sediments in the Plastics Processing-Preliminary Polylactide Composite Case Study: Mechanical and Structural Properties
 , ,
, , 
Abstract
:1. Introduction
2. Materials and Methods
2.1. Materials
2.2. Samples Preparation
2.2.1. Preparation of Sediments
2.2.2. Preparation of Masterbatches
2.2.3. Preparation of Final Samples
2.3. Characterisation Methods
3. Results and Discussion
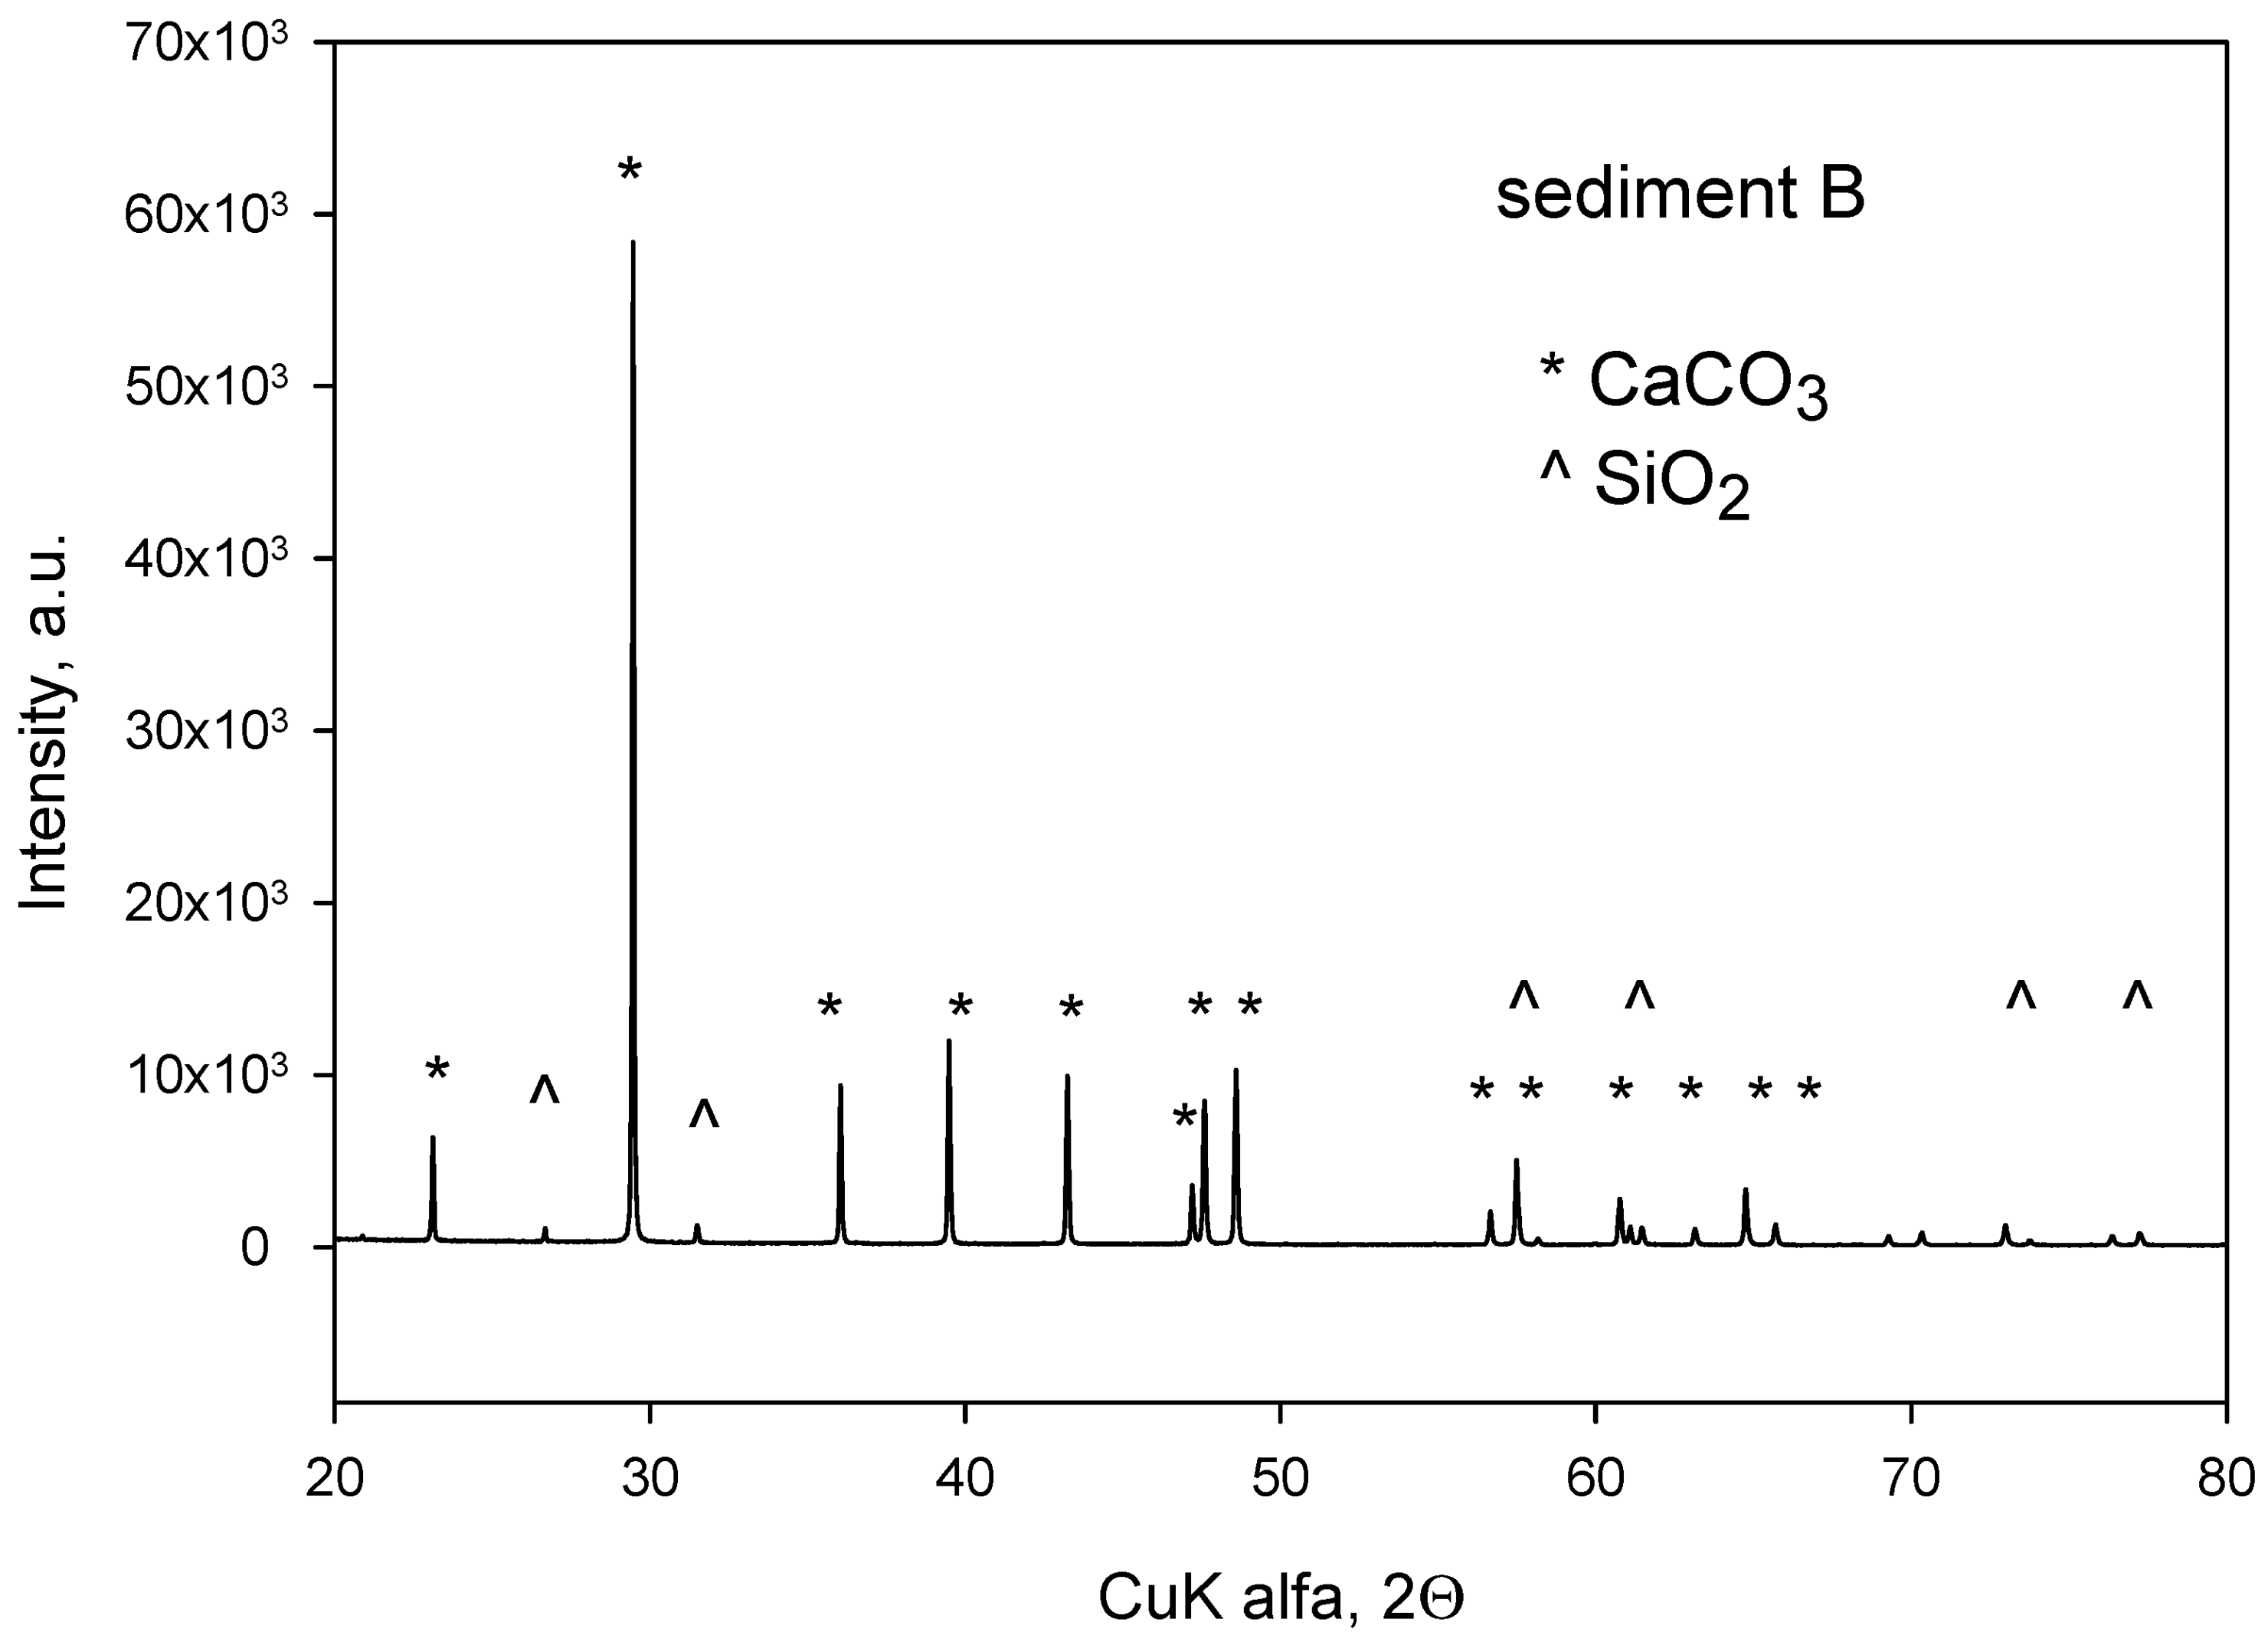
3.1. XRD Analysis of the Sediment
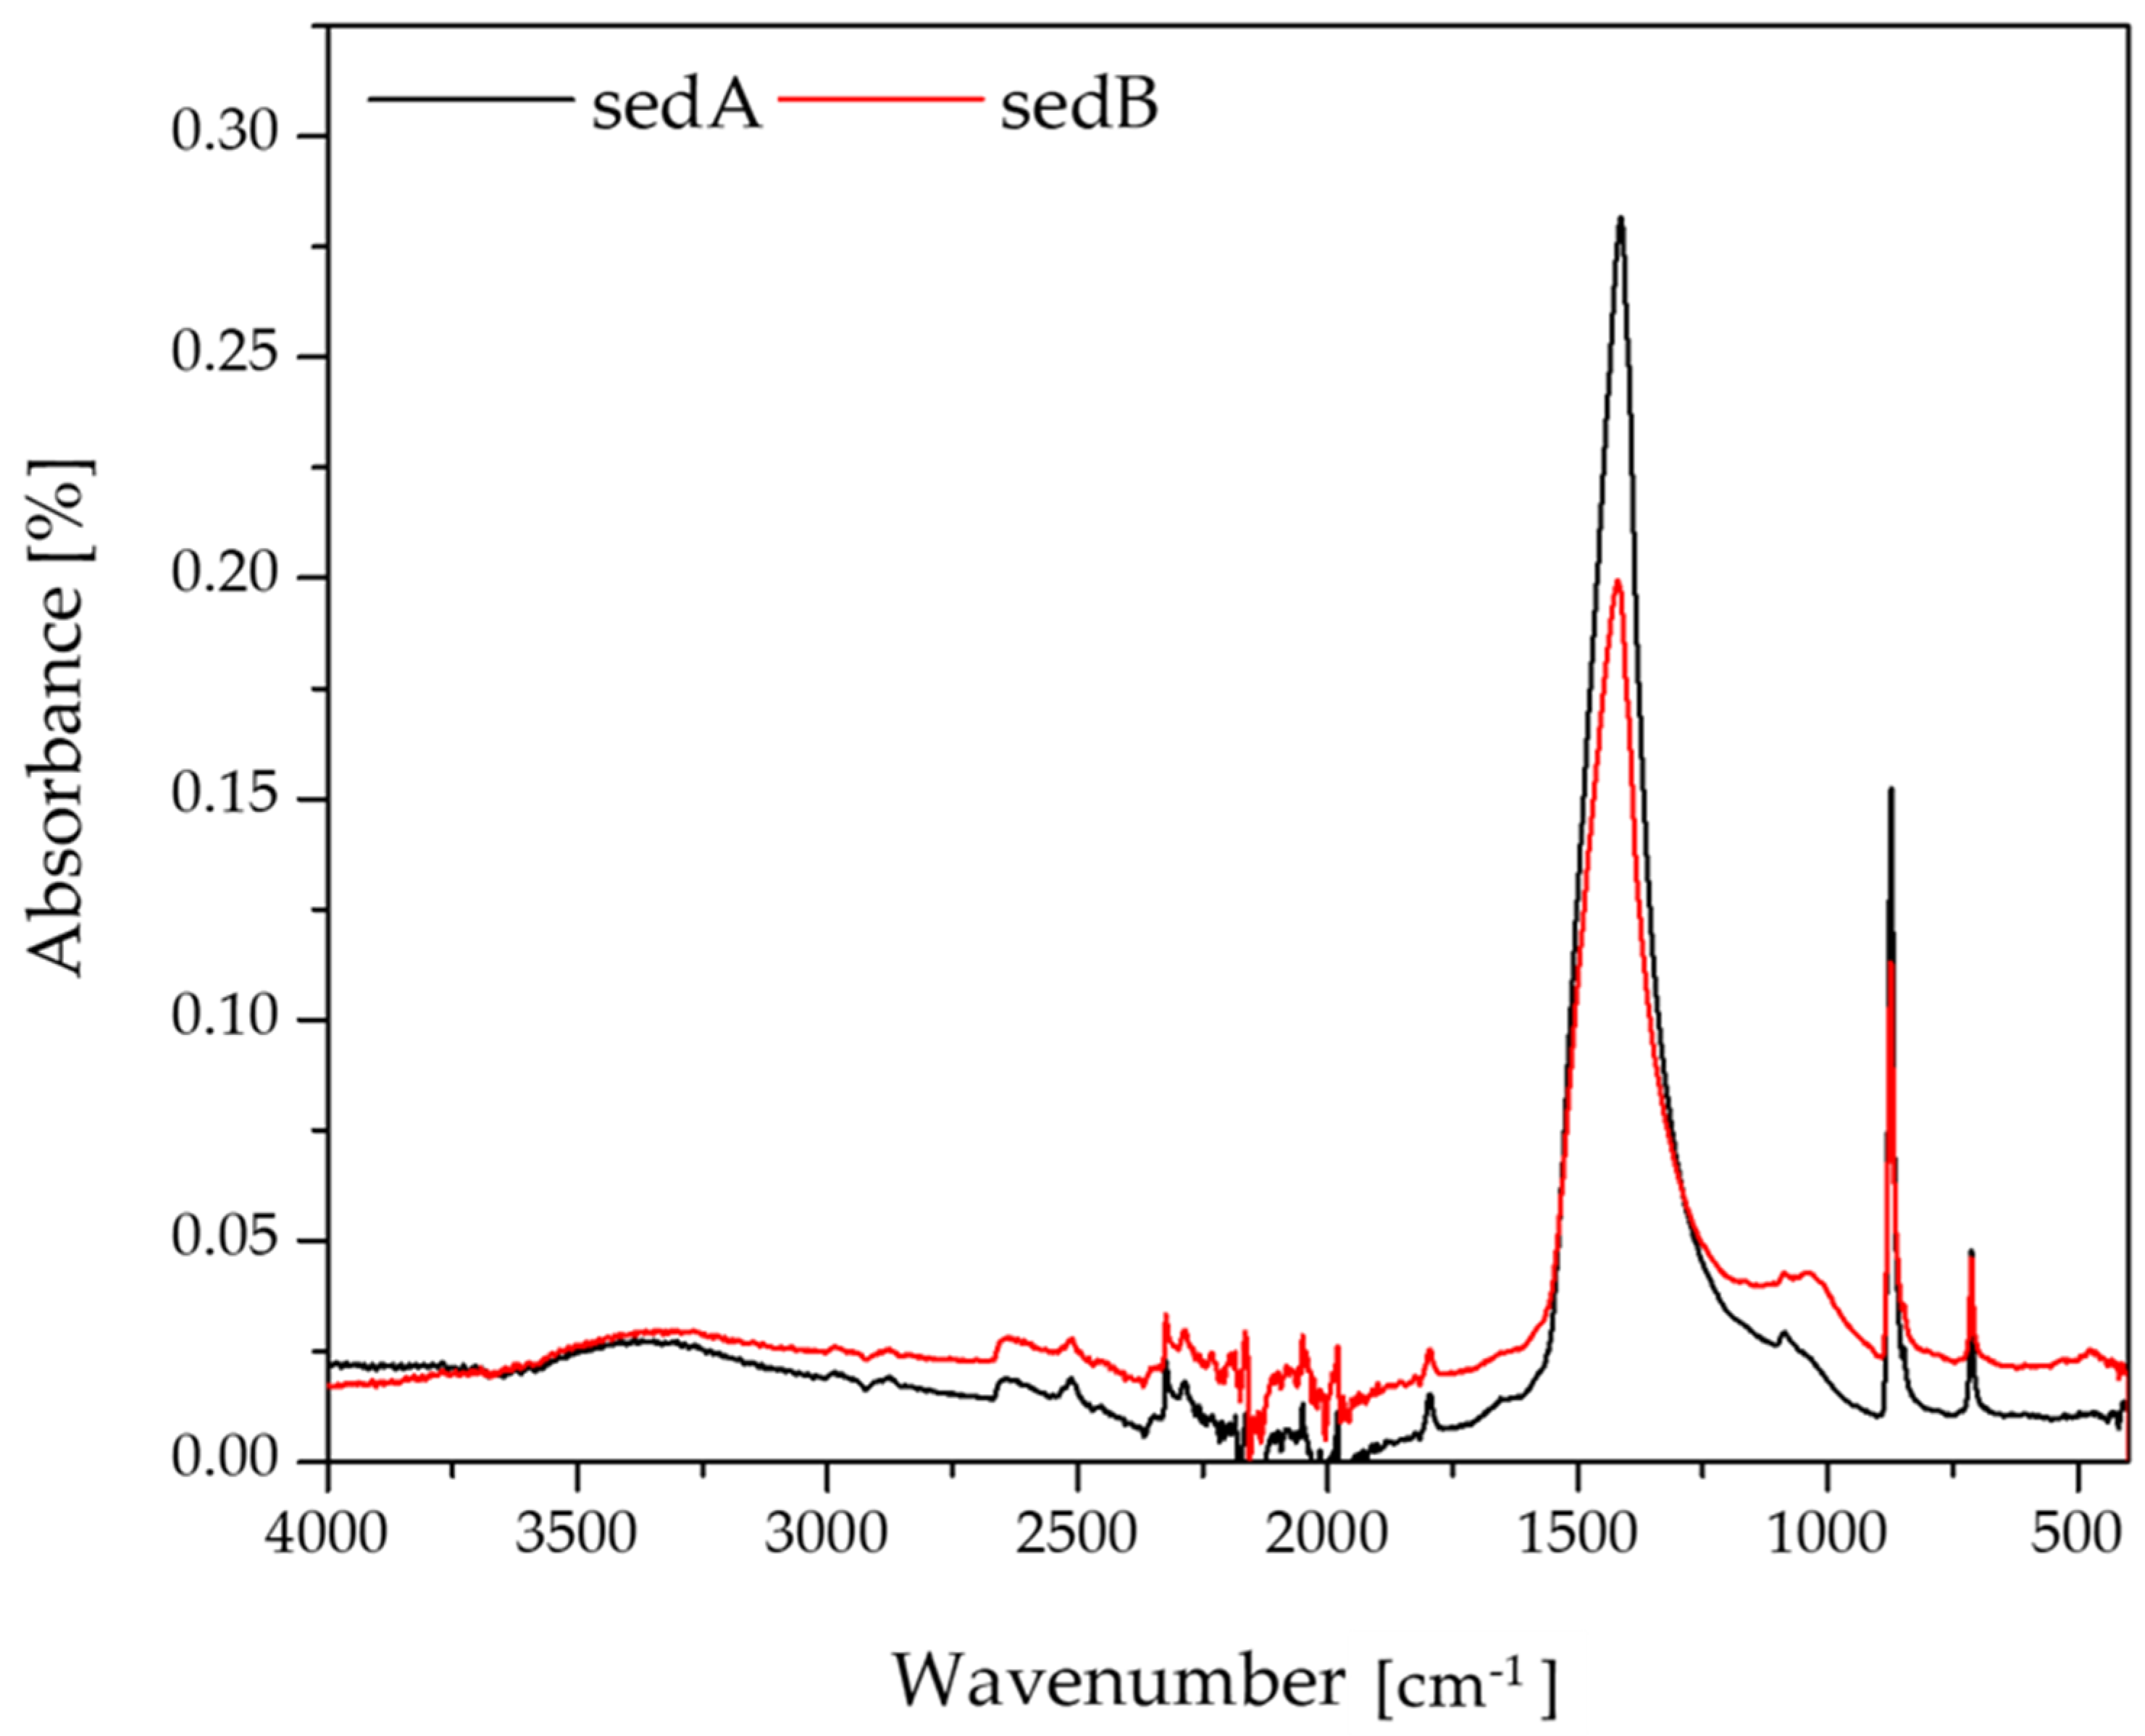
3.2. FT-IR Analysis of the Sediments
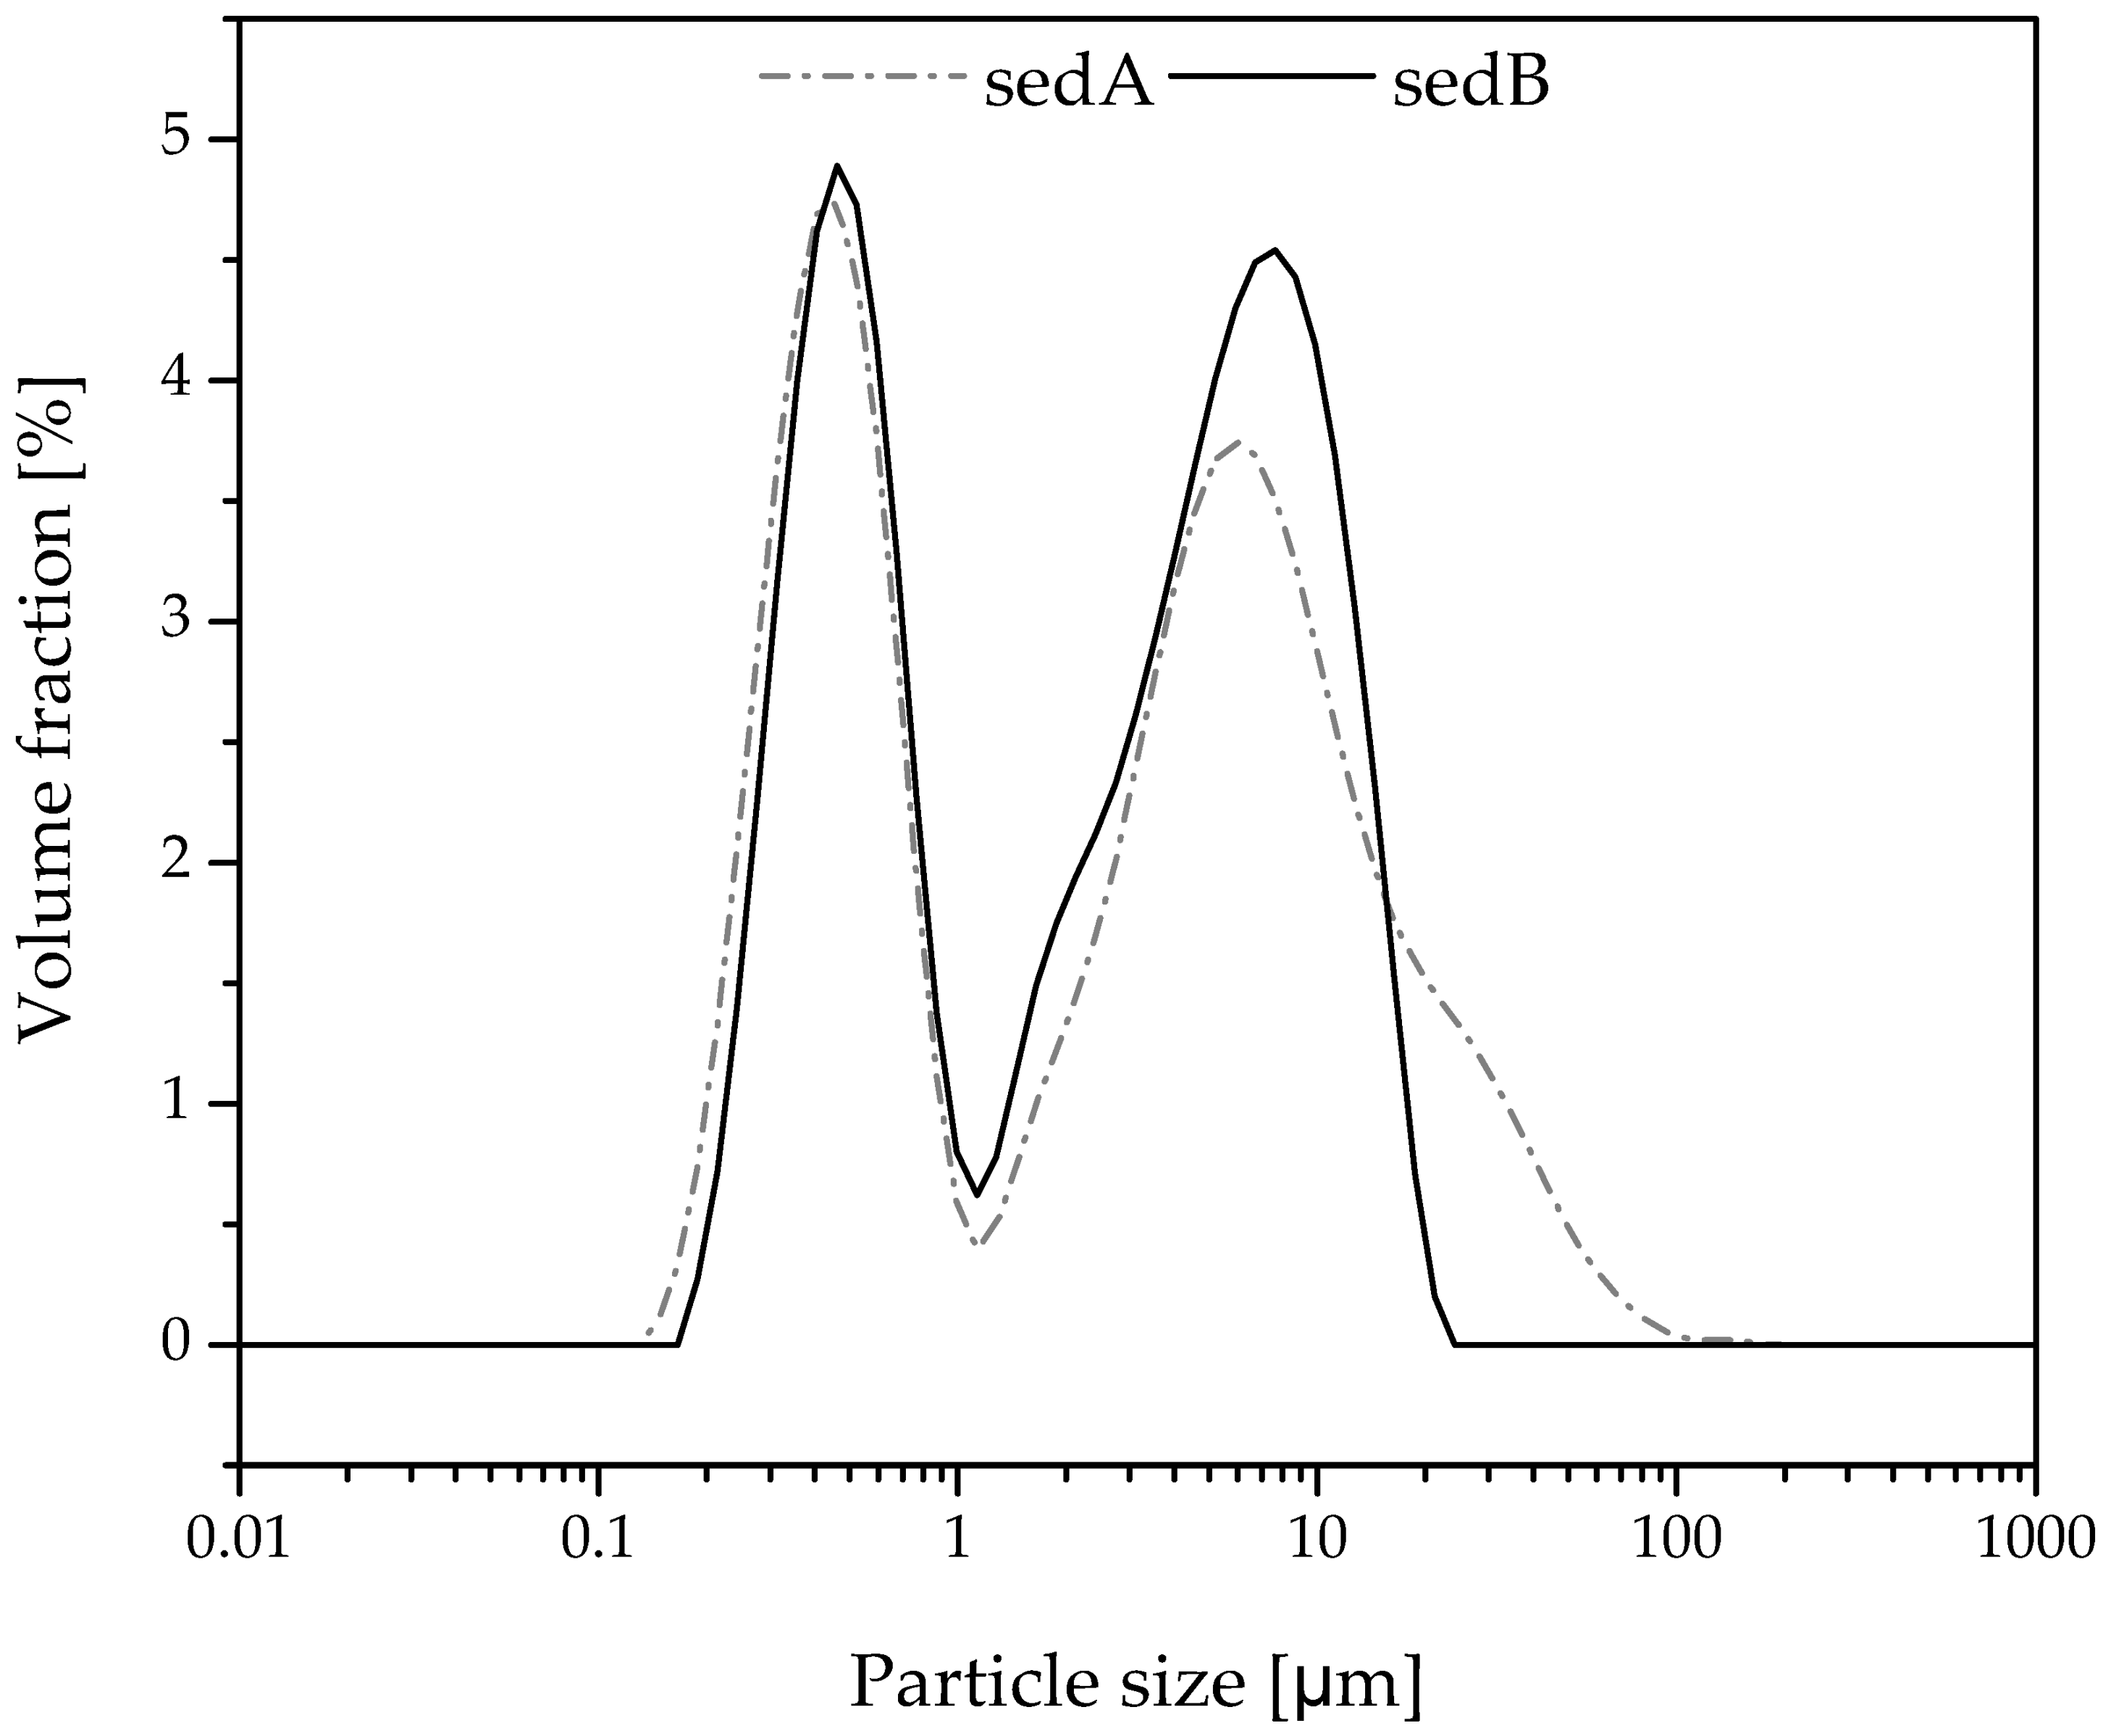
3.3. The Measurement of Particle Size Distribution by DLS (Dynamic Light Scaterring)
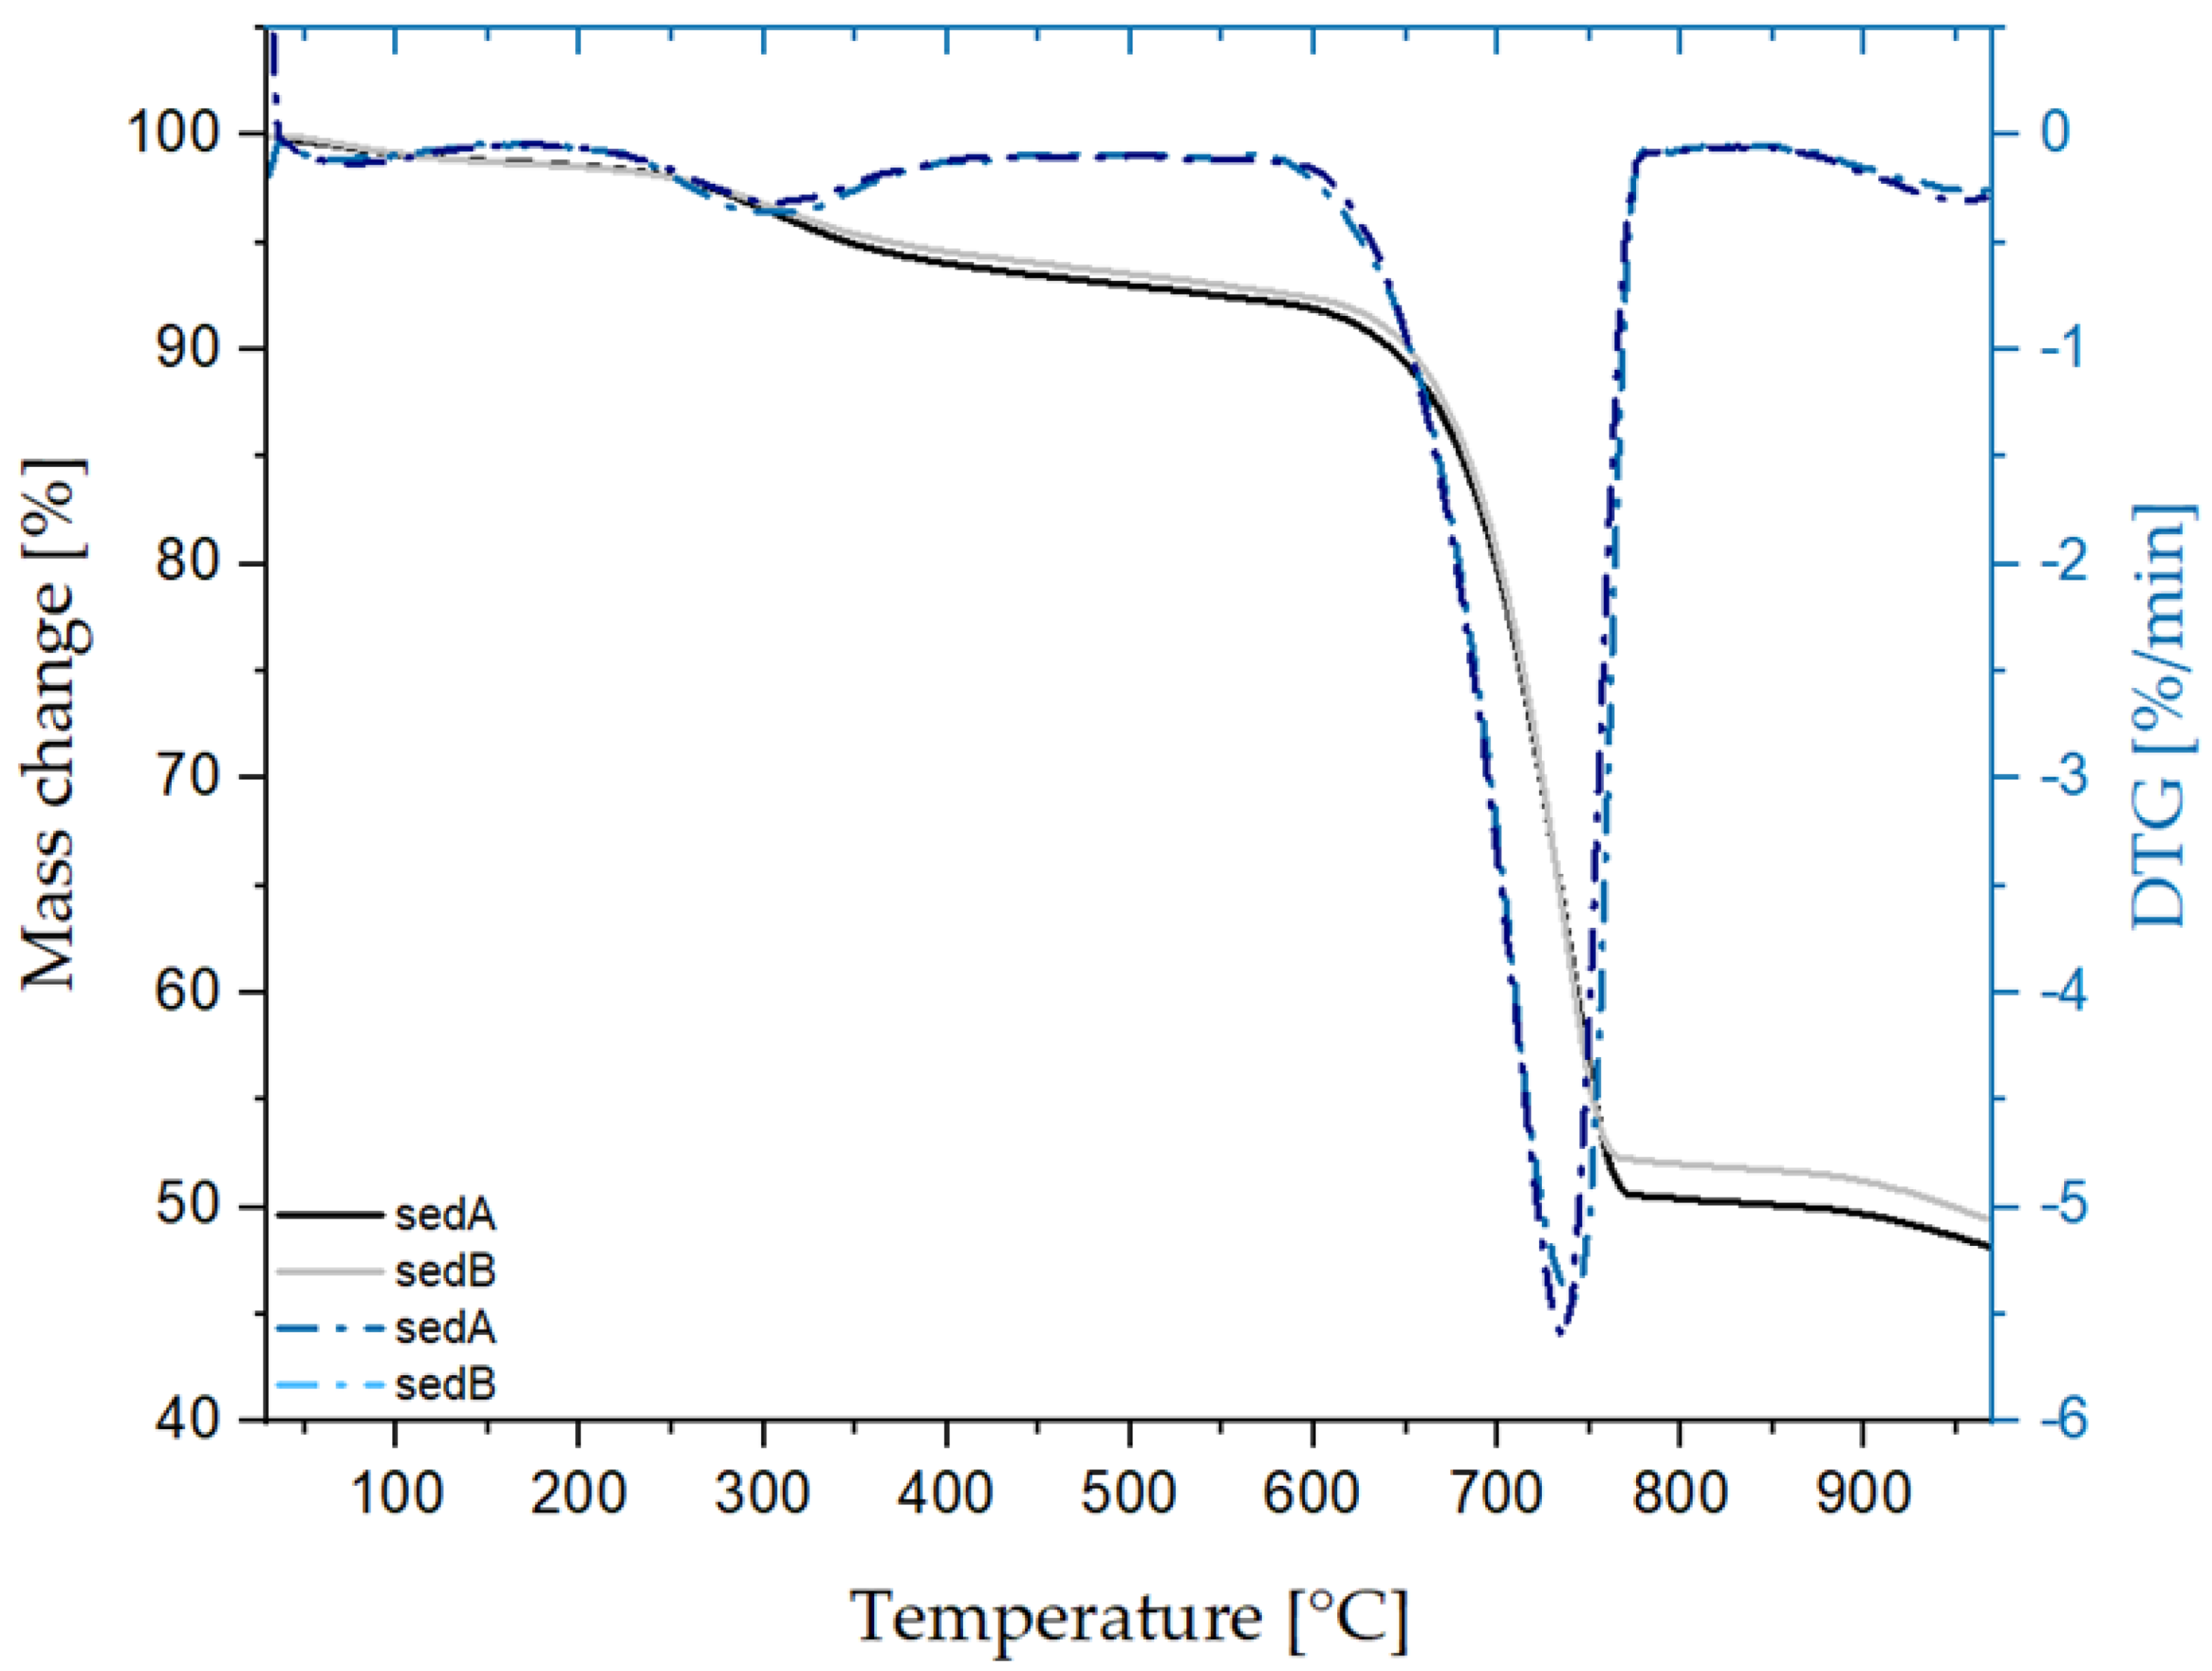
3.4. Thermal Behaviour Properties of the Sediment-TGA
3.5. Rheology
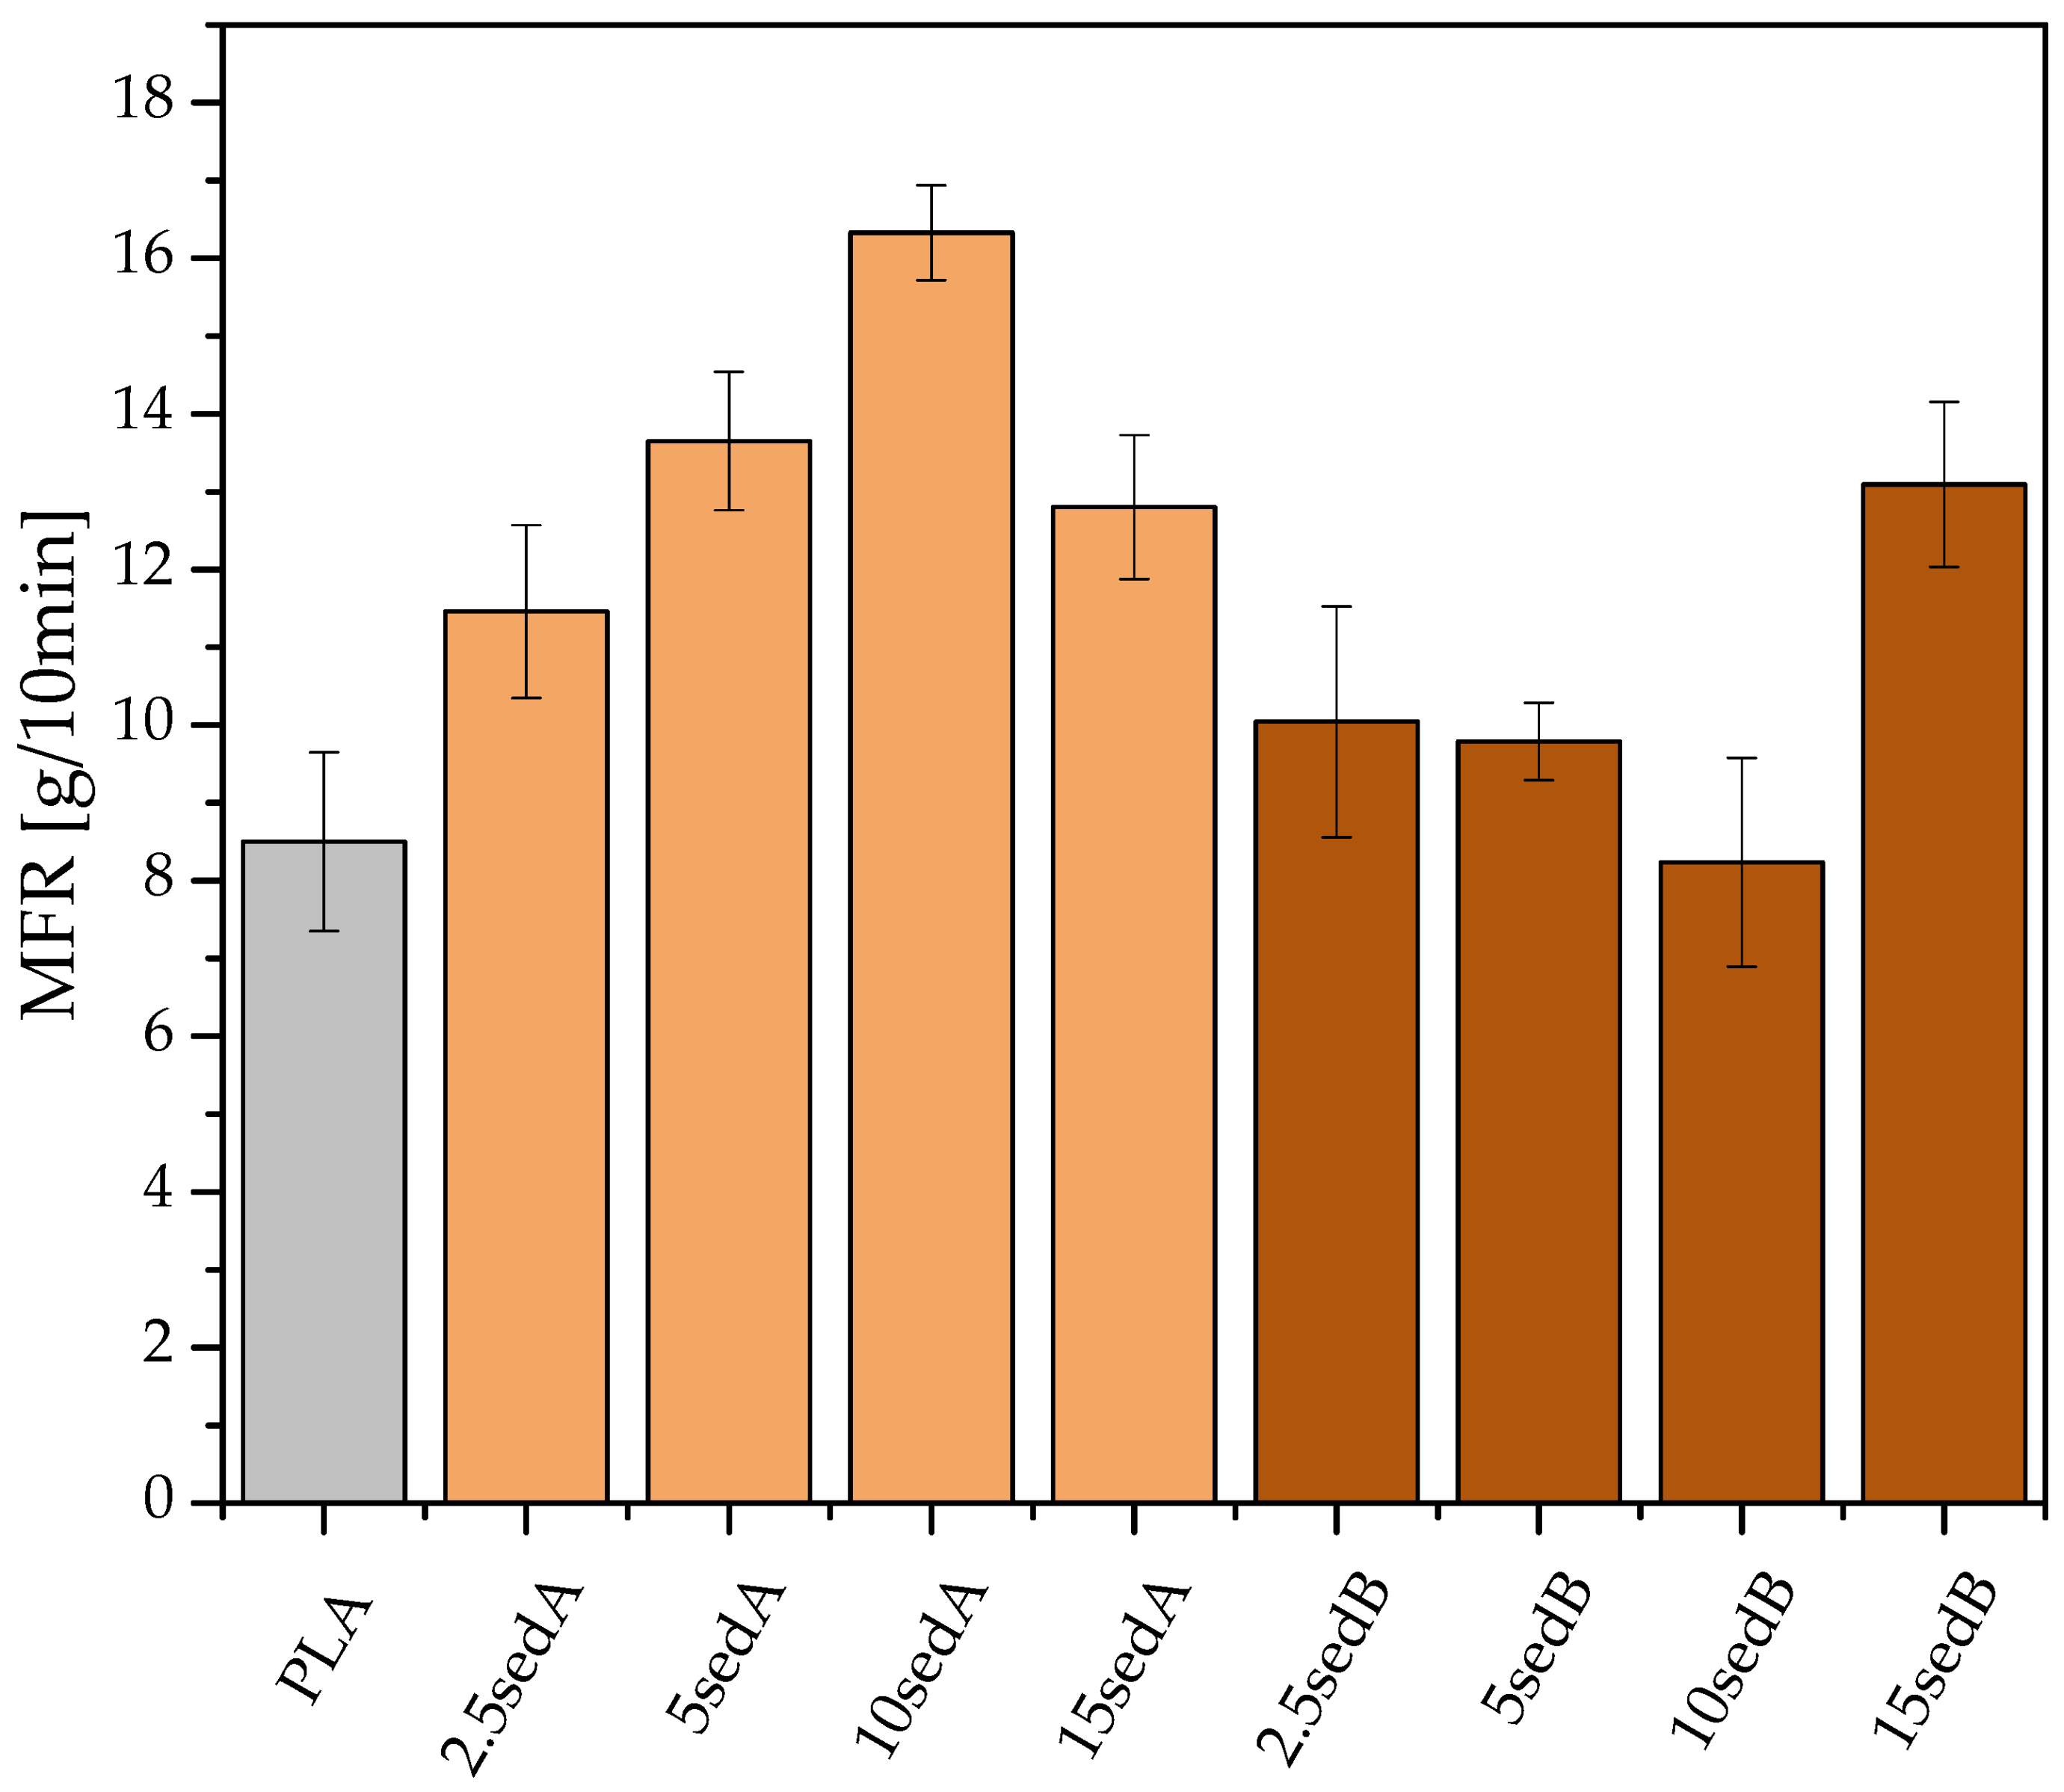
3.5.1. Melt flow Rate (MFR)
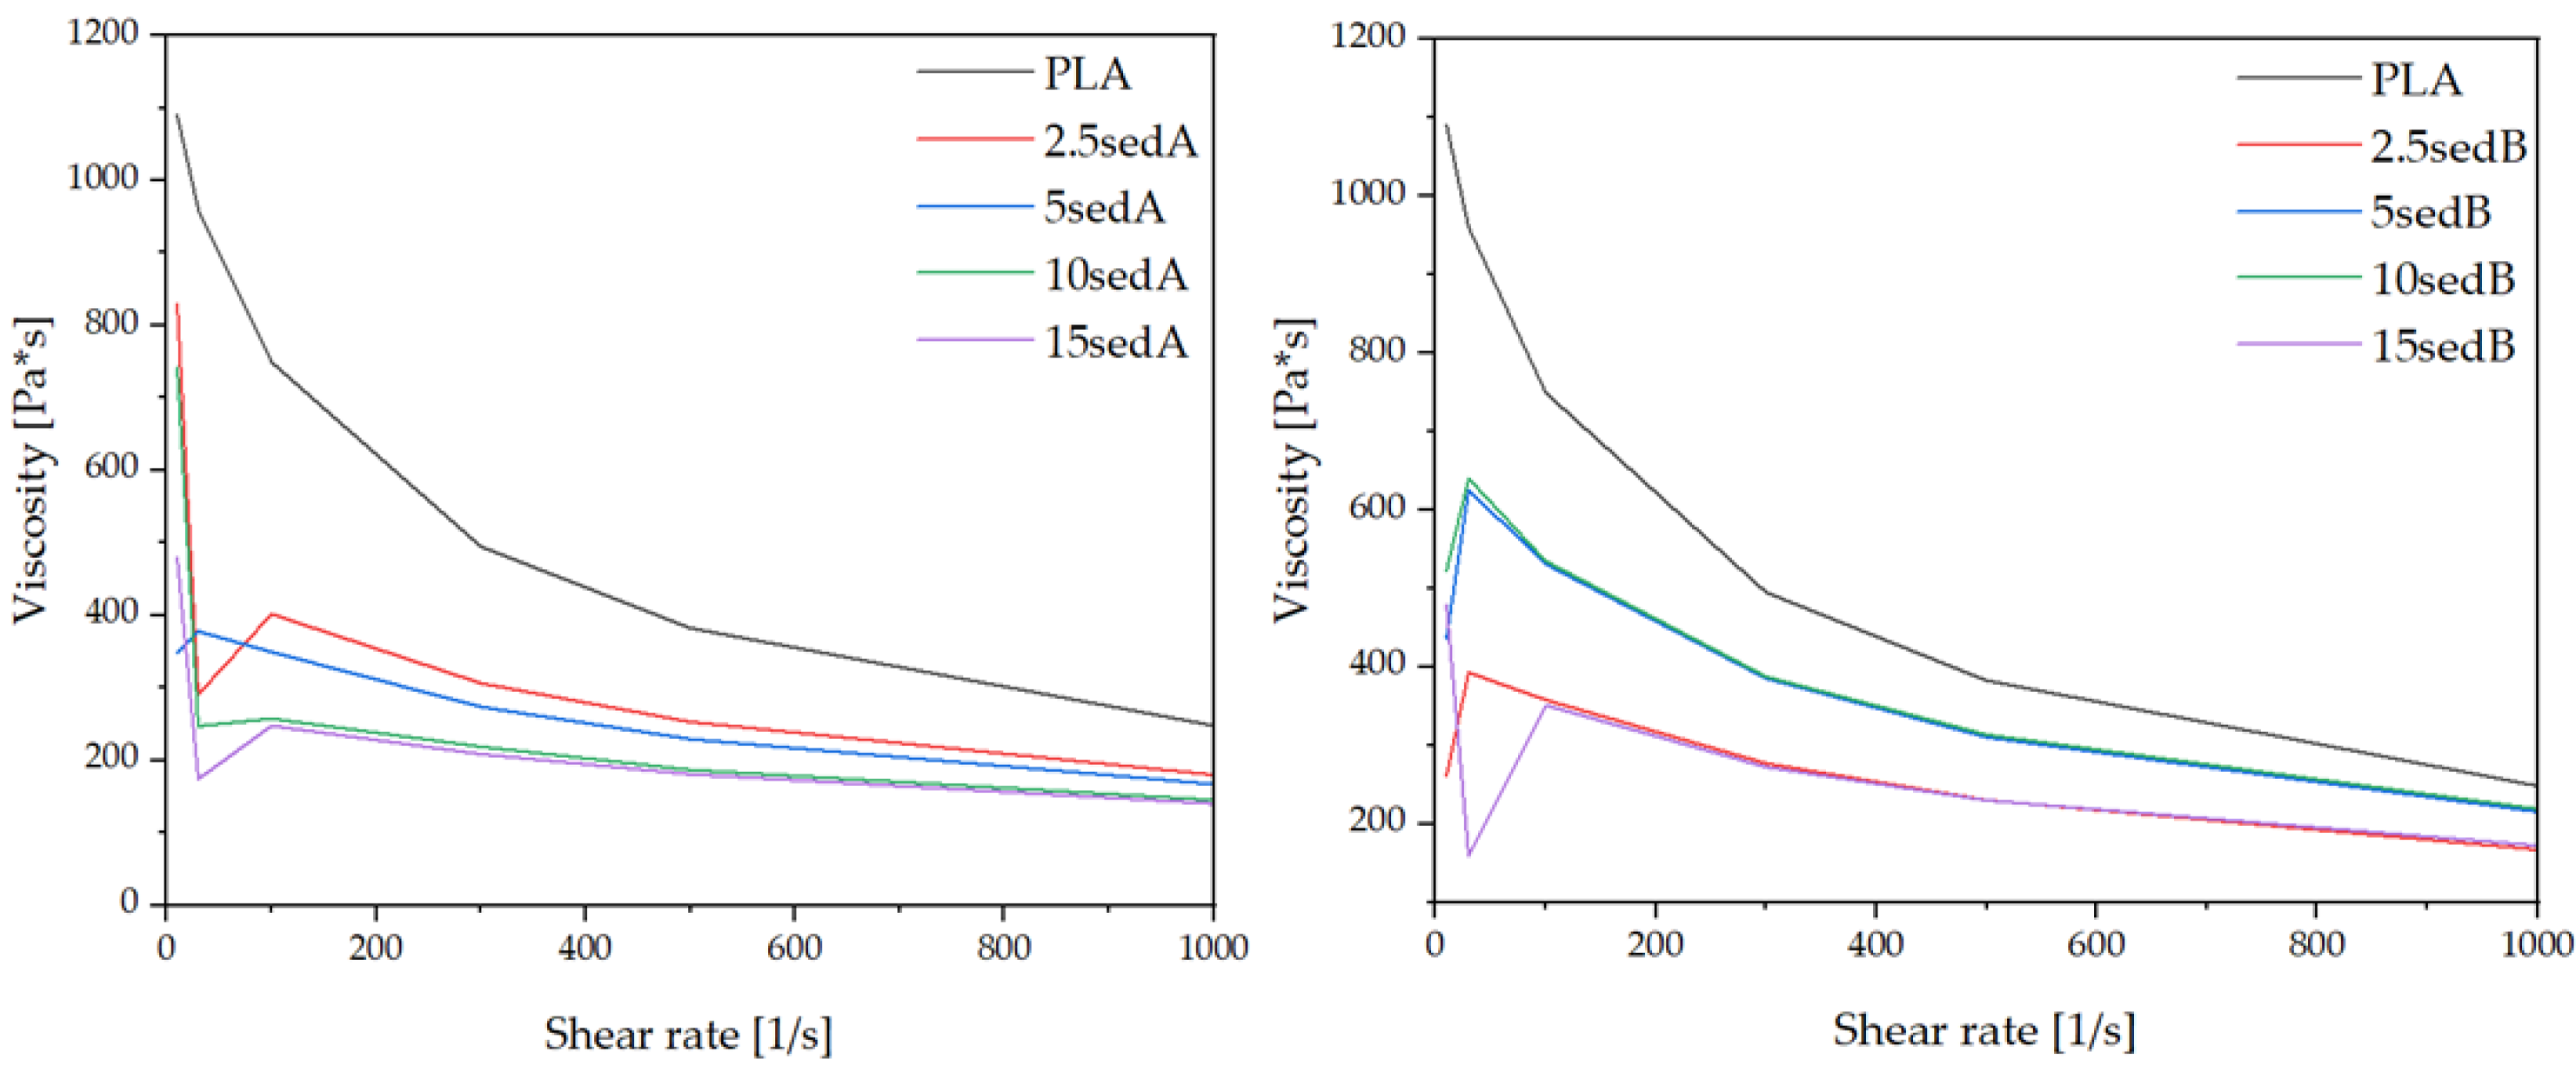
3.5.2. Viscosity
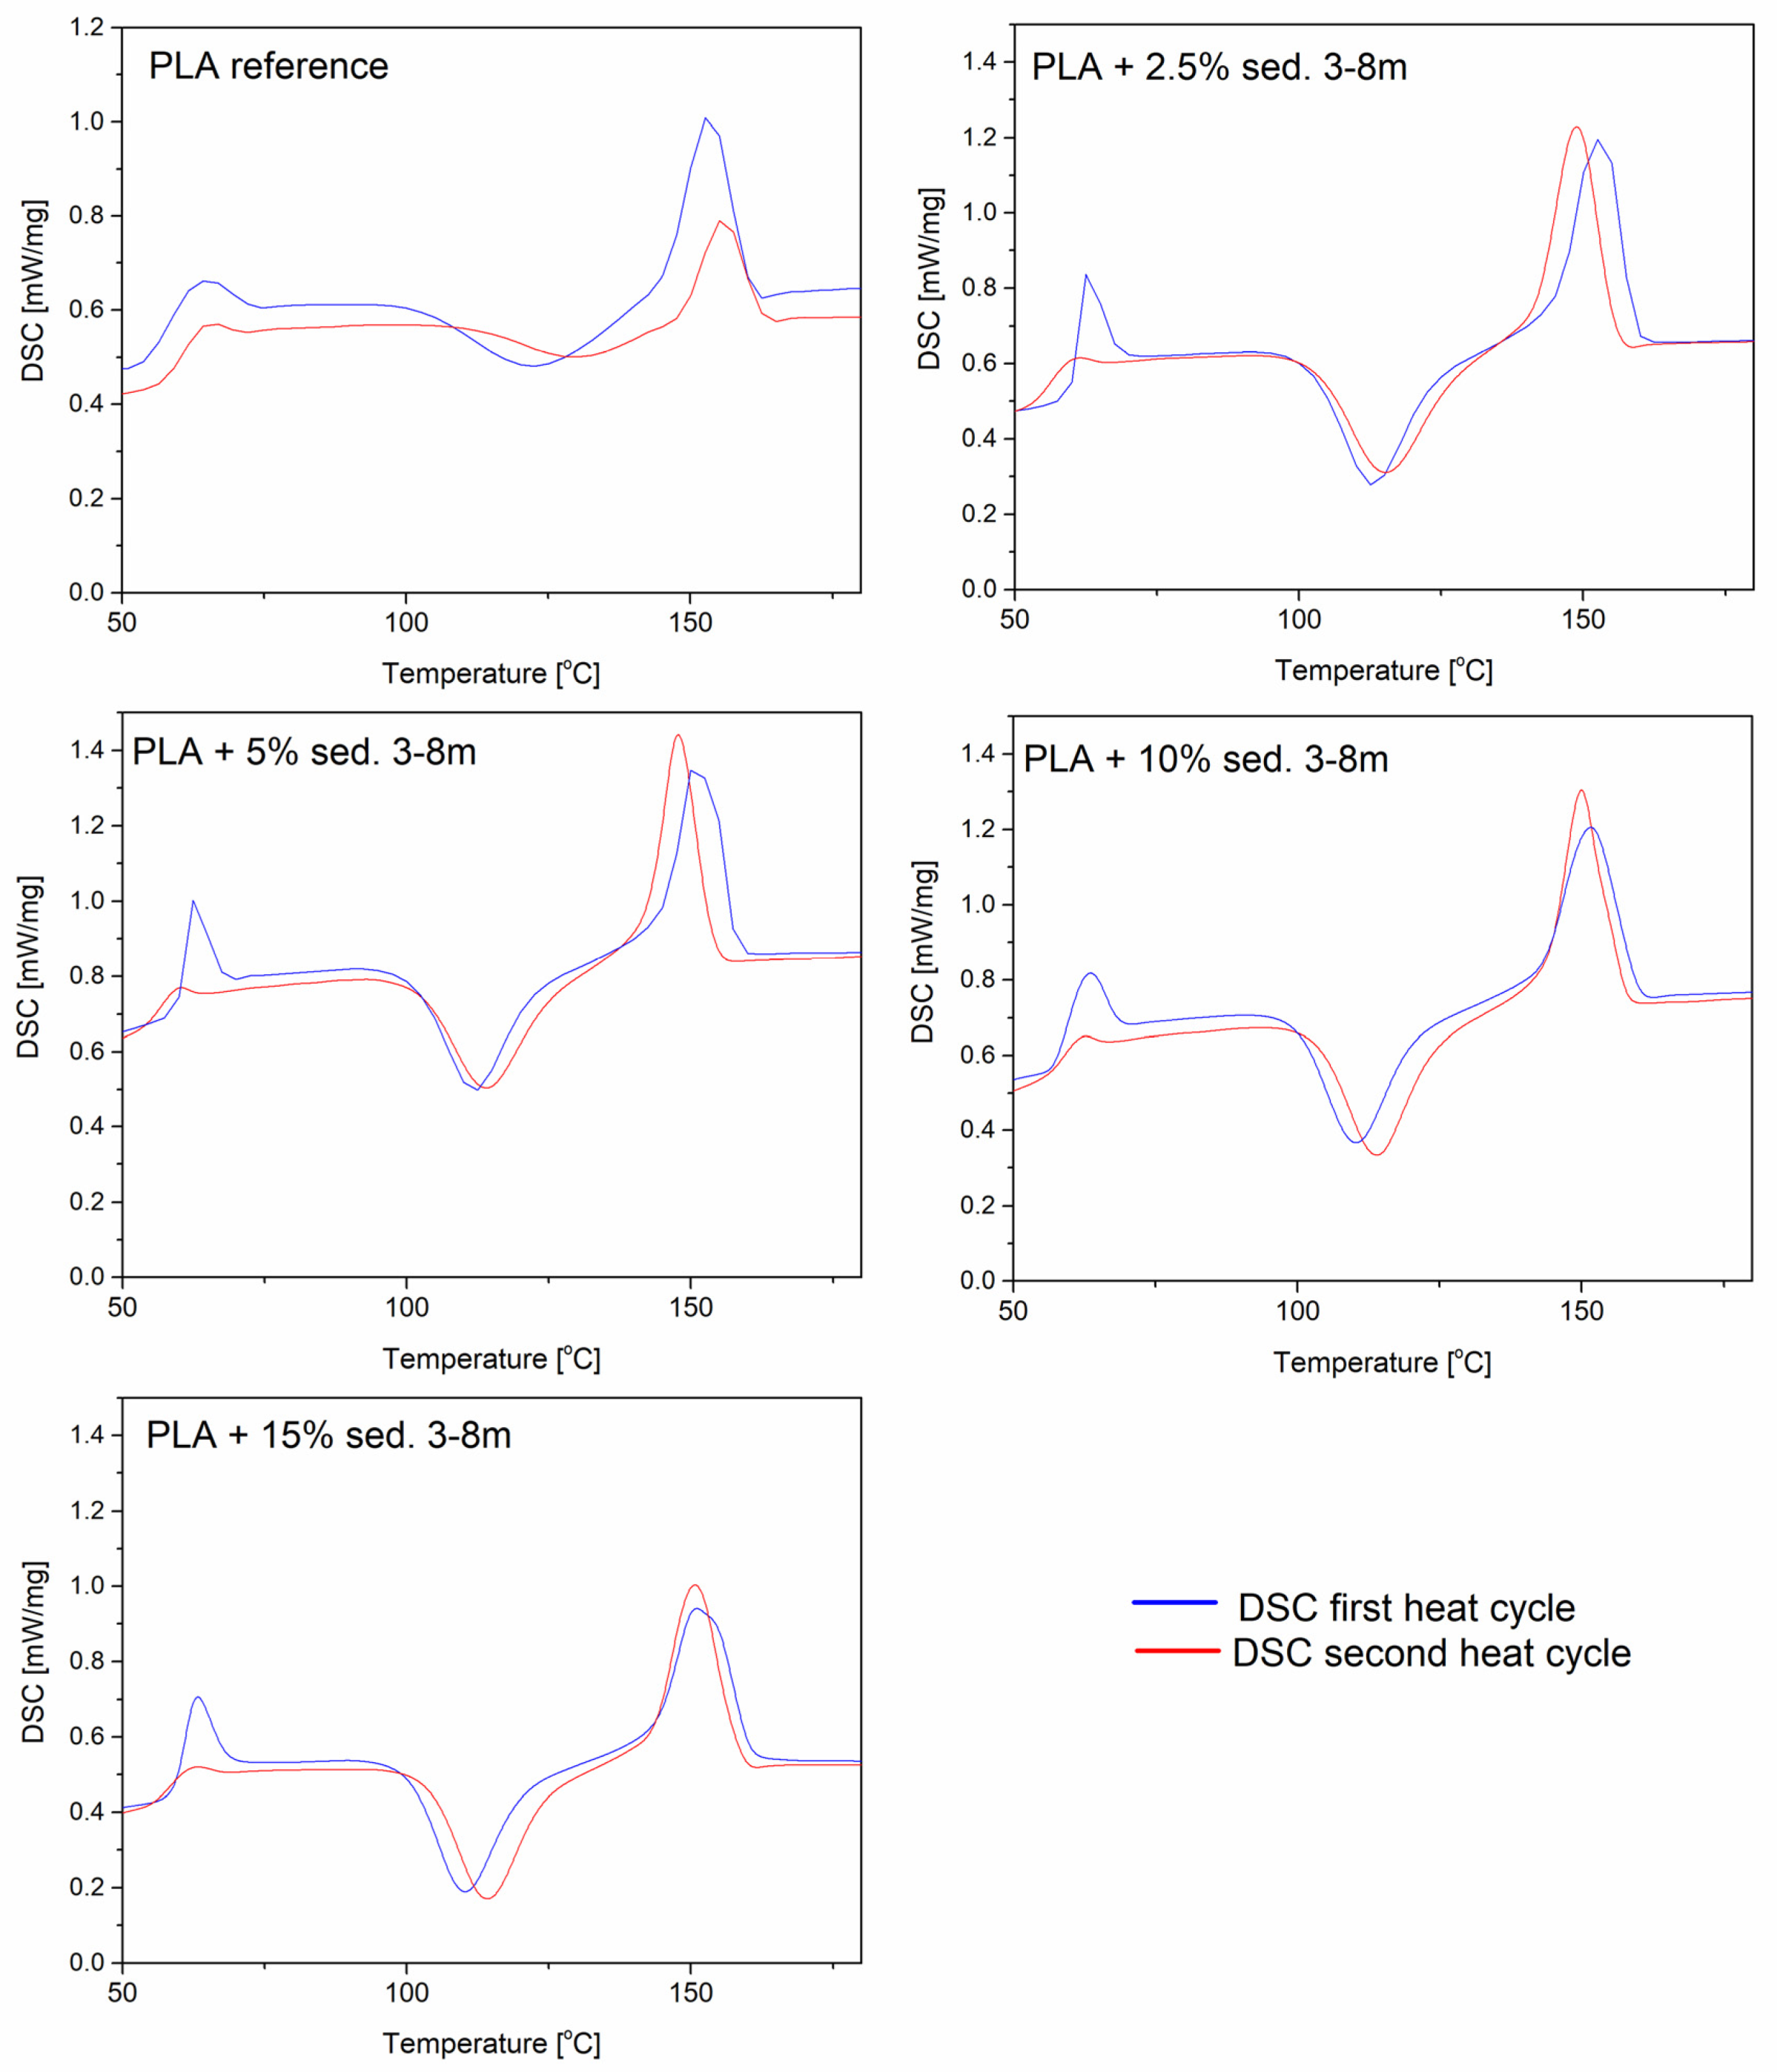
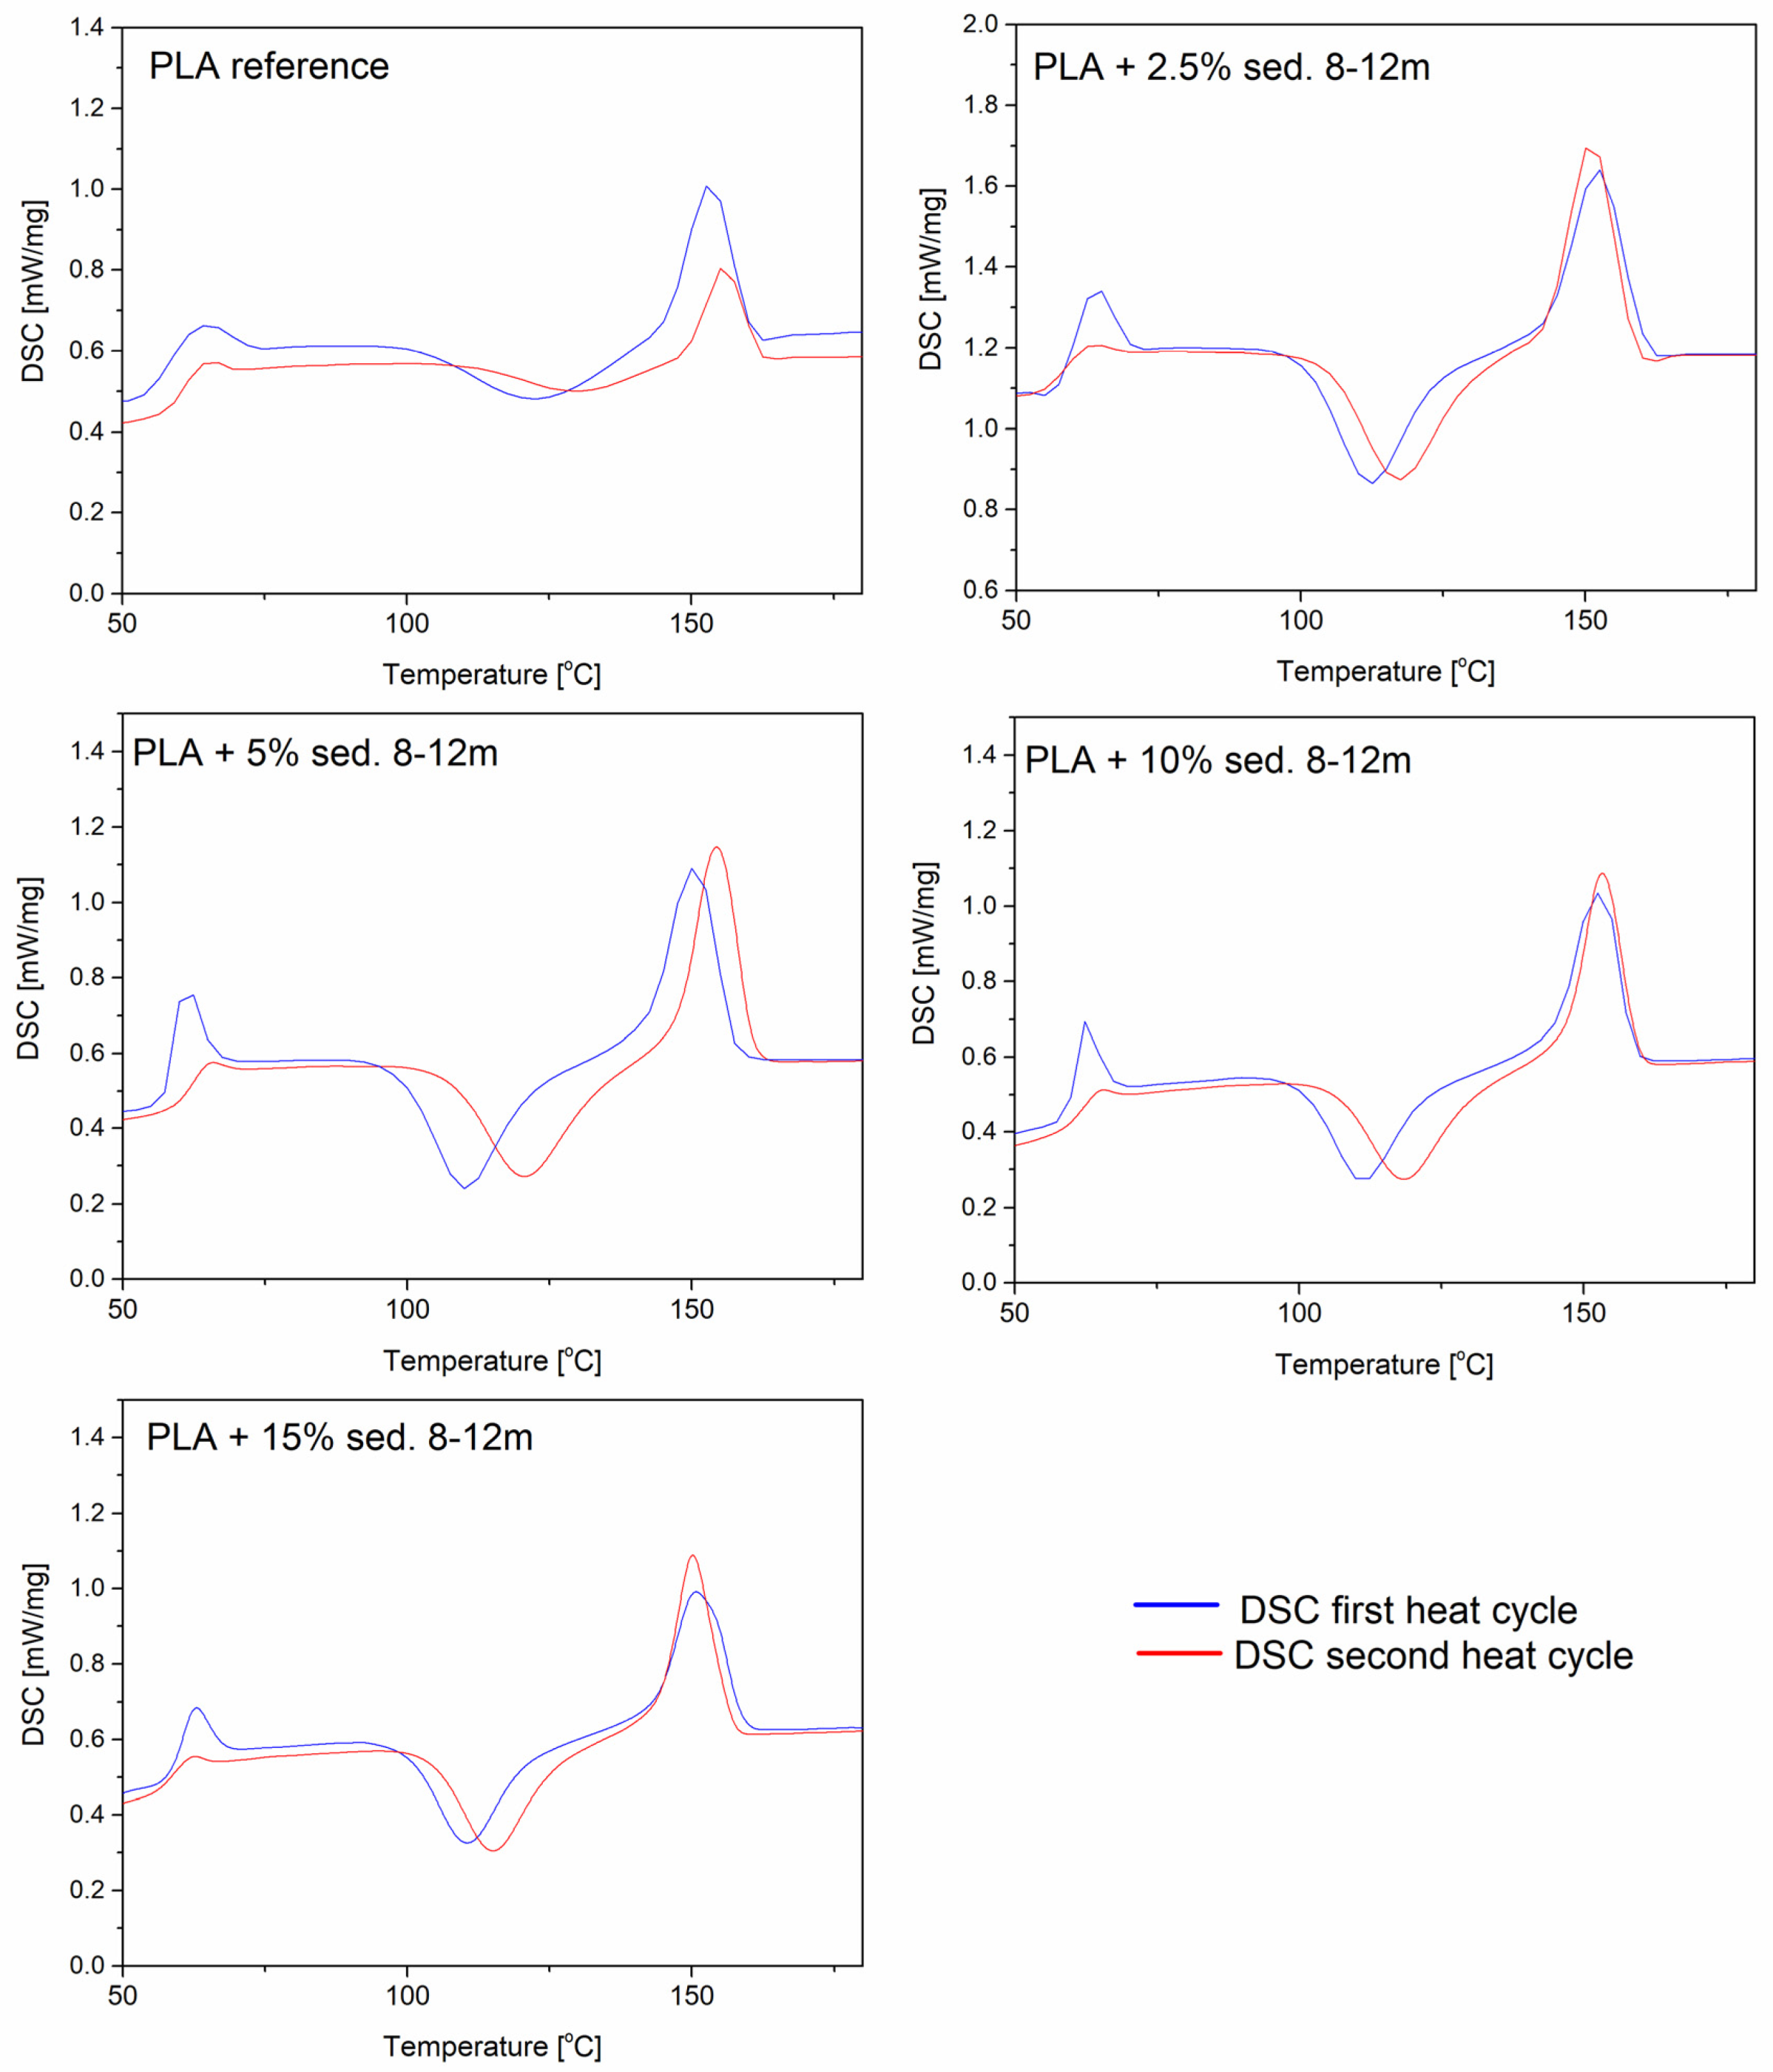
3.6. DSC Analysis
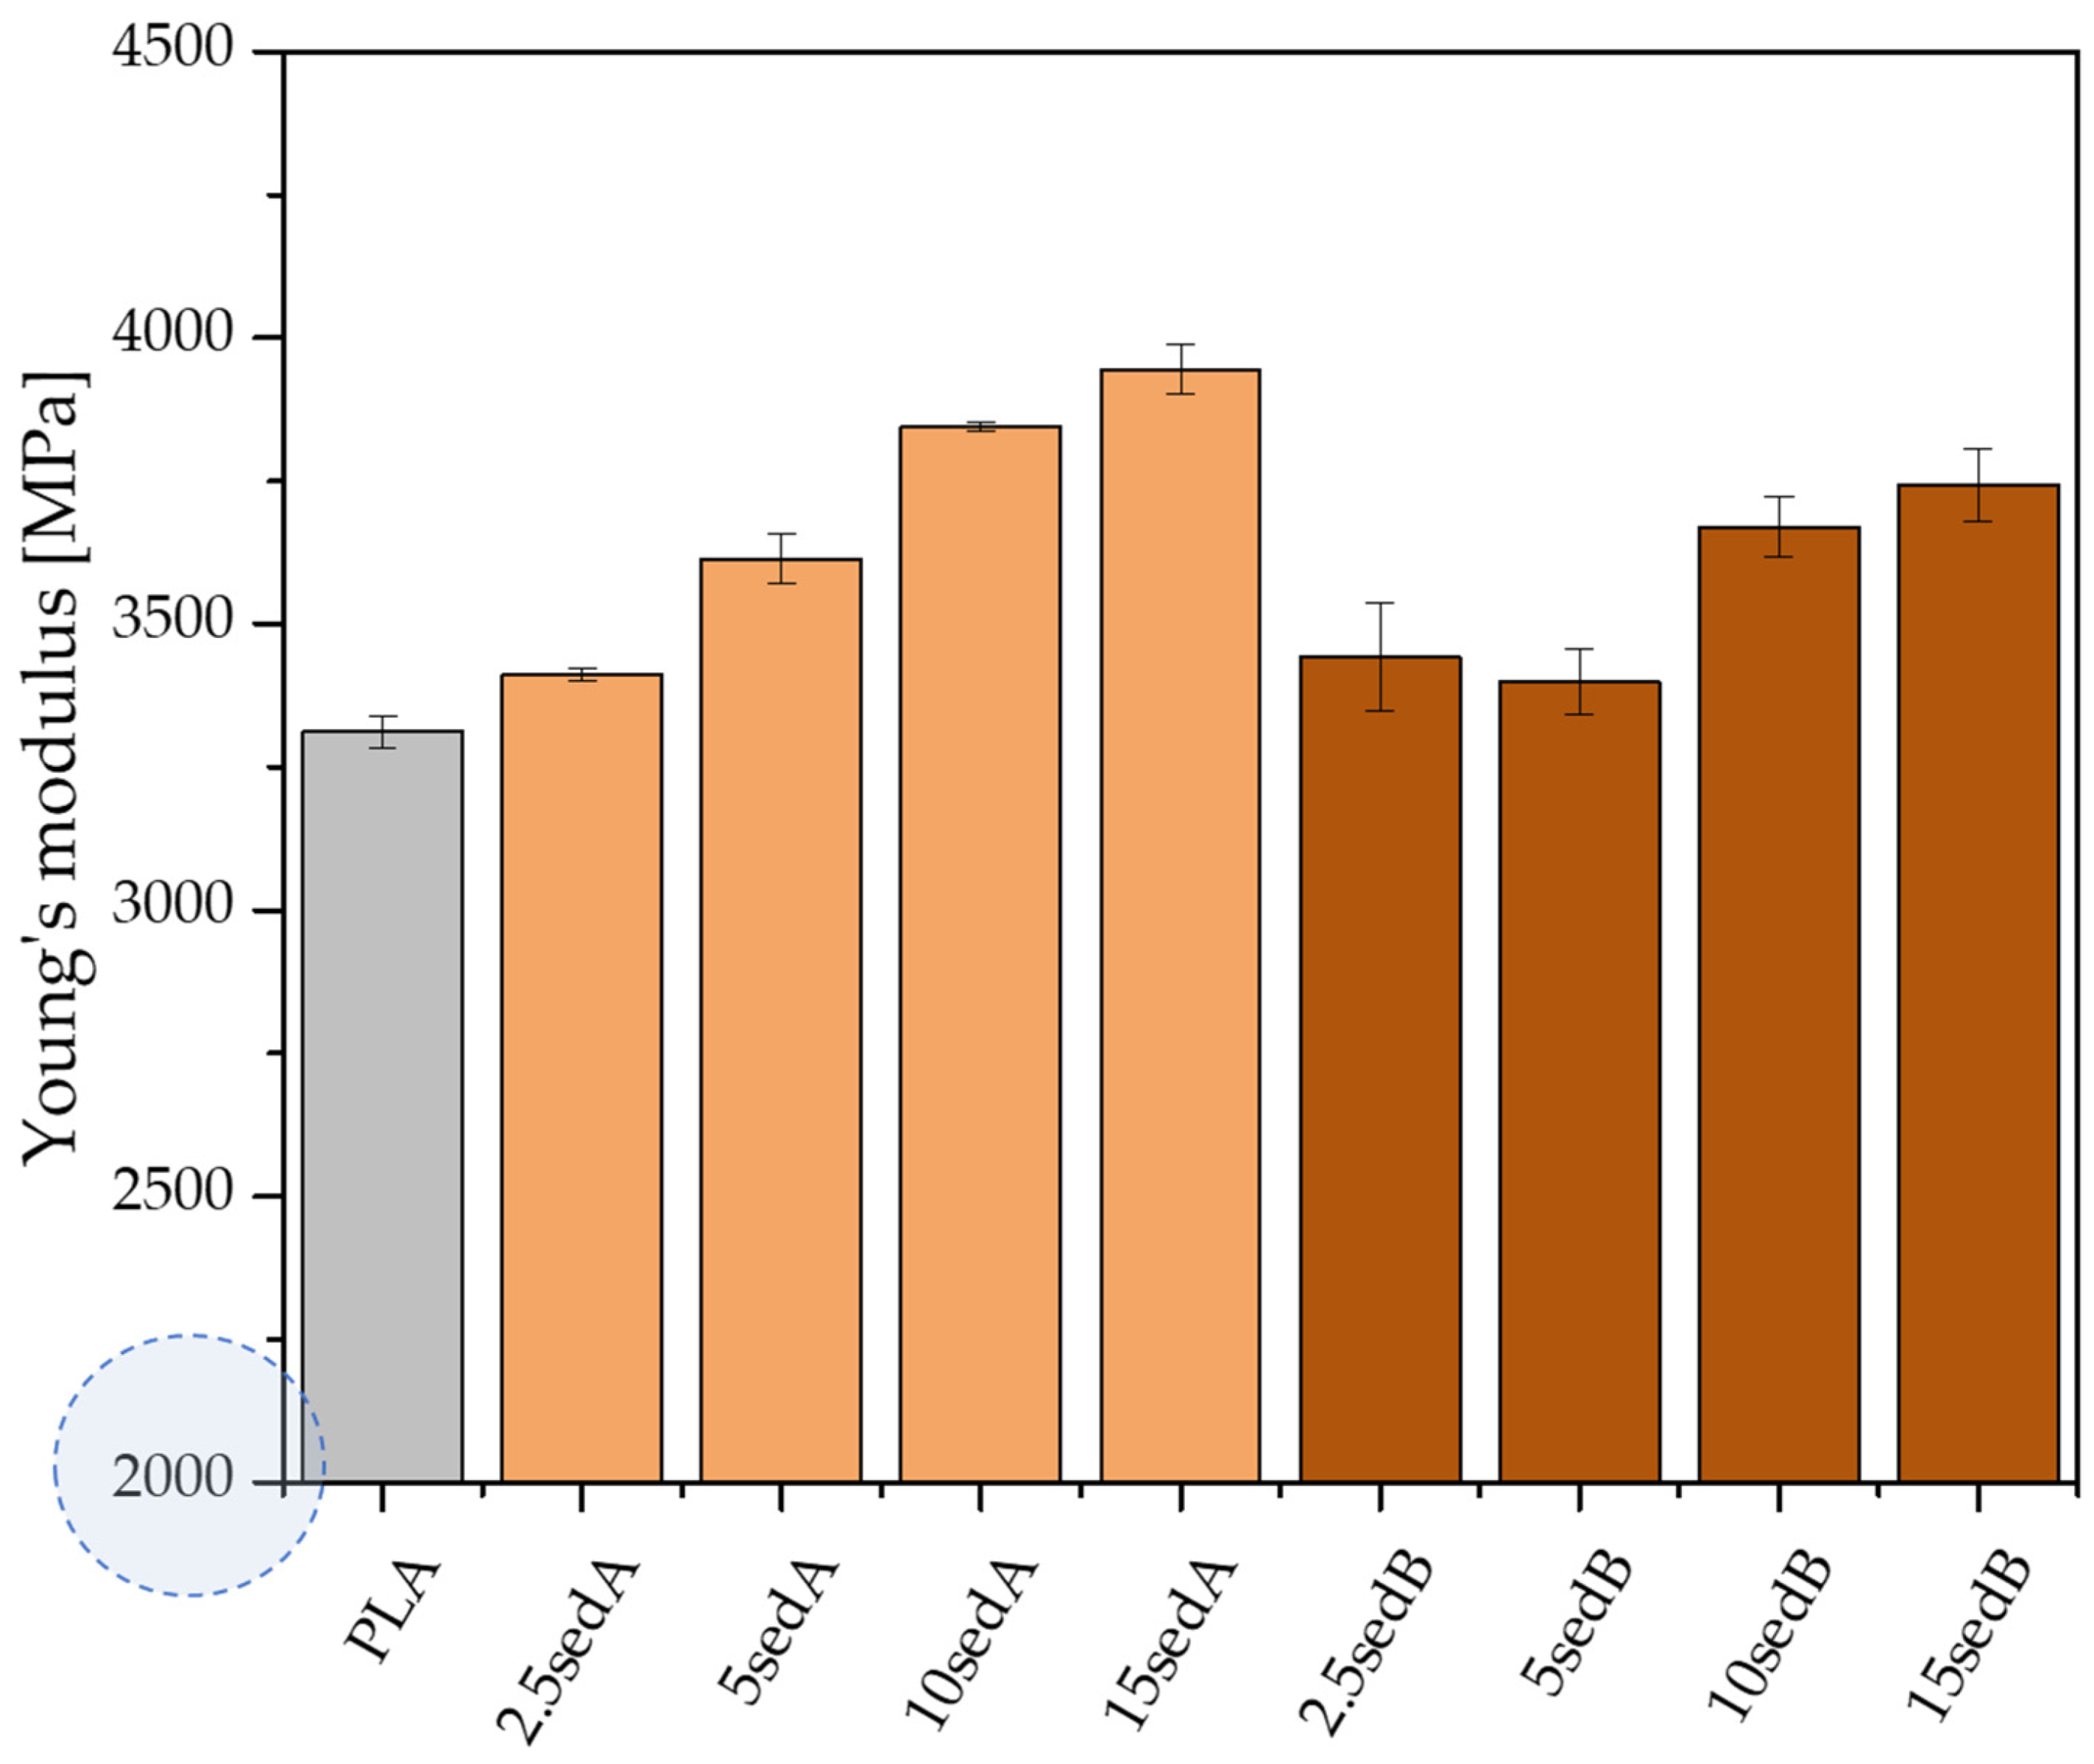
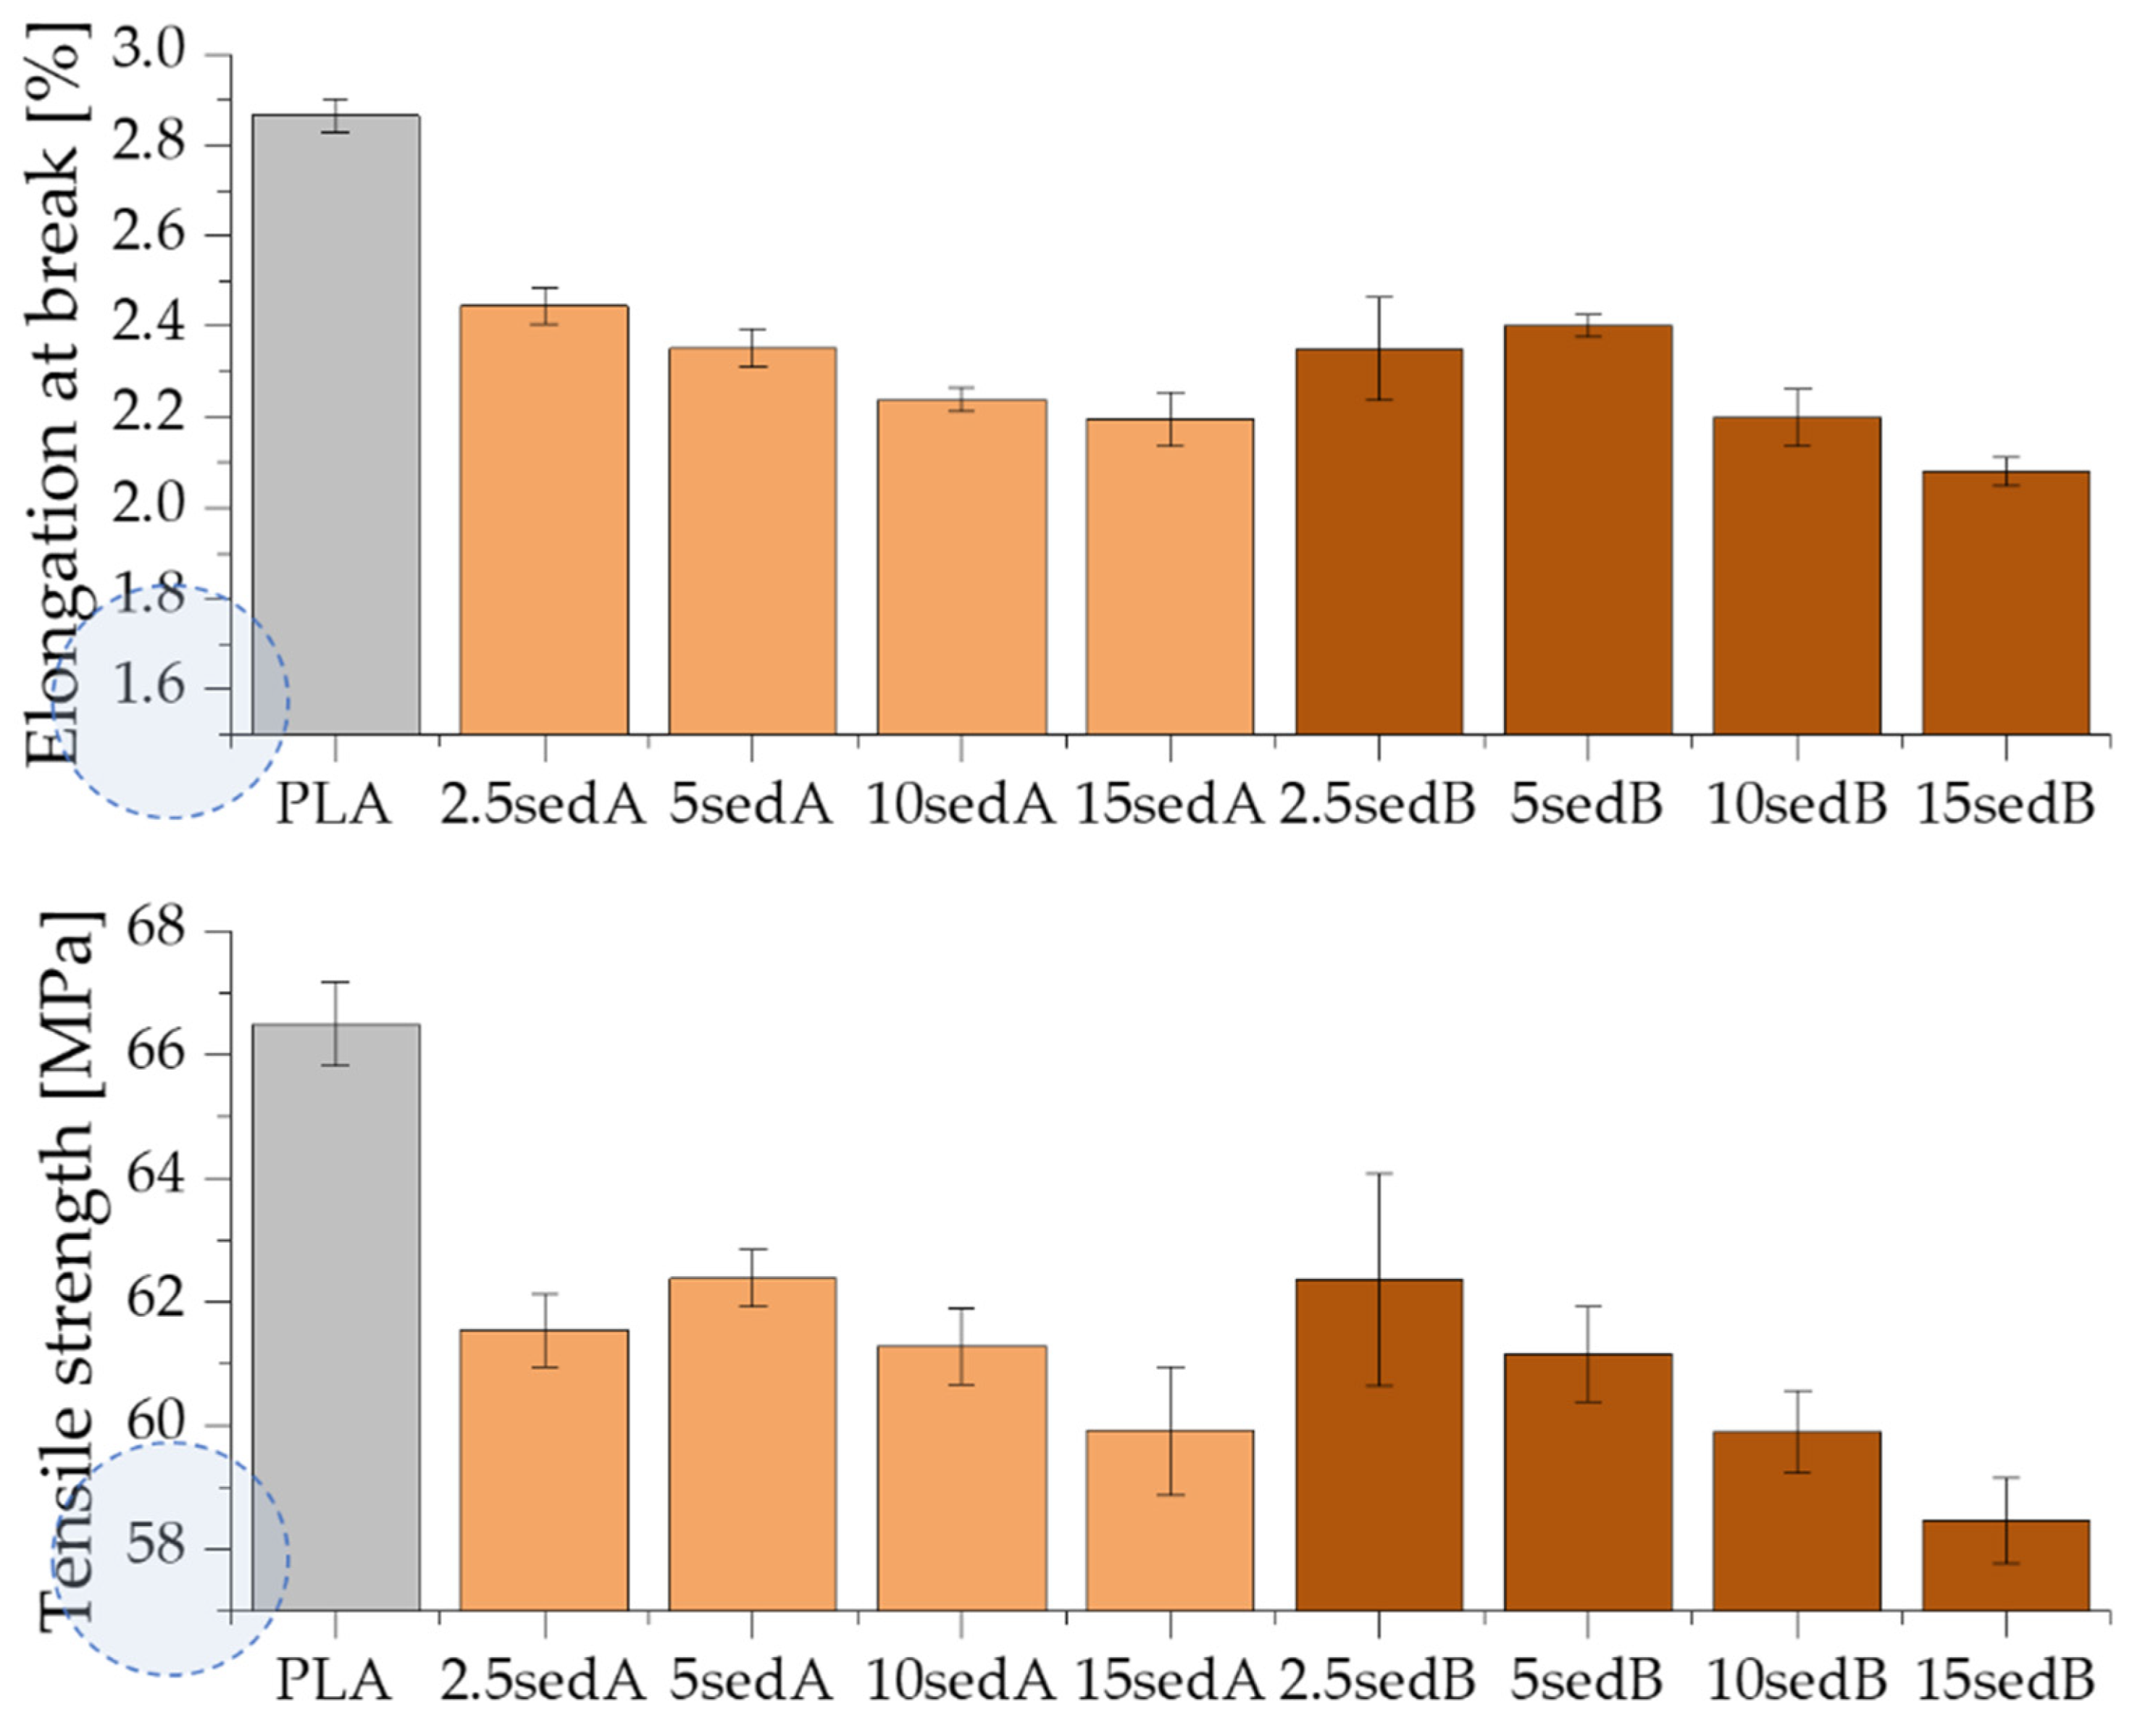
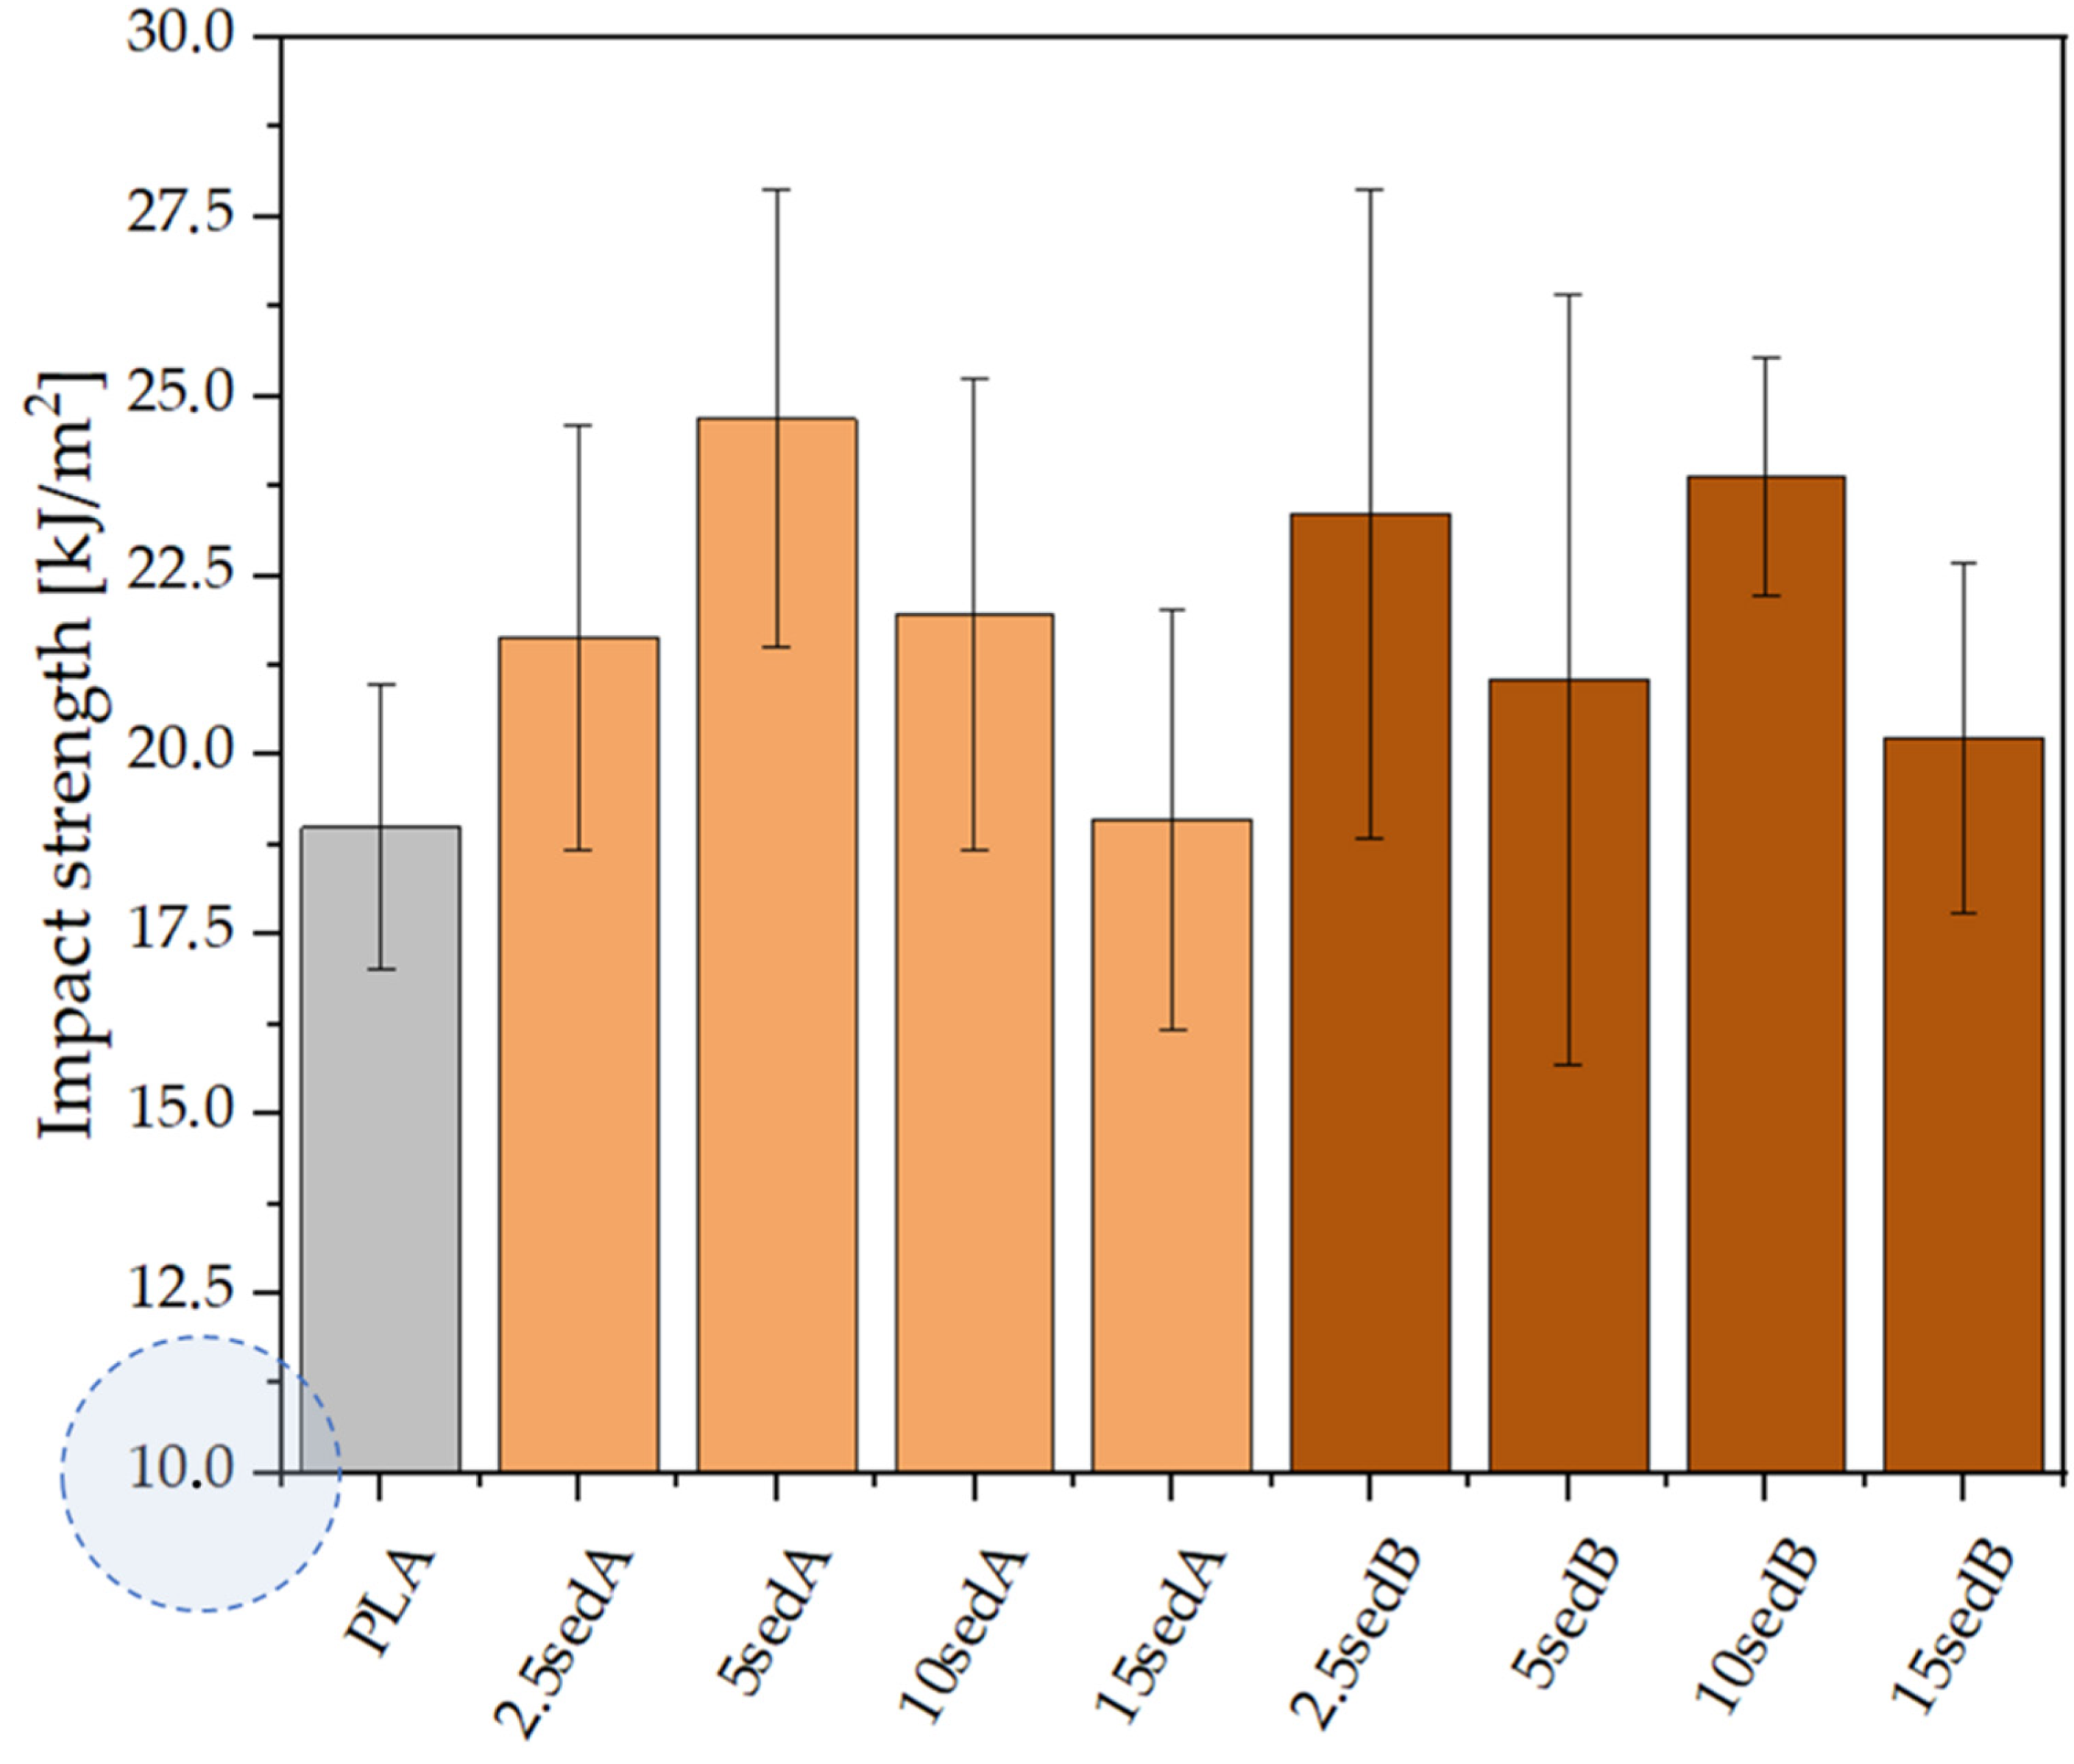
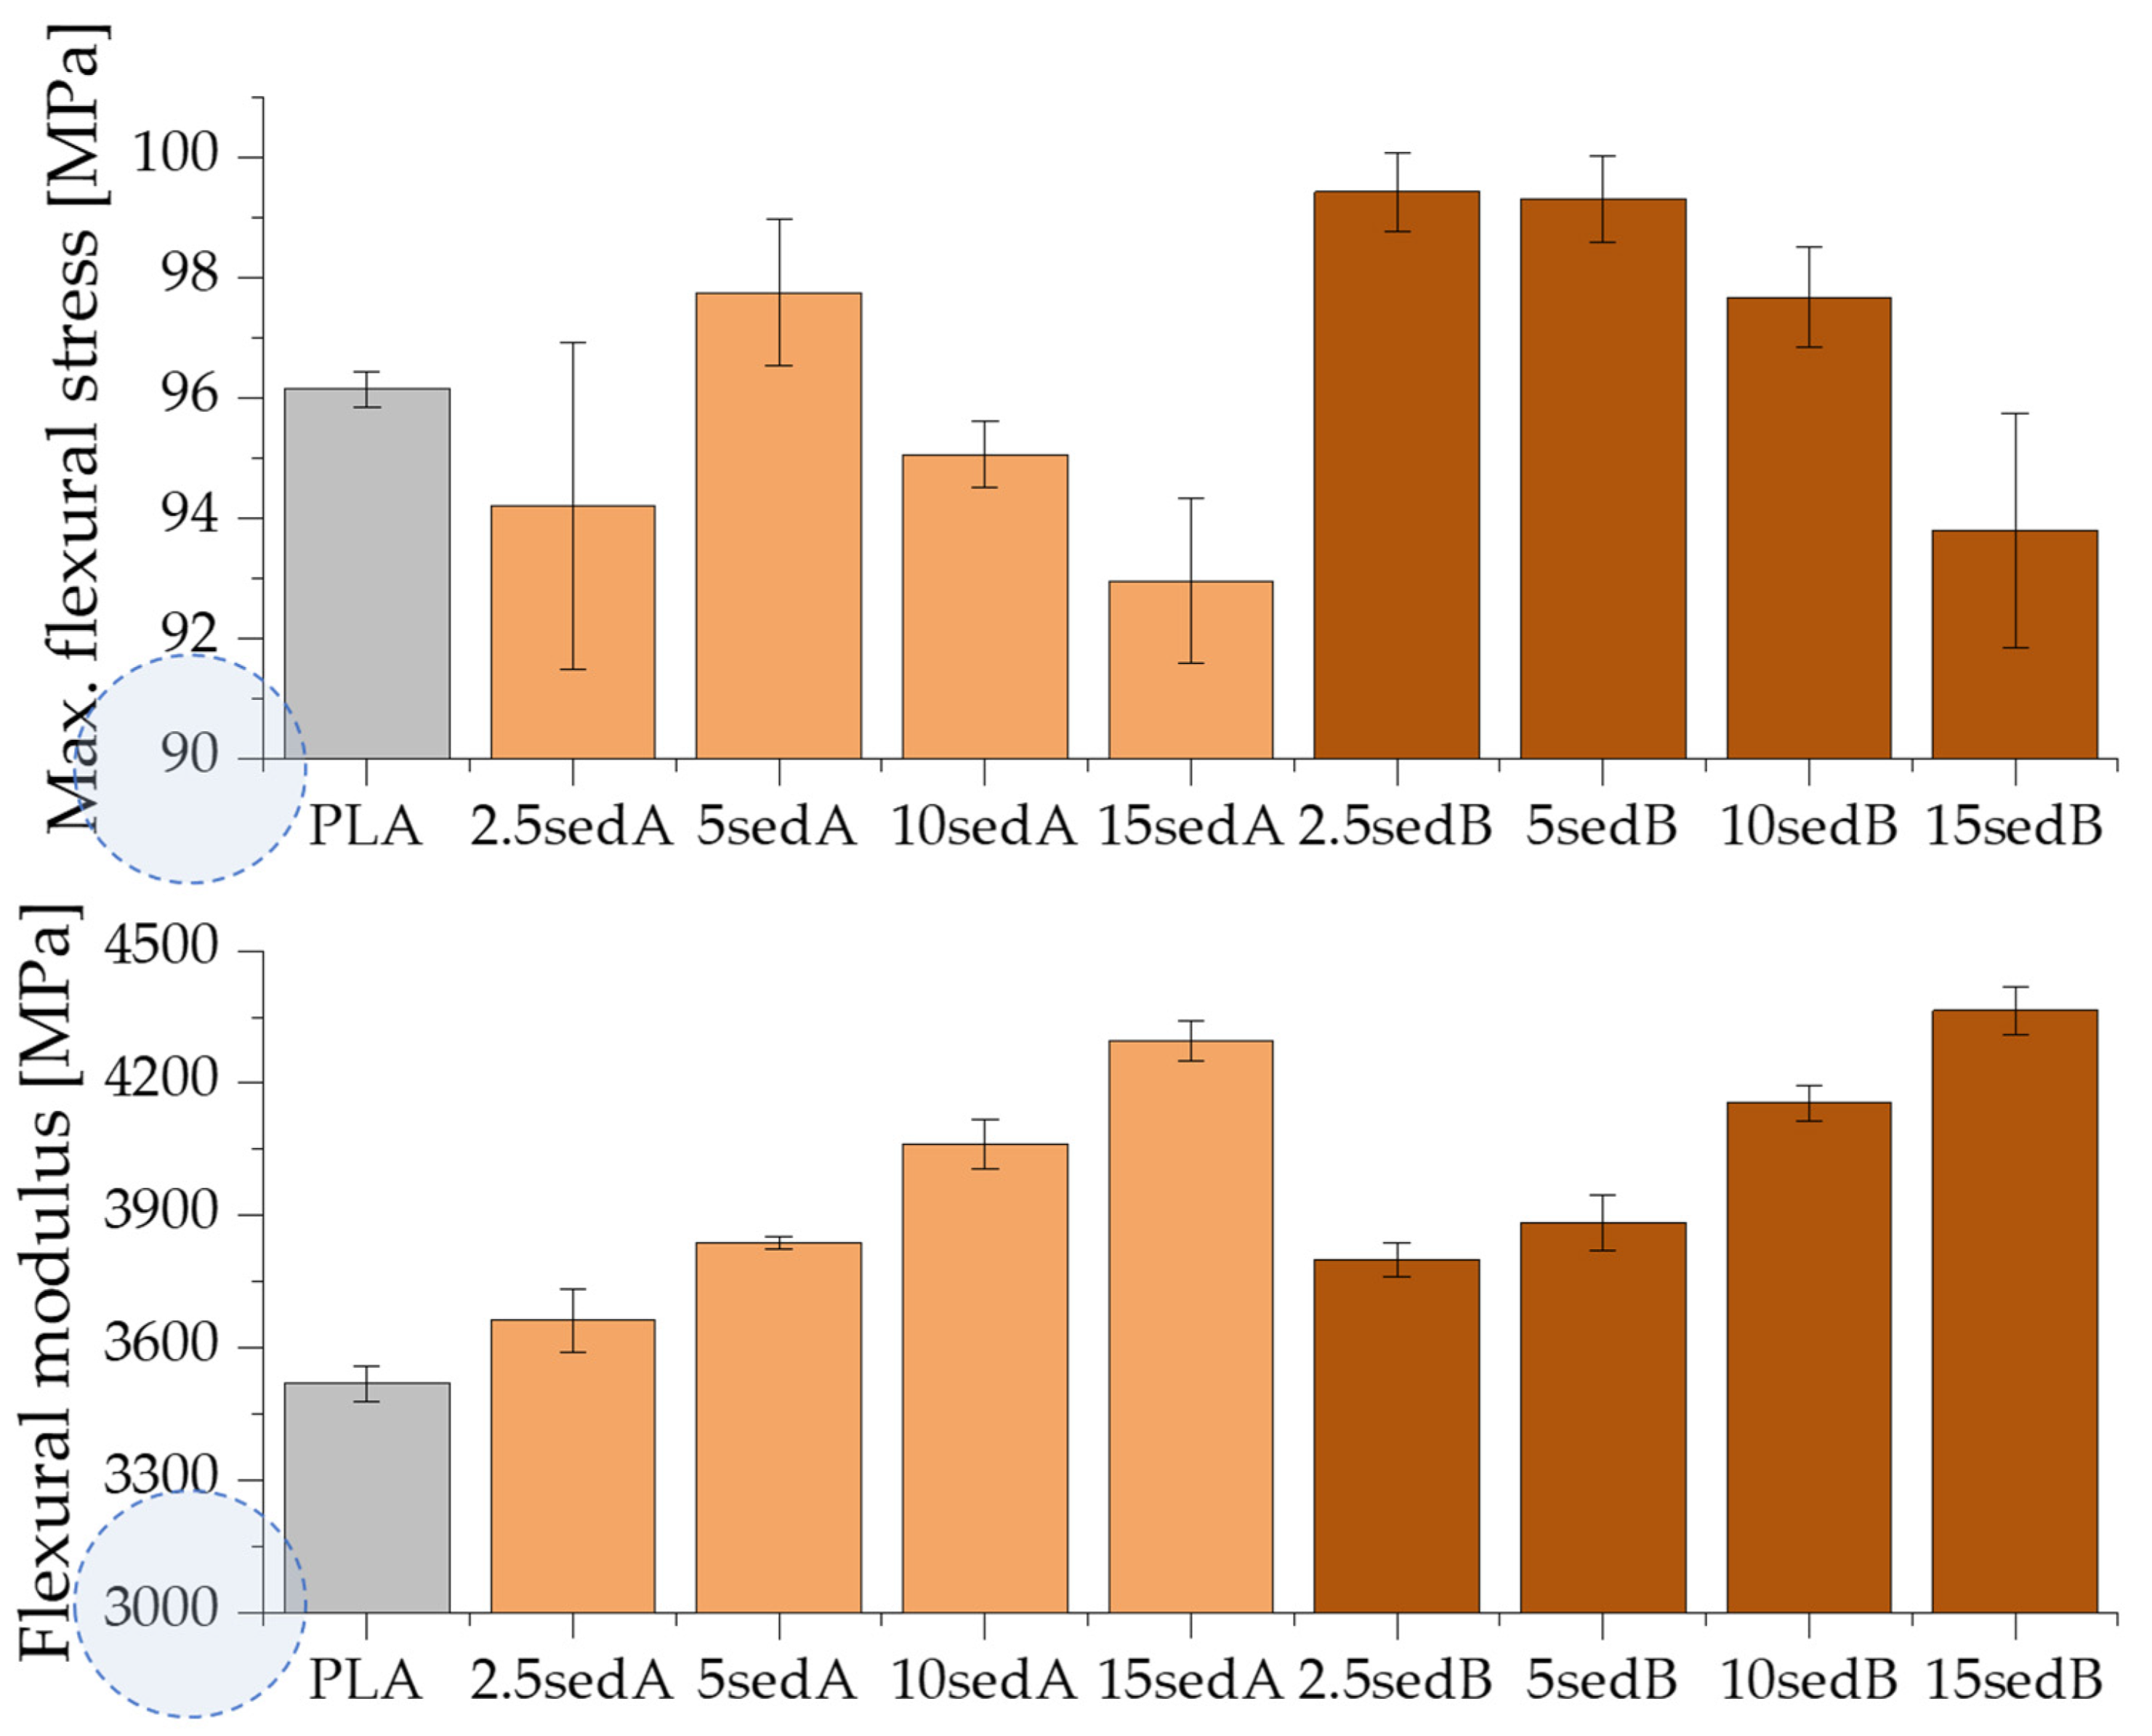
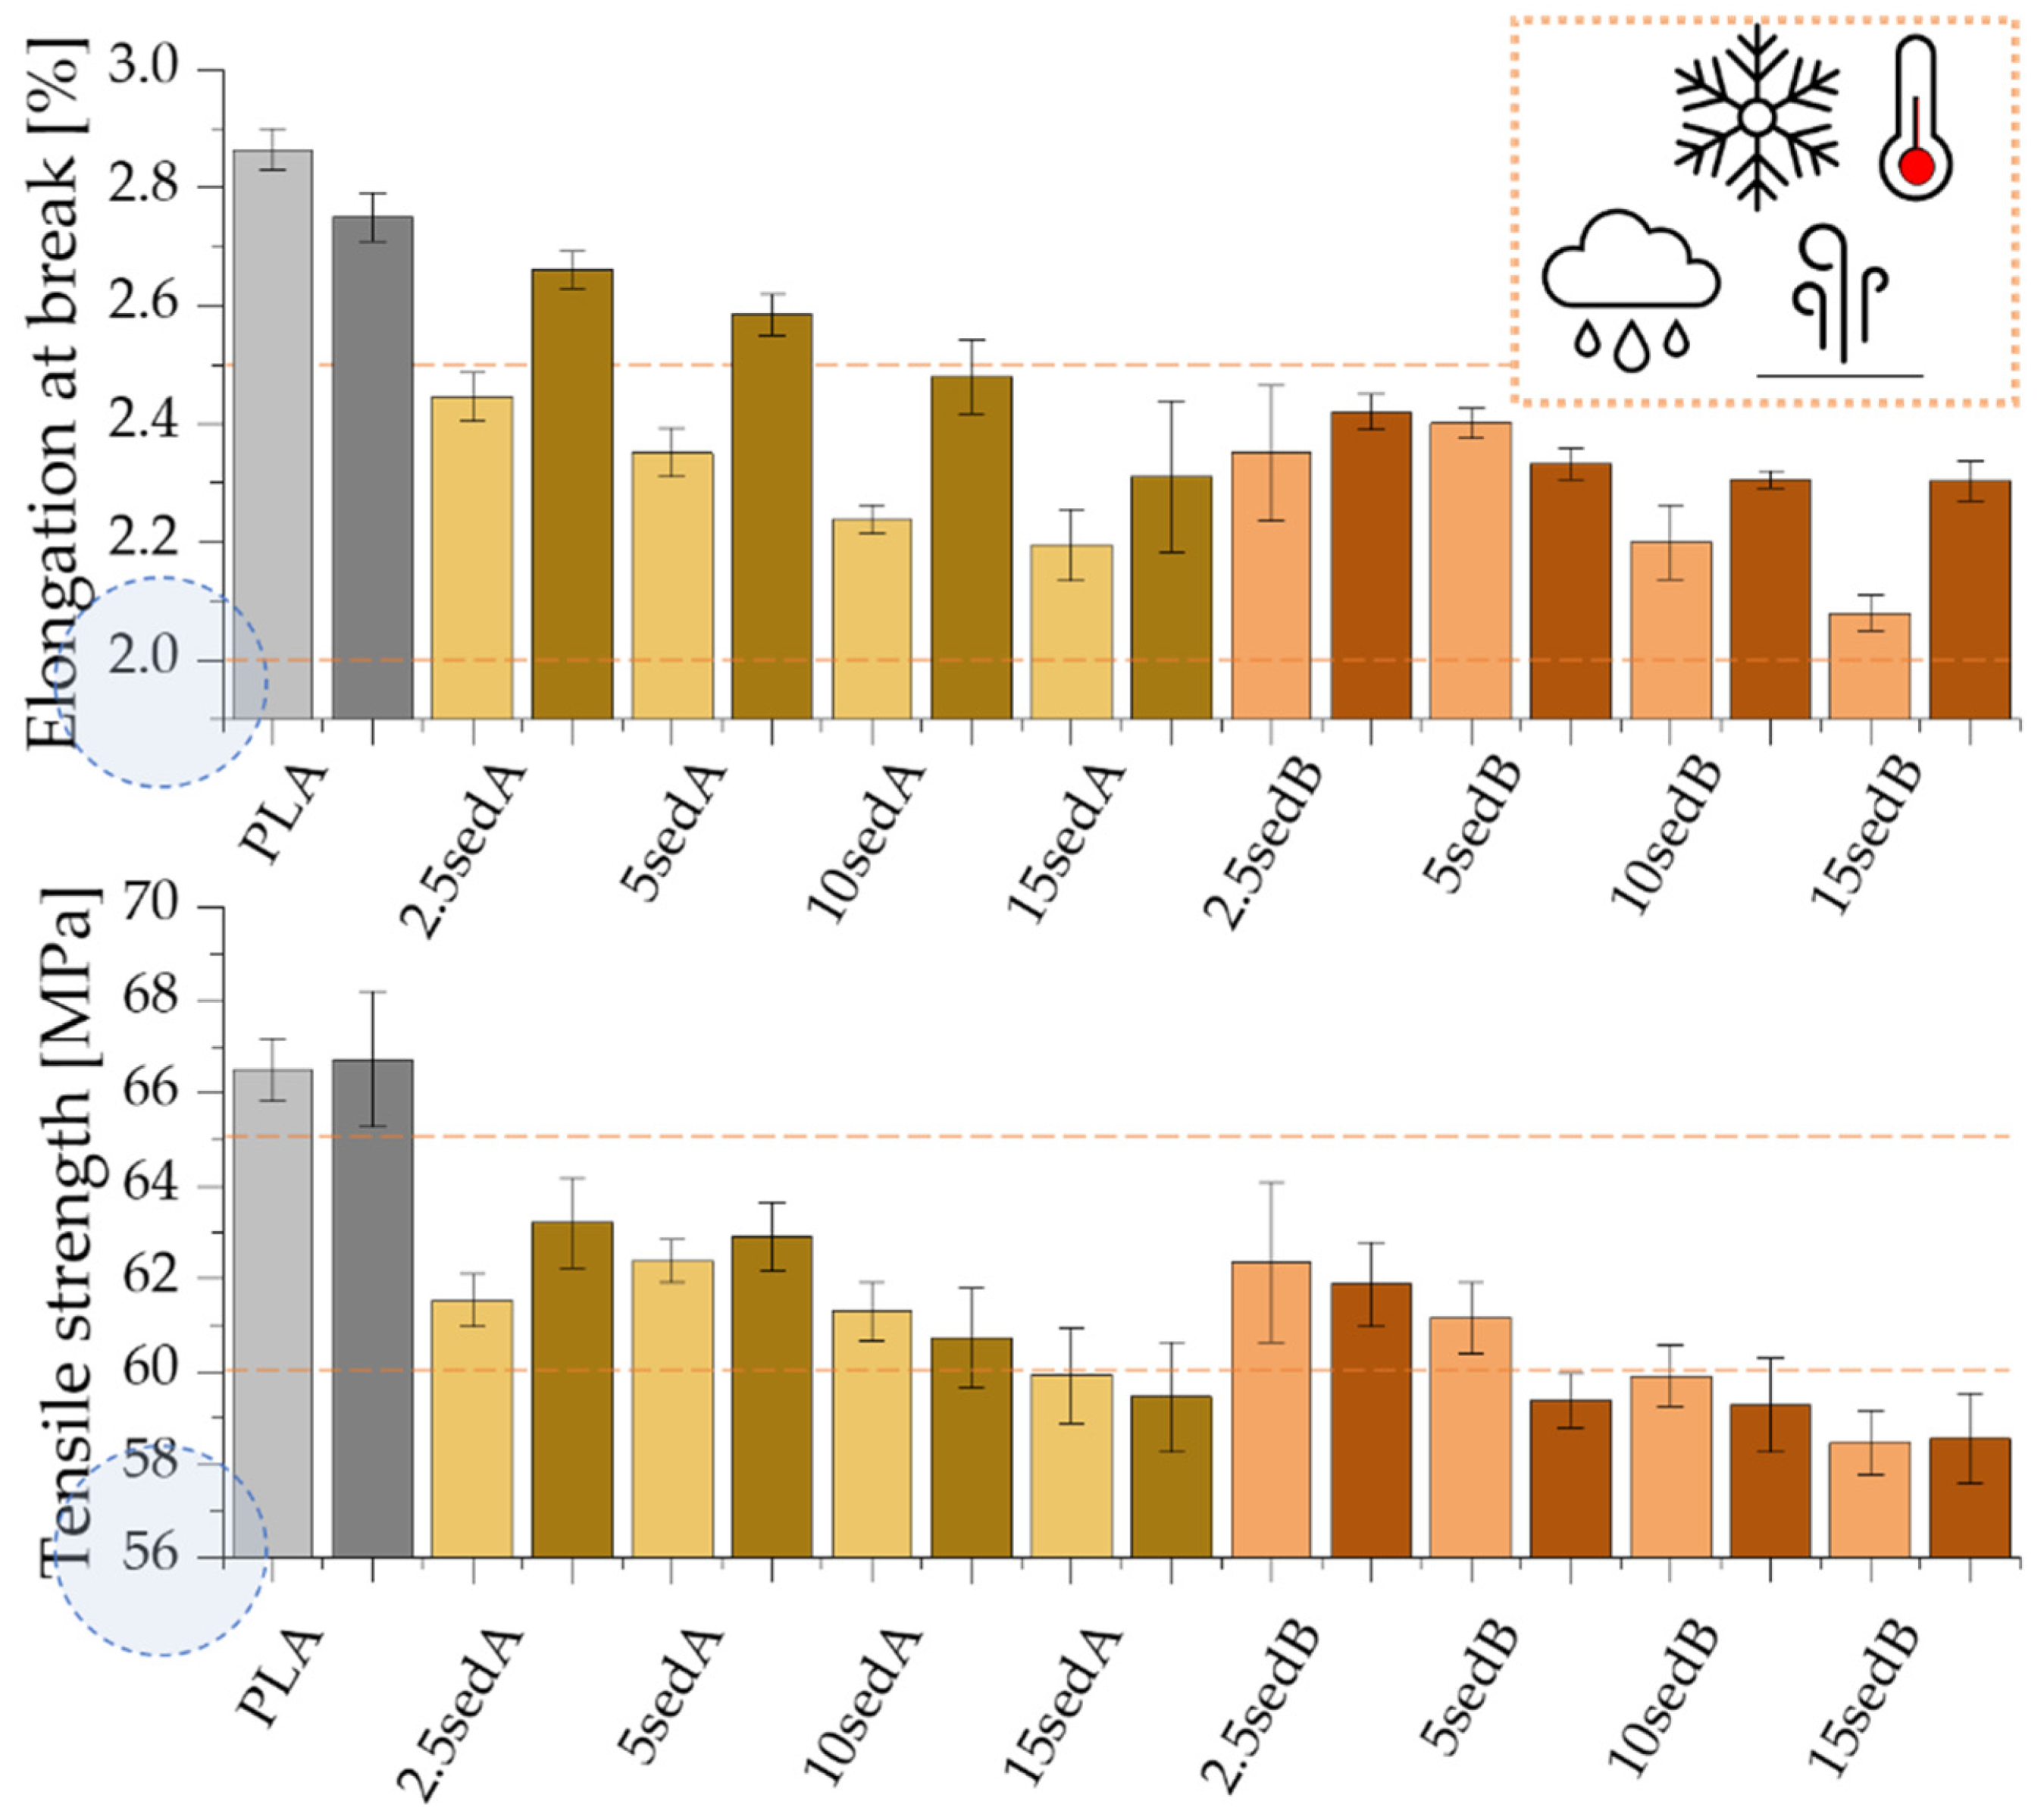
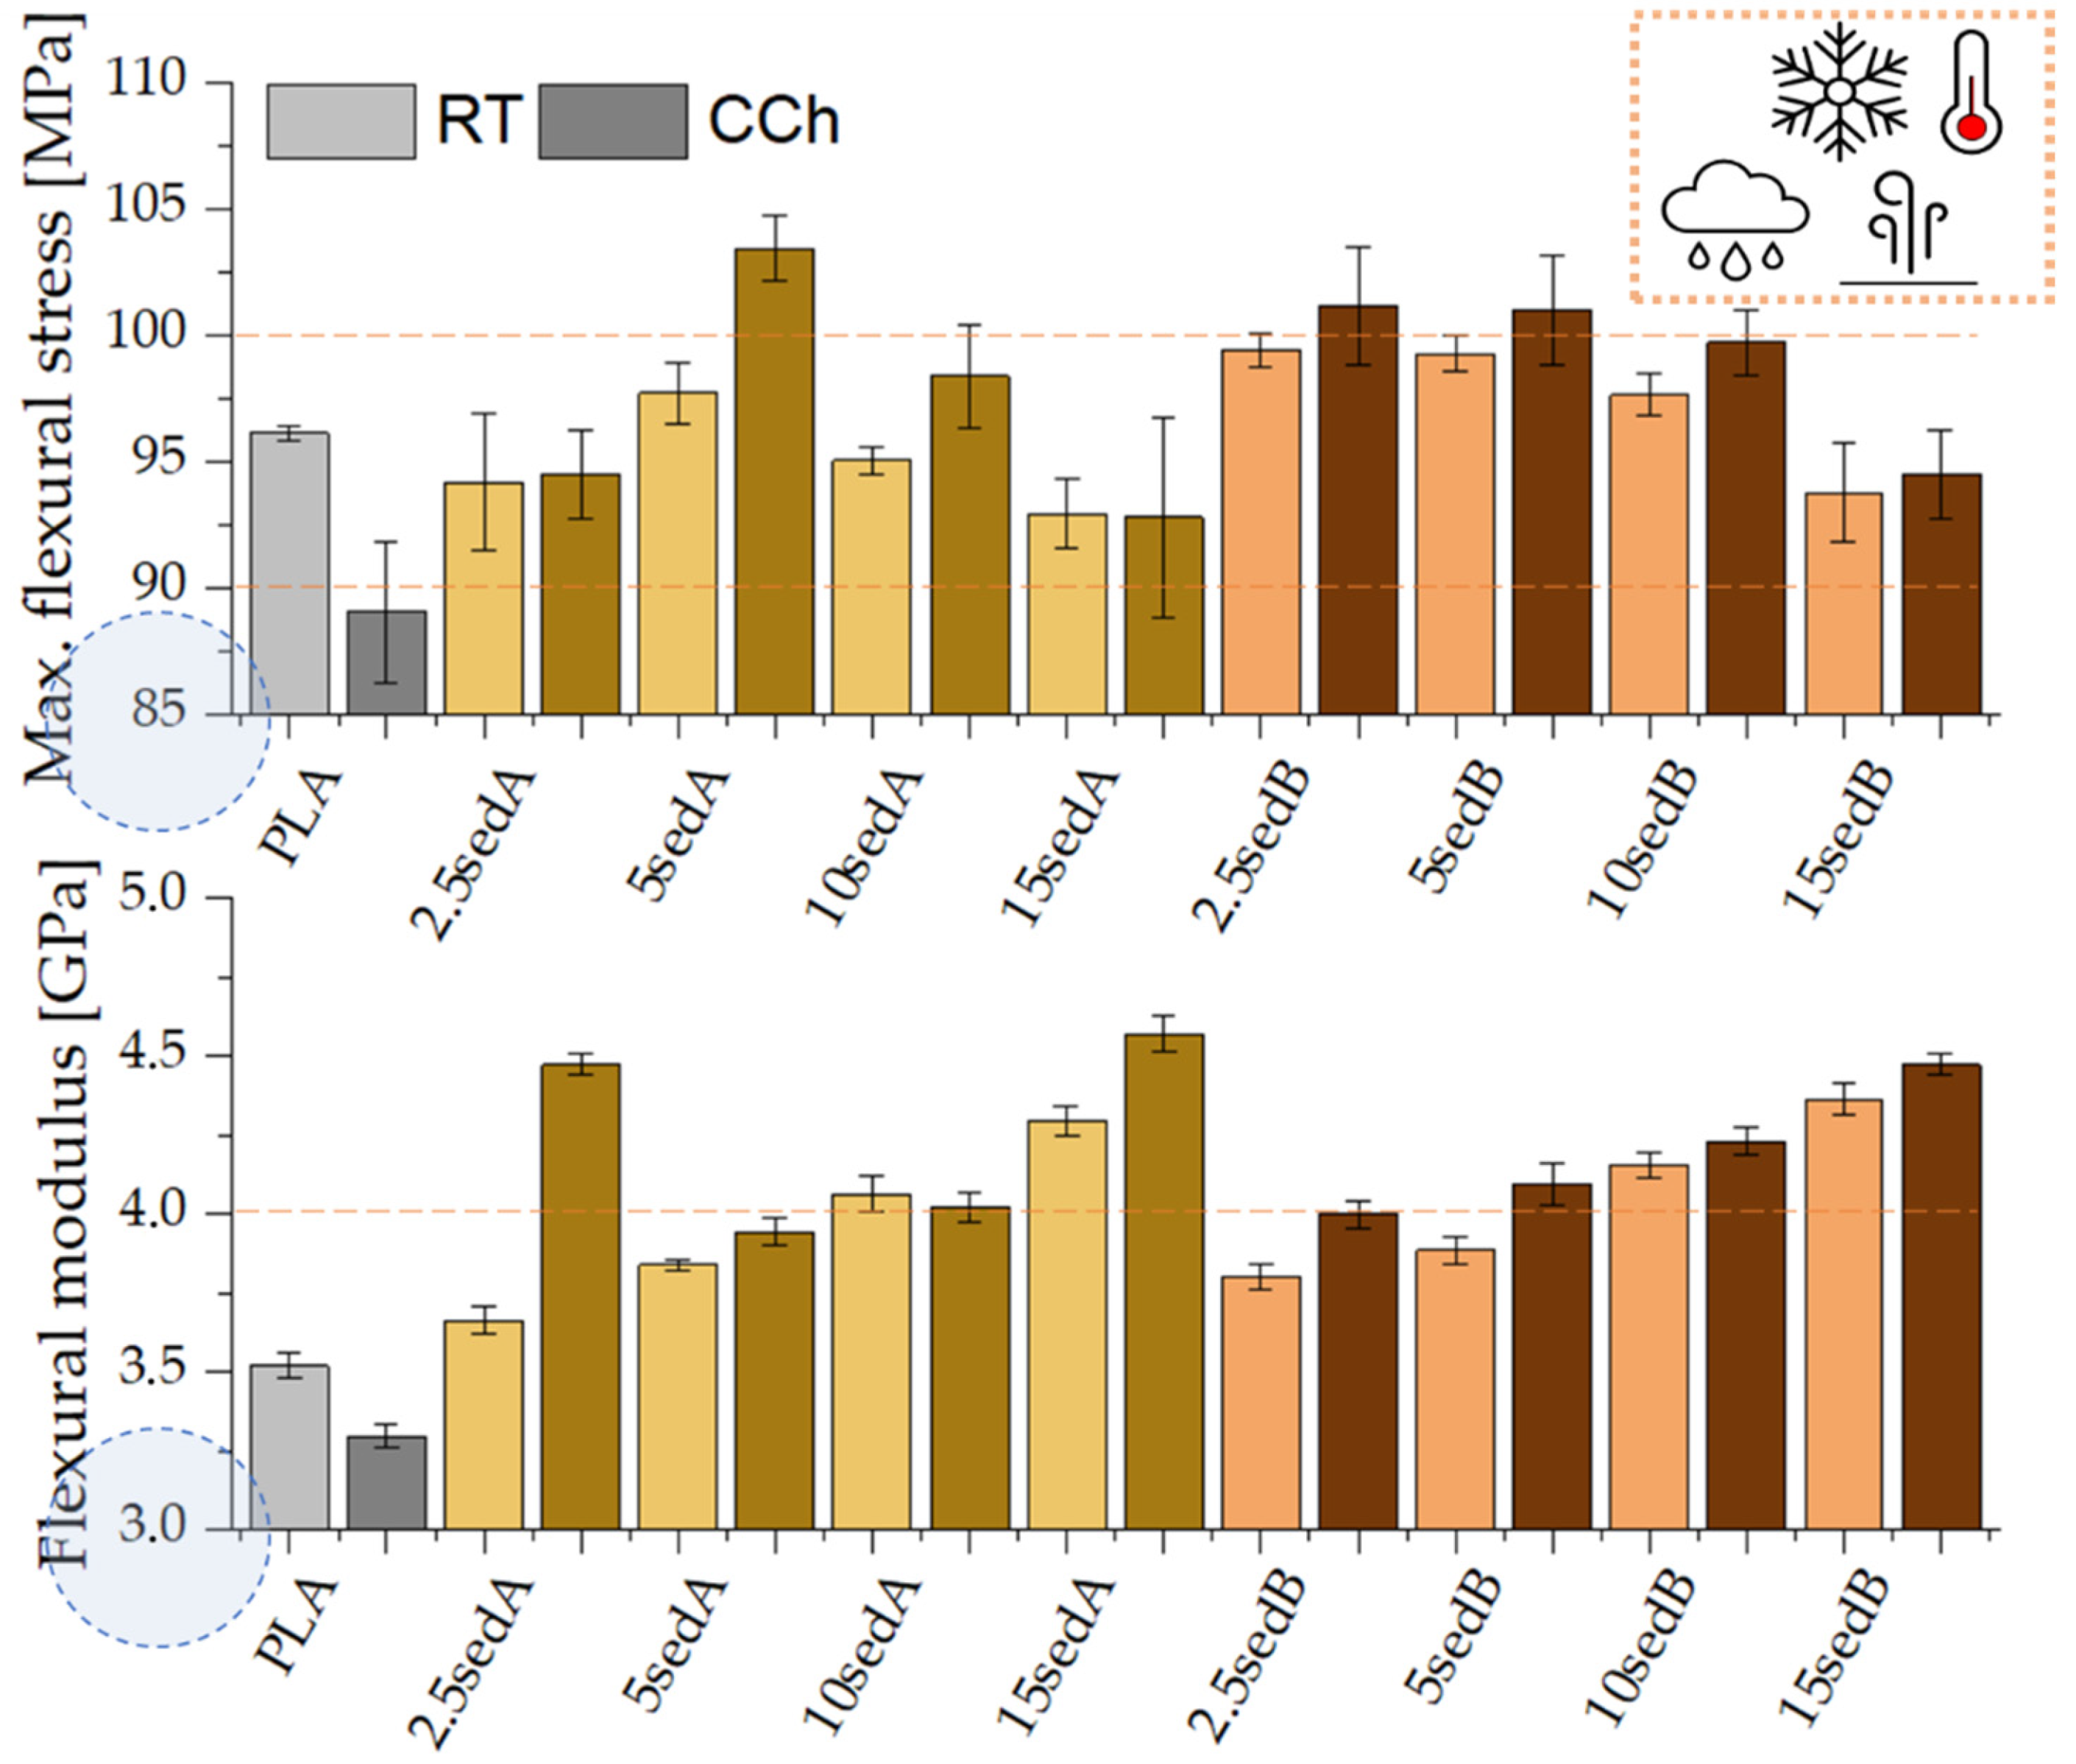
3.7. Mechanical Properties
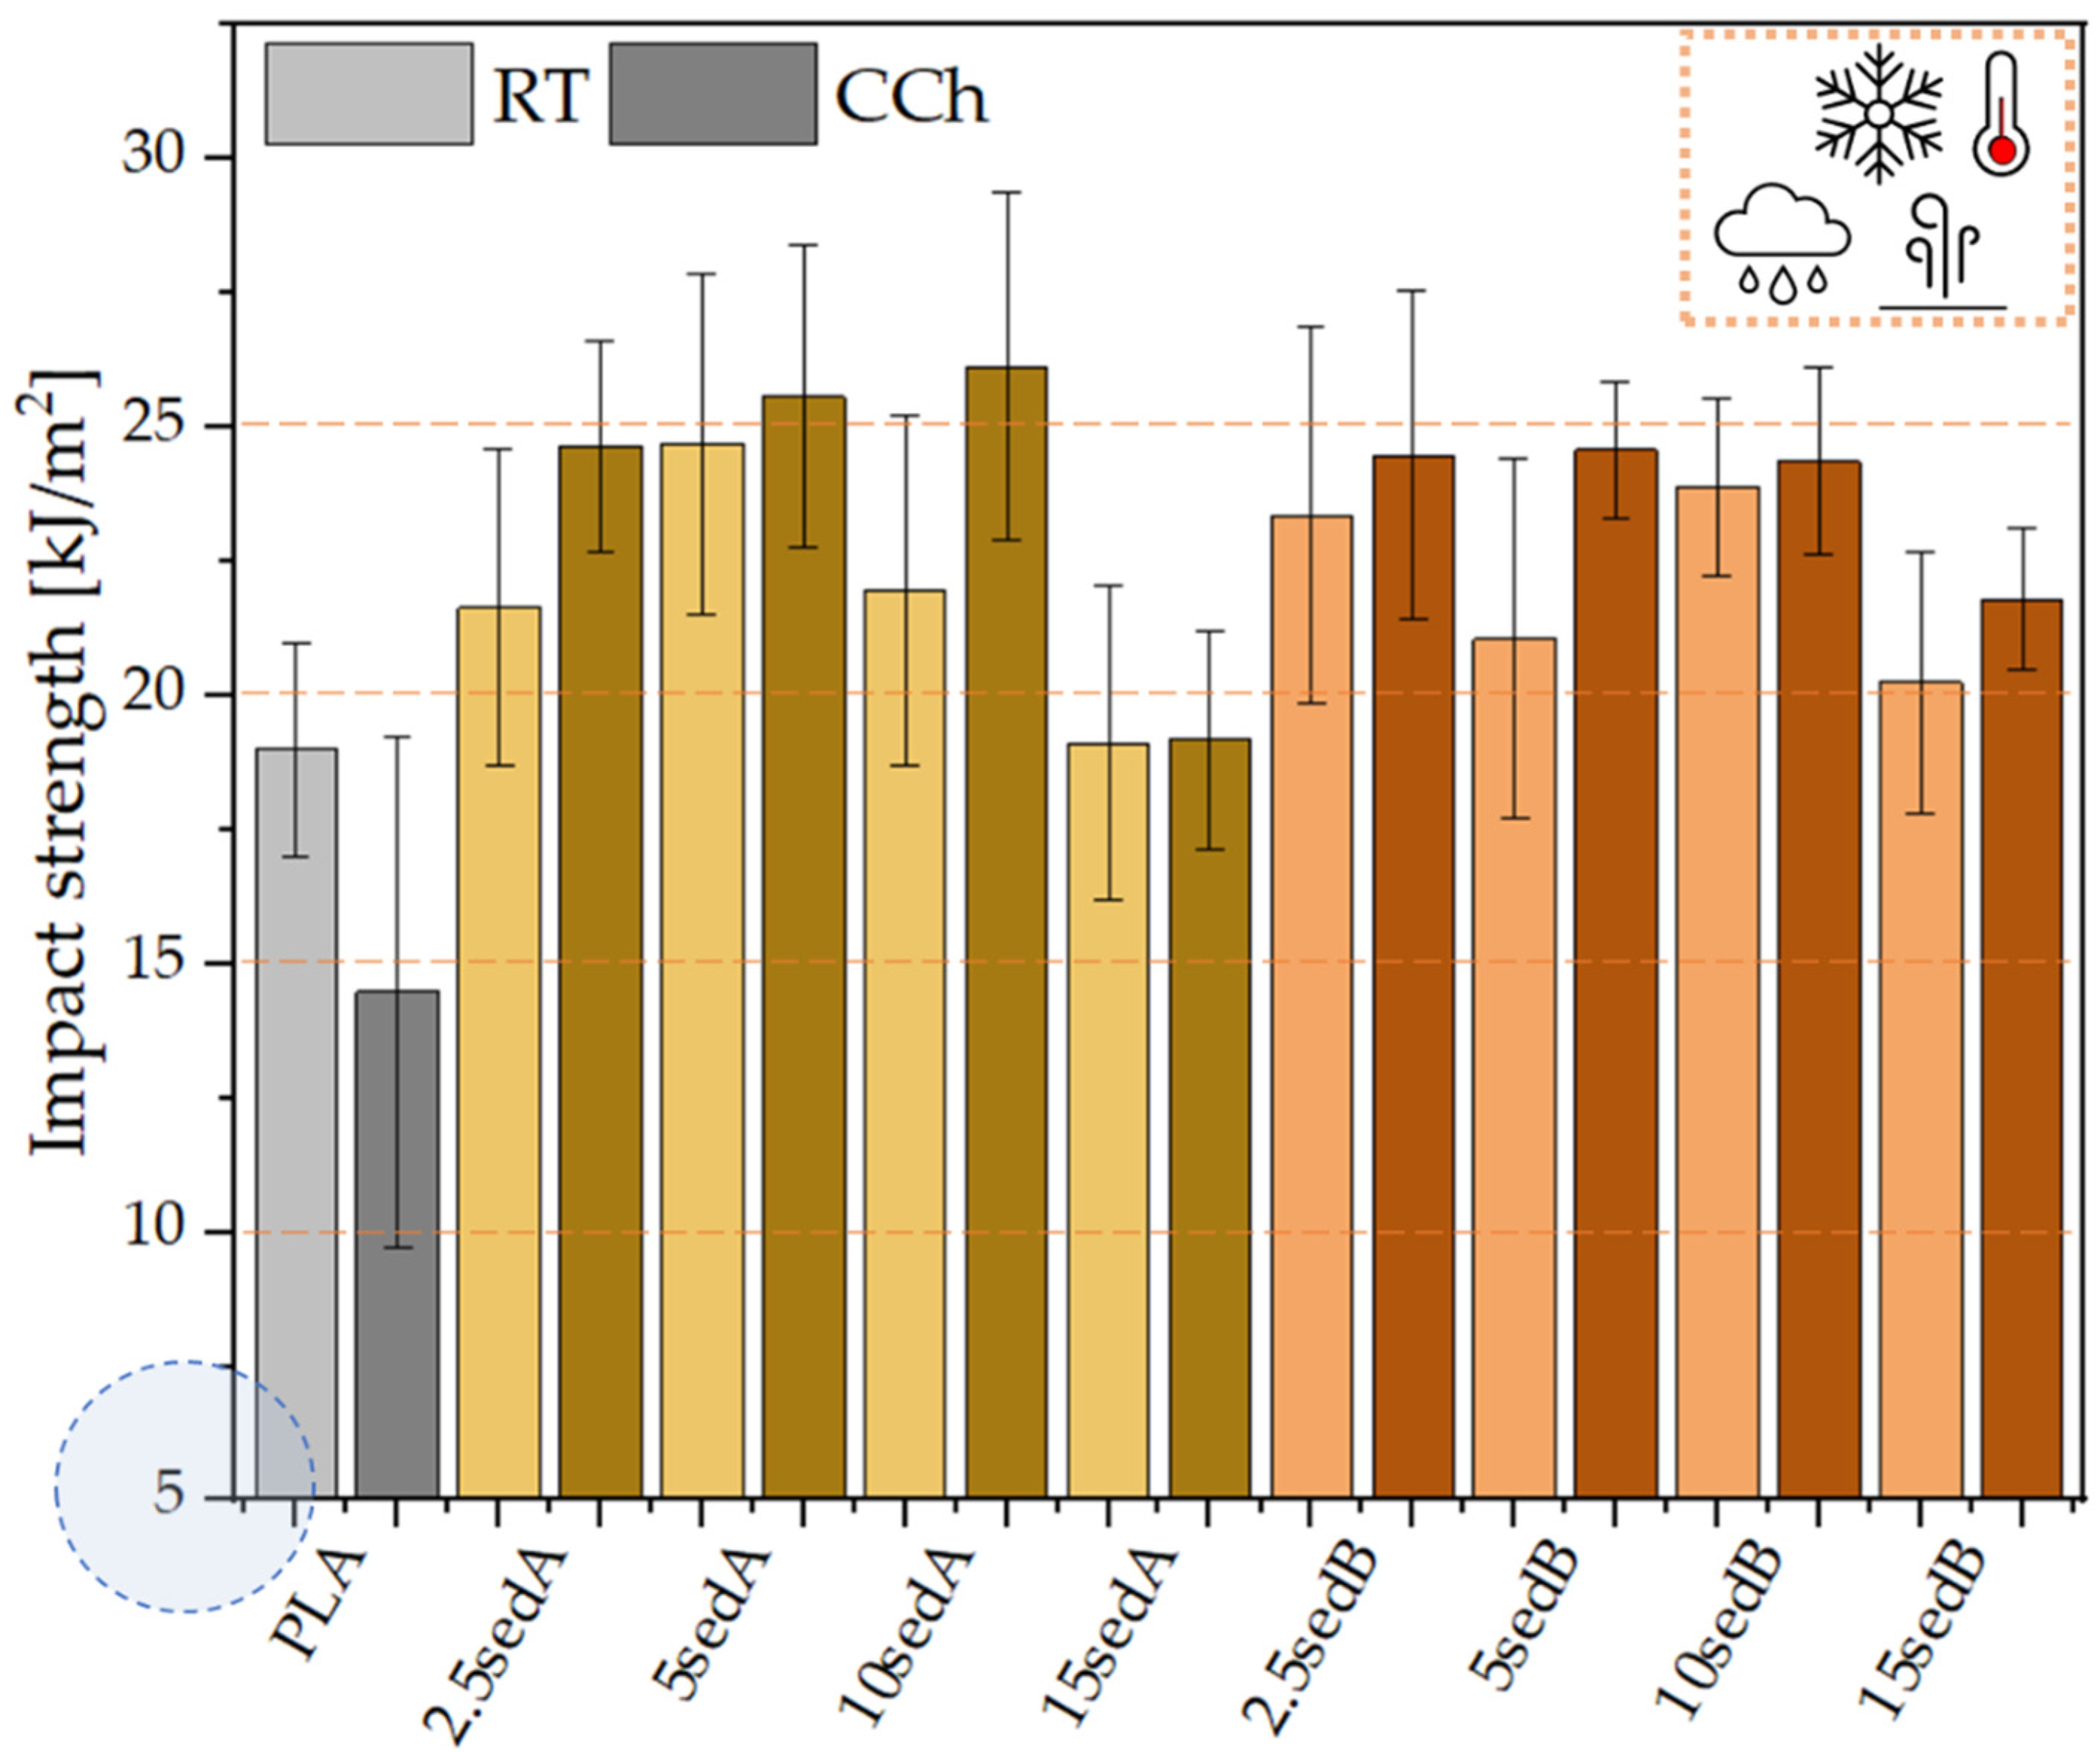
3.8. Mechanical Tests after Conditioning in the Weathering Chamber
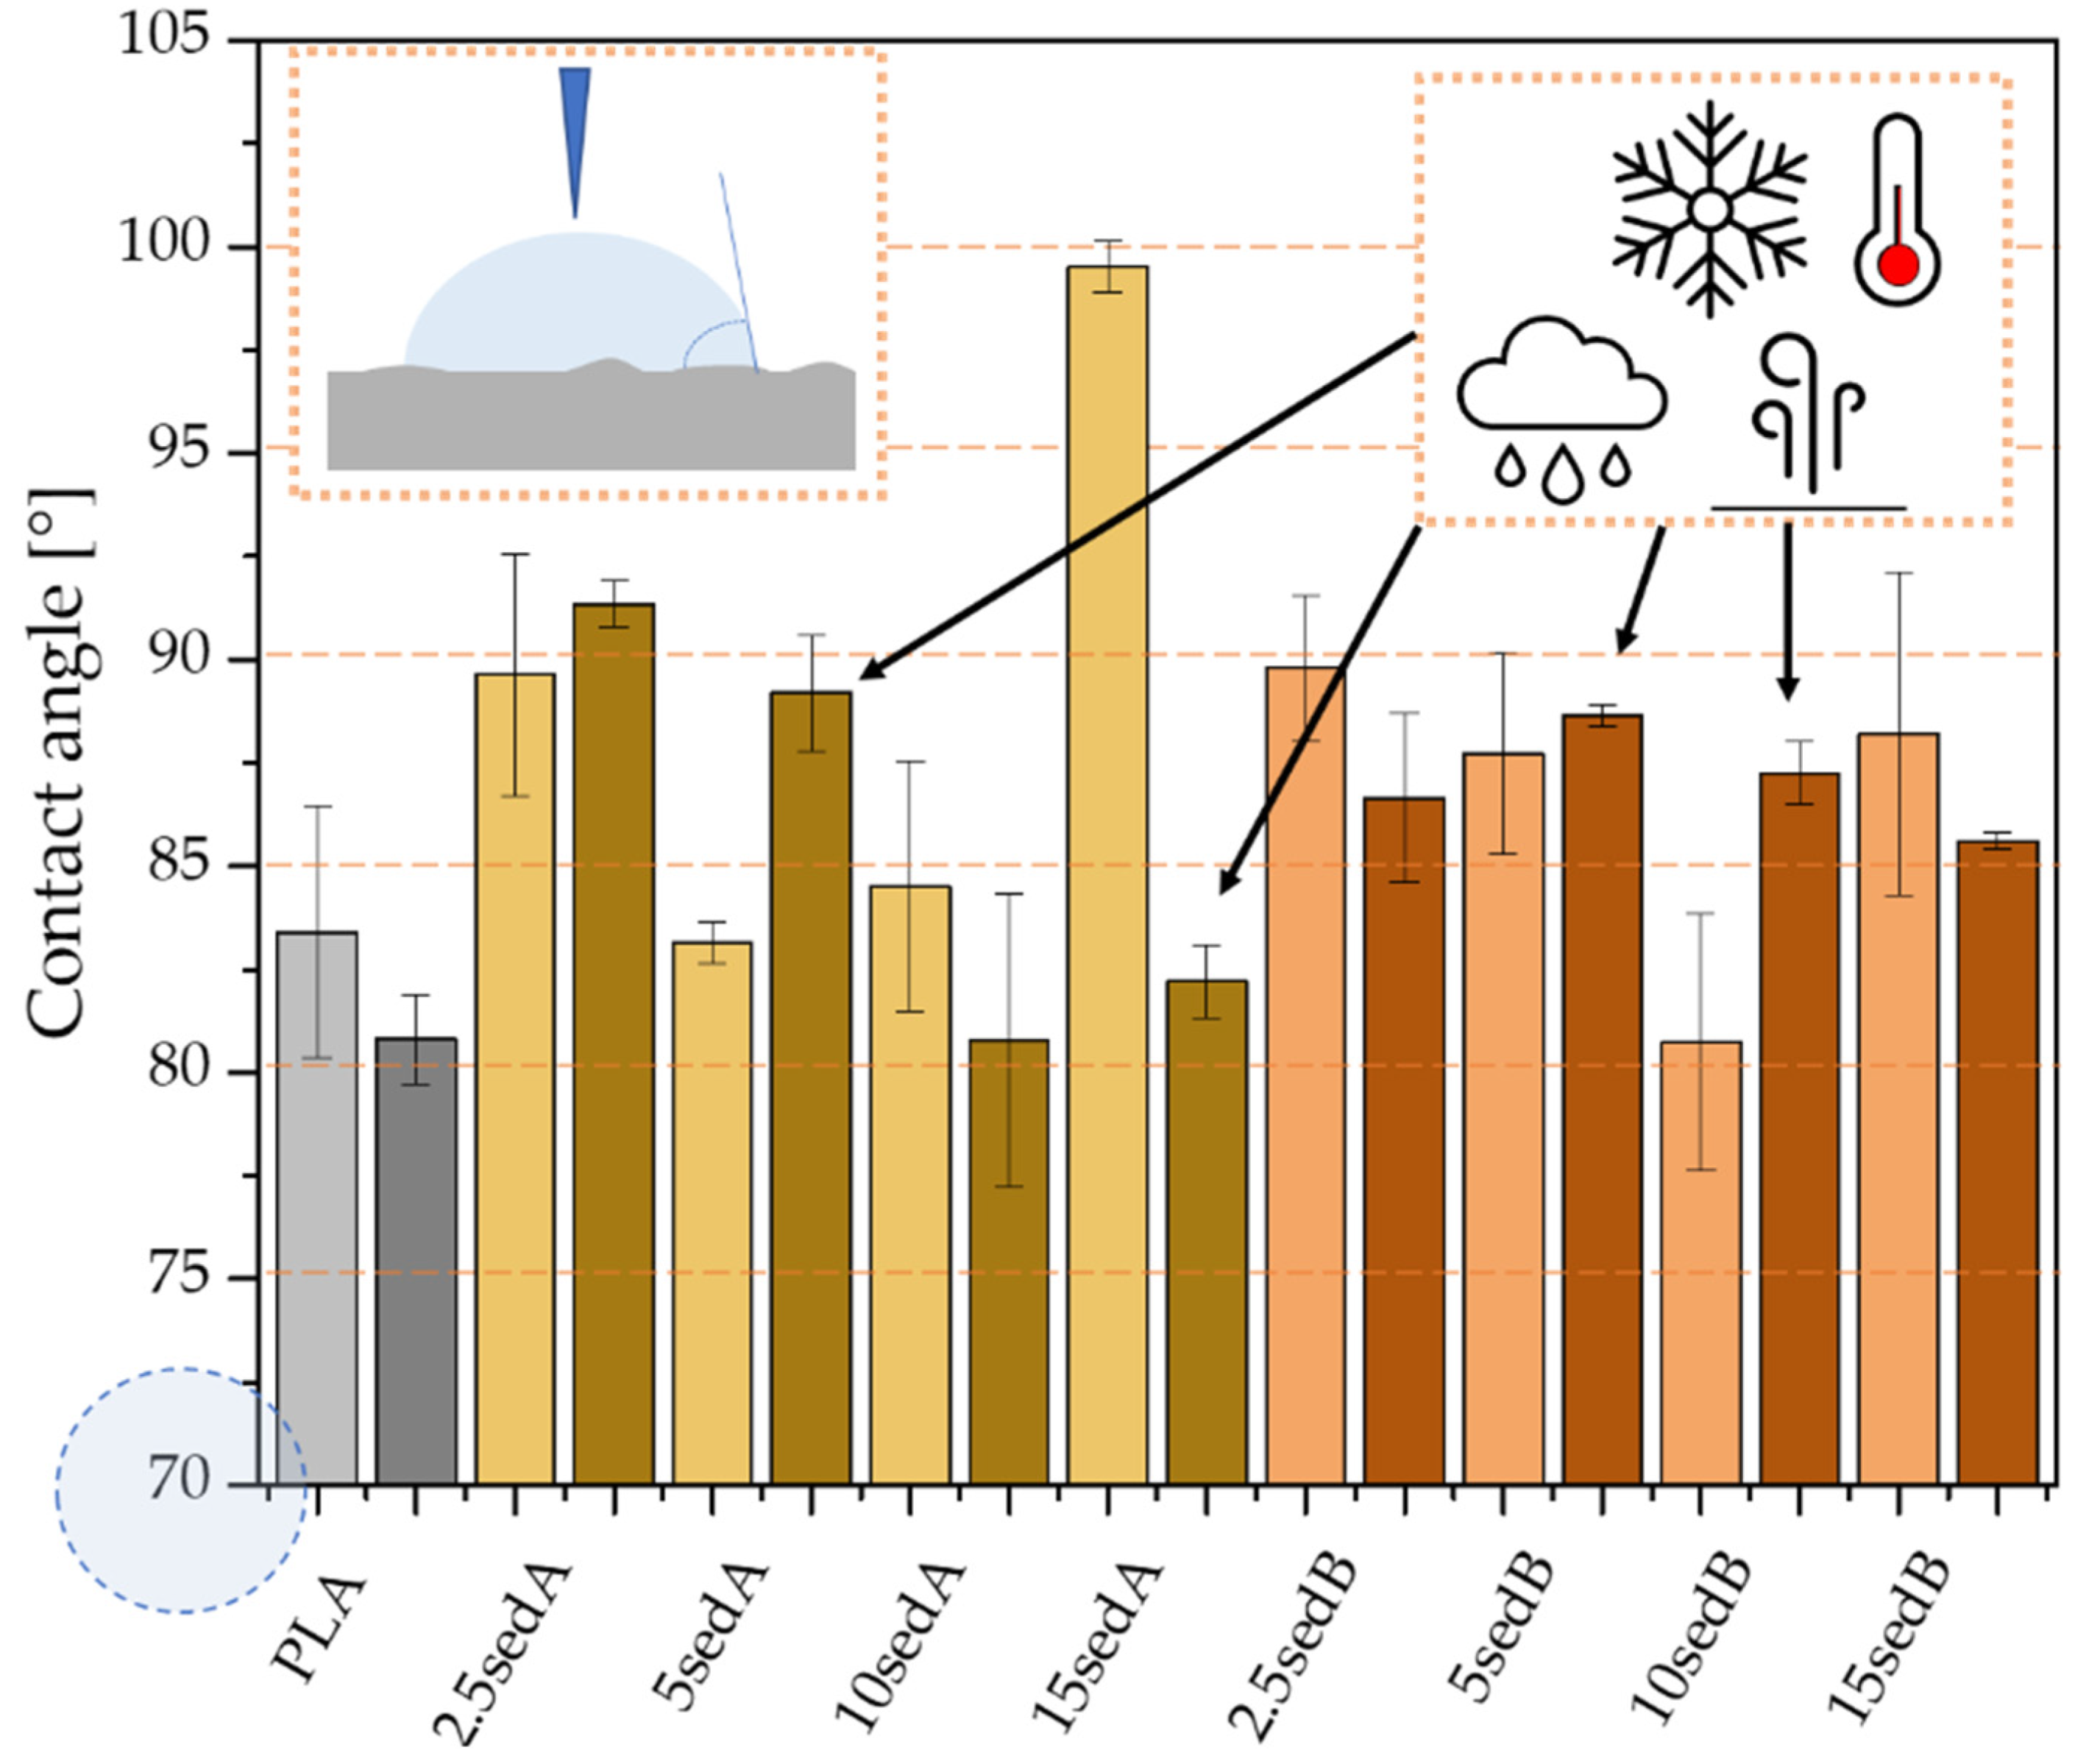
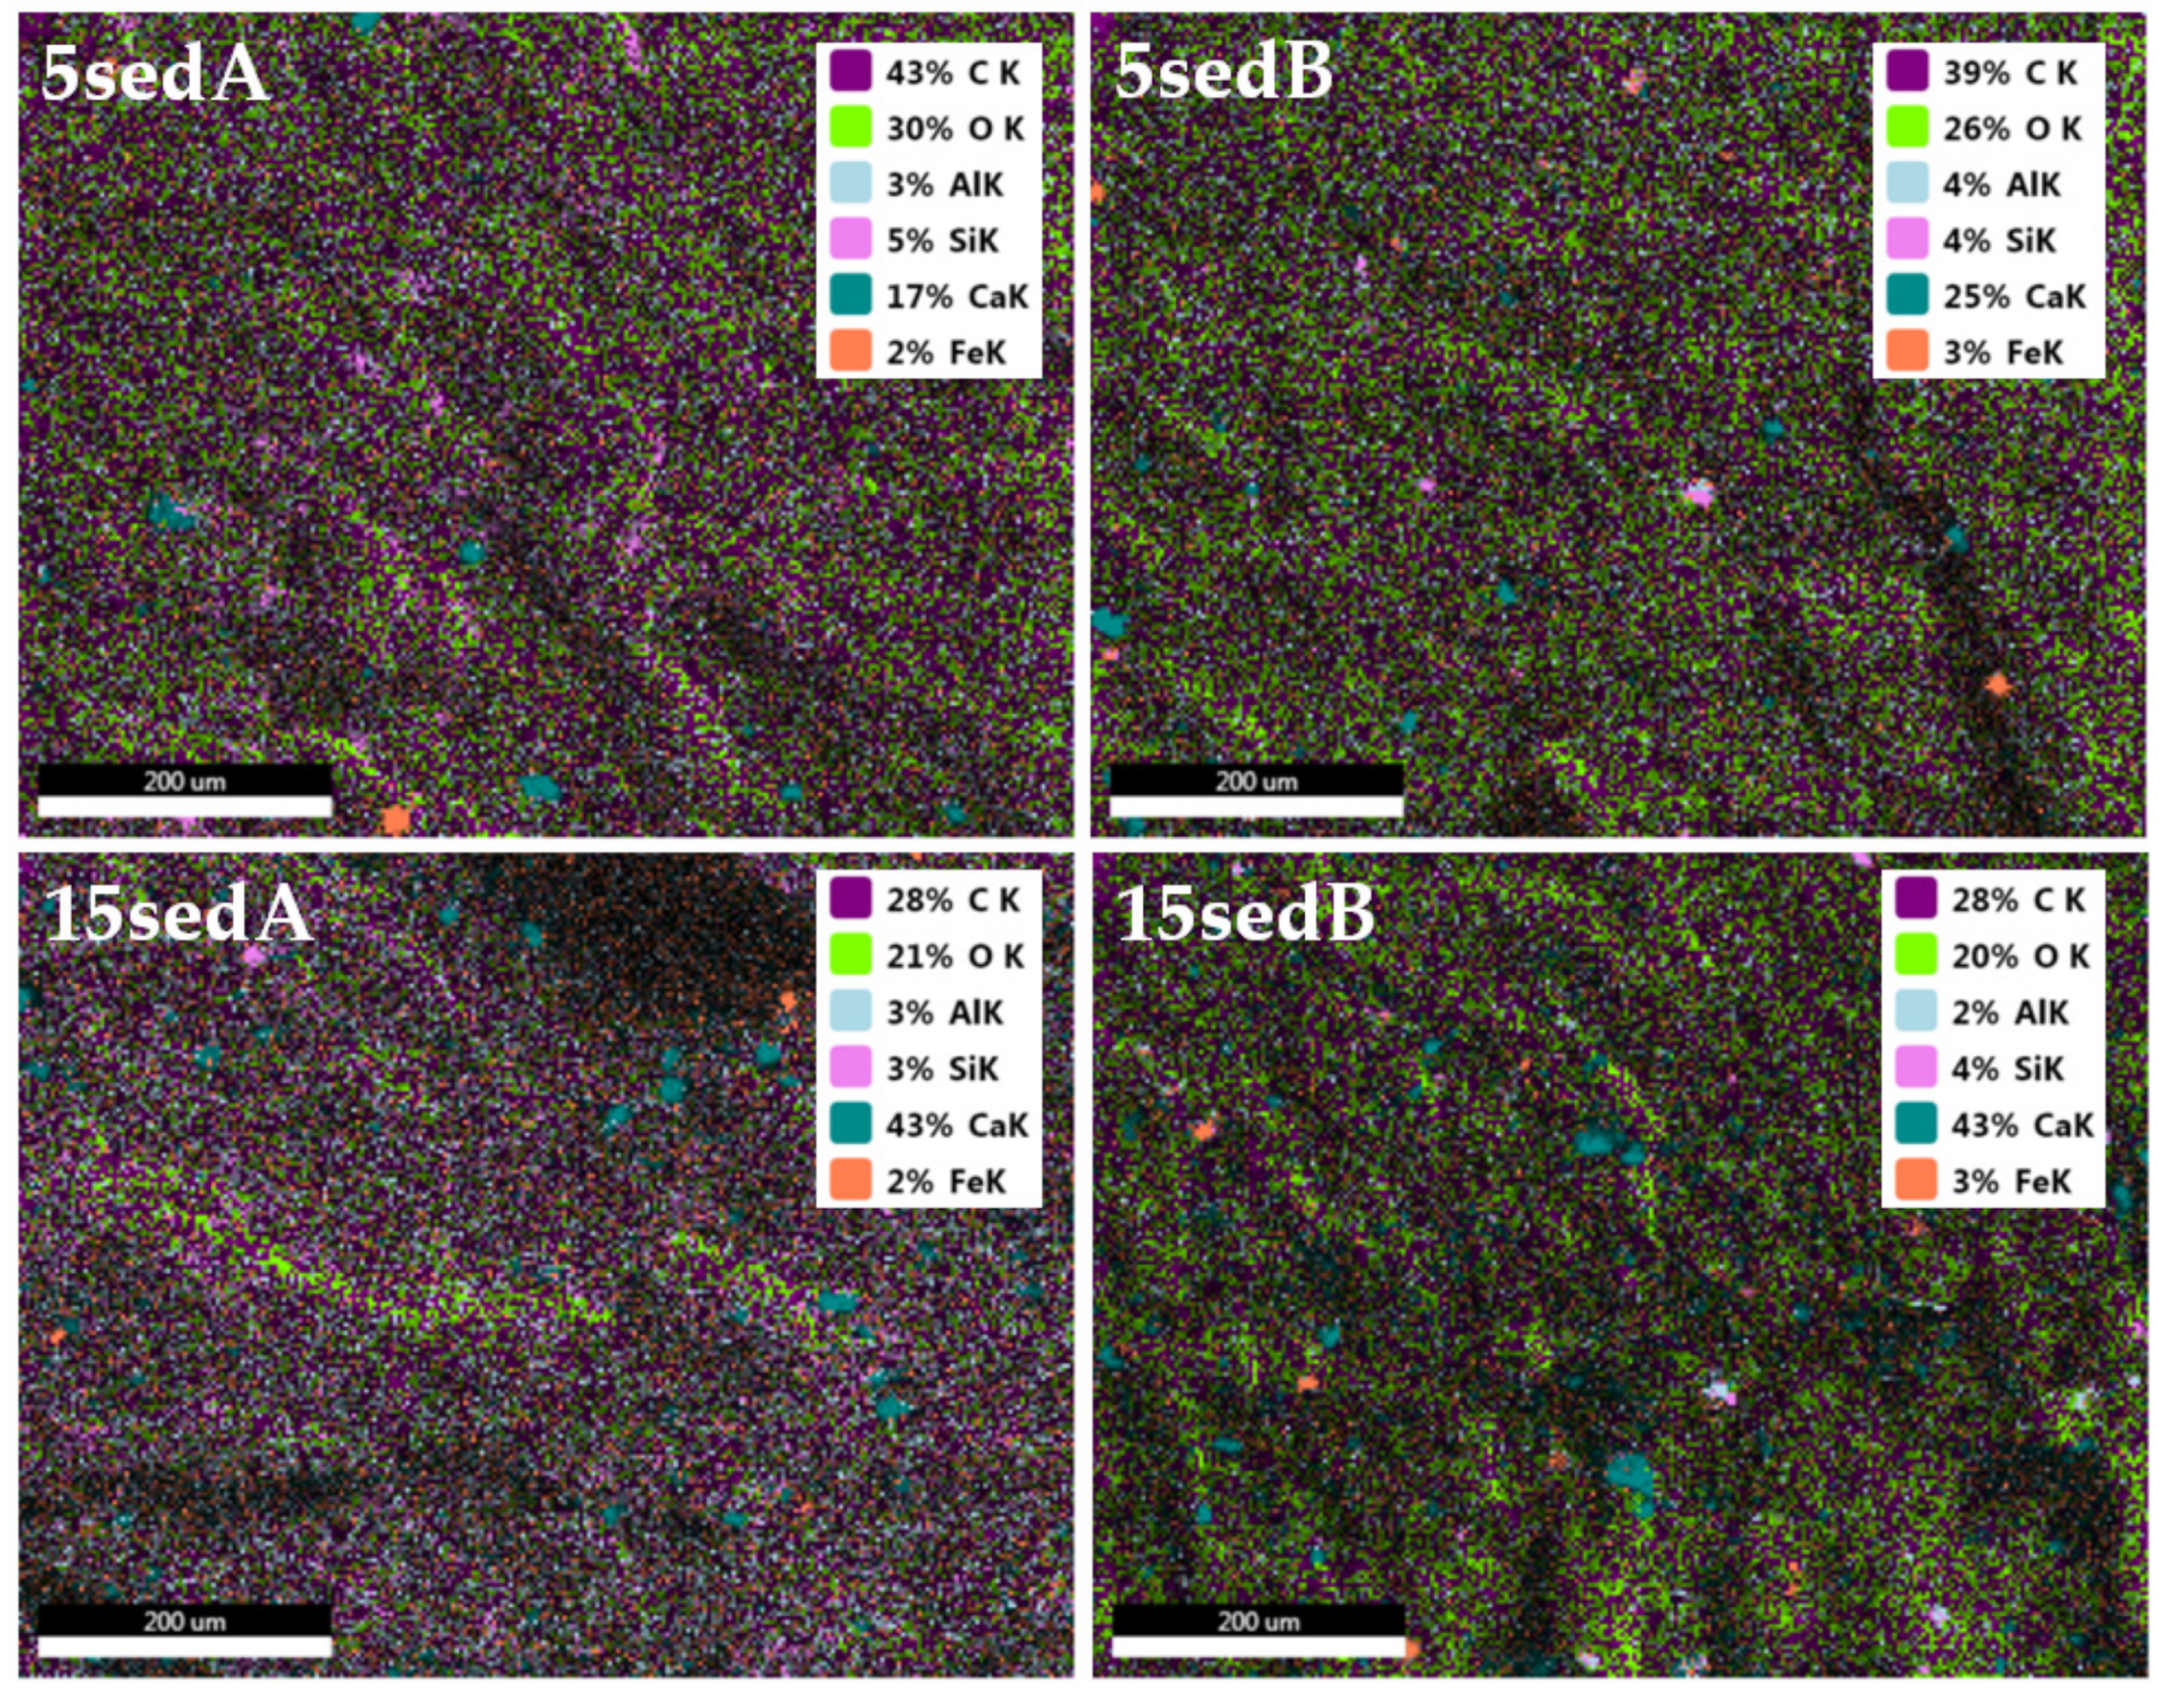
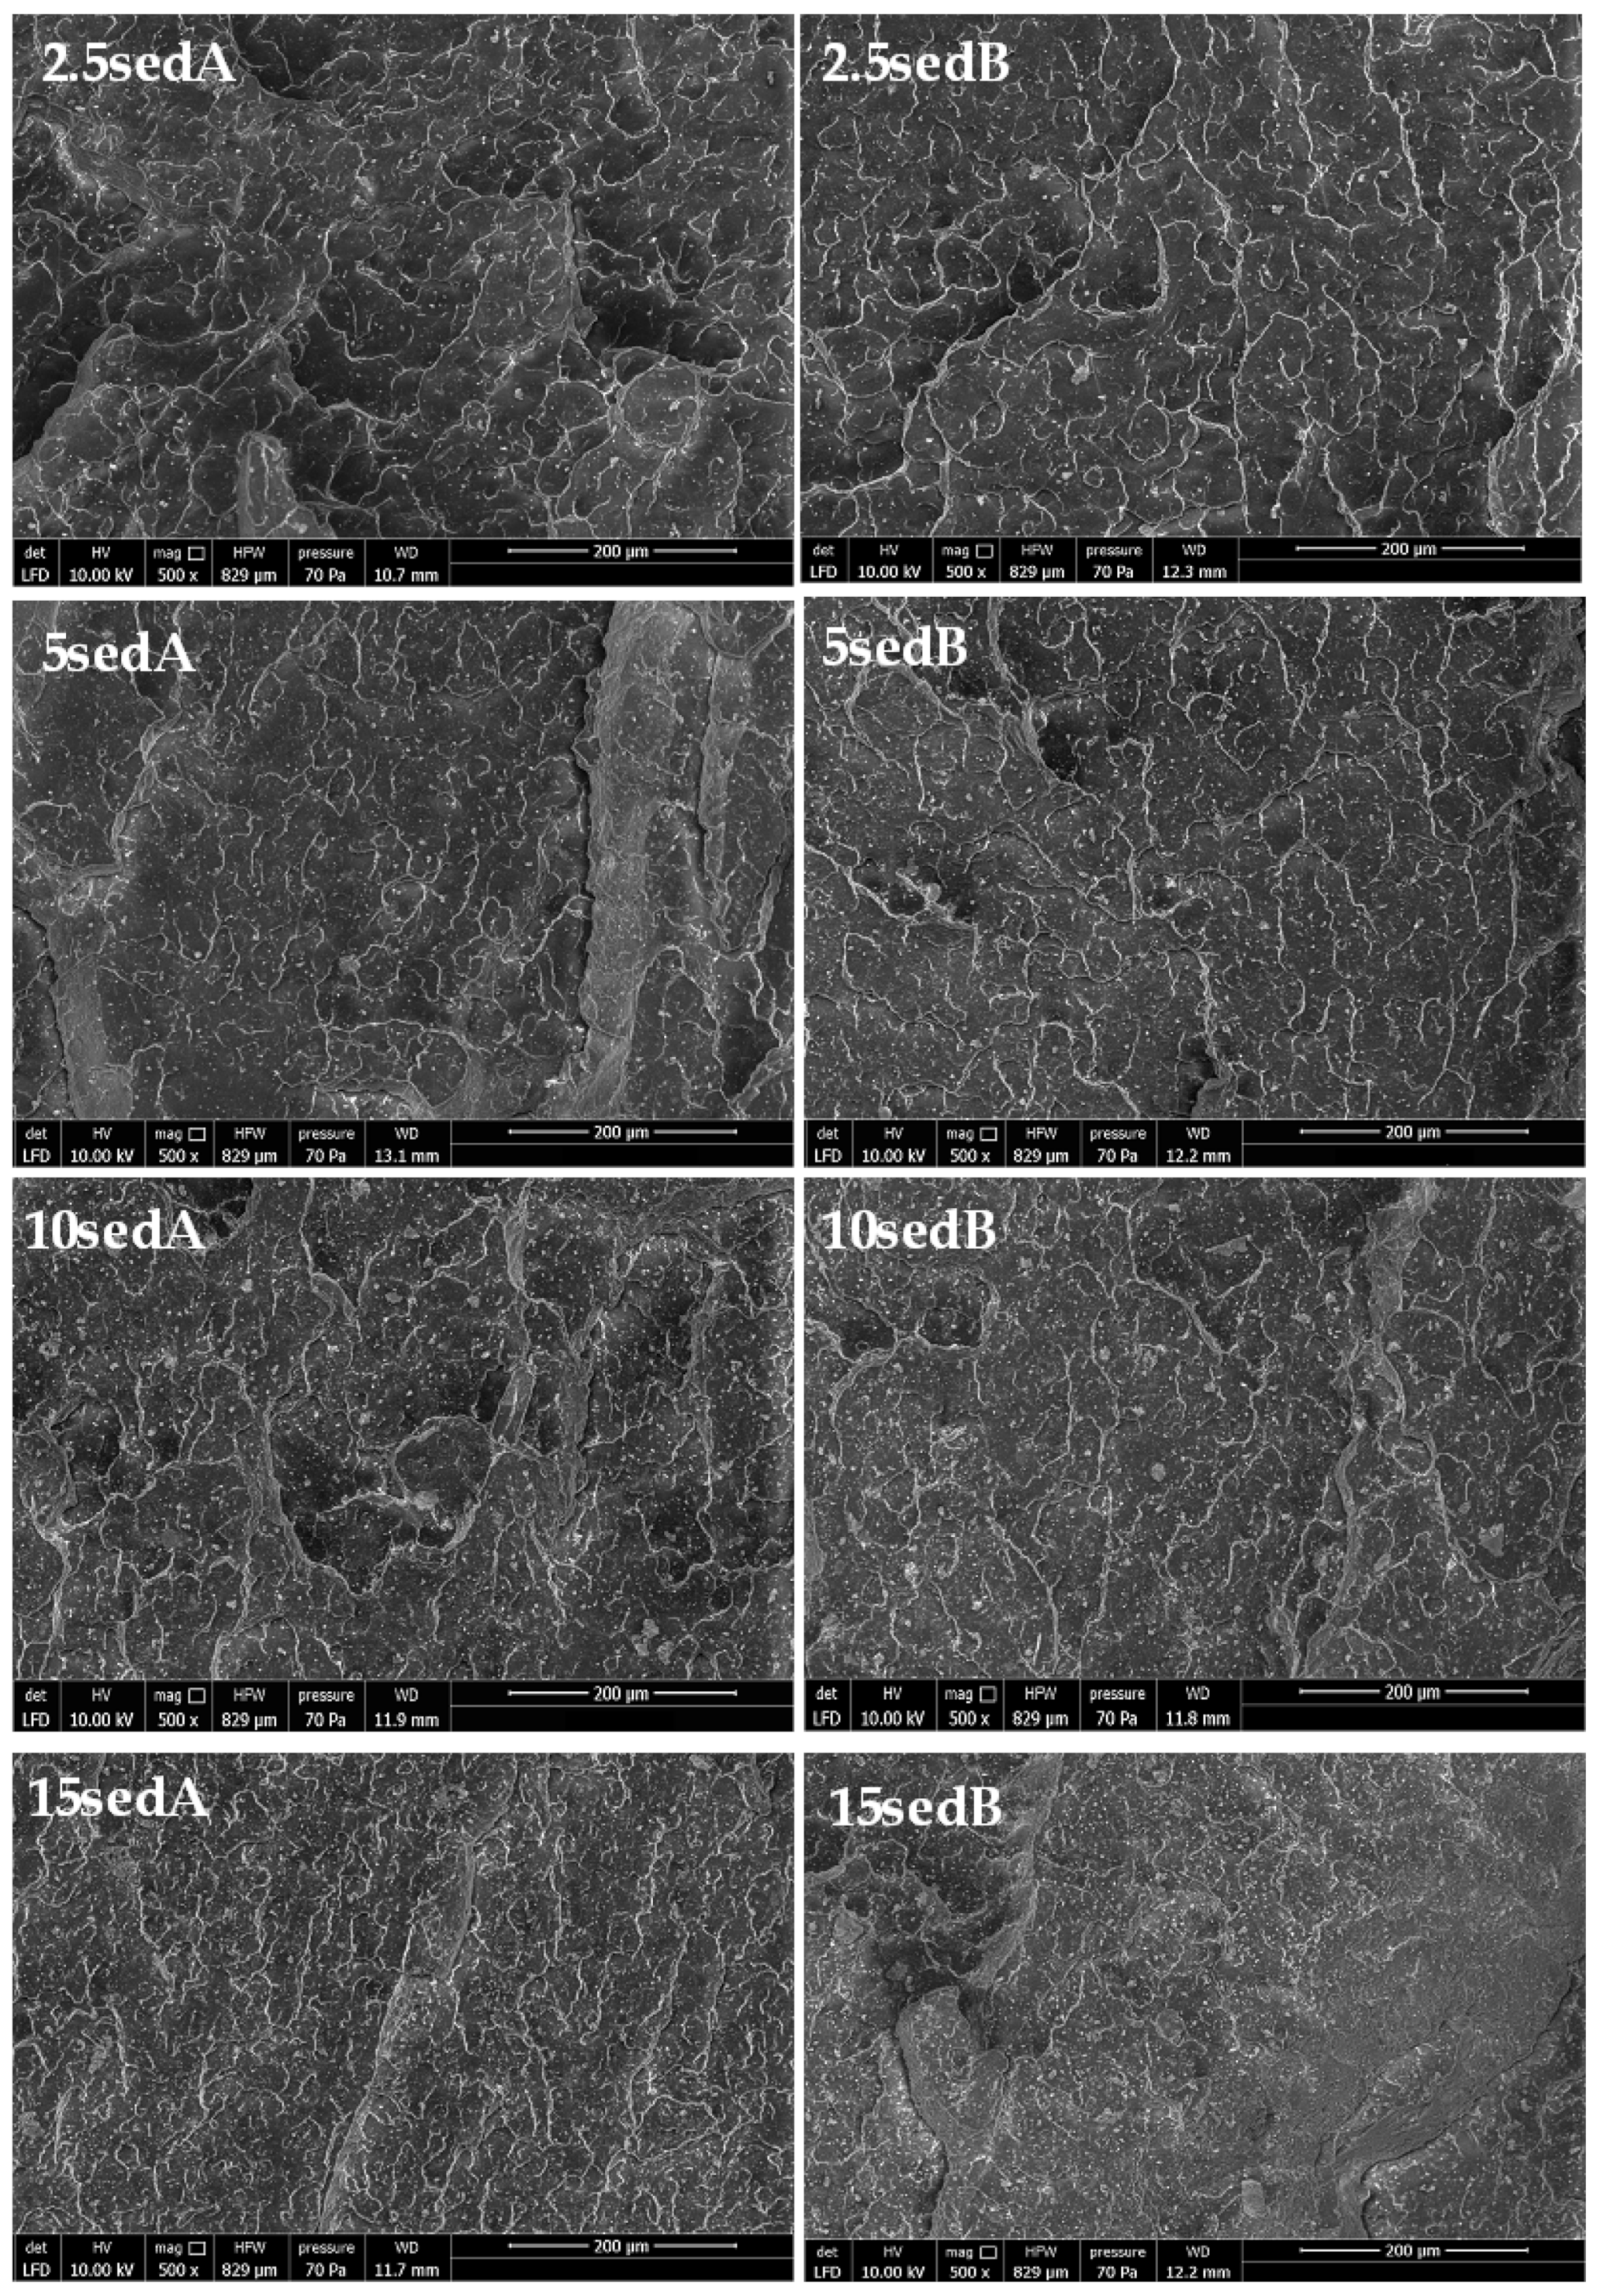
3.9. Composite Surface Characterisation
3.9.1. Composite Wettability Tests
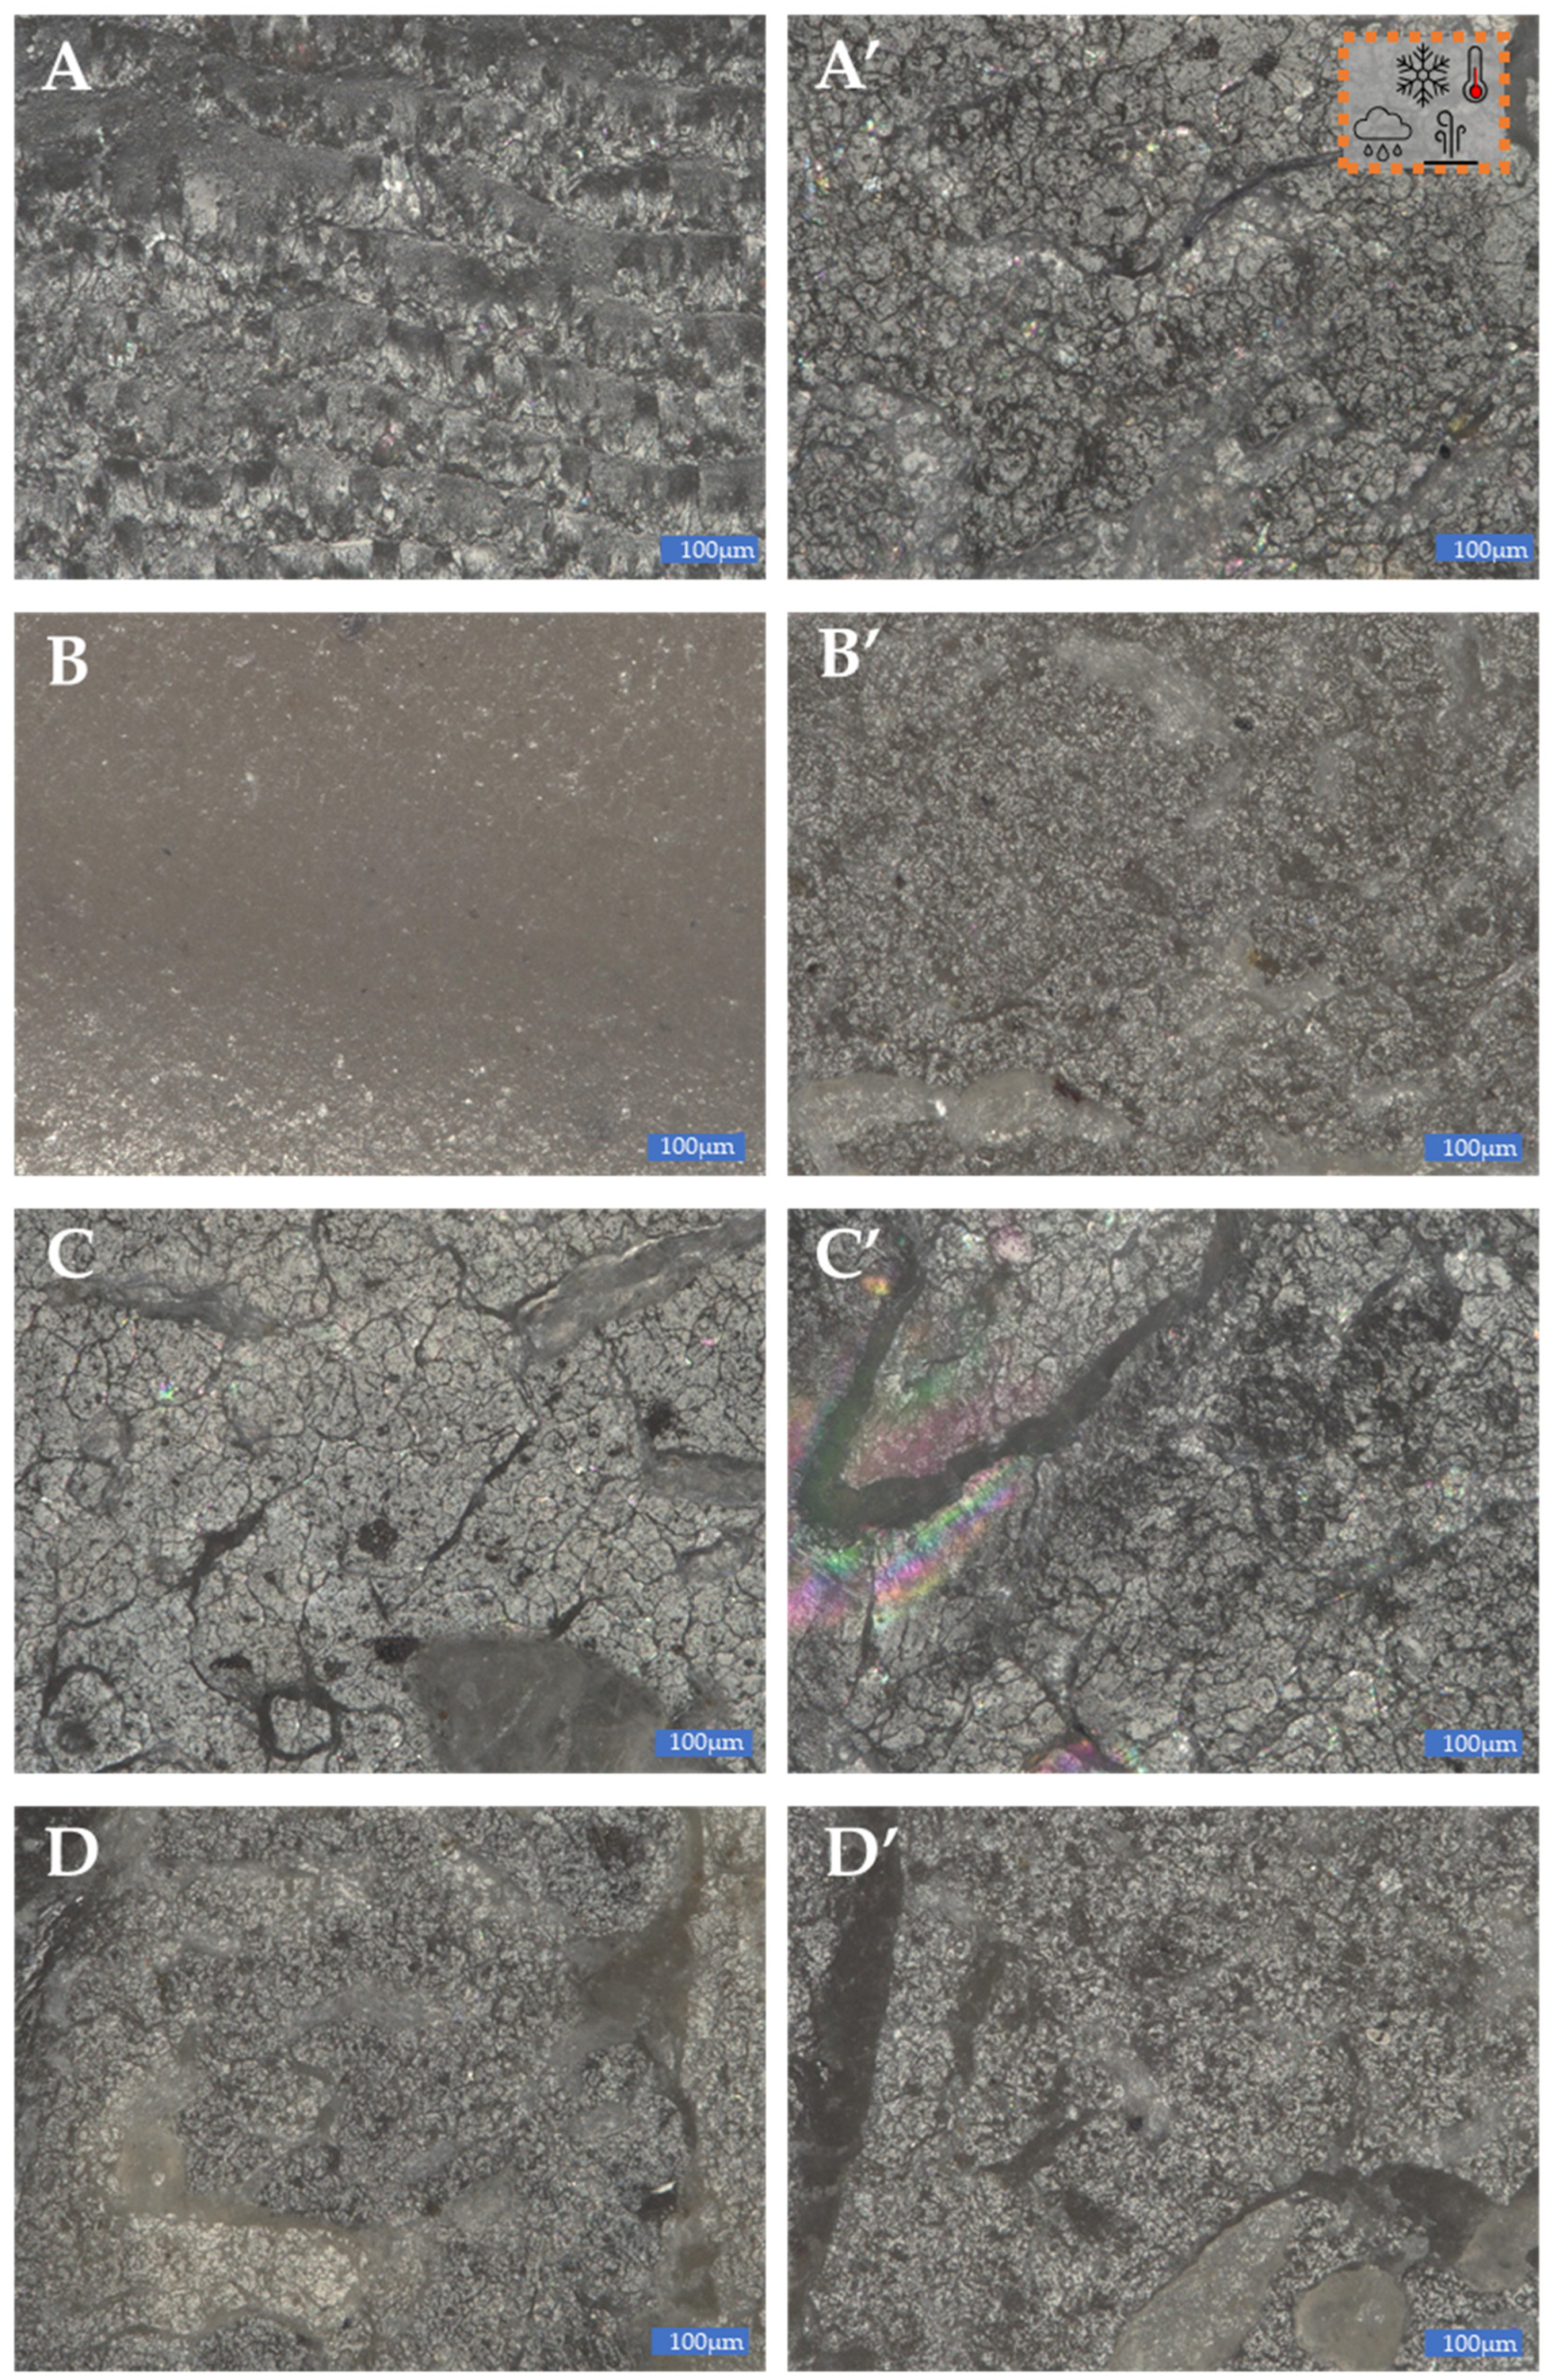
3.9.2. Microscopic Observations
4. Conclusions
Author Contributions
Funding
Institutional Review Board Statement
Informed Consent Statement
Data Availability Statement
Conflicts of Interest
References
- Tobolski, K. Vademecum Geobotanicum. In Przewodnik do Oznaczania torfów i Osadów Jeziornych; Wydawnictwo Naukowe PWN: Warszawa, Poland, 2000. [Google Scholar]
- Lange, W.; Borowiak, D. Metody Badań Fizycznolimnologicznych; Wydawnictwo Uniwersytetu Gdańskiego: Gdańsk, Poland, 1993; pp. 67–108. [Google Scholar]
- Kanbar, H.J.; Le, T.T.; Olajos, F.; Enguld, G.; Holmboe, M. Tracking mineral and geochemical characteristics of Holocene lake sediments: The case of Hotagen, west-central Sweden. J. Soils Sediments 2021, 21, 3150–3168. [Google Scholar] [CrossRef]
- Choiński, A. Wybrane Zagadnienia z Limnologii Fizycznej Polski; Wydawnictwo Naukowe UAM: Poznań, Poland, 1988; pp. 18–37. ISBN 9788370174545. [Google Scholar]
- Arockiam, J.; Subramanian, K.; Padmanabhan, R.G.; Selvaraj, R.; Bagal, D.K.; Rajesh, S. A review on PLA with different fillers used as a filament in 3D printing. Mater. Today Proc. 2022, 50, 2057–2064. [Google Scholar] [CrossRef]
- Dobrosielska, M.; Przekop, R.E.; Sztorch, B.; Brząkalski, D.; Zgłobnicka, I.; Łępicka, M.; Dobosz, R.; Kurzydłowski, K.J. Biogenic, Composite Filaments Based on Polylactide and Diatomaceous Earth for 3D Printing. Materials 2020, 13, 4632. [Google Scholar] [CrossRef] [PubMed]
- Dobrosielska, M.; Dobrucka, R.; Brząkalski, D.; Frydrych, M.; Kozera, P.; Wieczorek, M.; Jałbrzykowski, M.; Kurzydłowski, K.J.; Przekop, R.E. Influence of Diatomaceous Earth Particle Size on Mechanical Properties of PLA/Diatomaceous Earth Composites. Materials 2022, 15, 3607. [Google Scholar] [CrossRef]
- Platt, D.K. Rapra Technology Limited Biodegradable Polymers: Market Report; Smithers Rapra: Shrewsbury, UK, 2006; pp. 10–95. [Google Scholar]
- Henton, D.E.; Gruber, P.; Lunt, J.; Randall, J. Polylactic acid technology. Nat. Fibers Biopolym. Biocompos. 2005, 48674, 527–577. [Google Scholar]
- Murariu, M.; Da Silva Ferreira, A.; Degée, P.; Alexandre, M.; Dubois, P. Polylactide compositions. Part 1: Effect of filler content and size on mechanical properties of PLA/calcium sulfate composites. Polymer 2007, 48, 2613–2618. [Google Scholar] [CrossRef]
- Khalf, A.I.; Ward, A.A. Use of rice husks as potential filler in styrene butadiene rubber/linear low density polyethylene blends in the presence of maleic anhydride. Mater. Des. 2010, 31, 2414–2421. [Google Scholar] [CrossRef]
- Sam, S.T.; Nuradibah, M.A.; Ismail, H.; Noriman, N.Z.; Ragunathan, S. Recent Advances in Polyolefins/Natural Polymer Blends Used for Packaging Application. Polym. Plast. Technol. Eng. 2014, 53, 631–644. [Google Scholar] [CrossRef]
- Matsumoto, K.; Taguchi, S. Enzymatic and whole-cell synthesis of lactate containing polyesters: Toward the complete biological production of polylactate. Appl. Microbiol. Biotechnol. 2009, 85, 921–932. [Google Scholar] [CrossRef]
- Choi, S.Y.; Park, S.J.; Kim, W.J.; Yang, J.E.; Lee, H.; Shin, J.; Lee, S.Y. One-step fermentative production of poly(lactate-co-glycolate) from carbohydrates in Escherichia coli. Nat. Biotechnol. 2016, 34, 435–440. [Google Scholar] [CrossRef]
- Singhvi, M.S.; Zinjarde, S.S.; Gokhale, D.V. Polylactic acid: Synthesis and biomedical applications. J. Appl. Microbiol. 2019, 127, 1612–1626. [Google Scholar] [CrossRef] [PubMed] [Green Version]
- Chen, P.; Liang, X.; Xu, Y.; Zhou, Y.; Nie, W. Enhanced thermal and mechanical properties of PLA/MoS 2 nanocomposites synthesized via the in-situ ring-opening polymerization. Appl. Surf. Sci. 2018, 440, 1143–1149. [Google Scholar] [CrossRef]
- Zubir, N.H.M.; Sam, S.T.; Zulkepli, N.N.; Omar, M.F. The effect of rice straw particulate loading and polyethylene glycol as plasticizer on the properties of polylactic acid/polyhydroxybutyrate-valerate blends. Polym. Bull. 2018, 75, 61–76. [Google Scholar] [CrossRef]
- Obuchi, S.; Ogawa, S. Packaging and Other Commercial Applications. In Poly Lactic Acid; John Wiley & Sons, Inc.: Hoboken, NJ, USA, 2010; pp. 457–467. ISBN 9780470293669. [Google Scholar]
- Paul, M.A.; Alexandre, M.; Degée, P.; Henrist, C.; Rulmont, A.; Dubois, P. New nanocomposite materials based on plasticized poly (L-lactide) and organo-modified montmorillonites: Thermal and morphological study. Polymer 2002, 44, 443–450. [Google Scholar] [CrossRef]
- Pluta, M. Morphology and properties of polylactide modified by thermal treatment, filling with layered silicates and plasticization. Polymer 2004, 45, 8239–8251. [Google Scholar] [CrossRef]
- Murariu, M.; Bonnaud, L.; Yoann, P.; Fontaine, G.; Bourbigot, S.; Dubois, P. New trends in polylactide (PLA)-based materials: “Green” PLA-Calcium sulfate (nano)composites tailored with flame retardant properties. Polym. Degrad. Stab. 2010, 95, 374–381. [Google Scholar] [CrossRef]
- Bleach, N.C.; Nazhat, S.N.; Tanner, K.E.; Kellomäki, M.; Törmälä, P. Effect of filler content on mechanical and dynamic mechanical properties of particulate biphasic calcium phosphate-Polylactide composites. Biomaterials 2002, 23, 1579–1585. [Google Scholar] [CrossRef]
- Murariu, M.; Dechief, A.L.; Paint, Y.; Berlier, K.; Bonnaud, L.; Dubois, P. The “green” challenge: High performance PLA (nano) composites. JEC Compos. Mag. 2008, 45, 66–69. [Google Scholar]
- Solarski, S.; Ferreira, M.; Devaux, E.; Fontaine, G.; Bachelet, P.; Bourbigot, S.; Delobel, R.; Coszach, P.; Murariu, M.; Da Silva Ferreira, A.; et al. Designing polylactide/clay nanocomposites for textile applications: Effect of processing conditions, spinning, and characterization. J. Appl. Polym. Sci. 2008, 109, 841–851. [Google Scholar] [CrossRef]
- Tanase-Opedal, M.; Espinosa, E.; Rodríguez, A.; Chinga-Carrasco, G. Lignin: A Biopolymer from Forestry Biomass for Biocomposites and 3D Printing. Materials 2019, 12, 3006. [Google Scholar] [CrossRef]
- Rutkowski, J. Osady jezior w Polsce. Charakterystyka i stan rozpoznania, metodyka badań, propozycje. Studia Limnol. Telmatologica 2007, 1, 17–24. [Google Scholar]
- Saraya, M.E.S.I.; Hassan, H.; Rokbaa, A.L. Preparation of Vaterite Calcium Carbonate in the Form of Spherical Nano-size Particles with the Aid of Polycarboxylate Superplasticizer as a Capping Agent. J. Nanomater. 2016, 4, 44–51. [Google Scholar]
- Przekop, R.E.; Jakubowska, P.; Sztorch, B.; Kozera, R.; Dydek, K.; Jałbrzykowski, M.; Osiecki, T.; Marciniak, P.; Martyła, A.; Kloziński, A.; et al. Opoka-Sediment Rock as New Type of Hybrid Mineral Filler for Polymer Composites. Appl. Chem. 2021, 1, 90–110. [Google Scholar] [CrossRef]
- Karunadasa, K.S.P.; Manoratne, C.H.; Pitawala, H.M.T.G.A.; Rajapakse, R.M.G. Thermal decomposition of calcium carbonate (calcite polymorph) as examined by in-situ high-temperature X-ray powder diffraction. J. Phys. Chem. Solid. 2019, 134, 21–28. [Google Scholar] [CrossRef]
- Gug, J.; Sobkowicz, M.J. Effect of Catalyst on Compatibilization of Poly (lactic acid)/Polyamide Blends. Proceedings of Annual Technical Conference-ANTEC, Orlando, FL, USA, 23–25 March 2015. [Google Scholar]
- Silva, A.L.N.; Rocha, M.C.G.; Moraes, M.A.R.; Valente, C.A.R.; Coutinho, F.M.B. Mechanical and rheological properties of composites based on polyolefin and mineral additives. Polym. Test. 2002, 21, 57–60. [Google Scholar] [CrossRef]
- Chun, K.S.; Husseinsyah, S.; Osman, H. Mechanical and thermal properties of coconut shell powder filled polylactic acid biocomposites: Effects of the filler content and silane coupling agent. J. Polym Res. 2012, 19, 9859. [Google Scholar] [CrossRef]
- Nyambo, C.; Mohanty, A.K.; Misra, M. Polylactide-based renewable green composites from agricultural residues and their hybrids. Biomacromolecules 2010, 11, 1654–1660. [Google Scholar] [CrossRef]
- Fu, S.-Y.; Feng, X.-Q.; Lauke, B.; Mai, Y.-W. Effects of particle size, particle/matrix interface adhesion and particle loading on mechanical properties of particulate–polymer composites. Compos. Part B Eng. 2008, 39, 933–961. [Google Scholar] [CrossRef]
- Lee, S.-Y.; Kang, I.-A.; Doh, G.-H.; Yoon, H.-G.; Park, B.-D.; Wu, Q. Thermal and Mechanical Properties of Wood Flour/Talc-filled Polylactic Acid Composites: Effect of Filler Content and Coupling Treatment. J. Thermoplast. Compos. Mater. 2008, 21, 209–223. [Google Scholar] [CrossRef]
- Betancourt, N.G.; Cree, D.E. Mechanical Properties of Poly (lactic acid) Composites Reinforced with CaCO3 Eggshell Based Fillers. MRS Adv. 2017, 2, 2545–2550. [Google Scholar] [CrossRef]
- Barczewski, M.; Matykiewicz, D.; Krygier, A.; Andrzejewski, J.; Skórczewska, K. Characterization of poly (lactic acid) biocomposites filled with chestnut shell waste. J. Mater. Cycles Waste Manag. 2018, 20, 914–924. [Google Scholar]
- Koutsomitopoulou, A.F.; Bénézet, J.C.; Bergeret, A.; Papanicolaou, G.C. Preparation and characterization of olive pit powder as a filler to PLA-matrix bio-composites. Powder Technol. 2014, 255, 10–16. [Google Scholar] [CrossRef]


| Temperature [°C] | Nozzle | Zone 3 | Zone 2 | Zone 1 | Traverse |
| 190 | 195 | 200 | 185 | 40 | |
| Holding pressure | t [s] | 0.0 | 9.0 | ||
| P [bar] | 500 | 1500 | |||
| Closing Force [kN] | Holding Time [s] | Cooling Time [s] | Screw Diameter [mm] | ||
| 800 | 9 | 50 | 25 | ||
| Full Name | Short Name |
|---|---|
| PLA2003D | PLA |
| PLA + 2.5% sediment 3–8 m < 40 µm | 2.5sedA |
| PLA + 5% sediment 3–8 m < 40 µm | 5sedA |
| PLA + 10% sediment 3–8 m < 40 µm | 10sedA |
| PLA + 15% sediment 3–8 m < 40 µm | 15sedA |
| PLA + 2.5% sediment 8–12 m < 40 µm | 2.5sedB |
| PLA + 5% sediment 8–12 m < 40 µm | 5sedB |
| PLA + 10% sediment 8–12 m < 40 µm | 10sedB |
| PLA + 15% sediment 8–12 m < 40 µm | 15sedB |
| Wavenumber [cm−1] sedA | Wavenumber [cm−1] sedB |
|---|---|
| 1411 | 1411 |
| 1088 | 1088, 1029 |
| 864 | 864 |
| 705 | 705 |
| 1st Decomposition Stage | 2nd Decomposition Stage Residual Mass [%] | ||||||
|---|---|---|---|---|---|---|---|
| Sample Name | Onset 1 [°C] | Peak 1 [°C] | Mass Change 1 [%] | Onset 2 [°C] | Peak 2 [°C] | Mass Change 2 [%] | Residual Mass [%] |
| sedA | 254 | 302 | 5.6 | 681 | 731 | 45.5 | 48.9 |
| sedB | 250 | 304 | 5.6 | 686 | 736 | 44.9 | 49.4 |
Publisher’s Note: MDPI stays neutral with regard to jurisdictional claims in published maps and institutional affiliations. |
© 2022 by the authors. Licensee MDPI, Basel, Switzerland. This article is an open access article distributed under the terms and conditions of the Creative Commons Attribution (CC BY) license (https://creativecommons.org/licenses/by/4.0/).
Share and Cite
Borkowski, G.; Martyła, A.; Dobrosielska, M.; Marciniak, P.; Gabriel, E.; Głowacka, J.; Jałbrzykowski, M.; Pakuła, D.; Przekop, R.E. Carbonate Lake Sediments in the Plastics Processing-Preliminary Polylactide Composite Case Study: Mechanical and Structural Properties. Materials 2022, 15, 6106. https://doi.org/10.3390/ma15176106
Borkowski G, Martyła A, Dobrosielska M, Marciniak P, Gabriel E, Głowacka J, Jałbrzykowski M, Pakuła D, Przekop RE. Carbonate Lake Sediments in the Plastics Processing-Preliminary Polylactide Composite Case Study: Mechanical and Structural Properties. Materials. 2022; 15(17):6106. https://doi.org/10.3390/ma15176106
Chicago/Turabian StyleBorkowski, Grzegorz, Agnieszka Martyła, Marta Dobrosielska, Piotr Marciniak, Ewa Gabriel, Julia Głowacka, Marek Jałbrzykowski, Daria Pakuła, and Robert E. Przekop. 2022. "Carbonate Lake Sediments in the Plastics Processing-Preliminary Polylactide Composite Case Study: Mechanical and Structural Properties" Materials 15, no. 17: 6106. https://doi.org/10.3390/ma15176106