
Quantum Cutting in Ultraviolet B-Excited KY(CO3)2:Tb3+ Phosphors
1
School of Physics and Electronic Information, Huaibei Normal University, Huaibei 235000, China
2
Key Laboratory of Green and Precise Synthetic Chemistry and Applications, Ministry of Education, Huaibei 235000, China
*
Author to whom correspondence should be addressed.
Materials 2022, 15(17), 6160; https://doi.org/10.3390/ma15176160
Submission received: 5 August 2022
/
Revised: 29 August 2022
/
Accepted: 1 September 2022
/
Published: 5 September 2022
(This article belongs to the Special Issue Inorganic Luminescent Materials: Recent Years of Research and Application)
Abstract
:Highly efficient quantum cutting KY(CO3)2:Tb3+ phosphors excited by ultraviolet B (UVB) and ultraviolet C (UVC) were investigated. The structural and spectroscopic properties were characterized by XRD analysis and fluorescence spectrophotometry, respectively. The results showed that the monoclinic crystal structure of KY(CO3)2:Tb3+ remained in the Tb3+ doping range of 0~100%. In the excitation spectrum, two intense excitation peaks were observed in the ultraviolet range. Under the excitation of 283 nm, the maximum quantum efficiency of KY(CO3)2:0.7Tb3+ could reach 119%. However, the most efficient quantum cutting occurred at the 5K8 excited state in the cross-relaxation of 5K8 + 7F65D4 + 5D4. The Tb3+ content could be selected arbitrarily in the KY(CO3)2 host without any concentration quenching. Optimal quantum cutting concentrations of Tb3+ in KY(CO3)2 were 0.7 and 0.3 for the excitation of UVB and UVC, respectively. UVB-excited phosphors are more popular with high transparency in products such as glass or resin. A quick response code was fabricated by resin to show the hidden information clearly. Therefore, the highly efficient phosphor could be a candidate material for the application in information identification technology.
1. Introduction
Quantum cutting is the process of converting a single photon into two or more photons [1,2,3,4]. The quantum cutting efficiency is often larger than 100%. Vacuum ultraviolet and short-wave ultraviolet are often used as excitation sources for quantum cutting [5]. High-energy photons could excite ground-state electrons to higher excited-state energy levels, and the energy level of the intermediate excited state could be used as a bridge for the energy transfer to achieve multi-photon emission. As one of the rare-earth ions in visible light emission, Tb3+ has a large energy gap between the 5D4 excited state and the ground state for less influence on the multi-phonon relaxation [6]. The large proportion of green-light emissions from the 5D4 to 7F5 transition makes the 5D4 level of Tb3+ meet the requirement of efficient quantum cutting [1,7]. In efficient quantum cutting of Tb3+, the appropriate host environment and intermediate excited state are used to achieve energy level matching between two different or identical ions for energy transfer. In the research of single-ion quantum cutting of Tb3+, the quantum efficiencies of K2YF5:Tb3+ [1], Ca9Y(PO4)7:Tb3+ [8], and Ba9Lu2Si6O24:Tb3+ [9] excited at 245, 222, and 251 nm were 121.3%, 157.2%, and 144%, respectively. In the level matching, the 5D4 energy level of Tb3+ was directly used as an intermediate excited state to transfer the excited-state electrons [8]. If both 5D3 and 5D4 excited states of Tb3+ participate in the 7FJ (J = 6, 5, 4, 3) luminescence emission at the same time, there is an emission competition between the two excited levels [7], and the emission efficiency of 5D4 level in the visible region is reduced. On the other hand, energy transfer can also be realized with the aid of other ions for a suitable level matching. In the CeO2:Tb3+/Yb3+ [10], BaGdF5:Tb3+ [11], and NaGdF4:Ho3+/Yb3+ [2] materials, Yb3+and Gd3+ could be used as an energy transfer bridge to achieve quantum cutting efficiency of 164, 177, and 179.8%, respectively. To sum up, the direct energy transfer processes, an appropriate host, and energy level matching are necessary key conditions to achieve high efficiency of quantum cutting in luminescence materials.
In Stokes emission, most excitation wavelengths of quantum cutting are located in the short-wave or vacuum ultraviolet regions for visible light emission, such as 142 nm [12], 222 nm [13], and 251 nm [9]. However, there are few reports on quantum cutting excited by middle-wave ultraviolet light due to the limitation of exciting photon energy and the lack of matching energy levels. Middle-wave ultraviolet light has relatively good penetrability in air, resin, or glass. If the quantum cutting phosphor excited by ultraviolet B is developed, the application of phosphor in lamps, decoration, and anti-counterfeiting could be greatly improved and expanded [1]. We studied the luminescent spectra of Tb3+ in KTb(CO3)2 system in detail [14]. The larger excitation intensities exist in the ultraviolet B–excited spectrum, which has a potential application in quantum cutting for efficient luminescence. Compared with Tb, the rare-earth Y has a relatively cheaper price, which has a similar ionic radius and the zero electron of 4f configuration [15,16]. It is possible for Y3+ to completely substitute Tb3+ in KTb(CO3)2 as a luminescent host. In the luminescent emission of Tb3+-doped KY(CO3)2, the energy of the exciting photons could be further reduced by the emission transitions of the excited electrons to the lower 5D4 excited state. In this contribution, quantum cutting, spectral characterizations, and decay time of Tb3+-doped KY(CO3)2 were investigated in short- and middle-wave ultraviolet ranges.
2. Materials and Methods
KY1−x(CO3)2:xTb3+ (KYC:xTb3+) phosphors were synthesized by the hydrothermal method [14]. The raw materials of Tb(NO3)3·6H2O (99.99%) and Y(NO3)3·6H2O (99.99%) were bought from the Shanghai xianding Biotechnology Co., Ltd. (Shanghai, China). First, (1 − x) mmol Y(NO3)3·6H2O and x mmol Tb(NO3)3·6H2O were dissolved into 3 mL of deionized water for the mixture solution. Then, the mixture was added dropwise to the 25 mL K2CO3 solution (0.55 mol/L) under vigorous stirring. The pH value of the mixed solution was adjusted to 9.5 by the dilute nitric acid. The final solution was transferred to the 50 mL Teflon autoclave, which was reacted at 200 °C for 8 h with a heating rate of 5 °C/min. Deionized water and ethanol were used to wash the precipitate. The phosphor was prepared after drying at 60 °C for 40 min in the air.
A quick response code (QR code) was prepared by the epoxy resin and phosphor. First, the phosphor could be dispersed well in epoxy resin by stirring. After the two substances were fully mixed, the mold was used to fabricate the desired object under heating at 100 °C for 60 min in the air.
The crystal structures were analyzed by the X-ray powder diffraction in the range of 10–70° (PANalytical, Almelo, The Netherlands). The morphologies and energy dispersive spectrum (EDS) were imaged with a cold field emission scanning electron microscopy (Regulus 8220, Hitachi High-Tech Co., Tokyo, Japan). The excitation spectra and emission spectra were measured by a FLS920 fluorescence spectrophotometer (Edinburgh Instruments, Livingston, UK) with the excitation of 450 W Xe-lamp. Using BaSO4 as a reference, the absolute quantum efficiency (QE) was measured by the integrating sphere within the FLS920 sample chamber in a direct and indirect method. The decay curves were tested with the use of the 60 W microsecond flashlamp (Edinburgh Instruments, Livingston, UK).
3. Results and Discussion
3.1. Crystal Structures
Figure 1 shows the X-ray diffraction patterns of KYC:xTb3+ samples. When x increased from 0 to 1, the diffraction peaks of KYC:xTb3+ were consistent with that of monoclinic KDy(CO3)2 (JCPDS:1-88-1423) [17]. There were no foreign diffraction peaks, and it indicated that Tb3+-doped KYC is a pure monoclinic phase. In the KYC lattice, Tb3+ and Y3+ with similar ion radii could be substituted for each other in any proportion. On the right side of Figure 1, when x = 0, the value of KYC diffraction angle at (002) was larger than that of KDy(CO3)2 because the radius of Y3+ (1.019 Å) was smaller than Dy3+ (1.027 Å) [16]. As x increased, the diffraction peak corresponding to the (002) crystal plane was shifted toward a small angle. Therefore, the variation of cell parameters indicated that the environment of Tb3+ is modified slightly in the KYC lattice.
3.2. Morphologies and Element Analysis
The morphologies of KYC:xTb3+ at different x values are shown in Figure 2. When x value was 0.01, the phosphor exhibited as a single monoclinic particle with a size of 40–60 μm in Figure 2a. With the increase in Tb3+ ion concentration, the growth rate of the nucleus was obviously accelerated. Small monoclinic crystal particles aggregated with each other to form a large particle (Figure 2b–d). When the x further increased to 0.7 and 1, individual grains grew larger and easily fractured into small pieces (Figure 2e–f). A small area was selected from Figure 2d, and energy dispersive spectroscopy of Figure 2g was taken to demonstrate the existence of K, Y, Tb, and O elements in Figure 2h–l. From the element distribution maps, K, Y, and Tb ions were well-dispersed in KYC:0.5Tb3+. The relative elemental composition was close to the original stoichiometric ratio.
3.3. Luminescence Spectra
Figure 3 shows the luminescence spectra of KYC:xTb3+. From the excitation spectra presented in Figure 3a, the whole excitation spectrum of Tb3+ was mainly composed of 4f8–4f75d1 transition in the range of 200–300 nm and 4f8–4f8 transition in the range of 300–390 nm [3,18,19]. In the f–d transition, there were mainly two strong excitation peaks at 245 and 283 nm, corresponding to the transition from the 7F6 ground state to 7DJ and 9DJ levels [9], respectively. When the Tb3+ ion doping concentration is low, the excitation intensity corresponding to 7DJ is much greater than 9DJ because 7DJ transition is spin-allowed and 9DJ transition is spin-prohibited [9]. As the doped concentration of Tb3+ increases, the relative exciting intensity of 7D/9DJ is decreased due to the sensitive f-d transition in the variation of KYC:Tb3+ crystal field [20]. When the concentration of Tb3+ ion was greater than 10%, the 9DJ forbidden transition of Tb3+ was gradually abolished. The intensity of the excitation peak at 283 nm increased significantly in KYC:Tb3+, and it indicated that ultraviolet B could be used for efficient excitation. Compared with ultraviolet C and vacuum ultraviolet, ultraviolet B has higher transmittance in glass, resin, and polymer materials. The longer-wavelength UV light is more suitable for the excitation of luminescence emission of KYC:Tb3+ in the luminescent products.
Low doping concentration is convenient to characterize the transition process of a single excited-state electron between different levels. Figure 3b shows the emission spectra of Tb3+-doped KYC at x = 0.001. From the spectra, the intense emission peaks were mainly located in the range of 480–640 nm over the whole spectrum for the exciting wavelength of 245 and 283 nm, corresponding to the transition of 5D4–7FJ, respectively [21]. In the literature, it can be often found that there is a competitive emission between 5D3 and 5D4 of Tb3+ at low concentrations during the de-population process of the excited electron state [11]. A larger emission region reduces the proportion of green-light emission intensity [22]. When 283 nm was adopted as the excitation wavelength, only two emission bands were located at 376 and 543 nm. Two different emissions indicate that the electrons in the highest excited state are decayed to the ground state through at least two intermediate excited states. When 351 nm was used as the excitation wavelength, these two kinds of emission bands could also be observed. As it is shown in Figures S1 and S2, the broadband emission peak intensity at 376 nm gradually decreased with the increase in Tb3+ doping concentration. When 376 nm was directly used as the excitation wavelength, the excited-state electron could relax to 5D4 level to achieve luminescence emission. A suitable crystal lattice environment is also a key factor for the intense emission [23]. Therefore, in the KYC host, especially for excitation at 245 nm of Tb3+, there is no competitive emission between 5D3 and 5D4 levels, and the high efficiency of Tb3+ in the KYC host has more advantage in green-light emission than that of other hosts, owing to the single and direct energy transfer level of 5D4.
As is shown in Figure 3c, the emission intensity of the green light at 543 nm was increased rapidly with the increase in Tb3+-doped concentration in KYC. When x was larger than 0.3, the increase rate of 543 nm emission intensity was slowed down. When we used 351 nm as the excitation wavelength, the luminescence was similar to that of 283 nm excitation, but the emission intensity was slightly lower, which was about 50% of that of 283 nm under the same conditions in Figure 3d. The emission intensity was more intense under the 283 nm excitation than under 351 nm due to the larger excitation intensity in Figure 3a excitation spectra. Meanwhile, we also found that KYC:1Tb, where Tb3+ was completely substituted for Y3+, could emit strong green light without any concentration quenching [14].
3.4. Energy Level Diagram
Figure 4 gives a schematic diagram of the electron transition on the excited-state energy level of Tb3+. As can be seen from the diagram, electrons at the 7F6 level were excited to the 5K8 level by the 245 nm excitation light. The energy levels 5K8, 5F4, 5D4, 7F0, and 7F6 of Tb3+ were at 40,749, 35,380, 20,545, 5703, and 74 cm−1, respectively [24]. The 5K8→5D4 energy gap of 20204 cm−1 was similar to that of 7F6→5D4 (20471 cm−1). The excited-state electrons could transfer energy directly to the 5D4 level by the cross-relation: 5K8 + 7F6→5D4 + 5D4 (process 1), and then, the two excited-state electrons transferred back to the 7FJ (J=6, 5, 4, 3) for the quantum cutting emission at 493, 543, 583, and 623 nm, respectively. Under the excitation at 283 nm, the ground-state electrons of 7F6 were excited to the 5F4 level [1]. Then, the excited-state electrons returned to the two lower excited states 5G6 and 5D4. A proportion of excited-state electrons could transfer in a way of 5F4 and 5G6 to 7FJ with a board emission (360–420 nm), which is clearly shown in Figure 3b. It is worthwhile to note that the energy gaps were almost the same between 5F4→5D4 (14835 cm−1) and 7F0→5D4 (14842 cm−1). The other proportions of excited-state electrons could more easily return to 5D4 with the cross-relation: 5F4 + 7F0→5D4 + 5D4 (process 2). Finally, two excited-state electrons of 5D4 transferred to 7FJ in a quantum cutting emission. Under the excitation of 351 nm, the excited electrons at the 5L9 level could return to the 5G6 level through vibration relaxation and then transfer to 7FJ with the board emission, which is shown in Figure 3b. The other electrons returned to 5D4 with the cross-relation between 5G6→5D4 and 7F6→7F0, and the visible light could be emitted for the transition from 5D4 to 7FJ, which was the same as the excitation process of 376 nm.
Table 1 shows the quantum efficiency (QE) of KYC:xTb3+ excited at 245, 284, and 351 nm. Since the Xenon lamp has low emission intensity below 250 nm [8], the QE values were measured under the fixed excitation at 245 nm for the Tb3+ spin-allowed transition. From the tendency of value variation, the QEs increased rapidly with the increase in Tb3+ doping concentration. The higher QE was due to simple and direct transition processes between 5G6 and 5D4, which were the most efficient energy transfer processes. When 283 nm was used as an exciting wavelength, the quantum efficiency reached 109% at x = 0.3. As the doping concentration continued to increase, the increasing rate of quantum efficiency became slower. The maximum value was 119% for KYC:0.7Tb3+. Under the excitation of 351 nm, the QE value could increase with the increase in the Tb3+ concentration. From the analysis of QE value, it was concluded that KYC, in comparison with phosphate [8], silicate [9], and fluoride [11], could emit green light with high efficiency by Tb3+ doping. In addition, we will further adopt different preparation methods to control the morphology of samples for better luminescence performance in the future [25,26].
3.5. Decay Curves
Figure 5a shows the luminescence decay curves at different Tb3+ concentrations in KYC:xTb3+. As can be seen from the figure, the decay curves for different concentrations of KYC:xTb3+ could be single exponential for the emission process. It was indicated that the excitation electrons of 5D4 state have a longer lifetime than those of the 5K8 level. As the doping level increased, the cross-relaxation between the two Tb3+ became more intense, and the excited-state electrons decayed faster. The variation in lifetime as a function of x is shown in Figure 5b. It is seen that the lifetime of 543 nm green light decreased with the increase in Tb3+ content. The variation in lifetime was small when x was less than 0.1. When x was increased, the green emission lifetime at 543 nm decreased rapidly, which indicated that there is a faster energy migration process between the two Tb3+ ions in the crystal lattice of KYC. The fast migration process of excited-state electrons enables KYC:Tb3+ to be an efficient green-light-emitting phosphor.
4. Quick Response Code
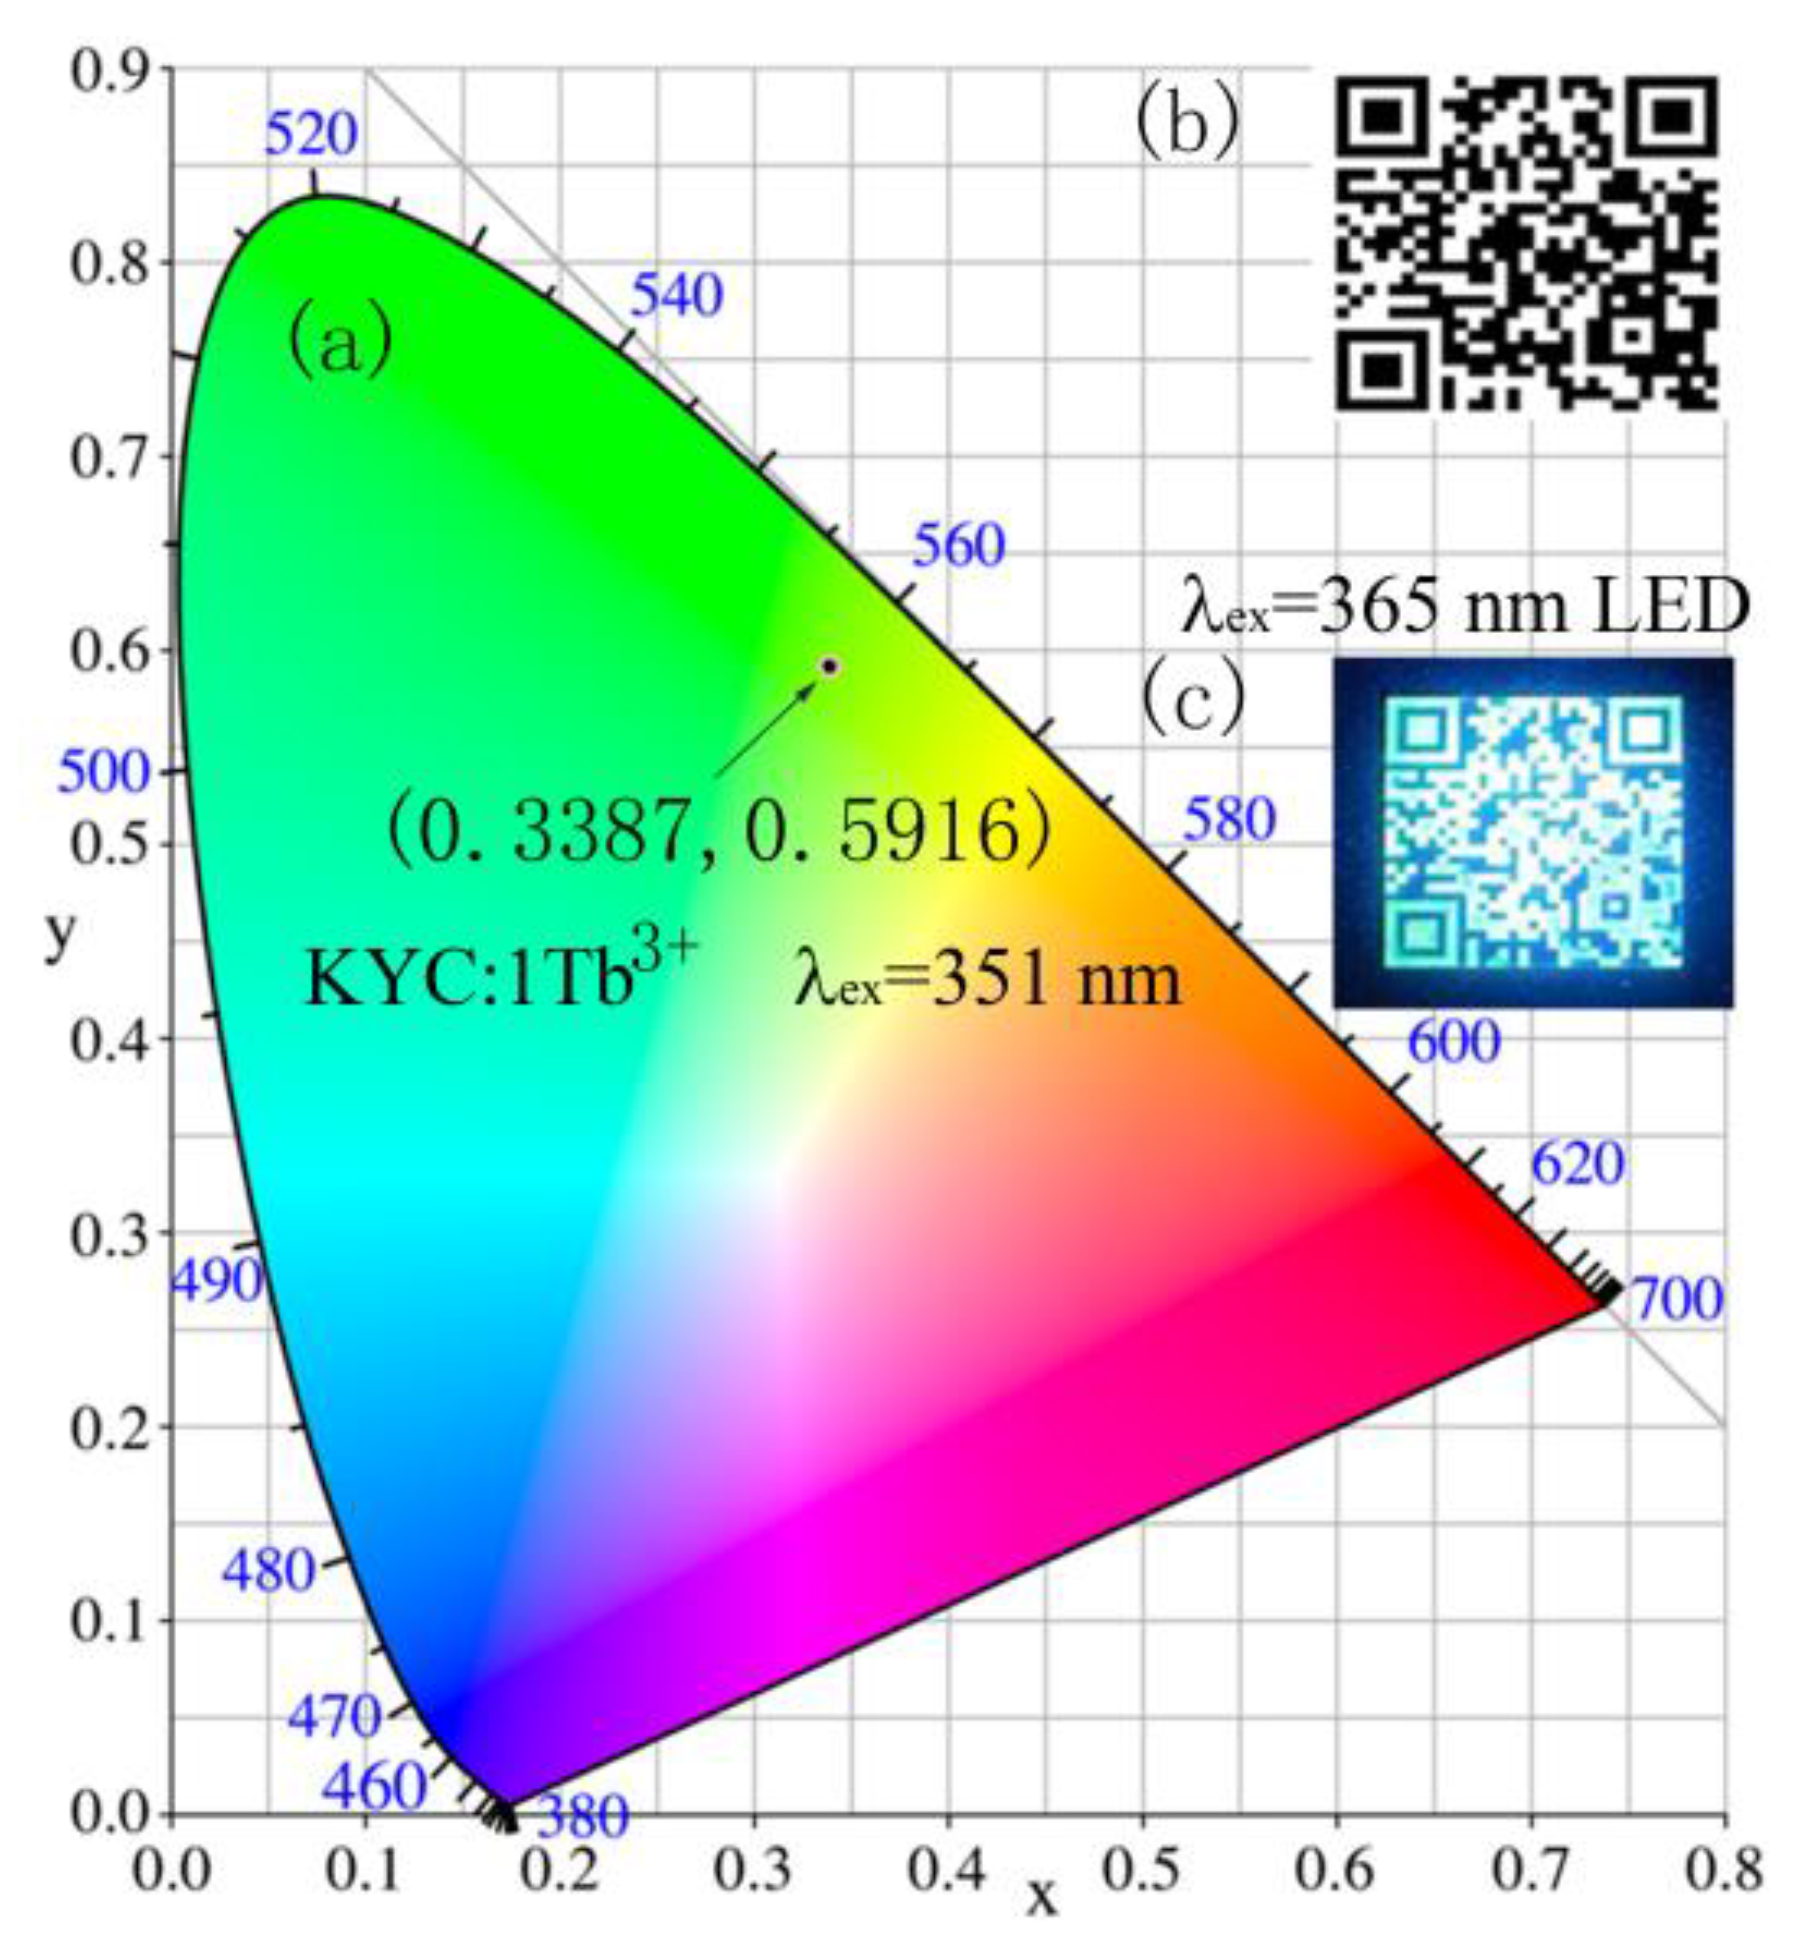
Quick response (QR) code is widely used in our life for information identification, health codes, trademark and product introduction, and so on. A highly efficient phosphor could enhance the QR code recognition in poor lighting conditions. Figure 6 shows the application of information identification for the luminescent QR code of KYC:1Tb3+ under the 365 nm LED irradiation. The chromaticity coordinate is (0.3387, 0.5916) in Figure 6a. The point position of KYC:1Tb3+ phosphor is in green field. Compared to a common QR code (Figure 6b), the luminescent QR code could be more easily identified in the darkness. Moreover, we can use QR codes to store some information or product introduction, especially in places where the space is small but where a lot of information needs to be expressed. The extended information can be easily obtained by scanning a QR code with a mobile phone in Figure 6c, such as “Huaibei Normal University”. In addition, the information can be kept secret by hiding the QR code under the transparent surface of a product. When information needs to be viewed, the QR code is displayed by ultraviolet excitation.
5. Conclusions
The KYC:xTb3+ (x = 0~1) phosphors were prepared by the hydrothermal method. The excited spectra, emission spectra, quantum cutting, and decay curves were measured and discussed. The ultraviolet wavelengths of 245, 283, and 351 nm were used to excite the phosphors. The exciting intensity of 245 and 283 nm (f–d transition) was larger than that of 351 nm (f–f transition). All the emissions were mainly attributed to the transition from 5D4 to 7FJ (J = 6, 5, 4, 3, 2). Visible quantum cutting of KYC:xTb3+ was observed at two excitation wavelengths of 245 nm and 283 nm. The optimal quantum cutting efficiency was ascribed to the simple and direct cross-relaxation transition under the 245 nm excitation: 5K8 + 7F6→5D4 + 5D4. The longest excitation wavelength of quantum cutting was 283 nm, which had the maximum QE value of 119% in KYC:0.7Tb3+. The high-efficiency KYC:Tb3+ phosphors could be potentially used in applications related to information identification.
Supplementary Materials
The following supporting information can be downloaded at: https://www.mdpi.com/article/10.3390/ma15176160/s1, Figure S1: Emission spectra of KYC:xTb3+ (x = 0.001, 0.01, 0.1) excited at 283 nm; Figure S2: Emission spectra of KYC:xTb3+ (x = 0.001, 0.01, 0.1) excited at 351 nm.
Author Contributions
Conceptualization, D.L. and G.Z.; methodology, D.L.; validation, D.L. and G.Z.; formal analysis, D.L. and G.Z.; investigation, D.L.; resources, D.L.; data curation, D.L.; writing—original draft preparation, D.L.; writing—review and editing, D.L.; visualization, D.L.; supervision, D.L.; project administration, D.L.; funding acquisition, D.L. All authors have read and agreed to the published version of the manuscript.
Funding
This research was funded by the University Natural Science Research Project of Anhui Province, grant number KJ2020A0048.
Institutional Review Board Statement
Not applicable.
Informed Consent Statement
Not applicable.
Data Availability Statement
The data presented in this study are available on request from the corresponding author.
Conflicts of Interest
The authors declare no conflict of interest.
References
- Tuyen, V.P.; Quang, V.X.; Khaidukov, N.M.; Thanh, L.D.; Ca, N.X.; Van Hao, N.; Van Nghia, N.; Van Do, P. K2YF5:Tb3+ single crystal: An in-depth study of spectroscopic properties, energy transfer and quantum cutting. Opt. Mater. 2020, 106, 109939. [Google Scholar] [CrossRef]
- Yu, X.; Li, H.; Li, X.; Jiang, Y.; Zheng, R.; Wu, H.; Song, Z.; Jiang, Z.; Zhao, P. Up-conversion luminescence and near-infrared quantum cutting of Ho3+/Yb3+ co-doped hexagonal NaGdF4 phosphors. J. Mater. Sci. Mater. Electron. 2021, 32, 21032–21043. [Google Scholar] [CrossRef]
- Hien, N.; Ca, N.; Kien, N.; Luyen, N.; Do, P.; Thanh, L.; Van, H.; Bharti, S.; Wang, Y.; Thuy, N. Structural, optical properties, energy transfer mechanism and quantum cutting of Tb3+ doped ZnS quantum dots. J. Phys. Chem. Solids 2020, 147, 109638. [Google Scholar] [CrossRef]
- Katayama, Y.; Tanabe, S. Spectroscopy and 1μm Luminescence by Visible Quantum Cutting in Pr3+-Yb3+ Codoped Glass. Materials 2010, 3, 2405–2411. [Google Scholar] [CrossRef]
- Zhang, F.; Wang, Y.; Tao, Y. Photoluminescence Properties of Li6Gd(BO3)3:Tb3+ Under VUV/UV Excitation. Phys. Procedia 2012, 29, 55–61. [Google Scholar] [CrossRef]
- Loiko, P.; Volokitina, A.; Mateos, X.; Dunina, E.; Kornienko, A.; Vilejshikova, E.; Aguiló, M.; Díaz, F. Spectroscopy of Tb3+ ions in monoclinic KLu(WO4)2 crystal application of an intermediate configuration interaction theory. Opt. Mater. 2018, 78, 495–501. [Google Scholar] [CrossRef]
- Zhang, Q.Y.; Huang, X.Y. Recent progress in quantum cutting phosphors. Prog. Mater. Sci. 2010, 55, 353–427. [Google Scholar] [CrossRef]
- Zhang, F.; Xie, J.; Li, G.; Zhang, W.; Wang, Y.; Huang, Y.; Tao, Y. Cation composition sensitive visible quantum cutting behavior of high efficiency green phosphors Ca9Ln(PO4)7:Tb3+ (Ln = Y, La, Gd). J. Mater. Chem. C 2017, 5, 872–881. [Google Scholar] [CrossRef]
- Liu, Y.; Zhang, J.; Zhang, C.; Jiang, J.; Jiang, H. High Efficiency Green Phosphor Ba9Lu2Si6O24:Tb3+: Visible Quantum Cutting via Cross-Relaxation Energy Transfers. J. Phys. Chem. C 2016, 120, 2362–2370. [Google Scholar] [CrossRef]
- Lu, C.-H.; Yeh, C.-H.; Som, S. Synthesis of Tb3+-Yb3+ coactivated CeO2 phosphors for two-photon assisted quantum cutting applications. Chem. Phys. Lett. 2020, 748, 137383. [Google Scholar] [CrossRef]
- Jaiswal, S.R.; Sawala, N.S.; Nagpure, P.A.; Bhatkar, V.B.; Omanwar, S.K. Visible quantum cutting in Tb3+ doped BaGdF5 phosphor for plasma display panel. J. Mater. Sci. Mater. Electron. 2017, 28, 2407–2414. [Google Scholar] [CrossRef]
- Jaiswal, S.R.; Sawala, N.S.; Nagpure, P.A.; Barde, W.S.; Omanwar, S. The Highly Efficient Inorganic SrF2:Gd3+,Eu3+ Phosphor for Mercury Free Fluorescence Lamps. Adv. Mat. Res. 2022, 1171, 17–24. [Google Scholar]
- Mou, R.; Jiang, P.; Cong, R.; Yang, T. Structure and composition-dependent photoluminescence for Ca8MgGd1-xTbx(PO4)7 (0 ≤ x ≤ 1). J. Solid State Chem. 2021, 298, 122116. [Google Scholar] [CrossRef]
- Li, D.; Zhu, G.; Zhao, X. High efficiently color-tunable emission in KTb(CO3)2:Eu3+ phosphors. Opt. Mater. 2021, 119, 111310. [Google Scholar] [CrossRef]
- Palilla, F.C.; Levine, A.K.; Rinkevics, M. Rare Earth Activated Phosphors Based on Yttrium Orthovanadate and Related Compounds. J. Electrochem. Soc. 1965, 112, 776–779. [Google Scholar] [CrossRef]
- Shannon, R. Revised effective ionic radii and systematic studies of interatomic distances in halides and chalcogenides. Acta Crystallorg. A 1976, 32, 751–767. [Google Scholar] [CrossRef]
- Kutlu, I.; Kalz, H.-J.; Wartchow, R.; Ehrhardt, H.; Seidel, H.; Meyer, G. Kalium-Lanthanoid-Carbonate, KM(CO3)2 (M = Nd, Gd, Dy, Ho, Yb). Z Anorg. Allg. Chem. 1997, 623, 1753–1758. [Google Scholar] [CrossRef]
- Lin, D.; Du, P. Room temperature synthesis of Tb3+-activated BiF3 green-emitting nanoparticles with high thermal stability for near-ultraviolet white light-emitting didoes. Appl. Phys. A 2021, 127, 65. [Google Scholar] [CrossRef]
- Lu, Y.; Wang, J.; He, L.; Hao, C.; Wang, F.; Zhang, J. Preparation and fluorescence properties of MgAl2O4:Tb3+ nanorod-like phosphors. Mater. Res. Express 2022, 9, 065009. [Google Scholar] [CrossRef]
- He, D.; Yu, C.; Cheng, J.; Li, S.; Hu, L. Effect of Tb3+ concentration and sensitization of Ce3+ on luminescence properties of terbium doped phosphate scintillating glass. J. Alloys Compd. 2011, 509, 1906–1909. [Google Scholar] [CrossRef]
- Jiang, P.; Li, Z.; Lu, W.; Ma, Y.; Tian, W. The pH Value Control of Morphology and Luminescence Properties of Gd2O2S: Tb3+ Phosphors. Materials 2022, 15, 646. [Google Scholar] [CrossRef] [PubMed]
- Xie, M.; Tao, Y.; Huang, Y.; Liang, H.; Su, Q. The Quantum Cutting of Tb3+ in Ca6Ln2Na2(PO4)6F2 (Ln=Gd, La) under VUV–UV Excitation: With and without Gd3+. Inorg. Chem. 2010, 49, 11317–11324. [Google Scholar] [CrossRef] [PubMed]
- Atuchin, V.V.; Aleksandrovsky, A.S.; Chimitova, O.D.; Krylov, A.S.; Molokeev, M.S.; Bazarov, B.G.; Bazarova, J.G.; Xia, Z. Synthesis and spectroscopic properties of multiferroic β′-Tb2(MoO4)3. Opt. Mater. 2014, 36, 1631–1635. [Google Scholar] [CrossRef]
- Carnall, W.T.; Fields, P.R.; Rajnak, K. Electronic Energy Levels of the Trivalent Lanthanide Aquo Ions. III. Tb3+. J. Chem. Phys. 1968, 49, 4447–4449. [Google Scholar] [CrossRef]
- Zhumanova, K.; Akhmetzhanov, N.; Kang, M.S.; Molkenova, A.; Raja, I.S.; Kim, K.S.; Han, D.-W.; Atabaev, T.S. Terbium and barium codoped mesoporous silica nanoparticles with enhanced optical properties. Mater. Lett. 2022, 323, 132500. [Google Scholar] [CrossRef]
- Khan, S.; Choi, Y.; Ahn, H.-Y.; Han, J.H.; Ju, B.-K.; Chung, J.; Cho, S.-H. Control of Particle Size in Flame Spray Pyrolysis of Tb–doped Y2O3 for Bio-Imaging. Materials 2020, 13, 2987. [Google Scholar] [CrossRef] [PubMed]
Figure 1.
X-ray diffraction spectra of KYC:xTb3+ (x = 0, 0.1, 0.3, 0.5, 0.7, 1).

Figure 2.
(a–f) Morphologies of KYC:xTb3+(x = 0.01, 0.1, 0.3, 0.5, 0.7, 1); (g) Selected area of KYC:0.5Tb3+; (h–k) Element mapping of K, Y, Tb, and O; (l) Energy dispersive spectroscopy analysis.
Figure 2.
(a–f) Morphologies of KYC:xTb3+(x = 0.01, 0.1, 0.3, 0.5, 0.7, 1); (g) Selected area of KYC:0.5Tb3+; (h–k) Element mapping of K, Y, Tb, and O; (l) Energy dispersive spectroscopy analysis.
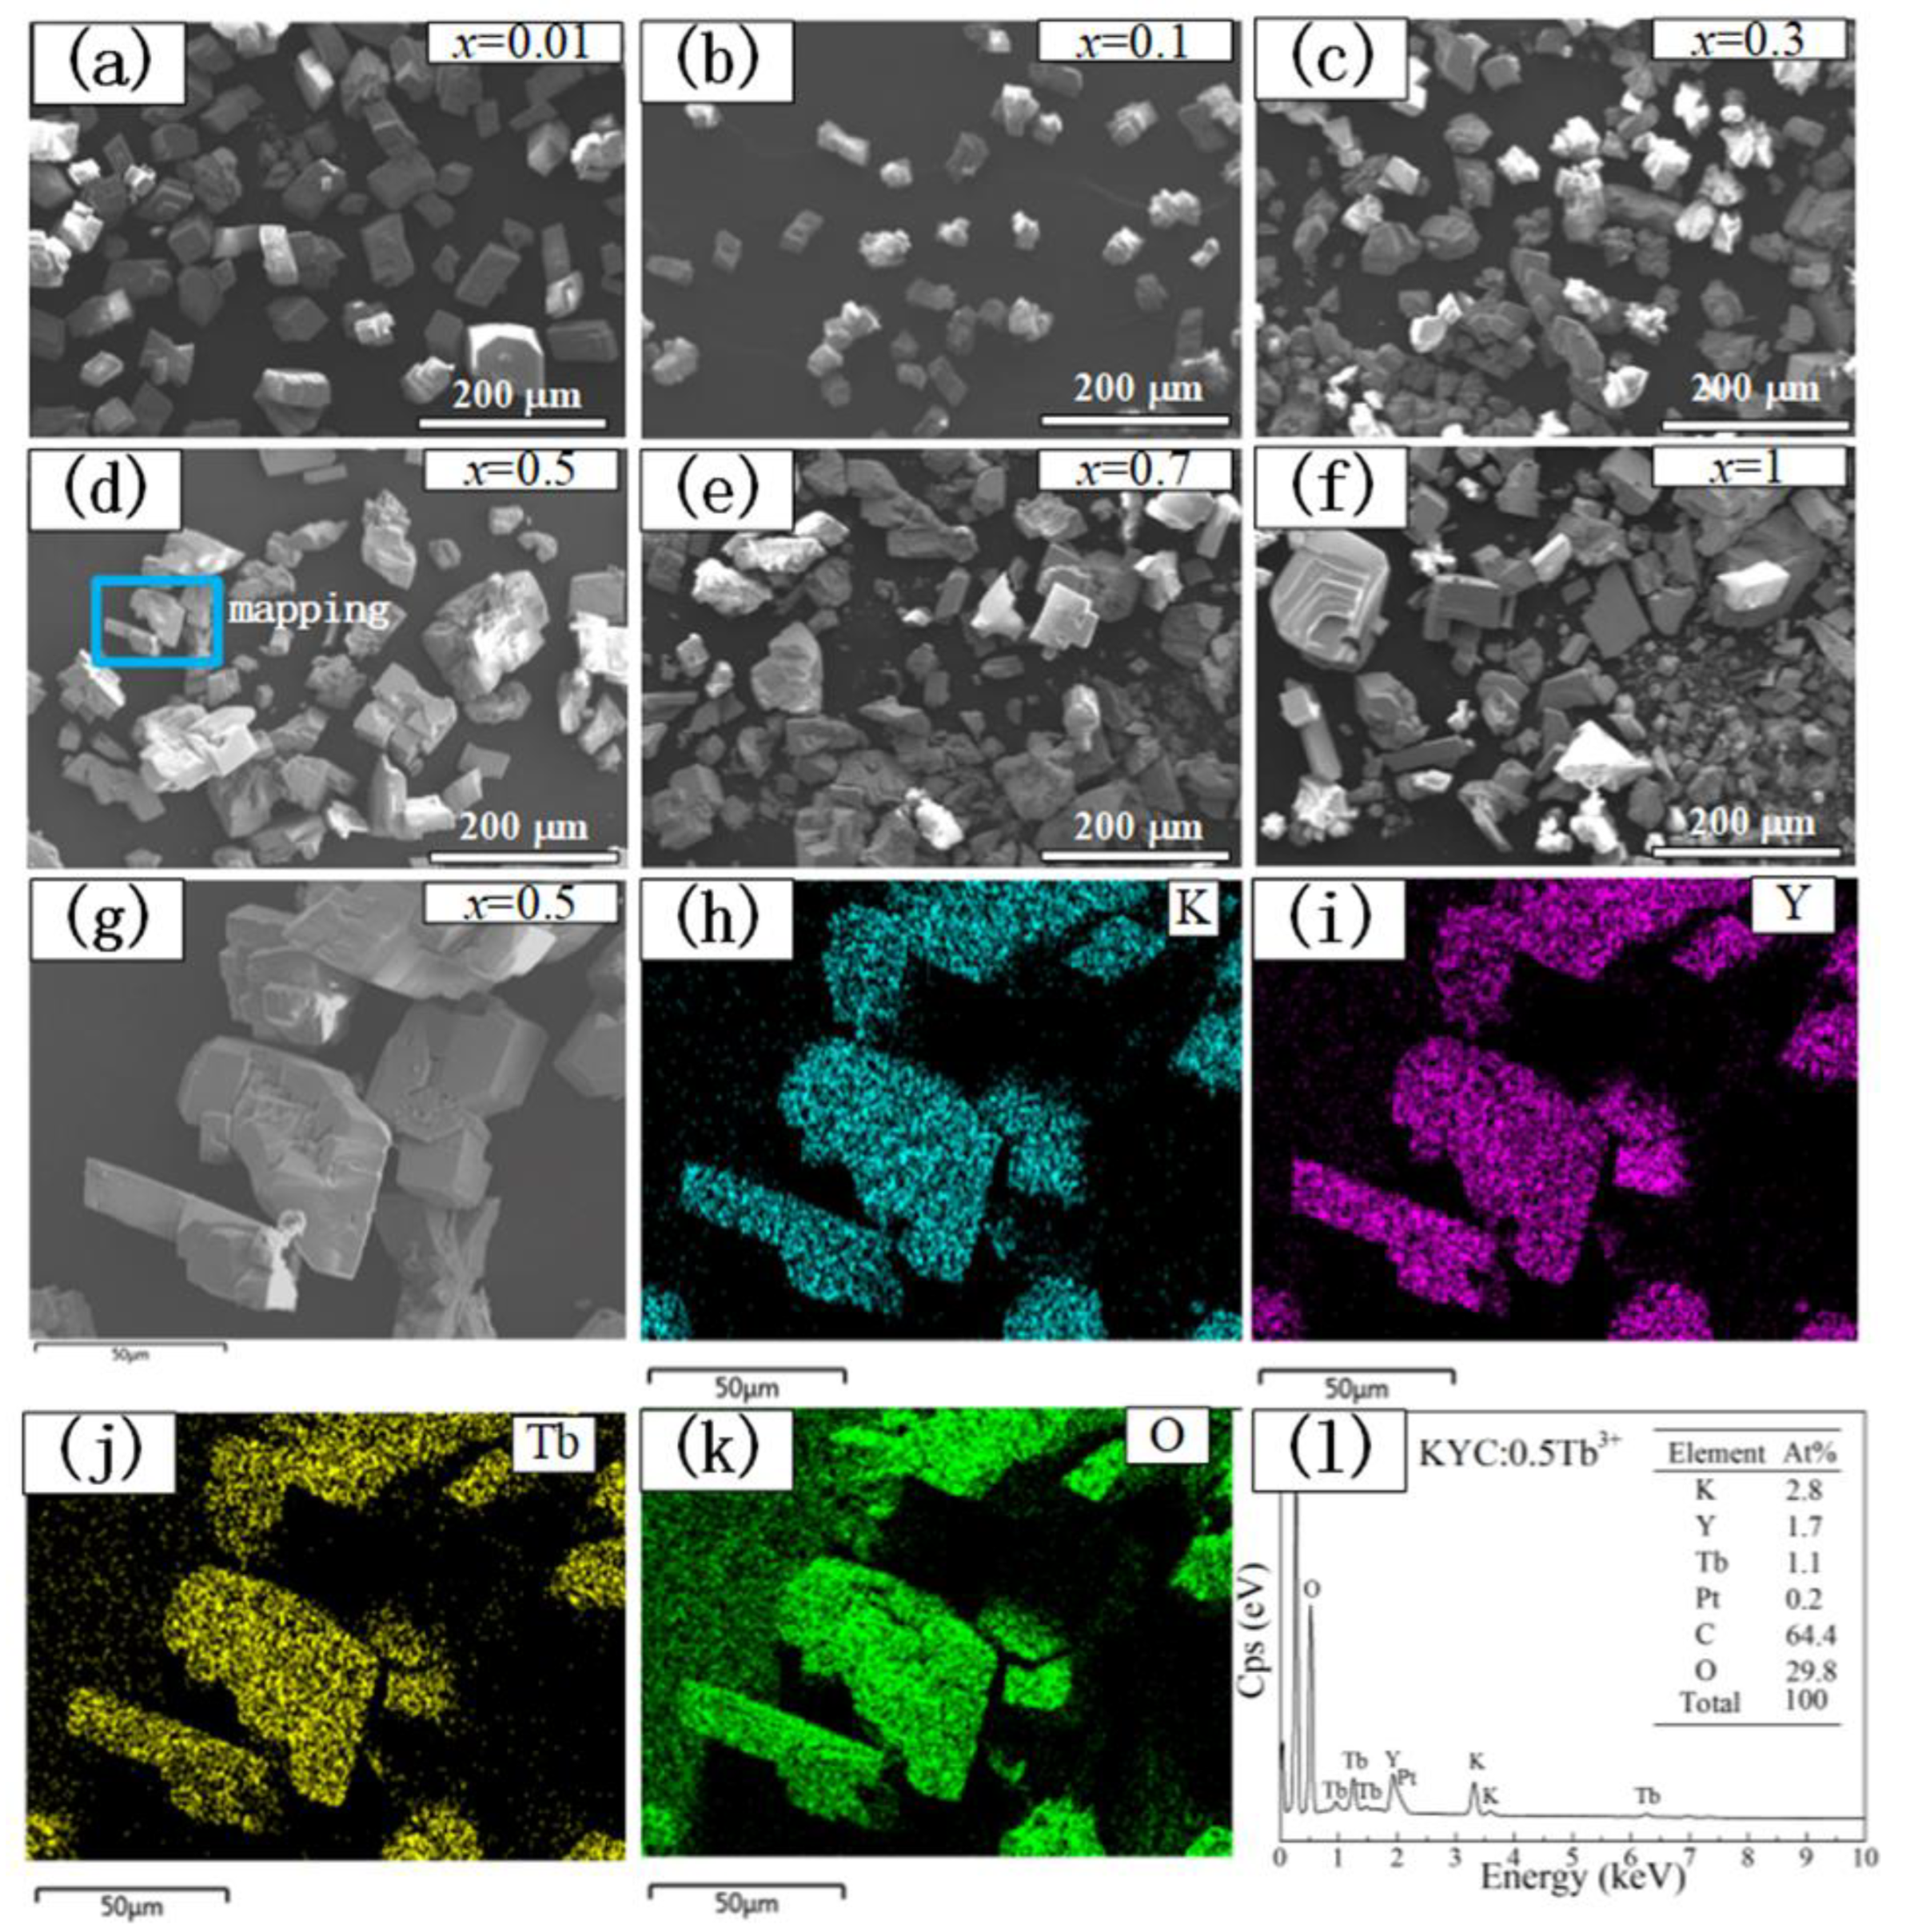
Figure 3.
Luminescence spectra of KYC:xTb3+: (a) excitation spectra; (b) emission spectra of KYC:0.001Tb3+; (c) emission spectra excited at 283 nm; (d) emission spectra excited at 351 nm.
Figure 3.
Luminescence spectra of KYC:xTb3+: (a) excitation spectra; (b) emission spectra of KYC:0.001Tb3+; (c) emission spectra excited at 283 nm; (d) emission spectra excited at 351 nm.

Figure 4.
Energy level diagram of KYC:Tb3+.
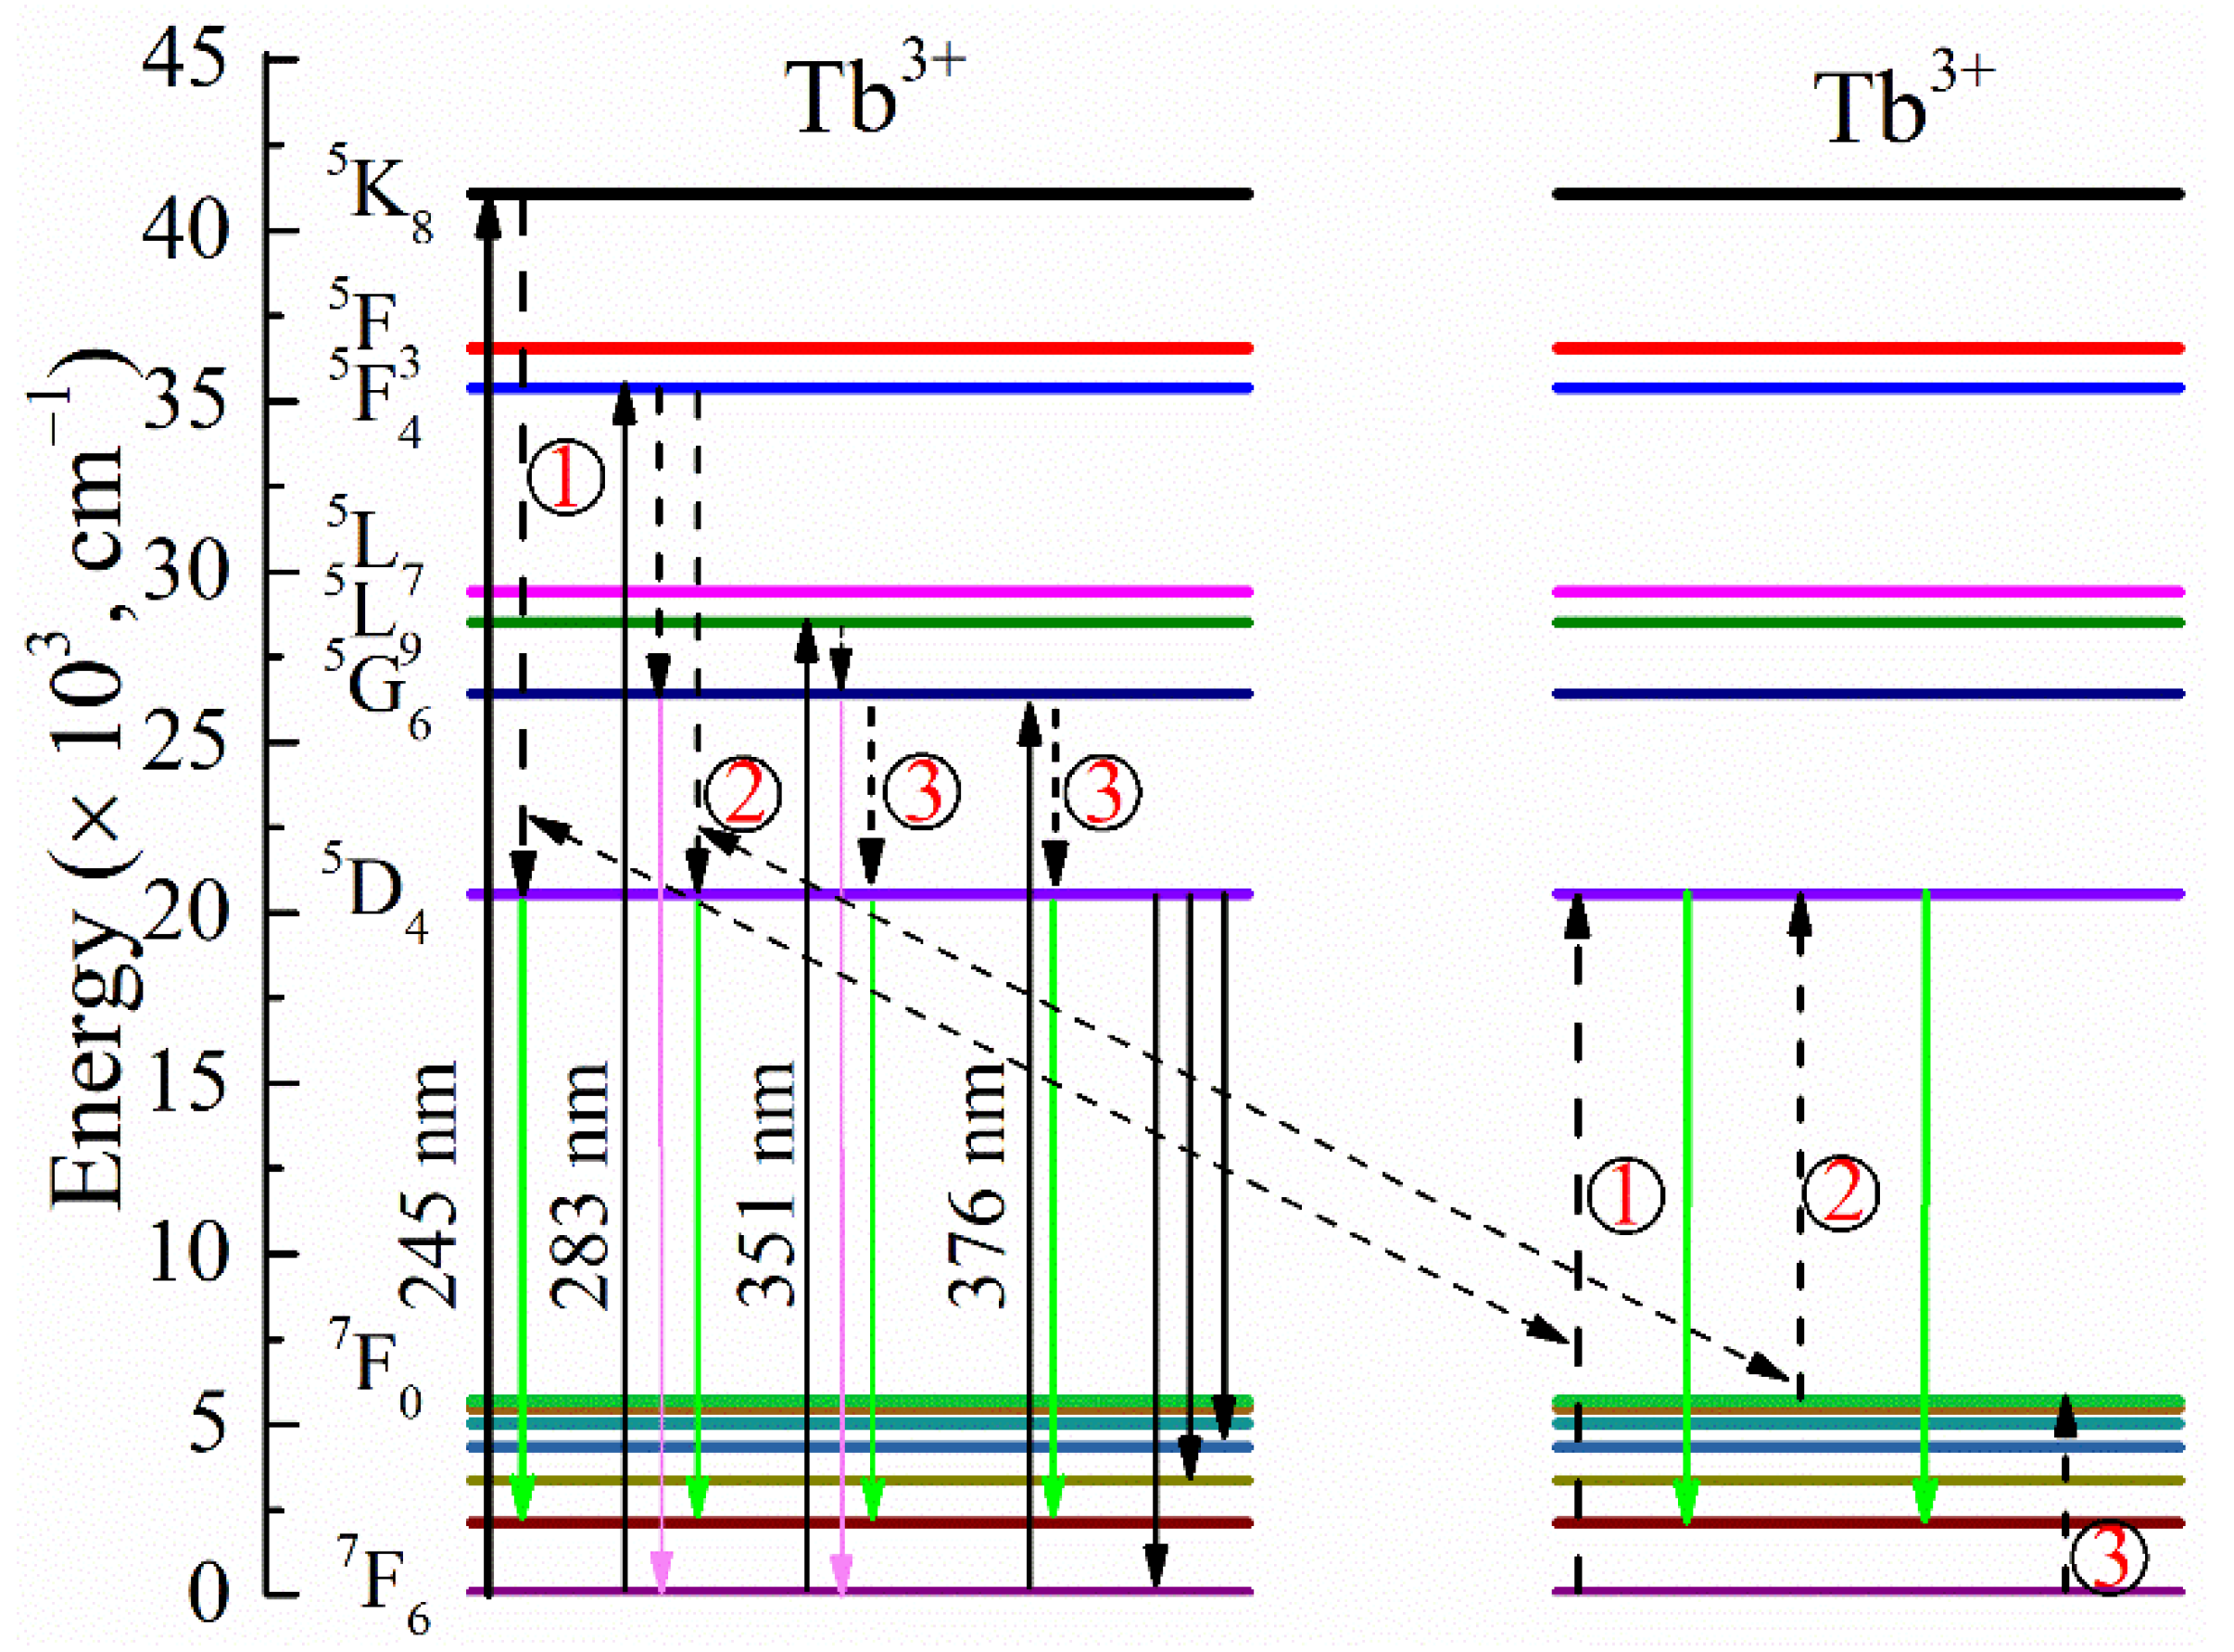
Figure 5.
Decay curves (a) and energy level lifetimes (b) of KYC:xTb3+.

Figure 6.
(a) Chromaticity point of phosphor; (b) Quick response code; (c) Quick response code excited by 365 nm LED.
Figure 6.
(a) Chromaticity point of phosphor; (b) Quick response code; (c) Quick response code excited by 365 nm LED.

Table 1.
Quantum efficiency of KYC:xTb3+ excited at different wavelengths.
| Materials | QE245nm | QE283nm | QE351nm | References |
|---|---|---|---|---|
| x = 0.01 | 138% | 23% | 5% | This work |
| x = 0.1 | 172% | 70% | 22% | This work |
| x = 0.3 | 177% | 109% | 43% | This work |
| x = 0.5 | 171% | 115% | 64% | This work |
| x = 0.7 | 160% | 119% | 67% | This work |
| x = 1 | 148% | 113% | 72% | This work |
| Ca9Y(PO4)7:Tb3+ | 157% (250 nm) | [8] | ||
| Ba9Lu2Si6O24:Tb3+ | 144% (251 nm) | [9] | ||
| K2GdF5:Tb3+ | 177% (240 nm) | [11] |
Publisher’s Note: MDPI stays neutral with regard to jurisdictional claims in published maps and institutional affiliations. |
© 2022 by the authors. Licensee MDPI, Basel, Switzerland. This article is an open access article distributed under the terms and conditions of the Creative Commons Attribution (CC BY) license (https://creativecommons.org/licenses/by/4.0/).
Share and Cite
MDPI and ACS Style
Li, D.; Zhu, G. Quantum Cutting in Ultraviolet B-Excited KY(CO3)2:Tb3+ Phosphors. Materials 2022, 15, 6160. https://doi.org/10.3390/ma15176160
AMA Style
Li D, Zhu G. Quantum Cutting in Ultraviolet B-Excited KY(CO3)2:Tb3+ Phosphors. Materials. 2022; 15(17):6160. https://doi.org/10.3390/ma15176160
Chicago/Turabian StyleLi, Dechuan, and Guangping Zhu. 2022. "Quantum Cutting in Ultraviolet B-Excited KY(CO3)2:Tb3+ Phosphors" Materials 15, no. 17: 6160. https://doi.org/10.3390/ma15176160
Note that from the first issue of 2016, this journal uses article numbers instead of page numbers. See further details here.