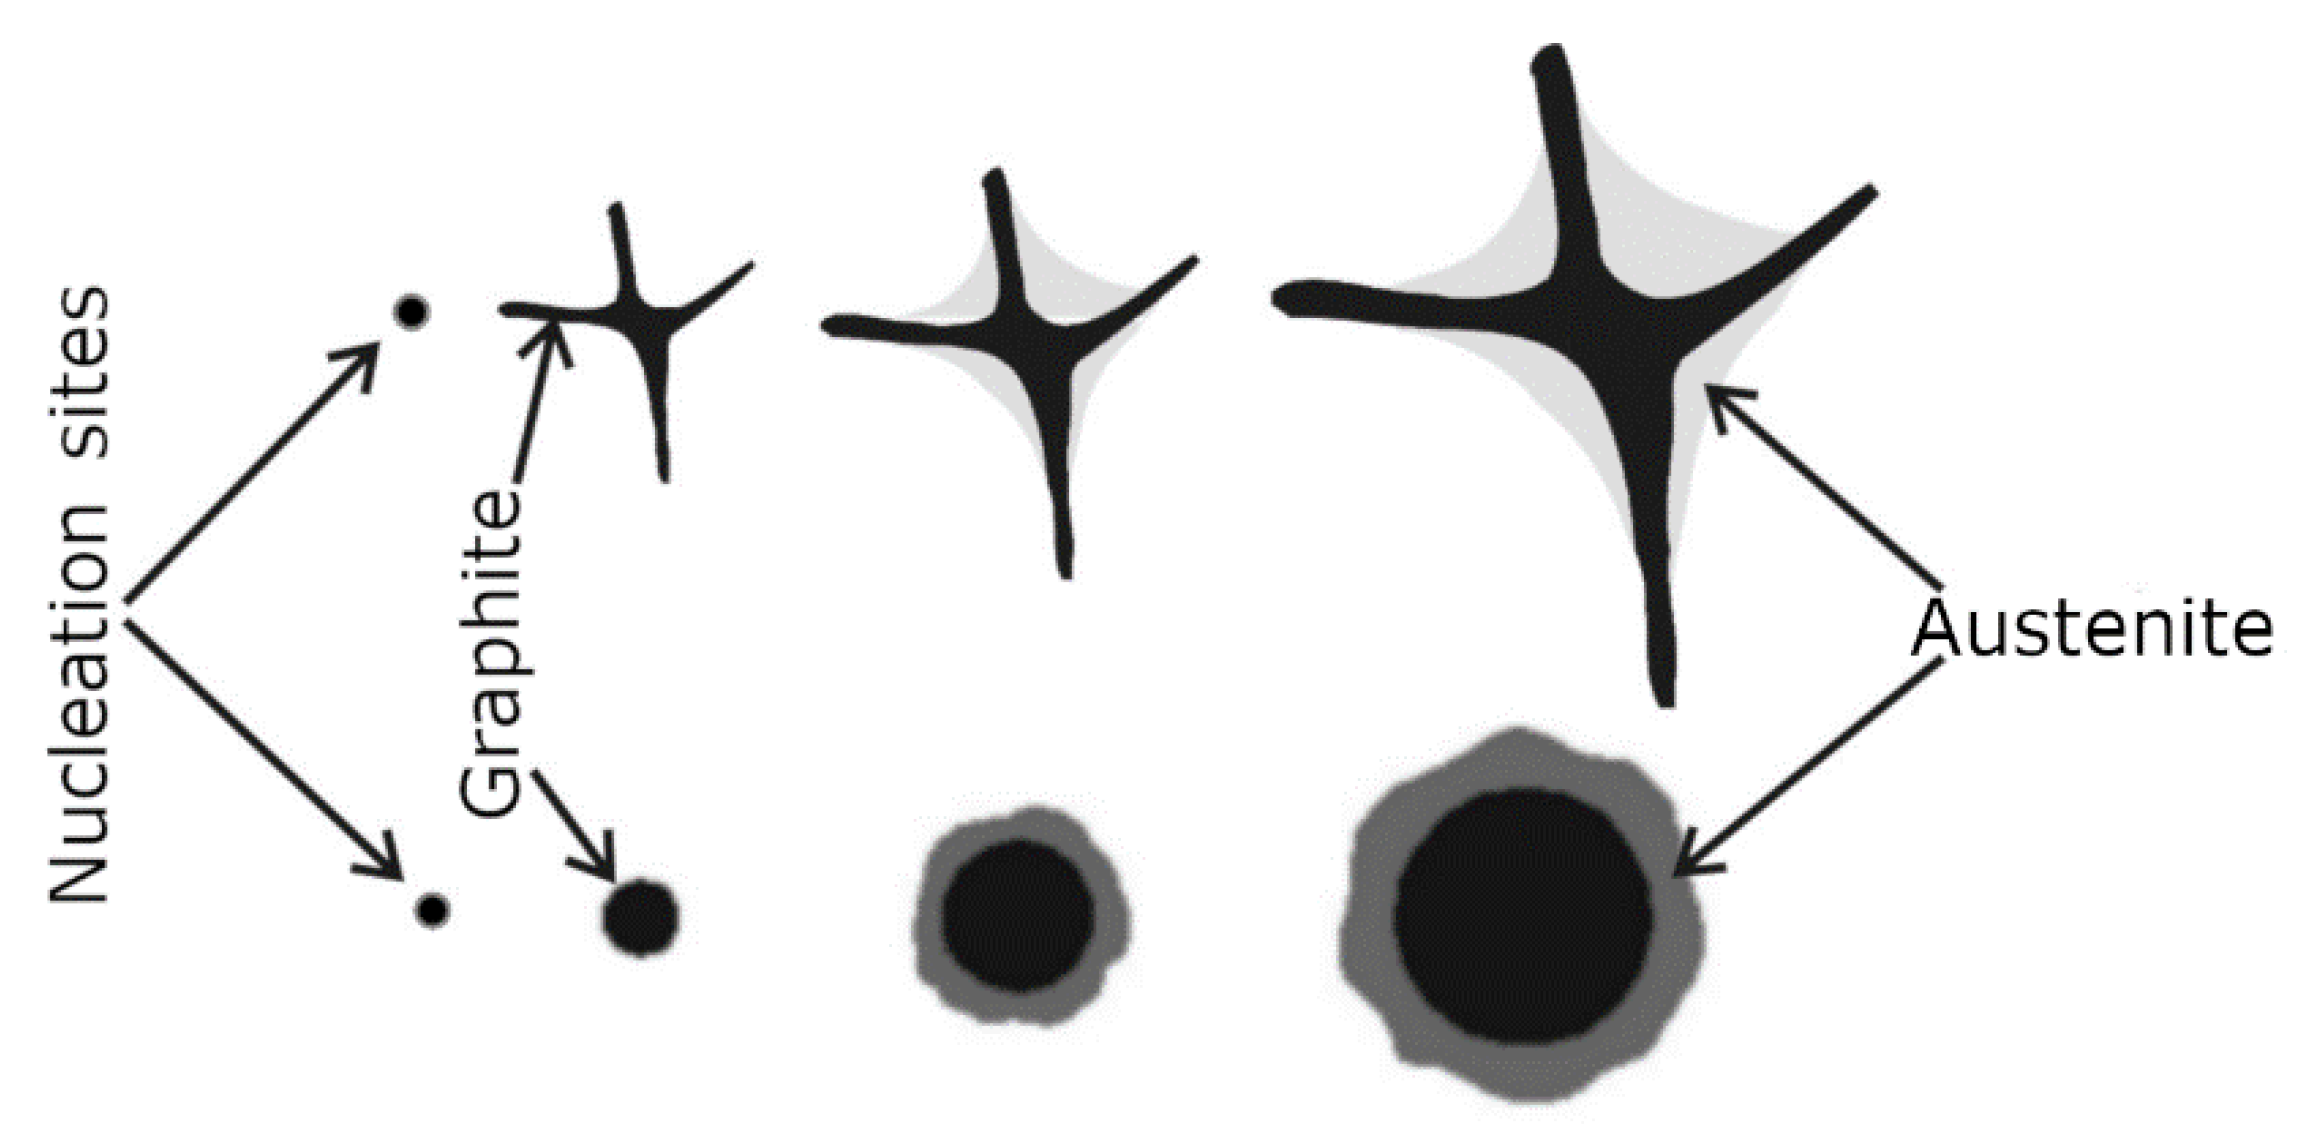
Figure 1.
Sequence of shaping in grey cast iron of eutectic grains with flake and nodular graphite.
Figure 1.
Sequence of shaping in grey cast iron of eutectic grains with flake and nodular graphite.
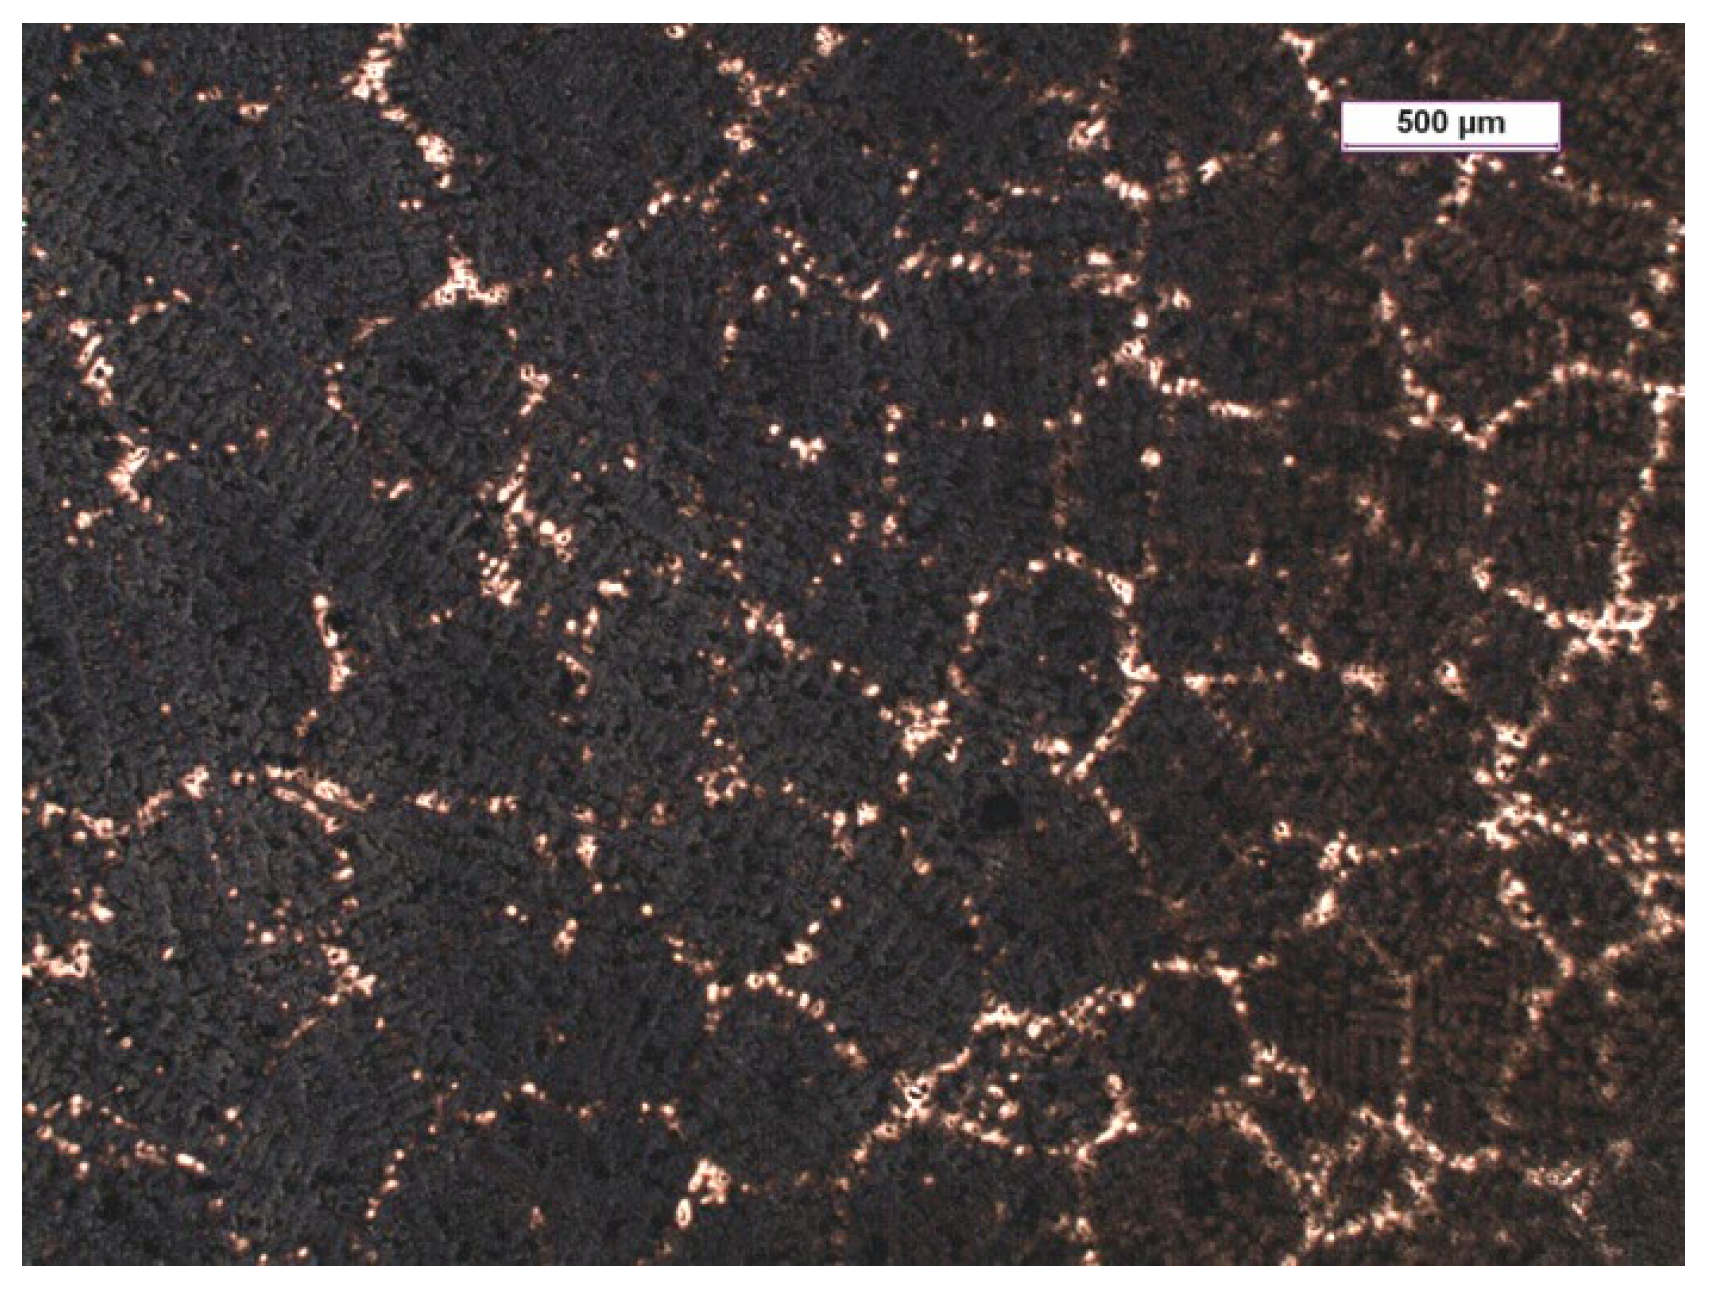
Figure 2.
Example of grey cast iron microstructure consisting of eutectic grains revealed on surface of metallographic specimen after etching with Stead’s solution.
Figure 2.
Example of grey cast iron microstructure consisting of eutectic grains revealed on surface of metallographic specimen after etching with Stead’s solution.
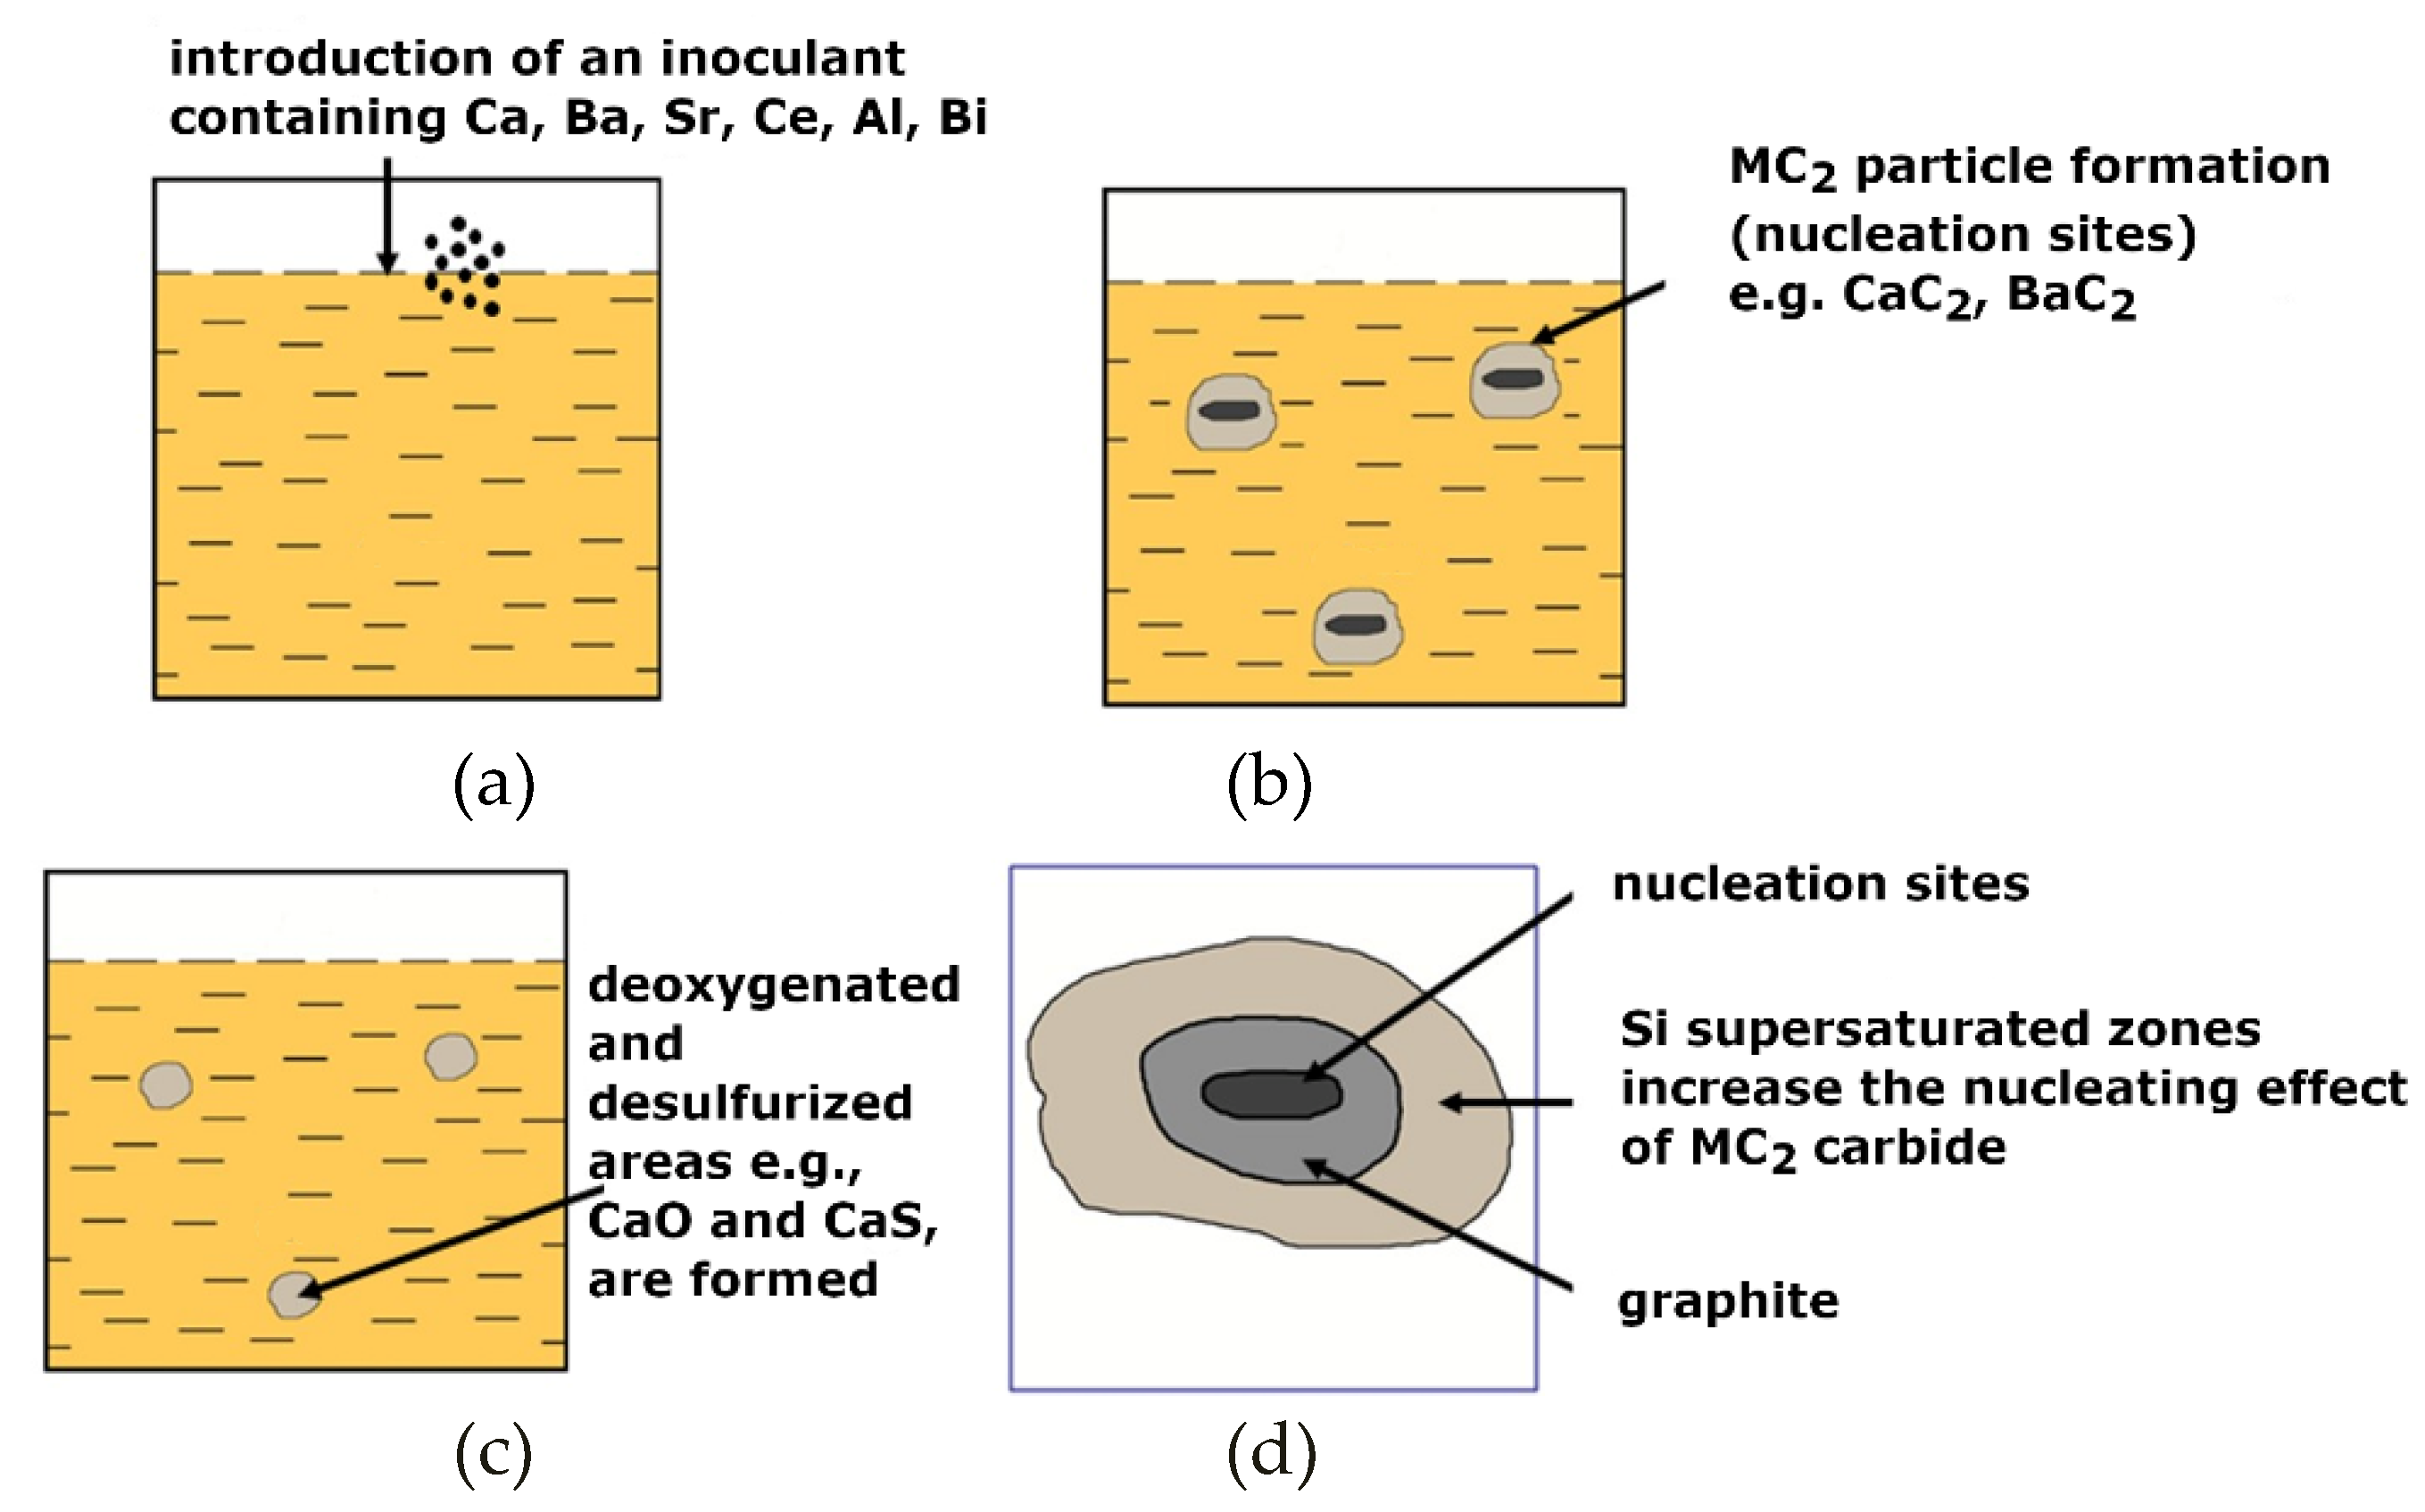
Figure 3.
(a) Scheme of procedure for inoculation of grey cast iron: introduction of inoculant containing Ca, Ba, Sr, and Al; (b) formation of deoxidised and desulphurised areas (e.g., CaO and CaS); (c) formation of MC2 (CaC2, BaC2) particles (nucleation sites) on which graphite nucleates; (d) schematic of inoculant interaction in molten metal.
Figure 5.
(a) Three-dimensional solid and (b) actual appearance of tested cast of electric motor shield.
Figure 5.
(a) Three-dimensional solid and (b) actual appearance of tested cast of electric motor shield.
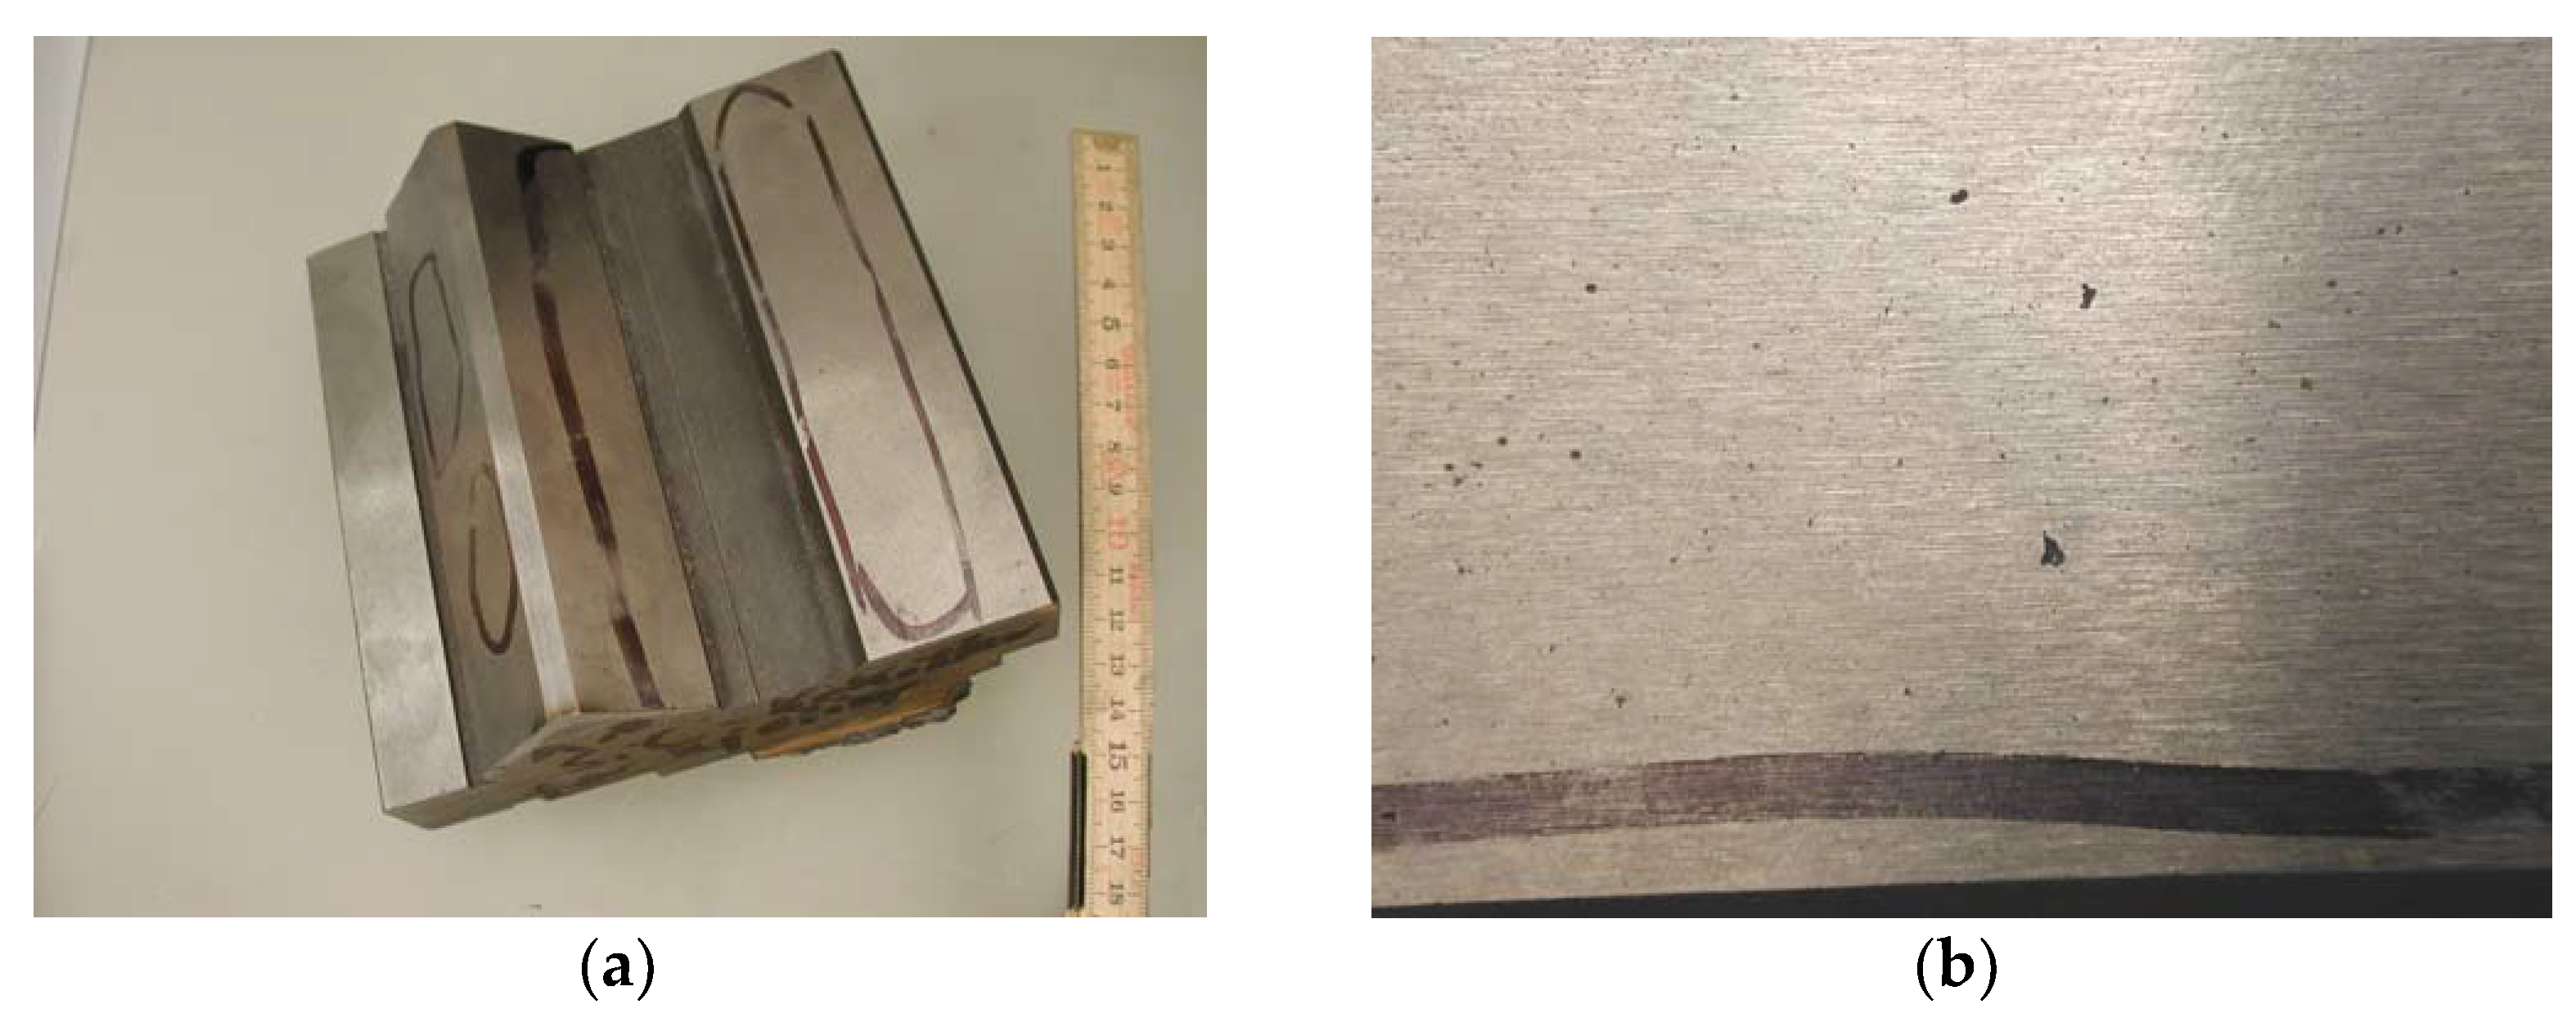
Figure 6.
(a) Place of appearance of porosity in cast of motor shield and (b) appearance of defect.
Figure 6.
(a) Place of appearance of porosity in cast of motor shield and (b) appearance of defect.
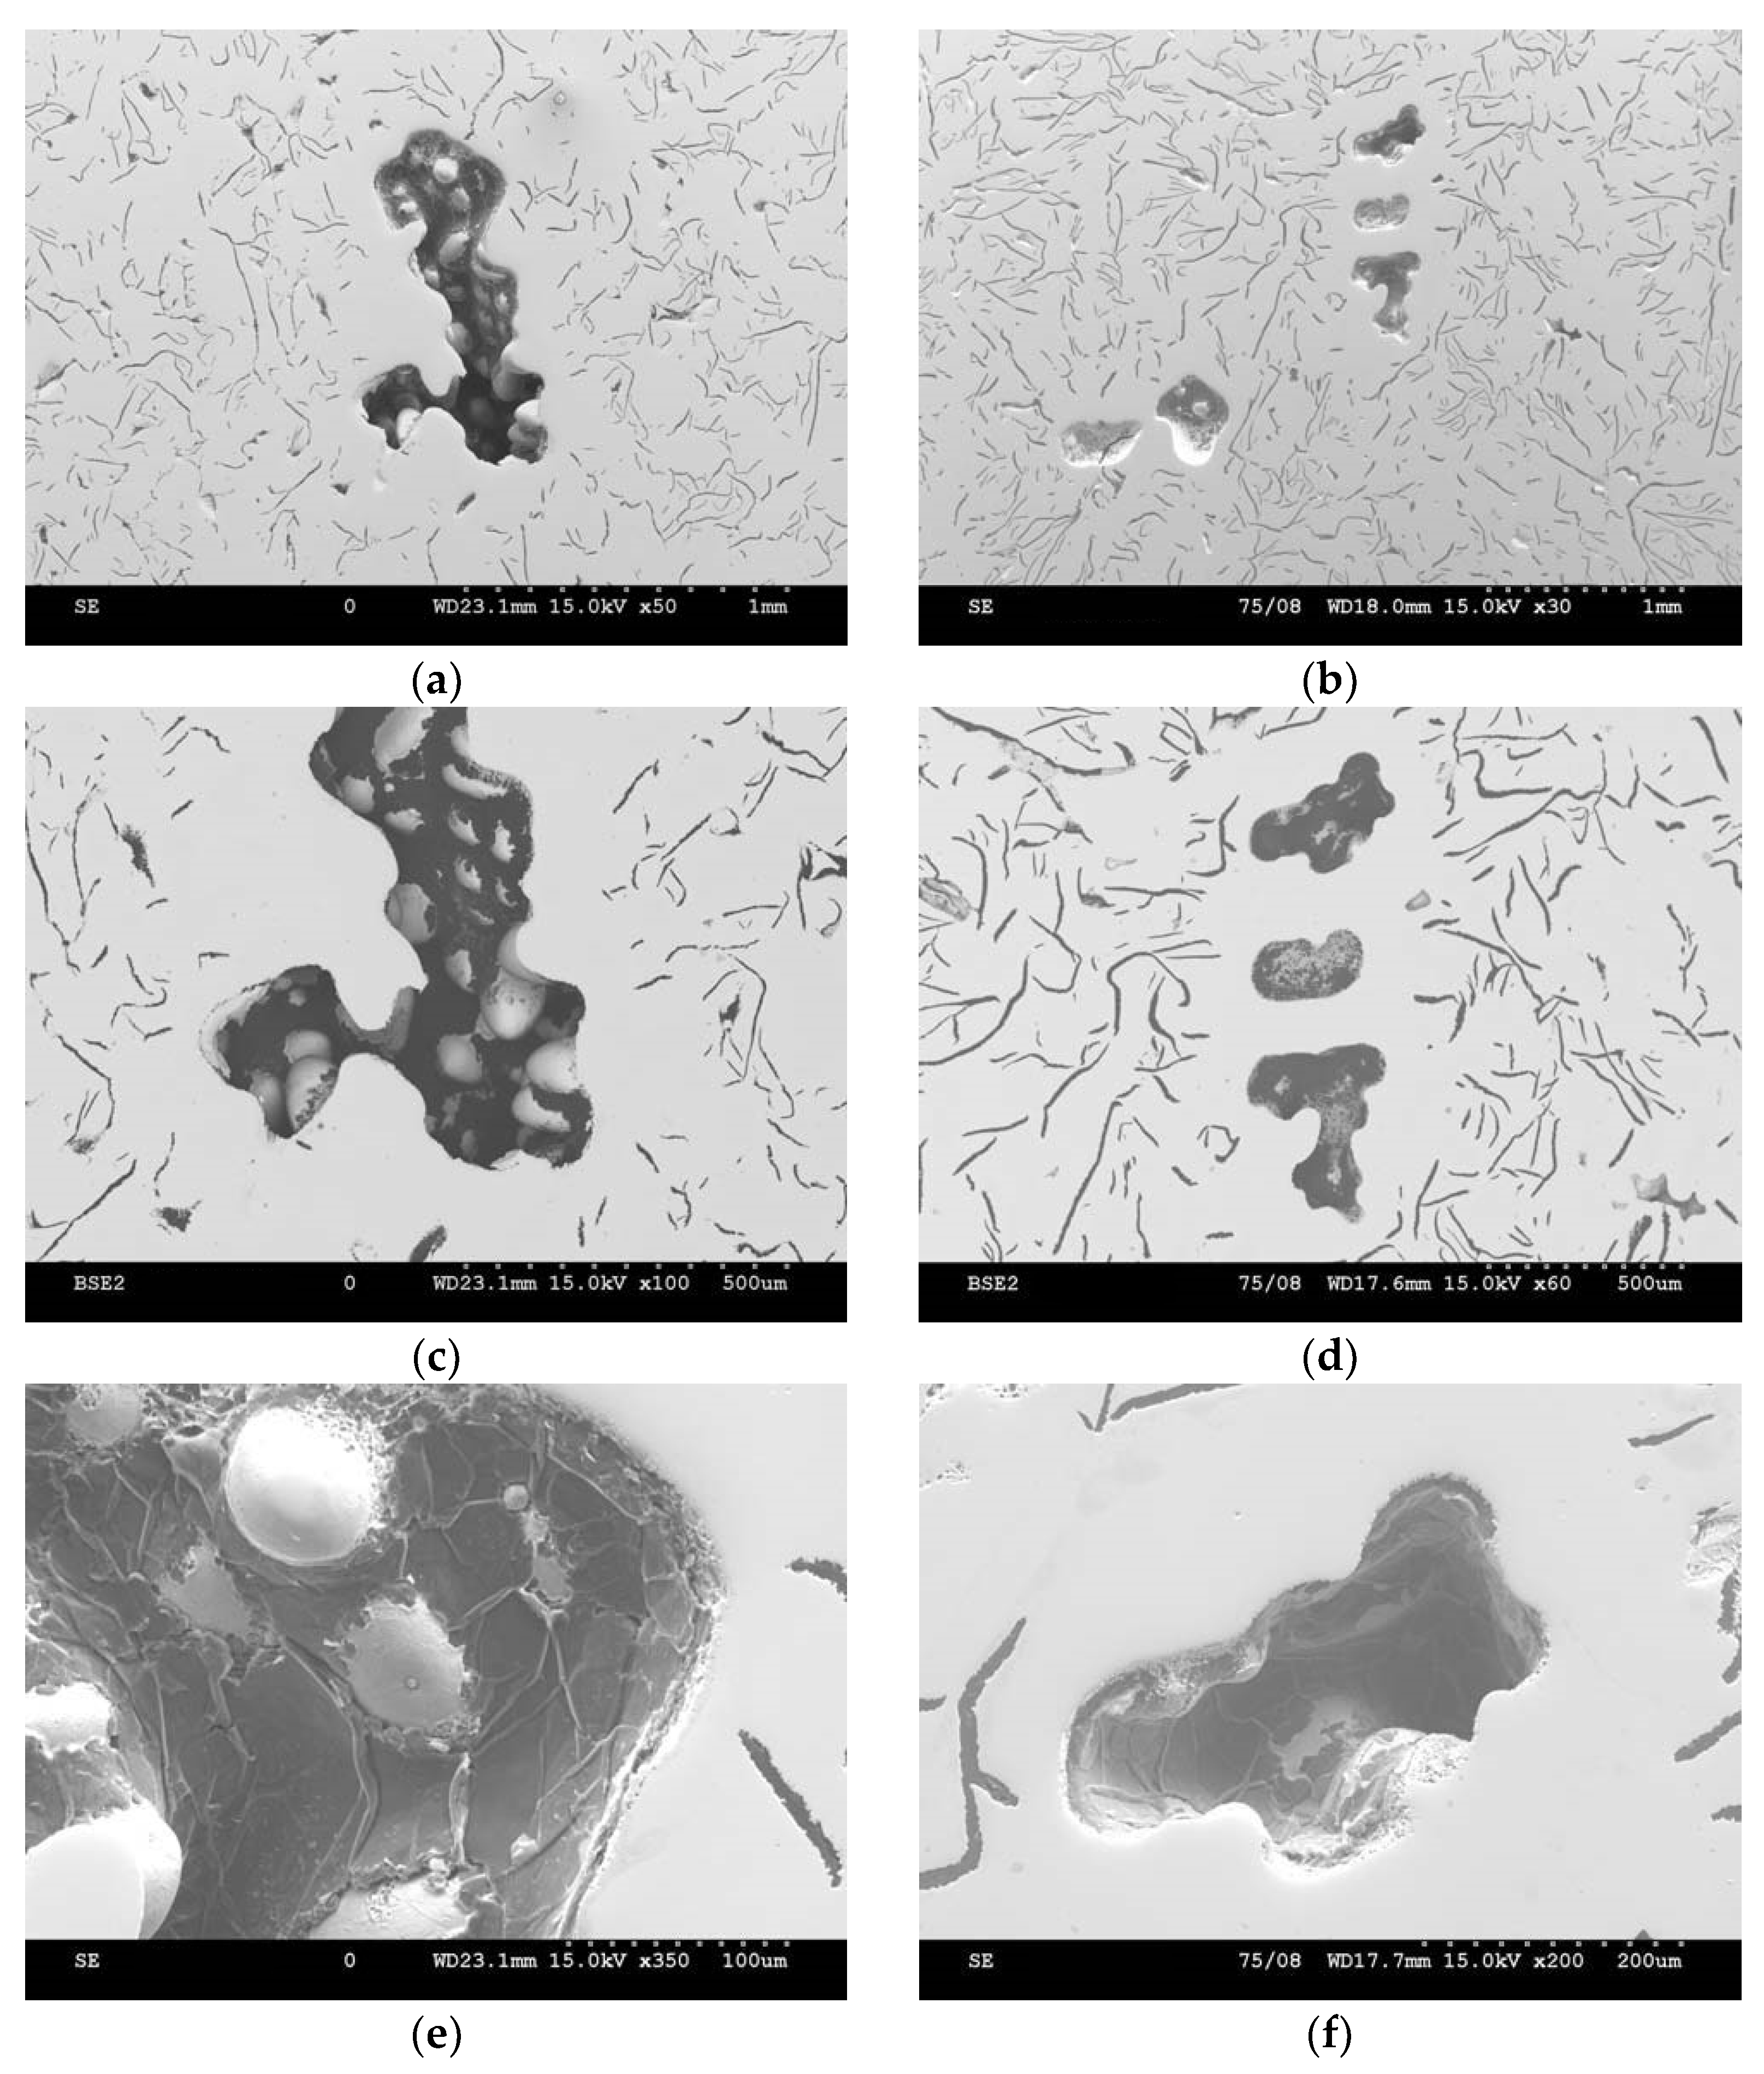
Figure 8.
Revealed porosity on surface of lathe bed casting—single void at magnifications of (a) 50×, (c) 100×, and (e) 350×, as well as their grouping at magnifications of (b) 30×, (d) 60×, and (f) 200×.
Figure 8.
Revealed porosity on surface of lathe bed casting—single void at magnifications of (a) 50×, (c) 100×, and (e) 350×, as well as their grouping at magnifications of (b) 30×, (d) 60×, and (f) 200×.
Figure 9.
(a) Analysis of chemical composition of lathe bed casting on surface of internal porosity and metal matrix, (b) results of EDS analysis for inside of void, and (c) metal matrix.
Figure 9.
(a) Analysis of chemical composition of lathe bed casting on surface of internal porosity and metal matrix, (b) results of EDS analysis for inside of void, and (c) metal matrix.
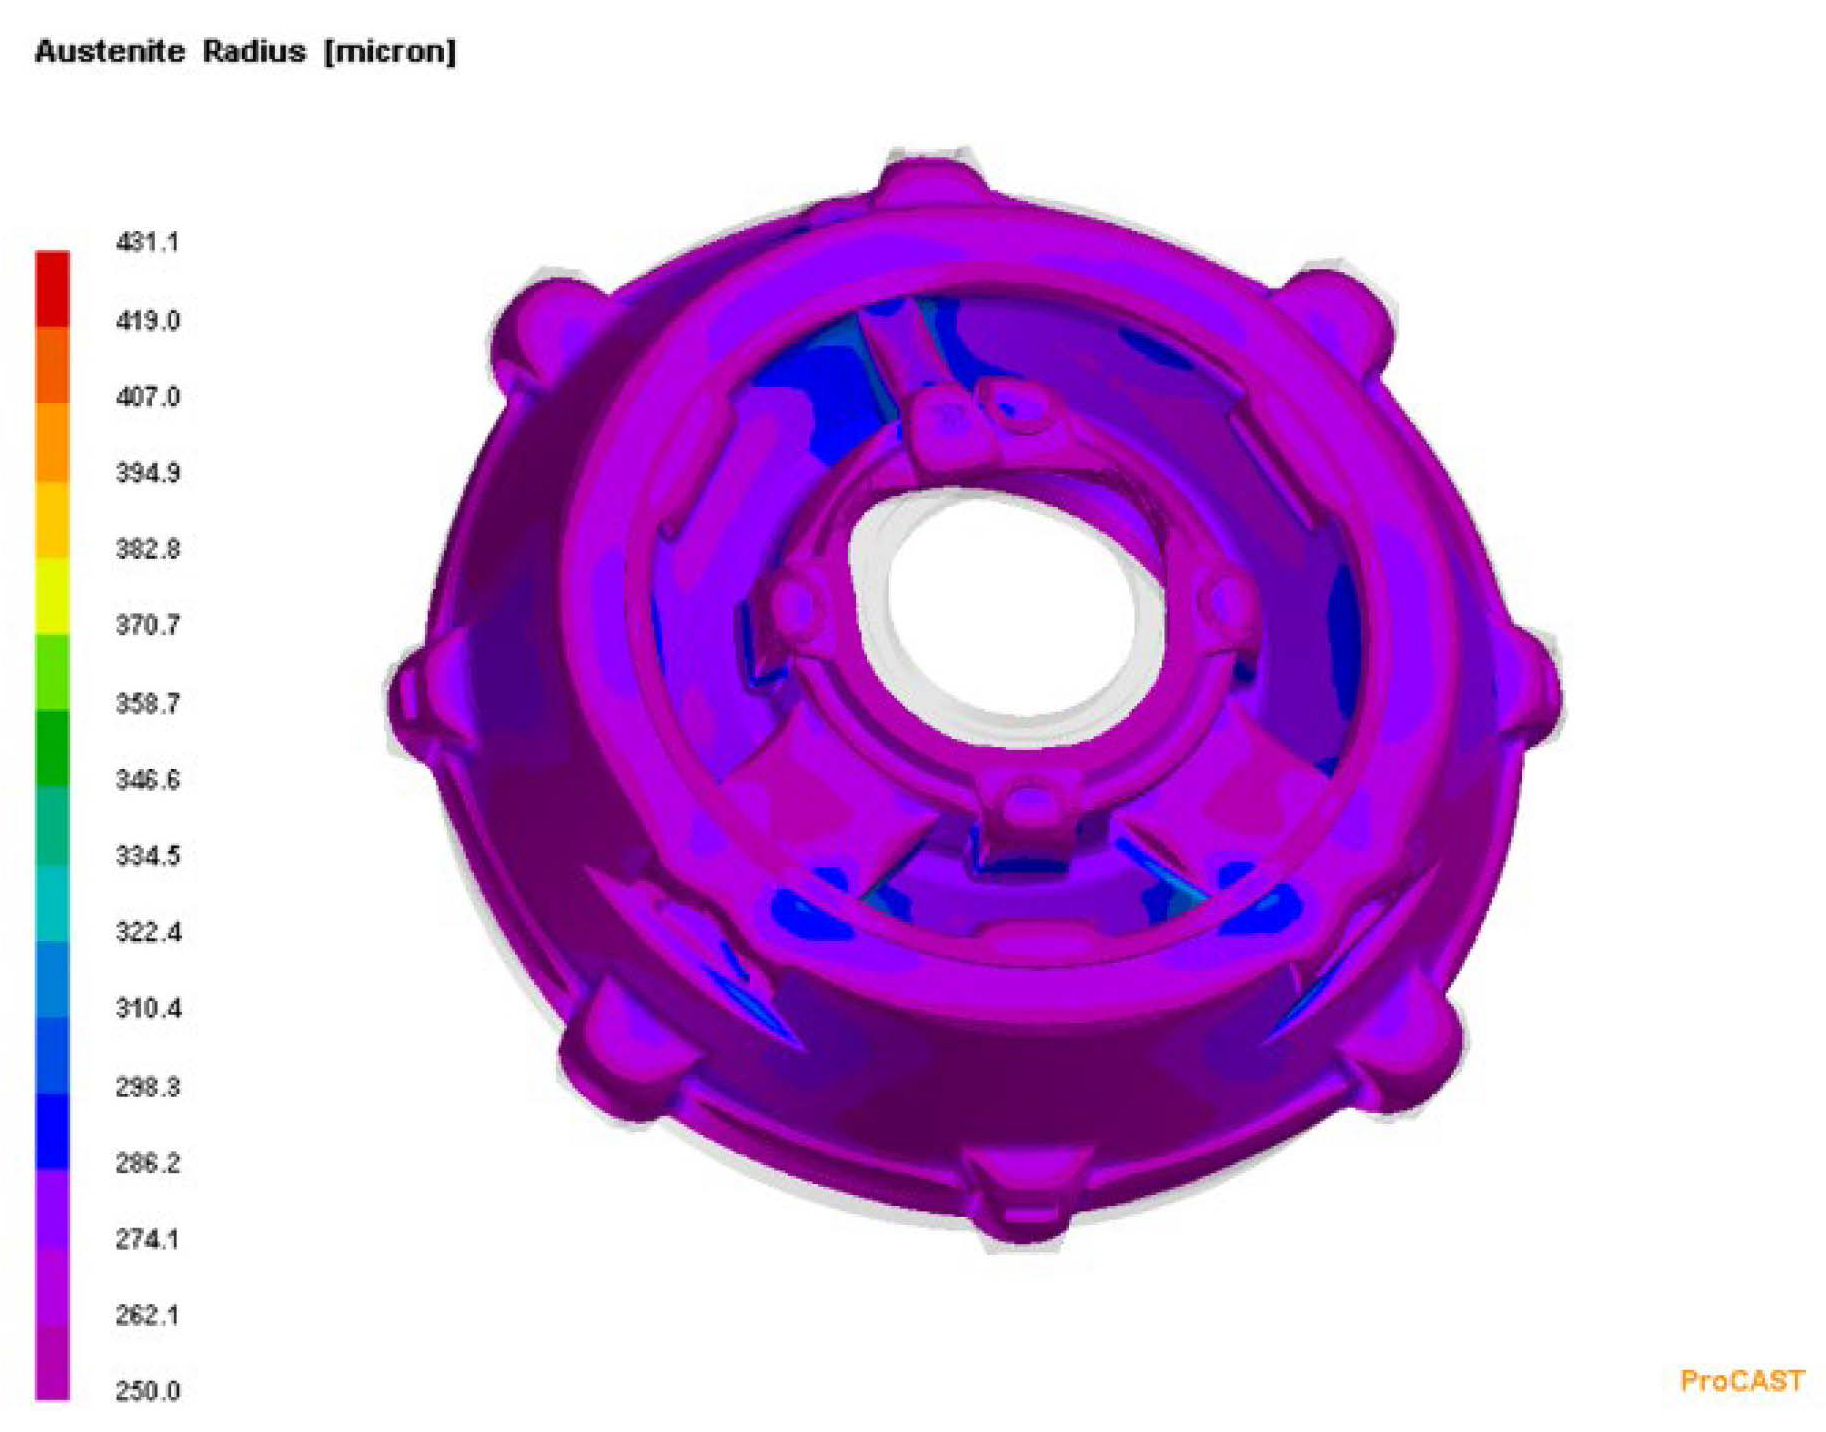
Figure 10.
Distribution of primary austenite grains with diameters that were greater than 250 μm, with a small number of nucleation sites of primary austenite.
Figure 10.
Distribution of primary austenite grains with diameters that were greater than 250 μm, with a small number of nucleation sites of primary austenite.
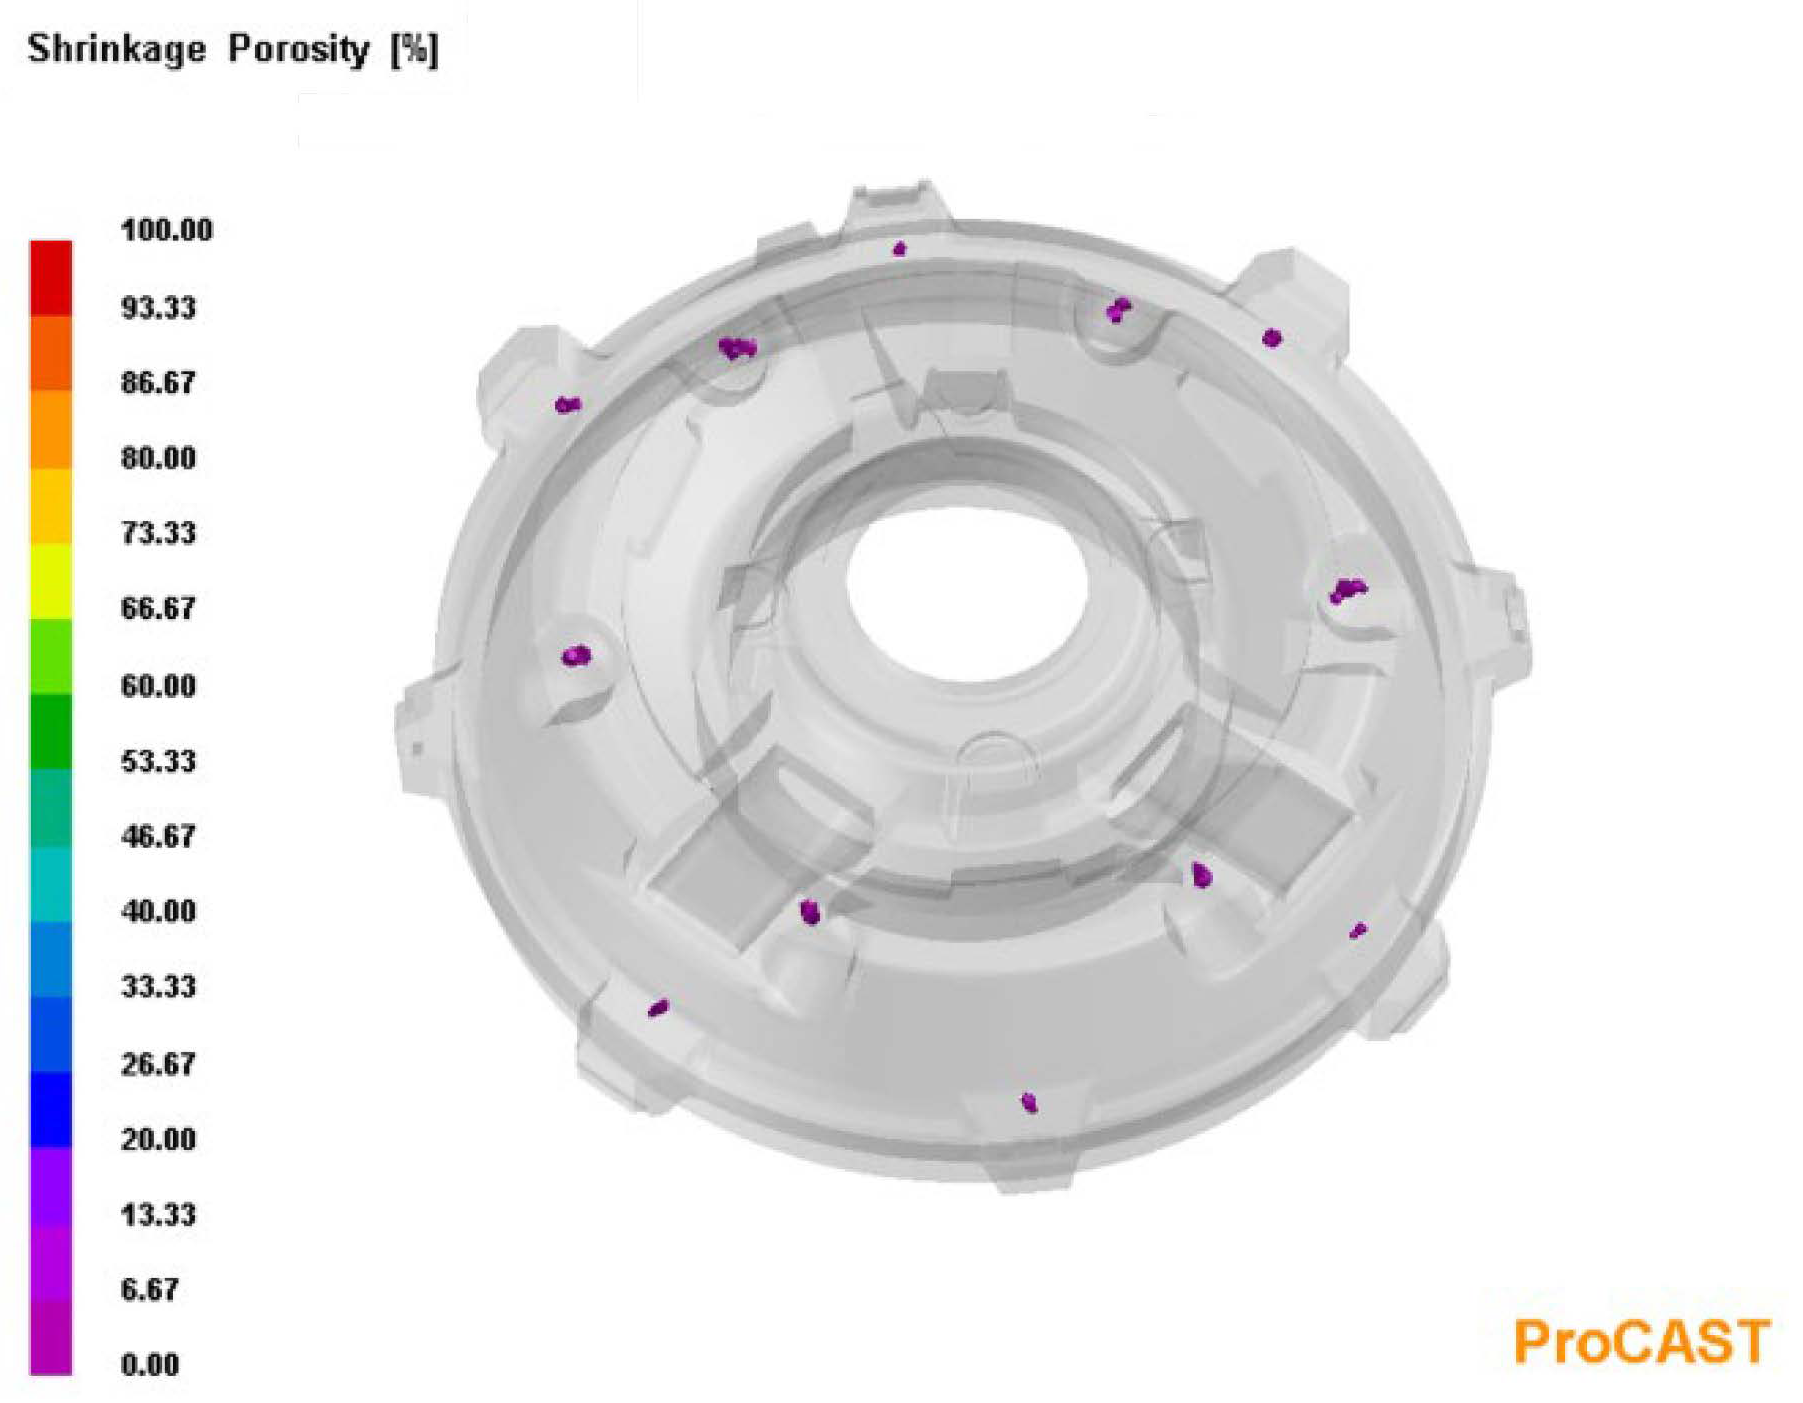
Figure 11.
Distribution of microporosity in casting with small number of nucleation sites of primary austenite.
Figure 11.
Distribution of microporosity in casting with small number of nucleation sites of primary austenite.
Figure 12.
Distribution of primary austenite grains with diameters that were smaller than 250 μm, with a large number of primary austenite nucleation sites.
Figure 12.
Distribution of primary austenite grains with diameters that were smaller than 250 μm, with a large number of primary austenite nucleation sites.
Figure 13.
Distribution of microporosity in casting, with a large number of nucleation sites of primary austenite.
Figure 13.
Distribution of microporosity in casting, with a large number of nucleation sites of primary austenite.
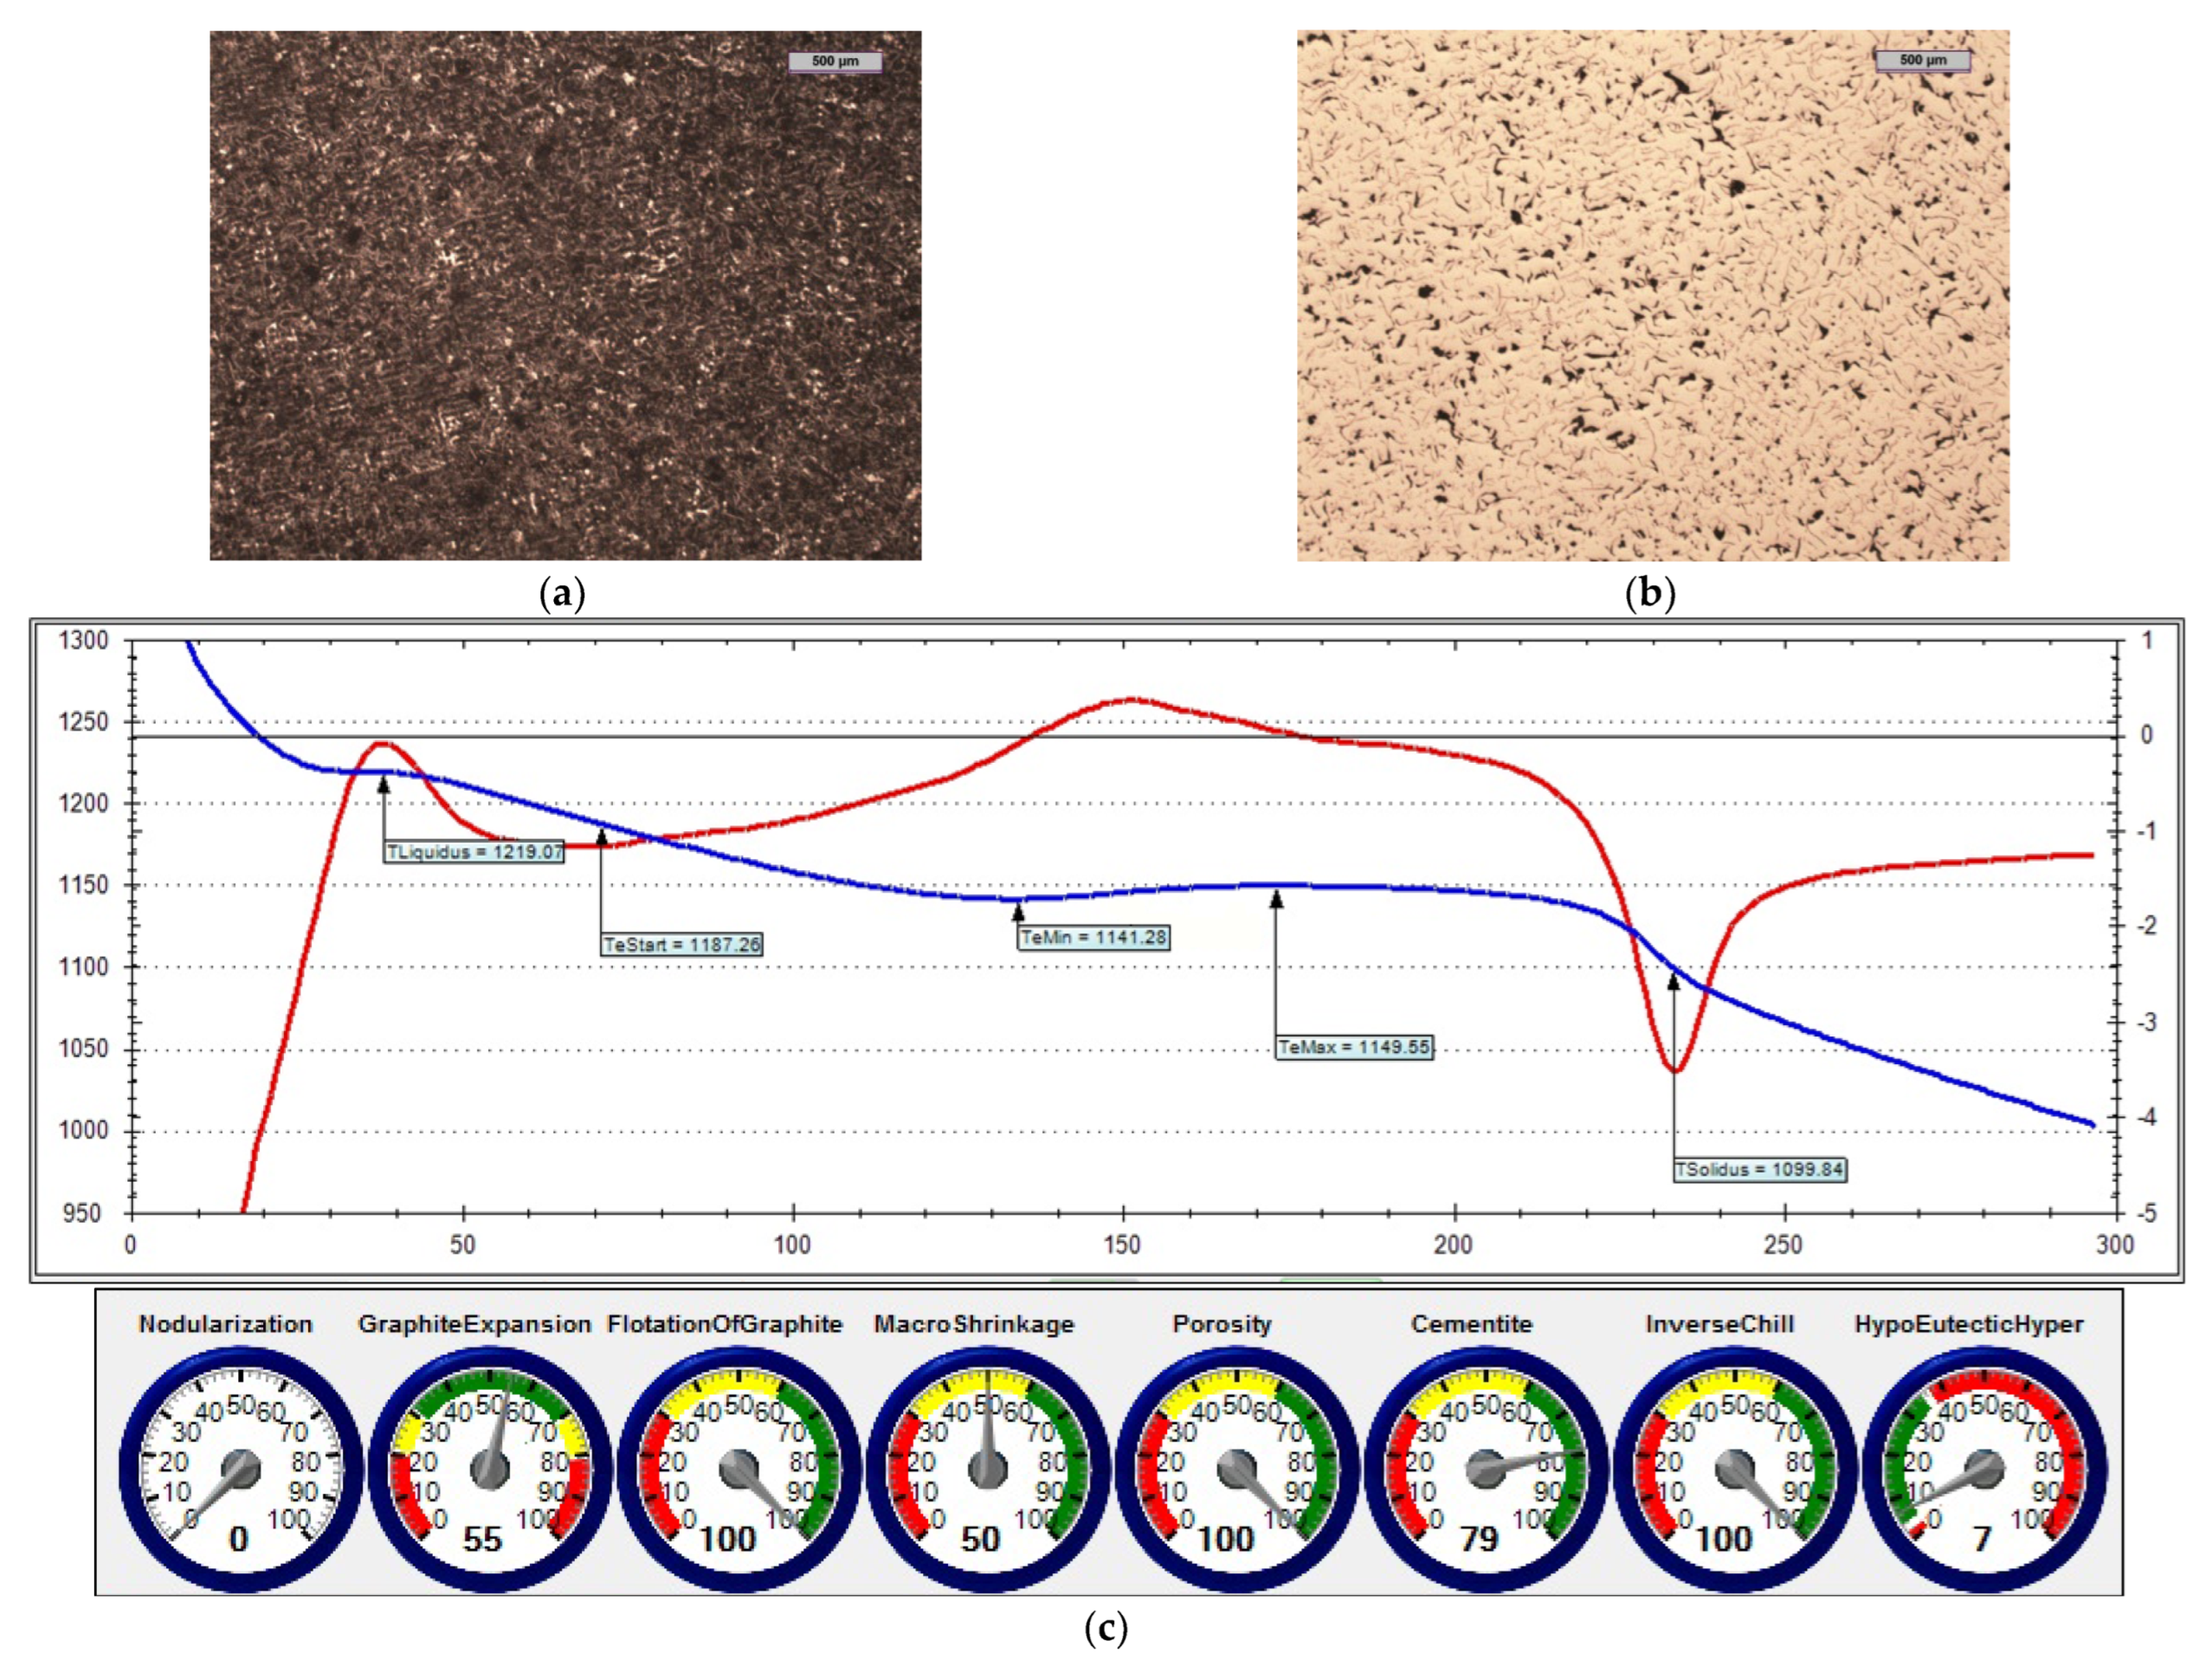
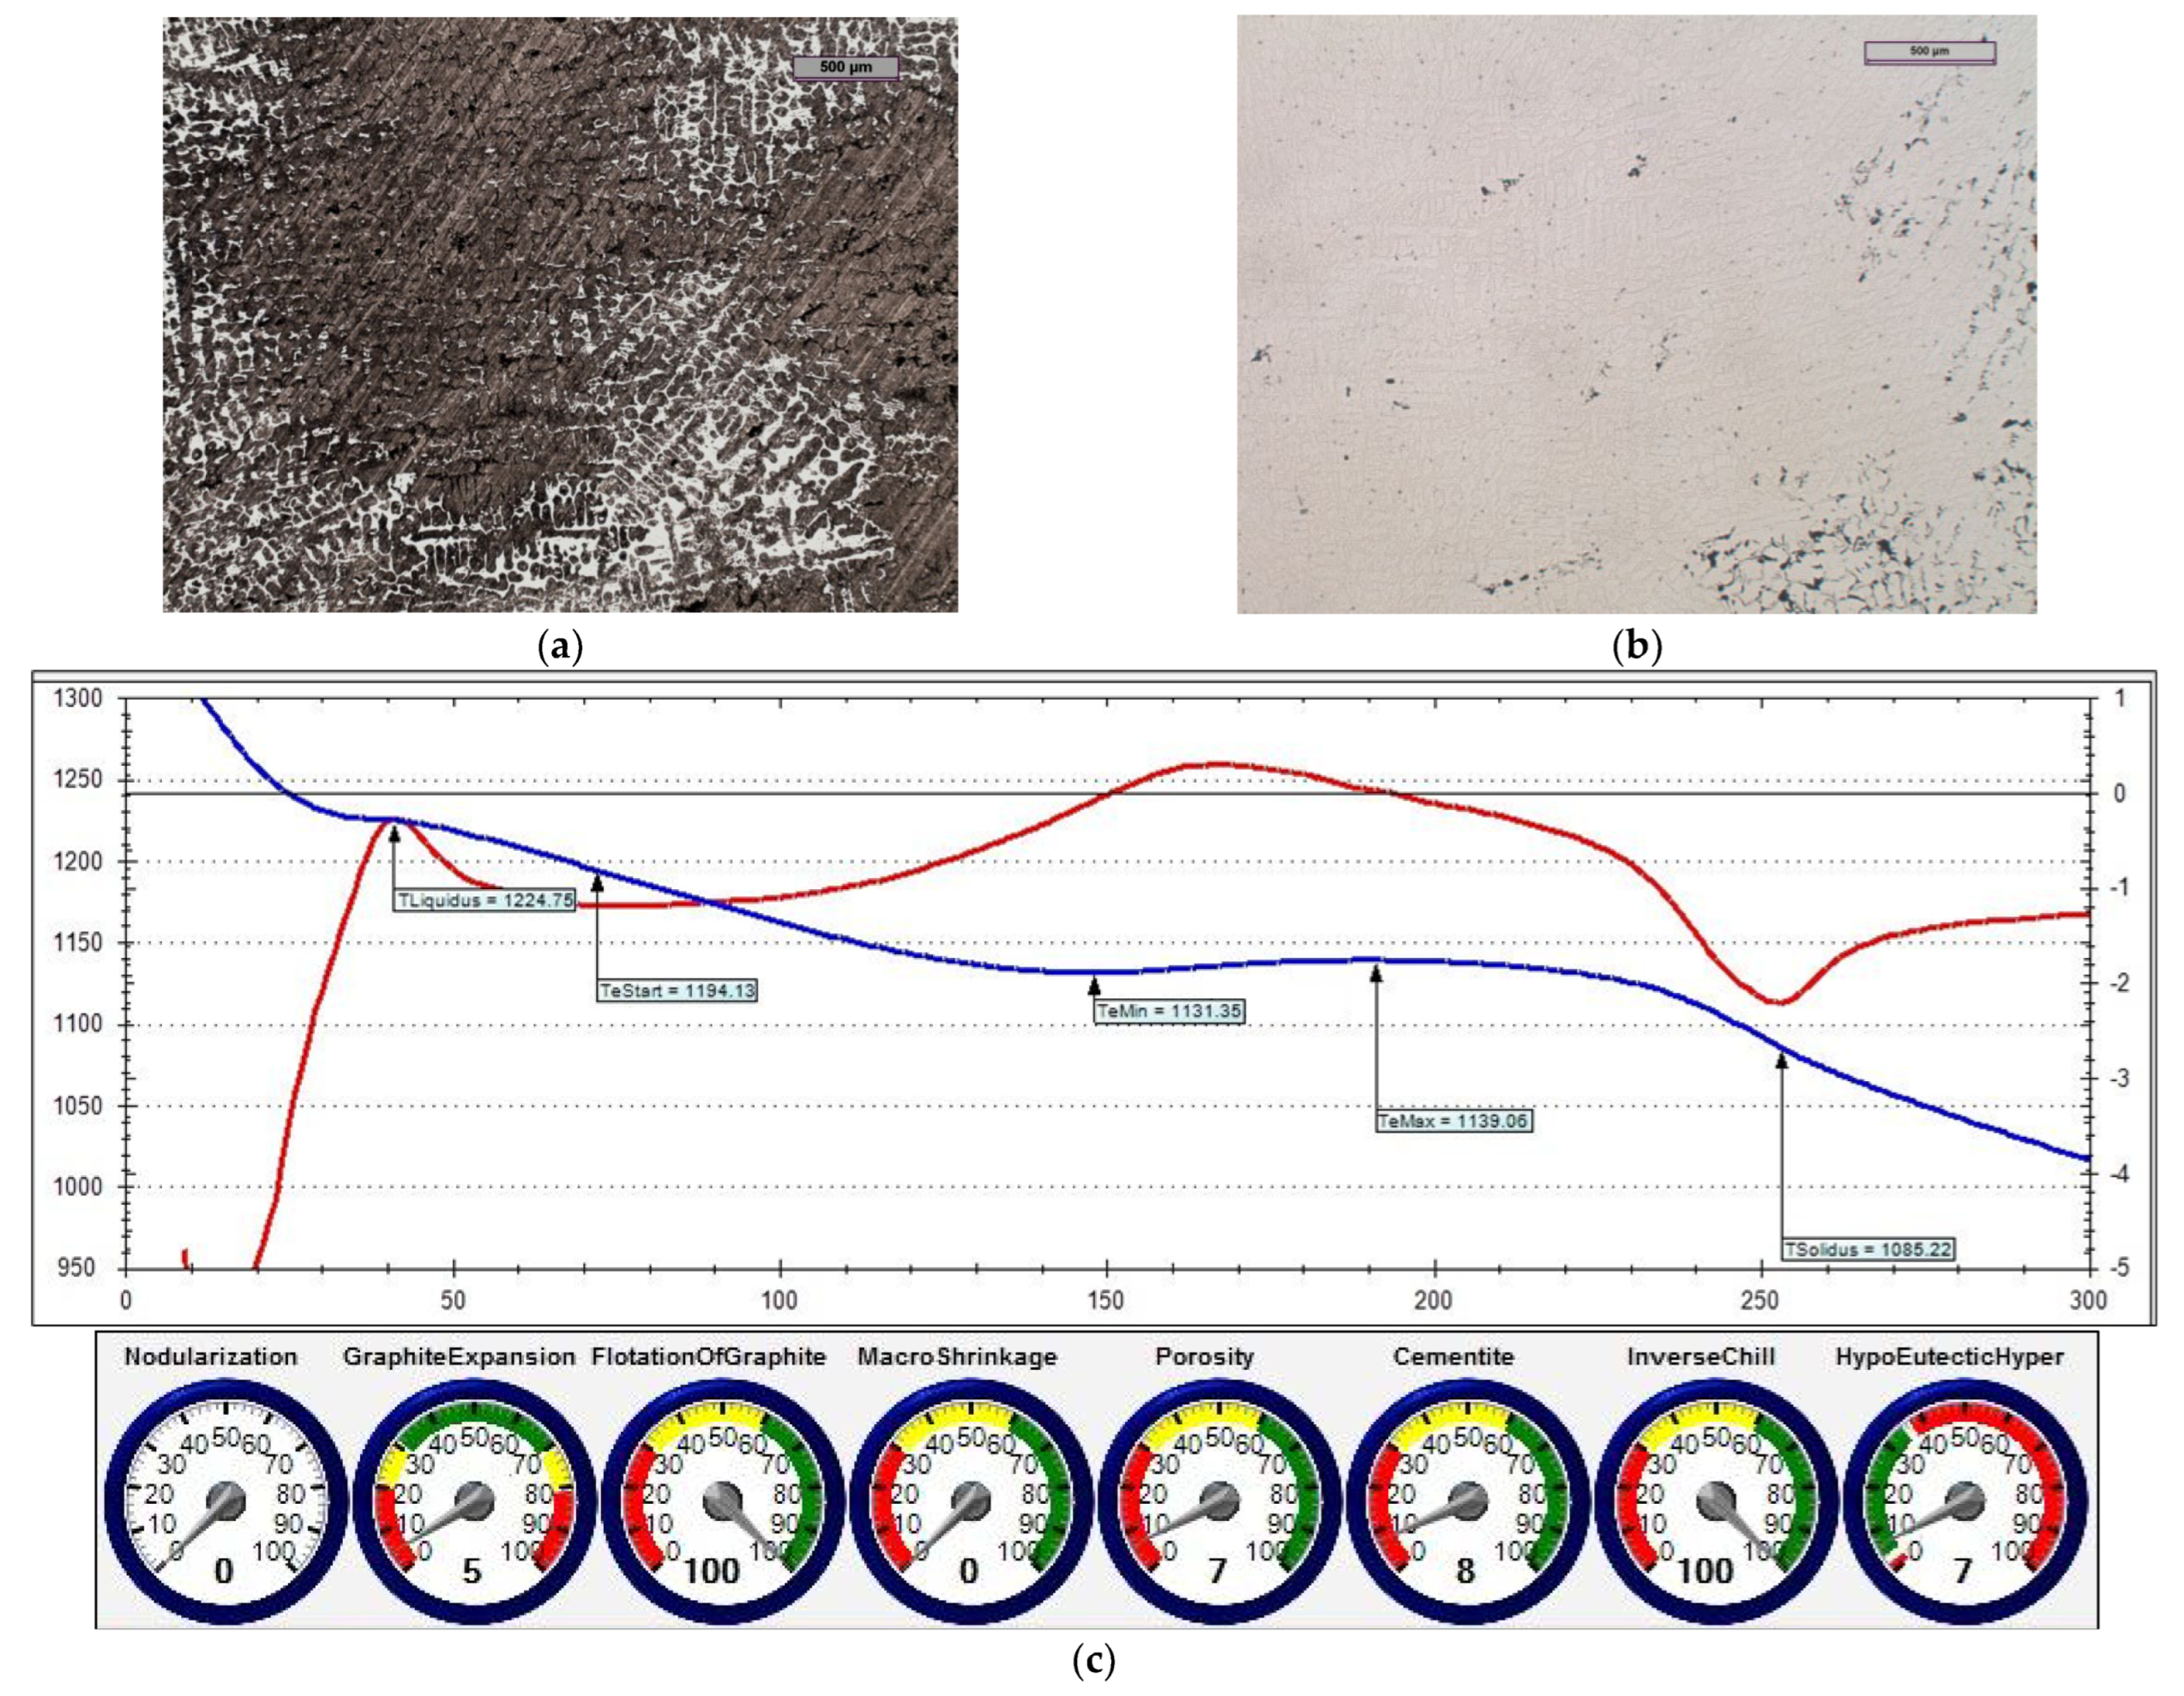
Figure 14.
Reference grey cast iron (with 0.014% S content): (a) sample etched with Picral reagent; (b) non-etched sample; (c) changes in cast iron temperature (in time, sec.) during crystallisation and cooling of casting according to ITACA system.
Figure 14.
Reference grey cast iron (with 0.014% S content): (a) sample etched with Picral reagent; (b) non-etched sample; (c) changes in cast iron temperature (in time, sec.) during crystallisation and cooling of casting according to ITACA system.
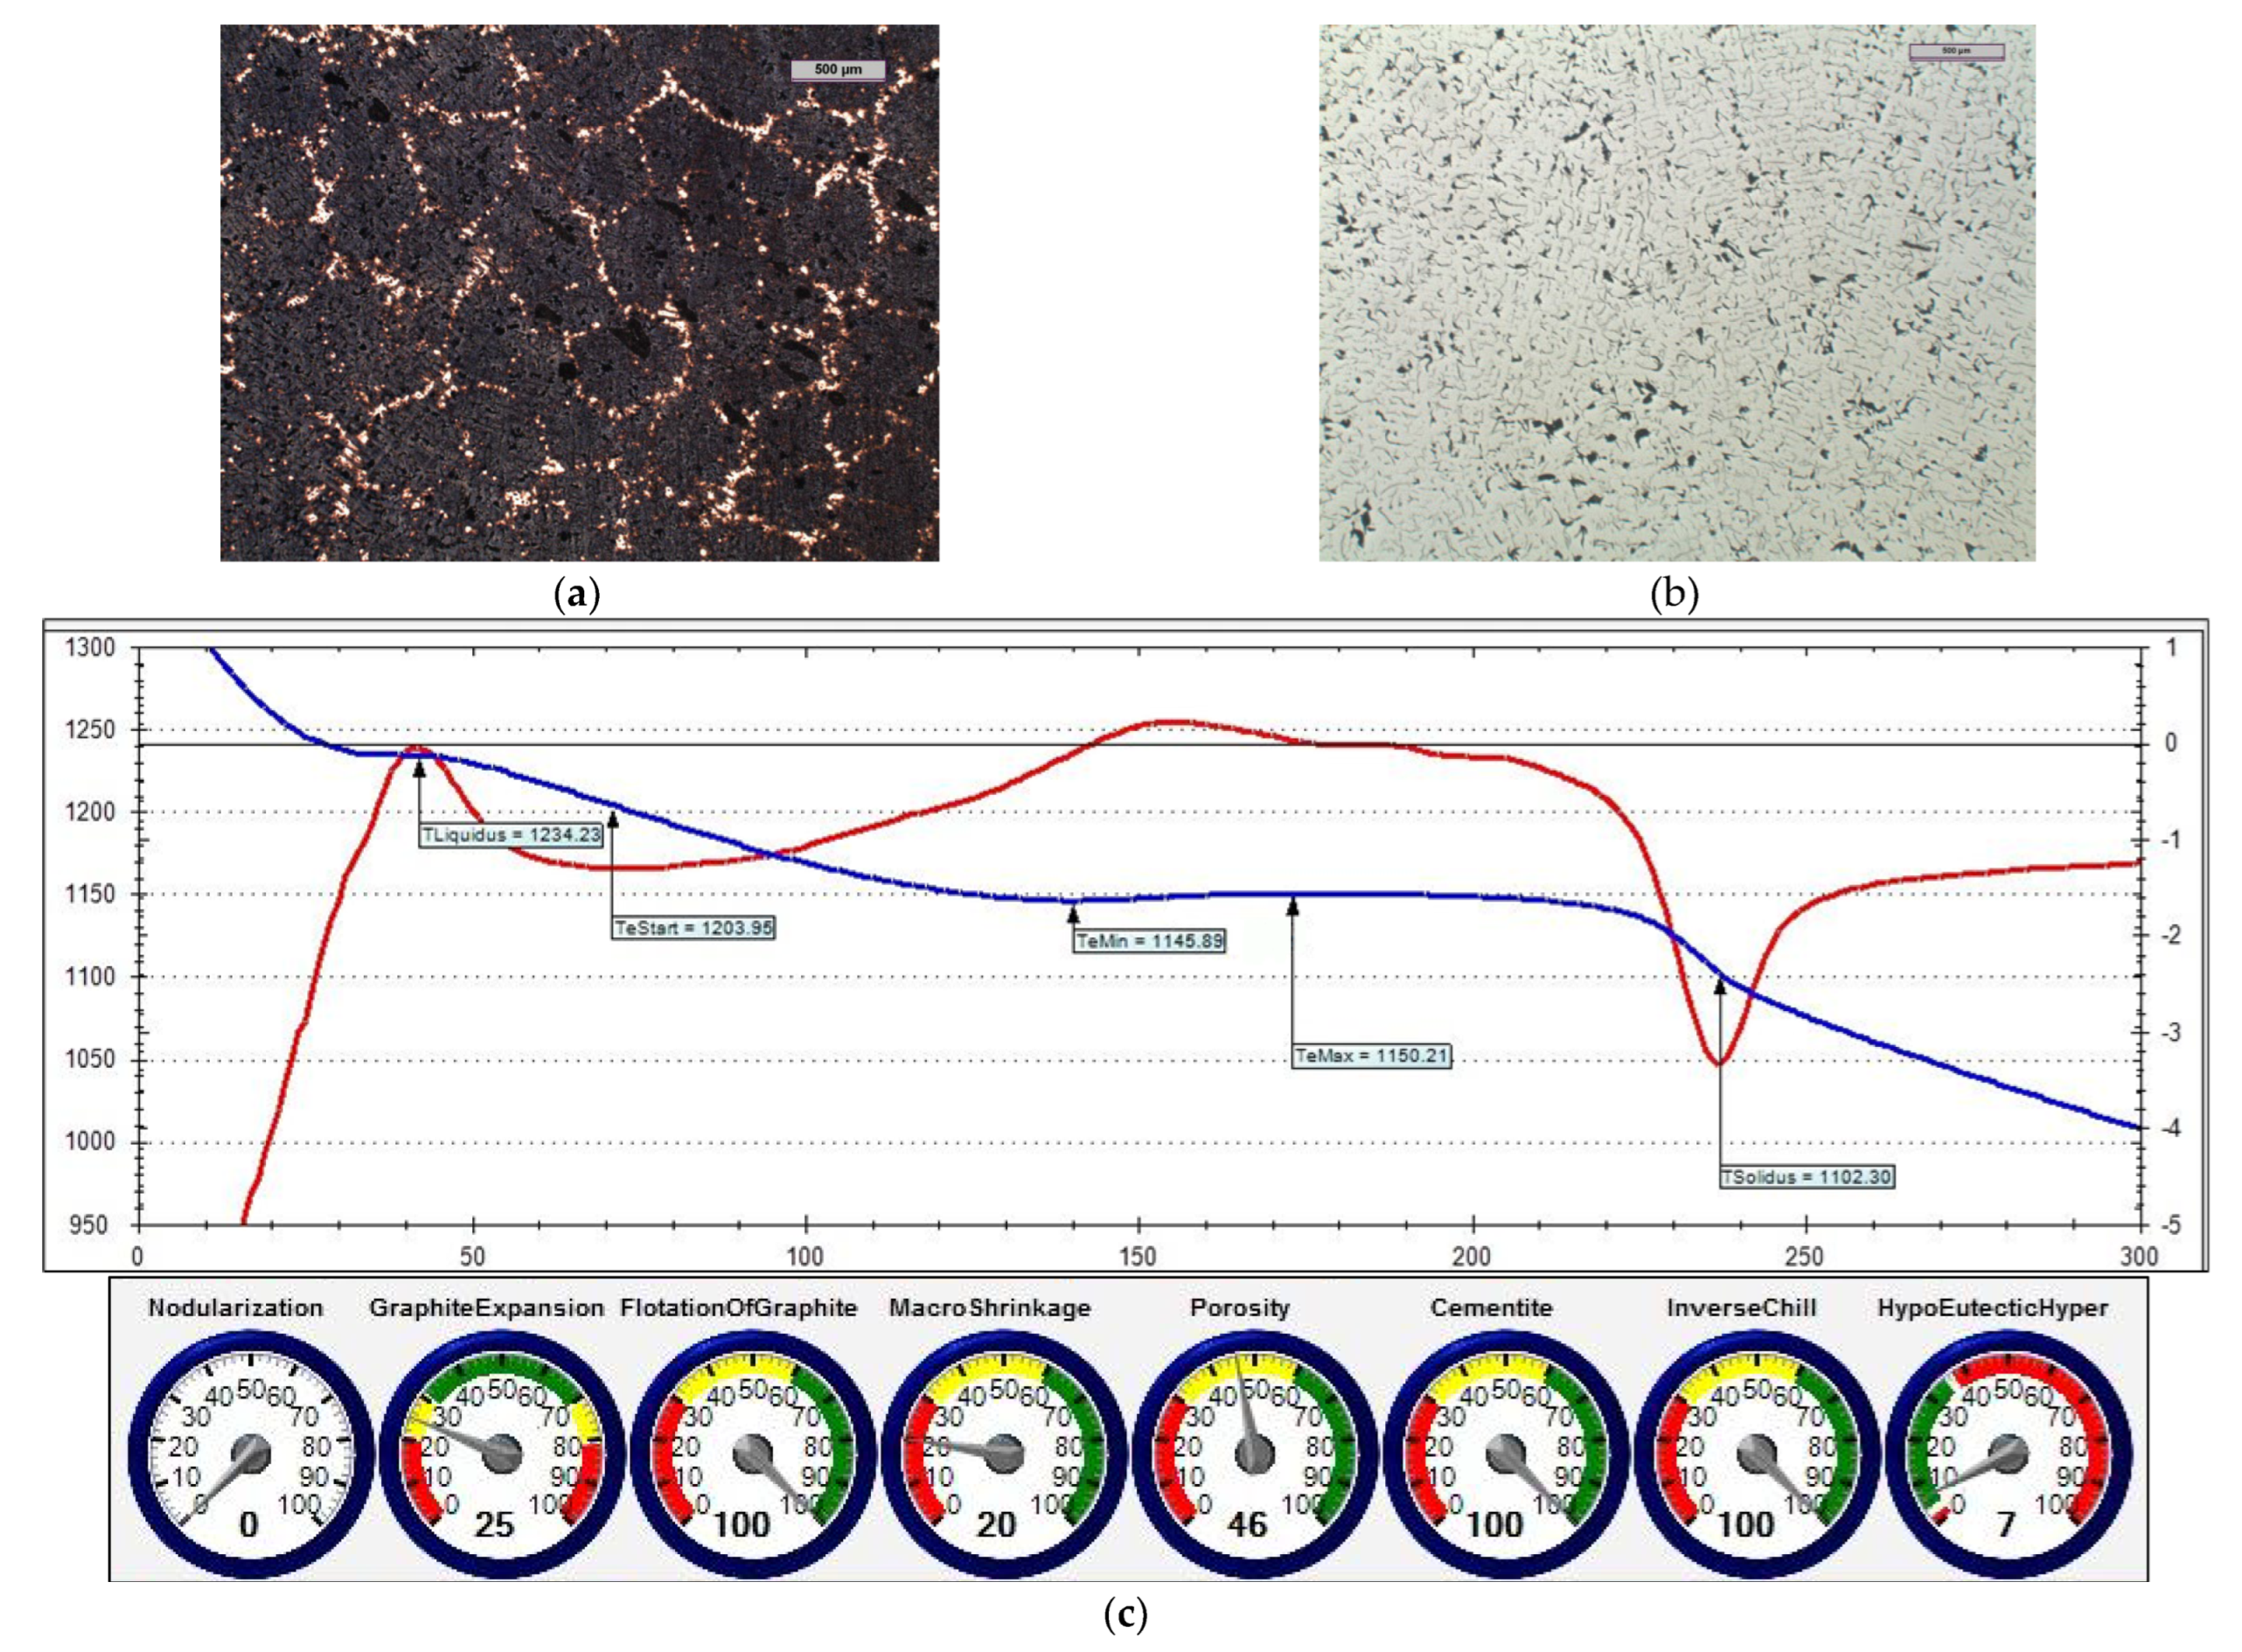
Figure 15.
Grey cast iron (with 0.014% S content) and inoculated with 0.4% iron powder: (a) sample etched with Picral reagent; (b) non-etched sample; (c) changes in cast iron temperature (in time, sec.) during crystallisation and cooling of casting according to ITACA system.
Figure 15.
Grey cast iron (with 0.014% S content) and inoculated with 0.4% iron powder: (a) sample etched with Picral reagent; (b) non-etched sample; (c) changes in cast iron temperature (in time, sec.) during crystallisation and cooling of casting according to ITACA system.
Figure 16.
Grey cast iron (with 0.014% S content) with addition of 0.4% Inoculant (A): (a) sample etched with Picral reagent; (b) non-etched sample; (c) changes in cast iron temperature (in time, sec.) during crystallisation and cooling of casting according to ITACA system.
Figure 16.
Grey cast iron (with 0.014% S content) with addition of 0.4% Inoculant (A): (a) sample etched with Picral reagent; (b) non-etched sample; (c) changes in cast iron temperature (in time, sec.) during crystallisation and cooling of casting according to ITACA system.
Figure 17.
Grey cast iron (with 0.014% S content) with addition of 0.4% Inoculant (A) and iron powder (0.2%): (a) sample etched with Picral reagent; (b) non-etched sample; (c) changes in cast iron temperature (in time, sec.) during crystallisation and cooling of casting according to ITACA system.
Figure 17.
Grey cast iron (with 0.014% S content) with addition of 0.4% Inoculant (A) and iron powder (0.2%): (a) sample etched with Picral reagent; (b) non-etched sample; (c) changes in cast iron temperature (in time, sec.) during crystallisation and cooling of casting according to ITACA system.
Figure 20.
(a) Appearance of disc casting (no porosity-type defects) after applying special inoculation of cast iron with underestimated sulphur content of 0.02%, and (b) inoculated cast iron with sulphur content of 0.06%.
Figure 20.
(a) Appearance of disc casting (no porosity-type defects) after applying special inoculation of cast iron with underestimated sulphur content of 0.02%, and (b) inoculated cast iron with sulphur content of 0.06%.
Table 1.
Chemical composition of grey cast iron industrial research (% mass).
Table 1.
Chemical composition of grey cast iron industrial research (% mass).
| Melt No. | C | Si | Mn | P | S | Ti | Al | Cu | N |
|---|
| A | 3.40 | 2.0 | 0.63 | 0.1 | 0.020 | <0.01 | - | 0.8 Cu | - |
| B | 3.24 | 1.60 | 0.91 | 0.04 | 0.025 | <0.01 | 0.01 Al | - | 0.013% |
Table 4.
Chemical composition of grey cast iron laboratory research (% mass).
Table 4.
Chemical composition of grey cast iron laboratory research (% mass).
| Melt No. | C | Si | Mn | P | S |
|---|
| 1 | 2.92 | 1.65 | 0.38 | 0.03 | 0.014 |
| 2 | 3.02 | 1.61 | 0.40 | 0.04 | 0.09 |
Table 5.
Data used in the ProCAST simulation.


